the Creative Commons Attribution 4.0 License.
the Creative Commons Attribution 4.0 License.
 | 02 Jun 2023
A multiple-charging correction algorithm for a broad-supersaturation scanning cloud condensation nuclei (BS2-CCN) system
Najin Kim
Nan Ma
Ulrich Pöschl
High time resolution (∼1 s) of aerosol hygroscopicity and CCN activity can be obtained with a broad-supersaturation scanning cloud condensation nuclei (BS2-CCN) system. Based on a commercial CCNC (CCN counter), the newly designed diffusive inlet in the BS2-CCN realizes a broad-supersaturation distribution in a chamber with a stable, low sheath-to-aerosol-flow ratio (SAR). In this way, a monotonic relation between the activation fraction of aerosols (Fact) and critical activation supersaturation (Saerosol) can be obtained. The accuracy of the size-resolved aerosol hygroscopicity, κ, measured by the BS2-CCN system can be, however, hampered by multiply charged particles, i.e., resulting in the overestimation of κ values. As the BS2-CCN system uses multiple and continuous supersaturations in the chamber and the size-resolved Fact value is directly used to derive κ values, the multiple-charging correction algorithm of the traditional CCNC where single supersaturation is applied does not work for the BS2-CCN observation. Here, we propose a new multiple-charging correction algorithm to retrieve the true Fact value. Starting from the largest size bin, a new Fact value at a specific particle diameter (Dp) is updated from a measured activation spectrum after removing both aerosol and the CCN number concentration of multiply charged particles using a kernel function with a given particle number size distribution. We compare the corrected activation spectrum with laboratory aerosols for a calibration experiment and ambient aerosols during the 2021 Yellow-Sea Air Quality Studies (YES-AQ) campaign. It is noted that this algorithm is only applied to the monomodal particle distribution. The difference between corrected and measured κ values can be as large as 0.08 within the measured κ values that range between 0.11 and 0.37 among the selected samples, highlighting that the multiple-charge effect should be considered for the ambient aerosol measurement. Furthermore, we examine how particle number size distribution is linked to the deviation of activation spectra and κ values.
- Article
(3046 KB) - Full-text XML
-
Supplement
(727 KB) - BibTeX
- EndNote


Cloud condensation nuclei (CCN), the subset of atmospheric aerosol particles that can activate at a certain supersaturation to form cloud droplets, are a key element in global climate change as they modulate the microphysical properties of the clouds (e.g., number concentration, mass and effective radius). Despite the scientific importance of CCN, there are still large uncertainties in assessing the aerosol–cloud interactions and quantification of their effect on climate due to the complexity of atmospheric composition and processes (IPCC, 2007). To reduce these uncertainties, knowledge of the spatiotemporal distribution of CCN and their activation characteristics is essential. As part of these efforts, numerous field campaigns have been carried out in the various regions in recent years (Andreae and Rosenfeld, 2008; Chang et al., 2010; Che et al., 2016; Ervens et al., 2010; Gunthe et al., 2009; Hämeri et al., 2001; Hudson, 1993; Jurányi et al., 2011; Kim et al., 2014; Moore et al., 2012; Ovadnevaite et al., 2011; Pöhlker et al., 2016; Rose et al., 2010; Schmale et al., 2018; Su et al., 2010; Thalman et al., 2017; Xu et al., 2021, and reference therein).
The activation of CCN at a given level of supersaturation can be primarily determined by particle size, followed by chemical composition and mixing state (Dusek et al., 2006; Ervens et al., 2010; Ren et al., 2018; Padró et al., 2012). Therefore, the size-resolved CCN measurement can separate the size effect to investigate the chemical composition effect on CCN activation efficiency under the simple assumption. This can help improve the understanding of CCN activation characteristics. Also, the critical diameter at a given supersaturation can be determined. For the size-resolved CCN measurement, a differential mobility analyzer (DMA) is commonly used to select the particle size before particles enter into the CCN counter (CCNC). As particles passed through the DMA are not all singly charged under the given electrical mobility, numerous approaches have been proposed to correct multiply charged particles. Multiply charged particles with a larger size penetrate the DMA resulting in a higher CCN activation ratio than the actual value. A higher CCN activation ratio causes an error when deriving the critical diameter and, thereby, the κ value, a single hygroscopicity parameter (Petters and Kreidenweis, 2007). Notably, the multiple-charge effect is evident for ambient aerosols that show a large geometric diameter. Frank et al. (2006) proposed a correction method by removing the multiply charged particle fraction in number size distribution scaled by an activation efficiency of an average of five spectra. Petters et al. (2007) used an activation model of the CCNC response of transferred polydisperse charged–equilibrated particles that pass through an ideal DMA. The activation efficiency of the particle distribution with the best estimate of critical diameter (Dc), the diameter to be activated, is determined by minimizing the χ2 statistic by varying the assumed Dc. Rose et al. (2008) simply assumed a constant fraction of doubly charged particles from the lower level of the plateau in the CCN efficiency spectra. Moore et al. (2010) used the algorithm for scanning mobility CCN analysis (SMCA). The activation fraction of a set diameter, Ra(Dp), is determined by removing total particles (i.e., condensation nuclei, CN) and CCN with +2 and +3 charges iteratively until convergence of Ra(Dp). Ultimately, each of methods introduced above are designed to determine Dc of the test aerosols and thus the hygroscopicity parameter, κ, of the aerosols. The single hygroscopicity parameter, κ, is used to model the composition dependence of the solution water activity. It can be used as a proxy for the chemical composition model and thereby streamline the aerosol composition model. Also, the values can manage the hygroscopic properties of complex aerosol types.
Whereas previous studies have improved hygroscopicity retrieval through the development of post-processing algorithms, modern studies have focused on directly manipulating the sampling parameters (e.g., sample flow rate, sheath flow rate, supersaturation) to allow direct retrieval of κ. An example of this approach includes the broad-supersaturation scanning (BS2) CCN approach proposed by Su et al. (2016), which modified the inlet and flow system of a commercial CCNC to obtain aerosol hygroscopicity and CCN activity with a high time resolution. With a new monotonic relation between the activation fraction (Fact) and the activation supersaturation (Saerosol), the κ value can be directly determined when the size-resolved CCN activation of the set diameter is measured. Kim et al. (2021) implemented a BS2-CCN system and proposed a calibration method. With the CCN activation model, a response of the CCNC with and without considering doubly charged particles was compared and a method for the calibration for the BS2-CCN system was suggested to minimize the multiple-charge effect. Although the calibration experiment can control particle size distribution to minimize this effect, the multiple-charging correction method is necessary when it is applied to the ambient aerosol measurement because particle size distribution cannot be controlled and Fact directly affects the κ value in the BS2-CCN system. In other words, a high Fact value caused by multiply charged particles of ambient aerosols results in an overestimation of the κ value. However, several algorithms mentioned above to correct the multiply charged particles cannot be directly applied to the BS2-CCN system. The reasons are as follows: (1) the BS2-CCN system uses multiple and continuous supersaturations in the chamber and not a single supersaturation as used in a commercial CCNC from Droplet Measurement Technologies (DMT). (2) The size-resolved Fact value is directly used to derive the κ value, whereas the original methods focus on a critical diameter or supersaturation. (3) The CCN activation model proposed by Kim et al. (2021) is only applicable to a known calibration aerosol. The model considers the multiple-charge effect on total particles and CCN separately, for which the equation contains the transfer function for a cylindrical DMA column and the charge distribution of particles carrying elementary charges. Particularly, for CCN, the function for a fraction of particles that activate as cloud droplets is added into the equation and the information on Saerosol at a specific diameter is necessary. In other words, this model cannot be applied to ambient aerosols with an unknown κ value. Therefore, we propose a multiple-charging correction algorithm for the BS2-CCN system in this paper. With a relevant theory for the electric mobility classifier, we summarize the procedure and show examples of ambient aerosol measurements applying the algorithm.
2.1 Description of the BS2-CCN system
The BS2-CCN system contains a modified DMT-CCNC with a newly designed inlet system to measure the size-resolved CCN activity with a high time resolution. The BS2-CCN system includes a differential mobility analyzer (DMA), a condensation particle counter (CPC) and a modified DMT-CCNC. Figures S1 and S2 in the Supplement present the schematic plot of a BS2-CCN system and a newly designed inlet, respectively, and are adopted from Su et al. (2016) and Kim et al. (2021). Selected monodisperse particles from the DMA enter into the CPC and a modified CCNC, and thereby the size-resolved Fact values can be obtained. A new inlet system of a modified CCNC makes stable, low sheath-to-aerosol-flow ratios (SARs), which obtain a monotonic Fact–Saerosol relation. The aerosol and sheath flows for a modified CCNC are set to 0.46 and 0.04 L min−1, respectively. A detailed description of the BS2-CCN system is found in Kim et al. (2021).
2.2 Basic theory: multi-charge effect
A particle with a narrow range of electrical mobility (Zp) can pass through the DMA. The Zp is defined as follows:
where e is the elementary charge, φ is the number of elementary charges on the particle, C(Dp) is the Cunningham slip correction, μ is the dynamic viscosity of air and Dp is particle diameter. The mobility bandwidth, ΔZp, is
where Qsh and Qa are the volumetric sheath flow and aerosol flow, respectively, and is the set electrical mobility.
The particle charge distribution for each size can be calculated according to Wiedensohler (1988) and Gunn and Woessner (1956). We can calculate the probability that a particle will pass through a DMA classifier using the kernel function, as follows:
where is a set diameter in the DMA, x is the scale parameter, F(xφ) is the charge distribution of the particles with φ elementary charges and is the probability of particles of that pass through the DMA, which is a piecewise linear probability function of triangular shape. It considers the electrical mobility and the mobility bandwidth for a given diameter and flow ratio.
2.3 Multiple-charging correction algorithm for BS2-CCN
Based on the theory, we present the procedure of a multiple-charge correction algorithm for the BS2-CCN system. As the κ value is calculated directly from Fact, the algorithm aims at deriving the true Fact we want to obtain from observed Fact. The experimental setup for the size-resolved CCN measurement is described in Kim et al. (2021). Selected dry particles from the DMA are split in two ways: the CPC for particle number concentration and a modified CCNC for CCN number concentration. It is noted that the DMA, the CPC and the CCNC are controlled and the number concentrations of CN and CCN are recorded at once within our own private software. We noted that the algorithm assumes the lognormal size distribution. Scanning the size of particles with an Fact of 0 to 1 is performed, and the algorithm applies starting from larger particles to small particles.
- 1.
The CN and CCN number size distributions, NCN(Dp) and NCCN(Dp), are obtained with a time resolution of 1 s. NCN(Dp) and NCCN(Dp) of each particle size were measured for 40 s.
- 2.
The size-dependent activation fraction, , is calculated from the CN and CCN time series. For each particle diameter, Fact(Dp) is calculated by averaging the values for 25 s excluding the first 15 s out of the total 40 s.
- 3.
To calculate NCCN of multiply charged particles (i.e., Step 5), we need the information on the particle diameter of +2 and +3 (or more) charges and the corresponding Fact values which are not measured. The Fact(Dp) values can be obtained using a linear interpolation within the Fact values measured in a set particle diameter. The Fact(Dp) of a particle size larger than the largest Dp is assumed to be 1.0. It is noted that Fact(Dp) of the largest particle size is to be 1.0.
- 4.
Starting from the largest aerosol size bin, the particle number concentration of single charge that can pass through the DMA (set ) is calculated by the kernel function with a given particle number size distribution, n(x), after removing the number concentration of particles with +2 and +3 (or more) charges using Eq. (4). Dmax should be larger than the diameter that can cover the kernel functions with different charges (here, ) at the set particle diameter range. For example, a peak diameter with a +3 charge in the kernel function is about 131 nm when the particle size is fixed at 70 nm in the DMA (Fig. 1).
- 5.
As the CCN number concentration can be calculated using the product of Fact and Nφ, we can calculate the true Fact value, , by subtracting the CCN number concentration for multiply charged particles from the measured CCN number concentration. To be specific, the CCN number concentration of multiply charged particles can be calculated with information on the particle diameter of +2 and +3 (or more) charges and corresponding Fact from the Fact curve (Eq. 5). It is noted that is a mathematical form of an activated fraction, Fact, i.e., the function for with φ elementary charges.
- 6.
The calculated that we want to obtain in step (5) is updated to the existing Fact function, .
- 7.
Repeat steps (3)–(6) from the largest to the smallest diameter.
Through this single process, steps (3)–(6), we obtain the ) value, and the calculated ) is reflected in the Dp–Fact curve, which is used in the calculation process of the following particle size.
Figure 1 shows the calculated kernel function for the DMA (TSI 3080) set to a size of 70 nm with different charges (. It is noted that particles carrying more than three charges within the particle size range in ambient air are not considered in this study. The sample / sheath flow ratio of is applied for calculation, and the same setting for the calibration experiment and ambient aerosol measurement is used, mainly discussed in Sect. 4. The kernel function can be different depending on the sample / sheath flow ratio. The particle number concentration carrying a specific charge can be determined by the kernel function and particle number size distribution (Eq. 4). Figure 2 shows the particle number fraction at each charge under assumed particle distribution data obtained from ambient aerosol measurement. According to Fig. 2, most particles are composed of particles with a single or double charge, but the particle number fraction with a triple charge between 60 and 90 nm, where the particle number concentration is high, was also seen slightly. The number concentrations by singly charged particles were dominant, but there was a size range where a number fraction for doubly charged particles was more than 0.1. And, the number fraction of doubly and triply charged particles depends on the number concentration of the larger particles. It means that in a region where larger particles are dominant, the effect of a doubly charged particle would be more prominent, and thereby it is necessary to apply the multiple-charging correction algorithm.
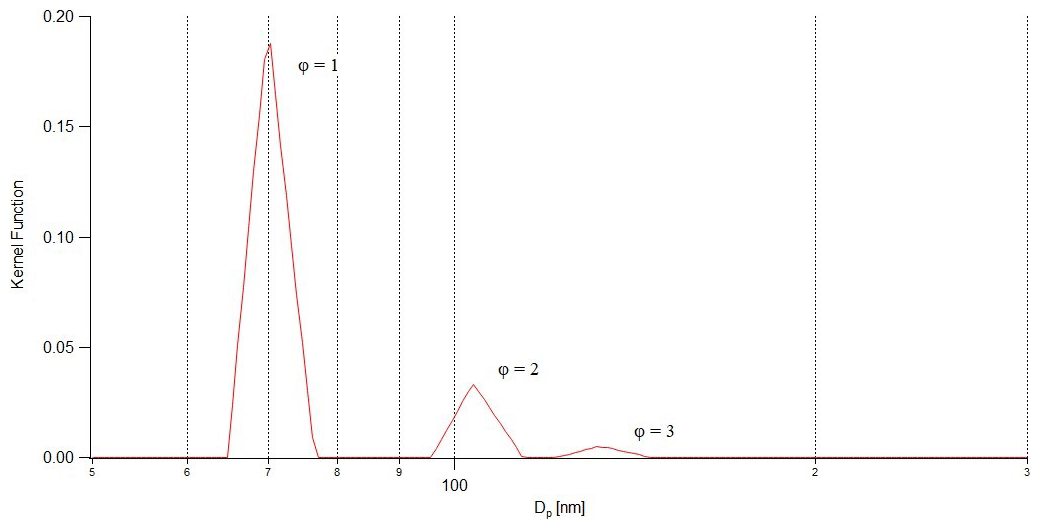
Figure 1The kernel function for the DMA set to a size of 70 nm with different charges (). The sample / sheath flow rate is .
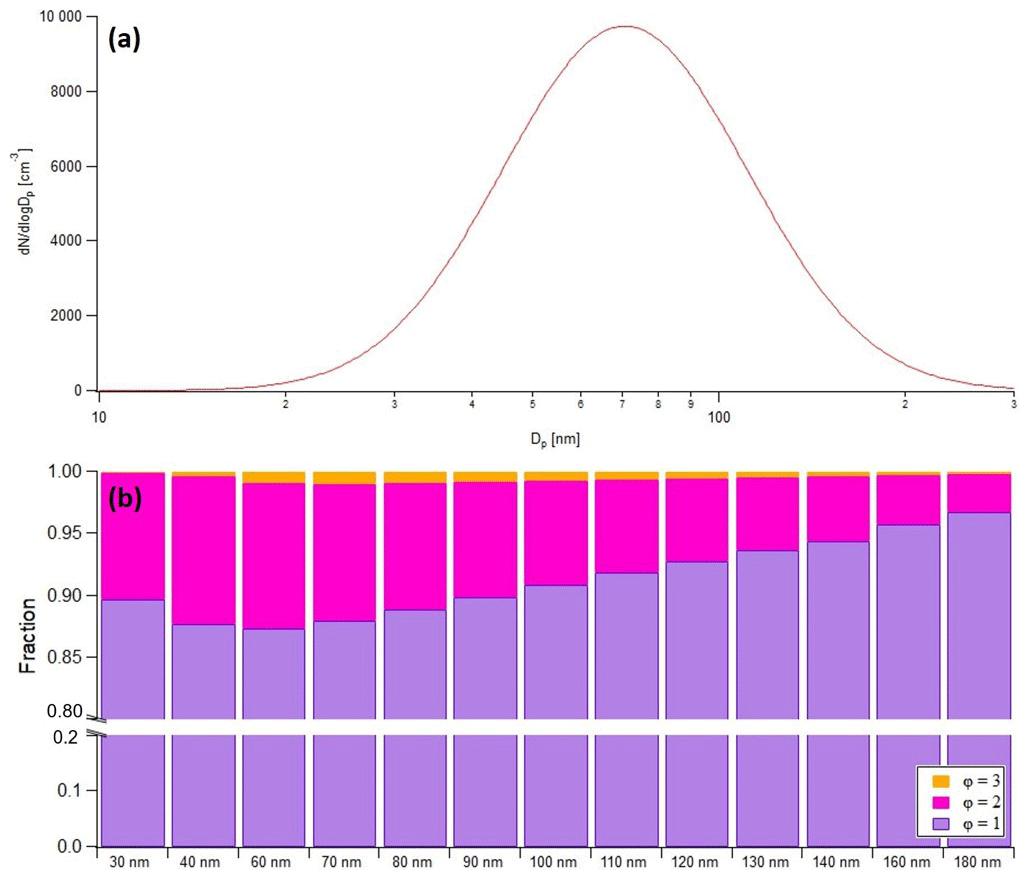
Figure 2(a) Lognormally fitted particle number size distribution (Dg=706 nm, σg=157) and (b) particle number fraction at each charge to which the particle number size distribution is applied. Each color indicates the charge number: purple for singly charged particles (φ=1), pink for doubly charged particles (φ=2) and orange for triply charged particles (φ=3).
The multiple-charge correction algorithm is applied to the calibration experiment and ambient aerosol measurements. Before applying the algorithm, a lognormal fitting procedure for the aerosol number concentration is conducted to calculate the number concentration of particles with double and triple charges as described in Eqs. (4) and (5). It is well known that the size distribution of atmospheric aerosols can be expressed by a lognormal distribution, and other fitting functions can be used if the number size distribution cannot be described by the lognormal distribution.
3.1 Calibration experiment
Calibration experiments for the BS2-CCN system are performed with ammonium sulfate, well-known calibration aerosols for the CCNC under the dT=6 and 8 K conditions. An instrumental setting of the calibration experiment is the same as the existing BS2-CCN system except that an atomizer for generating a calibration aerosol is added to the front of the DMA. Details are described in Kim et al. (2021). Figure 3 shows the aerosol and CCN number size distribution, the activation fraction (Fact) curve and BS2-CCN calibration curve under the two dT conditions. According to Fig. 3a, the CCN number size distribution shows a small plateau in the front for multiply charged particles leading to the small plateau of Fact (Fig. 3b). When applying the algorithm, this small plateau disappears, and the other Fact value slightly decreases. The results show that the algorithm corrects the increased Fact values due to multiple-charge particles. The elevated Fact values induced by multiply charged particles in Fig. 3 are not that high (less than 0.1) due to the small geometric mean diameter (Dg) and standard deviation (σg) of a generated particle number size distribution. This is a way of minimizing the effect of multiply charged particles on the calibration curve (Kim et al., 2021). Figure 3a and Table S1 in the Supplement show the calibration curve, coefficients of the fitted calibration curve, and goodness of fit before and after the correction. There is no significant difference in each coefficient and the shape of the calibration curve. The reasons for this are as follows: (1) for the fitting procedure, values lower than 0.05 of the Fact value where a small plateau from multiply charged particle exists are excluded. (2) The calibration experiment presented in this section follows the recommendation suggested by Kim et al. (2021) to generate a particle size distribution with small Dg and σg, and, thereby, the effect of multiply charged particles is not that obvious. (3) The Fact–Saerosol relation is determined based on κ–Köhler theory (Petters and Kreidenweis, 2007). In other words, the value of Saerosol changes based on the theory according to the reduced Fact. It can be inferred from these results that the suggested algorithm corrects the Fact induced by doubly and triply charged particles well. In addition, a more accurate calibration curve can be obtained by applying the algorithm, but the effect of multiply charged particles can be minimized, and almost the same calibration curve can be obtained without correction if the experimental control is performed well. Kim et al. (2021) examined the effect of multiply charged aerosols on the calibration curve through the CCN activation model and experiments. By adjusting the particle number concentrations, number size distribution with a small Dg and σg could be generated to minimize the influence of multiply charged particles. Additionally, Figs. S3 and S4 show the combined result of ammonium sulfate calibration experiments for three dT conditions and the sodium chloride experiment, another representative calibration aerosol. All show consistent results with Fig. 3 indicating that the suggested algorithm performs well.
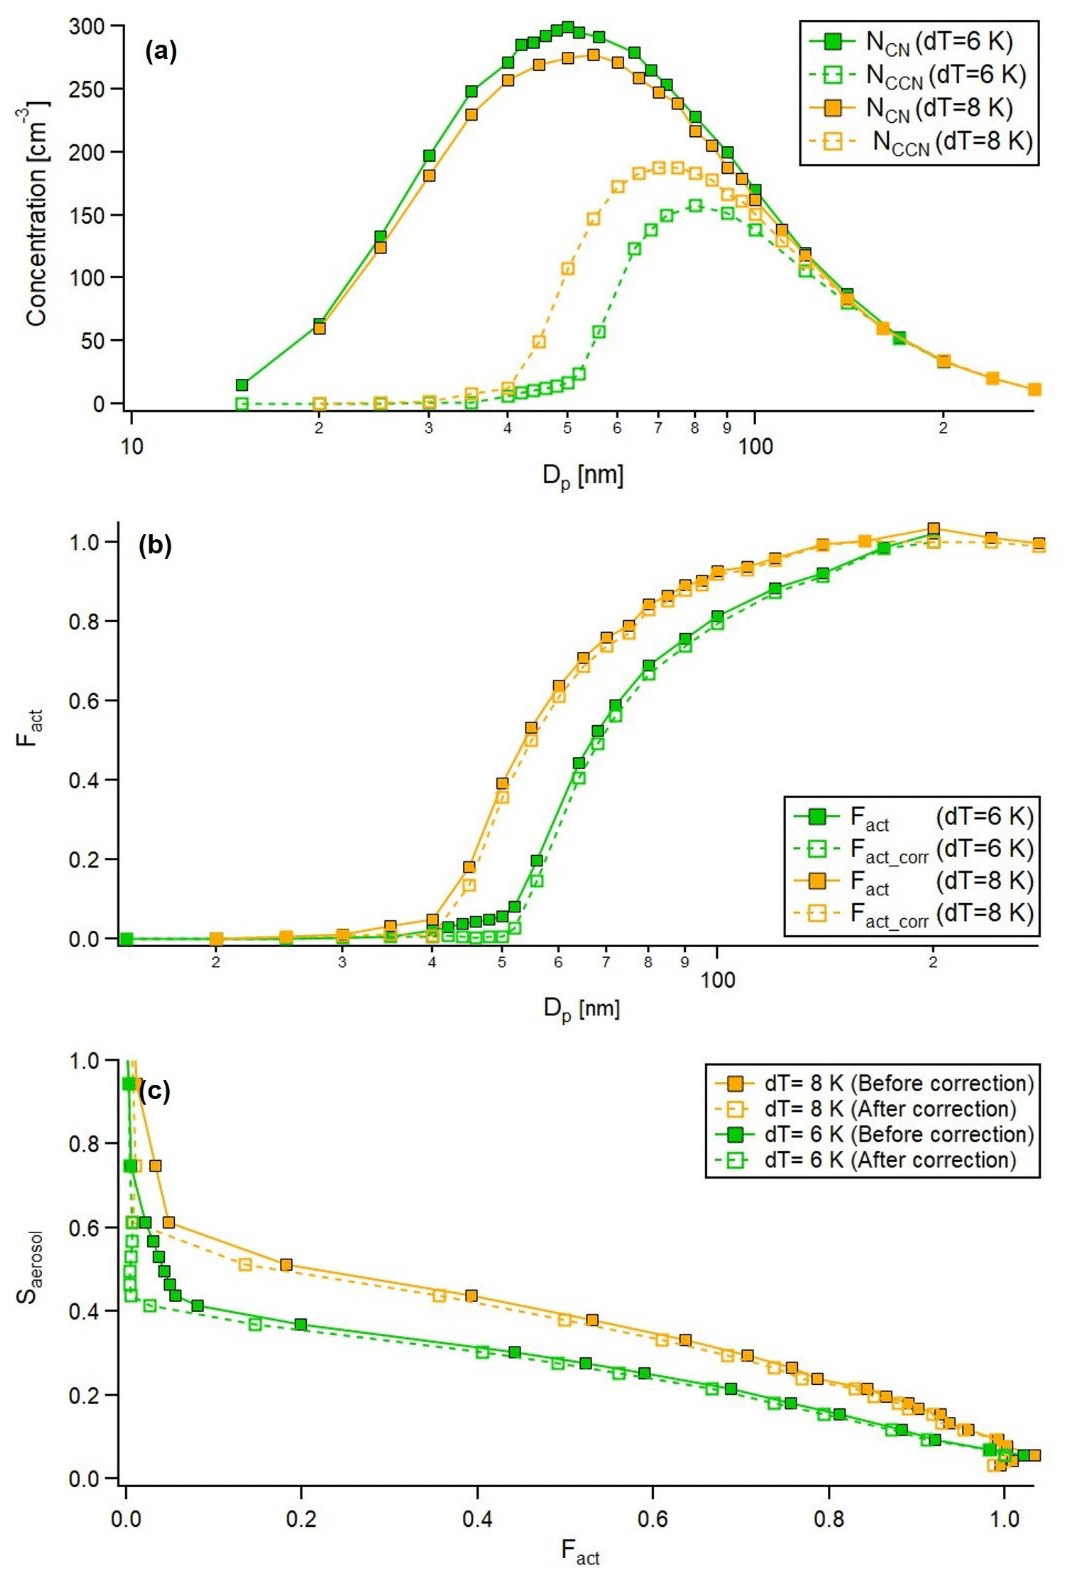
Figure 3(a) Particle and CCN number size distribution, (b) activation fraction (Fact) curve and (c) Fact–Saerosol calibration curve for dT=6 K (green) and 8 K (orange). Squares indicate measurement points. Solid lines and dashed lines with squares indicate results before and after the correction, respectively.
3.2 Ambient aerosol
Unlike calibration aerosols, the particle number size distribution of ambient aerosols cannot be controlled, and Dg is generally larger than lab-generated aerosols. Also, the particle number size distribution is highly variable depending on time and region. It means that Fact can be easily affected by multiply charged particles, so the correction algorithm is essential. Here, we adopted cases from the polluted marine aerosol measurement that was carried out in the Yellow Sea during springtime, 2021. Specifically, the ship campaign took place three times, lasting about 10 d each time (first period: 22 March–2 April; second period: 6–15 April; third period: 20–29 April), and it crossed the north and south of the Yellow Sea alternately. During the first observation period, the ship went down to the south (31.5∘ N, 125.0∘ E), which was relatively less affected by the continent. Also, there was a period for the transportation of Asian dust. For the first observation period, we chose two cases with different aerosol size distributions: one from the period when the ship sailed south and one from the period when Asian dust was transported. As in Sect. 4.1, the measured aerosol number concentration data were fitted to the lognormal distribution for calculation and the aerosols are assumed to be spherical. Figure 4 shows the measured aerosol and CCN number size distribution and the activation curve before and after the correction of Case I. Dg and σg are 70.6 nm and 1.58, respectively. When applying the algorithm, the reduction in the Fact value of the activation curve is 0.01 to 0.07. In particular, the decrease was the largest at about 70 nm, near the geometric mean diameter of the aerosol size distribution. Figure 5 is the same as Fig. 4 with Case II, which has larger Dg and higher σg than Case I (Dg=129.0 nm and σg=1.65). As the peak diameter becomes larger, the effect of multiply charged particles increases. The Fact decreases by up to 0.2. Although NCCN for doubly charged particle shows the maximum near the peak of NCN, the decrease in the value of Fact was dominant in the range where Fact is 0.1 to 0.8, and the corresponding particle size was smaller than the peak diameter. It is because Fact is calculated not only by NCCN but also by NCN after subtracting multiply charged particles. Also, when calculating NCCN, the original Fact from the measurement is considered. Figure 6 shows the change in the κ value according to the change in Fact. In Case II, since the decrease in Fact is more prominent than in Case I, the difference in the κ value after the correction is also more significant. For Case II, the change in the κ value is about 0.04 to 0.08, whereas for Case I, the change in κ is about 0.01. We can conclude from these results that the effect of multiply charged particles is different depending on the particle number size distribution. And, the difference in κ of 0.08 can lead to a relative deviation of the CCN number concentration of up to about 20 % when assuming the particle size distribution of Case II and a supersaturation ranging from 0.05 % to 1.0 %. It means that the correction algorithm should be applied if the peak size of ambient aerosols is large and has a broad particle number size distribution. However, it is noted that not only a monomodal distribution but also a bimodal or trimodal aerosol distribution are observed in the ambient environments, and care should be taken to apply the correction algorithm accordingly.
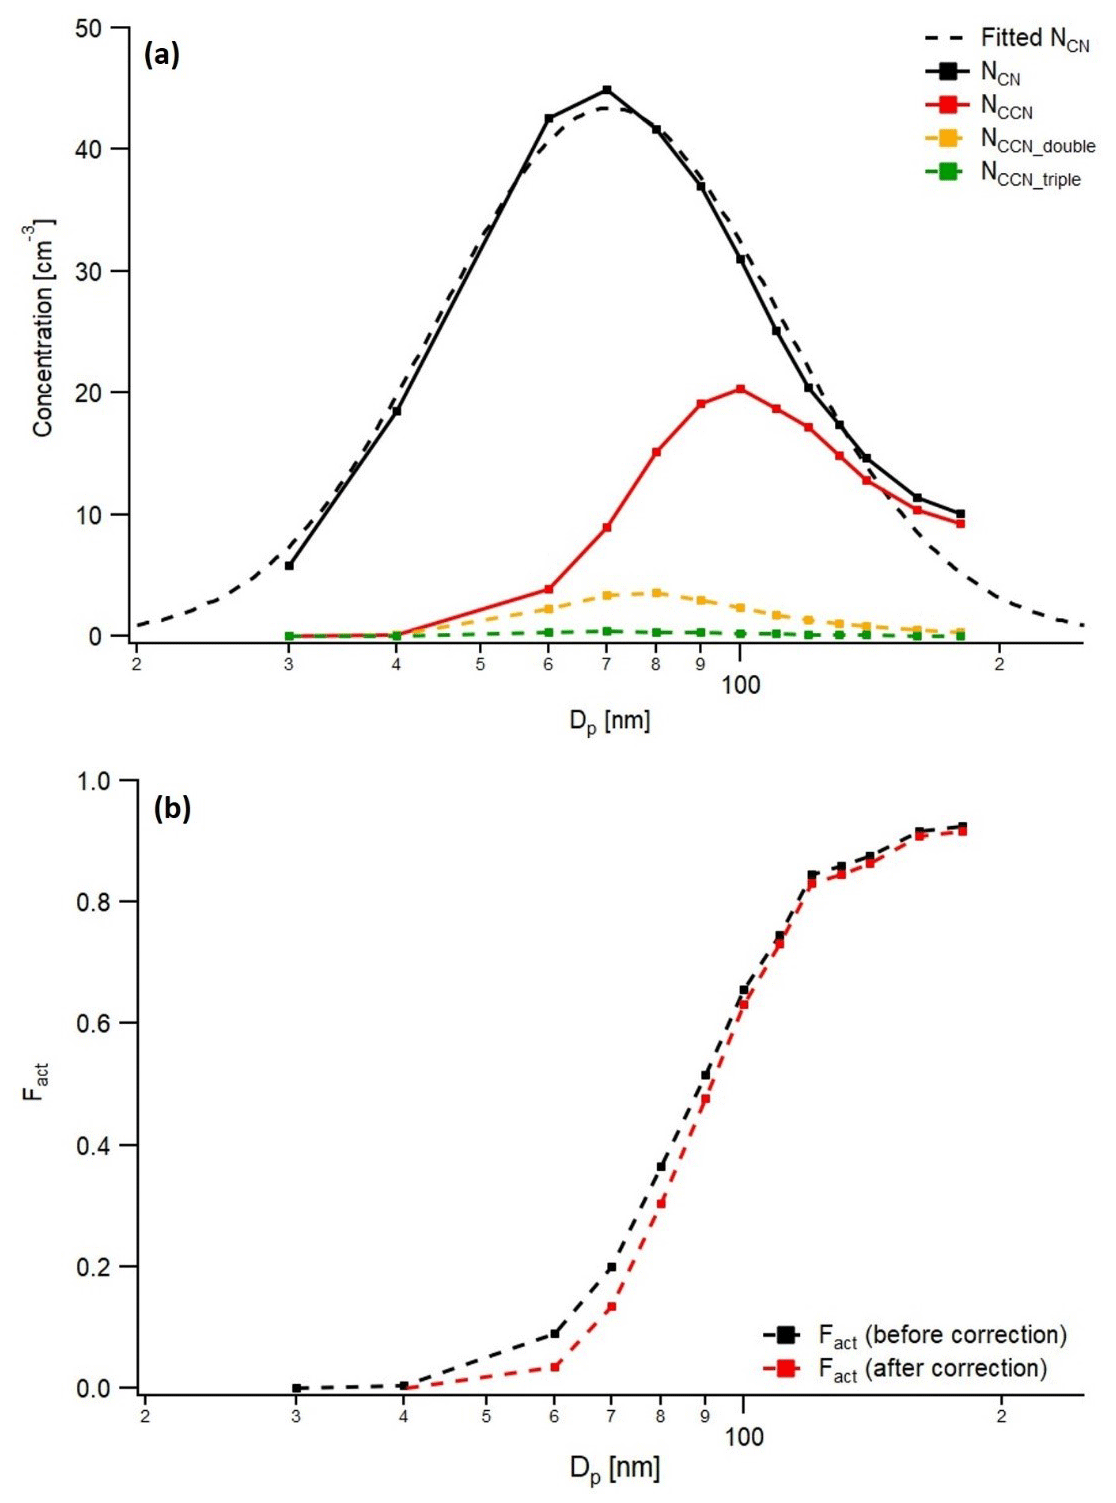
Figure 4(a) Number size distribution of aerosol (black) and CCN (red for total particles, orange for doubly charged particles and green for triply charged particles) and lognormally fitted particle number size distribution (Dg=70.6 nm and σg=1.58, dashed black line) and (b) activation cure before (black) and after correction (red) for Case I. Each dot indicates a measurement point.
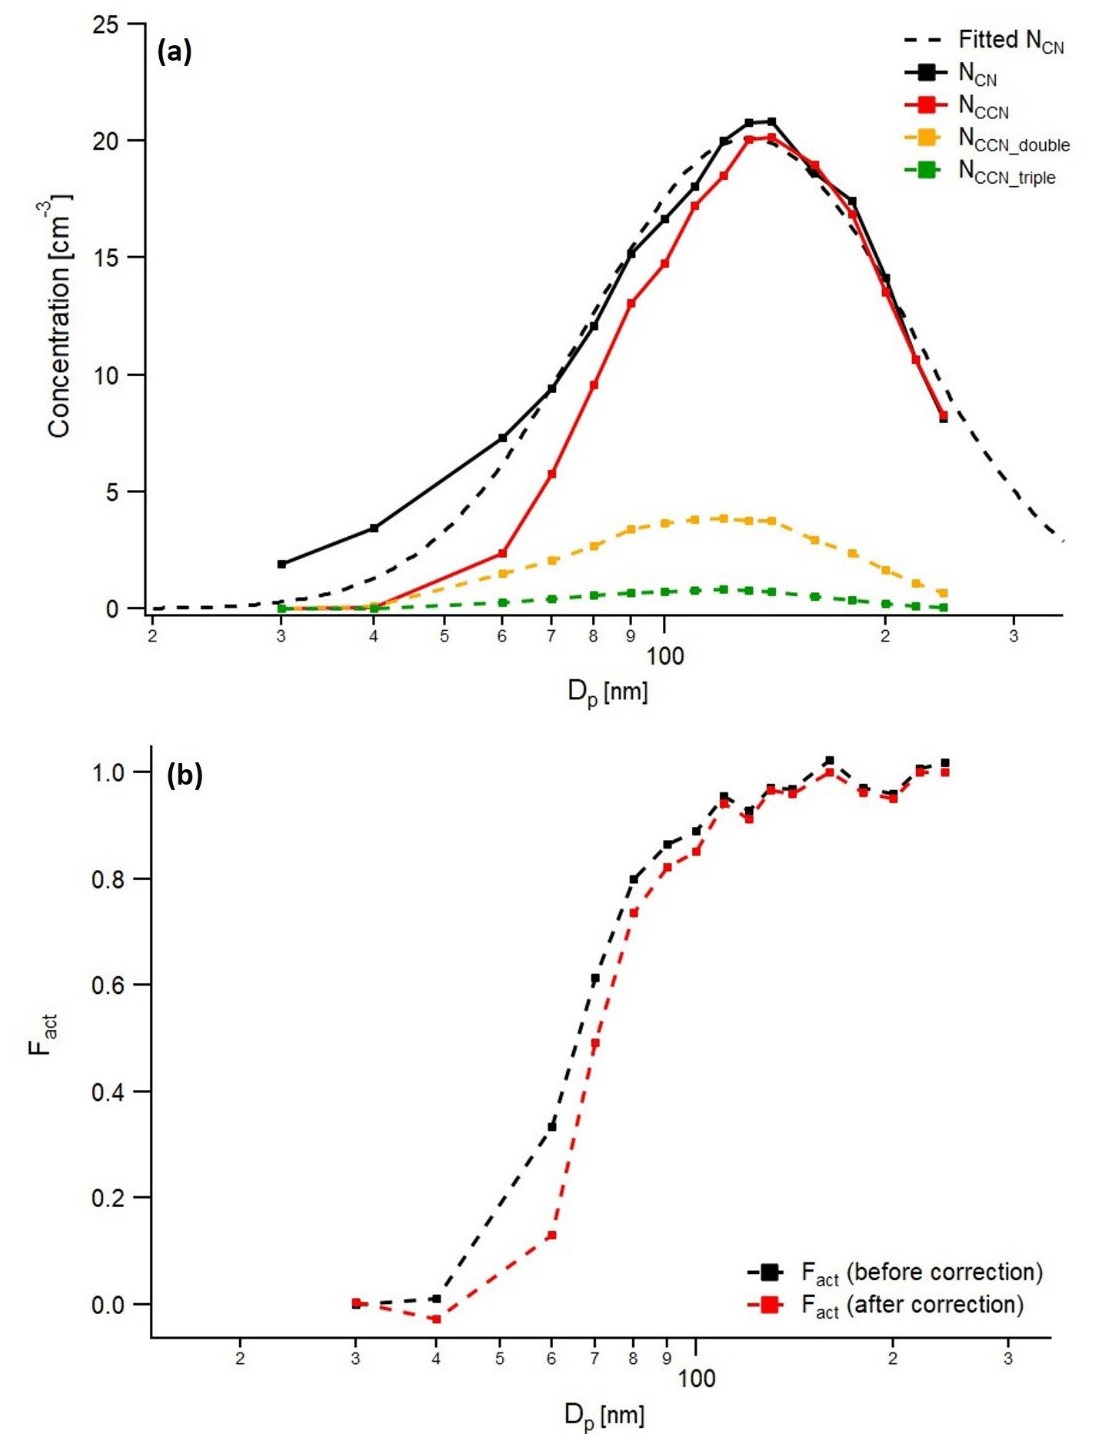
Figure 5(a) Number size distribution of aerosol (black) and CCN (red for total particles, orange for doubly charged particles and green for triply charged particles) and lognormally fitted particle number size distribution (Dg=129.0 nm and σg=1.65; dashed black line) and (b) activation curve before (black) and after correction (red) for Case II. Each dot indicates a measurement point.
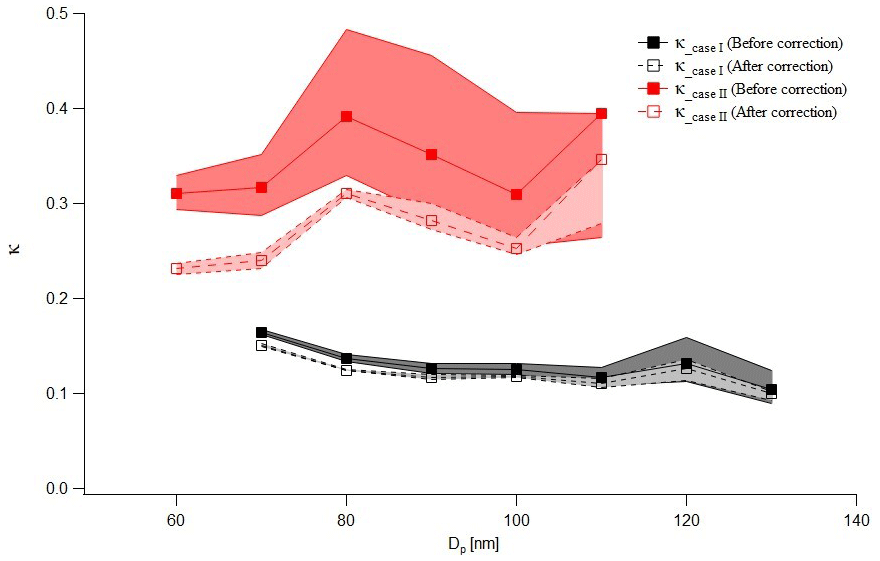
Figure 6κ values as a function of particle size before (filled square) and after (square) correction for Case I (black) and Case II (red). The shaded area indicates uncertainties in κ values which are evaluated from the Fact values.
As discussed above, Fact for multiply charged particle can affect the activation spectra and thereby the κ derivation. The extents of Fact and κ deviation between original and corrected activation spectra (i.e., Dp–Fact) for cases I and II were different due to the different particle number size distribution. Therefore, we further examined how the particle number size distribution is linked to the deviation of activation spectra and κ values. Based on the observed activation spectra, referred to as “original”, we applied the correction algorithm by changing Dg of the particle size distribution. The value obtained by applying the algorithm is referred to as “corrected”. The relative deviation is defined as the difference between the original and corrected value. Figure 7 is a contour plot of the relative deviation of Fact and κ as a function of Dg for the lognormally fitted particle size distribution for cases I and II. The dashed red line indicates the original Dg of each case as described in Sect. 3.3. For Case I (Fig. 7a), the maximum value appears near the original Dg, 70 nm, and gradually decreases. As Dg increases, the relative deviation of Fact increases, and the interval between the contour also gradually narrows. It is noted that deviation values between 60 and 120 nm in Dp, which correspond to a Fact value between 0.1 and 0.9, are meaningful. The deviation of the κ value in Fig. 7b also showed a similar tendency to that of the Fact value. For Case II (Fig. 7c), the maximum relative deviation value appears near 60 nm. The relative deviation value of Fact is higher and the interval is narrower than for Case I. This can be explained by the original particle number size distribution and activation spectra in Figs. 4 and 5. Case II shows a much broader and larger particle size distribution, which means the effect of multiply charged particle is larger in Case II. Also, Fact shows a higher value at the same particle size in Case II than Case I implying a different chemical composition due to different air masses. For Case II, deviation values between 50 and 100 nm in Dp, which correspond to the Fact value between 0.1 and 0.9, are meaningful. Like Case I, Case II also shows that the deviation of Fact increases as Dg increases, and the deviation of κ also tends to be similar (Fig. 7c and d). It means that change in particle size distribution affects the deviation of Fact and thereby the κ value regardless of the original activation spectra.
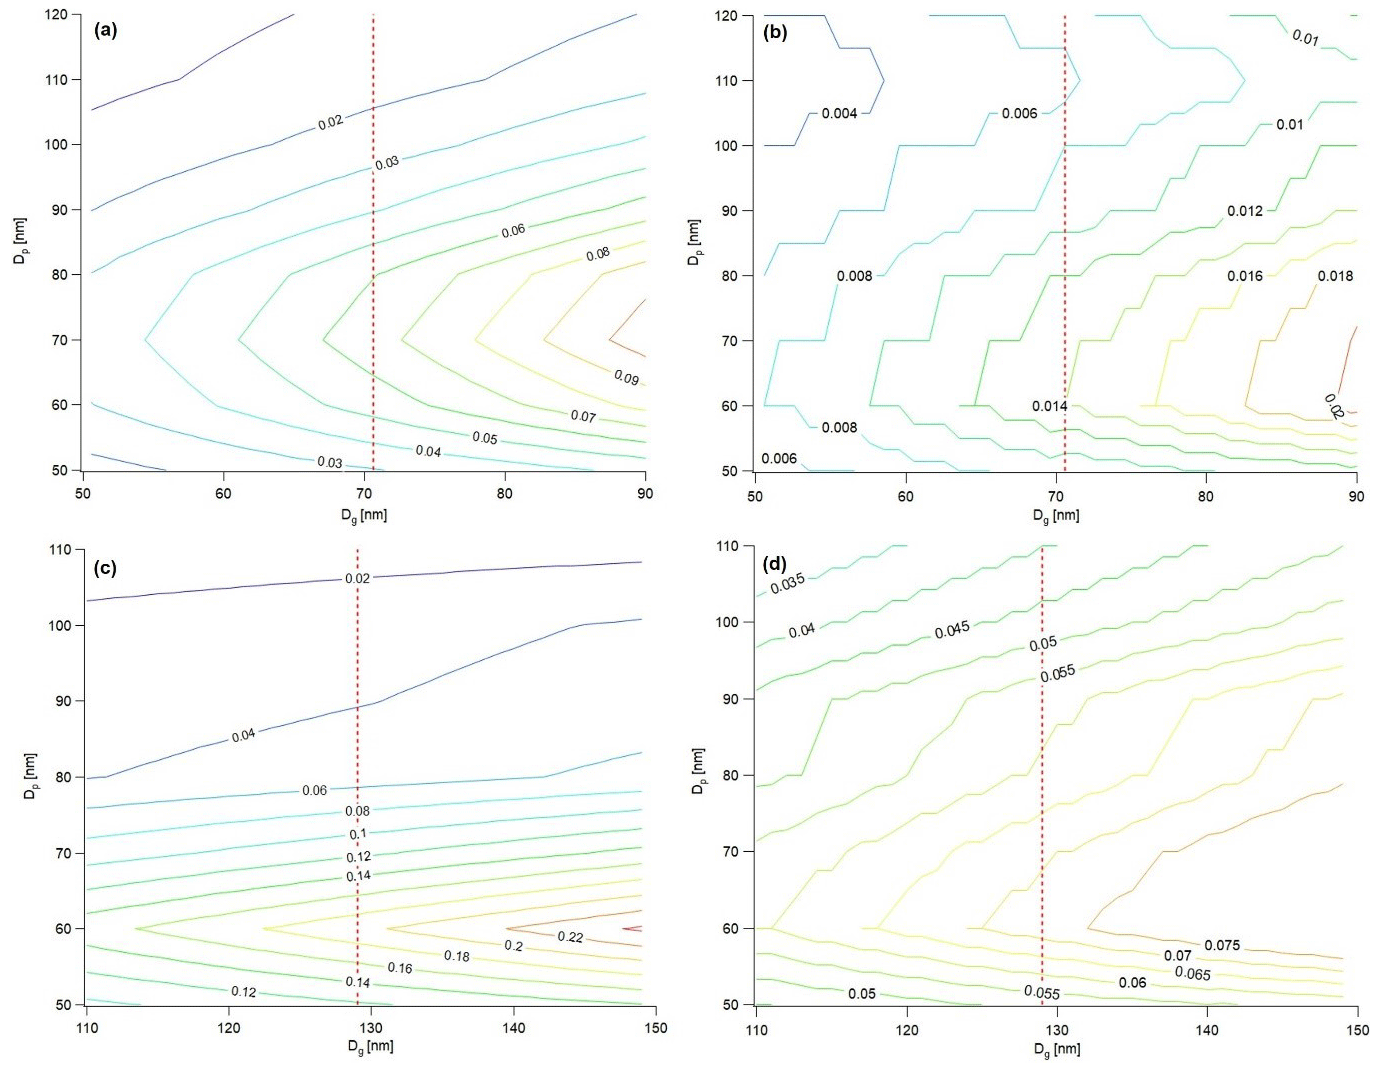
Figure 7The deviation (original value–corrected value) of Fact (a for Case I and c for Case II) and κ (b for Case I and d for Case II) as a function of Dg for lognormally fitted particle size distribution. The contour indicates the range of relative deviation, and the value is marked on the contour. (The redder the color of the contour, the greater the value.) Dashed red line presents the original Dg value for each case (Dg=70.6 nm for Case I and Dg=129.0 nm for Case II).
In addition to the effect of multiply charged particles on CCN activation, there are other possible uncertainties in CCN activation in the BS2-CCN system. It can be affected by combined physical factors including mixing state, surface activity, viscosity and particle morphology. For example, the CCN number concentration can be underestimated in the ultrafine mode with a high organic mass fraction due to the lower water surface tension. Particle morphology can affect CCN activity as it can have an influence in determining the diameter corresponding to the centroid mobility of each size bin. Altaf et al. (2018) explored the effect of size-dependent morphology on CCN activity using aerosol particles composed of organic compounds and salts. For the calibration experiment, particle morphology is considered by applying the particle shape factor when deriving κ values. The relative uncertainties, i.e., the ratio between absolute error and measured value, do not exceed 1 % for calibration aerosols. However, the relative uncertainties could be higher in ambient aerosols due to the non-sphericity. As κ values can be derived directly by Fact values in the BS2-CCN system, these possible uncertainties in CCN activation need to be carefully considered when deriving κ values. For the BS2-CCN system, the absolute deviation of Fact was mostly less than 0.05 except for the stabilization time, i.e., the first 10 s of each Dp scan and the Fact value that is higher than 0.85 (Kim et al., 2021).
In summary, we propose a multiple-charging correction algorithm for the BS2-CCN system with continuous and multiple supersaturations in the chamber. Unlike existing algorithms, the correction algorithm in this study aims at deriving the true value of Fact for each particle size as the Fact value is used to derive κ directly. Starting from larger particles, the number concentrations of particles for both NCN and NCCN with multiple charges (here, we consider only +2 and +3 charges) are removed, and the new Fact is updated to the original activation spectra. The same procedure is repeated for the smaller particles after updating the new Fact value. When applying the algorithm, the Fact value was corrected, especially in the range between 0.1 and 0.9 of Fact, and the plateau in activation spectra for multiply charged particles was successfully eliminated. The extent of correction depends on the particle size distribution. To be specific, there is no large discrepancy between the activation spectrum and the calibration curve (i.e., the Fact–Saerosol relation) if the particle size distribution of generated calibration aerosols is well controlled with smaller Dg. For ambient aerosols, larger deviations of Fact and κ were shown with larger Dg. The difference between corrected and original κ values of 0.08 from samples could lead to about 20 % of the relative deviation of CCN number concentration within the supersaturation range between 0.05 % and 1.0 %, which cannot be ignored. It can be concluded that the multiple-charge correction algorithm should be applied to the ambient aerosols to reduce the error when calculating the κ value in the BS2-CCN system.
The algorithm code and data can be made available upon request from the corresponding author (yafang.cheng@mpic.de).
The supplement related to this article is available online at: https://doi.org/10.5194/amt-16-2771-2023-supplement.
NK designed and implemented the data correction algorithm for the BS2-CCN system. YC supervised and led the paper preparation. HS and NM contributed to the discussion with their expertise in the BS2-CCN system and measurement data processing. NK wrote the paper. All coauthors discussed the results and commented on the paper.
At least one of the (co-)authors is a member of the editorial board of Atmospheric Measurement Techniques. The peer-review process was guided by an independent editor, and the authors also have no other competing interests to declare.
Publisher’s note: Copernicus Publications remains neutral with regard to jurisdictional claims in published maps and institutional affiliations.
The authors acknowledge financial support from the Max Planck Society (MPG). Yafang Cheng and Najin Kim thank the Minerva Program at MPG for support.
The article processing charges for this open-access publication were covered by the Max Planck Society.
This paper was edited by Mingjin Tang and reviewed by three anonymous referees.
Altaf, M. B., Dutcher, D. D., Raymond, T. M., and Freedman, M. A.: Effect of Particle Morphology on Cloud Condensation Nuclei Activity, ACS Earth Space Chem., 2, 634–639, https://doi.org/10.1021/acsearthspacechem.7b00146, 2018.
Andreae, M. O. and Rosenfeld, D.: Aerosol-cloud-precipitation interactions. Part 1, The nature and sources of cloud-active aerosols, Earth Sci. Rev., 89, 13–41, 2008.
Chang, R. Y.-W., Slowik, J. G., Shantz, N. C., Vlasenko, A., Liggio, J., Sjostedt, S. J., Leaitch, W. R., and Abbatt, J. P. D.: The hygroscopicity parameter (κ) of ambient organic aerosol at a field site subject to biogenic and anthropogenic influences: relationship to degree of aerosol oxidation, Atmos. Chem. Phys., 10, 5047–5064, https://doi.org/10.5194/acp-10-5047-2010, 2010.
Che, H. C., Zhang, X. Y., Wang, Y. Q., Zhang, L., Shen, X. J., Zhang, Y. M., Ma, Q. L., Sun, J. Y., Zhang, Y. W., and Wang, T. T.: Characterization and parameterization of aerosol cloud condensation nuclei activation under different pollution conditions, Scientific Reports, 6, 24497, https://doi.org/10.1038/srep24497, 2016.
Dusek, U., Frank, G. P., Hildebrandt, L., Curtius, J., Schneider, J., Walter, S., Chand, D., Drewnick, F., Hings, S., Jung, D., Borrmann, S., and Andreae, M. O.: Size matters more than chemistry for cloud nucleating ability of aerosol particles, Science, 312, 1375–1378, 2006.
Ervens, B., Cubison, M. J., Andrews, E., Feingold, G., Ogren, J. A., Jimenez, J. L., Quinn, P. K., Bates, T. S., Wang, J., Zhang, Q., Coe, H., Flynn, M., and Allan, J. D.: CCN predictions using simplified assumptions of organic aerosol composition and mixing state: a synthesis from six different locations, Atmos. Chem. Phys., 10, 4795–4807, https://doi.org/10.5194/acp-10-4795-2010, 2010.
Frank, G. P., Dusek, U., and Andreae, M. O.: Technical note: A method for measuring size-resolved CCN in the atmosphere, Atmos. Chem. Phys. Discuss., 6, 4879–4895, https://doi.org/10.5194/acpd-6-4879-2006, 2006.
Gunn, R. and Woessner, R. H.: Measurements of the systematic electrification of aerosols, J. Coll. Sci. Imp. U. Tok., 11, 254–259, https://doi.org/10.1016/0095-8522(56)90050-2, 1956.
Gunthe, S. S., King, S. M., Rose, D., Chen, Q., Roldin, P., Farmer, D. K., Jimenez, J. L., Artaxo, P., Andreae, M. O., Martin, S. T., and Pöschl, U.: Cloud condensation nuclei in pristine tropical rainforest air of Amazonia: size-resolved measurements and modeling of atmospheric aerosol composition and CCN activity, Atmos. Chem. Phys., 9, 7551–7575, https://doi.org/10.5194/acp-9-7551-2009, 2009.
Hämeri, K., Väkevä, M., Aalto, P. P., Kulmala, M., Swietlicki, E., Zhou, J., Seidl, W., Becker, E., and O'Dowd, C. D.: Hygroscopic and CCN properties of aerosol particles in boreal forests, Tellus B, 53, 359–379, 2001.
Hudson, J. G.: Cloud condensation nuclei, J. Appl. Meteorol., 32, 596–607, 1993.
IPCC: Climate Change 2007: Synthesis Report. Contribution of Working Groups I, II and III to the Fourth Assessment Report of the Intergovernmental Panel on Climate Change, Core Writing Team, edited by: Pachauri, R. K. and Reisinger, A., IPCC, Geneva, Switzerland, 104 pp., https://www.ipcc.ch/report/ar4/syr/ (last access: 8 April 2020), 2007.
Jurányi, Z., Gysel, M., Weingartner, E., Bukowiecki, N., Kammermann, L., and Baltensperger, U.: A 17 month climatology of the cloud condensation nuclei number concentration at the high alpine site Jungfraujoch, J. Geophys. Res.-Atmos., 116, D10204, https://doi.org/10.1029/2010JD015199, 2011.
Kim, J. H., Yum, S. S., Shim, S., Kim, W. J., Park, M., Kim, J.-H., Kim, M.-H., and Yoon, S.-C.: On the submicron aerosol distributions and CCN number concentrations in and around the Korean Peninsula, Atmos. Chem. Phys., 14, 8763–8779, https://doi.org/10.5194/acp-14-8763-2014, 2014.
Kim, N., Cheng, Y., Ma, N., Pöhlker, M. L., Klimach, T., Mentel, T. F., Krüger, O. O., Pöschl, U., and Su, H.: Calibration and evaluation of a broad supersaturation scanning (BS2) cloud condensation nuclei counter for rapid measurement of particle hygroscopicity and cloud condensation nuclei (CCN) activity, Atmos. Meas. Tech., 14, 6991–7005, https://doi.org/10.5194/amt-14-6991-2021, 2021.
Moore, R. H., Nenes, A., and Medina, J.: Scanning Mobility CCN Analysis – A Method for Fast Measurement of Size-Resolved CCN Distributions and Activation Kinetics, Aerosol Sci. Tech., 44, 861–871, https://doi.org/10.1080/02786826.2010.498715, 2010.
Moore, R. H., Cerully, K., Bahreini, R., Brock, C. A., Middlebrook, A. M., and Nenes, A.: Hygroscopicity and composition of California CCN during summer 2010, J. Geophys. Res.-Atmos., 117, D00V12, https://doi.org/10.1029/2011jd017352, 2012.
Ovadnevaite, J., Ceburnis, D., Martucci, G., Bialek, J., Monahan, C., Rinaldi, M., Facchini, M. C., Berresheim, H., Worsnop, D. R., and O'Dowd, C.: Primary marine organic aerosol: A dichotomy of low hygroscopicity and high CCN activity, Geophys. Res. Lett., 38, L21806, https://doi.org/10.1029/2011GL048869, 2011.
Padró, L. T., Moore, R. H., Zhang, X., Rastogi, N., Weber, R. J., and Nenes, A.: Mixing state and compositional effects on CCN activity and droplet growth kinetics of size-resolved CCN in an urban environment, Atmos. Chem. Phys., 12, 10239–10255, https://doi.org/10.5194/acp-12-10239-2012, 2012.
Petters, M. D. and Kreidenweis, S. M.: A single parameter representation of hygroscopic growth and cloud condensation nucleus activity, Atmos. Chem. Phys., 7, 1961–1971, https://doi.org/10.5194/acp-7-1961-2007, 2007.
Petters, M. D., Prenni, A. J., Kreidenweis, S. M., and DeMott, P. J.: On measuring the critical diameter of cloud condensation nuclei using mobility selected aerosol, Aerosol Sci. Tech., 41, 907–913, 2007.
Pöhlker, M. L., Pöhlker, C., Ditas, F., Klimach, T., Hrabe de Angelis, I., Araújo, A., Brito, J., Carbone, S., Cheng, Y., Chi, X., Ditz, R., Gunthe, S. S., Kesselmeier, J., Könemann, T., Lavrič, J. V., Martin, S. T., Mikhailov, E., Moran-Zuloaga, D., Rose, D., Saturno, J., Su, H., Thalman, R., Walter, D., Wang, J., Wolff, S., Barbosa, H. M. J., Artaxo, P., Andreae, M. O., and Pöschl, U.: Long-term observations of cloud condensation nuclei in the Amazon rain forest – Part 1: Aerosol size distribution, hygroscopicity, and new model parametrizations for CCN prediction, Atmos. Chem. Phys., 16, 15709–15740, https://doi.org/10.5194/acp-16-15709-2016, 2016.
Ren, J., Zhang, F., Wang, Y., Collins, D., Fan, X., Jin, X., Xu, W., Sun, Y., Cribb, M., and Li, Z.: Using different assumptions of aerosol mixing state and chemical composition to predict CCN concentrations based on field measurements in urban Beijing, Atmos. Chem. Phys., 18, 6907–6921, https://doi.org/10.5194/acp-18-6907-2018, 2018.
Rose, D., Gunthe, S. S., Mikhailov, E., Frank, G. P., Dusek, U., Andreae, M. O., and Pöschl, U.: Calibration and measurement uncertainties of a continuous-flow cloud condensation nuclei counter (DMT-CCNC): CCN activation of ammonium sulfate and sodium chloride aerosol particles in theory and experiment, Atmos. Chem. Phys., 8, 1153–1179, https://doi.org/10.5194/acp-8-1153-2008, 2008.
Rose, D., Nowak, A., Achtert, P., Wiedensohler, A., Hu, M., Shao, M., Zhang, Y., Andreae, M. O., and Pöschl, U.: Cloud condensation nuclei in polluted air and biomass burning smoke near the mega-city Guangzhou, China – Part 1: Size-resolved measurements and implications for the modeling of aerosol particle hygroscopicity and CCN activity, Atmos. Chem. Phys., 10, 3365–3383, https://doi.org/10.5194/acp-10-3365-2010, 2010.
Schmale, J., Henning, S., Decesari, S., Henzing, B., Keskinen, H., Sellegri, K., Ovadnevaite, J., Pöhlker, M. L., Brito, J., Bougiatioti, A., Kristensson, A., Kalivitis, N., Stavroulas, I., Carbone, S., Jefferson, A., Park, M., Schlag, P., Iwamoto, Y., Aalto, P., Äijälä, M., Bukowiecki, N., Ehn, M., Frank, G., Fröhlich, R., Frumau, A., Herrmann, E., Herrmann, H., Holzinger, R., Kos, G., Kulmala, M., Mihalopoulos, N., Nenes, A., O'Dowd, C., Petäjä, T., Picard, D., Pöhlker, C., Pöschl, U., Poulain, L., Prévôt, A. S. H., Swietlicki, E., Andreae, M. O., Artaxo, P., Wiedensohler, A., Ogren, J., Matsuki, A., Yum, S. S., Stratmann, F., Baltensperger, U., and Gysel, M.: Long-term cloud condensation nuclei number concentration, particle number size distribution and chemical composition measurements at regionally representative observatories, Atmos. Chem. Phys., 18, 2853–2881, https://doi.org/10.5194/acp-18-2853-2018, 2018.
Su, H., Rose, D., Cheng, Y. F., Gunthe, S. S., Massling, A., Stock, M., Wiedensohler, A., Andreae, M. O., and Pöschl, U.: Hygroscopicity distribution concept for measurement data analysis and modeling of aerosol particle mixing state with regard to hygroscopic growth and CCN activation, Atmos. Chem. Phys., 10, 7489–7503, https://doi.org/10.5194/acp-10-7489-2010, 2010.
Su, H., Cheng, Y., Ma, N., Wang, Z., Wang, X., Pöhlker, M. L., Nillius, B., Wiedensohler, A., and Pöschl, U.: A broad supersaturation scanning (BS2) approach for rapid measurement of aerosol particle hygroscopicity and cloud condensation nuclei activity, Atmos. Meas. Tech., 9, 5183–5192, https://doi.org/10.5194/amt-9-5183-2016, 2016.
Thalman, R., de Sá, S. S., Palm, B. B., Barbosa, H. M. J., Pöhlker, M. L., Alexander, M. L., Brito, J., Carbone, S., Castillo, P., Day, D. A., Kuang, C., Manzi, A., Ng, N. L., Sedlacek III, A. J., Souza, R., Springston, S., Watson, T., Pöhlker, C., Pöschl, U., Andreae, M. O., Artaxo, P., Jimenez, J. L., Martin, S. T., and Wang, J.: CCN activity and organic hygroscopicity of aerosols downwind of an urban region in central Amazonia: seasonal and diel variations and impact of anthropogenic emissions, Atmos. Chem. Phys., 17, 11779–11801, https://doi.org/10.5194/acp-17-11779-2017, 2017.
Wiedensohler, A.: An approximation of the bipolar charge distribution for particles in the submicron size range, J. Aerosol Sci., 19, 387–389, https://doi.org/10.1016/0021-8502(88)90278-9, 1988.
Xu, W., Fossum, K. N., Ovadnevaite, J., Lin, C., Huang, R.-J., O'Dowd, C., and Ceburnis, D.: The impact of aerosol size-dependent hygroscopicity and mixing state on the cloud condensation nuclei potential over the north-east Atlantic, Atmos. Chem. Phys., 21, 8655–8675, https://doi.org/10.5194/acp-21-8655-2021, 2021.