the Creative Commons Attribution 4.0 License.
the Creative Commons Attribution 4.0 License.
 | 07 Jun 2023
Development and evaluation of an improved offline aerosol mass spectrometry technique
Christina N. Vasilakopoulou
Kalliopi Florou
Christos Kaltsonoudis
Iasonas Stavroulas
Nikolaos Mihalopoulos
Spyros N. Pandis
The offline aerosol mass spectrometry technique is a useful tool for the source apportionment of organic aerosol (OA) in areas and periods during which an aerosol mass spectrometer (AMS) is not available. However, the technique is based on the extraction of aerosol samples in water, while several atmospheric OA components are partially or fully insoluble in water. In this work an improved offline technique was developed and evaluated in an effort to capture most of the partially soluble and insoluble organic aerosol material, reducing significantly the uncertainty of the corresponding source apportionment. A major advantage of the proposed approach is that no corrections are needed for the offline analysis to account for the limited water solubility of some OA components. The improved offline AMS analysis was tested in three campaigns: two during winter and one during summer. Collocated online AMS measurements were performed for the evaluation of the offline method. Source apportionment analysis was performed separately for the online and the offline measurements using positive matrix factorization (PMF). The PMF results showed that the fractional contribution of each factor to the total OA differed between the online and the offline PMF results by less than 15 %. The differences in the AMS spectra of the factors of the two approaches could be significant, suggesting that the use of factor profiles from the literature in the offline analysis may lead to complications. Part of the good agreement between the online and the offline PMF results is due to the ability of the improved offline AMS technique to capture a bigger part of the OA, including insoluble organic material. This was evident by the significant fraction of submicrometer suspended insoluble particles present in the water extract and by the reduced insoluble material on the filters after the extraction process. More than half of the elemental carbon (EC) was on average missing from the filters after the water extraction. Significant EC concentrations were measured in the produced aerosol that was used as input to the AMS during the offline analysis.
- Article
(2444 KB) - Full-text XML
-
Supplement
(3166 KB) - BibTeX
- EndNote


The high-resolution time-of-flight aerosol mass spectrometer (HR-ToF-AMS) has been used during the last 15 years for the source apportionment of organic aerosol (OA) in field studies (DeCarlo et al., 2008; Sun et al., 2011). The corresponding results have dramatically improved our understanding of particulate matter and especially of organic aerosol. The AMS is one of the few instruments which can provide information for the size distribution of aerosols, their concentration, and their chemical composition in high temporal resolution (Drewnick et al., 2005; Jayne et al., 2000).
The AMS measurements can also be combined with source apportionment algorithms, such as positive matrix factorization (PMF) (Paatero and Tapper, 1994), to estimate the contribution of the various sources or atmospheric transformations of OA. The advantage of PMF compared to other receptor models is that the solutions are constrained to be non-negative, which makes it suitable for environmental applications. The Multilinear Engine algorithm (ME-2) can also be used in cases that PMF results in non-meaningful solutions or to quantify smaller contributions of sources (Paatero, 1999). The difference between PMF and ME-2 is that in the latter, the user can use a priori information about the factor profiles as input to the algorithm, forcing it to account for the specific source.
Even though the AMS has been used in many field campaigns around the world (Aiken et al., 2009; Saarikoski et al., 2012; Setyan et al., 2012), there are circumstances in which its use is impractical. Its weight, size, and power consumption sometimes make its move to the field challenging or even impossible for some sites. Also, its high cost makes its use in multiple locations in the same city or region impossible. The offline AMS technique, developed by Daellenbach et al. (2016), is a possible solution to both these problems. In the offline analysis the ambient particulate matter is collected in filters. Then the filter samples are extracted in ultrapure water, and the water extract is filtered, aerosolized, dried, and finally measured with the AMS in the laboratory. Even though this technique provides valuable information about the OA, it has been designed to capture the water-soluble part of the measured OA. The ME-2 was proposed by Daellenbach et al. (2016) for the source apportionment of the corresponding offline measurements. Comparisons between the online and the offline measurements by Daellenbach et al. (2016) suggested the need for significant corrections for hydrocarbon-like OA (HOA), cooking OA (COA), and even biomass burning OA (BBOA) to account for the partial recovery of the components. Many studies have used the corrections proposed by Daellenbach et al. (2016) for OA to correct the offline results for this partial recovery (Bozzetti et al., 2017; Vlachou et al., 2018; Srivastava et al., 2021). However, these corrections may introduce significant uncertainties in the approach (Ge et al., 2017). They may be location-specific (Xu et al., 2017), or they may be sensitive to small variations in the experimental method. Some studies do not use these correction factors (Sun et al., 2011; Mihara and Mochida, 2011; Xu et al., 2015; Ye et al., 2017; Li et al., 2021) and assume that the offline results correspond only to the water-soluble part and not the total OA.
The application of the offline technique may be limited by the OA mass loading of the filter. Niedek et al. (2023) developed a technique in order to reduce the detection limits of the offline AMS measurements. Micronebulization was performed with only 10 µL of liquid used for the extraction. Organics and inorganics were quantitated by an isotopically labeled internal standard.
A significant difference between the online and the offline measurements is the reduced temporal resolution of the latter. Typically, the online measurements are conducted every few minutes, in contrast to the filter collection which is in most cases performed daily. The effect of the reduced temporal resolution to the PMF results was addressed by Vasilakopoulou et al. (2022), who analyzed a 5-month period in high (30 min) and low (daily) temporal resolution using PMF. The results showed that the average contribution of each source to the total OA differed by less than 15 % between the high- and the low-resolution analysis. However, significant differences were observed in the factor spectra. These differences were of secondary importance for the results of the offline AMS source apportionment; however, they suggest that the use of the online factor spectra in the offline analysis may lead to significant errors.
In this study we aim to improve the original offline experimental procedure of Daellenbach et al. (2016) in order to capture a higher fraction of the OA and reduce significantly the uncertainty of the PMF results. A major advantage of the original approach is that it is quantitative; however it requires a specific atomization procedure and does not account directly for the insoluble material. It relies on the use of correction factors that may or may not be applicable for a certain area. The new method is easier to apply in different laboratories, and the analysis of its results is relatively straightforward because it directly accounts for the insoluble material. The proposed improved offline AMS technique is evaluated on three field campaigns in Greece, two during winter and one in summer. Comparisons with the online source apportionment results are used to evaluate the accuracy of the offline source apportionment solution.
2.1 Experimental
The proposed offline method is based on the work of Daellenbach et al. (2016) but with changes in the extraction and atomization steps in an effort to characterize most of the OA. Particulate matter was collected daily (24 h sampling) in quartz filters by a high-volume sampler (Tisch Scientific, 200 L min−1). PM2.5 cyclones were used for the aerosol sampling. After the collection of each sample, the filters were wrapped in pre-baked aluminum foil and placed in petri dishes. Subsequently they were placed in a freezer at −18 ∘C. Also, the samples were transferred frozen to the laboratory in order to reduce the volatilization of semi-volatile organic compounds from the filters as much as possible.
In the laboratory, filter punches (1.5 cm2) are extracted in 20 mL of ultrapure water, with the help of an ultrasonic sonicator (Elmasonic S80). The extracts are placed in a syringe pump working at a flow rate of 15 mL h−1. The water sample is not filtered in an effort to analyze a higher fraction of the OA and to limit the losses of organic aerosol material. This is one of the major features of our proposed approach. The extract is then atomized using an atomizer (TSI, 3075), and the produced droplets are dried using a silica gel dryer. The resulting aerosol is characterized by a HR-ToF-AMS (Aerodyne Inc.). The AMS measures particles smaller than 1 µm because larger particles (e.g., fragments of the quartz filter) produced during the extraction and atomization processes are unable to pass through the AMS aerodynamic lenses. A Zetasizer (Malvern Nano ZS) was used to measure the size distribution of particles in the water extracts of the filters.
One of the potential problems of the technique is the fragmentation of the quartz filter during the sonication and the fate of the filter debris. In order to address this issue, we used the Zetasizer to measure the size distribution of particles in water extracts of sonicated clean pre-baked filters, and we compared the results with experiments in which we just sonicated clean water. In both cases, there were few particles in the sub-micrometer range, and the filter presence made practically no difference. However, in the case of the clean filter, a small peak was observed for particles with sizes around 5 µm. This is probably due to fragments of the quartz filter. However, these larger particles do not make it into the AMS (they do not pass through its aerodynamic lens) and therefore do not affect our measurements. Their presence did not cause any problems in the operation of our atomizer for the hundreds of samples that we have analyzed so far. As a quality assurance measure, we always compare the OA mass spectrum at the beginning and at the end of the offline measurement, and we have not seen any change. If something goes wrong with the atomization during a measurement, it would probably be detected this way. The atomizer is frequently (every few samples) cleaned to minimize any potential contamination.
On average, around 40 min of offline measurements is performed with the AMS for each collected sample. The temporal resolution of the offline AMS measurements was 3 min. Before and after each measurement, a blank measurement is conducted using the same atomized ultrapure water that is used for the extraction of the samples. The ultrapure water is atomized, the produced droplets are dried, and the resulting aerosol is measured by the AMS, similarly with the actual sample, for around 30 min. The average of the two blank measurements is subtracted from the sample value. These blanks were measured during the same days when the actual samples were analyzed so they account for the small variations in the quality of the ultrapure water. We have also tested the blank correction performing the full procedure with a clean filter. The results were for all practical purposes the same as those for the clean water (the angle of the spectra was just 3∘). It should also be noted that particles too small to enter the AMS will necessarily have a very low mass concentration, so even if this material is added to the sample, it will not affect our results. We have tested this by just looking at the size distributions of the produced aerosol from the blank experiments with a scanning mobility particle sizer (SMPS).
The proposed technique was evaluated in three different campaigns in Greece. The number of samples used in each period was above 30. In two of the campaigns (winter 2020 and early summer 2019 in Patras), an HR-AMS was used for the online measurements, and in the third (winter 2019 in Athens) an aerosol mass speciation monitor (ACSM) (Aerodyne Inc., USA) was used.
2.2 Online source apportionment
The PMF analysis of the online measurements (online PMF from now on) was performed using SoFi Pro in resolution of 3 min for the AMS and 30 min for the ACSM. No a priori information about the factor profiles was used. OA high-resolution (HR) mass spectra were analyzed ( 12–300) (Canonaco et al., 2013) for the case of the AMS datasets. The “weak” signals (signal-to-noise () ratio was between 0.2 and 1) were downweighted by a factor of 2 and the “bad” ( below 0.2) by a factor of 10. Also, the variables related to CO2 and CO2-based corrections (16, 17, 18, 28, and 44) were downweighted by a factor of 2. The rotational ambiguity of the solution was explored using the Fpeak. The minimum Fpeak value was −1, the maximum was 1, and the step was 0.1.
For the Athens campaign, the unit-mass-resolution (UMR) spectra ( 12–125) were used, and they were pre-treated in accordance to the procedure described above. Because of the low temporal resolution of the measurements (30 min) high-concentration events were not removed.
2.3 Offline source apportionment
The offline PMF was also performed using SoFi Pro, without utilization of any a priori information about the factor profiles. The high-resolution MS data were used for the offline PMF in all three datasets. Each sampling day was represented by an offline spectrum that was the arithmetic average of the 40 min offline AMS data. The error for each sample was represented by the arithmetic average of the error of the offline measurements. The measured AMS spectrum was corrected based on the blank measurements. The blank concentration was subtracted from the sample for each separately. The error matrix of the AMS spectrum was also blank-corrected using the same procedure. The blank correction was performed prior to the PMF analysis.
The same downweighting of weak and bad signals and the same Fpeak approach as in the online measurements were used.
The improved offline AMS technique was applied to more than 100 ambient daily filter samples from two urban areas in Greece and during different periods of the year. Continuous online AMS measurements were also performed, and they were used for the evaluation of the approach. In this work we will focus on the results from two winter periods (Athens and Patras) and one summer period in Greece (Patras). The measurements from each campaign are analyzed separately in the following sections. For the two campaigns performed in Patras (winter 2020 and summer 2019), an HR-AMS, with 3 min temporal resolution, was used, while in the Athens campaign, an ACSM was used. The temporal resolution of the ACSM was 30 min.
3.1 Winter campaign in Patras, 2020
Patras is the third biggest city of Greece, with almost 200 000 inhabitants. The winter campaign was conducted at the University of the Peloponnese campus during January–February 2020. This urban background site is located around 4 km from the center of Patras. The main goal of the campaign was to study the biomass burning emissions and especially residential wood burning.
Both ambient measurements and mobile smog chamber experiments were conducted (Jorga et al., 2021), but in this study we focus on the ambient measurements. Together with several other instruments, the HR-ToF-AMS was used to characterize the non-refractory PM1 concentration and composition continuously for 1 month. The V mode was used, and the temporal resolution of the measurements was 3 min. The vaporizer temperature was 600 ∘C, and no drying of the sample was performed. Collocated filter samples were also collected during the same period. The sampling started at 18:00 LT each day and lasted for 24 h. The black carbon (BC) mass concentration was measured using a multi-angle absorption photometer (MAAP).
High PM1 concentrations were measured during the late afternoon and night hours when biomass burning for heating purposes was taking place. In some periods, the OA mass concentration exceeded 100 µg m−3 (Fig. 1), with the organics accounting for around 70 % of the total. Black carbon levels were also high during these periods, exceeding 10 µg m−3.
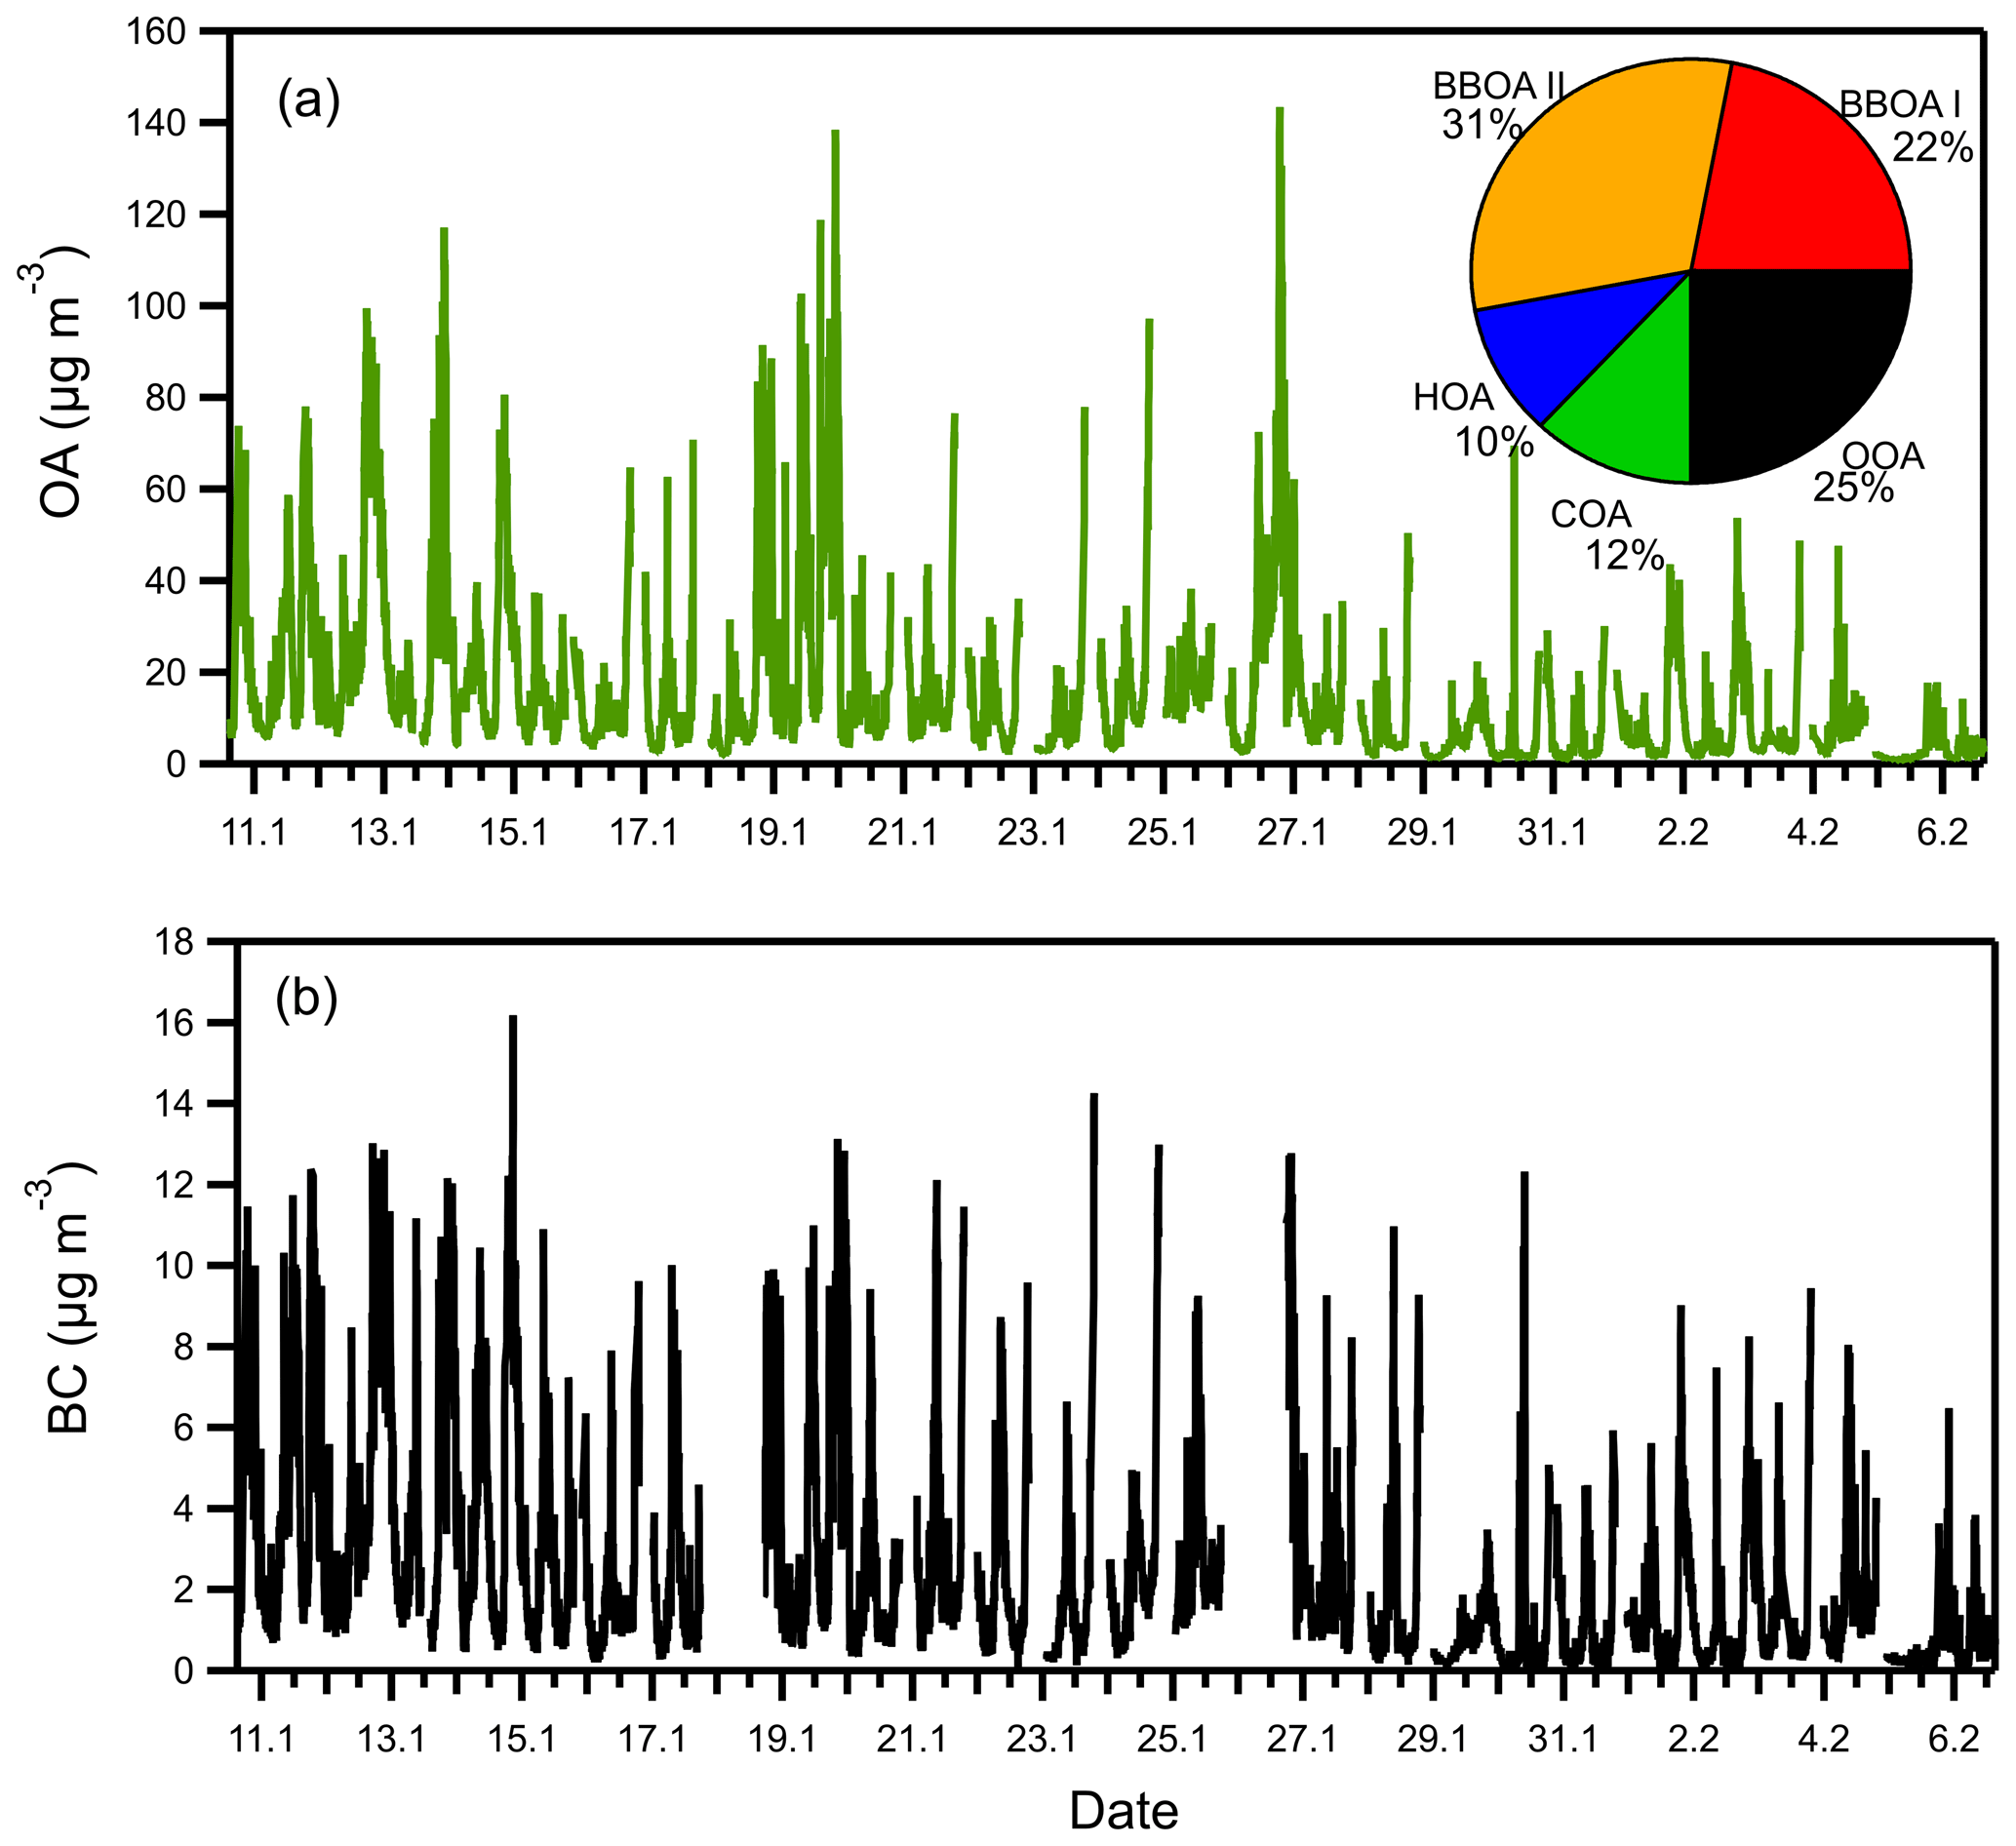
Figure 1Time series of (a) OA and (b) BC during the winter 2020 campaign in Patras. The fractional contribution of each factor to the total OA is also shown.
3.2 Summer campaign in Patras, 2019
The summer campaign in Patras was conducted in the Institute of Chemical Engineering Sciences (ICE-HT), which is located in a suburb of Patras, 8 km away from the city center. The area is surrounded by olive tree fields, and there is limited anthropogenic activity within a radius of 1 km.
The campaign lasted from March until June 2019. Online AMS measurements took place during a few days every week, and mostly during weekends, due to the use of the AMS in other laboratory experiments during that period. Measurements were performed during 10 d per month on average. Filter samples were collected during the same days. Low PM1 concentrations were observed during this measurement period (Fig. 2). The aerosol levels were on average 4 µg m−3. Among the 4 months, March was the one with the highest average OA concentration (6.9 µg m−3), and May had the lowest (2 µg m−3).
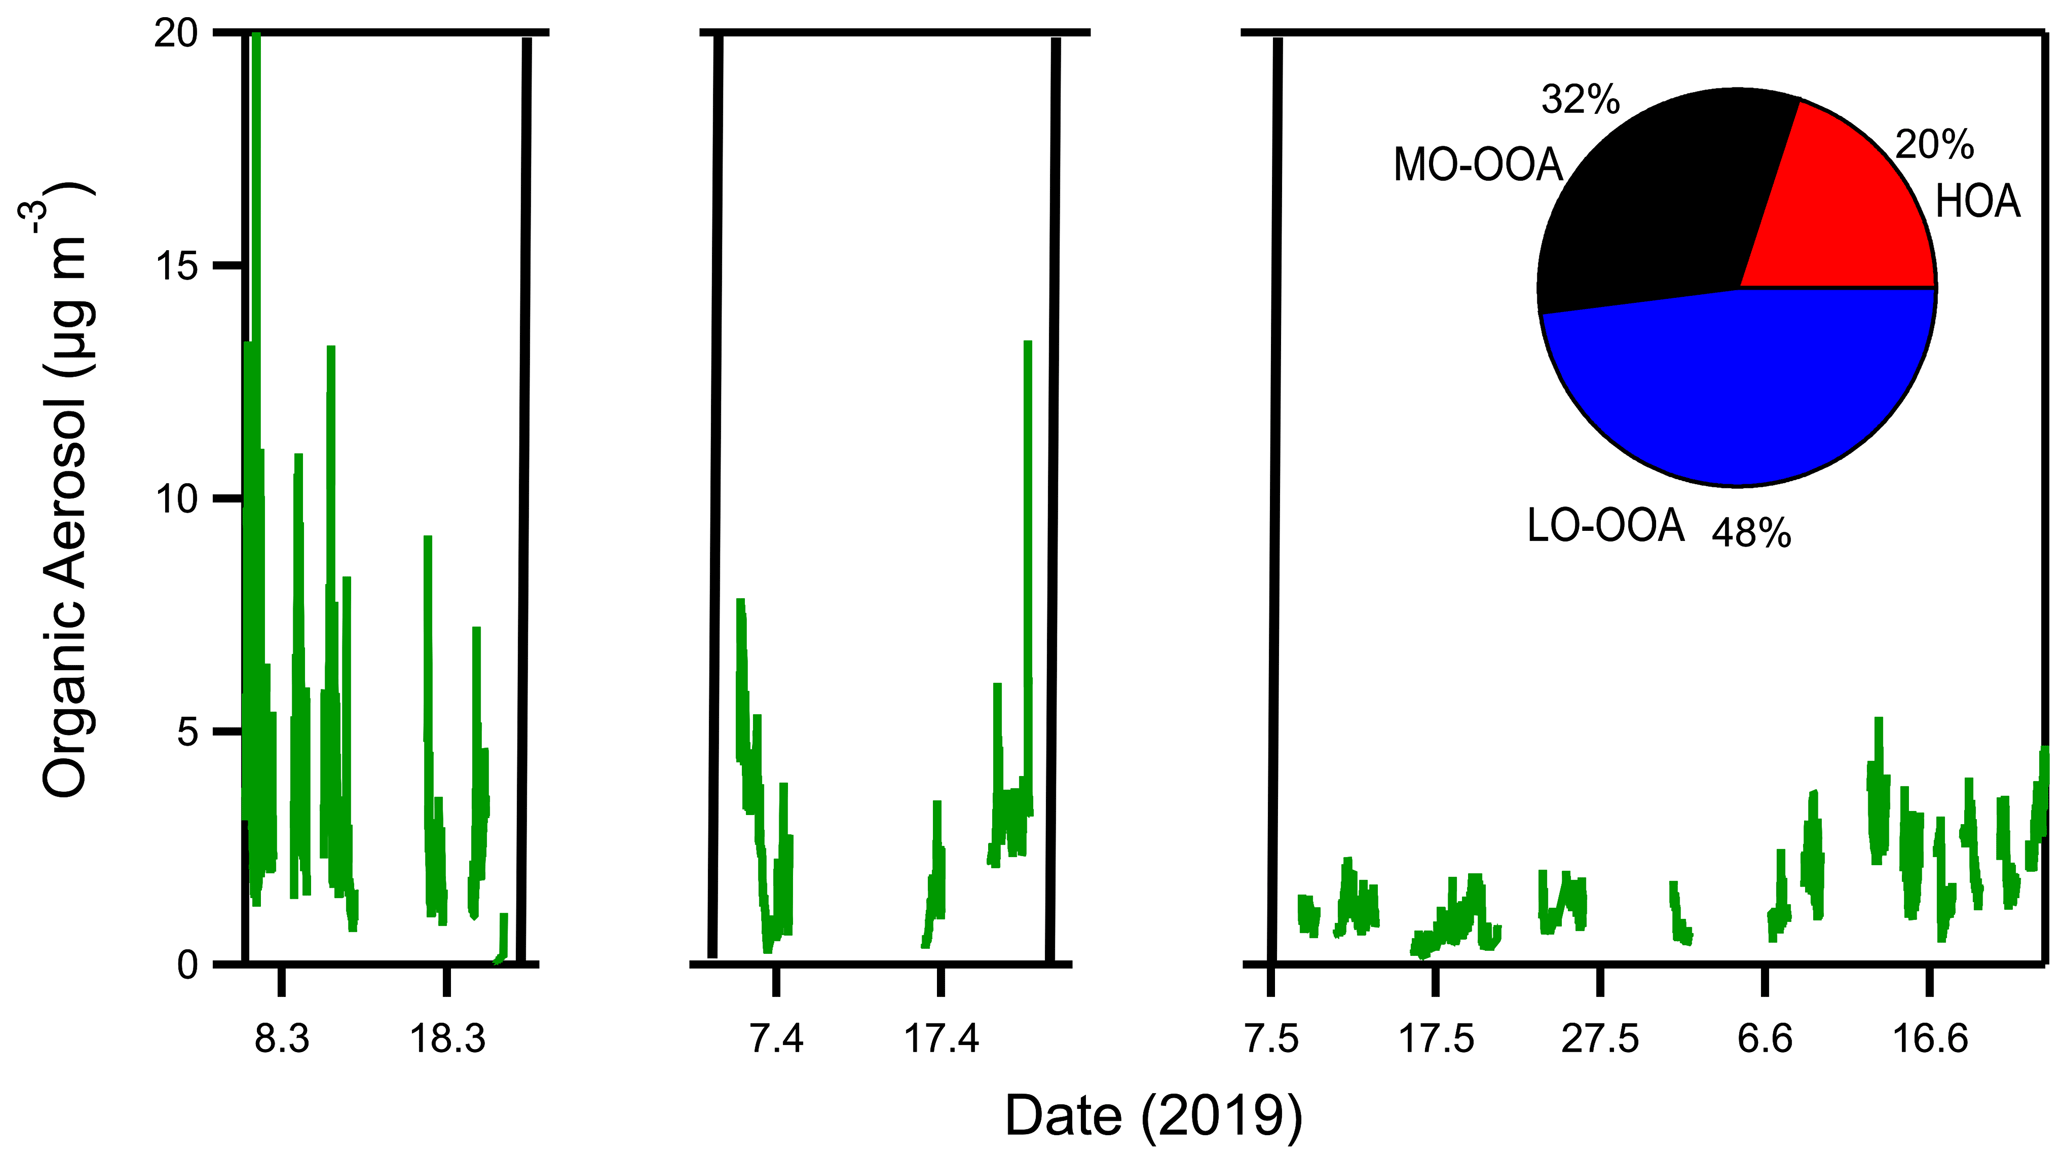
Figure 2Organic aerosol time series and fractional composition of the sources derived from the PMF analysis of the online measurements for the summer 2019 Patras campaign. Measurements were only performed during specific days in this 3-month period.
3.3 Winter campaign in Athens, 2019
Athens is the biggest city of Greece, with a population of 3.2 million inhabitants. The winter campaign was performed at the National Observatory of Athens at Thissio, in the center of the city. The measurements started in January and lasted until March 2019. The OA in this case was measured using an aerosol mass speciation monitor (ACSM) (Aerodyne Inc., USA) with a temporal resolution of 30 min.
The OA was on average 8.2 µg m−3 during the examined period (Fig. 3). The highest average concentration (10.8 µg m−3) was observed in February and the lowest (4.4 µg m−3) in January. High-concentration events were observed during the whole period late at night. The maximum half-hour OA concentration (98 µg m−3) was observed on 19 February at midnight. The OA concentration started to increase from 22:00 LT on 18 February and remained high until 04:00 LT that night.
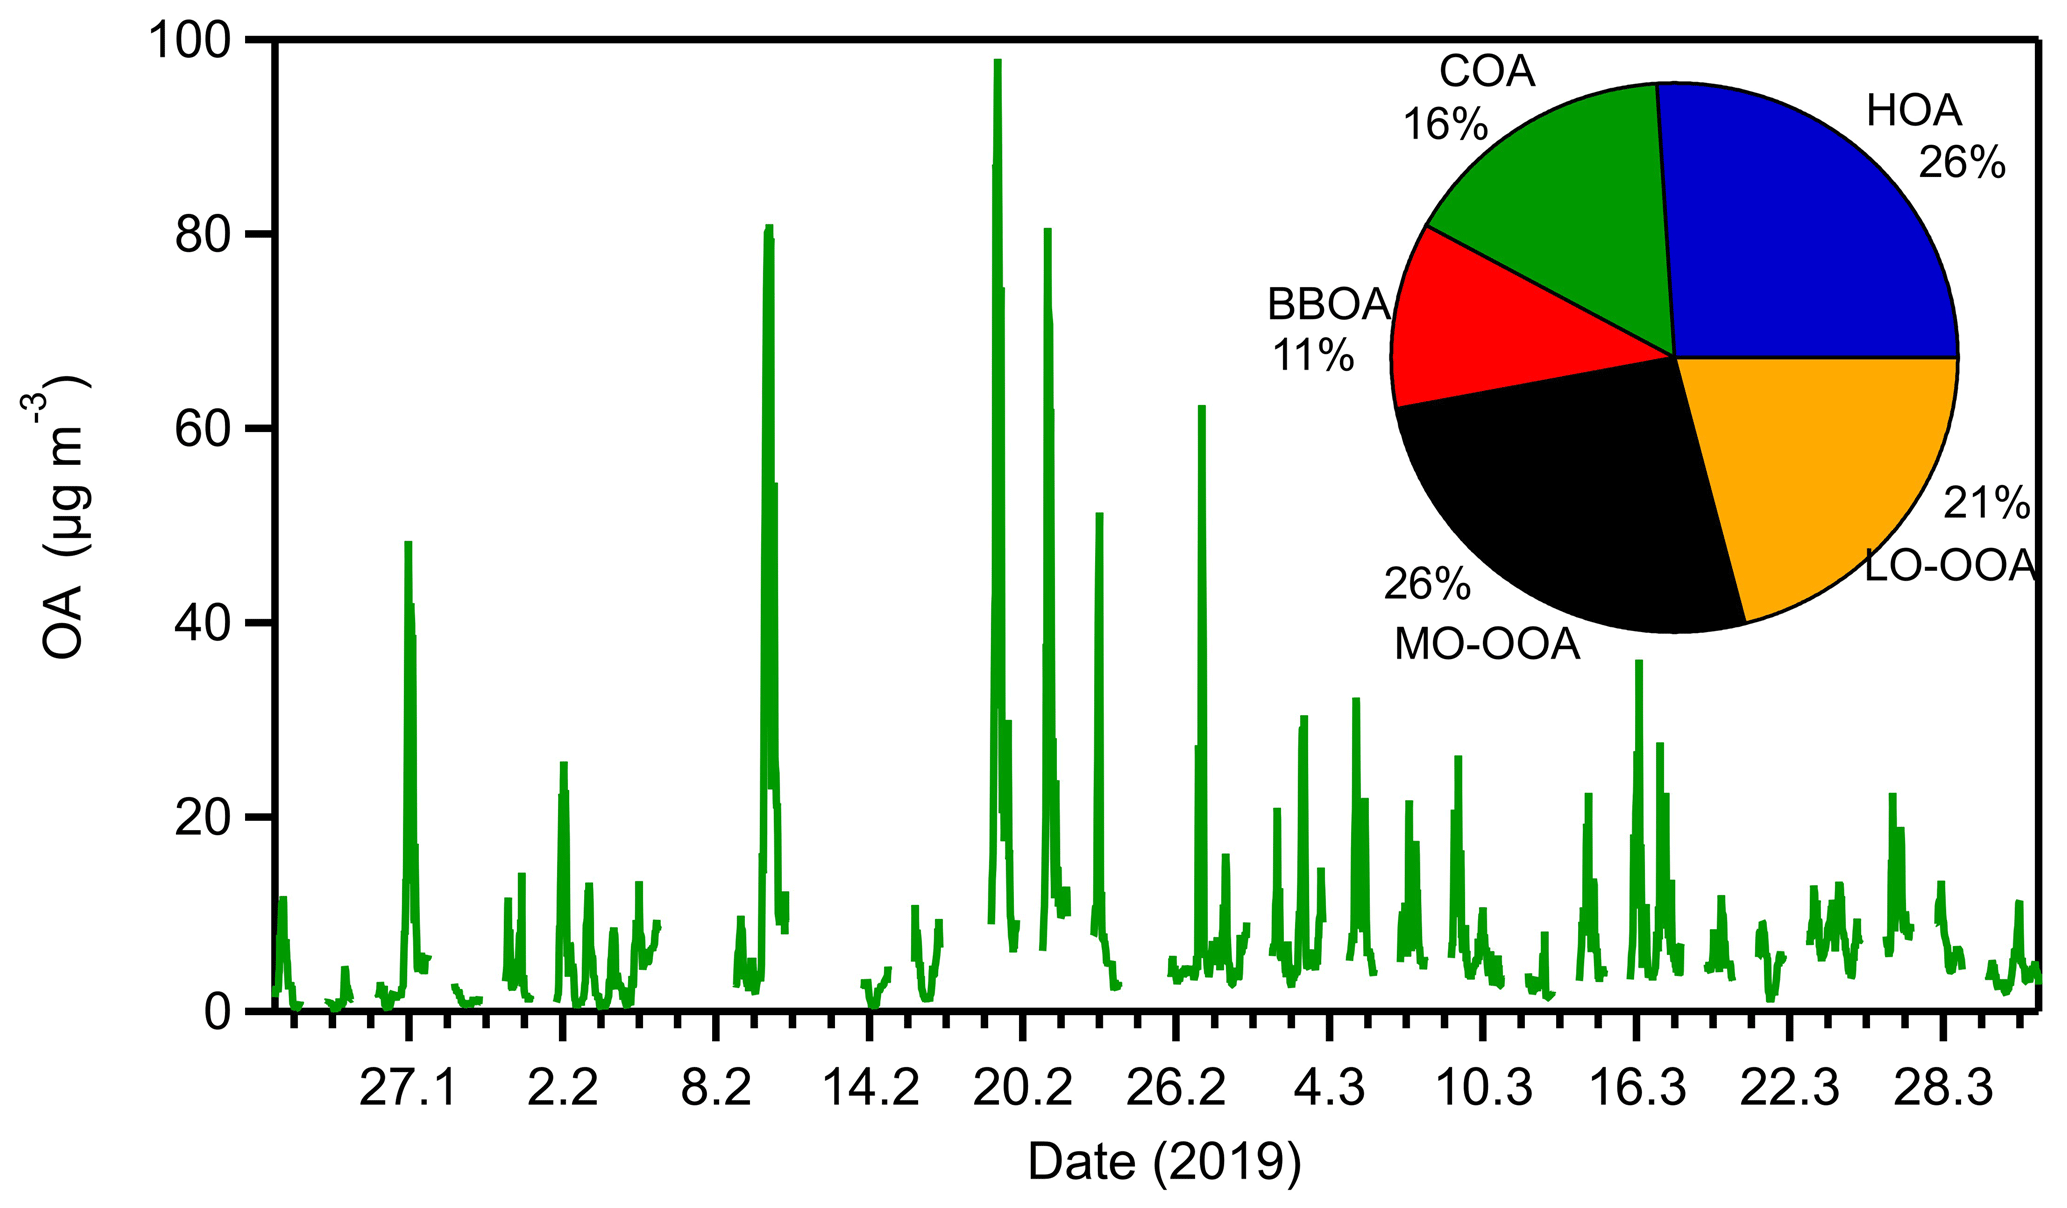
Figure 3Organic aerosol concentration and fractional composition of the sources derived from the PMF analysis for the online measurements for the Athens 2019 winter campaign.
4.1 Source apportionment of the Patras 2020 winter campaign
4.1.1 Online
Solutions with one to six factors were explored, and the five-factor solution was chosen as the one that could explain the OA sources satisfactorily. Biomass burning (BBOA) was the dominant source of the OA (Fig. 1). Two biomass burning factors were identified (responsible for 53 % of the total OA), a cooking OA (COA) factor (12 %), a hydrocarbon-like OA (HOA) (10 %), and an oxidized OA (OOA) factor (25 %) (Fig. 1).
BBOA I and BBOA II had similar time series (R2 = 0.91) but different spectra. BBOA I had strong peaks at values 43, 60, and 73 (Ng et al., 2011). On the other hand, BBOA II was characterized by 's 44 and 60 (Figs. S3–S4 in the Supplement). The two BBOA factors appear in the PMF analysis when four- or five-factor solutions are tested. In the four-factor solution, the COA was not present, and the four factors were BBOA I, BBOA II, OOA, and HOA, Here, we present the five-factor solution which also includes the COA factor. There are a few possible explanations about the two BBOA types. These factors may correspond to fresh and more processed BBOA or to different wood types or combustion conditions. This issue clearly deserves additional investigation. For the purposes of the current work though, the two BBOA factors could even be added to produce one total BBOA factor, since the reasons for the separation of the two by the PMF are not clear. The mass concentration of both BBOA I and BBOA II increased from 17:00 LT and remained at high levels until 01:00 LT (Fig. S5), which is consistent with the hours that fireplaces and wood stoves are used in the area. The highest BBOA concentration of the day was observed around 20:00 LT, when BBOA was almost 40 µg m−3 on average.
The COA concentration peaked at the late evening hours (17:00–23:00 LT) and had a weaker peak around midday (10:00–15:00 LT) (Fig. S5). The highest COA concentration was observed at 21:00 LT, which is the common wintertime dinnertime in Greece and was about 5 µg m−3 on average. The COA spectrum was characterized by peaks at values 41, 43, 55, and 57, consistent with the results of Kaltsonoudis et al. (2017). The 55 signal was almost twice that at 57, a feature related to charbroiling in previous studies (Lanz et al., 2007; Allan et al., 2010).
The HOA concentration increased at 09:00 LT, which is the local morning rush hour, and during the evening at 18:00 LT. The HOA spectrum was characterized by the values 41, 43, 55, 57, 67, 69, and 81, which are hydrocarbon fragments of typical traffic-related emissions (Aiken et al., 2009).
The OOA was characterized by a strong signal at 44 (mostly due to CO) and another one at 28, which is also reported in previous studies (Florou et al., 2017). The average diurnal pattern of OOA showed less variation compared to the primary factors. A slight increase of OOA was present during 10:00–14:00 LT, possibly due to the higher photochemical activity during that period.
4.1.2 Offline
During the 2020 winter campaign in Patras, 31 ambient aerosol samples were collected on quartz filters using a medium-volume sampler (Tisch Scientific, 220 L min−1 flow rate). The sampling started at 18:00 LT each day and lasted 24 h. The experimental procedure described in Sect. 2.1 was used for the offline AMS analysis, and the offline PMF was conducted according to the procedure described in Sect. 2.3.
The results of the PMF analysis for the offline AMS method showed similar fractional contributions with the online (differences below 15 %) (Fig. 4). The offline BBOA was responsible for 48 % of the total OA (Fig. 4). The second-highest contributor to the total OA was COA (19 %), and then HOA and OOA were responsible for 16 % and 17 % of the total OA respectively. These results are quite encouraging, showing that our new offline approach can reproduce the online results without the significant corrections (e.g., a factor of 10 for the HOA) needed in the original method.
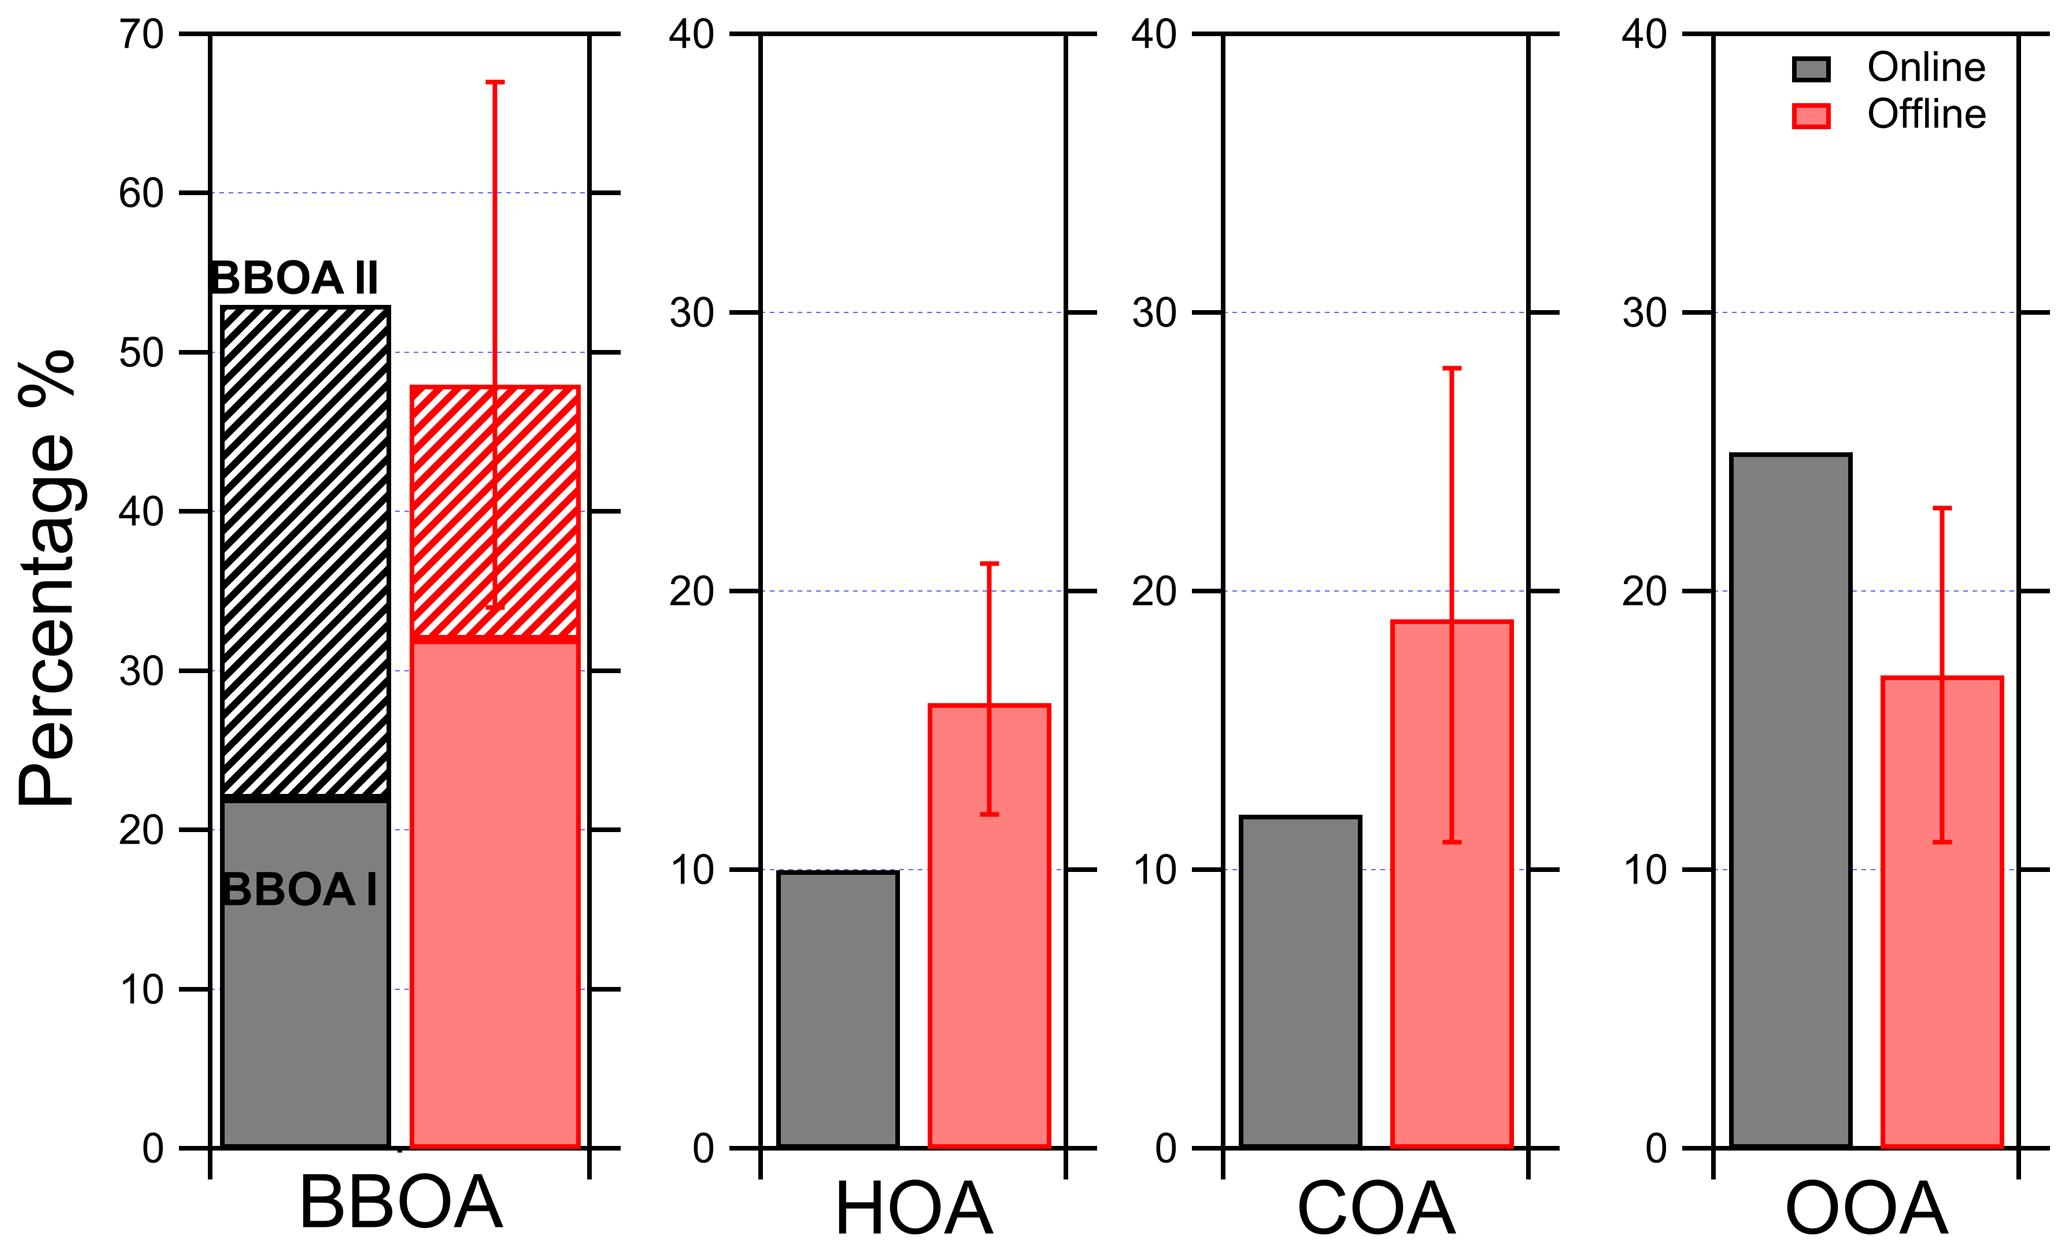
Figure 4Contribution of each factor to the total OA for the online and the offline PMF results in Patras during the winter of 2020. The contribution of each one of the two BBOA factors to the total OA is also shown. A different scale is used for the BBOA.
The main difference of the above offline analysis results to those of online analysis is the different split of the two BBOA factors. The online PMF analysis indicated that BBOA I was 22 % and BBOA II 31 % of the total OA, while the offline PMF analysis resulted in 32 % for BBOA I and 16 % for BBOA II (Fig. 4). However, the difference between the online and the offline contribution to the total BBOA is below 5 %, which shows that the offline analysis can still provide an estimate of the importance of BBOA on the total OA that is consistent with the online results. This different split in the BBOA factors is probably of secondary importance given our limited understanding of the differences of BBOA I and BBOA II. For the purposes of the current work, a difference of 15 % is not that important, and the sum of the BBOA factors could be viewed as the total BBOA.
The uncertainty of the offline PMF results was estimated using bootstrap analysis. The results showed that BBOA I varied the most among the five factors. The estimated average contribution of BBOA I to the total OA was 32 % and ranged between 18 % (2.7 µg m−3 based on the online OA concentration) and 47 % (7 µg m−3). All the other factor contributions to the total OA varied less than 20 %. The BBOA II contribution to the total OA was 16 % and varied between 11 % (1.7 µg m−3) and 21 % (3 µg m−3). The total BBOA estimated contribution to the total OA was 48 % and ranged from 29 % (4.4 µg m−3) to 67 % (10 µg m−3). COA was on average 19 % of the total OA and ranged between 11 % (1.7 µg m−3) and 28 % (4.2 µg m−3). The HOA contribution to the total OA was 16 %, ranging from 12 % (1.8 µg m−3) to 21 % (3.1 µg m−3), and OOA was on average 17 %, ranging from 11 % (1.7 µg m−3) to 23 % (3.5 µg m−3) (Fig. S6).
Offline measurements of organic carbon (OC; e.g., by thermal optical analysis) in the same filter samples can be used to convert the fractions calculated above to absolute factor mass concentration in future studies. This standard analysis can be easily performed in parts of the collected filter samples. For example, the OC EC (elemental carbon) analysis using a Sunset OC EC analyzer requires just a small punch per filter (usually 1 × 1 cm2 or 1 × 1.5 cm2), so sample availability is not an issue. The organic aerosol (OA) concentration can then be calculated by multiplying the measured OC with the OA OC that is determined from the high-resolution AMS measurements. The product of the factor fractions determined by our proposed method with the OA concentration will then give the mass concentrations of each factor.
Even though the average contribution of each factor to the total OA showed good agreement between the online and the offline PMF results, higher discrepancies were observed on a daily basis (Fig. S7). For example, the offline COA showed two different behaviors during the period, one of overestimation and one of underestimation compared to the online COA. This is evidence that the offline AMS technique proposed in this work can give relatively accurate (within 15 %) contributions of each factor for extended periods, but on a daily basis the uncertainty can be really high. This is due to a large extent to the temporal resolution of the offline measurements (Vasilakopoulou et al., 2022). The reduced temporal resolution can result in significant source apportionment differences for individual days. In Vasilakopoulou et al. (2022), discrepancies of a factor of 2 were observed for several factors on a daily basis. However, the source apportionment results were relatively accurate for a month-long period. We reach the same conclusion for the offline measurements in this study. Another potential reason for these discrepancies is experimental issues such as the extraction efficiency of the filter samples and volatilization of semi-volatile organic compounds from the filter, etc.
Even though the factor contributions of the offline and the online PMF results differed by less than 15 %, the factor profiles were significantly different. The offline PMF spectra were compared with those online, using the theta angle approach (Kostenidou et al., 2009). Theta is the angle that the two factors have if they are treated as vectors. The highest difference was observed for HOA (θ = 40∘) (Fig. S8), showing that the offline HOA spectrum is quite different from the online. This is not surprising given the limited water solubility of the HOA components. However, the HOA tracers ( values 41, 43, 55, 57 and 69) were present in the offline HOA spectrum, making its identification possible. These differences are probably due to the partial inclusion of the HOA components in the aerosol that is measured by the AMS. Therefore, the extraction process appears to modify the AMS spectrum, but still the PMF reaches a reasonably accurate estimate, at least in this case, with the “processed” AMS spectrum. Also, high theta angles were observed for the other primary factors (θ > 25∘). The offline COA spectrum differed by 34∘ from the online one, the offline BBOA I by 27∘, and the offline BBOA II by 36∘ from the online BBOA II. The OOA had the most similar spectrum profile between the offline and the online results (θ = 17∘). A possible explanation about this similarity is that secondary OA is much more soluble in water than COA and HOA.
These differences in the spectra profiles are a consequence of two facts. First, the lower temporal resolution that the offline results have (24 h) compared to the online (3 min) results can affect the profiles of each factor leading to high theta angles that can reach up to 30∘ (Vasilakopoulou et al., 2022). The reduction of the information provided to the PMF moving from high temporal resolution (usually thousands of measurements) to daily resolution (hundreds or even less) measurements affects the results. Also, when daily averages are used, the diurnal variation of each factor is lost. Second, the extraction efficiency of the different OA components can also result in increased angles.
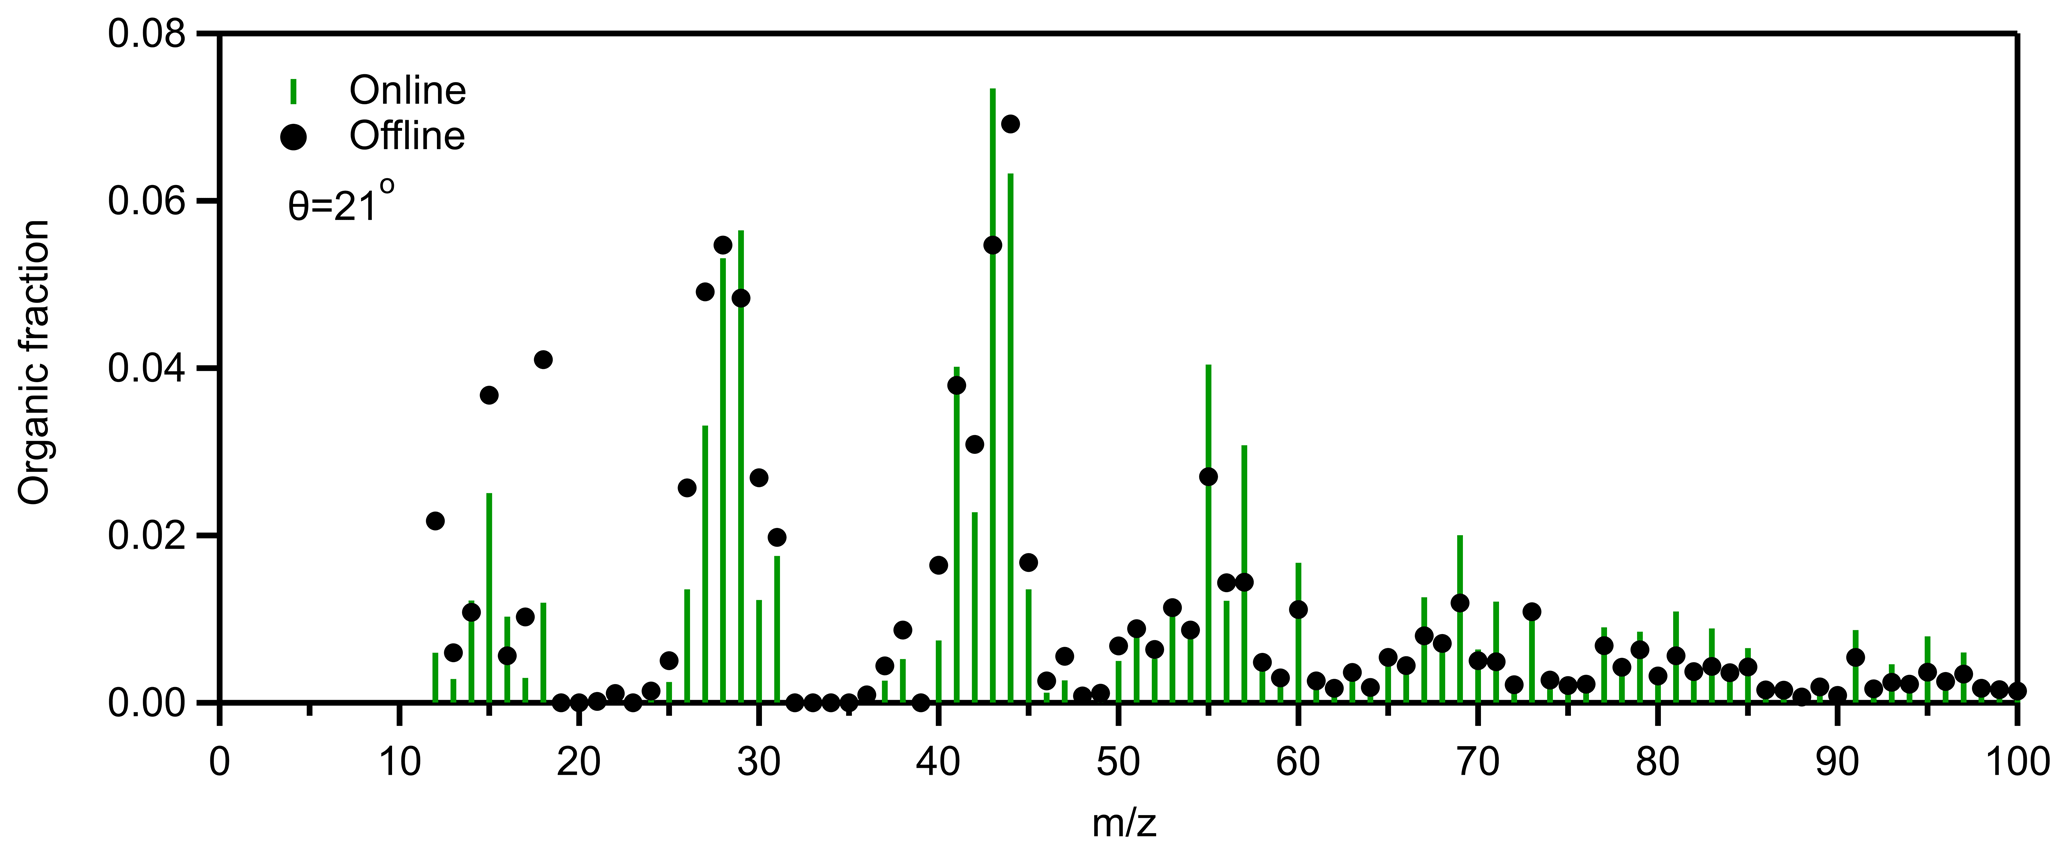
Figure 5Comparison of the average online and offline organic mass spectrum for the Patras 2020 winter campaign.
In order to understand the differences between the offline and the online PMF analyses better, we compared the total organic mass spectra from the two techniques. The offline organic mass spectra were blank-corrected. The theta angle between the average offline and the average online organic mass spectrum was 21∘ (Fig. 5). Significant differences were observed at values below 20, since the theta angle drops to 17∘ if these values are not accounted for. These values should be checked carefully because they may affect the results. Water appears to contribute to these differences in the low values. For example, the 18 is higher in all offline spectra compared to the online. The exclusion of these values from the PMF factors reduced the theta angle by 3∘.
Comparing the signals at four major HOA fragments ( 55, 57, 67, 69) we estimated that on average the offline technique captured 64 % of the CxH and 82 % of the CxHyO+ (Fig. 6). The average offline-to-online ratio for these HOA markers was 0.73 (Fig. S9). The CxHyO+ fragments contain oxygen, so they should be coming from relatively water-soluble compounds. The difference in the two approaches is 18 %, suggesting that indeed the offline AMS approach captures these compounds to a very large extent. The CxH fragments are characteristic of hydrocarbon-like OA (HOA) that has low water solubility in general. The fact that 64 % of the material is present in the offline organic mass spectra provides strong evidence that our approach extracts and includes the majority of these mostly water-insoluble compounds in the corresponding AMS analysis. If these compounds remained on the filter, there would be no signal at the corresponding values for CxH.
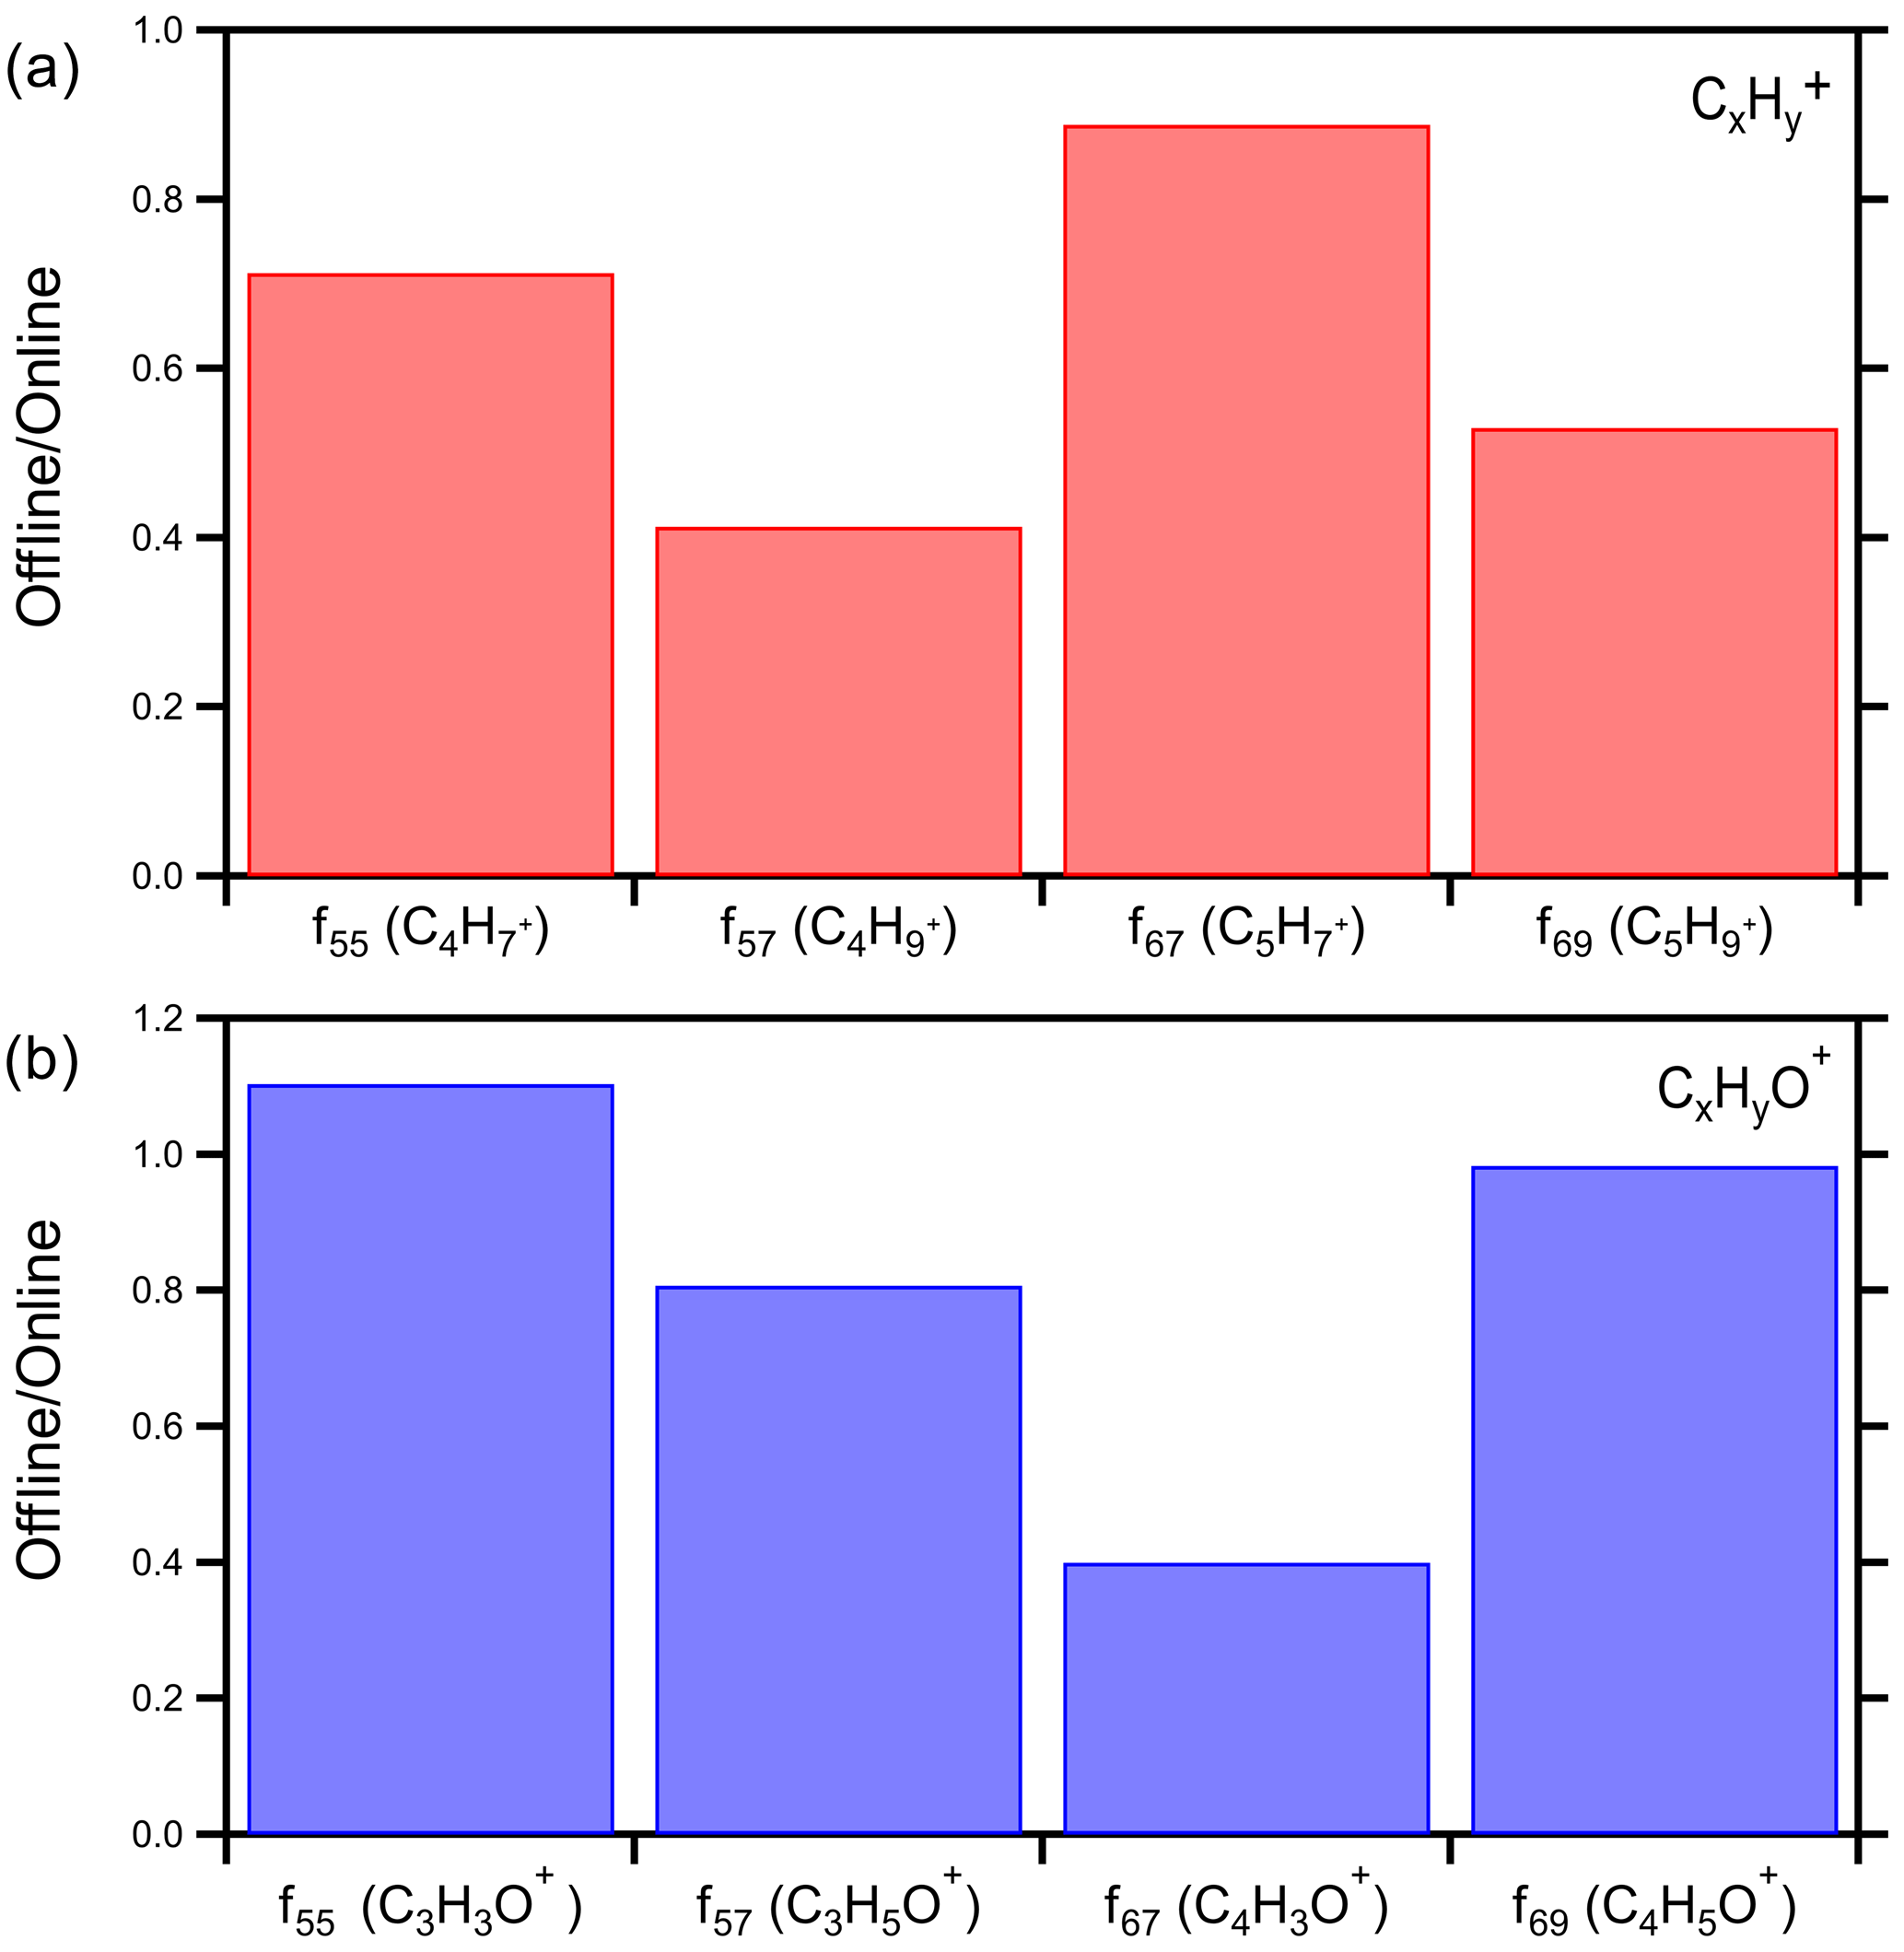
Figure 6Offline-to-online ratio of various HOA markers for the winter 2020 Patras campaign: (a) CxH and (b) CxHyO+.
A day-by-day analysis has also been performed between the online (24 h averages) and the offline samples. The organic mass spectra comparison between the offline and the online results showed that the best agreement was observed on 20 January, and their angle was 16∘. The worst agreement was observed on 30 January, and the theta angle was 26∘ (Fig. S10).
The atomic oxygen-to-carbon ratio (O : C) of the offline spectra was on average 0.47, and that of the online spectra was 0.50, showing good agreement between the two for the whole period (Fig. S11). The fractional error of the offline compared to the online O : C was 12 %.
The organics-to-sulfate ratio (OA sulf) was also compared between the online and the offline results. Organics, in general, have a wide range of water solubility. They can be either soluble, insoluble, or partially soluble in water. Sulfate on the other hand is completely soluble in water for the conditions of the extraction. So, comparing the two can give us an estimate of the fraction of the organics that was analyzed with the offline AMS technique. The offline (OA sulf) ratio followed the same trend over time of the online ratio (Fig. 7). The two ratios agreed within 30 %. The offline results showed a surprisingly small overestimation of the OA sulf ratio compared to the online results, with a bias of 1.05 and a fractional bias of 0.18. The average offline OA sulf ratio was 8.0, while the online ratio was 7.0.
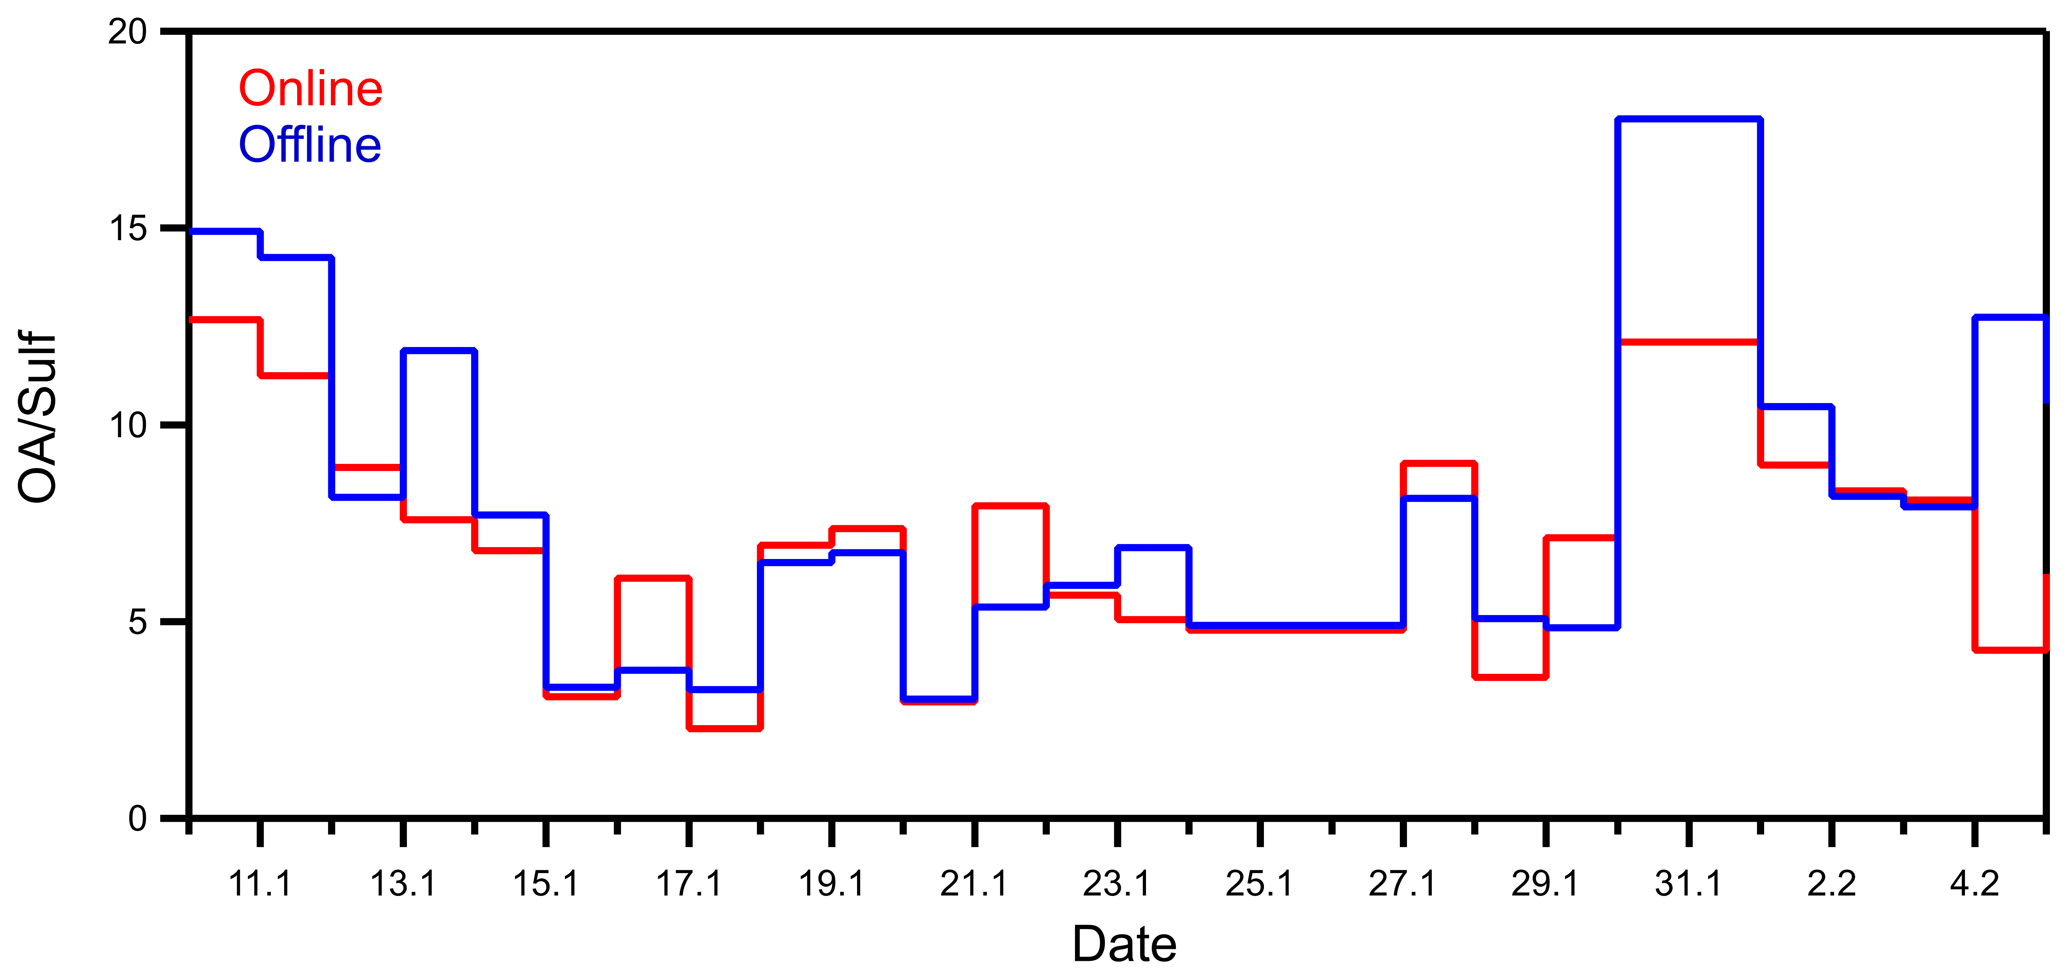
Figure 7Organics-to-sulfate ratio comparison between the offline and the online results for the Patras winter 2020 campaign.
4.2 Source apportionment of the Patras 2019 summer campaign
4.2.1 Online
Solutions with one up to four factors were examined, and the three-factor solution was chosen as the one which explains the ambient OA spectral variation better. One primary (HOA) and two secondary (MO-OOA, LO-OOA) factors were identified (Fig. S13). The OA was highly oxidized during the examined period, as the secondary factors accounted for 80 % of the total OA (LO-OOA 48 % and MO-OOA 32 %). The estimated average HOA contribution to the total OA was 20 % (Fig. 2).
The HOA spectrum was characterized by 's 41, 43, 55, 57, 67, 69, and 81 (Fig. S14). Its diurnal profile had one peak at 10:00 LT and one during the evening at 22:00 LT (Fig. S15). The HOA O : C was 0.22, which is on the high end of the ranges reported in the literature. Since HOA and COA have relatively similar AMS spectra, distinguishing between the two is not always possible. The HOA of this study agrees well with the HOA-2 reported in Kostenidou et al. (2015), which also included meat cooking emissions.
MO-OOA was the most oxidized of the two secondary factors. Its diurnal profile had small variation, showing that it was not affected by local sources. On the other hand, the LO-OOA diurnal profile was more variable and was characterized by a first peak at 10:00 LT and a second one during the evening (22:00 LT). Both the MO-OOA and LO-OOA mass spectra were characterized by a strong peak at 44. However, the LO-OOA spectrum also had peaks at values, 39, 41 and 55. These peaks were weak in the MO-OOA spectrum. Also, the MO-OOA O : C was a little higher (1.0) than the O : C of the LO-OOA (0.94). Their angle was 9∘.
4.2.2 Offline
We focus here on the analysis of the 31 daily samples collected during the early summer period (March to June 2020) in Patras. A low-volume sampler (6.7 L min−1) was used for the sample collection on quartz filters, and the sampling period was 24 h. Because of the low mass loading of the filter, half of the initial filter (47 mm) was used in this offline AMS analysis.
The offline PMF analysis resulted in a three-factor solution with one primary (HOA) and two secondary (MO-OOA and LO-OOA) factors. The offline results showed that the OA was highly oxidized, which is in agreement with the online results. OOA was responsible for 68 % of the total OA, while HOA represented 32 % of the total OA, which is 12 % more than in the online solution. The contribution of each factor to the total OA differed by less than 17 % with the online estimation (Fig. 8). The offline HOA contribution to the total OA was 32 %, and the bootstrap analysis showed that it ranged from 23 % to 42 % (5th and 95th percentiles). The MO-OOA was 37 %, ranging from 24 % to 57 %, and the LO-OOA was 31 % (ranging from 26 % to 35 %) (Fig. S16). These uncertainties suggest that the estimates of the two approaches were practically in agreement with each other considering their uncertainty.
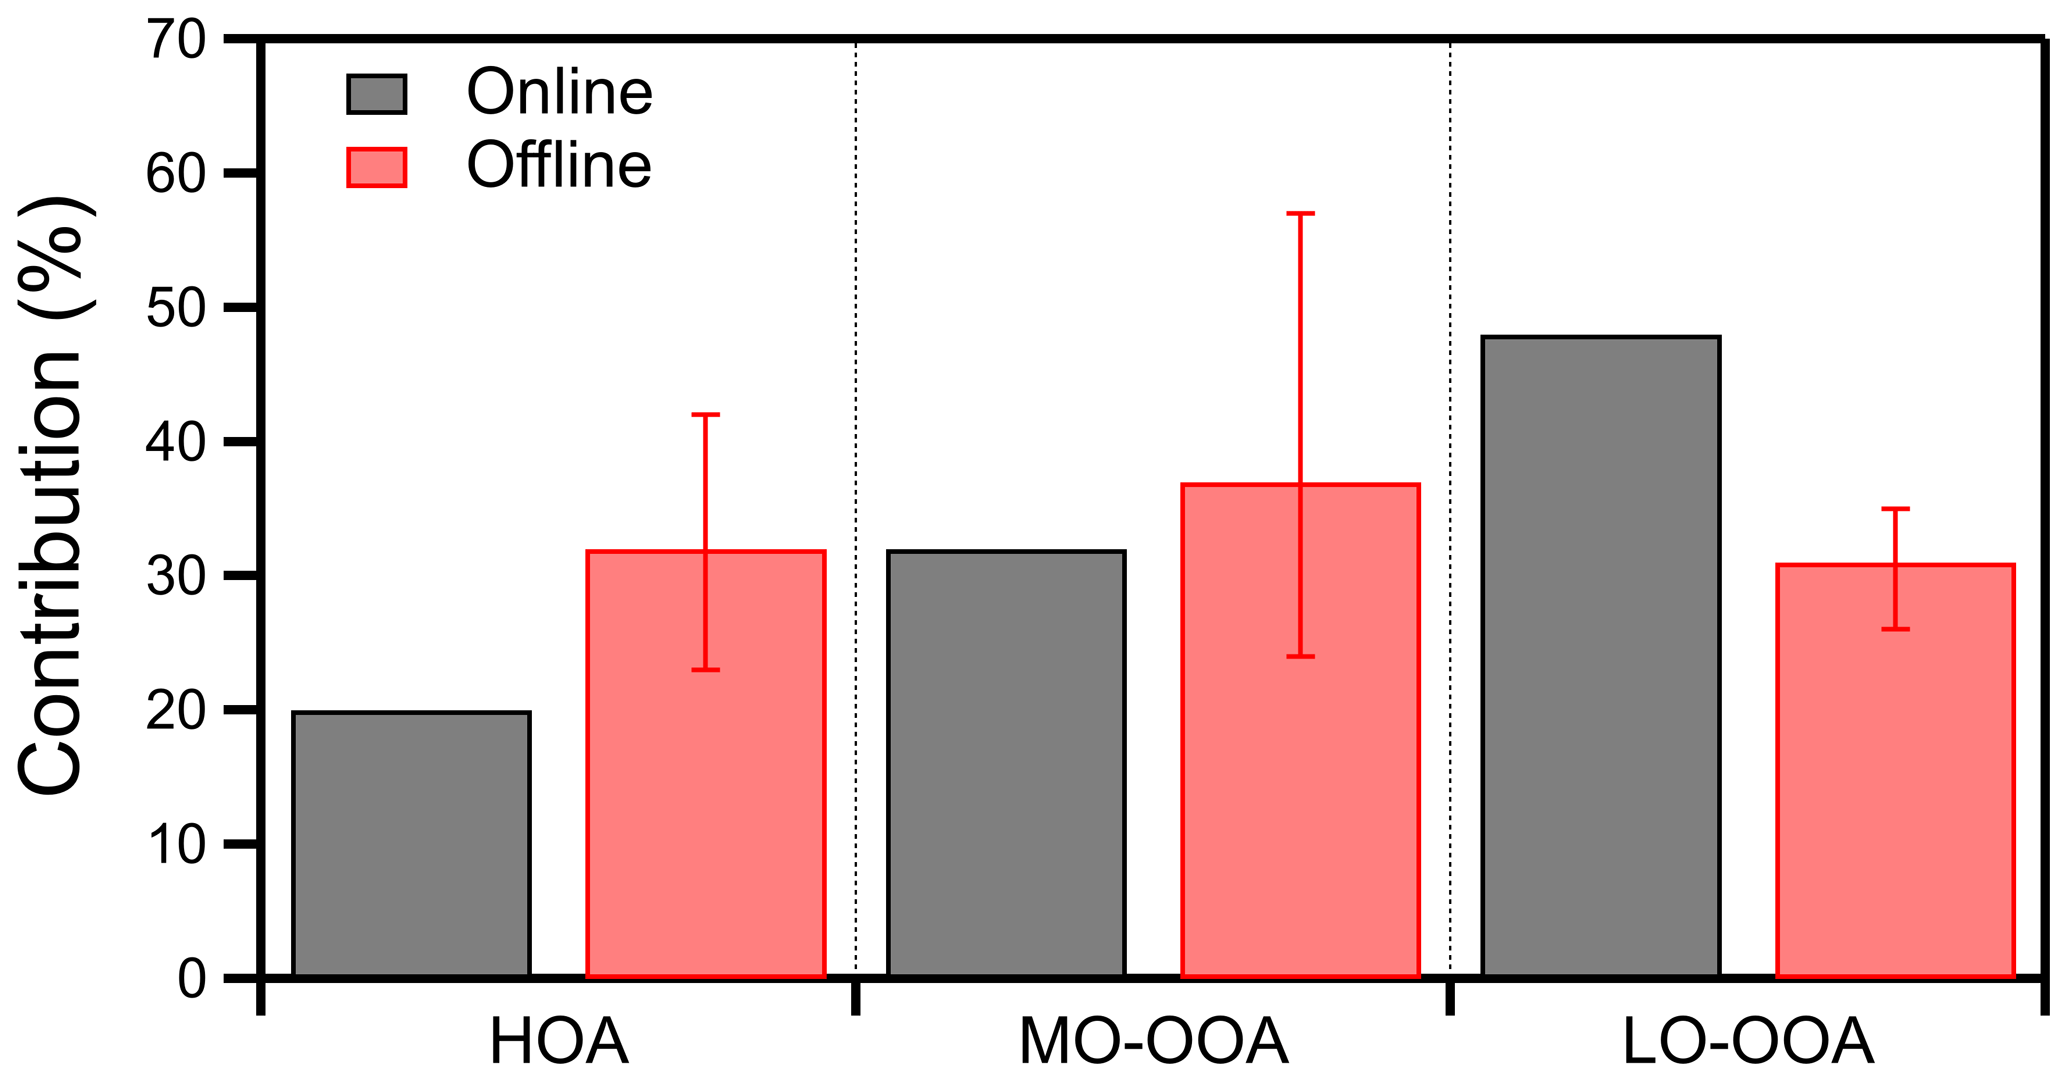
Figure 8Comparison of the contribution of each factor to the total OA between the online and the offline PMF results for the summer 2019 Patras campaign.
The offline PMF spectra were characterized by the specific markers of each factor. The offline HOA spectrum was characterized by peaks related to aliphatic hydrocarbons i.e., 41, 43, 55, 57, 67, and 69 (Fig. S17). The MO-OOA spectrum was characterized by the 44 peak and the LO-OOA by the peaks at 43 and 44. The different ratio among the two secondary factors was used for their identification. The offline spectrum of each factor was different compared with the online spectrum. The offline HOA spectrum differed by 34∘ from the online HOA (Fig. S18). A high theta angle was also observed for the LO-OOA, as the offline LO-OOA differed by 34∘ from the online LO-OOA. The MO-OOA spectra were more similar, as the offline one differed by 12∘ from the online MO-OOA spectrum. The O : C of the MO-OOA was 1.2, and that of the LO-OOA was 0.81 in this case, and their angle was 35∘. These changes in the spectra of the factors appear to be characteristic of the low-temporal-resolution offline analysis. The differences of the LO-OOA and MO-OOA spectra vary widely in different campaigns because they appear to roughly represent the upper and lower limits of secondary organic aerosol (SOA) oxidation encountered in the specific campaign.
The average total offline-to-online spectra comparisons in the summer period showed better agreement compared with the winter campaign. We believe that this behavior is partially due to the mixing state of the particles (e.g., the co-existence of water-soluble secondary PM components with the water-insoluble primary combustion material). The different mixing state in each period is an important factor affecting the offline measurements. For example, during the summer the primary particles from transportation are rapidly covered with sulfates and secondary organic aerosol. This process is slower during the winter, so there are particles that do not include much water-soluble material. Our hypothesis is that this water-soluble material when present facilitates the transfer of the water-insoluble particle core from the filter to the water extract. The total OA spectra for the offline and the online results had an average theta angle of 12∘ (Fig. S19). The best agreement was observed on 8 May, when the two spectra differed by 7∘. The worst was observed on 18 May, and the angle between the offline and the online OA spectra was 16∘.
The offline technique captured a big part of the HOA online signal as indicated by the comparison of five HOA markers (Fig. 9). For these HOA markers, the average CxHyO+ offline-to-online ratio was 0.77, and the average CxH offline-to-online ratio was 1.1 (Fig. 9). This good agreement between the offline and the online HOA markers could be responsible for the lower theta angle between the offline and the online HOA spectrum in the PMF analysis, compared to the winter campaign.
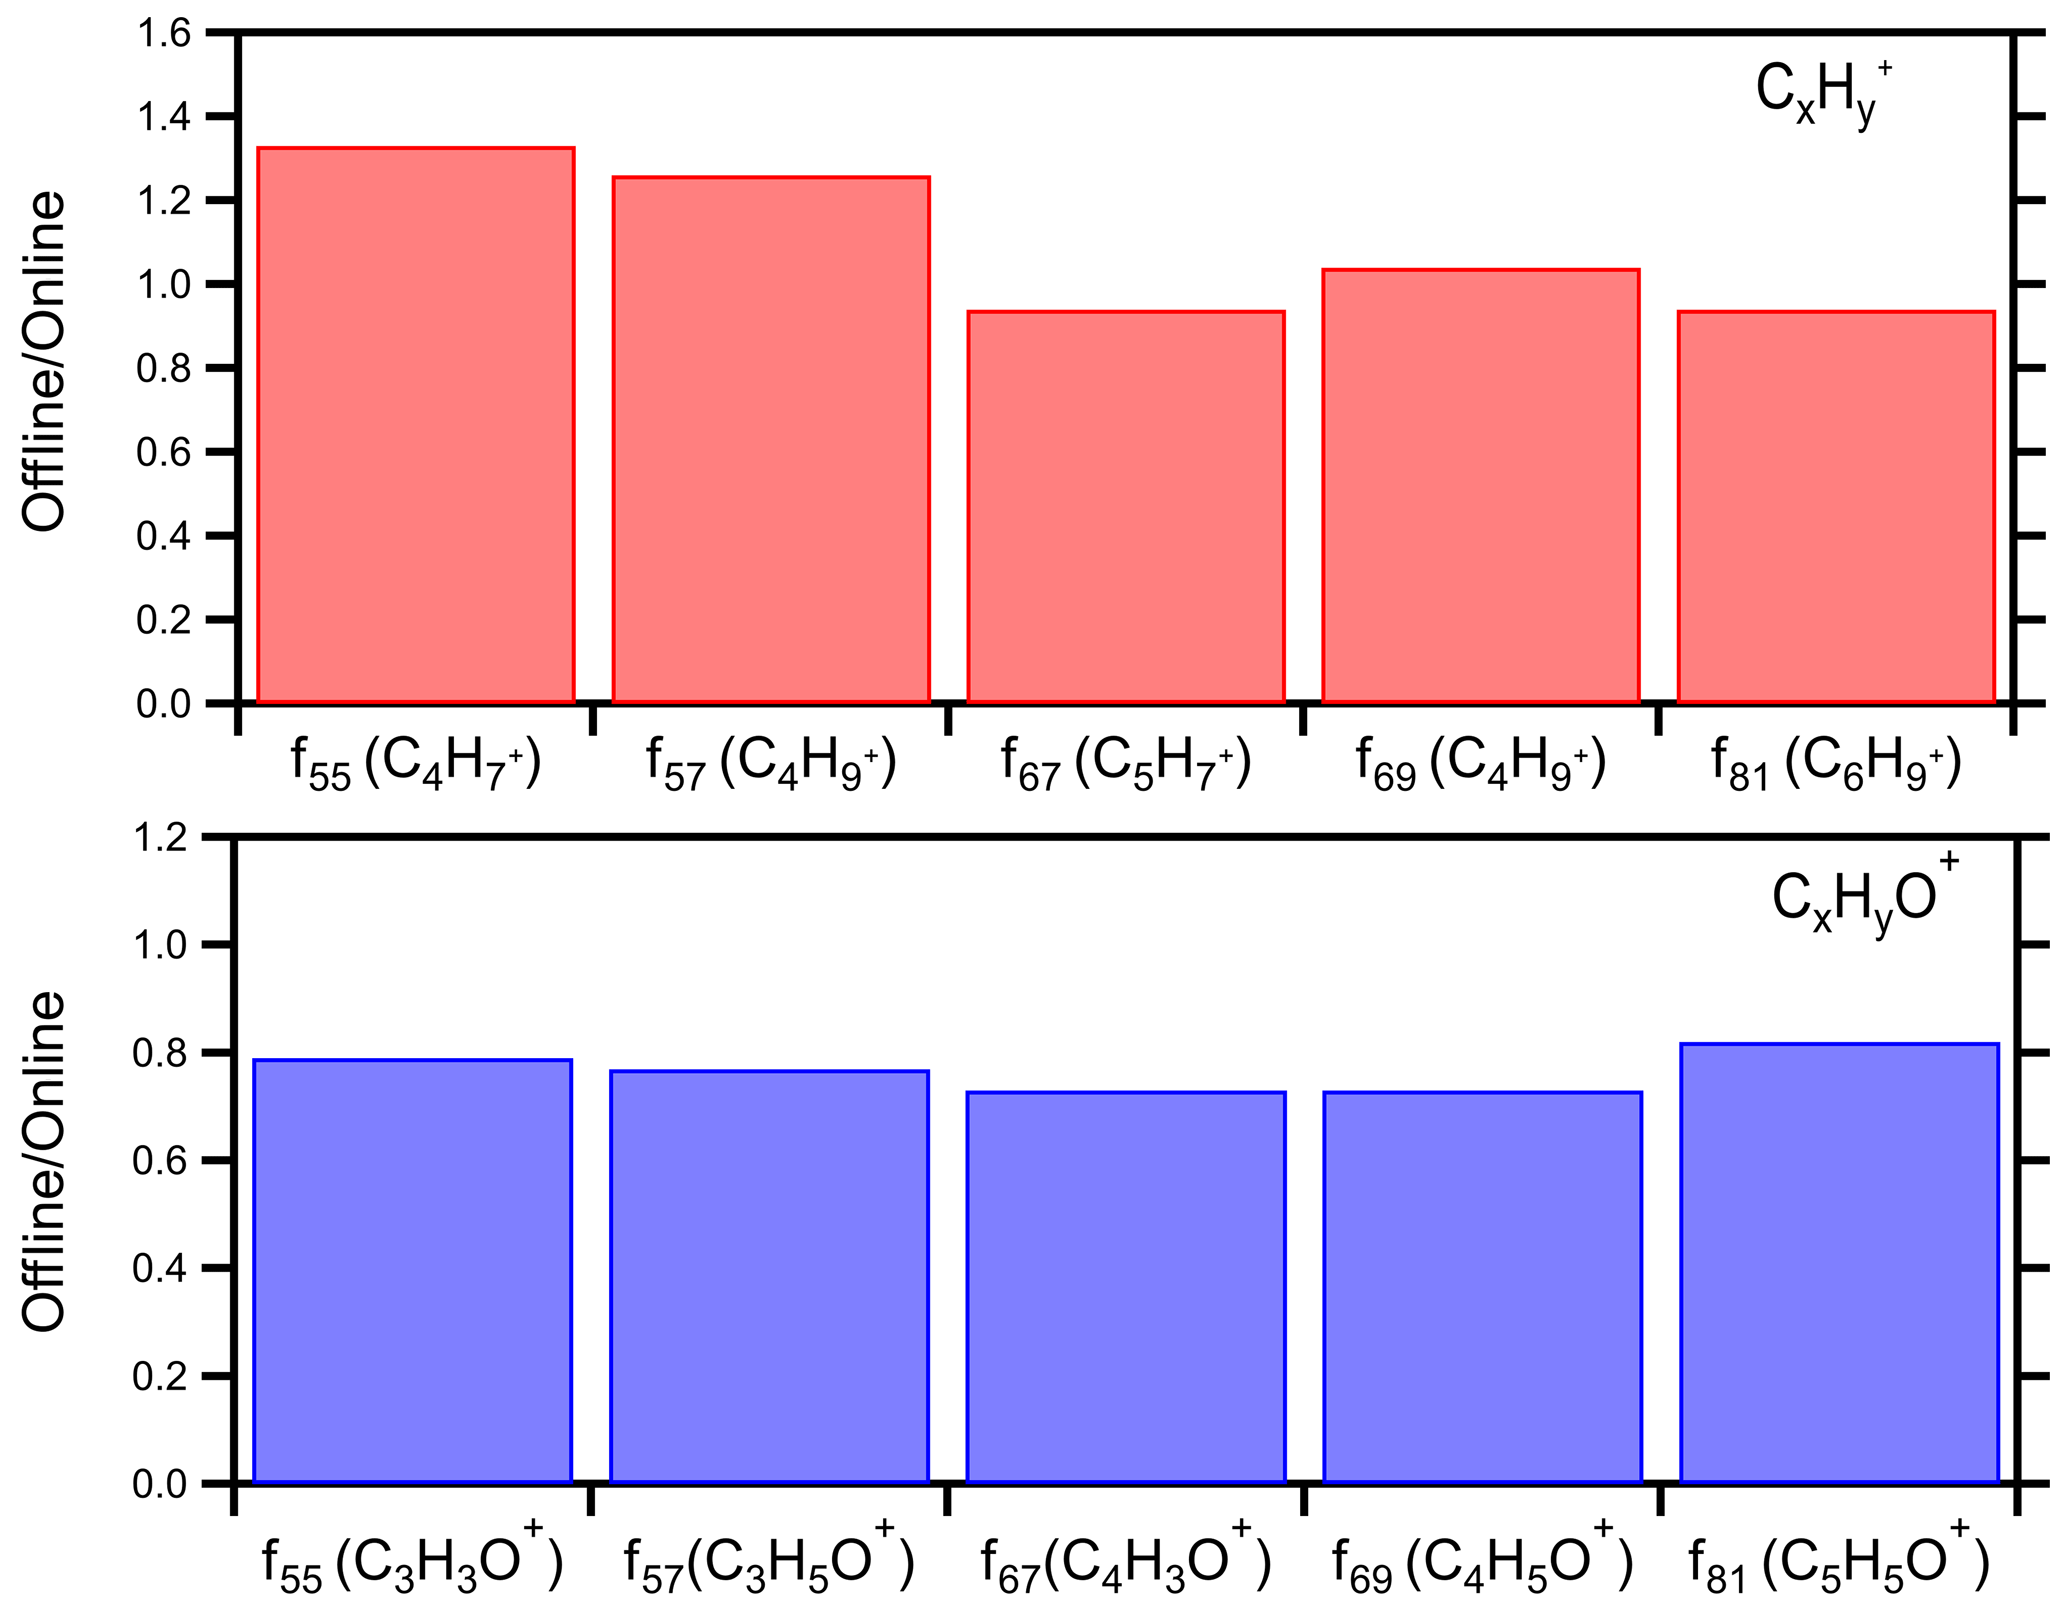
Figure 9Offline-to-online fraction of various CxH and CxHyO+ HOA markers for the summer 2019 Patras campaign.
4.3 Source apportionment of the Athens 2019 winter campaign
4.3.1 Online
Five factors were identified, three primary (HOA, COA, BBOA) and two secondary (MO-OOA, LO-OOA). The primary factors represented on average 53 % of the total OA and the secondary 47 %. The contribution of the secondary factors to the total OA was relatively high for a winter period in the center of a big city. The bootstrap analysis suggested low uncertainty for the contribution of each factor to the total OA (below 15 %) (Fig. S21).
The BBOA (11 % of the total OA) had high concentrations during January and February and decreased in March (Figs. S22–S23), a behavior that is consistent with the temperatures in Greece during the winter period. The highest hourly BBOA mass concentration (26 µg m−3) was observed on 19 February at midnight, which was also the night with the highest OA mass concentration. The same night the HOA mass concentration was the highest of the 3-month period (49 µg m−3). On average, the HOA mass concentration was 2.1 µg m−3, and it represented 26 % of the total OA. On the other hand, COA (16 % of the total OA) remained at the same levels during the 3-month period examined. The LO-OOA (21 % of the total OA) and the MO-OOA (26 % of the total OA) were less variant during the 3-month period compared to the primary factors.
4.3.2 Offline
In this campaign, 33 daily samples were collected in Thissio, at the National Observatory of Athens. A high-volume sampler (DH-77, Digitel) was used for the sample collection. One of the additional objectives of this test was to study the difference that may occur between HR-AMS offline measurements and unit mass resolution ACSM online results.
The average offline mass spectrum was similar to that online (θ = 16∘) (Fig. S24) for the examined days. The offline PMF solution resulted in five factors, just like the online solution. Three primary (HOA, COA, and BBOA) and two secondary (MO-OOA, LO-OOA) factors were identified. Each factor was identified using the specific tracer 's that have been already discussed in the previous sections. The offline spectrum of each factor was different compared to the one in the online PMF solution (Fig. S25). The difference in the estimated spectra is partially due to the different sampling temporal resolution (30 min in the online, daily in the offline) (Vasilakopoulou et al., 2022) and could also be partially due to the different instrumentation used for the online and the offline analysis. In the offline PMF results of this study, the two secondary factors start to mix at low-temporal-resolution PMF results, as the O : C of the offline MO-OOA is lower compared to the online ratio, while the O : C of the LO-OOA is higher. This is also characteristic of the reduced-temporal-resolution analysis (Vasilakopoulou et al., 2022). In order to estimate the O : C from the online ACSM measurements, we used the approach of Canagaratna et al. (2015) for the unit-mass resolution data. The O : C estimates are quite uncertain in this case. The O : C of the LO-OOA was 0.7, and the O : C of the MO-OOA was 0.87 in the offline analysis. By definition, LO-OOA always has a lower O : C compared to that of MO-OOA. The LO-OOA and MO-OOA separation is performed by the PMF, and they can always be summed to obtain the total OOA. We present and discuss both of them in the present study to facilitate comparisons with the result of the online analyses in the literature.
The difference between the online and the offline contributions to the total OA was below 15 % (Fig. 10), which is evidence of consistency between the offline HR-AMS analysis with the online ACSM results. The highest difference was observed for BBOA, which was 13 % higher (24 % vs. 11 %) than the online BBOA, and the lowest was observed for COA, which was 1 % lower than the online COA (15 % vs. 16 %). The offline HOA was 8 % lower (18 % vs. 26 %). The offline LO-OOA contribution to the total OA was only 4 % higher (25 % vs. 21 %) than the online LO-OOA. The offline MO-OOA contribution to the total OA differed by 9 % (17 % vs. 26 %) from the online MO-OOA. These differences are inside the uncertainty range of the offline analysis.
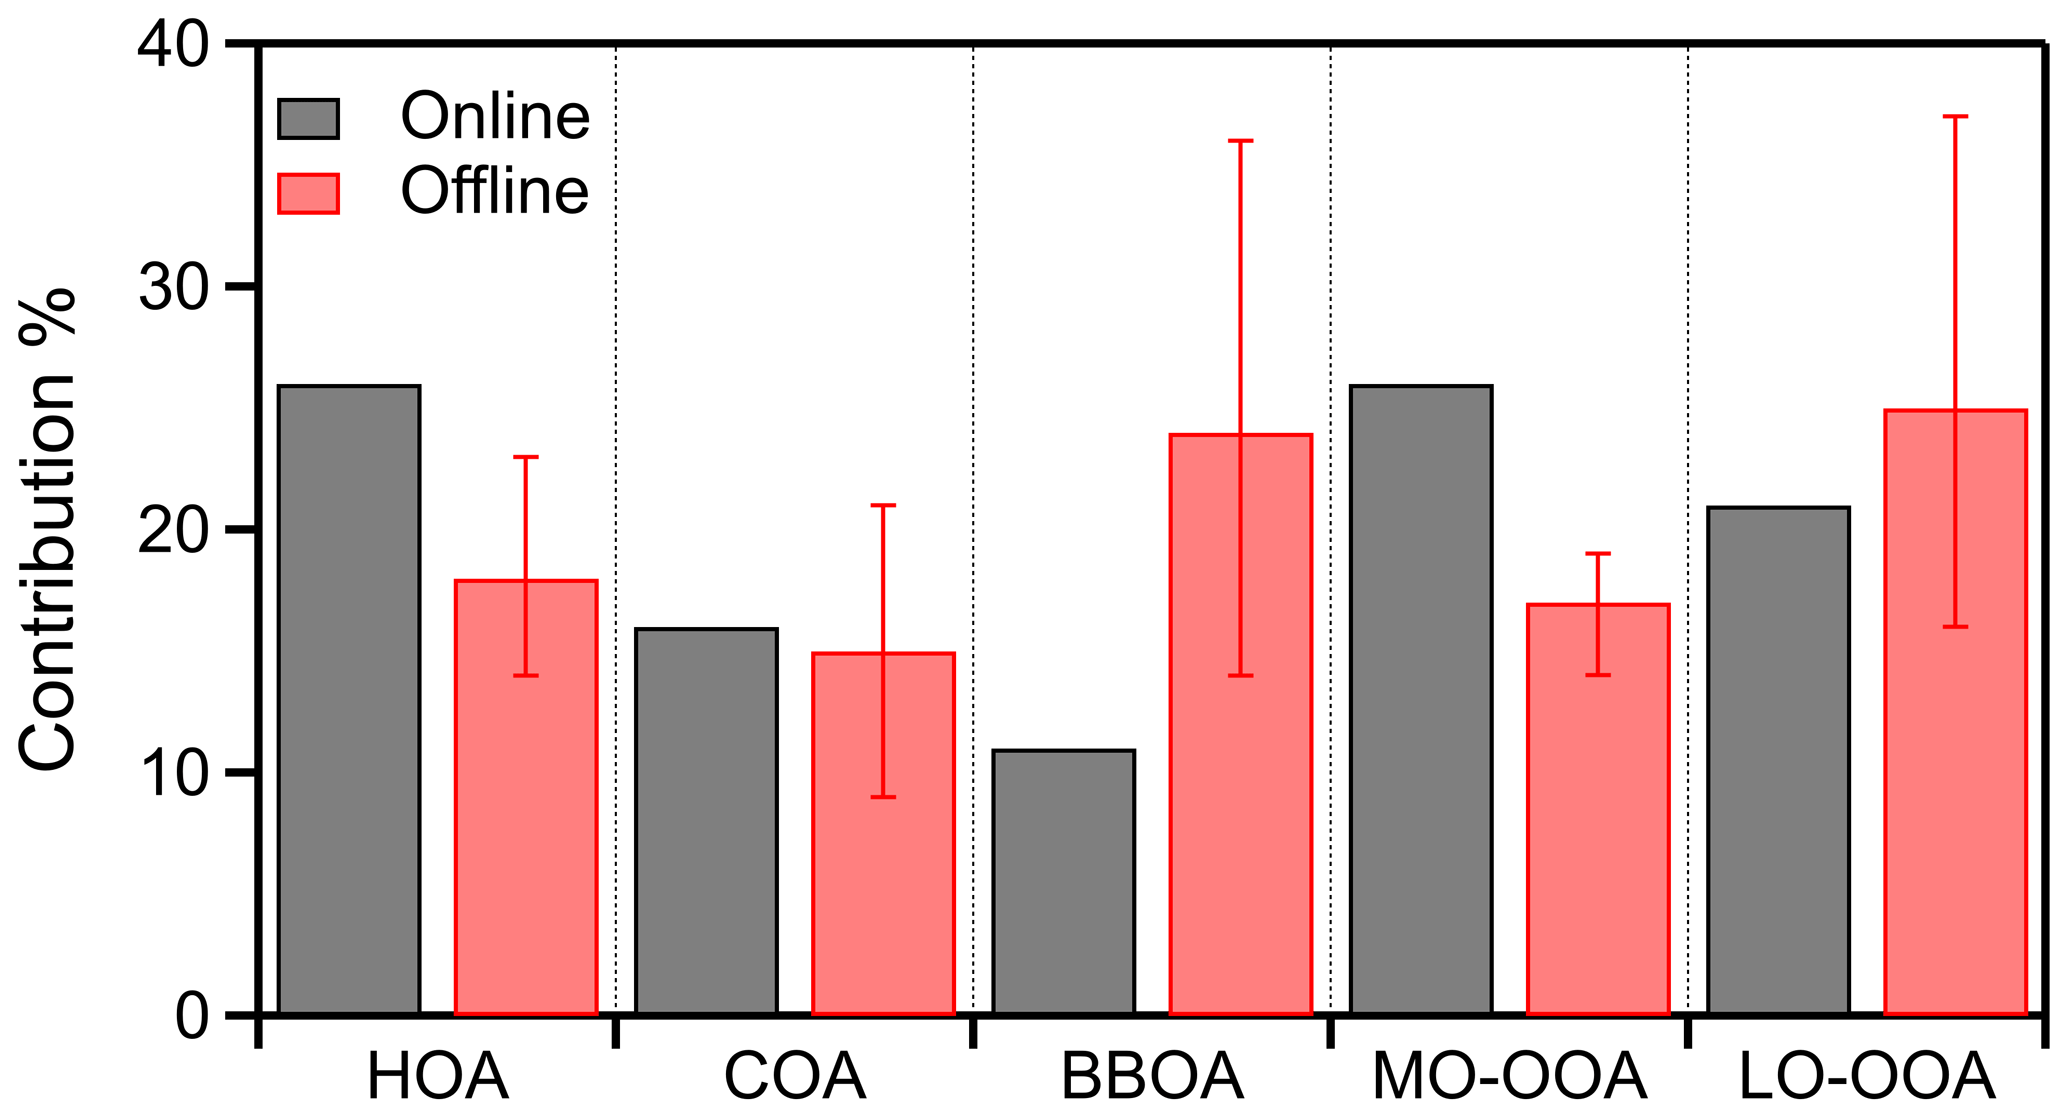
Figure 10Comparison of the contribution of each factor to the total OA between the online and the offline PMF analysis for the Athens 2019 winter campaign.
In order to estimate the uncertainty of the offline PMF results, a bootstrap analysis of 1000 runs has been performed. The mean BBOA contribution to the total OA was 24 % and ranged from 14 % to 36 % (Fig. S26). The HOA contribution to the total OA ranged from 14 % to 23 % (the mean value was 18 %). The estimated average COA contribution to the total OA was 15 %, and it ranged from 9 % to 21 %. MO-OOA ranged from 15 % to 20 % (mean value 18 %), and LO-OOA ranged from 16 % to 37 % (mean value 25 %).
A sensitivity analysis has also been performed, in which the offline high-resolution AMS spectra were averaged to unit resolution and were used as inputs to the PMF. The UMR PMF analysis resulted in more mixed profiles than the HR analysis, and the factors were not identified as easily as in the HR analysis. The contribution of each factor to the total OA between the HR and the UMR offline PMF results differed by less than 20 % (Sect. S4). The highest difference was observed for BBOA and was 17 % (24 % for the HR analysis and 7 % for the UMR analysis). Comparing the UMR offline solution with the online solution, the highest difference observed was 14 % and it referred to the COA. The UMR offline COA was 21 % of the total OA, while the online COA was 17 %.
Our results so far have indicated good agreement between the offline and collocated online AMS measurements. This is a rather surprising result because a significant fraction of the organics analyzed (components of cooking aerosol or components of the HOA coming from transportation) are practically insoluble in water. The coating of these particles with soluble secondary material can probably explain the corresponding results during the different campaigns. Our hypothesis is that during the extraction process, the water-soluble material of the particles dissolves, and the remaining small water-insoluble particle cores leave the filter and get suspended in the water during the sonication phase and then are transferred with the solution to the atomizer. After they enter the atomizer, they are included in the formed water droplets together with the dissolved material and become part of the produced aerosol after the drying. In this way, they are measured by the AMS. The different aspects of this hypothesis are tested in the following sections.
5.1 Measurements of suspended particles in the liquid phase
In order to test our hypothesis, we first quantified the concentration of the particles in the aqueous phase after the extraction and the filtration phase. Filtration (1 µm pore size) was used only for the measurements of the suspended particles in water and not for the offline AMS analysis. If our hypothesis is not valid, there should be no particles suspended in the solution, just the background. We used the Zetasizer to measure the size distribution of nanoparticles in the water using dynamic light scattering. The particle size distribution was measured in the ultrapure water used for the extraction and in the solution produced by the extraction of ambient aerosol samples. The Zetasizer was calibrated using monodisperse polystyrene spheres (PSLs) of 100 and 200 nm (Sect. S5).
The method was applied to 20 ambient samples, which were collected during winter at the University of Peloponnese campus, in Patras. The results support our hypothesis as significant concentrations of particles of sizes in the 100–200 nm size range were detected in the extract of the ambient aerosol samples (Fig. 11). These particles were not present in the blanks. In this case, only the water was used as blank.
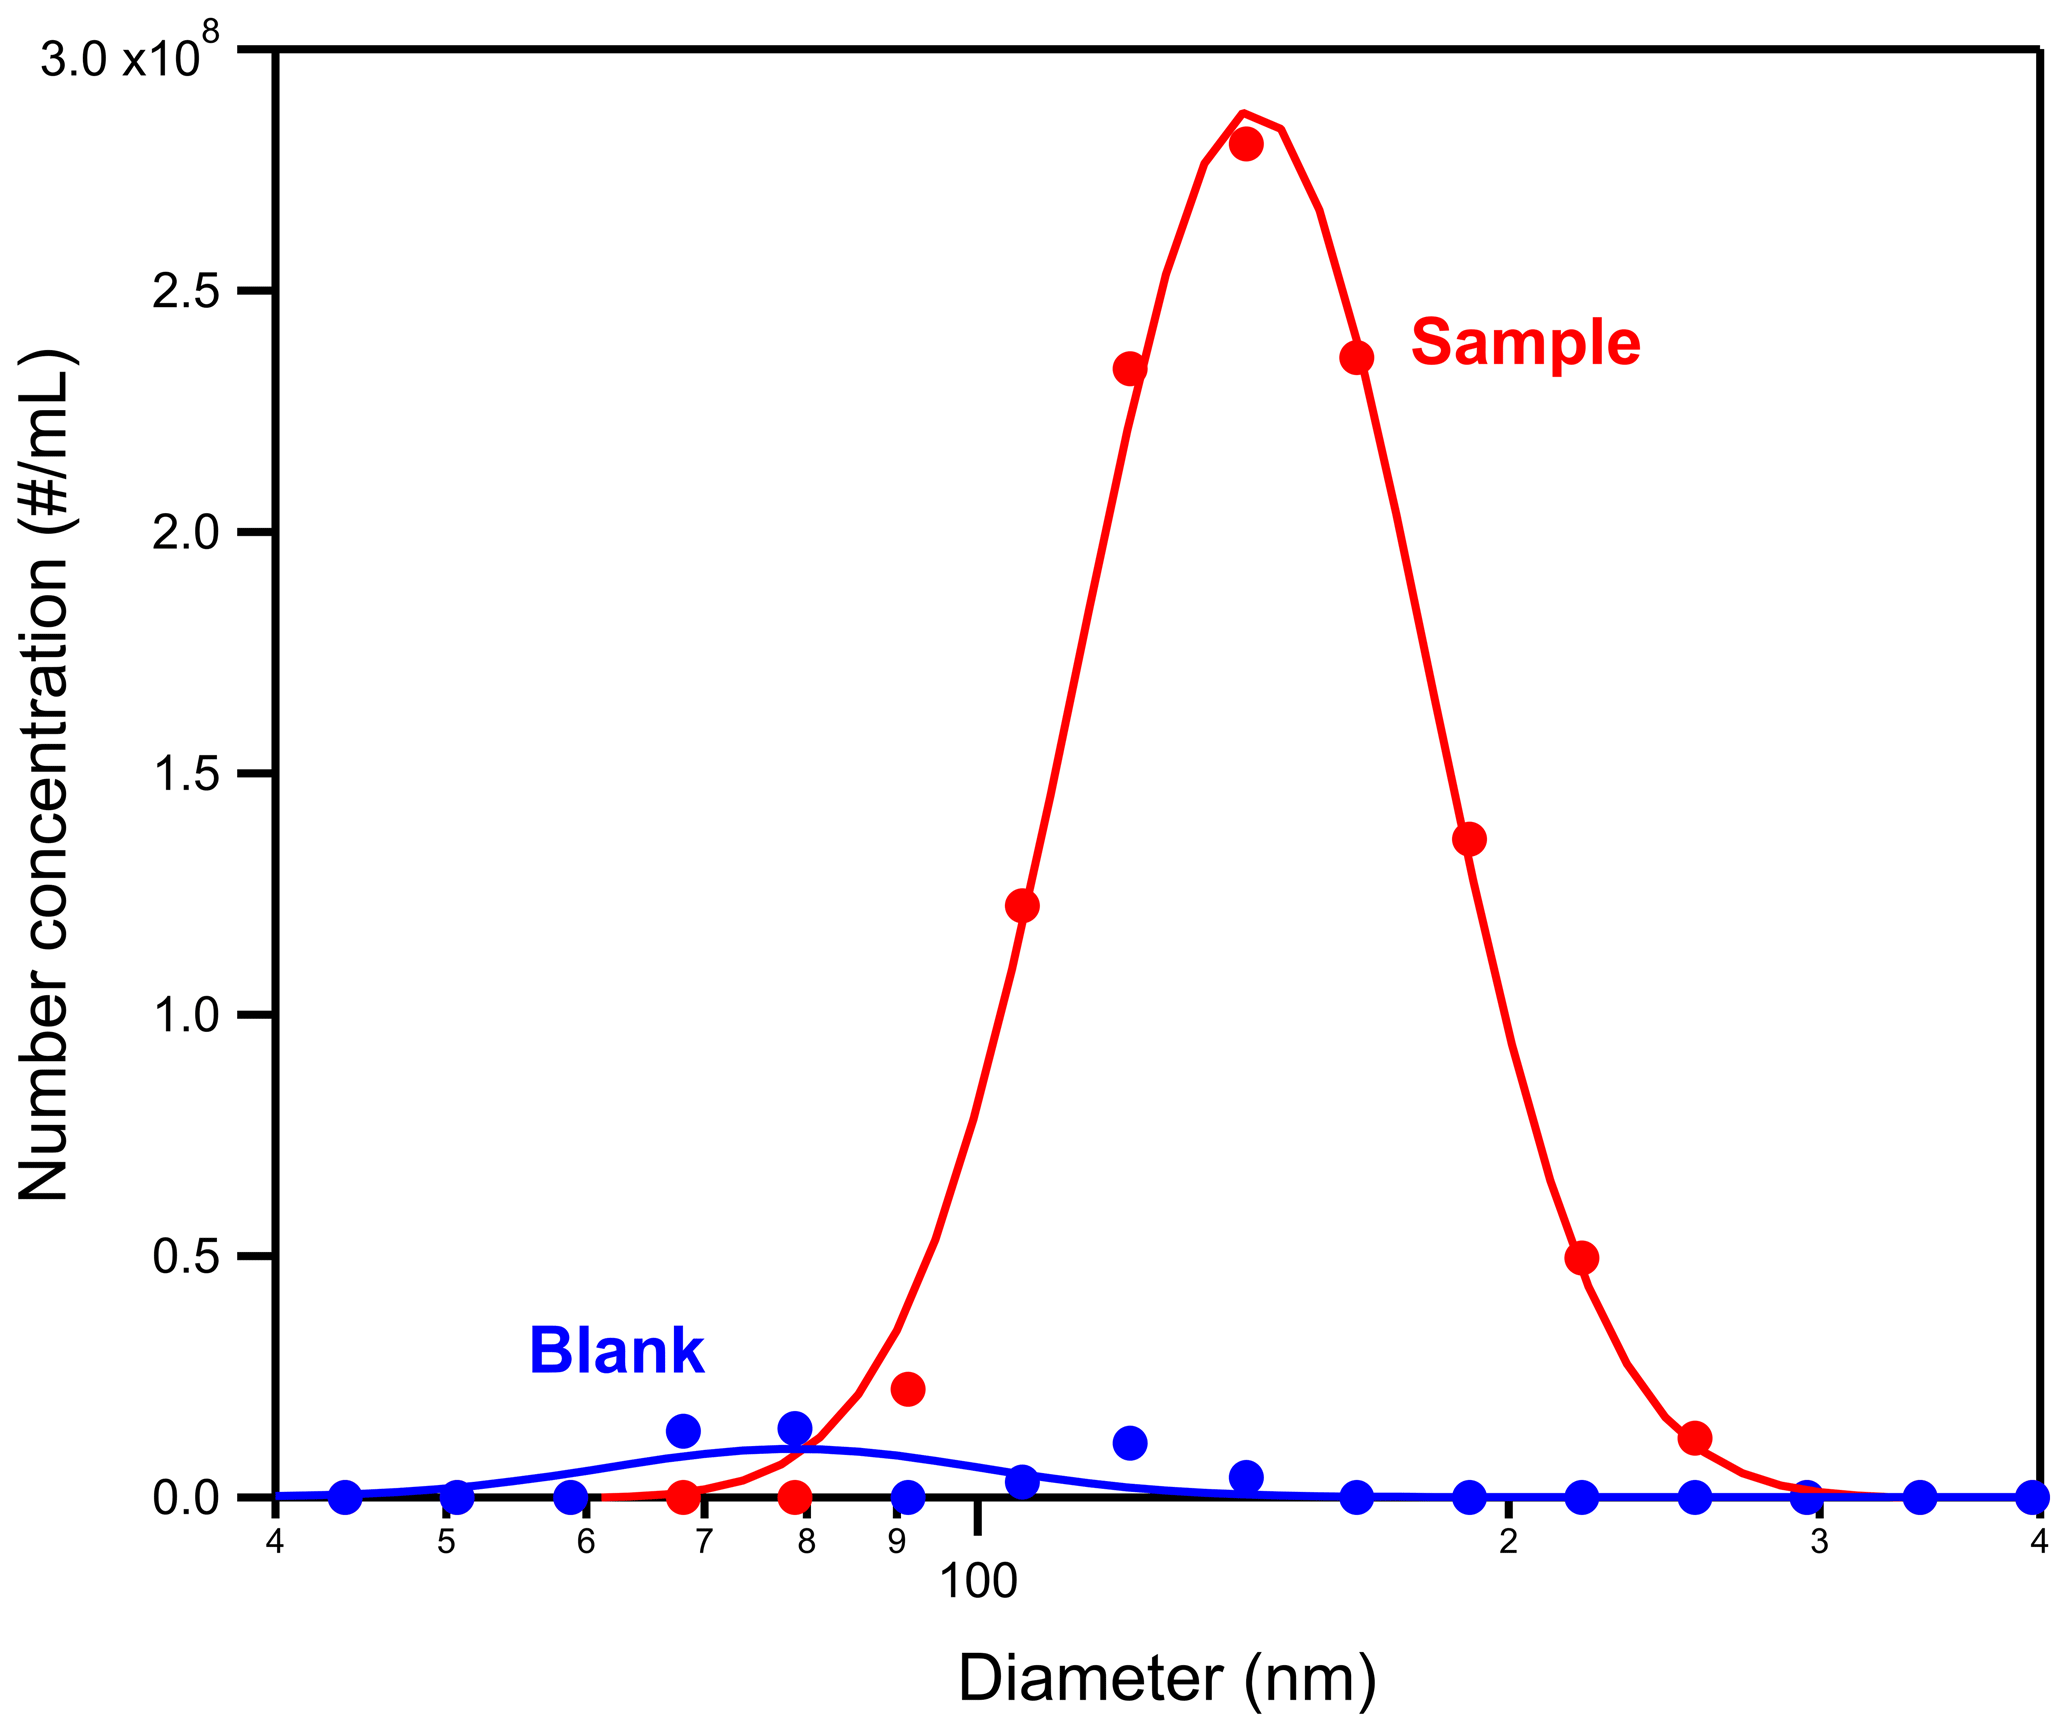
Figure 11Number concentration of suspended particles in the water extract for the sample (in red) and the blank (in blue).
5.2 Insoluble material removed from the filter after the extraction process
A significant number of suspended particles was measured in the water extracts using the Zetasizer. However, with that test we could not get information about the chemical composition of the particles leaving the filter. In this section we focus on the least water-soluble component of the particles: elemental carbon. Since the Zetasizer results showed that particles were detected in the water extracts, the concentration of insoluble material on the filter after the extraction process should be reduced compared to the initial concentration.
To test this, we used a Sunset OC EC analyzer for 20 ambient filter samples. In these additional experiments, the EC was measured before and after the extraction. The filters after the extraction were dried at 100 ∘C for 5 min before the EC measurement because the humidity of the sample increases the uncertainty of the EC measurement significantly. The ambient EC concentration for the examined period was on average 0.7 µg m−3 and ranged from 0.2 to 1.4 µg m−3. A significant fraction of EC was missing from the filter after the extraction process. The average EC on the filter after the extraction was 44 % of the initial (Fig. 12). The significant reduction of the EC on the filter supports our hypothesis that the insoluble particle cores leave the filter and get suspended in the water.

5.3 BC measurements using the offline technique
To test if the insoluble material can also survive through the atomization and drying processes, we measured the BC in the resulting particles with the Single-Particle Soot Photometer – Extended Range (SP2-XR) (Droplet Measurement Technologies). We focus on BC because it is water-insoluble and easy to measure and thus can be used to prove that the suspended insoluble material can be transferred to the AMS. Two filter punches (3 cm2 in total) from ambient samples were extracted in 10 mL of ultrapure water, following the offline procedure. The samples were placed in an ultrasonic sonicator for 30 min, and no filtration phase was performed. The water extracts were then atomized and dried, as in the offline AMS procedure, and then the resulting aerosol was detected with the SP2-XR. Significant BC concentrations were detected in the samples (Fig. 13), while in the blank (atomized water) the BC was practically zero. These tests strongly support our hypothesis that a significant fraction of even the most insoluble material (elemental carbon) in the ambient particles leaves the filter, gets suspended in the aqueous solution as particles in the 50–300 nm size range, and makes it to the AMS.
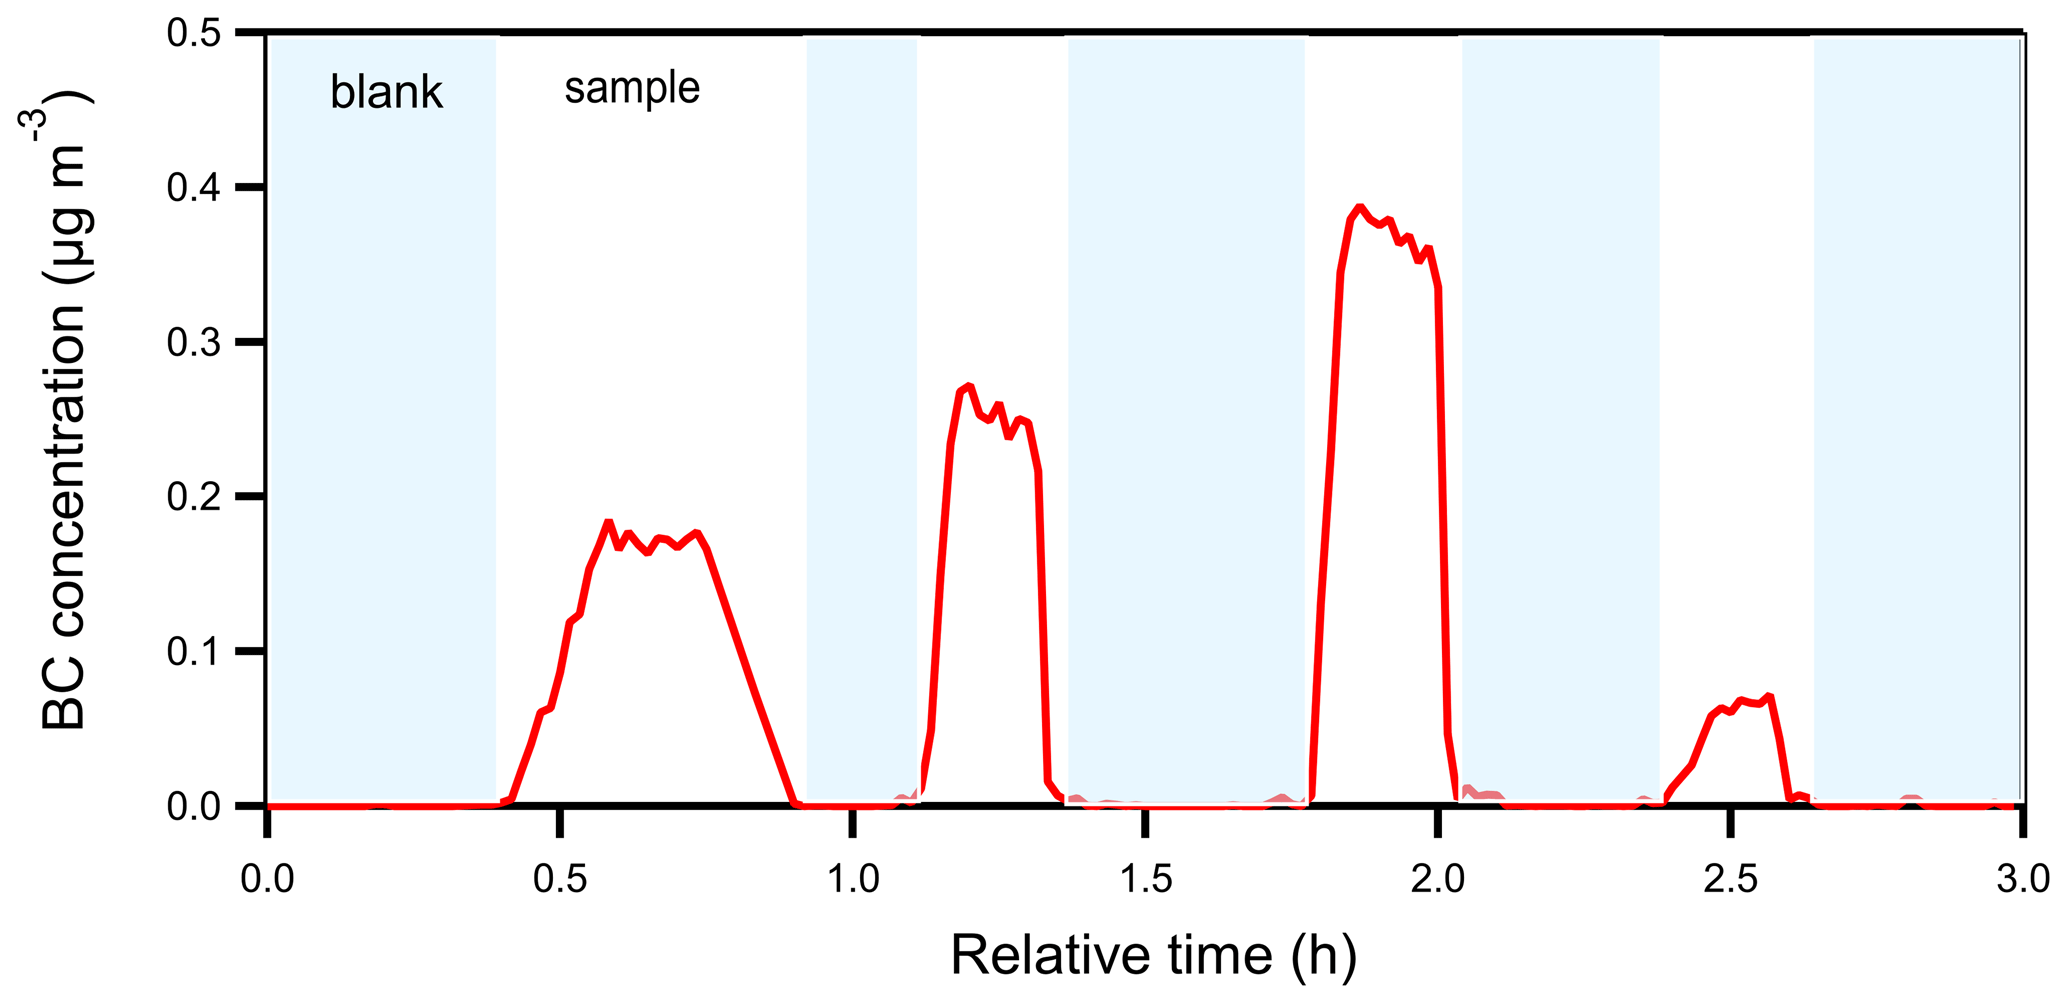
Figure 13BC concentration time series of the offline SP2 test. The blanks are shown in blue background and the samples in white.
The offline AMS technique can be a powerful tool for characterizing OA in areas and periods when an AMS is not available. However, so far it could only capture the water-soluble part of OA if no corrections were used. This could lead to significant differences of the source apportionment results compared to online measurements. In this work an improved offline aerosol mass spectrometer analysis technique has been developed, which can capture a significant part of the insoluble and the partially soluble fraction of OA.
The improved offline AMS technique has been evaluated in three different campaigns in Greece, two during winter (Athens and Patras) and one in the summer (Patras). PMF analysis was performed for each campaign, separately for the online and for the offline results. The fractional contribution of each source to the total OA differed by less than 15 % between the online and the offline PMF results, which shows that the two methods are in good agreement (considering their uncertainty) without any corrections required for the offline results.
The AMS spectra, however, showed significant differences between the online and the offline PMF results. This is due to both the reduced temporal resolution in the offline results compared to the online and the uncertainty introduced by aspects of the experimental procedure, such as the extraction efficiency. However, the PMF appears to be able to adjust the factors and still give relatively accurate fractional contributions of each factor to the total OA. Comparing summer with winter results, better agreement was observed in summer between the online and offline OA spectra. This could be due to the prevalence of the secondary material that coats most of the primary particles and potentially facilitates their suspension as it dissolves in water.
The proposed improved offline AMS technique can mobilize a significant fraction of the water-insoluble material and allow the AMS to measure it. This reduces the uncertainty compared to the original method significantly. The suspension of the insoluble material in the improved offline technique was evident by the considerable number of particles detected in the water extract at the range of 50–300 nm and by the lack of more than half of the EC from the filter after our water extraction process. In addition, a significant BC concentration was detected in the aerosol samples before the AMS, which is evidence that insoluble material can be extracted from the filter, can be atomized, and can get analyzed by the AMS with the proposed approach.
Measurement data are available by request by ch.vasilakopoulou@chemeng.upatras.gr.
The supplement related to this article is available online at: https://doi.org/10.5194/amt-16-2837-2023-supplement.
CNV and SNP designed the study and wrote the paper. CNV did the offline measurements and analysis. CNV, KF, CK, IS, and NM obtained and provided the online measurements. All authors edited the manuscript.
The contact author has declared that none of the authors has any competing interests.
Publisher’s note: Copernicus Publications remains neutral with regard to jurisdictional claims in published maps and institutional affiliations.
We would like to thank Aikaterini Bougiatioti and Despina Paraskevopoulou for providing the filters from the Thissio 2019 winter campaign.
This research has been supported by the Horizon 2020 Framework program, H2020 Excellent Science (RI-URBANS project, grant no. 101036245) and the Hellenic Foundation for Research and Innovation (project CHEVOPIN, grant no. 1819).
This paper was edited by Hang Su and reviewed by three anonymous referees.
Aiken, A. C., Salcedo, D., Cubison, M. J., Huffman, J. A., DeCarlo, P. F., Ulbrich, I. M., Docherty, K. S., Sueper, D., Kimmel, J. R., Worsnop, D. R., Trimborn, A., Northway, M., Stone, E. A., Schauer, J. J., Volkamer, R. M., Fortner, E., de Foy, B., Wang, J., Laskin, A., Shutthanandan, V., Zheng, J., Zhang, R., Gaffney, J., Marley, N. A., Paredes-Miranda, G., Arnott, W. P., Molina, L. T., Sosa, G., and Jimenez, J. L.: Mexico City aerosol analysis during MILAGRO using high resolution aerosol mass spectrometry at the urban supersite (T0) – Part 1: Fine particle composition and organic source apportionment, Atmos. Chem. Phys., 9, 6633–6653, https://doi.org/10.5194/acp-9-6633-2009, 2009.
Allan, J. D., Williams, P. I., Morgan, W. T., Martin, C. L., Flynn, M. J., Lee, J., Nemitz, E., Phillips, G. J., Gallagher, M. W., and Coe, H.: Contributions from transport, solid fuel burning and cooking to primary organic aerosols in two UK cities, Atmos. Chem. Phys., 10, 647–668, https://doi.org/10.5194/acp-10-647-2010, 2010.
Bozzetti, C., El Haddad, I., Salameh, D., Daellenbach, K. R., Fermo, P., Gonzalez, R., Minguillón, M. C., Iinuma, Y., Poulain, L., Elser, M., Müller, E., Slowik, J. G., Jaffrezo, J.-L., Baltensperger, U., Marchand, N., and Prévôt, A. S. H.: Organic aerosol source apportionment by offline-AMS over a full year in Marseille, Atmos. Chem. Phys., 17, 8247–8268, https://doi.org/10.5194/acp-17-8247-2017, 2017.
Canagaratna, M. R., Jimenez, J. L., Kroll, J. H., Chen, Q., Kessler, S. H., Massoli, P., Hildebrandt Ruiz, L., Fortner, E., Williams, L. R., Wilson, K. R., Surratt, J. D., Donahue, N. M., Jayne, J. T., and Worsnop, D. R.: Elemental ratio measurements of organic compounds using aerosol mass spectrometry: characterization, improved calibration, and implications, Atmos. Chem. Phys., 15, 253–272, https://doi.org/10.5194/acp-15-253-2015, 2015.
Canonaco, F., Crippa, M., Slowik, J. G., Baltensperger, U., and Prévôt, A. S. H.: SoFi, an IGOR-based interface for the efficient use of the generalized multilinear engine (ME-2) for the source apportionment: ME-2 application to aerosol mass spectrometer data, Atmos. Meas. Tech., 6, 3649–3661, https://doi.org/10.5194/amt-6-3649-2013, 2013.
Daellenbach, K. R., Bozzetti, C., Křepelová, A., Canonaco, F., Wolf, R., Zotter, P., Fermo, P., Crippa, M., Slowik, J. G., Sosedova, Y., Zhang, Y., Huang, R.-J., Poulain, L., Szidat, S., Baltensperger, U., El Haddad, I., and Prévôt, A. S. H.: Characterization and source apportionment of organic aerosol using offline aerosol mass spectrometry, Atmos. Meas. Tech., 9, 23–39, https://doi.org/10.5194/amt-9-23-2016, 2016.
DeCarlo, P. F., Dunlea, E. J., Kimmel, J. R., Aiken, A. C., Sueper, D., Crounse, J., Wennberg, P. O., Emmons, L., Shinozuka, Y., Clarke, A., Zhou, J., Tomlinson, J., Collins, D. R., Knapp, D., Weinheimer, A. J., Montzka, D. D., Campos, T., and Jimenez, J. L.: Fast airborne aerosol size and chemistry measurements above Mexico City and Central Mexico during the MILAGRO campaign, Atmos. Chem. Phys., 8, 4027–4048, https://doi.org/10.5194/acp-8-4027-2008, 2008.
Drewnick, F., Hings, S. S., DeCarlo, P., Jayne, J. T., Gonin, M., Fuhrer, K., Weimer, S., Jimenez, J. L., Demerjian, K. L., Borrmann, S., and Worsnop, D. R.: A new time-of-flight aerosol mass spectrometer (TOF-AMS) – Instrument description and first field deployment, Aerosol Sci. Tech., 39, 637–658, https://doi.org/10.1080/02786820500182040, 2005.
Florou, K., Papanastasiou, D. K., Pikridas, M., Kaltsonoudis, C., Louvaris, E., Gkatzelis, G. I., Patoulias, D., Mihalopoulos, N., and Pandis, S. N.: The contribution of wood burning and other pollution sources to wintertime organic aerosol levels in two Greek cities, Atmos. Chem. Phys., 17, 3145–3163, https://doi.org/10.5194/acp-17-3145-2017, 2017.
Ge, X., Li, L., Chen, Y., Chen, H., Wu, D., Wang, J., Xie, X., Ge, S., Ye, Z., Xu, J., and Chen, M.: Aerosol characteristics and sources in Yangzhou, China resolved by offline aerosol mass spectrometry and other techniques, Environ. Pollut., 225, 74–85, https://doi.org/10.1016/j.envpol.2017.03.044, 2017.
Jayne, J. T., Leard, D. C., Zhang, X., Davidovits, P., Kenneth, A., Kolb, C. E., Worsnop, D. R., Jayne, J. T., Leard, D. C., Zhang, X., Davidovits, P., Smith, A., Kolb, C. E., and Worsnop, D. R.: Development of an aerosol mass spectrometer for size and composition analysis of submicron particles, Aerosol Sci. Tech., 33, 49–70, https://doi.org/10.1080/027868200410840, 2000.
Jorga, S. D., Florou, K., Kaltsonoudis, C., Kodros, J. K., Vasilakopoulou, C., Cirtog, M., Fouqueau, A., Picquet-Varrault, B., Nenes, A., and Pandis, S. N.: Nighttime chemistry of biomass burning emissions in urban areas: A dual mobile chamber study, Atmos. Chem. Phys., 21, 15337–15349, https://doi.org/10.5194/acp-21-15337-2021, 2021.
Kaltsonoudis, C., Kostenidou, E., Louvaris, E., Psichoudaki, M., Tsiligiannis, E., Florou, K., Liangou, A., and Pandis, S. N.: Characterization of fresh and aged organic aerosol emissions from meat charbroiling, Atmos. Chem. Phys., 17, 7143–7155, https://doi.org/10.5194/acp-17-7143-2017, 2017.
Kostenidou, E., Lee, B. H., Engelhart, G. J., Pierce, J. R., and Pandis, S. N.: Mass spectra deconvolution of low, medium, and high volatility biogenic secondary organic aerosol, Environ. Sci. Technol., 43, 4884–4889, https://doi.org/10.1021/es803676g, 2009.
Kostenidou, E., Florou, K., Kaltsonoudis, C., Tsiflikiotou, M., Vratolis, S., Eleftheriadis, K., and Pandis, S. N.: Sources and chemical characterization of organic aerosol during the summer in the eastern Mediterranean, Atmos. Chem. Phys., 15, 11355–11371, https://doi.org/10.5194/acp-15-11355-2015, 2015.
Lanz, V. A., Alfarra, M. R., Baltensperger, U., Buchmann, B., Hueglin, C., and Prévôt, A. S. H.: Source apportionment of submicron organic aerosols at an urban site by factor analytical modelling of aerosol mass spectra, Atmos. Chem. Phys., 7, 1503–1522, https://doi.org/10.5194/acp-7-1503-2007, 2007.
Li, H., Zhang, Q., Jiang, W., Collier, S., Sun, Y., Zhang, Q., and He, K.: Characteristics and sources of water-soluble organic aerosol in a heavily polluted environment in Northern China, Sci. Total Environ., 758, 143970, https://doi.org/10.1016/j.scitotenv.2020.143970, 2021.
Mihara, T. and Mochida, M.: Characterization of solvent-extractable organics in urban aerosols based on mass spectrum analysis and hygroscopic growth measurement, Environ. Sci. Technol., 45, 9168–9174, https://doi.org/10.1021/es201271w, 2011.
Ng, N. L., Canagaratna, M. R., Jimenez, J. L., Zhang, Q., Ulbrich, I. M., and Worsnop, D. R.: Real-time methods for estimating organic component mass concentrations from aerosol mass spectrometer data, Environ. Sci. Technol., 45, 910–916, https://doi.org/10.1021/es102951k, 2011.
Niedek, C. R., Mei, F., Zawadowicz, M. A., Zhu, Z., Schmid, B., and Zhang, Q.: Quantitative chemical assay of nanogram-level particulate matter using aerosol mass spectrometry: characterization of particles collected from uncrewed atmospheric measurement platforms, Atmos. Meas. Tech., 16, 955–968, https://doi.org/10.5194/amt-16-955-2023, 2023.
Paatero, P.: The Multilinear Engine – A table-driven, least squares program for solving multilinear problems, including the n-way parallel factor analysis model, J. Comput. Graph. Stat., 8, 854–888, https://doi.org/10.1080/10618600.1999.10474853, 1999.
Paatero, P. and Tapper, U.: Positive matrix factorization: A non-negative factor model with optimal utilization of error estimates of data values, Environmetrics, 5, 111–126, https://doi.org/10.1002/env.3170050203, 1994.
Saarikoski, S., Carbone, S., Decesari, S., Giulianelli, L., Angelini, F., Canagaratna, M., Ng, N. L., Trimborn, A., Facchini, M. C., Fuzzi, S., Hillamo, R., and Worsnop, D.: Chemical characterization of springtime submicrometer aerosol in Po Valley, Italy, Atmos. Chem. Phys., 12, 8401–8421, https://doi.org/10.5194/acp-12-8401-2012, 2012.
Setyan, A., Zhang, Q., Merkel, M., Knighton, W. B., Sun, Y., Song, C., Shilling, J. E., Onasch, T. B., Herndon, S. C., Worsnop, D. R., Fast, J. D., Zaveri, R. A., Berg, L. K., Wiedensohler, A., Flowers, B. A., Dubey, M. K., and Subramanian, R.: Characterization of submicron particles influenced by mixed biogenic and anthropogenic emissions using high-resolution aerosol mass spectrometry: results from CARES, Atmos. Chem. Phys., 12, 8131–8156, https://doi.org/10.5194/acp-12-8131-2012, 2012.
Srivastava, D., Daellenbach, K. R., Zhang, Y., Bonnaire, N., Chazeau, B., Perraudin, E., Gros, V., Lucarelli, F., Villenave, E., Prévôt, A. S. H., El Haddad, I., Favez, O., and Albinet, A.: Comparison of five methodologies to apportion organic aerosol sources during a PM pollution event, Sci. Total Environ., 757, 143168, https://doi.org/10.1016/j.scitotenv.2020.143168, 2021.
Sun, Y.-L., Zhang, Q., Schwab, J. J., Demerjian, K. L., Chen, W.-N., Bae, M.-S., Hung, H.-M., Hogrefe, O., Frank, B., Rattigan, O. V., and Lin, Y.-C.: Characterization of the sources and processes of organic and inorganic aerosols in New York city with a high-resolution time-of-flight aerosol mass apectrometer, Atmos. Chem. Phys., 11, 1581–1602, https://doi.org/10.5194/acp-11-1581-2011, 2011.
Vasilakopoulou, C., Stavroulas, I., Mihalopoulos, N., and Pandis, S. N.: The effect of the averaging period for PMF analysis of aerosol mass spectrometer measurements during offline applications, Atmos. Meas. Tech., 15, 6419–6431, https://doi.org/10.5194/amt-15-6419-2022, 2022.
Vlachou, A., Daellenbach, K. R., Bozzetti, C., Chazeau, B., Salazar, G. A., Szidat, S., Jaffrezo, J.-L., Hueglin, C., Baltensperger, U., Haddad, I. E., and Prévôt, A. S. H.: Advanced source apportionment of carbonaceous aerosols by coupling offline AMS and radiocarbon size-segregated measurements over a nearly 2-year period, Atmos. Chem. Phys., 18, 6187–6206, https://doi.org/10.5194/acp-18-6187-2018, 2018.
Xu, J. Z., Zhang, Q., Wang, Z. B., Yu, G. M., Ge, X. L., and Qin, X.: Chemical composition and size distribution of summertime PM2.5 at a high altitude remote location in the northeast of the Qinghai–Xizang (Tibet) Plateau: insights into aerosol sources and processing in free troposphere, Atmos. Chem. Phys., 15, 5069–5081, https://doi.org/10.5194/acp-15-5069-2015, 2015.
Xu, L., Guo, H., Weber, R. J., and Ng, N. L.: Chemical characterization of water-soluble organic aerosol in contrasting rural and urban environments in the southeastern United States, Environ. Sci. Technol., 51, 78–88, https://doi.org/10.1021/acs.est.6b05002, 2017.
Ye, Z., Liu, J., Gu, A., Feng, F., Liu, Y., Bi, C., Xu, J., Li, L., Chen, H., Chen, Y., Dai, L., Zhou, Q., and Ge, X.: Chemical characterization of fine particulate matter in Changzhou, China, and source apportionment with offline aerosol mass spectrometry, Atmos. Chem. Phys., 17, 2573–2592, https://doi.org/10.5194/acp-17-2573-2017, 2017.