the Creative Commons Attribution 4.0 License.
the Creative Commons Attribution 4.0 License.
 | 13 Jun 2023
Validation of the Cloud_CCI (Cloud Climate Change Initiative) cloud products in the Arctic
Kameswara S. Vinjamuri
Marco Vountas
Luca Lelli
Martin Stengel
Matthew D. Shupe
Kerstin Ebell
John P. Burrows
The role of clouds in the Arctic radiation budget is not well understood. Ground-based and airborne measurements provide valuable data to test and improve our understanding. However, the ground-based measurements are intrinsically sparse, and the airborne observations are snapshots in time and space. Passive remote sensing measurements from satellite sensors offer high spatial coverage and an evolving time series, having lengths potentially of decades. However, detecting clouds by passive satellite remote sensing sensors is challenging over the Arctic because of the brightness of snow and ice in the ultraviolet and visible spectral regions and because of the small brightness temperature contrast to the surface. Consequently, the quality of the resulting cloud data products needs to be assessed quantitatively. In this study, we validate the cloud data products retrieved from the Advanced Very High Resolution Radiometer (AVHRR) post meridiem (PM) data from the polar-orbiting NOAA-19 satellite and compare them with those derived from the ground-based instruments during the sunlit months. The AVHRR cloud data products by the European Space Agency (ESA) Cloud Climate Change Initiative (Cloud_CCI) project uses the observations in the visible and IR bands to determine cloud properties. The ground-based measurements from four high-latitude sites have been selected for this investigation: Hyytiälä (61.84∘ N, 24.29∘ E), North Slope of Alaska (NSA; 71.32∘ N, 156.61∘ W), Ny-Ålesund (Ny-Å; 78.92∘ N, 11.93∘ E), and Summit (72.59∘ N, 38.42∘ W). The liquid water path (LWP) ground-based data are retrieved from microwave radiometers, while the cloud top height (CTH) has been determined from the integrated lidar–radar measurements. The quality of the satellite products, cloud mask and cloud optical depth (COD), has been assessed using data from NSA, whereas LWP and CTH have been investigated over Hyytiälä, NSA, Ny-Å, and Summit.
The Cloud_CCI COD results for liquid water clouds are in better agreement with the NSA radiometer data than those for ice clouds. For liquid water clouds, the Cloud_CCI COD is underestimated roughly by 3 optical depth (OD) units. When ice clouds are included, the underestimation increases to about 5 OD units. The Cloud_CCI LWP is overestimated over Hyytiälä by ≈7 g m−2, over NSA by ≈16 g m−2, and over Ny-Å by ≈24 g m−2. Over Summit, CCI LWP is overestimated for values ≤20 g m−2 and underestimated for values >20 g m−2. Overall the results of the CCI LWP retrievals are within the ground-based instrument uncertainties. To understand the effects of multi-layer clouds on the CTH retrievals, the statistics are compared between the single-layer clouds and all types (single-layer + multi-layer). For CTH retrievals, the Cloud_CCI product overestimates the CTH for single-layer clouds. When the multi-layer clouds are included (i.e., all types), the observed CTH overestimation becomes an underestimation of about 360–420 m. The CTH results over Summit station showed the highest biases compared to the other three sites. To understand the scale-dependent differences between the satellite and ground-based data, the Bland–Altman method is applied. This method does not identify any scale-dependent differences for all the selected cloud parameters except for the retrievals over the Summit station. In summary, the Cloud_CCI cloud data products investigated agree reasonably well with those retrieved from ground-based measurements made at the four high-latitude sites.
- Article
(3340 KB) - Full-text XML
- BibTeX
- EndNote


Over the past decades, a lack of knowledge of cloud properties in the melting Arctic has limited our understanding of their role in climate change (Devasthale et al., 2020). Clouds influence the earth's radiation budget by scattering the incoming solar radiation and absorbing and emitting outgoing longwave radiation in the thermal infrared. Clouds at different heights and temperatures also have different effects on the incoming shortwave (SW) and outgoing longwave (LW) radiation. The net amount of solar radiation reaching the earth's surface depends on the optical properties of clouds and their horizontal and vertical geometrical extent. For example, the low-level cloud fraction from 2000 to 2016 increased over the sea ice regions of the Beaufort and East Siberian seas during the summertime and resulted in an increasing ice melt. This behavior strengthens the ice–albedo feedback in the Arctic (Huang et al., 2021). At least since the beginning of the 1990s, Arctic surface temperature has been increasing more rapidly than at lower latitudes, a phenomenon called Arctic amplification (AA; Wendisch et al., 2017, and references therein). Long-term data records of cloud properties are required to understand the Arctic clouds and their impacts on AA's causes and consequences. Cloud properties, measured at the sparsely located ground-based sites can be complemented by satellite retrievals to improve the coverage of observations. Improved knowledge of the spatial and temporal variation in cloud micro-physical properties (e.g., cloud optical depth, COD; liquid water path, LWP) and macro-physical properties (e.g., cloud fraction, CF; cloud top height, CTH) in the Arctic improves our understanding of cloud processes and radiation balance (e.g., He et al., 2019; Devasthale et al., 2020; Lelli et al., 2023). Cloud data products from satellite remote sensing provide daily global coverage and high spatial resolution over the Arctic. In addition, these cloud data products can help to evaluate climate models and assess anomalies in the reanalysis data products (Liu and Key, 2016; Shaw et al., 2021). Thus the accuracy of these cloud data products needs to be assessed and validated in the Arctic. However, retrievals of cloud properties from measurements by passive remote sensing instruments over snow and ice are challenging and thus error-prone. These errors are mainly because of the low spectral contrast between the cloud and the surface in the visible spectral region and temperature inversions which influence the radiance observed in the near-infrared and thermal infrared spectral regions (see Dybbroe et al., 2005; Marchand, 2016, and references therein). In addition, multi-layer clouds occur in the Arctic, leading to issues in interpreting the cloud parameters (e.g., CTH) and resulting in biases. The lack of validation studies for the satellite cloud data products at high latitudes may have limited their use by the scientific community undertaking research in the Arctic. There are some exceptions, where TROPOspheric Monitoring Instrument (TROPOMI) products are compared with ground-based instruments and other satellite products (Compernolle et al., 2021). Other studies which have used the cloud cover (Schweiger, 2004; Boccolari and Parmiggiani, 2018; Philipp et al., 2020) have investigated cloud trends and variability over the Arctic. In addition, some studies, such as Sporre et al. (2016), have compared LWP and CTH retrievals from the Moderate Resolution Imaging Spectroradiometer (MODIS) and Visible Infrared Imaging Radiometer Suite (VIIRS) with the measurements of the Atmospheric Radiation Measurement (ARM) mobile facility at the high-latitude site in Hyytiälä. The results from this study showed an LWP difference of <15 g m−2 and CTH differences of <500 m between satellite and ground-based observations. However, the CTH differences are more than 1000 m for the clouds located above 6000 m. Earlier versions of the MODIS measurements were compared with ARM measurements over the North Slope of Alaska (NSA), where the authors identified cloud detection problems at high viewing angles (>55∘) (Berendes et al., 2004). Another study by Liu et al. (2017) examined active satellite observations in the Arctic compared to two ground-based stations, NSA and Eureka, and found from the cloud fractions that the satellite observations show 25 %–40 % fewer near-surface clouds (<0.5 km).
In this study, we validate the satellite cloud retrieval using selected cloud parameters, i.e., cloud mask, COD, LWP, and CTH, from the Cloud Climate Change Initiative (Cloud_CCI) dataset with ground-based cloud data products. The Cloud_CCI is a recent global dataset of cloud properties with good coverage in the Arctic. The Cloud_CCI data products are retrievals from the measurements made by the Advanced Very High Resolution Radiometer (AVHRR) on a series of satellite platforms (Stengel et al., 2020). It is part of the European Space Agency's program to provide climate data records within the United Nations Convention on Climate Change framework. In this study, we use the data products retrieved from the AVHRR on NOAA-19 daytime measurements made during the sunlit months, specifically April, May, June, July, August, and September for the time period 2010–2018. NOAA-19 flies in a sun-synchronous orbit in an ascending node, having an approximate Equator crossing time of 13:30 local time when it was launched. Previously, validation of the Cloud_CCI dataset has typically focused on latitudes outside of the Arctic (see Jeanneret et al., 2018). In this study, ground-based measurements from one sub-Arctic site at Hyytiälä, Finland (61.84∘ N, 24.29∘ E), and three Arctic sites at NSA (North Slope of Alaska), USA (71.32∘ N, 156.61∘ W); Ny-Ålesund, Svalbard (78.92∘ N, 11.92∘ E); and Summit, Greenland (72.59∘ N, 38.42∘ W) are used to validate the Cloud_CCI data product. All these sites have similar ground instrumentation. The measurements made at Hyytiälä were part of the Biogenic Aerosols – Effects on Clouds and Climate (BAECC) campaign and are available for 2014. In contrast, those at NSA and Summit provide a relatively long-term data record from 2010–2018 for LWP. For CTH over NSA and Summit, data records from 2012–2016 and 2010–2014, respectively, were used. The ground-based data record from Ny-Ålesund (Ny-Å) used in this study covers the years 2016–2018. The Hyytiälä and NSA ground-based data are from the ARM research facilities. The ARM program, initiated by the US Department of Energy, provides atmospheric measurements from targeted campaigns and also long-term measurements at some sites. ARM cloud data products have been used to validate satellite cloud retrievals (Rutan et al., 2001; Ji and Shi, 2012; Sporre et al., 2016). The data from Summit were obtained from the Integrated Characterization of Energy, Clouds, Atmospheric state, and Precipitation at Summit (ICECAPS) a project funded by the US National Science Foundation. For Ny-Å, measurements are taken from the AWIPEV Atmosphere Observatory. While some measurements at AWIPEV, e.g., radiosondes, surface radiation, and meteorology, started more than 30 years ago, cloud observations have been enhanced in 2016 as part of the Transregional Collaborative Research Center TRR 172 “ArctiC Amplification: Climate Relevant Atmospheric and SurfaCe Processes, and Feedback Mechanisms (AC)3” (Wendisch et al., 2022). In particular with the installation of a cloud radar, enhanced vertically resolved cloud observations became possible (Nomokonova et al., 2019a).
The satellite retrievals are often subject to a scale bias (i.e., scale-dependent bias) compared to the measurements from ground-based instruments. They tend to overestimate (underestimate) the high (low) values of COD, LWP, and CTH (Sporre et al., 2016). Consequently, in the present study, we investigated the scale bias between the selected Cloud_CCI data products and those from the ground-based measurements in the Arctic. For this purpose, we use the Bland–Altman (BA) approach (Altman and Bland, 1983; Bland and Altman, 1986; Knobelspiesse et al., 2019). The BA approach uses the normalized bias for the paired mean values between the ground-based measurements and the Cloud_CCI data for the selected cloud parameter.
In Sect. 2 of the paper, we introduce the Cloud_CCI cloud data products and then the corresponding data product from the ground-based observational sites. Section 3 describes the method used to assess and validate the Cloud_CCI data products, i.e., the statistical techniques. The results and their discussion are presented in Sect. 4. In the last section, we summarize the findings of this study.
2.1 CCI data
As described above, we use the Cloud_CCI dataset retrieved from the measurements of AVHRR which flew on NOAA-19. The interested reader is referred to the detailed publication about the data by Stengel et al. (2020). The Cloud_CCI retrievals use the AVHRR radiance measurements centered at the wavelengths 0.6, 0.8, 3.7, 11, and 12 µm. The version 3.0 Level-3U daily products used in this study contain selected Level-2 data (satellite pixel level data) on a global 0.05∘ longitude–latitude grid (Stengel et al., 2020). The Cloud_CCI products are retrieved using the Community Cloud retrieval for CLimate (CC4CL) retrieval system (Sus et al., 2018; McGarragh et al., 2018). It comprises three major steps involving the following:
-
A cloud mask that identifies the cloudy and clear scenes is determined using an artificial neural network (ANN). The ANN uses the AVHRR radiances trained with the co-located Cloud-Aerosol Lidar with Orthogonal Polarization (CALIOP) COD to identify the presence or absence of cloud. In addition, a detection algorithm for cirrus clouds is used based on the brightness temperature differences in the IR band radiances at 11 and 12 µm and defined threshold values as proposed by Pavolonis et al. (2005).
-
A cloud-phase mask is used to determine liquid water and ice clouds using an ANN approach. The ANN cloud-phase mask is similar to the cloud mask ANN, but it is trained with the CALIOP cloud-top-phase data. The cloud-phase retrieval provides binary information, liquid or ice.
-
An optimal estimation algorithm (Rodgers, 1976) is applied to the measured AVHRR radiances using the retrieved cloud mask and cloud-phase information to generate the cloud data products. The ancillary information, such as the land bidirectional reflectance distribution function (BRDF), surface temperature, and surface emissivity, is taken from the MODIS C6 (Schaaf et al., 2010), ERA-Interim (Dee et al., 2011), and Cooperative Institute for Meteorological Satellite Studies (CIMSS) databases, respectively (Seemann et al., 2008). Cloud properties retrieved using the optimal estimation algorithm are cloud top pressure, cloud effective radius (CER), and COD in the SW region. These are used to calculate cloud liquid and ice water paths (Stephens, 1978). The COD and LWP are daytime products. One of the key features of the Cloud_CCI dataset comprises the uncertainties provided at the pixel level inferred from the implemented optimal estimation theory (Stengel et al., 2020). The Cloud_CCI data have been validated by comparing them to independent spaceborne references, especially for non-polar regions (Stengel et al., 2020; Stapelberg et al., 2019). The main focus of these studies was global-scale evaluation against space-based reference data as well as global-scale comparisons to existing datasets of similar types. The results presented in the article at hand extend the evaluation efforts by using high-quality, ground-based reference measurements in the Arctic.
2.2 Ground-based measurements
This study uses ground-based data from Hyytiälä, NSA, Ny-Å, and Summit stations shown in Fig. 1. Although of limited duration, the campaign data products, measured as part of the BAECC campaign (2014) over Hyytiälä, provide relatively dense records with similar instrumentation and are directly comparable to measurements at the NSA (Verlinde et al., 2016), Ny-Å (Nomokonova et al., 2019a), and Summit (Shupe et al., 2013) sites. Due to the availability of data products from the ground-based measurements, the CCI cloud mask (CM) and COD are validated at NSA, whereas CCI LWP and CTH are validated at all four sites.
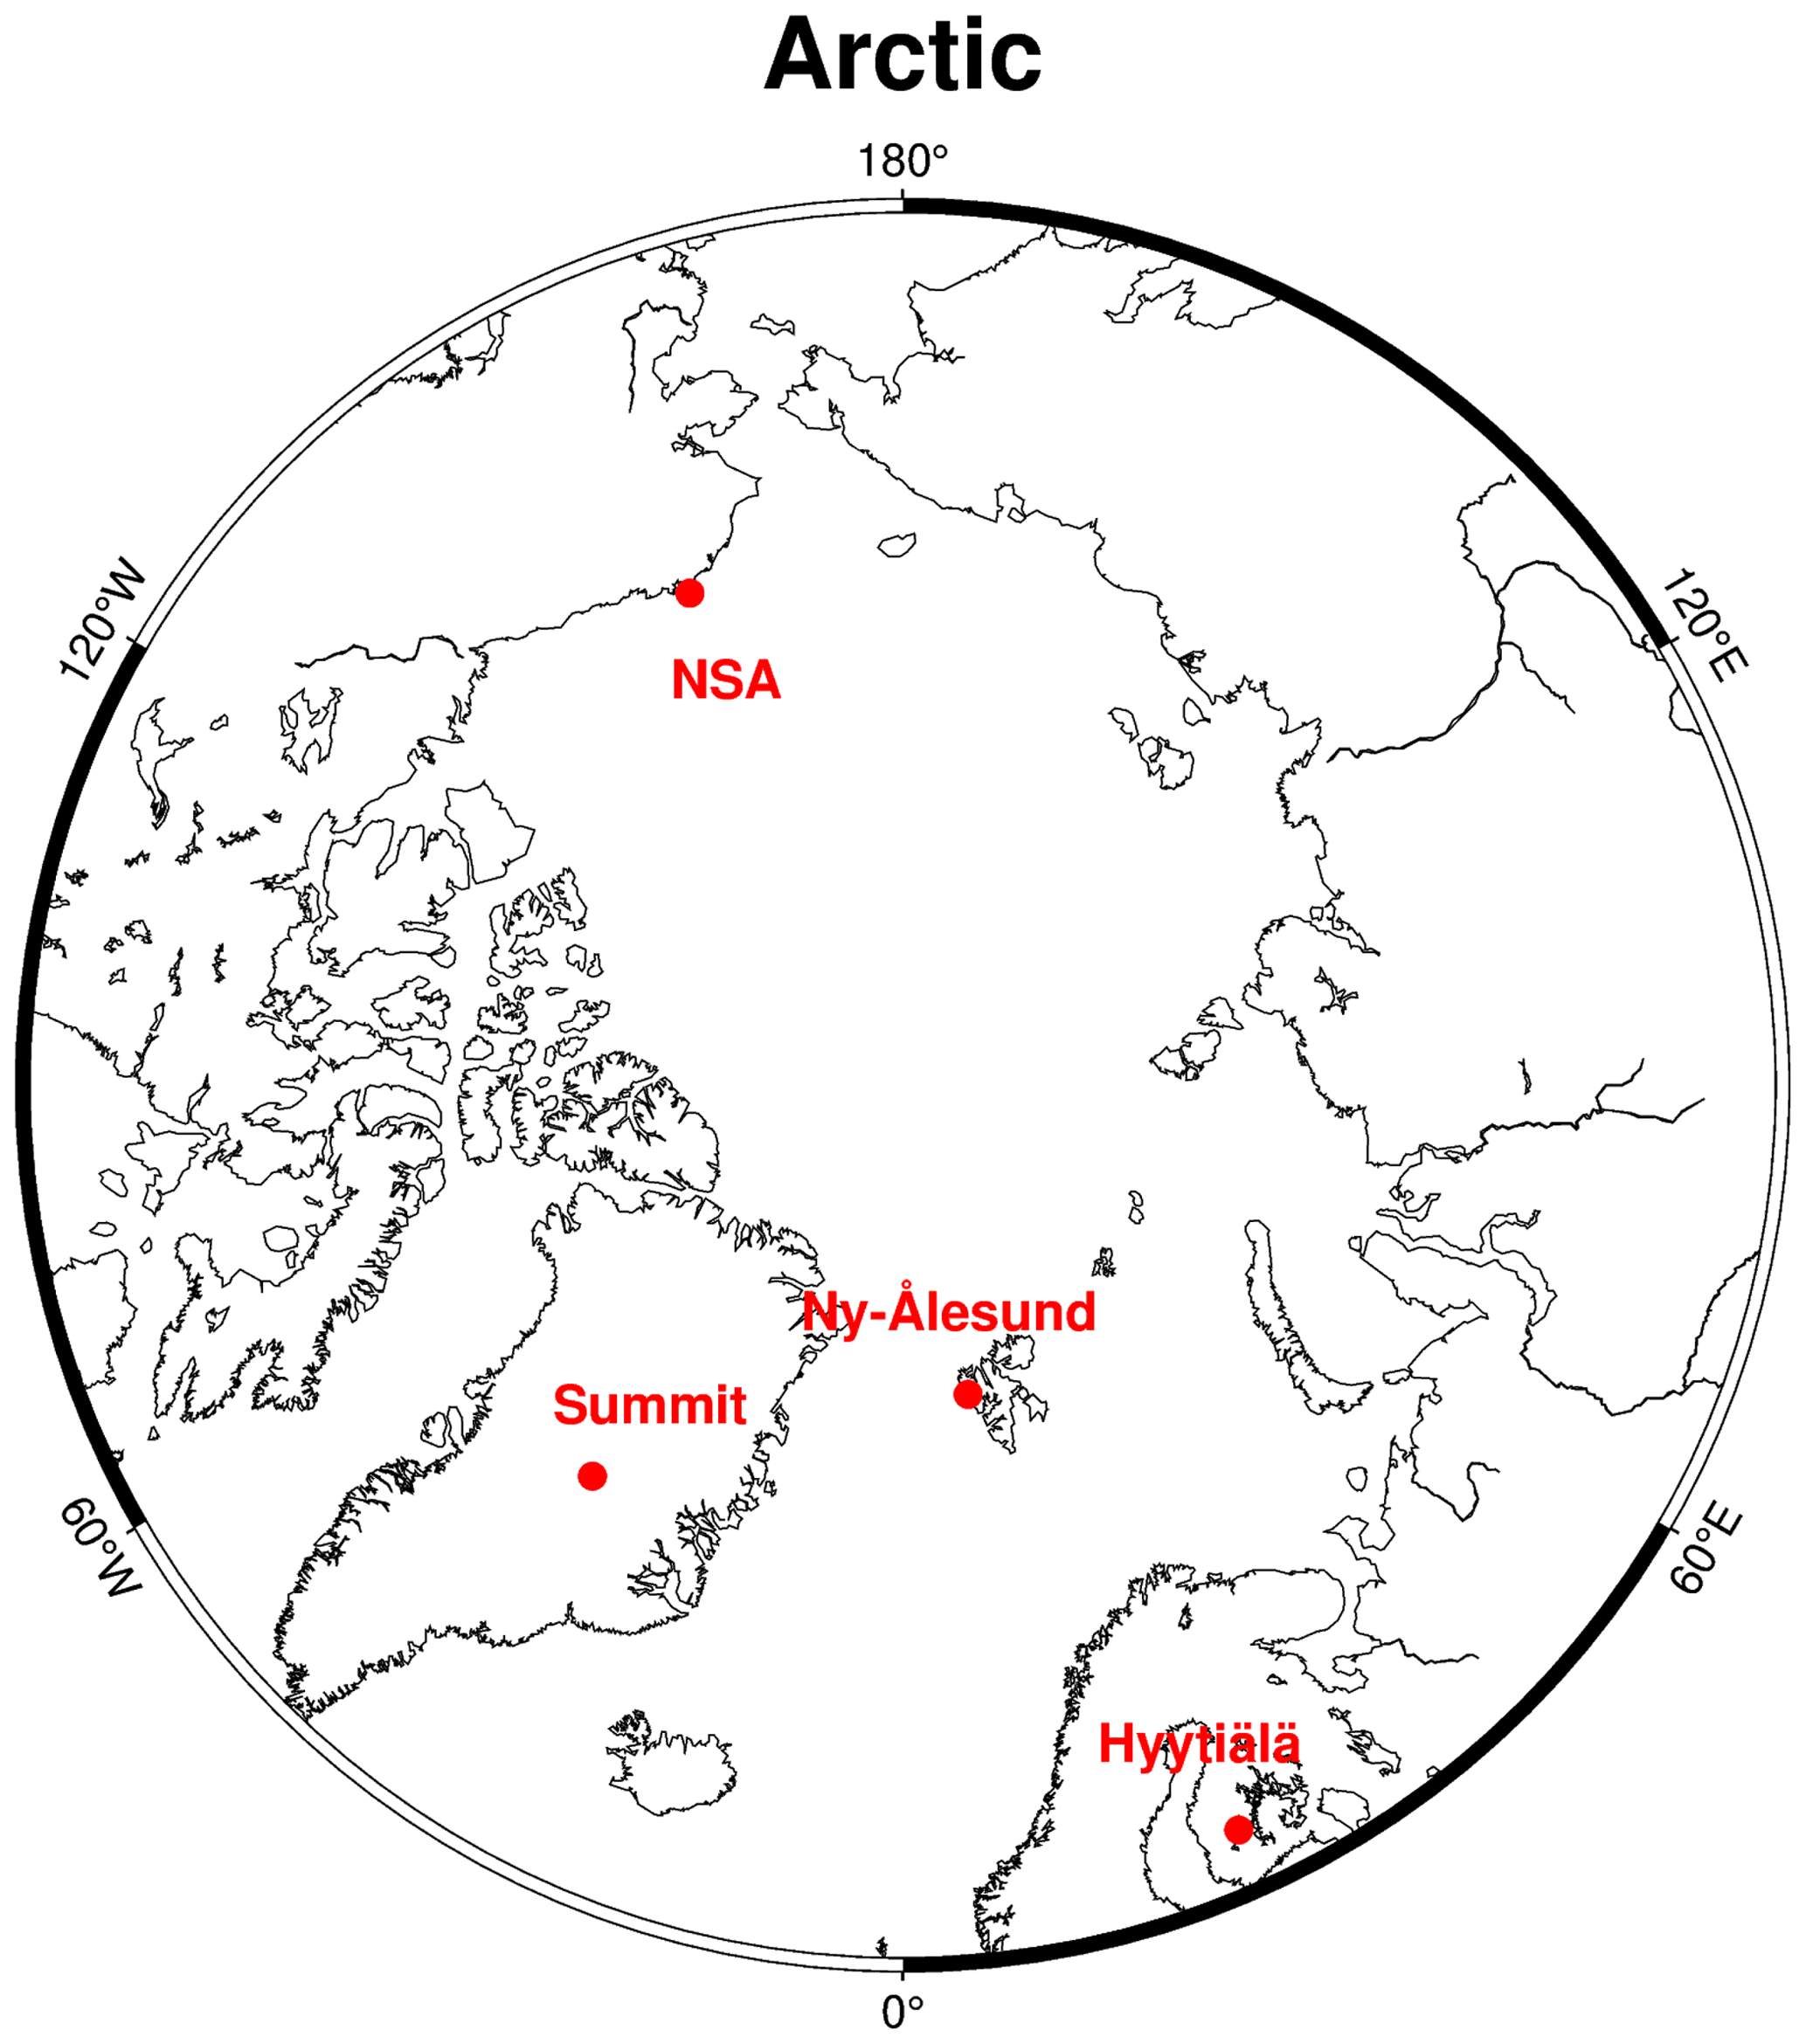
Figure 1Arctic polar stereographic map showing the selected ground-based sites.
2.2.1 Cloud fraction and optical depth
The cloud fraction (CF) and cloud optical depth over NSA are obtained from the radiative flux analysis product. This value-added product is based on the shortwave irradiance from the pyranometer to identify clear and cloudy skies (Riihimaki et al., 2019). In the presence of clear skies, the shortwave irradiance, measured at the ground, is larger than that for cloudy skies. An empirical fit function is then used to calculate the continuous clear-sky estimates and cloud optical property data products (Long and Ackerman, 2000; Riihimaki et al., 2019). The CF is derived using the methodology described in Long et al. (2006), which assumes that increasing cloud cover increases the diffuse irradiance relative to the direct irradiance (Riihimaki et al., 2019). The SW COD is retrieved using the algorithm from Barnard and Long (2004), which has been adapted for the identification of optically thin clouds (Barnard et al., 2008). The algorithm enables COD for liquid and ice clouds to be retrieved. The algorithm differentiates the liquid and ice clouds based on the fixed asymmetry parameter of 0.87 and 0.80, respectively, as suggested by Fu (1996) and Barnard et al. (2008). The retrieved SW COD is only valid for overcast conditions, i.e., cloud fractions greater than 0.95 (Min and Harrison, 1996). The absolute differences in sky cover amount derived from the SW CF estimates and total sky imager (TSI) retrievals agree within 10 %, indicating a good level of agreement (Long et al., 2006; Barnard et al., 2008).
2.2.2 Liquid water path
The LWP at Hyytiälä is retrieved from the three-channel microwave radiometer instrument (MWR3C) data product. The center frequencies of the microwave radiometer (MWR) are 23.83, 30, and 89 GHz, which coincide with the peak absorption frequencies for the liquid water (Cadeddu, 2021). The use of the three channels makes the retrieval sensitive to the small LWP values expected in dry environments, such as larger parts of the Arctic (Cadeddu et al., 2009; Cadeddu, 2021). The retrieval uses an ANN approach as described by Cadeddu et al. (2009). The LWP at NSA is retrieved from MWR-measured brightness temperatures at 23.80 and 31.40 GHz frequencies, while at Summit the same technique is applied to the same channels in addition to a 90.0 GHz channel. For these two sites, a physically based radiative transfer model for monochromatic light called MonoRTM uses the observed measurements to create the MWR RETrieval (MWRRET) product (Turner et al., 2007; Gaustad et al., 2011). The MWRs make measurements every 28 s, and the random uncertainties associated with the retrieval for MWR3C and MWRRET are ≈15 and ≈20 g m−2, respectively (Turner et al., 2007; Cadeddu, 2021). For Ny-Å, LWP is retrieved from the Humidity And Temperature PROfiler (HATPRO) of the Alfred Wegener Institute for Polar and Marine Research (Nomokonova et al., 2019b, a). HATPRO is an MWR providing brightness temperature measurements at seven frequencies between 22.24 and 31.40 GHz and at seven frequencies between 51.26 and 58.00 GHz with a temporal resolution of about 1 s. LWP is retrieved from a linear regression algorithm (Nomokonova et al., 2019a). The uncertainty is estimated to be about 20–25 g m−2 (Rose et al., 2005). In the analysis, HATPRO LWP has been excluded in cases where the quality flag was set, i.e., indicating for example precipitation, and in cases where an additional check indicated that the MWR brightness temperatures of one frequency channel were spectrally inconsistent with the other channels of the same band.
2.2.3 Cloud top height
CTH at Hyytiälä and NSA is measured using the Ka-band ARM Zenith Radar (KAZR) Active Remote Sensing of Clouds (KAZR-ARSCL) data product, which blends the radar observations with micropulse lidar observations (Clothiaux et al., 2001) to provide, among other parameters, a detailed vertical cloud mask with cloud boundaries. The lidar provides supporting information on the cloud boundaries, although for optically thick clouds the radar typically provides information on the cloud top due to attenuation of the lidar signal. The CTH over Summit is derived from an earlier version of the ARSCL algorithm but uses only observations from a millimeter cloud radar (MMCR), which was the precursor for the KAZR and is an operationally similar radar. Both radars used here are 35 GHz, Ka-band radars, which are commonly used for cloud detection because the oxygen and water vapor absorption at these frequencies is at a local minimum (Clothiaux et al., 2001; Kollias et al., 2007). The reflectivity in the range of −50 to 20 dBZ for the hydrometeor layer up to 10 km or higher is accurately detected by the cloud radar (Clothiaux et al., 2000). The accuracy of the measurement for a stratocumulus or altocumulus cloud with liquid particle size in the range of 3–5 µm at −50 dBZ is such that the detection limit for a hydrometeor layer is smaller than a condensed water content of ≤0.01 g m−3 and hydrometer layers in the range 0.01–0.03 g m−3 are measurable (Noonkester, 1984; Heymsfield et al., 1991; Clothiaux et al., 2001). The radar products have a vertical resolution of 45 m and a time resolution of 2–4 s. For Ny-Å, the Cloudnet classification product (Illingworth et al., 2007; Nomokonova et al., 2019a) was used to determine CTH. To this end, measurements at the AWIPEV Atmosphere Observatory, i.e., cloud radar reflectivity, Doppler velocity, and ceilometer attenuated backscatter, are jointly analyzed with numerical weather prediction data. The resulting classification profiles have a temporal (vertical) resolution of 30 s (20 m) and provide information on the presence of cloud liquid droplets, ice, melting ice, and drizzle/rain in each radar height bin up to a height of about 12 km. The CTH value corresponding to the height above ground level is converted to the height above mean sea level to match satellite CTH values.
One of this study's essential aspects is to match the satellite and the ground-based instruments spatio-temporally. We follow the spatial co-location strategy from Stengel et al. (2020) i.e., 5 km radius. However, in comparison to Stengel et al. (2020), we relaxed the temporal co-location from 3 to 5 min and averaged the ground-based data over this 5 min interval. We expect the satellite and ground-based instruments to view the same cloud even at this relaxed interval, bearing in mind that the Arctic atmosphere is less dynamic than at the lower latitudes (Kay et al., 2016; Edel et al., 2019). For the quality criteria, the pixels for the selected Cloud_CCI cloud data are not qualified for validation if the cost values are too high in the optimal estimation retrieval. The exact limits for each Cloud_CCI cloud parameter for the iteration process in the optimal estimation can be found in McGarragh et al. (2018). The validation uses scatterplots and linear least-squares regression coefficients to interpret the results. The reliability of the regression coefficients is examined using the t distribution (Phillips, 1986). In the following text, the terms overestimation and underestimation refer to the median bias.
Bland–Altman plots
Validation or assessment studies often use scatterplots to infer the difference or bias between the space and ground measurements. This method has its limitations (Martonchik et al., 2004; Van Harten et al., 2018; Seegers et al., 2018). For example, linear regression models do not provide information on scale-dependent biases. In addition to using scatterplots, we use Bland–Altman (BA) plots to further investigate the behavior of the bias. The BA approach used here plots the differences between the paired measurements, normalized by the root mean square of the standard deviations versus the measured paired mean. This plot enables scale-dependent and scale-independent biases to be identified (Altman and Bland, 1983; Bland and Altman, 1986). There have been a few relevant studies that have used this approach effectively (Knobelspiesse et al., 2019; McKinna et al., 2021). The steps of our BA analysis are as follows:
-
Calculate the paired mean (M) for all matched observations for the chosen cloud parameter,
where Mi is the paired mean for the ith observation, Xi is the ground ith observation, and Yi is the satellite ith observation.
-
Calculate the normalized differences (D) for all matched observations for the chosen cloud parameter,
where Di is the normalized difference for the ith observation, σci is the Cloud_CCI pixel uncertainty for the ith observation in the optimal estimation, and σai is the standard deviation observed in the ground-based measurements for the temporally averaged period for the ith observation.
-
Plot M vs. D, and calculate the linear regression coefficients (Pearson coefficient, r) with the significance testing (t test). The corresponding formula for r is
where is the mean of ground observations, is the mean of satellite observations, and n is the total number of observations.
-
Check whether the Pearson coefficient from the above step is insignificant at the 95 % confidence level. BA bias (B) and limits of agreement (LOAs) are defined in this case. The BA bias is the mean normalized difference (D), and LOA denotes the 2σ region for the observed BA bias.
where Bs is the standard deviation in Di.
-
If the significance test fails, then B and LOA are considered meaningless and are not calculated. In this case, the bias is dependent on the paired mean, which implies that the bias changes significantly with the paired mean, i.e., a scale-dependent or variant case.
-
We assume that an ideal distribution of normalized differences would have a bias of 0 % and 95 % of the values lie within . The obtained results from the BA plots (B, LOA) are interpreted by comparing them to this assumed ideal range.
4.1 Cloud mask
The initial step in any cloud retrieval scheme is to apply a cloud mask to the satellite observations. This classifies the pixels as cloudy or cloud-free. If a cloud is identified in a pixel, cloud data products are retrieved. The Cloud_CCI, as discussed before, uses an ANN trained with CALIOP data to identify the cloudy and cloud-free pixels. Figure 2 shows the plot of SW CF vs. SW COD from NSA, stratified by Cloud_CCI cloud mask information. The COD from NSA is divided into three ranges as follows, less than 3 optical depth (OD) units (optically thin), 3–10 OD units, and more than 10 OD units. The black and red colors show the cloudy and clear conditions, respectively, as described in the Cloud_CCI data. The shaded region of Fig. 2 comprises ground-based measurements having CF values of 50 %–100 %. We choose the 50 %–100 % values of CF to investigate whether the Cloud_CCI cloud mask is accurate. For these data, we expect the Cloud_CCI cloud mask to be cloudy when the NSA CF is at least 0.5. The hit percentage for a particular COD range is defined as the number of Cloud_CCI cloudy pixels that occurs in the shaded region (NSA CF >0.5) divided by the total number of pixels in the shaded region. The miss percentage is defined as the number of Cloud_CCI clear pixels that occurs in the shaded region (NSA CF >0.5) divided by the total number of pixels in the shaded region. In this study, we use the hit and miss percentages to quantify the success of the cloud mask. In Fig. 2, the hit percentage is ≈75 % for the optically thin clouds, whereas, for the optical thick clouds, it is as high as 90 %. For the clouds having optical depths greater than 10 OD units, the hit percentage is greater than 95 %. The miss percentage is around 25 % for the optically thin clouds, i.e., for COD ≤3. The miss percentage was reduced to almost 10 % for the clouds, whose optical depths are between 3 and 10 OD units. This relatively high miss percentage for the thin clouds is due to the high cloud detection sensitivities (minimum COT required to detect 50 % of clouds) over polar regions during the AVHRR–CALIOP matchups (Karlsson and Håkansson, 2018). This could also be due to the smaller cloud elements (smaller than AVHRR field of view) that make the cloud optically not thick enough to be sensed by the AVHRR sensor. Another possible explanation for the miss percentages is the presence of fog or clouds that form as a result of a temperature inversion in the boundary layer. Such conditions are more frequent in the Arctic, compared to other regions (Tjernström et al., 2019; Wang et al., 2022). For optically thick clouds whose COD is more than 10 OD units, the miss percentage is as small as 5 %. In summary, the CCI cloud mask shows cloudy for 90 % of the cases when the ground-based COD ≥3 OD units.
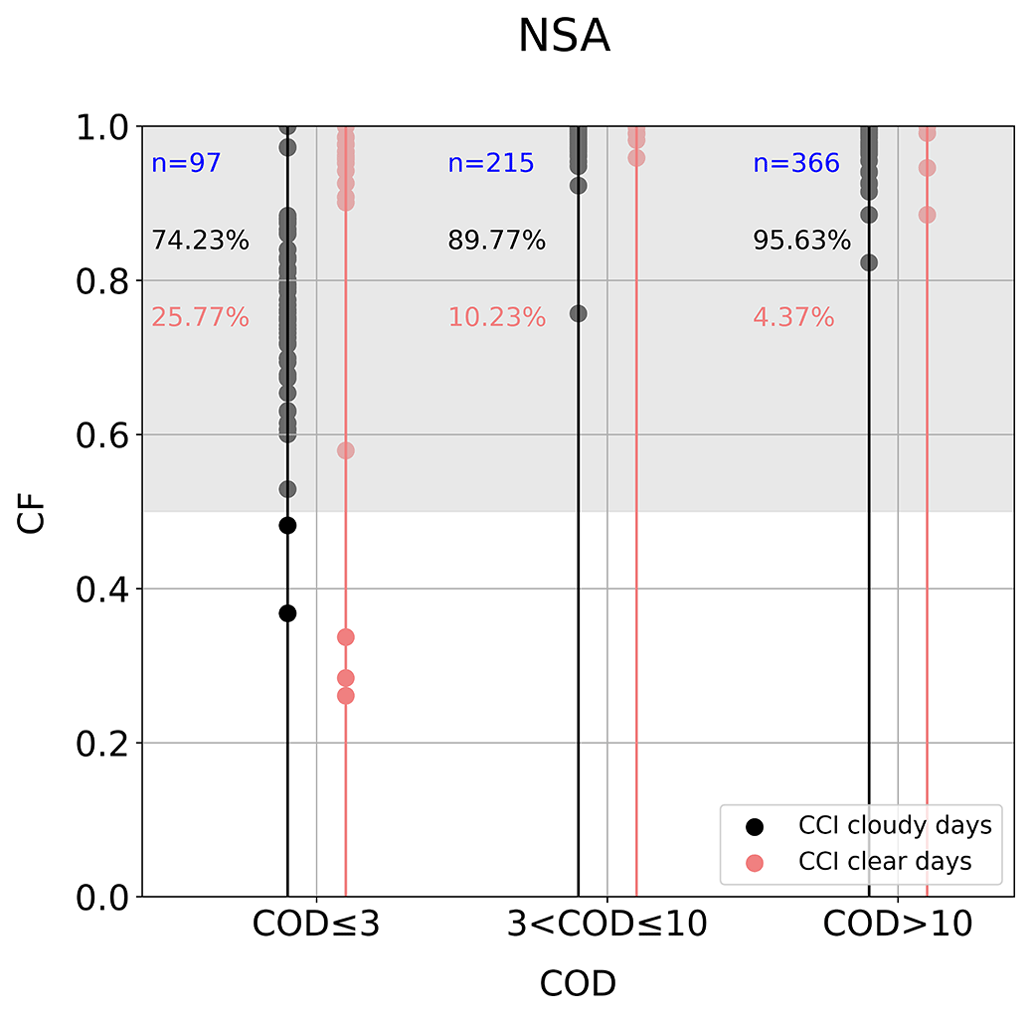
Figure 2NSA cloud fraction (CF) vs. NSA cloud optical depth (COD) for different COD ranges for the cloudy (black) and clear sky (red) stratified by Cloud_CCI measurements at NSA during the daytime in the period 2010–2018. The shaded grey region is the acceptance range, i.e., the range used to analyze the Cloud_CCI cloud mask accuracy. The value of “n” represents the number of samples in the shaded region for that particular COD range. The percentage values written on the plot correspond to the hit (black) and miss percentages (red). More information is found in the text.
4.2 Cloud optical thickness and liquid water path
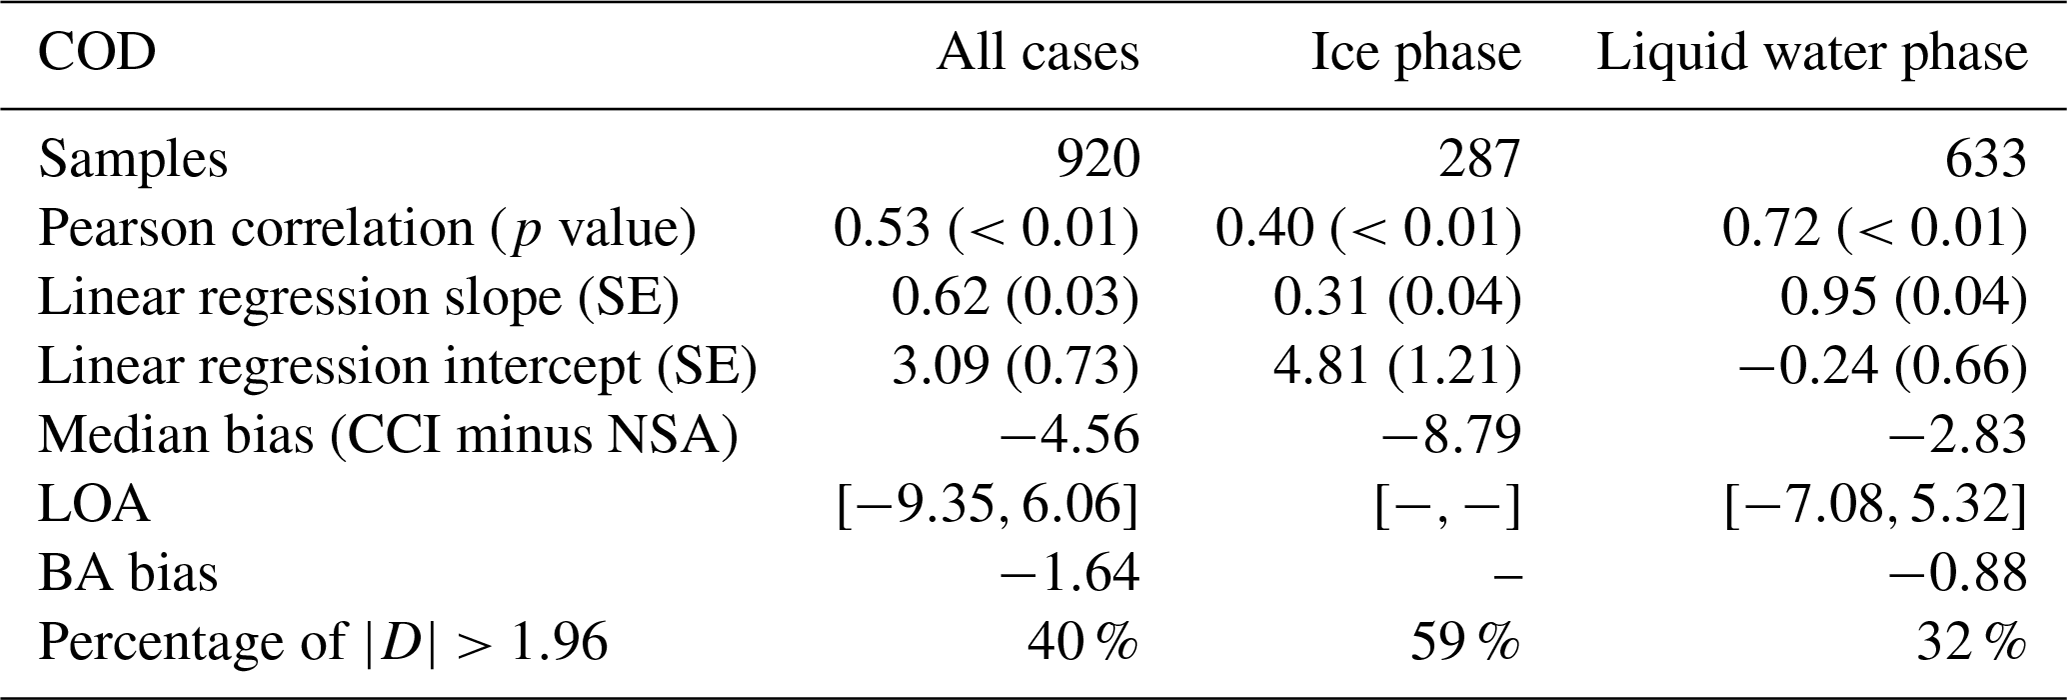
The validation of Cloud_CCI COD is performed for daytime cases at NSA (ground-based COD is only available at NSA) because the retrieved COD from the instruments uses visible channels. Cloud_CCI COD is classified as either liquid water or ice, as explained in the Cloud_CCI data product. The statistical analysis (i.e., the determination of regression coefficients and BA biases) of the comparison of COD is calculated for the three possible types of COD: all types (liquid water phase + ice phase), the ice phase, and the liquid water phase. Figure 3 shows the regression lines and BA biases for all types and liquid-water-phase types because scale independence is not observed for the ice-phase type. From Fig. 3 and Table 1, it can be seen that the COD retrieved by Cloud_CCI for the liquid-water-phase clouds shows a better agreement compared to the NSA measurements than for the ice-phase clouds. The regression coefficients are improved significantly when only liquid-water-phase clouds are considered, i.e., when the regression line for the liquid-water-phase clouds is closer to the 1:1 line. The Cloud_CCI COD product underestimates the COD: by a bias of 3 OD units for water-phase clouds and 9 OD units for ice-phase clouds. In general, liquid water clouds whose COD is less than 30 OD units are closer to the 1 : 1 line, and for ice-phase clouds, the Cloud_CCI COD values are much lower than the NSA measurement values (red color points below the 1 : 1 line). In summary, the Cloud_CCI product underestimates COD by around 5 OD units. There is no scale dependence for COD observed for the liquid-water-phase clouds. The BA bias for liquid-water-phase clouds is close to 0 (−0.88) and becomes almost twice that magnitude (−1.64) with the inclusion of ice-phase clouds (i.e., the all-case scenario). The LOA for the liquid water clouds is also closer to the ideal range (the shaded region) and becomes wider when augmented with the ice-phase clouds. The percentage of cases outside the ideal bias range is also better for liquid-water-phase clouds than ice-phase clouds. In the all-case type, 40 % of the measurements lie outside the ideal range, and most of these are due to the ice-phase clouds below 30 OD units where an underestimation by Cloud_CCI is clearly visible. This value is reduced to 32 % when only liquid-water-phase clouds are considered.
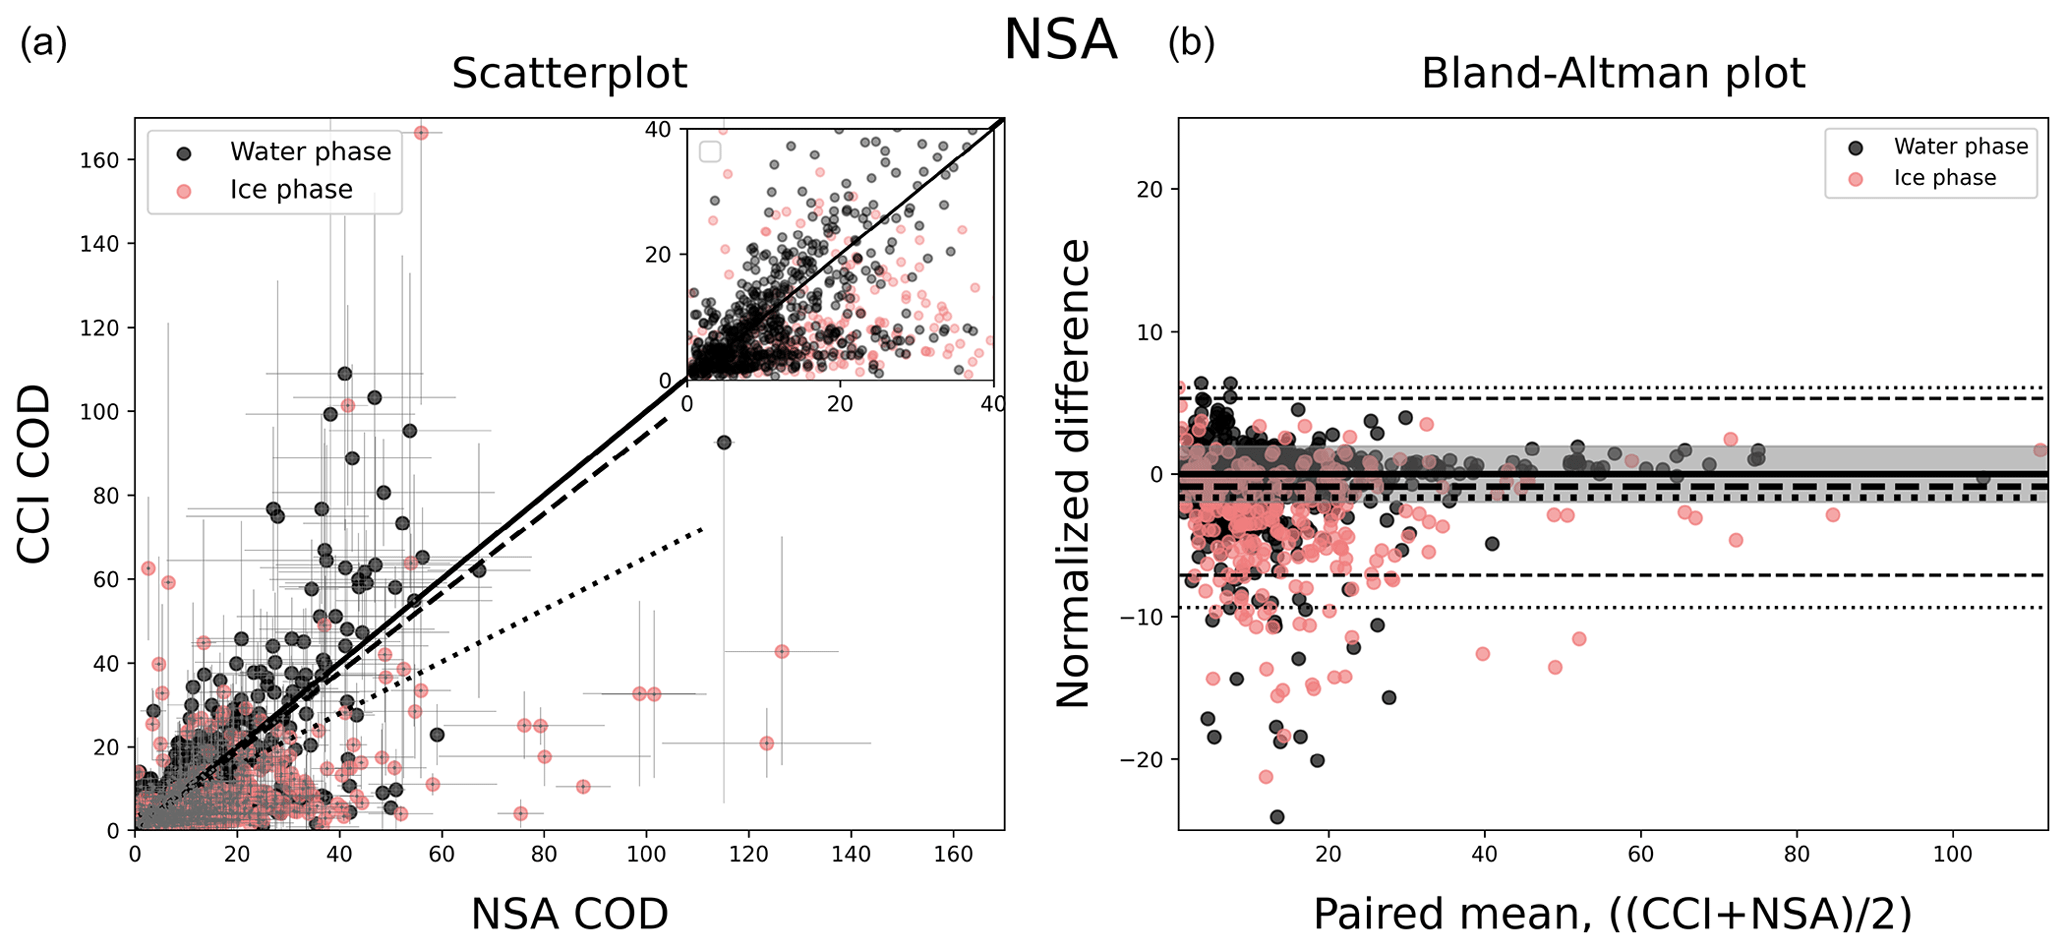
Figure 3(a) Ground-based COD vs. Cloud_CCI COD daytime data products plotted for the period 2010 to 2018 at NSA. The data points are classified by liquid water (black) and ice (red) phases as given by the Cloud_CCI cloud product. The thick black line is the 1:1 line. The regression lines for the liquid-water-phase cases (dashed) and for all cases (liquid water + ice; dotted) are shown as well. The error bars represent the standard deviation in the 5 min averaging period of the ground-based measurements and the Cloud_CCI pixel uncertainty. The zoomed-in plot represents the samples below 40 units. (b) Bland–Altman plot showing the paired mean vs. the normalized difference for the liquid-water-phase cases (black dots) and for ice cases (red dots). The thick dashed line indicates the BA bias for the liquid cases with the thin dashed lines indicating the corresponding limits of agreement (LOAs). Correspondingly, the dotted lines indicate the results including all cases (liquid water + ice). The shaded area indicates the assumed ideal range. Table 1 lists the corresponding statistics.
Table 1Statistics related to Fig. 3, NSA vs. Cloud_CCI COD data for all cases (liquid water + ice), the ice phase, and the liquid water phase for the period 2010–2018. SE represents the standard error. LOA and BA bias represent the limit of agreement and Bland–Altman bias, respectively, as calculated from Eqs. (4) and (5), respectively. The last row represents the percentage of values outside the assumed ideal range.
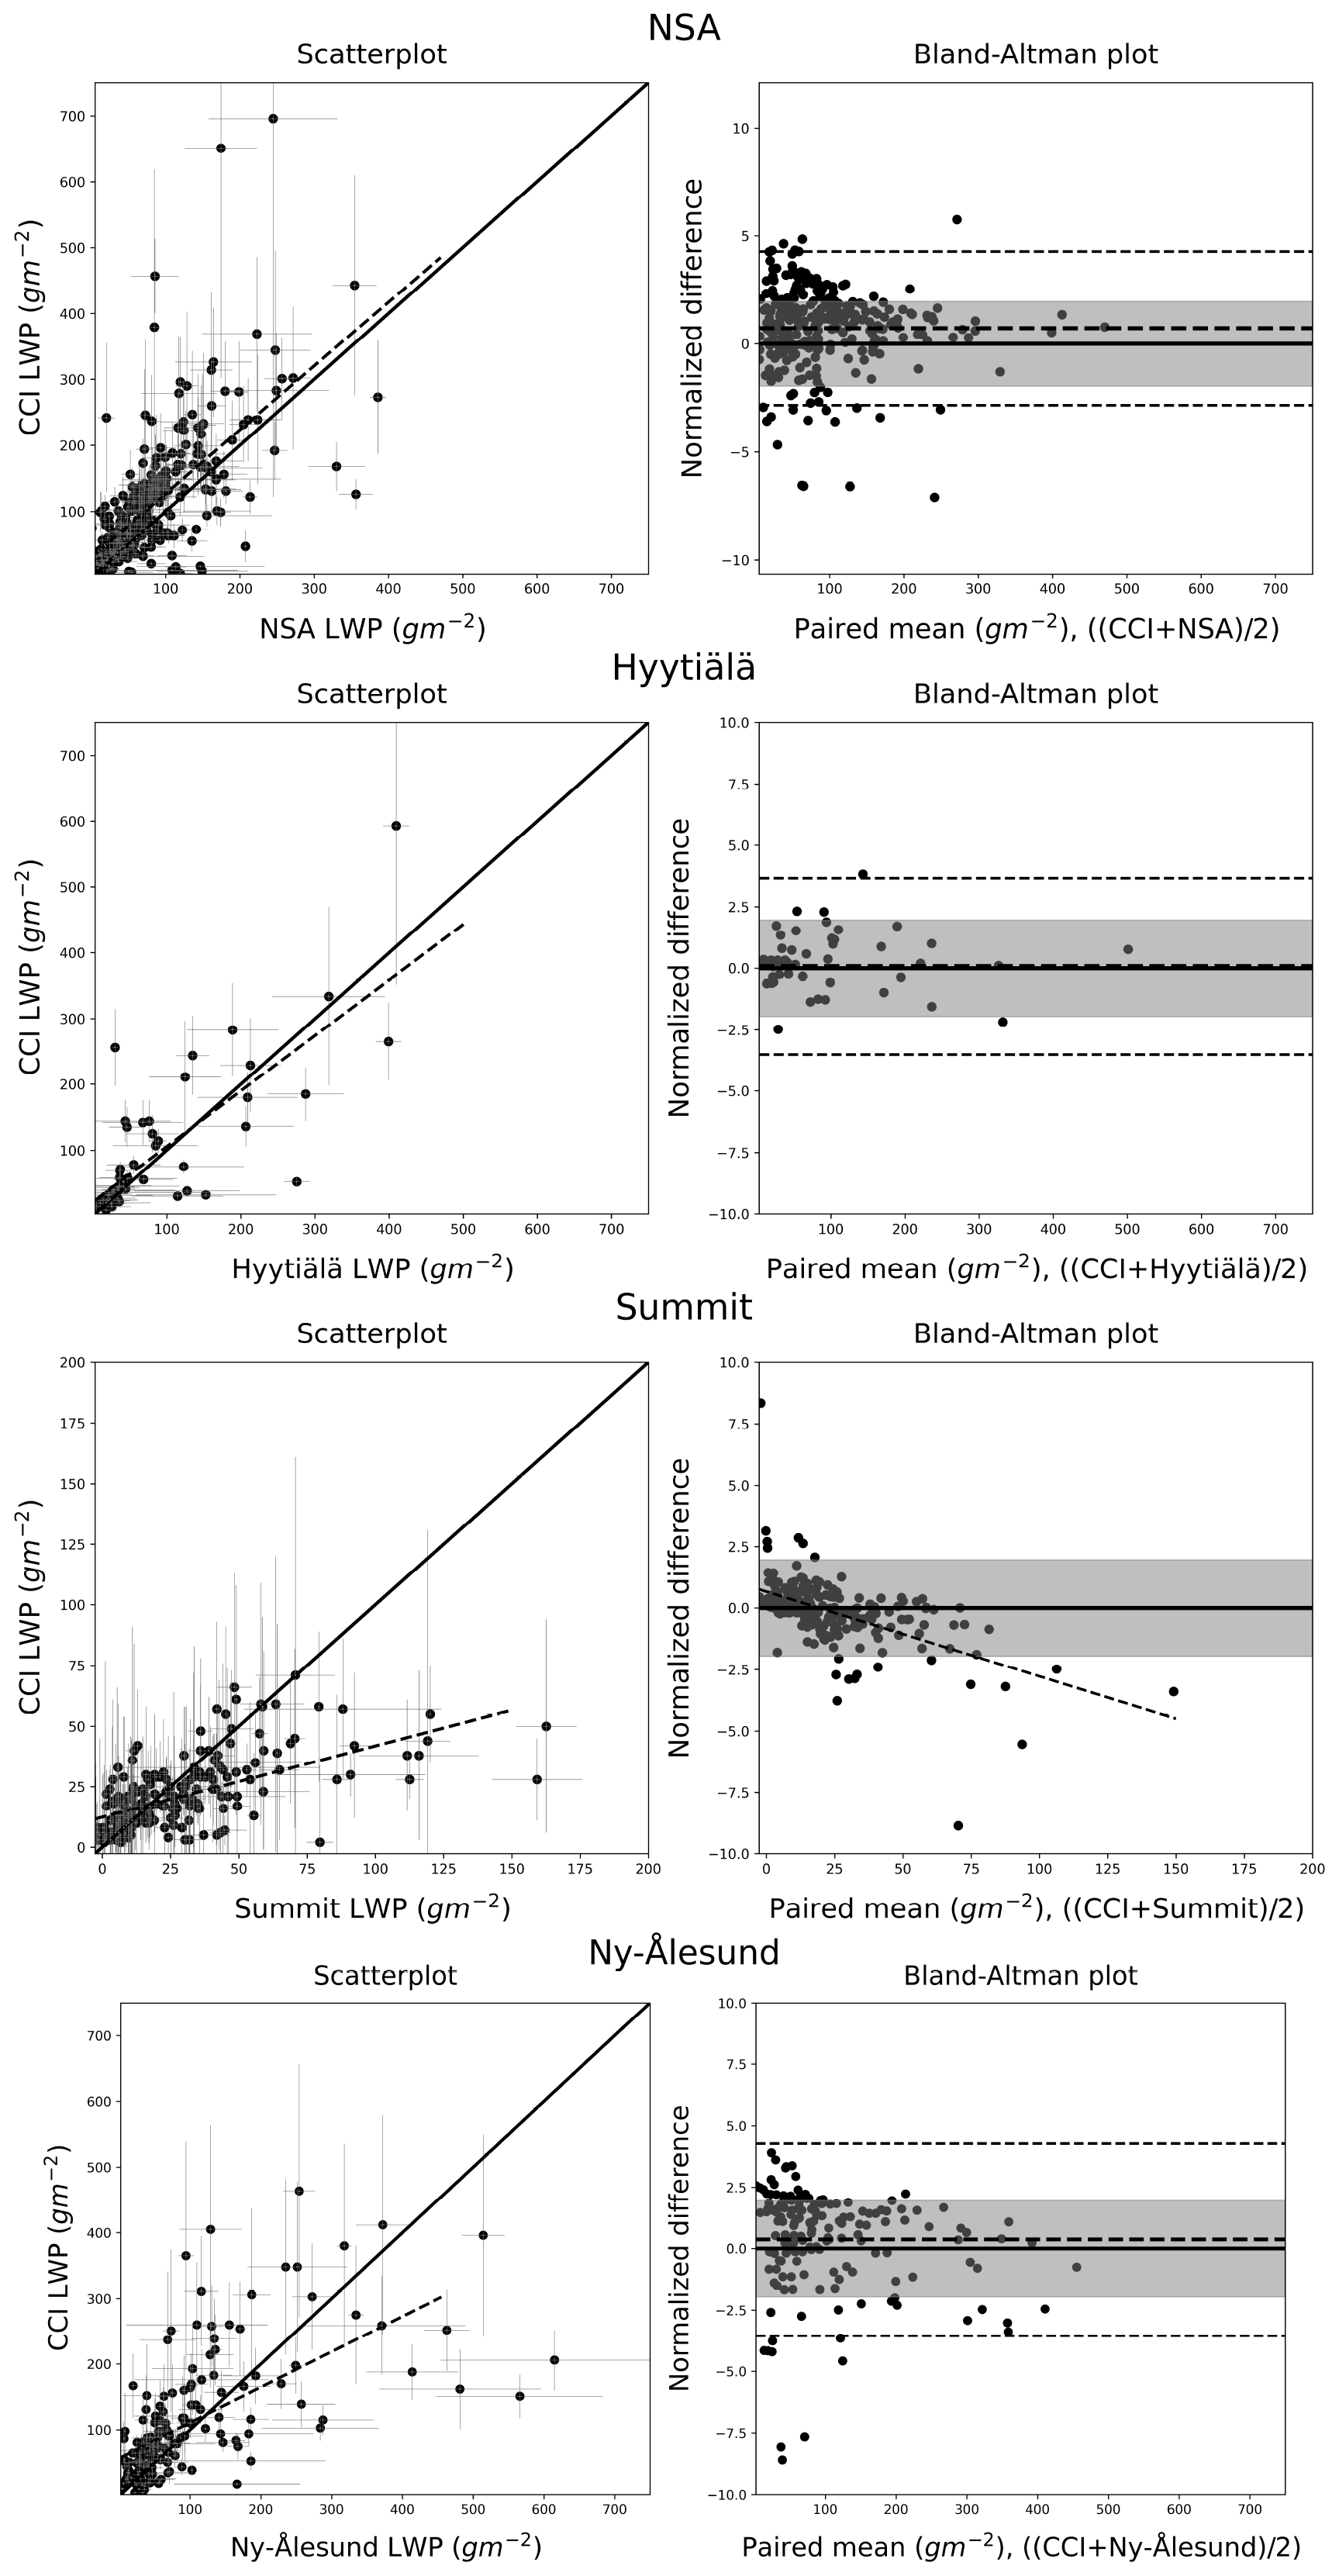
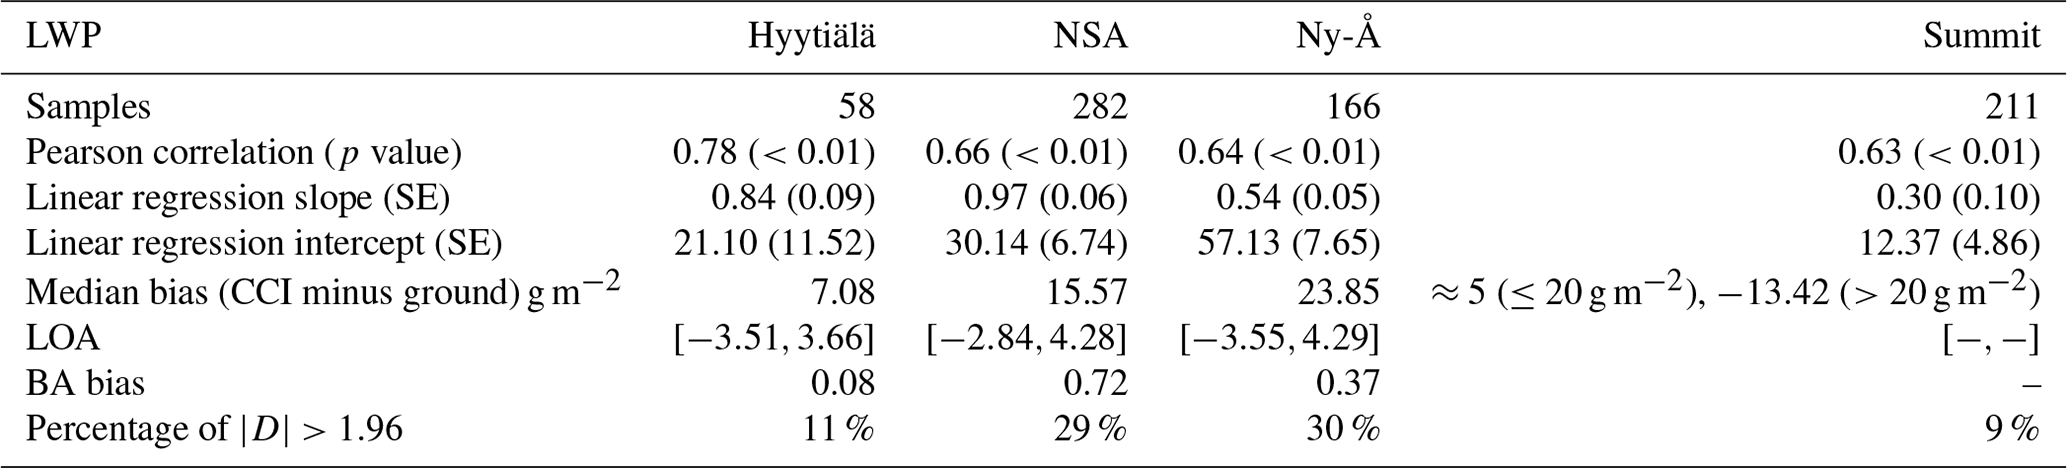
LWP is further analyzed when the cloud phase is liquid according to the Cloud_CCI product. Figure 4 and Table 2 show that Cloud_CCI generally overestimates the LWP when compared with the ground-based radiometer measurements. The LWP comparison for Hyytiälä, NSA, and Ny-Å reveals similar results: for Hyytiälä and NSA, LWP is overestimated by 7 and 16 g m−2, respectively (bearing in mind the number of samples over Hyytiälä is quite small). At Ny-Å, LWP is overestimated by about 24 g m−2. The comparison statistics for the measurements made at Hyytiälä are generally better than those at other sites. The overestimation of LWP is most probably due to the uncertainty in the CER retrievals. The CER, especially in the Arctic, is not necessarily constant with respect to altitude within the cloud. The inhomogeneity of the CER cannot be accounted for in the retrieval. The LWP statistics for Summit are inferior to those at the other three sites. As expected (see, for instance, Bennartz et al., 2013), very low values of LWP are observed over the Greenland ice shield. Unlike the other three sites, a scale-dependent bias is observed approximately at about 20 g m−2, which can be observed from the BA plot (where the regression line intersects the zero line). Thus, the median biases are calculated for pixels when LWP is ≤20 g m−2 and for LWP >20 g m−2. At LWP values ≤20 g m−2, we observe an overestimation of ≈5 g m−2 in the Cloud_CCI data, whereas for LWP >20 g m−2, there is a negative bias i.e., underestimation of about 13 g m−2, which, according to the BA plot, is strongly driven by the lower range of LWP values (20 g m g m−2). Because of this scale dependence, LOAs and BA biases are not calculated for Summit. Scale independence was observed over Hyytiälä, NSA, and Ny-Å, leading to the consideration of BA bias and LOAs. These LOAs are much closer to the defined ideal range where the BA bias is less than 1. The percentage of points outside the ideal range is also small for all the sites i.e., 11 % for Hyytiälä, 29 % for NSA, 30 % for Ny-Å, and 9 % for Summit. In previous studies (Sporre et al., 2016), the LWP determined from passive satellite-based remote sensing depends on the solar zenith angle (SZA) and larger biases are observed at higher SZAs. For the Cloud_CCI LWP data product, there is no sign of change in statistics when separating the days based on SZA (not shown). The biases observed at all the sites are smaller than the uncertainty in the ground-based LWP retrievals.
4.3 Cloud top height
The comparison is separated into single-layer and multi-layer conditions using the lidar–radar classification. A single-layer cloud is defined when the ground-based instruments showed only one cloud layer throughout the averaged 5 min interval. Similarly, if two or more cloud layers are observed, the scene is defined as a multi-layer cloud. For Ny-Å, multi-layer clouds are assumed if at least two vertical bins (i.e., 40 m) are cloud-free between the cloud layers, while for the other sites one bin (i.e., 45 m) is at least cloud-free between the cloud layers. Figure 5 shows the scatterplots and BA plots for the CTH data. The statistics (Tables 3 and 4) are calculated separately for all cloud types, defined as (i) the sum of single- and multi-layer clouds and (ii) single-layer clouds. The regression line for all cloud types is much closer to the 1:1 line for Hyytiälä (slope =0.87) than those for NSA (0.68), Ny-Å (0.64), and Summit (0.32). The CTH values for the single-layer clouds are in better agreement with the ground-based measurements than those for the multi-layer clouds. In general, the single-layer CTH is overestimated at all sites. When single-layer clouds are combined with multi-layer clouds, i.e., all cloud types, the Cloud_CCI CTH underestimates the ground-based CTH, implying an underestimation of the CTH of multi-layer clouds. This overestimation for single-layer clouds and underestimation for multi-layer clouds is similar for all sites except for Summit where the underestimation of CTH for multi-layer clouds is not so large. In brief, the overestimation for the single-layer CTHs at Hyytiälä, NSA, and Ny-Å are ≈240 m, ≈197 m, and ≈187 m, respectively, while CTHs of all clouds are underestimated by ≈180, ≈208, and ≈172 m at Hyytiälä, NSA, and Ny-Å, respectively (Tables 3 and 4). This difference between the overestimation of single-layer CTH and underestimation of all-cloud CTH over Hyytiälä, NSA, and Ny-Å is around 420, 405, and 360 m, respectively. This suggests that the presence of multi-layer clouds adds an underestimation by about 360–420 m in the Cloud_CCI CTH retrievals. We attribute this underestimation of the CTH of multi-layer clouds to the reduced sensitivity of the passive spaceborne instruments to detect high-altitude thin clouds, which are often comprised of ice. A thick cloud deck underneath thin high-altitude clouds will contribute significantly to the observed radiance at the top of the atmosphere. Similarly to the analyses of the LWP, the analysis of the CTH data from the Summit station (located at ca. 3.2 km a.m.s.l.) showed different statistics and high retrieval uncertainties for the Cloud_CCI CTH as compared to the values at other stations (Table 4). Over Summit, scale-dependent bias is observed with an overestimation of CTH values below 5000 m and an underestimation above 5000 m (derived from the intersection of the regression line with the zero line in the BA plot). This led us to report the median biases for these two separate cases. For clouds whose CTH is below 5000 m over the Summit, the overestimation of CTH for single-layer clouds is around 380 m. In contrast to the other sites, no distinct underestimation of the multi-layer CTH is observed over Summit. For CTH values above 5000 m, CTH is largely underestimated by Cloud_CCI, i.e., by 1100 m for single-layer clouds and by 1371 m for all cloud types (single- and multi-layer clouds).
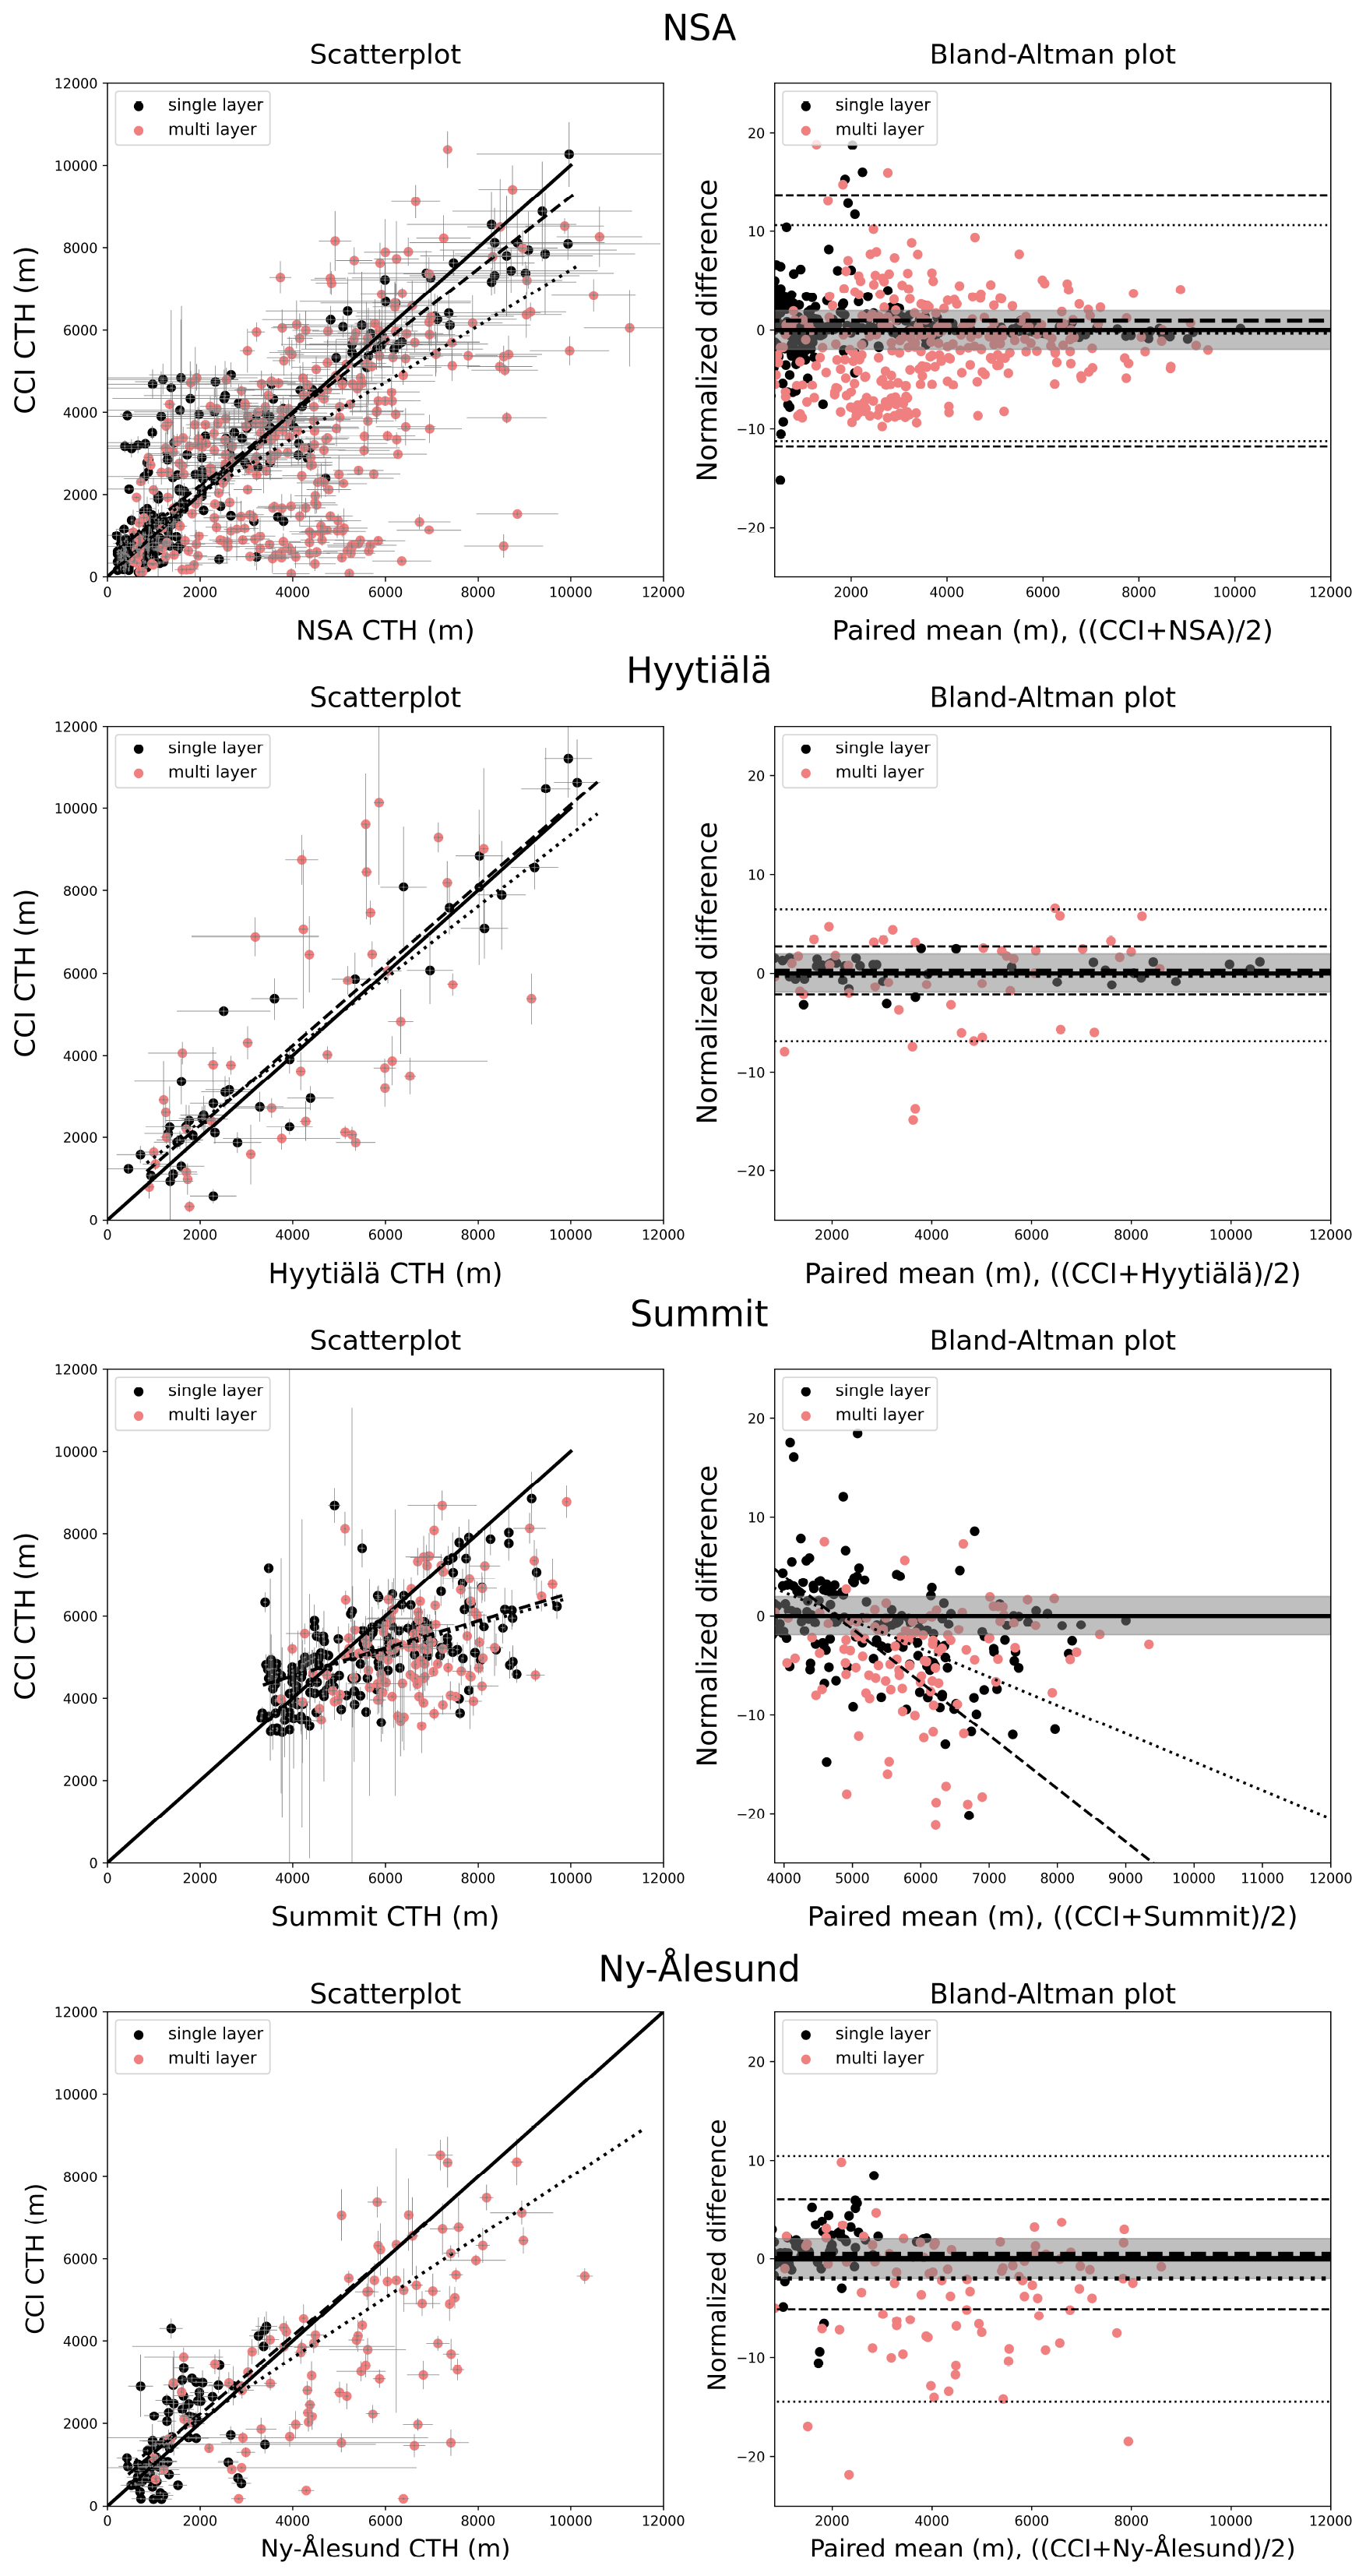
Figure 5Similar to Fig. 3 but for CTH over Hyytiälä (2014), NSA (2012–2016), Ny-Å (2016–2018), and Summit (2010–2014). Tables 3 and 4 list the corresponding statistics. The data points are classified by single-layer (black) and multi-layer (red) clouds as identified from the ground-based observations. Left: the regression lines for the single-layer cloud cases (dashed) and for all cloud cases (single- and multi-layer; dotted) are shown as well. Right: the BA bias and limits of agreement (LOAs) are shown for single-layer cloud cases (dashed) and all cloud cases (dotted). Note that the dashed (dotted) line in the BA plot for Summit represents the regression line for single-layer cloud (all cloud) cases instead.
Table 3Statistics as in Table 1 but related to Fig. 5 showing ground-based vs. Cloud_CCI CTH data over Hyytiälä (2014) and NSA (2012–2016).
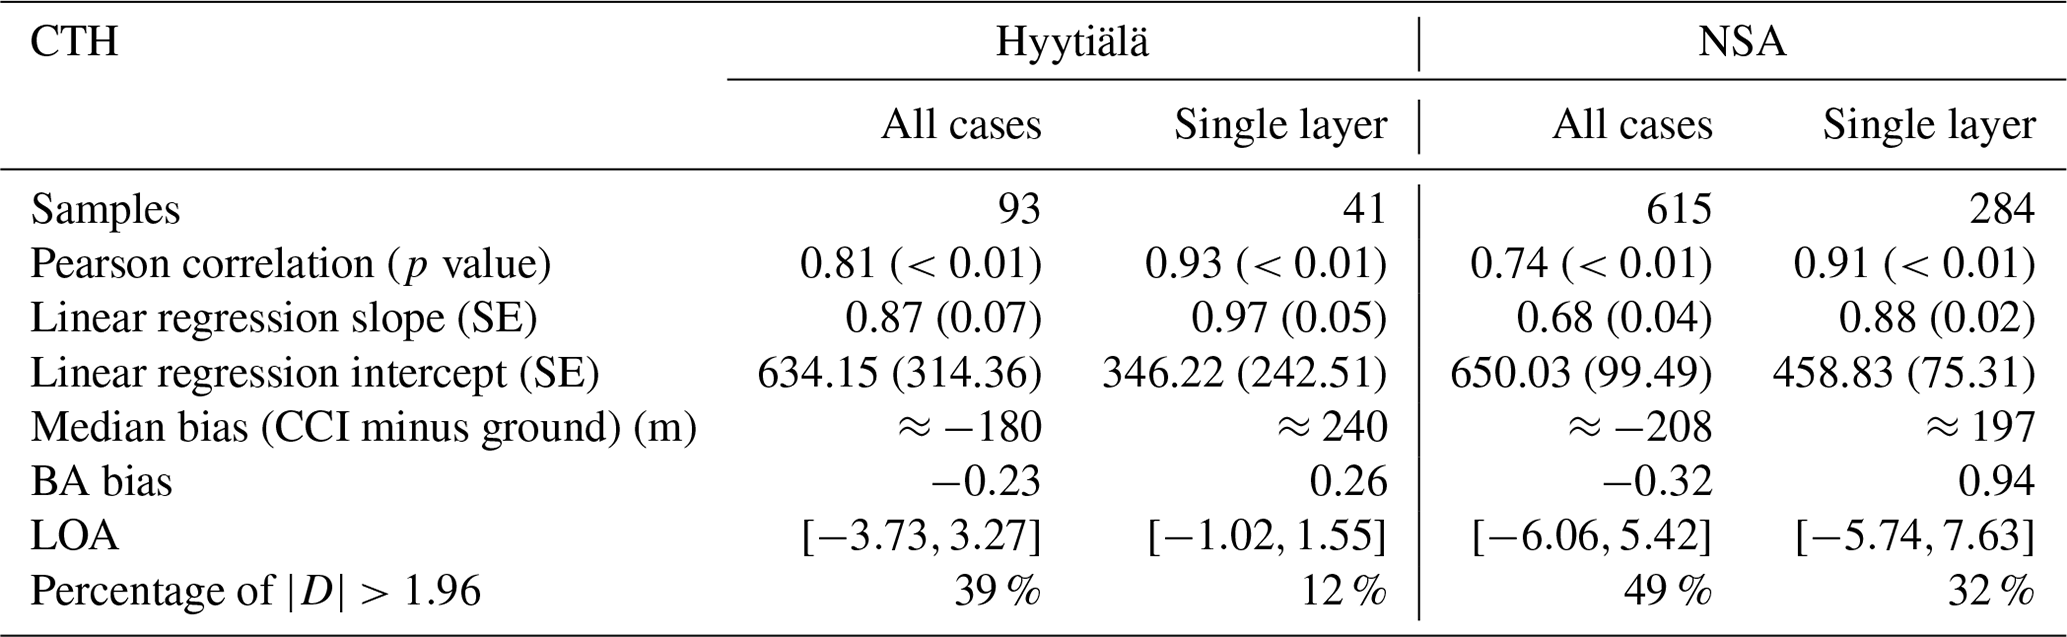
Table 4Statistics as in Table 1 but related to Fig. 5 showing ground-based vs. Cloud_CCI CTH data over Ny-Å (2016–2018) and Summit (2010–2014).
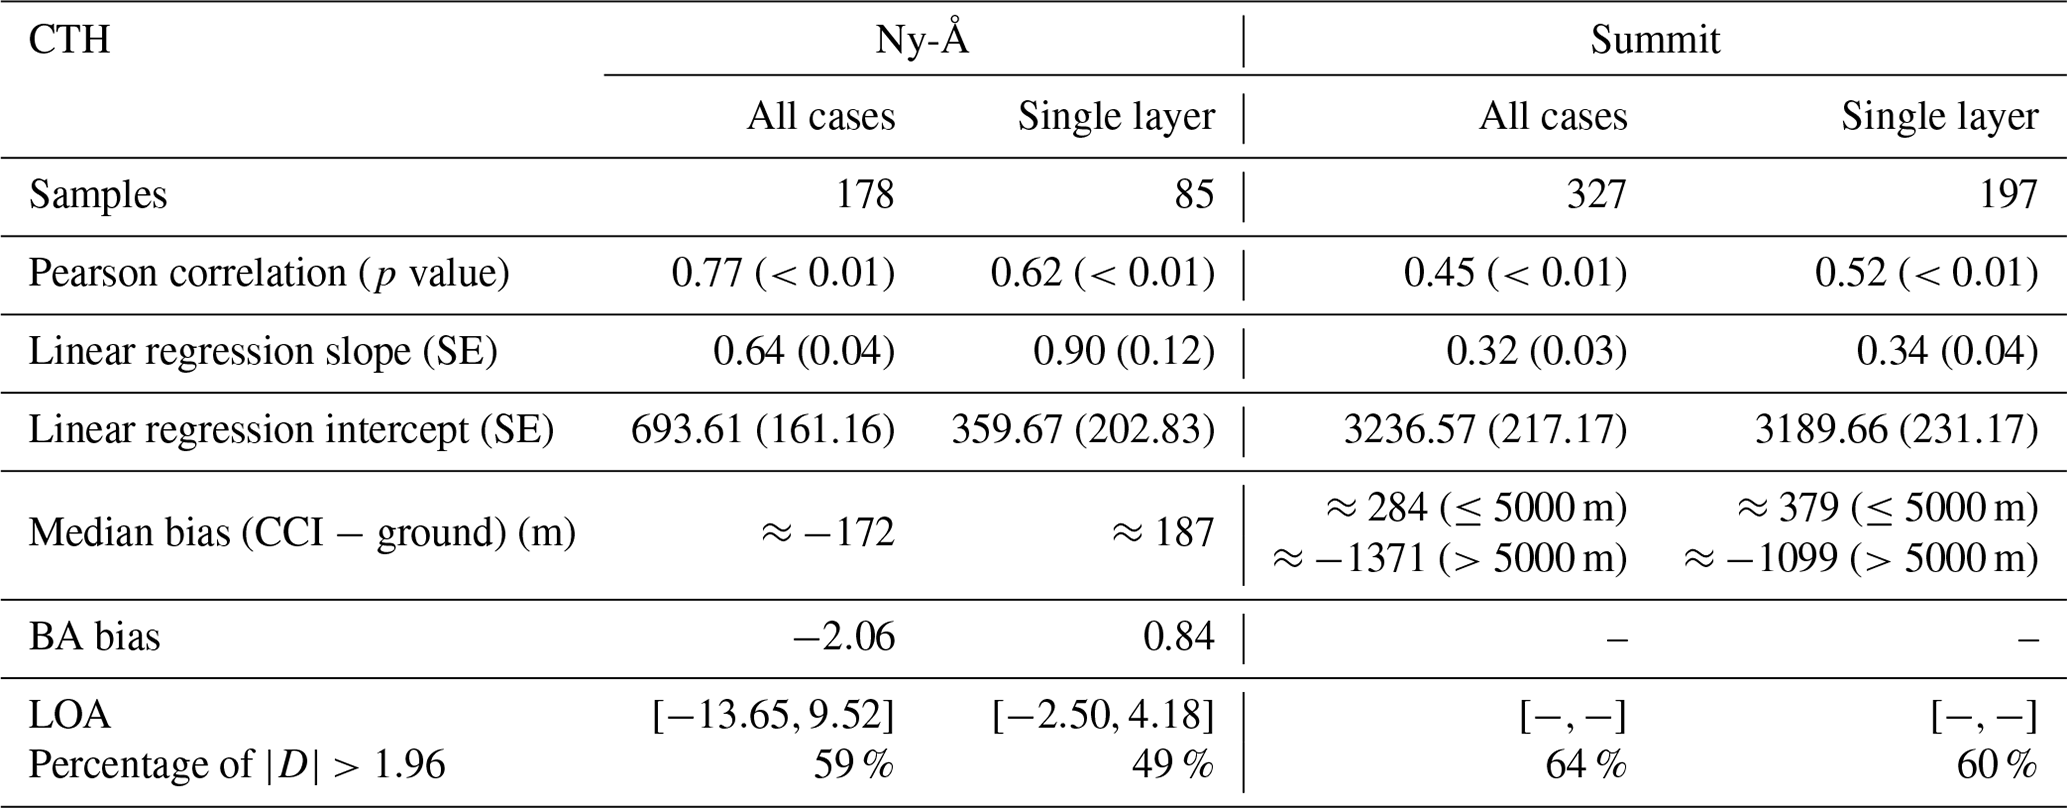
From the BA plots over Hyytiälä, NSA, and Ny-Å, no observable scale-dependent bias for the CTH retrievals is noticed, leading to a meaningful LOA. The LOA over Hyytiälä is much closer to the defined acceptable range and within the defined acceptable range for single-layer CTHs. Compared to Hyytiälä, over NSA and Ny-Å, the LOA is wider for both considered types, i.e., all-cloud CTHs and single-layer CTHs, indicating more significant differences between satellite and ground-based CTH values. These differences are clearly identifiable in the BA plot, where 32 % of such cases fall outside the defined acceptable range for single-layer clouds (Table 3). The number of cases falling outside the defined acceptable range for single-layer clouds is 12 % over Hyytiälä. In contrast, for multi-layer clouds, the samples outside the defined acceptable range are about 40 %, 50 %, and 60 % over Hyytiälä, NSA, and Ny-Å, respectively. For Summit, a high number of values (>60 %) are outside the defined acceptable range, resulting from many CTH values that are underestimated. The BA bias and LOA are not calculated for Summit since they showed scale dependence.
Previous studies from Holz et al. (2008) and Sporre et al. (2016) for MODIS and VIIRS satellite retrievals observed similar patterns of overestimation of CTH for the single-layer clouds and underestimation for multi-layer clouds. These studies did not include high-Arctic sites such as NSA and Summit. The plausible reason reported in those studies is the differences in the cloud optical thicknesses between different cloud layers, which then influence the accuracy of the multi-layer CTH retrievals.
The Climate Change Initiative (CCI) global cloud products (Cloud_CCI) are one of the publicly available climate data records. Cloud_CCI makes use of the measurements from the AVHRR post meridiem (PM) dataset, which extends over more than 3 decades. To our knowledge, this is the first study to validate Cloud_CCI data products by comparison with measurements from ground-based instruments in the Arctic (>60∘ N) and one of few to validate satellite cloud products over the Arctic.
The comparisons of the Cloud_CCI and ground-based cloud data during the sunlit months, available for Hyytiälä, NSA, Ny-Å, and Summit, in most cases, showed high Pearson correlation coefficients (PCCs) ≥0.6, having a 99 % confidence level. The Cloud_CCI cloud mask indicates cloudy for more than 90 % of the time in the presence of optically thick clouds (COD >10), having CF >0.5 as indicated from ground-based observations. Of the clouds, 10 % are missed by Cloud_CCI for cases with COD in the range of 3 to 10. We conclude that the CCI cloud mask is reasonably well validated for optically thick clouds over NSA. Such clouds are found in the oceanic regions of the Arctic, such as the Barents Sea, Laptev Sea, Kara Sea, East Siberian Sea, and the Chukchi Sea, where optically dense clouds are present most of the time during the sunlit months (Kay et al., 2016; Huang et al., 2021). As a result of the warming Arctic, we expect cloud properties to change over time. We, therefore, need sufficiently accurate satellite cloud data records to detect these changes. To this end, we need to understand whether the differences between the satellite data and ground-based data are scale independent or scale dependent. Consequently, the Bland–Altman approach has been used in this study to investigate this issue. If the differences in the cloud properties between the satellite and ground-based data do not significantly increase/decrease with the value of the cloud property itself, they are assumed to be scale independent. The majority of the Cloud_CCI results have no scale biases when compared with the ground-based instruments, except for Summit. In general, the Cloud_CCI underestimates COD by 3 OD units for liquid-water-phase clouds. These results imply that the Cloud_CCI COD values when compared with the ground-based radiometers are expected to have differences ≤3 OD units over NSA and similar regions where liquid-water-phase cloud formation is more active during sunlit months (Gu et al., 2021). The overestimation of LWP at high-latitude sites, such as NSA and Ny-Å, is 2 to 3 times higher than at the low-latitude Arctic site Hyytiälä. At NSA, Ny-Å, and Hyytiälä, the Cloud_CCI CTH retrievals overestimate the single-layer cloud CTH but underestimate the CTH of multi-layer clouds. The comparison over Summit, Greenland, showed a different CTH behavior compared to the other three stations. At Summit, significant scale-dependent biases are observed in single-layer clouds and for all cloud types (single-layer + multi-layer). These issues of high CTH biases over Greenland and the effect of multi-layer clouds need to be taken into account when using the Cloud_CCI CTH data products to evaluate models and for other applications. In general, the AVHRR PM Cloud_CCI cloud data for LWP are within the ground-based instrument uncertainties, and Cloud_CCI CTH agrees within 500 m compared to the ground-based lidar–radar observations. There are some other exceptions, in particular for Summit, as discussed in the “Results and discussion” section. In particular, the Cloud_CCI data products at high altitudes in Greenland and multi-layer clouds are associated with larger errors.
We conclude that further studies are needed comparing ground-based and satellite-borne measurements, not only to extend this study in terms of temporal and spatial coverage but also to investigate further the applicability of passive space-based remote sensing instruments for cloud retrievals in the Arctic.
Cloud_CCI data sets until 2016 are available through this DOI: https://doi.org/10.5676/DWD/ESA_Cloud_cci/AVHRR-PM/V003 (Stengel et al., 2019). Using the same input data and retrieval systems, the Cloud_CCI data for the year 2017 were made available by Martin Stengel upon personal request. Data from NSA (https://doi.org/10.5439/1395157, Riihimaki, 1995; https://doi.org/10.5439/1228769, Johnson and Jensen, 2011, and https://doi.org/10.5439/1027369, Zhang, 1996) and Hyytiälä (https://doi.org/10.5439/1025248, Cadeddu et al., 2011 and https://doi.org/10.5439/1393438, Johnson et al., 2020) were obtained from the Atmospheric Radiation Measurement (ARM) user facility, a US Department of Energy (DOE) Office of Science user facility managed by the Biological and Environmental Research Program. Data from the ICECAPS project at Summit are available via the Arctic Data Center (https://doi.org/10.18739/A2348GH4Z, Von Walden et al., 2010). Ny-Å measurements are taken from the AWIPEV Atmosphere Observatory (https://doi.org/10.1594/PANGAEA.902183, Nomokonova et al., 2019b). The validation code is based on Python and is available on request. The Bland–Altman analysis is done using Kirk Knobelspiesse's GitHub project (https://github.com/knobelsp/BlandAltman/, Knobelspiesse, 2021).
KSV and MV conceptualized the study. KSV did the analysis for the validation and wrote the manuscript with contributions from the co-authors. LL and MV suggested the Bland–Altman method. MS contributed to the Cloud_CCI data. MDS contributed to the Summit data record. KE contributed to the Ny-Å data record. JPB provided guidance for the work. All authors were involved in examining and reviewing the results. All authors were involved in editing the paper.
The contact author has declared that none of the authors has any competing interests.
Publisher’s note: Copernicus Publications remains neutral with regard to jurisdictional claims in published maps and institutional affiliations.
We gratefully acknowledge the funding by the Deutsche Forschungsgemeinschaft (DFG, German Research Foundation) – project no. 268020496 – TRR 172, within the Transregional Collaborative Research Center “ArctiC Amplification: Climate Relevant Atmospheric and SurfaCe Processes, and Feedback Mechanisms (AC)3”. The study has also in part been funded by the University of Bremen. Luca Lelli was partly funded by the Alexander von Humboldt Foundation via the Feodor Lynen Research Fellowship 2020. The contribution of Martin Stengel was supported by the European Space Agency (ESA) through the Cloud_cci project (contract no. 4000128637/20/I-NB). Data from NSA and Hyytiälä were obtained from the Atmospheric Radiation Measurement (ARM) user facility, a US Department of Energy (DOE) Office of Science user facility managed by the Biological and Environmental Research Program. Data from Summit were obtained from the ICECAPS project funded by the US National Science Foundation (grant nos. OPP-1801764, OPP-1801318, OPP-1801477). Matthew D. Shupe was supported by a Mercator Fellowship as part of (AC)3, the National Science Foundation (grant no. OPP-2137091), and NOAA (grant no. NA22OAR4320151). We also acknowledge Kirk Knobelspiesse (NASA GSFC) for the provision of statistical routines.
This research has been supported by the Deutsche Forschungsgemeinschaft (grant no. 268020496 – TRR 172).
The article processing charges for this open-access publication were covered by the University of Bremen.
This paper was edited by Alexander Kokhanovsky and reviewed by Abhay Devasthale and one anonymous referee.
Altman, D. G. and Bland, J. M.: Measurement in medicine: the analysis of method comparison studies, J. Roy. Stat. Soc. D-Stat., 32, 307–317, https://doi.org/10.2307/2987937, 1983. a, b
Barnard, J. C. and Long, C. N.: A simple empirical equation to calculate cloud optical thickness using shortwave broadband measurements, J. Appl. Meteorol., 43, 1057–1066, https://doi.org/10.1175/1520-0450(2004)043<1057:ASEETC>2.0.CO;2, 2004. a
Barnard, J. C., Long, C. N., Kassianov, E. I., McFarlane, S. A., Comstock, J. M., Freer, M., and McFarquhar, G.: Development and evaluation of a simple algorithm to find cloud optical depth with emphasis on thin ice clouds, The Open Atmospheric Science Journal, 2, 46–55, https://doi.org/10.2174/1874282300802010046, 2008. a, b, c
Bennartz, R., Shupe, M. D., Turner, D. D., Walden, V., Steffen, K., Cox, C. J., Kulie, M. S., Miller, N. B., and Pettersen, C.: July 2012 Greenland melt extent enhanced by low-level liquid clouds, Nature, 496, 83–86, https://doi.org/10.1038/nature12002, 2013. a
Berendes, T. A., Berendes, D. A., Welch, R. M., Dutton, E. G., Uttal, T., and Clothiaux, E. E.: Cloud cover comparisons of the MODIS daytime cloud mask with surface instruments at the North Slope of Alaska ARM site, IEEE T. Geosci. Remote, 42, 2584–2593, https://doi.org/10.1109/TGRS.2004.835226, 2004. a
Bland, J. M. and Altman, D.: Statistical methods for assessing agreement between two methods of clinical measurement, The Lancet, 327, 307–310, https://doi.org/10.1016/S0140-6736(86)90837-8, 1986. a, b
Boccolari, M. and Parmiggiani, F.: Trends and variability of cloud fraction cover in the Arctic, 1982–2009, Theor. Appl. Climatol., 132, 739–749, https://doi.org/10.1007/s00704-017-2125-6, 2018. a
Cadeddu, M.: Microwave Radiometer–3-Channel (MWR3C) Instrument Handbook, ARM Technical Report DOE/SC-ARM-TR-108, DOE Office of Science Atmospheric Radiation Measurement (ARM) Program, https://doi.org/10.2172/1039668, 2021. a, b, c
Cadeddu, M. P., Turner, D. D., and Liljegren, J. C.: A neural network for real-time retrievals of PWV and LWP from Arctic millimeter-wave ground-based observations, IEEE T. Geosci. Remote, 47, 1887–1900, https://doi.org/10.1109/TGRS.2009.2013205, 2009. a, b
Cadeddu, M., Gibler, G., and Koontz, A.: Microwave Radiometer, 3 Channel (MWR3C), Atmospheric Radiation Measurement (ARM) User Facility [data set], https://doi.org/10.5439/1025248, 2011. a
Clothiaux, E. E., Ackerman, T. P., Mace, G. G., Moran, K. P., Marchand, R. T., Miller, M. A., and Martner, B. E.: Objective determination of cloud heights and radar reflectivities using a combination of active remote sensors at the ARM CART sites, J. Appl. Meteorol., 39, 645–665, https://doi.org/10.1175/1520-0450(2000)039<0645:ODOCHA>2.0.CO;2, 2000. a
Clothiaux, E. E., Miller, M. A., Perez, R. C., Turner, D. D., Moran, K. P., Martner, B. E., Ackerman, T. P., Mace, G. G., Marchand, R. T., Widener, K. B., Rodriguez, D. J., Uttal, T., Mather, J. H., Flynn, C. J., Gaustad, K. L., and Ermold, B.: The ARM millimeter wave cloud radars (MMCRs) and the active remote sensing of clouds (ARSCL) value added product (VAP), DOE Office of Science Atmospheric Radiation Measurement (ARM) user facility, Tech. Rep. No. DOE/SC-ARM/VAP-002.1, https://doi.org/10.2172/1808567, 2001. a, b, c
Compernolle, S., Argyrouli, A., Lutz, R., Sneep, M., Lambert, J.-C., Fjæraa, A. M., Hubert, D., Keppens, A., Loyola, D., O'Connor, E., Romahn, F., Stammes, P., Verhoelst, T., and Wang, P.: Validation of the Sentinel-5 Precursor TROPOMI cloud data with Cloudnet, Aura OMI O2–O2, MODIS, and Suomi-NPP VIIRS, Atmos. Meas. Tech., 14, 2451–2476, https://doi.org/10.5194/amt-14-2451-2021, 2021. a
Dee, D. P., Uppala, S. M., Simmons, A. J., Berrisford, P., Poli, P., Kobayashi, S., Andrae, U., Balmaseda, M., Balsamo, G., Bauer, P., Bechtold, P., Beljaars, A. C. M., van de Berg, L., Bidlot, J., Bormann, N., Delsol, C., Dragani, R., Fuentes, M., Geer, A. J., Haimberger, L., Healy, S. B., Hersbach, H., Hólm, E. V., Isaksen, L., Kållberg, P., Köhler, M., Matricardi, M., McNally, A. P., Monge-Sanz, B. M., Morcrette, J. J., Park, B. K., Peubey, C., de Rosnay, P., Tavolato, C., Thépaut, J. N., and Vitart, F.: The ERA-Interim reanalysis: Configuration and performance of the data assimilation system, Q. J. Roy. Meteor. Soc., 137, 553–597, https://doi.org/10.1002/qj.828, 2011. a
Devasthale, A., Sedlar, J., Tjernström, M., and Kokhanovsky, A.: A Climatological Overview of Arctic Clouds, in: Physics and Chemistry of the Arctic Atmosphere, Springer, 331–360, https://doi.org/10.1007/978-3-030-33566-3_5, 2020. a, b
Dybbroe, A., Karlsson, K.-G., and Thoss, A.: NWCSAF AVHRR cloud detection and analysis using dynamic thresholds and radiative transfer modeling. Part II: Tuning and validation, J. Appl. Meteorol., 44, 55–71, https://doi.org/10.1175/JAM-2188.1, 2005. a
Edel, L., Rysman, J.-F., Claud, C., Palerme, C., and Genthon, C.: Potential of passive microwave around 183 GHz for snowfall detection in the Arctic, Remote Sens., 11, 2200, https://doi.org/10.3390/rs11192200, 2019. a
Fu, Q.: An accurate parameterization of the solar radiative properties of cirrus clouds for climate models, J. Climate, 9, 2058–2082, https://doi.org/10.1175/1520-0442(1996)009<2058:AAPOTS>2.0.CO;2, 1996. a
Gaustad, K. L., Turner, D. D., and McFarlane, S. A.: MWRRET Value-Added Product: The Retrieval of Liquid Water Path and Precipitable Water Vapor from Microwave Radiometer (MWR) Data Sets (Revision 2), U.S. Department of Energy, Office of Science, Office of Biological and Environmental Research, Atmospheric Radiation Measurement Facility, Tech. Rep. No. DOE/SC-ARM/TR-081.2, 10 pp., DOE Office of Science Atmospheric Radiation Measurement (ARM) Program, https://doi.org/10.2172/1019284, 2011. a
Gu, M., Wang, Z., Wei, J., and Yu, X.: An assessment of Arctic cloud water paths in atmospheric reanalyses, Acta Oceanol. Sin., 40, 46–57, https://doi.org/10.1007/s13131-021-1706-5, 2021. a
He, M., Hu, Y., Chen, N., Wang, D., Huang, J., and Stamnes, K.: High cloud coverage over melted areas dominates the impact of clouds on the albedo feedback in the Arctic, Sci. Rep., 9, 9529, https://doi.org/10.1038/s41598-019-44155-w, 2019. a
Heymsfield, A. J., Miloshevich, L. M., Slingo, A., Sassen, K., and Starr, D. O.: An observational and theoretical study of highly supercooled altocumulus, J. Atmos. Sci., 48, 923–945, https://doi.org/10.1175/1520-0469(1991)048<0923:AOATSO>2.0.CO;2, 1991. a
Holz, R., Ackerman, S., Nagle, F., Frey, R., Dutcher, S., Kuehn, R., Vaughan, M., and Baum, B.: Global Moderate Resolution Imaging Spectroradiometer (MODIS) cloud detection and height evaluation using CALIOP, J. Geophys. Res.-Atmos., 113, D00A19, https://doi.org/10.1029/2008JD009837, 2008. a
Huang, Y., Ding, Q., Dong, X., Xi, B., and Baxter, I.: Summertime low clouds mediate the impact of the large-scale circulation on Arctic sea ice, Communications Earth & Environment, 2, 1–10, https://doi.org/10.1038/s43247-021-00114-w, 2021. a, b
Illingworth, A. J., Hogan, R. J., O'Connor, E., Bouniol, D., Brooks, M. E., Delanoé, J., Donovan, D. P., Eastment, J. D., Gaussiat, N., Goddard, J. W. F., Haeffelin, M., Baltink, H. K., Krasnov, O. A., Pelon, J., Piriou, J.-M., Protat, A., Russchenberg, H. W. J., Seifert, A., Tompkins, A. M., van Zadelhoff, G.-J., Vinit, F., Willén, U., Wilson, D. R., and Wrench, C. L.: Cloudnet: Continuous Evaluation of Cloud Profiles in Seven Operational Models Using Ground-Based Observations, B. Am. Meteorol. Soc., 88, 883–898, https://doi.org/10.1175/BAMS-88-6-883, 2007. a
Jeanneret, F., Martucci, G., Pinnock, S., and Berne, A.: Correction of CCI cloud data over the Swiss Alps using ground-based radiation measurements, Atmos. Meas. Tech., 11, 4153–4170, https://doi.org/10.5194/amt-11-4153-2018, 2018. a
Ji, D. and Shi, J.: Cloud liquid water retrieval using AMSR-E on land, in: Remote Sensing of the Atmosphere, Clouds, and Precipitation IV, SPIE, 8523, 167–174, https://doi.org/10.1117/12.977178, 2012. a
Johnson, K. and Jensen, M.: Active Remote Sensing of CLouds (ARSCL) product using Ka-band ARM Zenith Radars (ARSCLKAZRBND1KOLLIAS, KAZRARSCL-Cloud Boundaries subset), Atmospheric Radiation Measurement (ARM) User Facility [data set], https://doi.org/10.5439/1228769, 2011. a
Johnson, K., Giangrande, S., and Toto, T.: Active Remote Sensing of CLouds (ARSCL) Product Using Ka-Band ARM Zenith Radars (ARSCLKAZRBND1KOLLIAS, KAZRARSCL-c0-Cloud Boundaries subset), Atmospheric Radiation Measurement (ARM) User Facility [data set], https://doi.org/10.5439/1393438, 2020. a
Karlsson, K.-G. and Håkansson, N.: Characterization of AVHRR global cloud detection sensitivity based on CALIPSO-CALIOP cloud optical thickness information: demonstration of results based on the CM SAF CLARA-A2 climate data record, Atmos. Meas. Tech., 11, 633–649, https://doi.org/10.5194/amt-11-633-2018, 2018. a
Kay, J., L'Ecuyer, T., Chepfer, H., Loeb, N., Morrison, A., and Cesana, G.: Recent advances in Arctic cloud and climate research, Current Climate Change Reports, 2, 159–169, https://doi.org/10.1007/s40641-016-0051-9, 2016. a, b
Knobelspiesse, K.: BlandAltman, GitHub [code], https://github.com/knobelsp/BlandAltman/ (last access: December 2021), 2021. a
Knobelspiesse, K., Tan, Q., Bruegge, C., Cairns, B., Chowdhary, J., Van Diedenhoven, B., Diner, D., Ferrare, R., Van Harten, G., Jovanovic, V., Ottaviani, M., Redemann, J., Seidel, F., and Sinclair, K.: Intercomparison of airborne multi-angle polarimeter observations from the Polarimeter Definition Experiment, Appl. Optics, 58, 650–669, https://doi.org/10.1364/AO.58.000650, 2019. a, b
Kollias, P., Clothiaux, E., Miller, M., Albrecht, B., Stephens, G., and Ackerman, T.: Millimeter-wavelength radars: New frontier in atmospheric cloud and precipitation research, B. Am. Meteorol. Soc., 88, 1608–1624, https://doi.org/10.1175/BAMS-88-10-1608, 2007. a
Lelli, L., Vountas, M., Khosravi, N., and Burrows, J. P.: Satellite remote sensing of regional and seasonal Arctic cooling showing a multi-decadal trend towards brighter and more liquid clouds, Atmos. Chem. Phys., 23, 2579–2611, https://doi.org/10.5194/acp-23-2579-2023, 2023. a
Liu, Y. and Key, J. R.: Assessment of Arctic cloud cover anomalies in atmospheric reanalysis products using satellite data, J. Climate, 29, 6065–6083, https://doi.org/10.1175/JCLI-D-15-0861.1, 2016. a
Liu, Y., Shupe, M. D., Wang, Z., and Mace, G.: Cloud vertical distribution from combined surface and space radar–lidar observations at two Arctic atmospheric observatories, Atmos. Chem. Phys., 17, 5973–5989, https://doi.org/10.5194/acp-17-5973-2017, 2017. a
Long, C. N. and Ackerman, T. P.: Identification of clear skies from broadband pyranometer measurements and calculation of downwelling shortwave cloud effects, J. Geophys. Res.-Atmos., 105, 15609–15626, https://doi.org/10.1029/2000JD900077, 2000. a
Long, C. N., Ackerman, T. P., Gaustad, K. L., and Cole, J.: Estimation of fractional sky cover from broadband shortwave radiometer measurements, J. Geophys. Res., 111, D11204, https://doi.org/10.1029/2005JD006475, 2006. a, b
Marchand, R.: ARM and satellite cloud validation, Meteor. Mon., 57, 30.1–30.11, https://doi.org/10.1175/AMSMONOGRAPHS-D-15-0038.1, 2016. a
Martonchik, J., Diner, D., Kahn, R., Gaitley, B., and Holben, B.: Comparison of MISR and AERONET aerosol optical depths over desert sites, Geophys. Res. Lett., 31, L16102, https://doi.org/10.1029/2004GL019807, 2004. a
McGarragh, G. R., Poulsen, C. A., Thomas, G. E., Povey, A. C., Sus, O., Stapelberg, S., Schlundt, C., Proud, S., Christensen, M. W., Stengel, M., Hollmann, R., and Grainger, R. G.: The Community Cloud retrieval for CLimate (CC4CL) – Part 2: The optimal estimation approach, Atmos. Meas. Tech., 11, 3397–3431, https://doi.org/10.5194/amt-11-3397-2018, 2018. a, b
McKinna, L. I., Cetinić, I., and Werdell, P. J.: Development and validation of an empirical ocean color algorithm with uncertainties: A case study with the particulate backscattering coefficient, J. Geophys. Res.-Oceans, 126, e2021JC017231, https://doi.org/10.1029/2021JC017231, 2021. a
Min, Q. and Harrison, L. C.: Cloud properties derived from surface MFRSR measurements and comparison with GOES results at the ARM SGP site, Geophys. Res. Lett., 23, 1641–1644, https://doi.org/10.1029/96GL01488, 1996. a
Nomokonova, T., Ebell, K., Löhnert, U., Maturilli, M., Ritter, C., and O'Connor, E.: Statistics on clouds and their relation to thermodynamic conditions at Ny-Ålesund using ground-based sensor synergy, Atmos. Chem. Phys., 19, 4105–4126, https://doi.org/10.5194/acp-19-4105-2019, 2019a. a, b, c, d, e
Nomokonova, T., Ritter, C., and Ebell, K.: HATPRO microwave radiometer measurements at AWIPEV, Ny-Ålesund (2016-2018), PANGAEA [data set], https://doi.org/10.1594/PANGAEA.902183, 2019b. a, b
Noonkester, V. R.: Droplet spectra observed in marine stratus cloud layers, J. Atmos. Sci., 41, 829–845, https://doi.org/10.1175/1520-0469(1984)041<0829:DSOIMS>2.0.CO;2, 1984. a
Pavolonis, M. J., Heidinger, A. K., and Uttal, T.: Daytime global cloud typing from AVHRR and VIIRS: Algorithm description, validation, and comparisons, J. Appl. Meteorol. Clim., 44, 804–826, https://doi.org/10.1175/JAM2236.1, 2005. a
Philipp, D., Stengel, M., and Ahrens, B.: Analyzing the Arctic feedback mechanism between sea ice and low-level clouds using 34 years of satellite observations, J. Climate, 33, 7479–7501, https://doi.org/10.1175/JCLI-D-19-0895.1, 2020. a
Phillips, P. C.: The exact distribution of the Wald statistic, Econometrica, 54, 881–895, https://doi.org/10.2307/1912841, 1986. a
Riihimaki, L.: Radiative Flux Analysis (RADFLUX1LONG), Atmospheric Radiation Measurement (ARM) User Facility [data set], https://doi.org/10.5439/1395157, 1995. a
Riihimaki, L. D., Gaustad, K. L., and Long, C. N.: Radiative Flux Analysis (RADFLUXANAL) Value-Added Product: Retrieval of Clear-Sky Broadband Radiative Fluxes and Other Derived Values, DOE Office of Science Atmospheric Radiation Measurement (ARM) user facility, Tech. Rep. No. DOE/SC-ARM-TR-228, https://doi.org/10.2172/1569477, 2019. a, b, c
Rodgers, C. D.: Retrieval of atmospheric temperature and composition from remote measurements of thermal radiation, Rev. Geophys., 14, 609–624, https://doi.org/10.1029/RG014i004p00609, 1976. a
Rose, T., Crewell, S., Löhnert, U., and Simmer, C.: A network suitable microwave radiometer for operational monitoring of the cloudy atmosphere, Atmos. Res., 75, 183–200, https://doi.org/10.1016/j.atmosres.2004.12.005, 2005. a
Rutan, D., Rose, F., Smith, N., and Charlock, T.: CERES/ARM Validation Experiment, in: 11th ARM Science Team Meeting, Atlanta, Georgia, 19–23 March 2001, 1–4, https://www.arm.gov/publications/proceedings/conf11/extended_abs/rutan_da.pdf (last access: 1 August 2021), 2001. a
Schaaf, C. B., Liu, J., Gao, F., and Strahler, A. H.: Aqua and Terra MODIS albedo and reflectance anisotropy products, in: Land Remote Sensing and Global Environmental Change, Springer, 549–561, https://doi.org/10.1007/978-1-4419-6749-7_24, 2010. a
Schweiger, A. J.: Changes in seasonal cloud cover over the Arctic seas from satellite and surface observations, Geophys. Res. Lett., 31, L12207, https://doi.org/10.1029/2004GL020067, 2004. a
Seegers, B. N., Stumpf, R. P., Schaeffer, B. A., Loftin, K. A., and Werdell, P. J.: Performance metrics for the assessment of satellite data products: an ocean color case study, Opt. Express, 26, 7404–7422, https://doi.org/10.1364/OE.26.007404, 2018. a
Seemann, S. W., Borbas, E. E., Knuteson, R. O., Stephenson, G. R., and Huang, H.-L.: Development of a global infrared land surface emissivity database for application to clear sky sounding retrievals from multispectral satellite radiance measurements, J. Appl. Meteorol. Clim., 47, 108–123, https://doi.org/10.1175/2007JAMC1590.1, 2008. a
Shaw, J., McGraw, Z., Bruno, O., Storelvmo, T., and Hofer, S.: Using satellite observations to evaluate model microphysical representation of Arctic mixed-phase clouds, Geophys. Res. Lett., 49, e2021GL096191, https://doi.org/10.1029/2021GL096191, 2021. a
Shupe, M. D., Turner, D. D., Walden, V. P., Bennartz, R., Cadeddu, M. P., Castellani, B. B., Cox, C. J., Hudak, D. R., Kulie, M. S., Miller, N. B., Neely III, R. R., Neff, W. D., and Rowe, P. M.: High and dry: New observations of tropospheric and cloud properties above the Greenland Ice Sheet, B. Am. Meteorol. Soc., 94, 169–186, https://doi.org/10.1175/BAMS-D-11-00249.1, 2013. a
Sporre, M. K., O'Connor, E. J., Håkansson, N., Thoss, A., Swietlicki, E., and Petäjä, T.: Comparison of MODIS and VIIRS cloud properties with ARM ground-based observations over Finland, Atmos. Meas. Tech., 9, 3193–3203, https://doi.org/10.5194/amt-9-3193-2016, 2016. a, b, c, d, e
Stapelberg, S., Stengel, M., Karlsson, K., Meirink, J., Bojanowski, J., and Hollmann, R.: ESA Cloud_cci Product Validation and Intercomparison Report (PVIR), Tech. Rep. 4.1, https://www.esa-cloud-cci.org/?q=documentation_v3 (last access: May 2022), 2019. a
Stengel, M., Sus, O., Stapelberg, S., Finkensieper, S., Würzler, B., Philipp, D., Hollmann, R., and Poulsen, C.: ESA Cloud Climate Change Initiative (ESA Cloud_cci) data: Cloud_cci AVHRR-PM L3C/L3U CLD_PRODUCTS v3.0, Deutscher Wetterdienst (DWD) [data set], https://doi.org/10.5676/DWD/ESA_Cloud_cci/AVHRR-PM/V003, 2019. a
Stengel, M., Stapelberg, S., Sus, O., Finkensieper, S., Würzler, B., Philipp, D., Hollmann, R., Poulsen, C., Christensen, M., and McGarragh, G.: Cloud_cci Advanced Very High Resolution Radiometer post meridiem (AVHRR-PM) dataset version 3: 35-year climatology of global cloud and radiation properties, Earth Syst. Sci. Data, 12, 41–60, https://doi.org/10.5194/essd-12-41-2020, 2020. a, b, c, d, e, f, g
Stephens, G.: Radiation profiles in extended water clouds. II: Parameterization Schemes, J. Atmos. Sci., 35, 2123–2132, https://doi.org/10.1175/1520-0469(1978)035<2123:RPIEWC>2.0.CO;2, 1978. a
Sus, O., Stengel, M., Stapelberg, S., McGarragh, G., Poulsen, C., Povey, A. C., Schlundt, C., Thomas, G., Christensen, M., Proud, S., Jerg, M., Grainger, R., and Hollmann, R.: The Community Cloud retrieval for CLimate (CC4CL) – Part 1: A framework applied to multiple satellite imaging sensors, Atmos. Meas. Tech., 11, 3373–3396, https://doi.org/10.5194/amt-11-3373-2018, 2018. a
Tjernström, M., Shupe, M. D., Brooks, I. M., Achtert, P., Prytherch, J., and Sedlar, J.: Arctic summer airmass transformation, surface inversions, and the surface energy budget, J. Climate, 32, 769–789, https://doi.org/10.1175/JCLI-D-18-0216.1, 2019. a
Turner, D. D., Clough, S. A., Liljegren, J. C., Clothiaux, E. E., Cady-Pereira, K. E., and Gaustad, K. L.: Retrieving liquid water path and precipitable water vapor from the atmospheric radiation measurement (arm) microwave radiometers, IEEE T. Geosci. Remote, 45, 3680–3690, https://doi.org/10.1109/TGRS.2007.903703, 2007. a, b
Van Harten, G., Diner, D. J., Daugherty, B. J., Rheingans, B. E., Bull, M. A., Seidel, F. C., Chipman, R. A., Cairns, B., Wasilewski, A. P., and Knobelspiesse, K. D.: Calibration and validation of airborne multiangle spectropolarimetric imager (AirMSPI) polarization measurements, Appl. Optics, 57, 4499–4513, https://doi.org/10.1364/AO.57.004499, 2018. a
Verlinde, J., Zak, B., Shupe, M., Ivey, M., and Stamnes, K.: The arm north slope of alaska (nsa) sites, Meteor. Mon., 57, 8.1–8.13, https://doi.org/10.1175/AMSMONOGRAPHS-D-15-0023.1, 2016. a
Von Walden, P., Shupe, M., Turner, D., and Bennartz, R.: Integrated Characterization of Energy, Clouds, Atmospheric State, and Precipitation at Summit (ICECAPS), Arctic Data Center [data set], https://doi.org/10.18739/A2348GH4Z, 2010. a
Wang, X., Liu, J., Liu, H., and Yang, B.: Characteristics of Arctic Summer Inversion and Its Correlation with Extreme Sea Ice Anomalies, Atmosphere, 13, 316, https://doi.org/10.3390/atmos13020316, 2022. a
Wendisch, M., Brückner, M., Burrows, J., Crewell, S., Dethloff, K., Ebell, K., Lüpkes, C., Macke, A., Notholt, J., Quaas, J., Rinke, A., and Tegen, I.: Understanding causes and effects of rapid warming in the Arctic, Eos, 98, https://doi.org/10.1029/2017EO064803, 2017. a
Wendisch, M., Brückner, M., Crewell, S., et al.: Atmospheric and Surface Processes, and Feedback Mechanisms Determining Arctic Amplification: A Review of First Results and Prospects of the (AC)3 Project, B. Am. Meteorol. Soc., 104, E208–E242, https://doi.org/10.1175/BAMS-D-21-0218.1, 2022. a
Zhang, D.: MWR Retrievals (MWRRET1LILJCLOU), Atmospheric Radiation Measurement (ARM) User Facility [data set], https://doi.org/10.5439/1027369, 1996. a