the Creative Commons Attribution 4.0 License.
the Creative Commons Attribution 4.0 License.
 | 15 Jun 2023
Vertical information of CO from TROPOMI total column measurements in context of the CAMS-IFS data assimilation scheme
Teresa Campos
Natalie Kille
Kyle J. Zarzana
Rainer Volkamer
Jochen Landgraf
Since 2017 the Tropospheric Monitoring Instrument (TROPOMI) on board ESA's Copernicus Sentinel-5 satellite (S5-P) has provided the operational carbon monoxide (CO) data product with daily global coverage on a spatial resolution of 5.5×7 km2. The European Centre for Medium-Range Weather Forecasts (ECMWF) plans to assimilate the retrieved total columns and the corresponding vertical sensitivities in the Copernicus Atmosphere Monitoring Service Integrated Forecasting System (CAMS-IFS) to improve forecasts of the atmospheric chemical composition. The TROPOMI data will primarily constrain the vertical integrated CO field of CAMS-IFS but to a lesser extent also its vertical CO distribution. For clear-sky conditions, the vertical sensitivity of the TROPOMI CO data product is useful throughout the atmosphere, but for cloudy scenes it varies due to cloud shielding and light scattering. To assess the profile information, we deploy an a posteriori profile retrieval that combines an ensemble of TROPOMI CO column retrievals with different vertical sensitivities to obtain a vertical CO profile that is then a representative average for the chosen spatial and temporal domain. We demonstrate the approach on three CO pollution cases. For the so-called “Rabbit Foot Fire” in Idaho on 12 August 2018, we estimate a CO profile showing the pollution at an altitude of about 5 km in good agreement with airborne in situ measurements of the Biomass Burning Flux Measurements of Trace Gases and Aerosol (BB-FLUX) field campaign. The distinct CO enhancement in a plume aloft (length =212 km, width =34 km), decoupled from the ground, is sensed by TROPOMI but is not present in the CAMS-IFS model. For a large-scale event, we analyzed the CO pollution from Siberian wildfires that took place from 14 to 17 August 2018. The TROPOMI data estimate the height of the pollution plume over Canada at 7 km in agreement with CAMS-IFS. However, CAMS-IFS underestimates the enhanced CO vertical column densities sensed by TROPOMI within the plume by more than 100 ppb. Finally, we study the seasonal biomass burning in the Amazon. During the burning season the CO profile retrieved from the TROPOMI measurements (1–15 August 2019) agrees well with the one of CAMS-IFS with a similar vertical shape between ground and 14 km altitude. Hence, our results indicate that assimilating TROPOMI CO retrieval with different vertical sensitivities (e.g., under clear-sky and cloudy conditions) provides information about the vertical distribution of CO.
- Article
(6769 KB) - Full-text XML
- BibTeX
- EndNote


The atmospheric trace gas carbon monoxide (CO) is predominantly emitted to the atmosphere by incomplete combustion (e.g., due to biomass burning, industrial activity, and traffic). Its only sink is the oxidation reaction with the hydroxyl radical (Spivakovsky et al., 2000), the reaction rate of which determines its moderate atmospheric residence time that varies from days to several weeks (Holloway et al., 2000) depending on latitude and the solar illumination. Another important sink of the trace gas is, for example, the oxidation by soil bacteria (Cordero et al., 2019; Stein et al., 2014). In combination with its relatively low atmospheric background, CO is widely established to pinpoint pollution hotspots worldwide and to trace the transport of air pollution within the atmosphere (e.g., Gloudemans et al., 2009; Pommier et al., 2013; Schneising et al., 2020; Borsdorff et al., 2020).
One of the primary targets of the Tropospheric Monitoring Instrument (TROPOMI) on ESA's Sentinel-5 satellite (S5-P) is to measure the total column concentration of CO, hereafter referred to as columns, with daily global coverage on a high spatial resolution of 5.5×7 km2 (7×7 km2 before 6 August 2019). The instrument was launched on 13 October 2017 and performs measurements in the visible (270–500 nm), the near-infrared (675–775 nm), and the shortwave infrared (SWIR, 2305–2385 nm) (Veefkind et al., 2012). The SWIR CO retrieval software package (SICOR) was developed for the operational processing of TROPOMI and estimates CO total columns under clear-sky over land and cloudy atmospheric conditions over land and oceans. For clear-sky conditions, the retrieved CO product shows a good sensitivity throughout the atmosphere but can be affected in its vertical sensitivity by the presence of clouds. Therefore, the retrieved columns should be interpreted together with the total column averaging kernels (Borsdorff et al., 2018b, 2019) that are supplied with the data product. An extensive validation with ground-based measurements of the TCCON network showed that the TROPOMI data product is compliant with the mission requirements (Borsdorff et al., 2018a; Sha et al., 2021) , and thus, it was released for public usage (https://scihub.copernicus.eu, last access: 7 June 2023).
The TROPOMI CO dataset was compared early in the mission with the CO fields of ECMWF's Copernicus Atmosphere Monitoring Service (CAMS) Integrated Forecasting System (IFS), and an overall good agreement was found (bias %, correlation =0.97) (Borsdorff et al., 2018b). CAMS-IFS assimilates various trace gas retrievals from different satellite missions and provides daily global forecast of the chemical composition of the atmosphere up to 5 d ahead with a spatial resolution of about 40×40 km2. Currently, total column CO retrievals from MOPITT (Measurement of Pollution in the Troposphere instrument) and IASI (Infrared Atmospheric Sounding Interferometer) are routinely assimilated together with their total column averaging kernels (Inness et al., 2015). The spatial resolution at nadir of these datasets is near 22×22 and 12×12 km2, respectively. The MOPITT and IASI CO data are retrieved from thermal infrared (TIR) measurements; details about the approach are given in Deeter et al. (2022) and Clerbaux et al. (2009) respectively. TIR measurements, which are sensitive to the vertical distribution of CO, are most sensitive in the mid-troposphere as shown by Deeter et al. (2013) and George et al. (2015). In contrast, the TROPOMI CO data provide a higher spatial resolution and a vertical sensitivity that covers the full atmosphere including the contribution of the planetary boundary layer, making them particularly suitable for detecting surface sources of CO (Landgraf et al., 2016). ECMWF plans to assimilate the TROPOMI CO columns and their vertical sensitivities (total column averaging kernels) with CAMS-IFS. The TROPOMI CO data have been monitored since 2018 within the global CAMS-IFS system, and the final assimilation will be activated in the next operational upgrade (CY48R1) scheduled for Q2/2023 (Inness et al., 2022).
In this study, we point out the potential benefits of assimilating TROPOMI CO for CAMS-IFS. The vast amount of TROPOMI data will strongly constrain the total column field of CAMS-IFS including the vertical distribution of CO assumed in the model. This is because the CO column sensitivity to the vertical distribution of CO varies for clear and cloudy conditions and with the observation geometry. To demonstrate this, we implemented an a posteriori profile retrieval that combines individual TROPOMI CO column retrievals with different vertical sensitivities and obtains a vertical concentration profile of the CO. We evaluate the approach on three CO pollution events for which we compare the retrieved vertical CO profiles and total columns of TROPOMI with collocated CAMS-IFS simulations that do not assimilate the TROPOMI data yet.
Section 2 introduces the data used in our study, Sect. 3 defines the methodology of the a posteriori profile retrieval, Sect. 4 demonstrates the approach using three CO pollution cases, and Sect. 5 summarizes our findings and provides conclusions.
The settings of the TROPOMI CO retrieval in this study are identical to the recent reprocessing of ESA (version 02.04.00). The SICOR algorithm accounts for light scattering effects in the atmosphere by retrieving effective cloud parameters (altitude, optical thickness) together with the total column concentrations of CO, H2O, HDO, and CH4. The forward simulation of the retrieval deploys the SEOM-IAS (Scientific Exploitation of Operational Missions – Improved Atmospheric Spectroscopy) cross section database for all trace gases as described by Borsdorff et al. (2019), and the inversion uses the profile scaling approach that scales a reference profile to fit the spectral measurement (Borsdorff et al., 2014). Here, the reference profile is taken from a spatiotemporally resolved atmospheric transport simulations of the TM5 model (Krol et al., 2005). A detailed outline of all settings for the CO retrieval (e.g., spectral windows, a priori profiles, and other auxiliary data) is given by Landgraf et al. (2016). This study limits the analysis to scenes under clear-sky conditions (τ<0.5 and z<500 m) and mid-level clouds (τ≥0.5 and z<5000 m) by filtering the data using the quality assurance value (q>0.5). Here τ is the cloud optical thickness and z the cloud center height. Furthermore, the artificial striping in flight direction found in the TROPOMI CO data was reduced by the a posteriori data correction as discussed by Borsdorff et al. (2019) based on frequency filtering in the Fourier space.
We compare the TROPOMI CO retrievals with the simulated CAMS-IFS CO fields. CAMS-IFS is an incremental four-dimensional variational (4D-Var) data assimilation system that minimizes the difference between the modeled fields and observations to obtain the best forecast by adjusting the initial conditions (Inness et al., 2019, 2015). The spatial resolution of TROPOMI is higher than the one of CAMS-IFS, and to overcome this ECMWF is averaging the TROPOMI data into so-called “super-observations” before they are included in the CAMS system. In this study we collocate the CAMS-IFS data with TROPOMI by temporal and spatial interpolation to the ground pixel of the satellite (Borsdorff et al., 2018a). We are interested in comparing the CO vertical concentration profile ρcams and the total column given by CAMS-IFS with the TROPOMI observations. Therefore, we calculate the total column concentration ccams accounting for the vertical sensitivity of the TROPOMI CO product given by the total column averaging kernel a,
with the TROPOMI measurement noise contribution ϵ that is provided for each retrieval and is propagated from the measurement noise. Hence, the total column ccams can be compared directly with the TROPOMI observation.
Finally, we aim to compare the vertical CO profiles derived from the TROPOMI data by deploying the a posteriori profile retrieval method with the ones of CAMS-IFS using the profile averaging kernels of the a posteriori retrieval. As an additional validation source we use airborne in situ measurements of the Biomass Burning Flux Measurements of Trace Gases and Aerosol (BB-FLUX) campaign. The NCAR/NSF vacuum UV resonance fluorescence instrument measured in situ CO mixing ratios during BB-FLUX. It is functionally similar to that of Gerbig et al. (1999). The project analyzed among others an optically thick pollution plume caused by the so-called “Rabbit Foot Fire” near Boise in Idaho on 12 August 2018 and measured a vertical CO concentration profile for this event. This date and flight are chosen as they specifically planned an overpass of TROPOMI. The in situ measurements were done about 45 min before the TROPOMI overpass. More details about the campaign including an error estimation of the in situ measurements are given by Rowe et al. (2022). They validated TROPOMI CO retrievals under high pollution load using air borne measurements and calculations of the FLEXible PARTicle dispersion model (FLEXPART). The study showed that even under extreme polluted conditions the TROPOMI CO dataset is fully compliant with the mission requirements of 10 % precision and 15 % accuracy. This makes the BB-FLUX data an excellent reference for the validation of our a posteriori profile retrieval.
We developed an a posteriori profile retrieval that estimates a vertical concentration profile of a trace gas on n layers from an ensemble of total column retrievals chosen, for example, for a region or time range of interest. The approach relies on the assumption that the total column retrievals provide different vertical sensitivities, for example, caused by cloud contamination or different observation geometries. Hence, the ensemble of column measurements needs to be chosen to ensure that. The input of the a posteriori profile retrieval is a set of m retrieved total columns of a trace gas , their precision , and an estimate of the vertical sensitivity for each retrieved column ci to the profile component . Here, ei is the noise error of the column retrieval i and is the propagated measurement noise. So, we obtain the linear relation between the observed columns c and the profile x,
with the matrix , with i=1…m and j=1…n and the a priori profile xapr based on TM5. For profile scaling retrievals as used for the TROPOMI CO data the term is (Borsdorff et al., 2014). Hence, we can reduce the equation to
The total column averaging kernel ai varies, for example, due to cloud contamination or different observation geometries as shown in Fig. 1. Hence, using the total columns together with their vertical sensitivity, we can invert Eq. (3) to infer a corresponding vertical concentration profile of a trace gas. To this end we set up an a posteriori profile retrieval for this purpose, and we minimize the Tikhonov cost function:
The m×m matrix Se is a diagonal matrix with on the diagonal, and R is the regularization matrix. Here the function minx is providing the profile that minimizes the Tikhonov cost function. We choose here, and L1 is a discrete version of the first derivative:
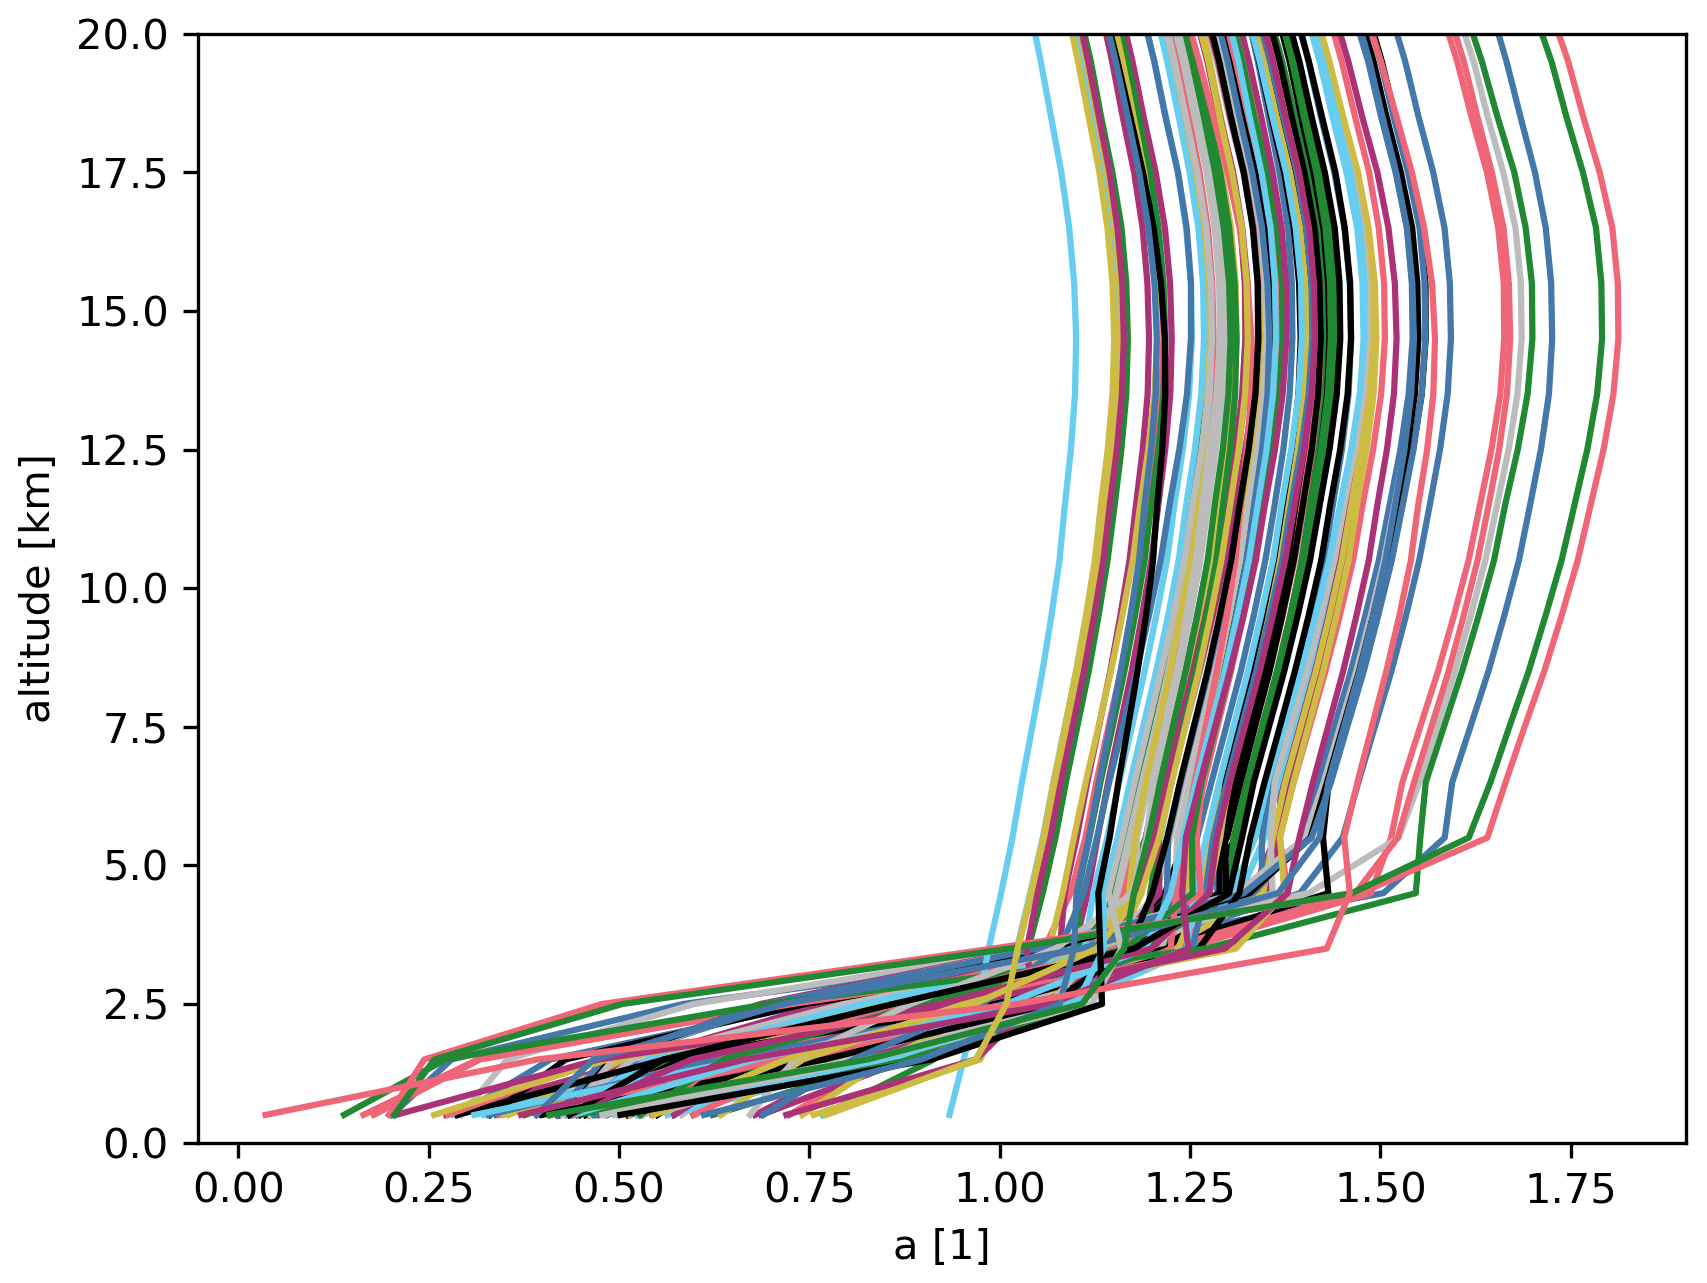
Figure 1Total column averaging kernels of the TROPOMI CO retrieval for different satellite ground pixels (color coded) selected over the Amazon within the burning season (1 to 15 August 2019) in unitless representation [1]. Most of the retrievals are cloud contaminated.
The regularization parameter λ balances the two contributions of the cost function shown in Eq. (4), and thus its value is of crucial importance for the inversion. In this study, we calculate λ by deploying the L-curve method (Hansen and O'Leary, 1993) that searches for the highest curvature of the functional dependency between λ and the cost term of the retrieval. Figure 2 shows an example of this functional dependency, and the highest curvature is marked with a red dot.
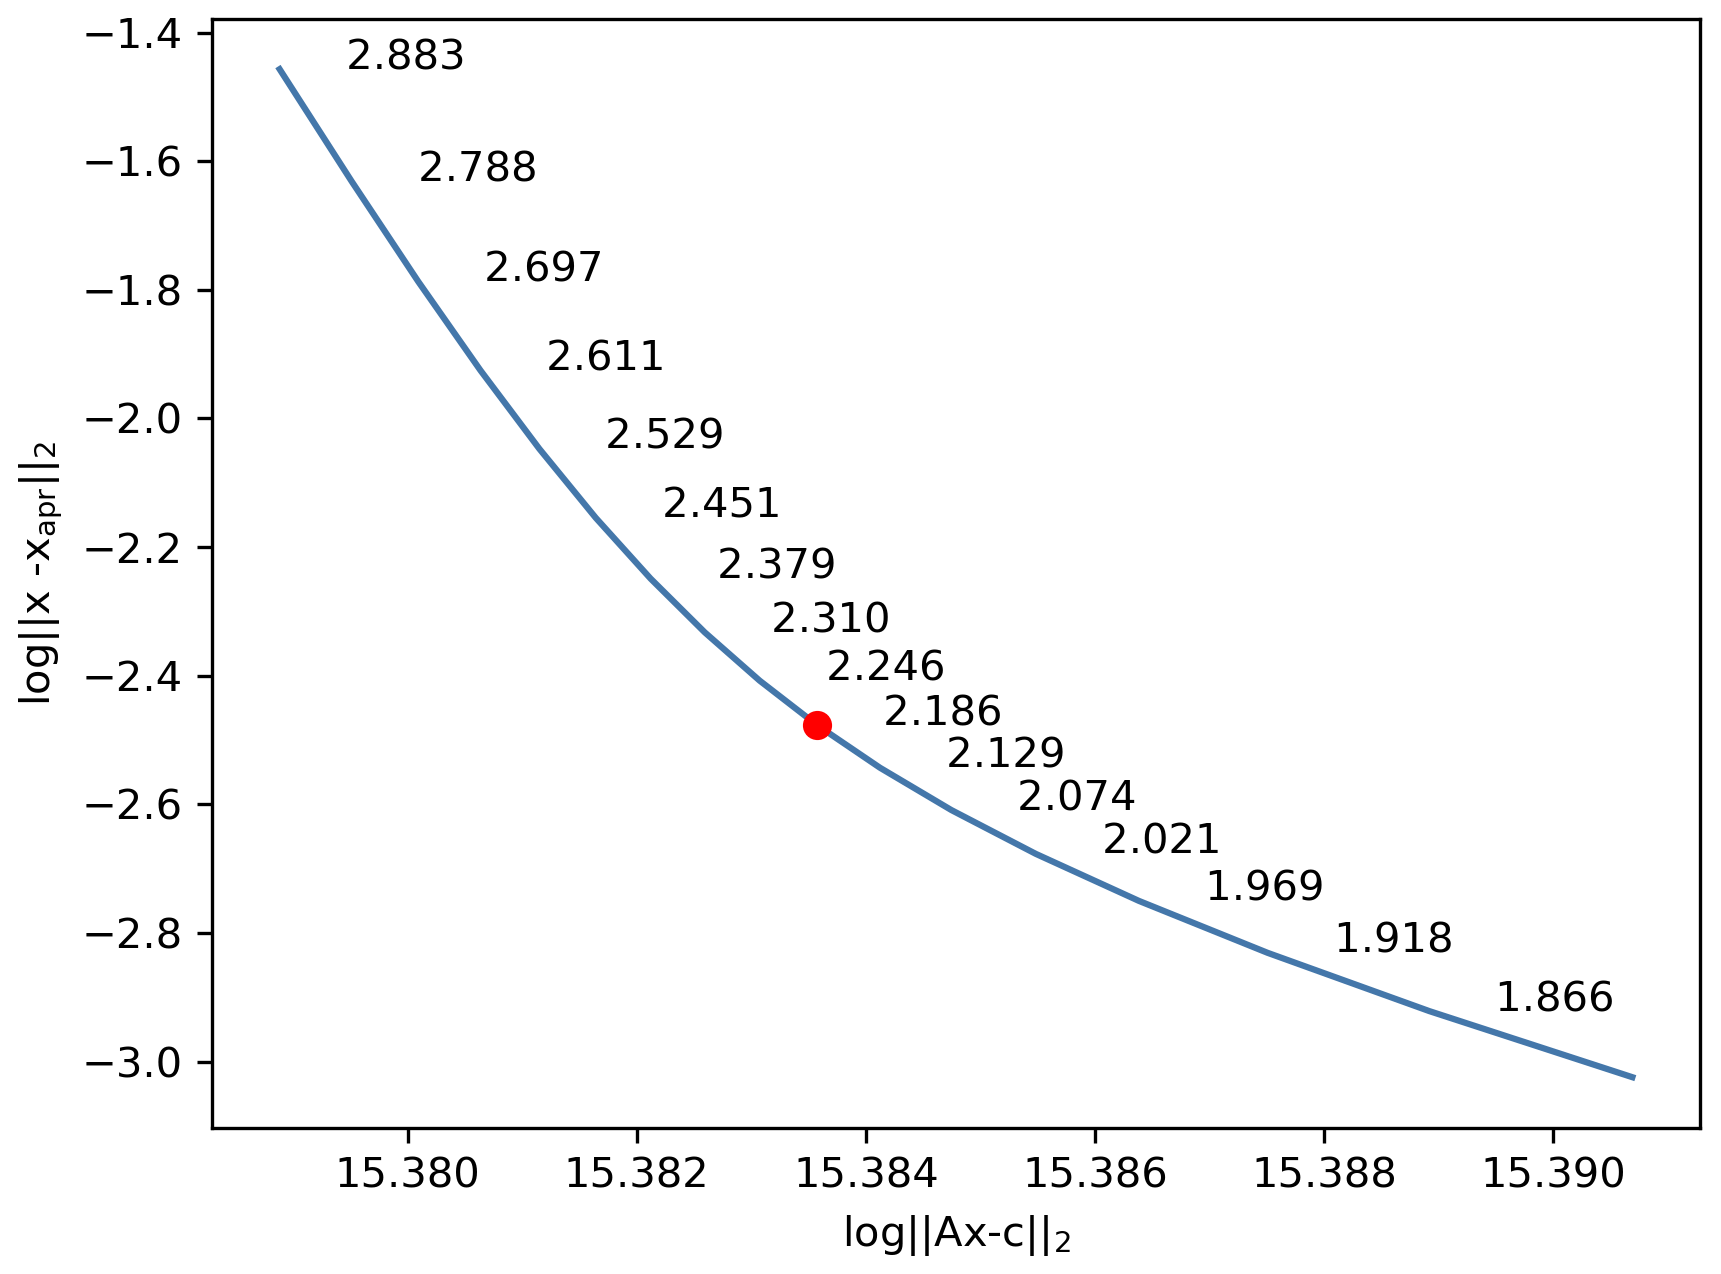
Figure 2L-curve optimization to find the regularization strength λ of the a posteriori profile retrieval for the case study (1 to 15 August 2019) over the Amazon within the burning season. The figure shows the two cost terms as a function of λ with the resulting DFS of the a posteriori profile retrieval for each data point. The selected optimal point is marked by the red dot.
In the linear approximation the solution of the profile retrieval becomes
with the gain matrix
In general, the CO total columns calculated from the vertical profiles of the a posteriori retrieval are in better agreement with the TROPOMI measurements than the a priori assumptions based on TM5. We do not achieve here a perfect agreement between the TROPOMI CO columns and the columns calculated from the a posteriori profile because we assume for the a posteriori profile retrieval that the real vertical CO profile is constant in time and space, which is not the case in reality. For example, the mean difference between the measured TROPOMI CO columns and TM5 of −17.5 % is reduced by the a posteriori profile retrieval to only −4.3 % for the case over the Amazon during the burning season (1 to 15 August 2019). For all other example cases in this study the difference between the TROPOMI CO columns and the columns calculated from the a posteriori profile retrieval is in absolute below 0.3 %. Here, the percentage is relative to the TROPOMI measurements.
The vertical sensitivity of the profile retrieval is described by the profile averaging kernel matrix,
with
where represents the derivative , where its diagonal elements describe the retrieval sensitivity of a state vector element to its true value as shown in Fig. 3. The degree of freedom for signal indicates the total number of independent pieces of information:
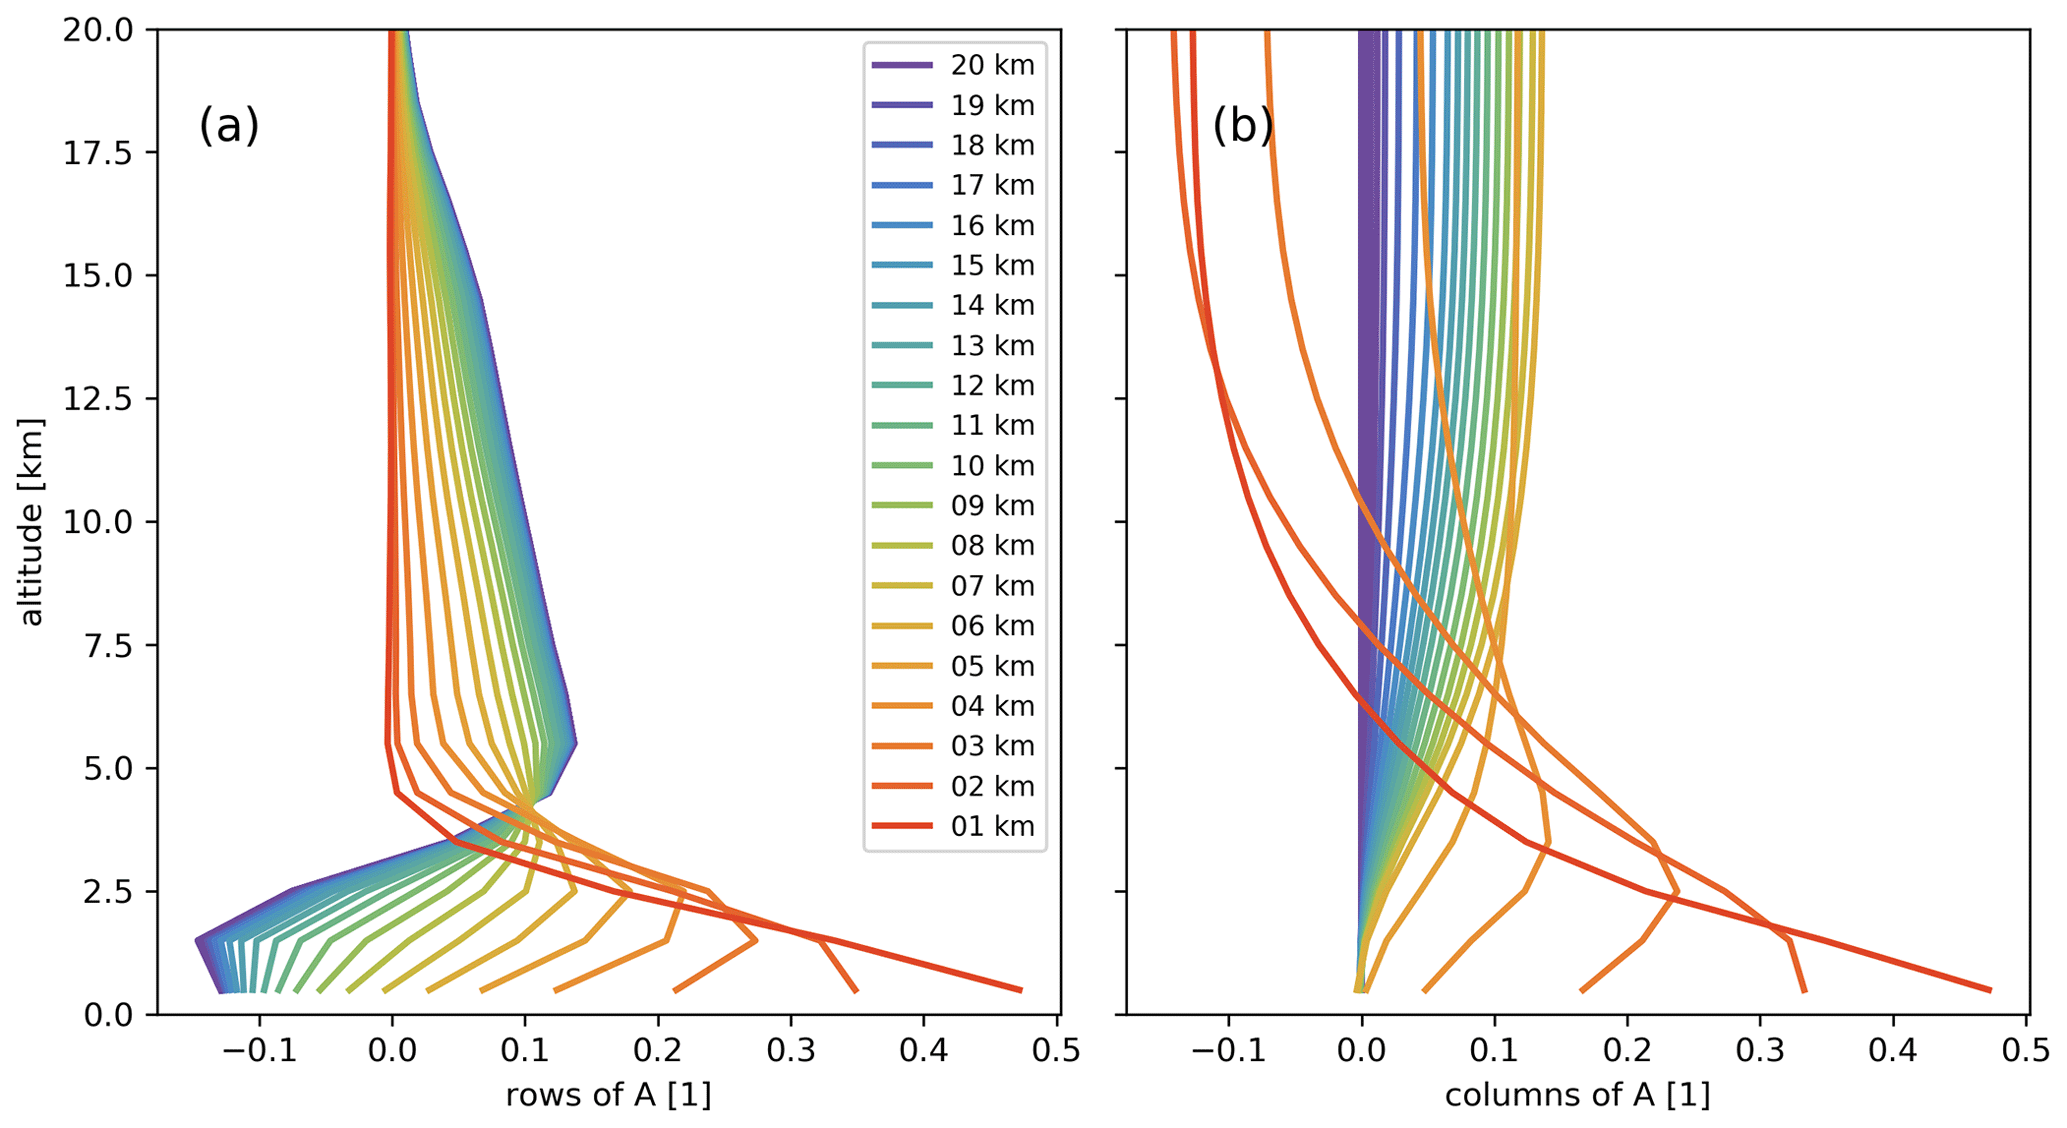
Figure 3Averaging kernel of the a posteriori profile retrieval for CO over the Amazon (1 to 15 August 2019) within the burning season in unitless representation [1]. Panel (a) shows the rows and panel (b) the columns of the averaging kernel matrix. The rows indicate how one level of the retrieved profile is a smoothed version of all levels from the true profile, while the columns show how one level of the true profile will affect all levels of the retrieved profile. Altitudes are given in the legend.
The TROPOMI CO retrieval uses the profile scaling retrieval that scales a reference profile xref to get the spectral measurement in agreement with the simulation. To be most comparable with the TROPOMI CO column retrieval, we chose a Tikhonov regularization of the first order and a vertical profile expressed relative to a reference profile xref. This special type of a profile retrieval is becoming a profile scaling retrieval when the regularization parameter λ→∞ (Borsdorff et al., 2014). To be compatible with the total column averaging kernels provided by the TROPOMI CO data product, the vertical profiles of the a posteriori profile retrieval are defined on the same vertical grid which consists of n=50 layers with a width of 1 km starting from the surface.
4.1 Rabbit Foot Fire in Idaho
We applied the a posteriori profile retrieval approach to three different cases. Figure 4a shows the TROPOMI CO columns retrieved from the measurements over Idaho on 12 August 2018. The good signal-to-noise ratio of the TROPOMI measurements allows one to perform precise retrievals from individual ground pixels which allows the use of the full spatial resolution of the instrument without the need for averaging individual retrievals to reduce the noise. The measurements show elevated CO values caused by pollution outflow (length =212 km, width =34 km) from the “Rabbit Foot Fire” that was burning near Boise in Idaho. The pollution pattern is not reflected by the simulation of CAMS-IFS as shown by Fig. 4b. This event was not captured by the MOPITT or IASI satellite measurements most probably caused by clouds over the location of the biomass burning. Hence, the prediction of CAMS-IFS for this case fully depends on the assumed fire emissions in the model. Consequently, a reason for the missing plume in the CAMS-IFS model could be missing emissions or the 1 d time delay of fire emissions in the CAMS-IFS forecast run. For all cases the assimilation of TROPOMI data in CAMS-IFS can help to improve the issue. Moreover, the background measured by TROPOMI and modeled by CAMS-IFS is in good agreement when excluding elevated CO values ( molec. cm−2). The bias (TROPOMI – CAMS-IFS) is 9.05 ppb (10 %), and the Pearson correlation 0.88. The TM5 CO field is a monthly average with a coarse spatial resolution of (longitude × latitude) shown in Fig. 4c. It cannot reproduce the pollution plume and cannot model a realistic background CO concentration (Krol et al., 2005). Hence, the origin of the small-scale variation seen in Fig. 4c is not the TM5 model but the vertical sensitivity of TROPOMI. For this plot we interpolated both models to the time and ground pixel location of TROPOMI and smoothed them with the total column averaging kernels of the satellite. Since TM5 serves as the a priori for the TROPOMI CO by comparing Fig. 4c and a, it becomes clear how much information about CO is extracted by the retrieval from the TROPOMI measurements. For the a posteriori profile retrieval we considered the TROPOMI columns that fall within the black dashed box shown in Fig. 4a to retrieve one single vertical profile. The black dashed box was empirically chosen to include the major part of the elevated CO. We select only elevated CO columns ( molec. cm−2) to get more information about the pollution signature. Figure 5a shows the vertical CO profile retrieved by the a posteriori profile retrieval (black) that shows enhanced CO concentrations compared to CAMS-IFS (blue) and TM5 (yellow). Since both models do not account for the fire emissions the averaged model profiles represent CO background conditions. The BB-FLUX in situ measurements of the same day (red) show a distinct CO plume at an altitude of about 3–4 km; the retrieved profile from the TROPOMI measurements is vertically smoothed since the retrieval only has a DFS of about 1.79. However, when representing the retrieved profile of TROPOMI divided by its TM5 a priori (see Fig. 5b), a clear plume signature becomes visible with a maximum at slightly higher altitude than the one of BB-FLUX (about 5 km). For better comparison we reduced the vertical resolution of the BB-FLUX profile to the one of TROPOMI. This was done by first extending it with the TM5 profile (yellow) shown Fig. 5a for higher altitudes and then smoothing it with the total column averaging kernel of TROPOMI, which results in a similar vertical shape as the one derived from the TROPOMI measurements, as can be seen in Fig. 5b.
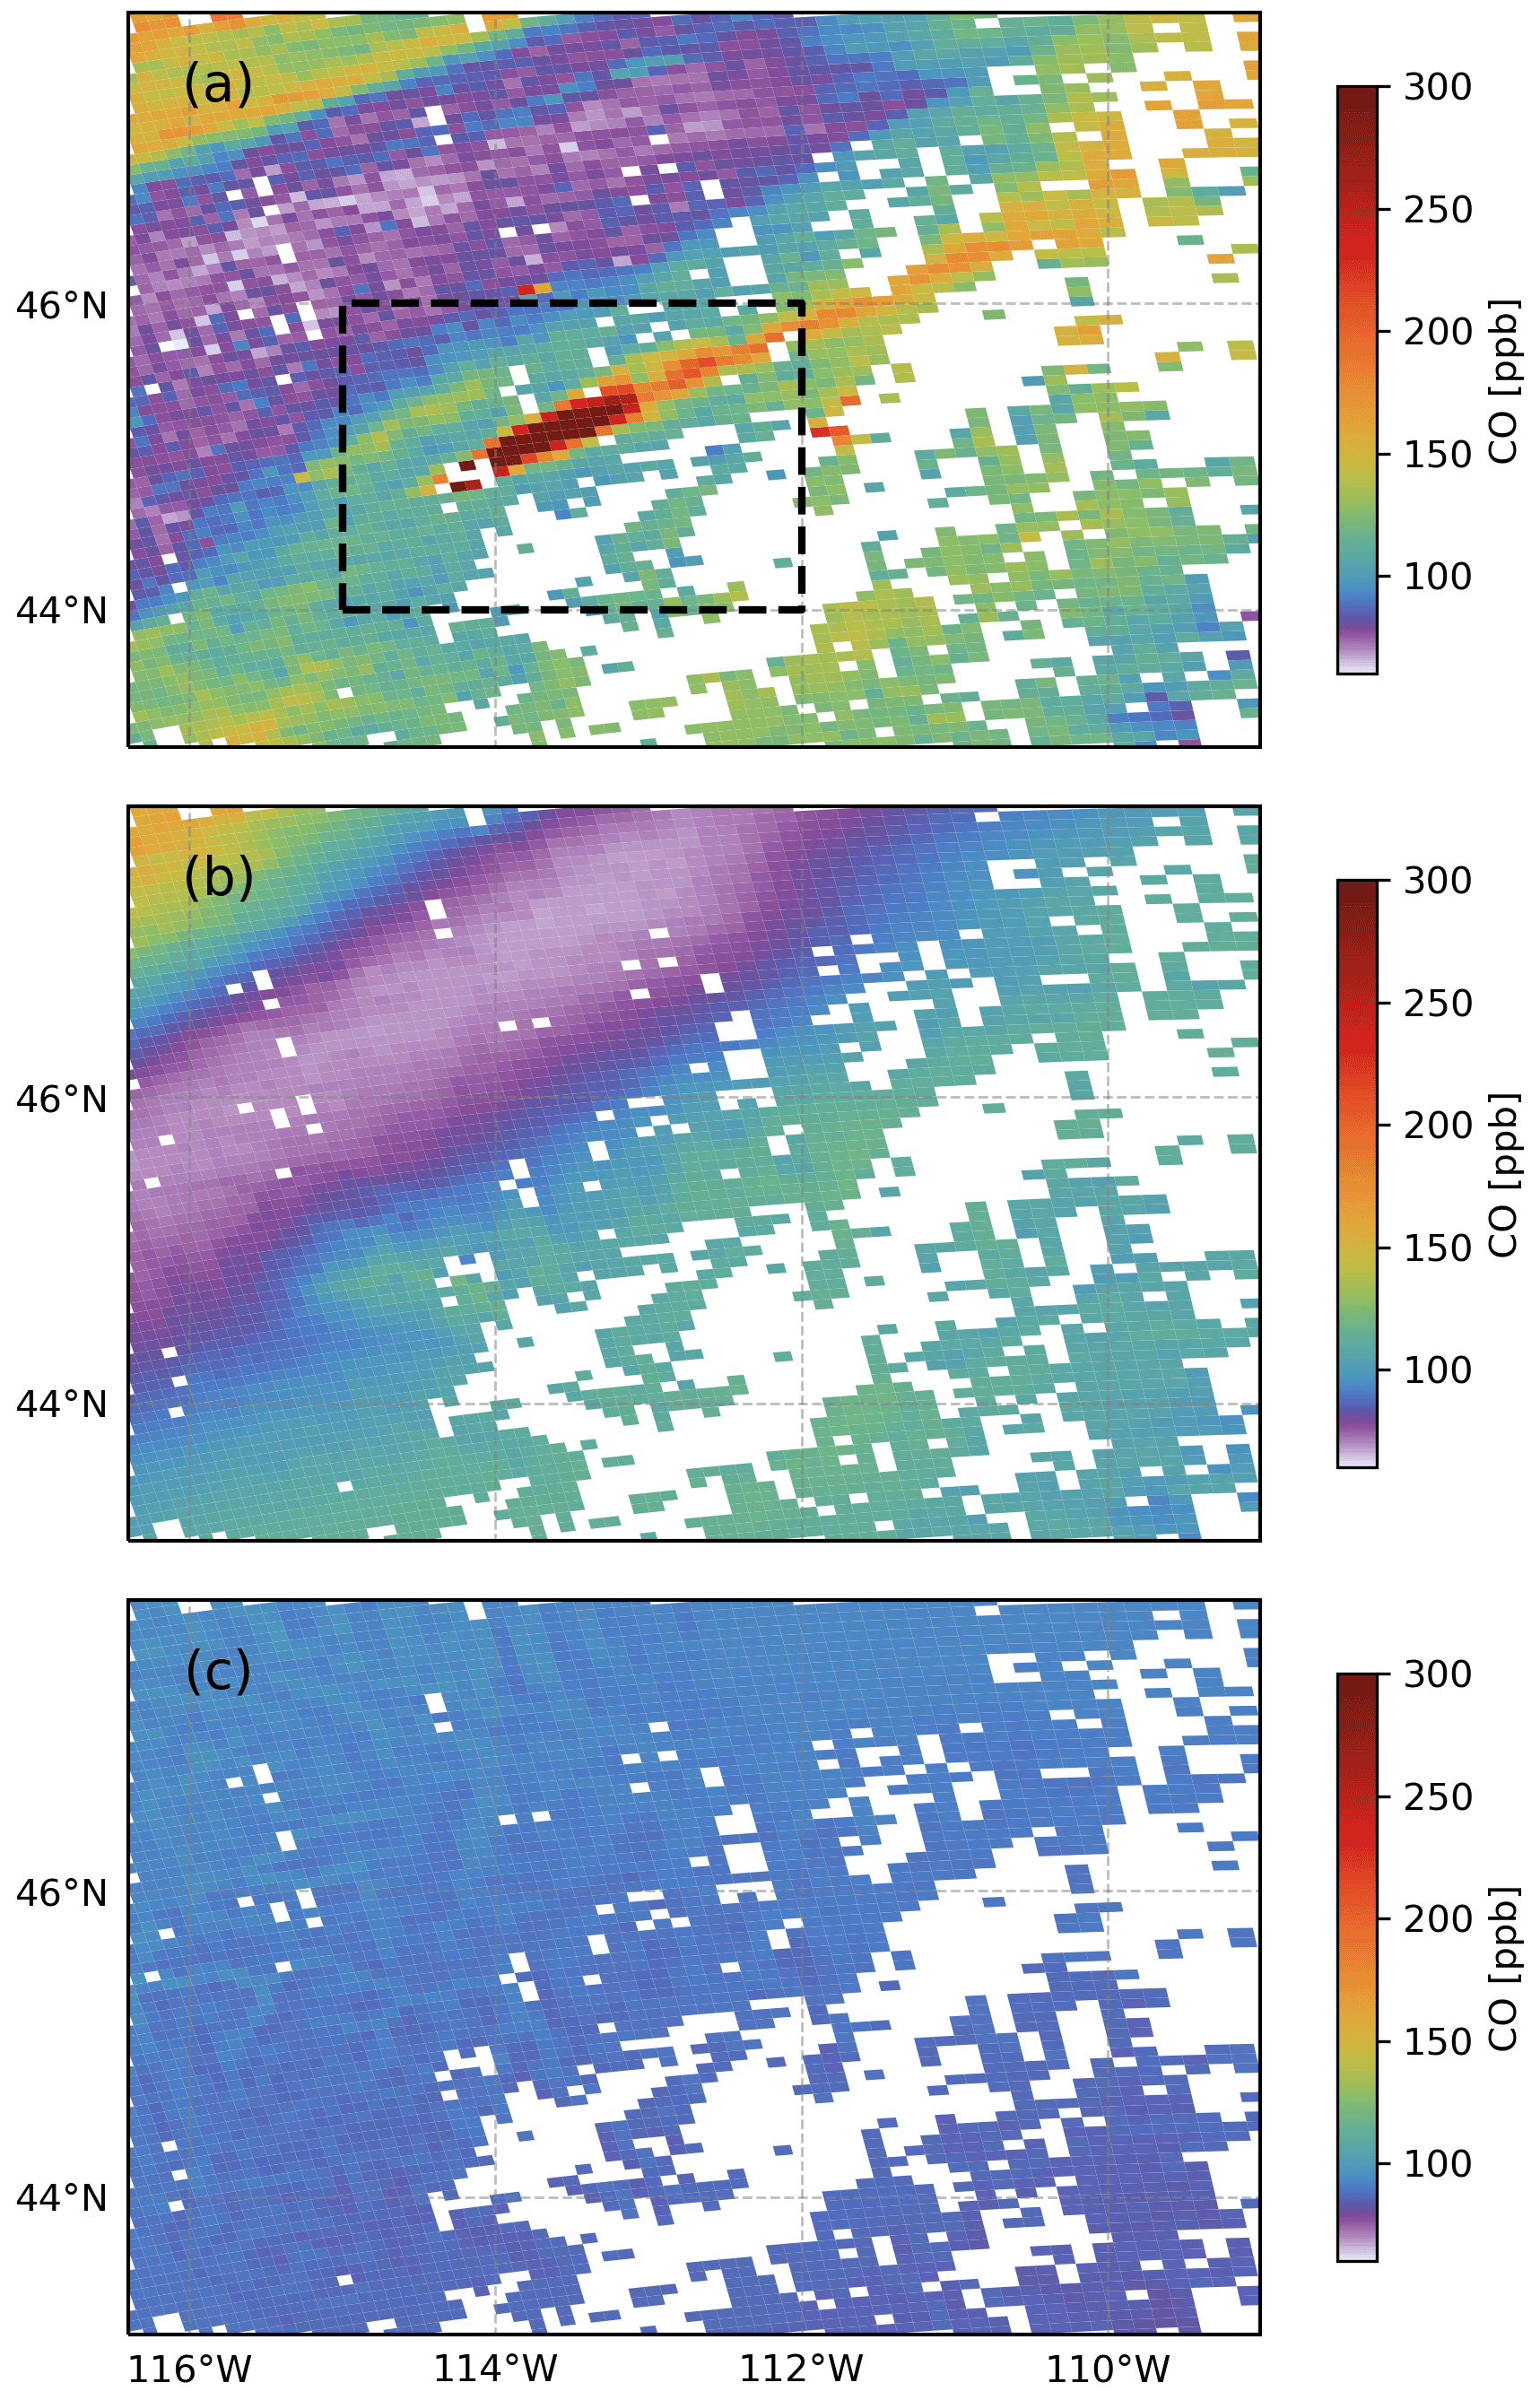
Figure 4CO total columns for 12 August 2018 from TROPOMI orbit 4305 (a), the CAMS-IFS model (b), and the TM5 model (c). TROPOMI measurements show elevated CO from the Rabbit Foot Fire near Boise, Idaho, which was not captured by either of the two models. The black dashed box shows the region analyzed in our a posteriori profile retrieval analysis. Here, 71 column retrievals were selected. The spatial resolution of TROPOMI is 5.5×7 km2, of CAMS-IFS 40×40, and of TM5 3×2 ∘. CAMS-IFS and TM5 are interpolated in time and space to the TROPOMI ground pixels, and the model data are smoothed with the TROPOMI total column averaging kernels.
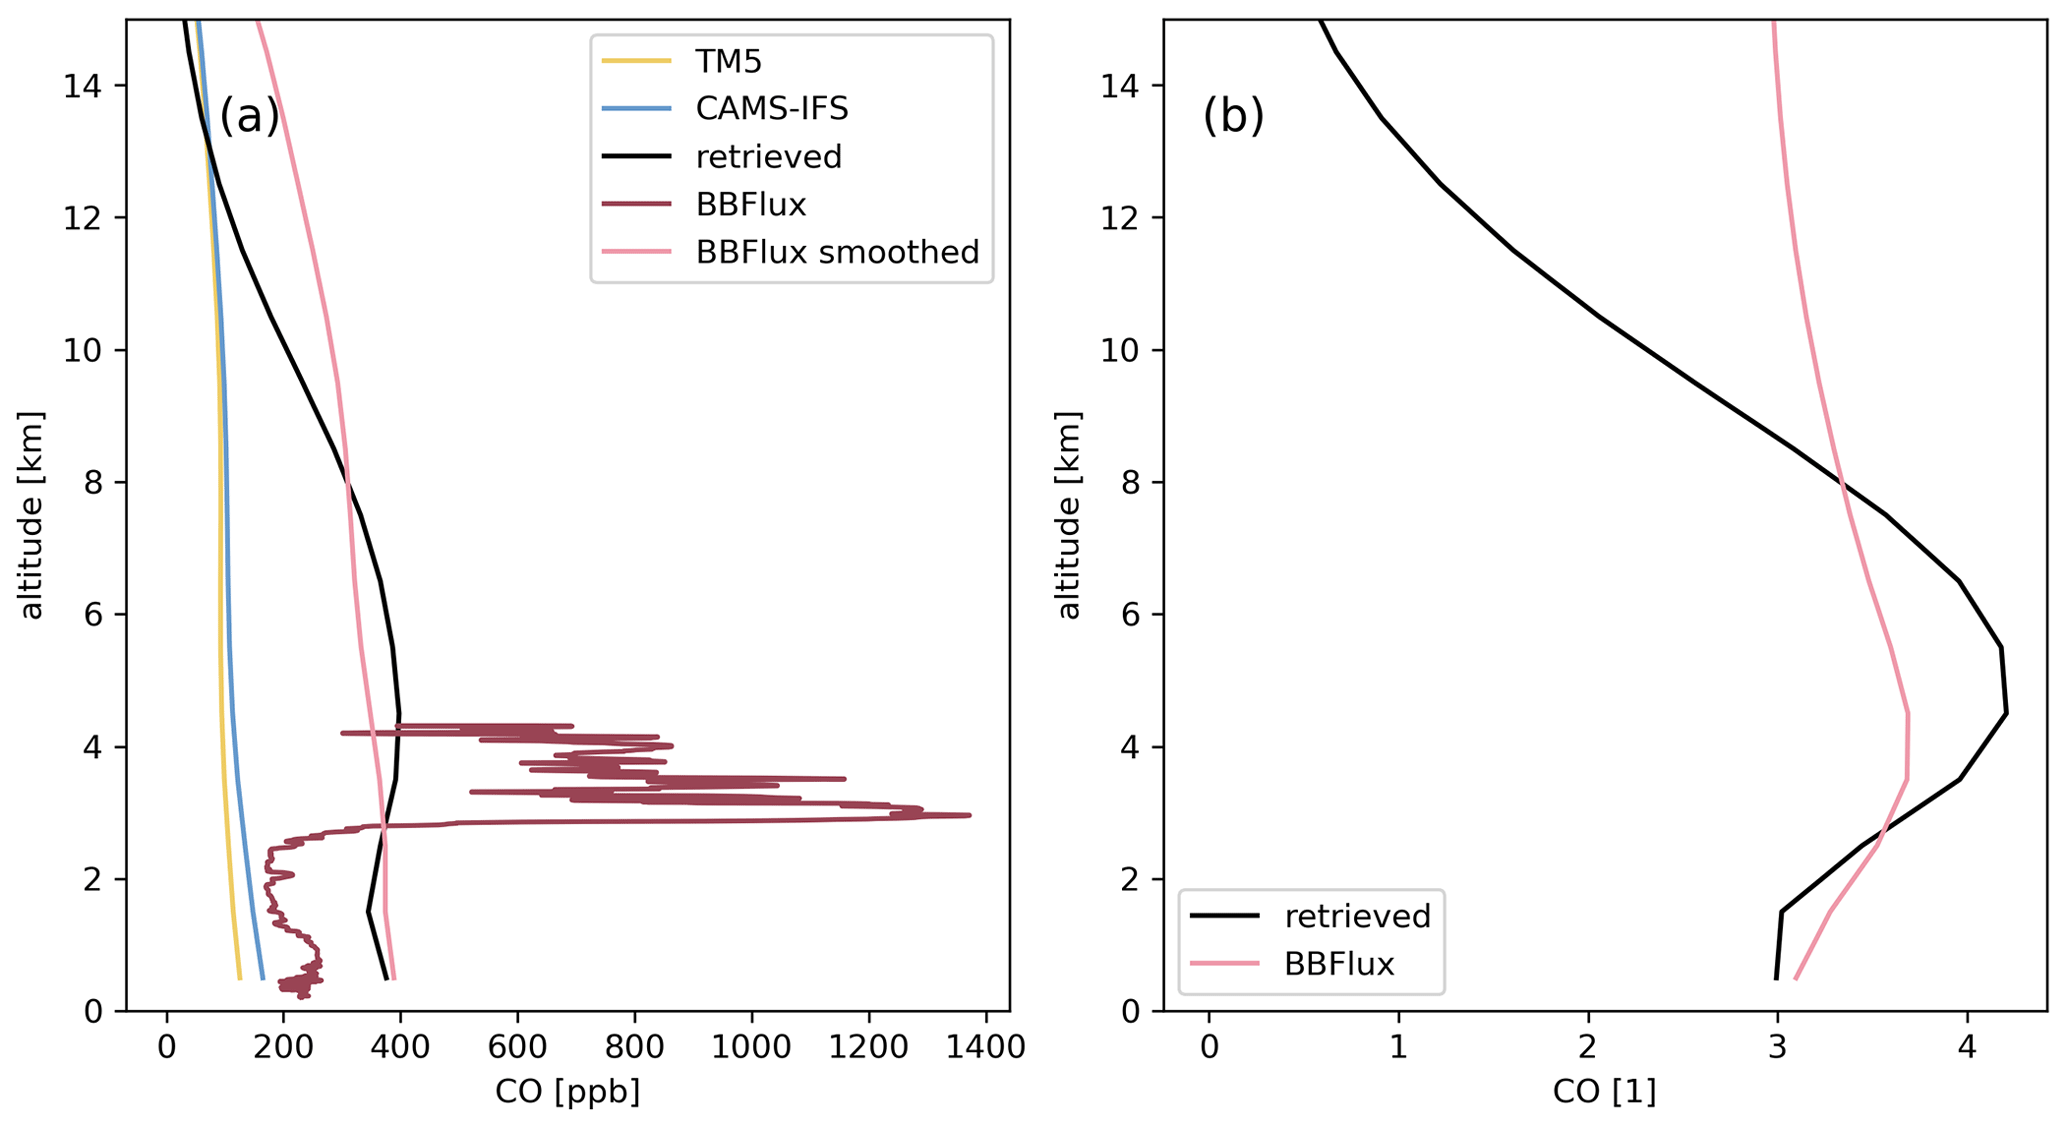
Figure 5Vertical CO profile retrieved from the elevated TROPOMI CO column measurements on 12 August 2018 caused by the “Rabbit Foot Fire” near Boise in Idaho (black) in comparison to the one of TM5 (yellow), CAMS-IFS (original data in grey and smoothed with the averaging kernel of the a posteriori profile retrieval in blue), and BB-FLUX (red). The profiles in panel (a) are given in parts per billion and in panel (b) in fraction of TM5, which is the a priori of the TROPOMI CO retrieval.
4.2 Pollution transport from Siberia to Canada
Figure 6 demonstrates the advantage of TROPOMI providing CO retrievals with daily global coverage. It allows one to track the transport of pollution within the atmosphere. Figure 6a shows TROPOMI CO columns measured on 14 August 2018; it shows strong biomass burning sources in Siberia with a CO plume over the Arctic Ocean. Figure 6d depicts the corresponding TROPOMI CO measurements on 17 August 2018. Here, the CO pollution plume had already reached Canada. Long-range transports like this predominantly take place in higher altitudes of the atmosphere, which makes this case especially interesting for our study. The atmospheric transport shown by TROPOMI and CAMS are in remarkably good agreement (see Fig. 6b, e) with a bias of 5.32 ppb (7 %) and 3.31 ppb (5 %) and a Pearson correlation of 0.65 and 0.66 for 14 and 17 August 2018, respectively (the statistics were calculated for the whole map shown, TROPOMI-CAMS-IFS). However, the CO enhancement over Canada modeled by CAMS is much lower than the one measured by TROPOMI; nearer to Siberia, CAMS gives CO enhancements which are not seen by TROPOMI. The reason might be a time mismatch between the real emissions and the ones assumed in the forecast run of CAMS-IFS which are from the day before. Furthermore, the CO enhancements modeled by CAMS-IFS at the source of the biomass burning in Siberia show also strong deviations from TROPOMI. The modeled CO does not reflect all enhancements seen by TROPOMI and seem to be more dispersed than the satellite measurements. This is also reflected by the profile comparison for this case shown in Fig. 7. Here one single profile was retrieved for each of the 2 d (14 and 17 August 2018) from all TROPOMI column measurements that fall within the black dashed boxes shown in Fig. 6a and d. The black dashed boxes were chosen empirically to capture the elevated CO values of the event. This time the a posteriori retrieval has a higher DFS of 2.5 for 14 August and 3 for 17 August, which allows us to obtain more vertical information of the trace gas. The vertical CO profile (black) retrieved by the a posteriori profile retrieval from the TROPOMI measurements on 14 August 2018 shows a clear plume structure at an altitude of 7–8 km with elevated CO levels at the ground (Fig. 7a). The CAMS-IFS profile (blue) shows no plume structure but slightly elevated CO values at the ground. This changes for 17 August 2018, as shown in Fig. 7b. Here, the vertical profile of the a posteriori retrieval (black) shows a more pronounced plume shape in the same altitude as found on 14 August but with lower CO values at the ground. A reason for this could be the atmospheric transport of the pollution away from its source. The CAMS-IFS profile (blue) shows now a similar plume shape as the TROPOMI profile, but generally the CO enhancement is lower, which is in agreement with the column comparison we discussed before. The CAMS-IFS CO profile was smoothed with the averaging kernel of the TROPOMI a posteriori profile retrieval for this comparison. The original CAMS-IFS profile shown in grey shows an even more pronounced plume signature. TM5 (yellow) shows no enhancement at all and is for both days more representative of a background CO profile of the scene.
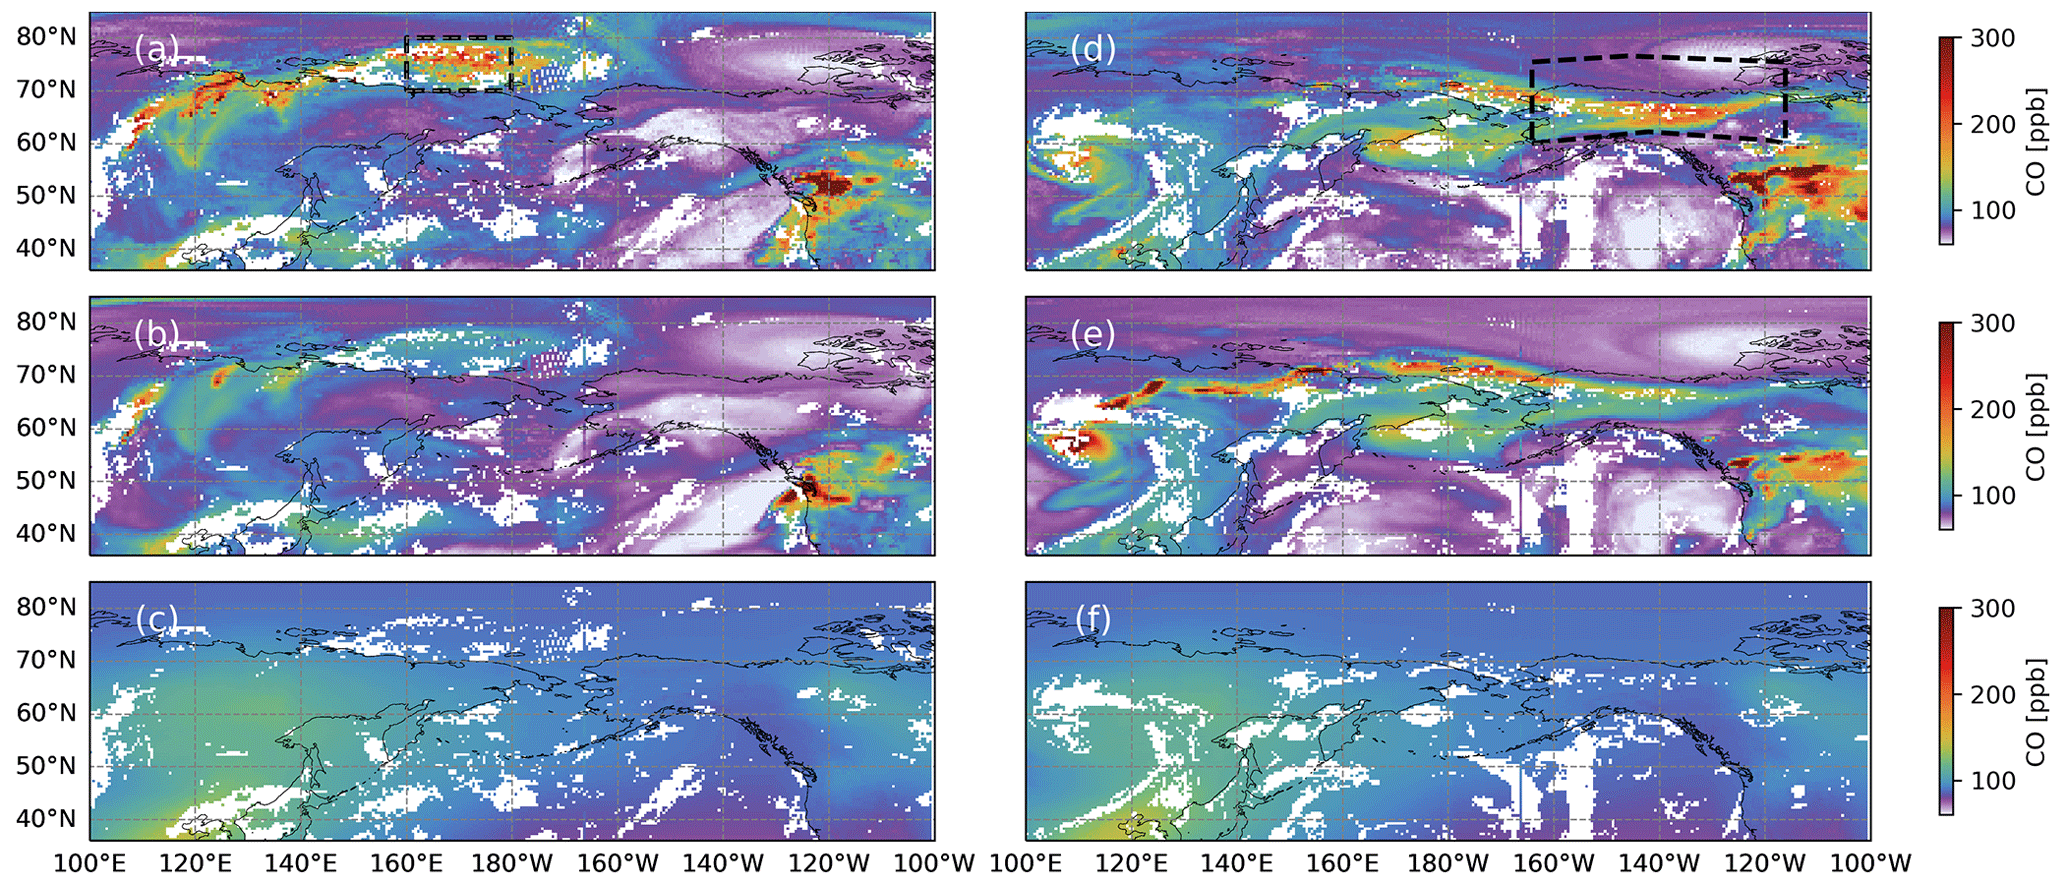
Figure 6Transport of CO pollution from fires in Siberia to Canada is shown on 14 August 2018 (a, b, c) and 17 August 2018 (d, e, f). TROPOMI total column measurements (a, d) are compared with simulation of CAMS-IFS (b, e) and TM5 (c, f). The black dashed boxes mark the region we use for the a posteriori profile retrieval for the 2 d. For this, on 14 August 1.5 k and on 17 August 1.2 k column retrievals were selected. The spatial resolution of TROPOMI is 5.5×7 km2, of CAMS-IFS 40×40, and of TM5 3×2∘. CAMS-IFS and TM5 are interpolated in time and space to the TROPOMI ground pixels, and the model data are smoothed with the TROPOMI total column averaging kernels.
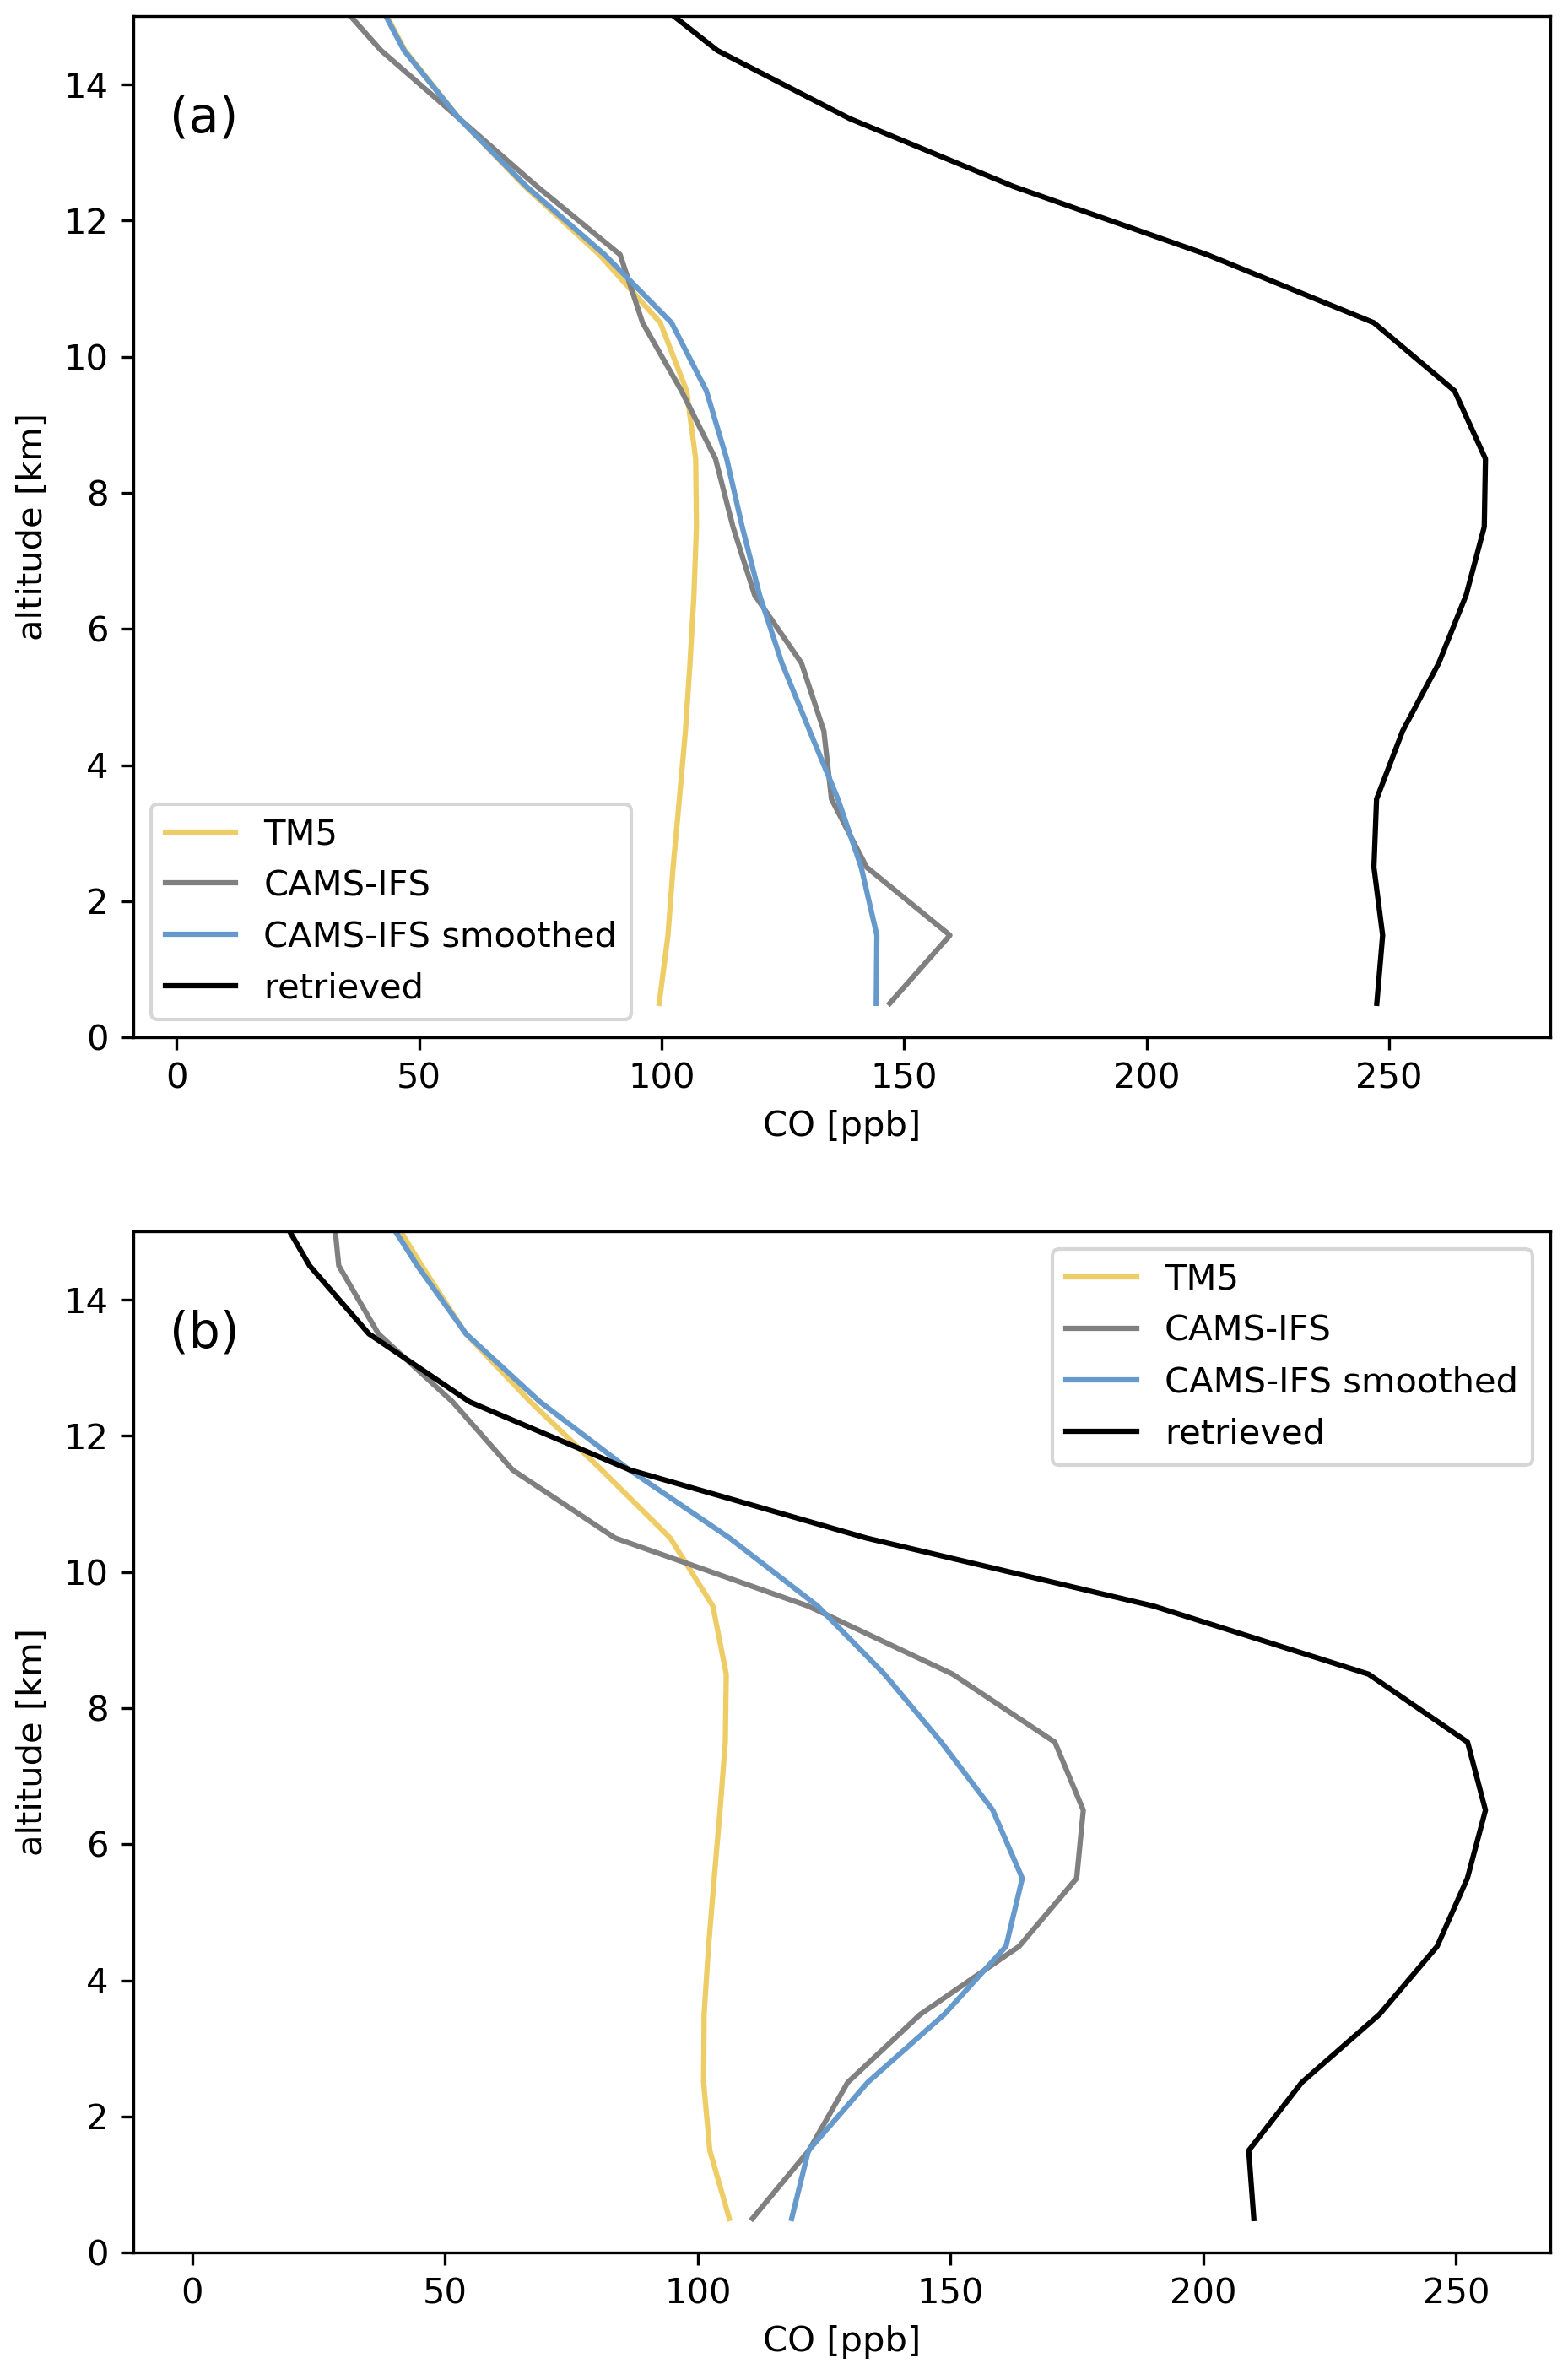
Figure 7Vertical CO profile retrieved from the elevated TROPOMI CO column measurements on (a) 14 and (b) 17 August 2018 caused by pollution transport from Siberia to Canada (black) in comparison to the one of TM5 (yellow) and CAMS-IFS (original data in grey and smoothed with the averaging kernel of the a posteriori profile retrieval in blue).
4.3 Seasonal biomass burning in the Amazon
As a last example, the a posteriori profile retrieval is deployed to estimate a vertical CO profile for a longer time series of TROPOMI CO column measurements. This also shows that the approach is computationally efficient enough to handle bigger datasets. Figure 8 shows averaged TROPOMI CO columns for (a) between 16 July and 1 August 2019 before the biomass burning season and (d) between 1 August and 15 August 2019 during the biomass burning season. Hence, burning activities lead to an enhanced CO background concentration, but also individual pollution sources can be distinguished. The agreement between TROPOMI and CAMS-IFS is again good with a bias of 5.07 ppb (8 %) and 5.35 ppb (8 %) and a Pearson correlation coefficient of 0.97 and 0.97 before and during the biomass burning season (the statistics were calculated for the whole map shown, TROPOMI-CAMS-IFS). However, CAMS-IFS is missing some CO enhancement by individual point sources, and in general individual pollution sources look more dispersed in the model run. We deploy the a posteriori profile retrieval for the two time ranges specified to estimate a vertical CO profile for an unpolluted and polluted environment. The black dashed box in Fig. 8d indicates the region that we used to select all TROPOMI CO columns for the a posteriori profile retrieval that estimates one single vertical profile from it. The black dashed box was chosen empirically to include the region of the strongest biomass burning in that year. The resulting vertical profiles are shown in Fig. 9 (black) together with the ones by TM5 (yellow) and CAMS-IFS (blue) that we smoothed for the comparison with the averaging kernels of the a posteriori profile retrieval. The DFS of the retrieval before the biomass burning season and during the biomass burning season is 2.5. For the data before the biomass burning, all three profiles in Fig. 9a agree well and represent a typical unpolluted background situation. The profile of the a posteriori retrieval does not deviate much from its a priori TM5 profile here. However, for data during the biomass burning event this is considerable different. The a posteriori profile agrees very well with the CAMS-IFS model and even can reproduce a similar vertical gradient of the CO concentration field modeled by CAMS-IFS. This shows how much information about the vertical distribution of CO is in the TROPOMI data because of the different vertical sensitivities of the measurements.
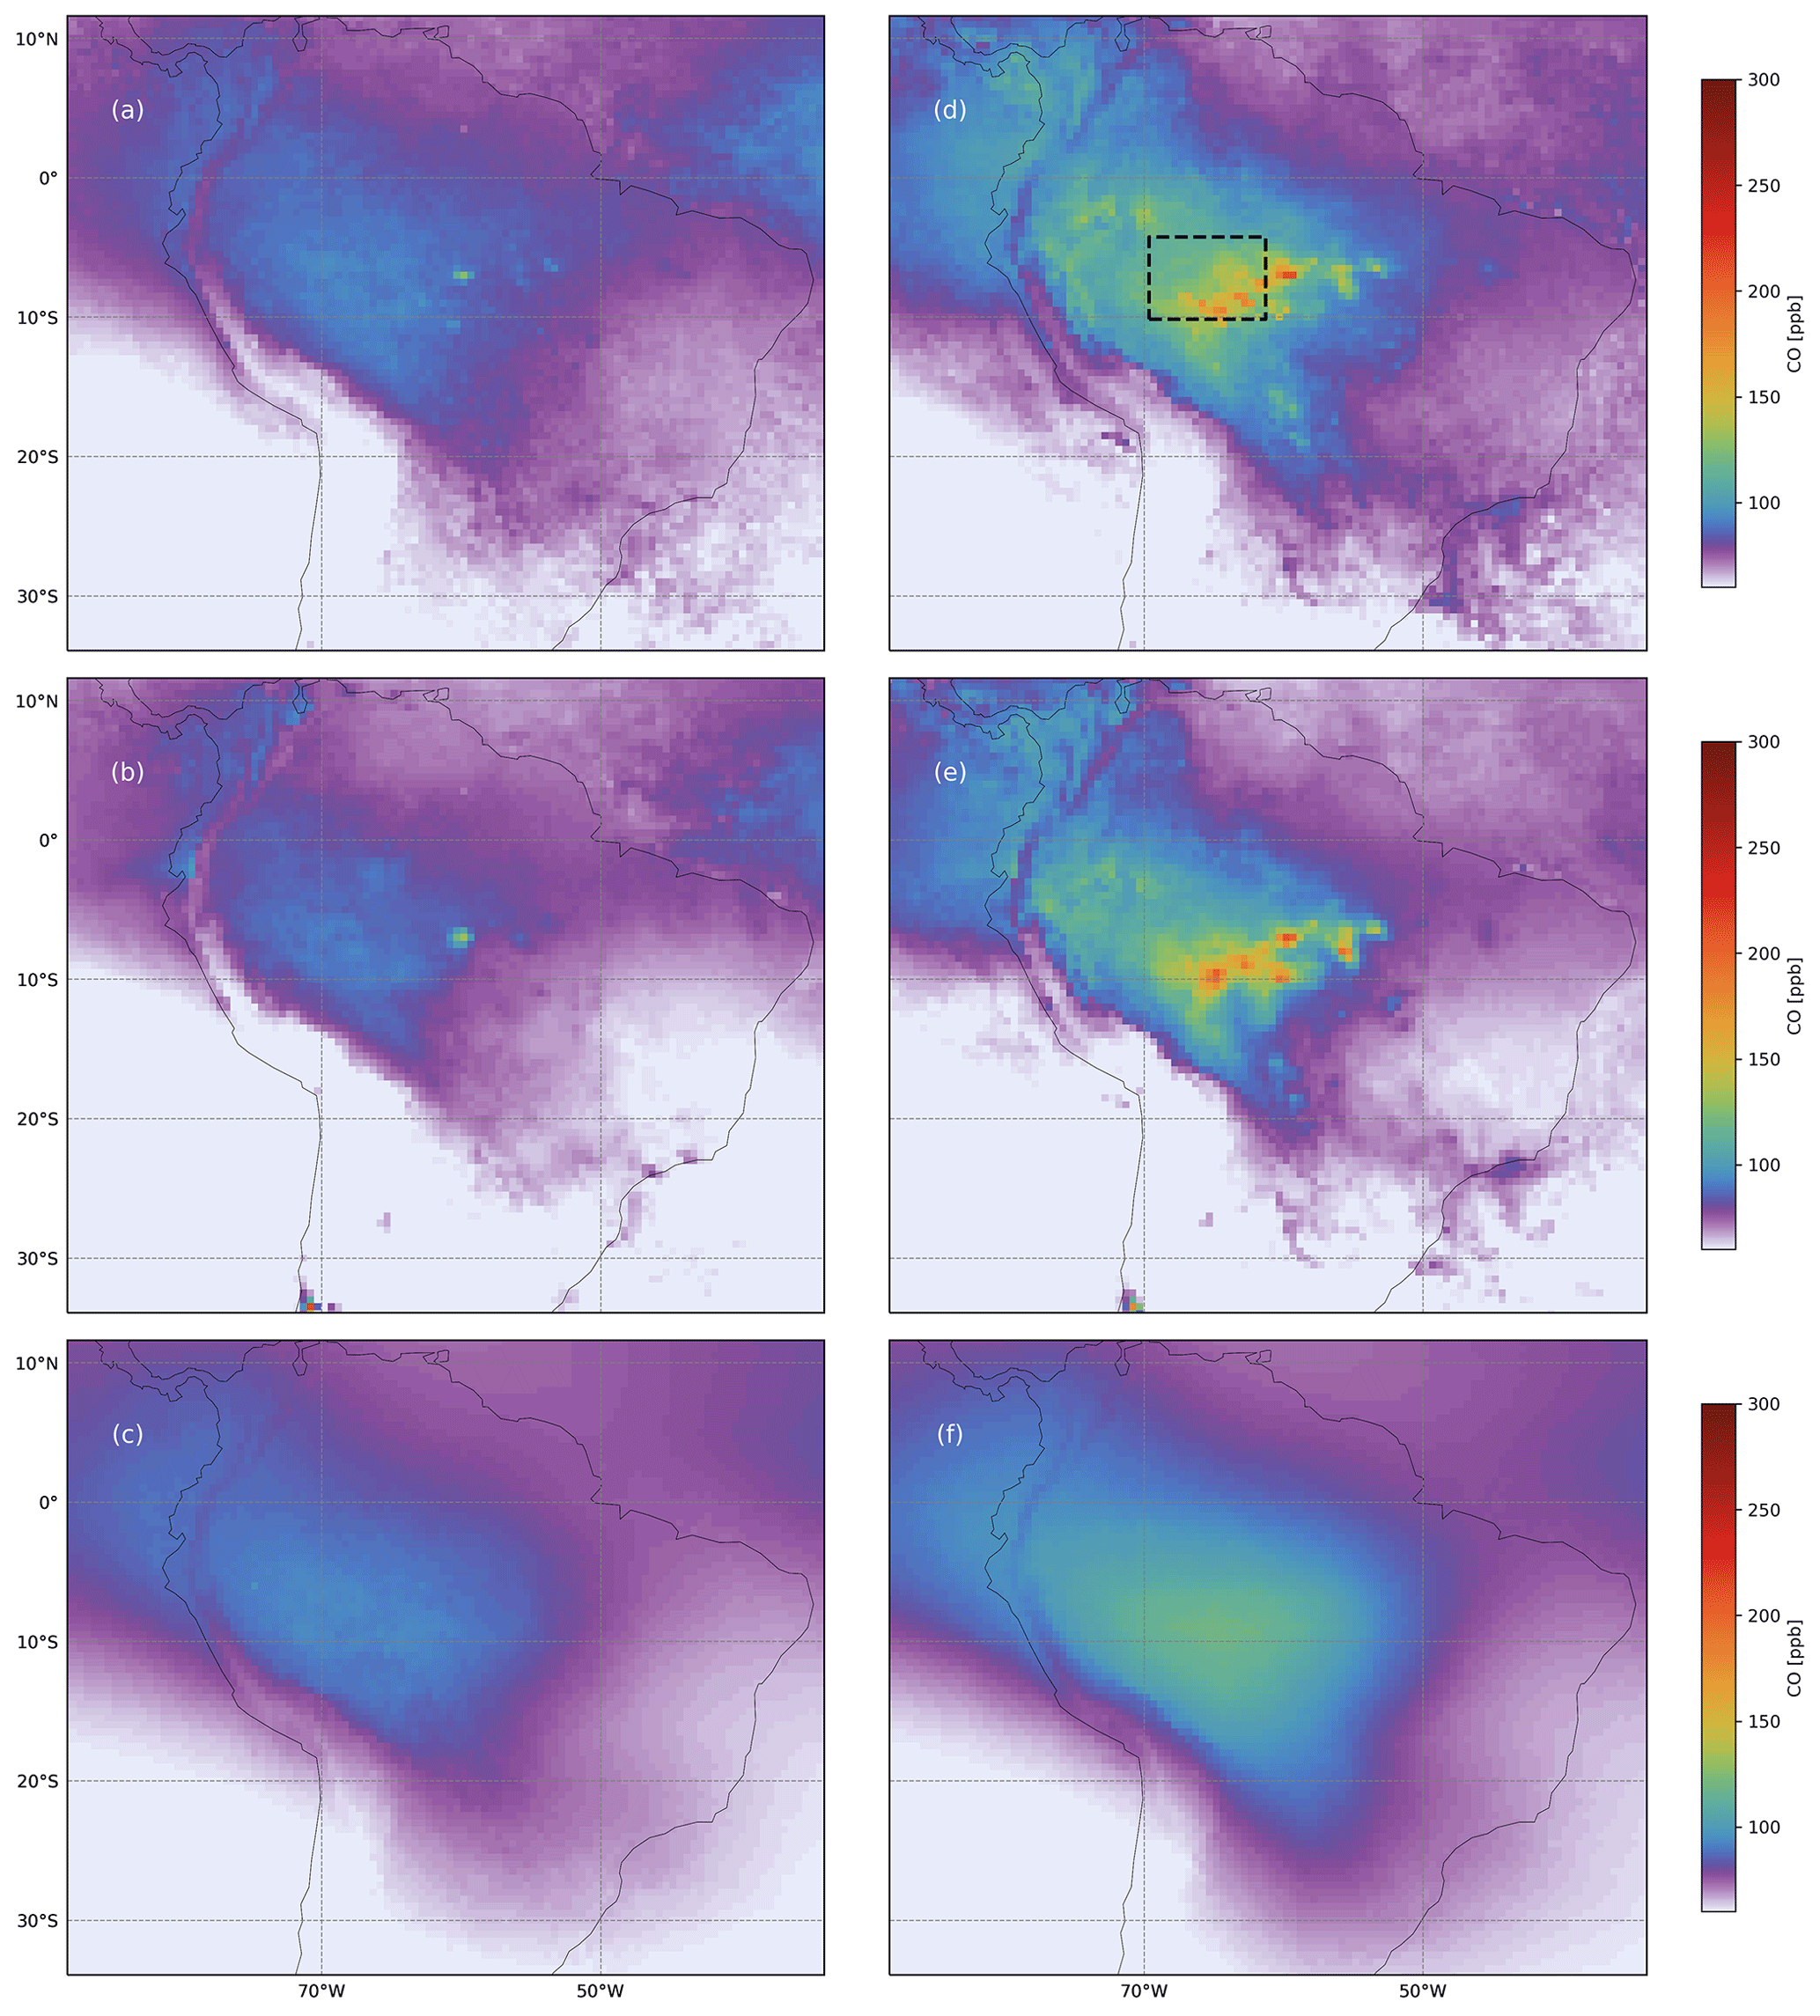
Figure 8Accumulation of CO pollution over the Amazon measured by TROPOMI (a, d) and modeled by CAMS-IFS (b, e) and TM5 (c, f). Left column is the averaged CO field before (16 July to 1 August 2019) and the right column within the burning season (1 to 15 August 2019). The black dashed box marks the region we use for the a posteriori profile retrieval. For this, 88 000 column retrievals were selected before and 83 000 within the burning season. The spatial resolution of TROPOMI is 5.5×7 km2, of CAMS-IFS 40×40, and of TM5 3×2 ∘. CAMS-IFS and TM5 are interpolated in time and space to the TROPOMI ground pixels, and the model data are smoothed with the TROPOMI total column averaging kernels before the data were averaged on a 0.5×0.5∘ grid.
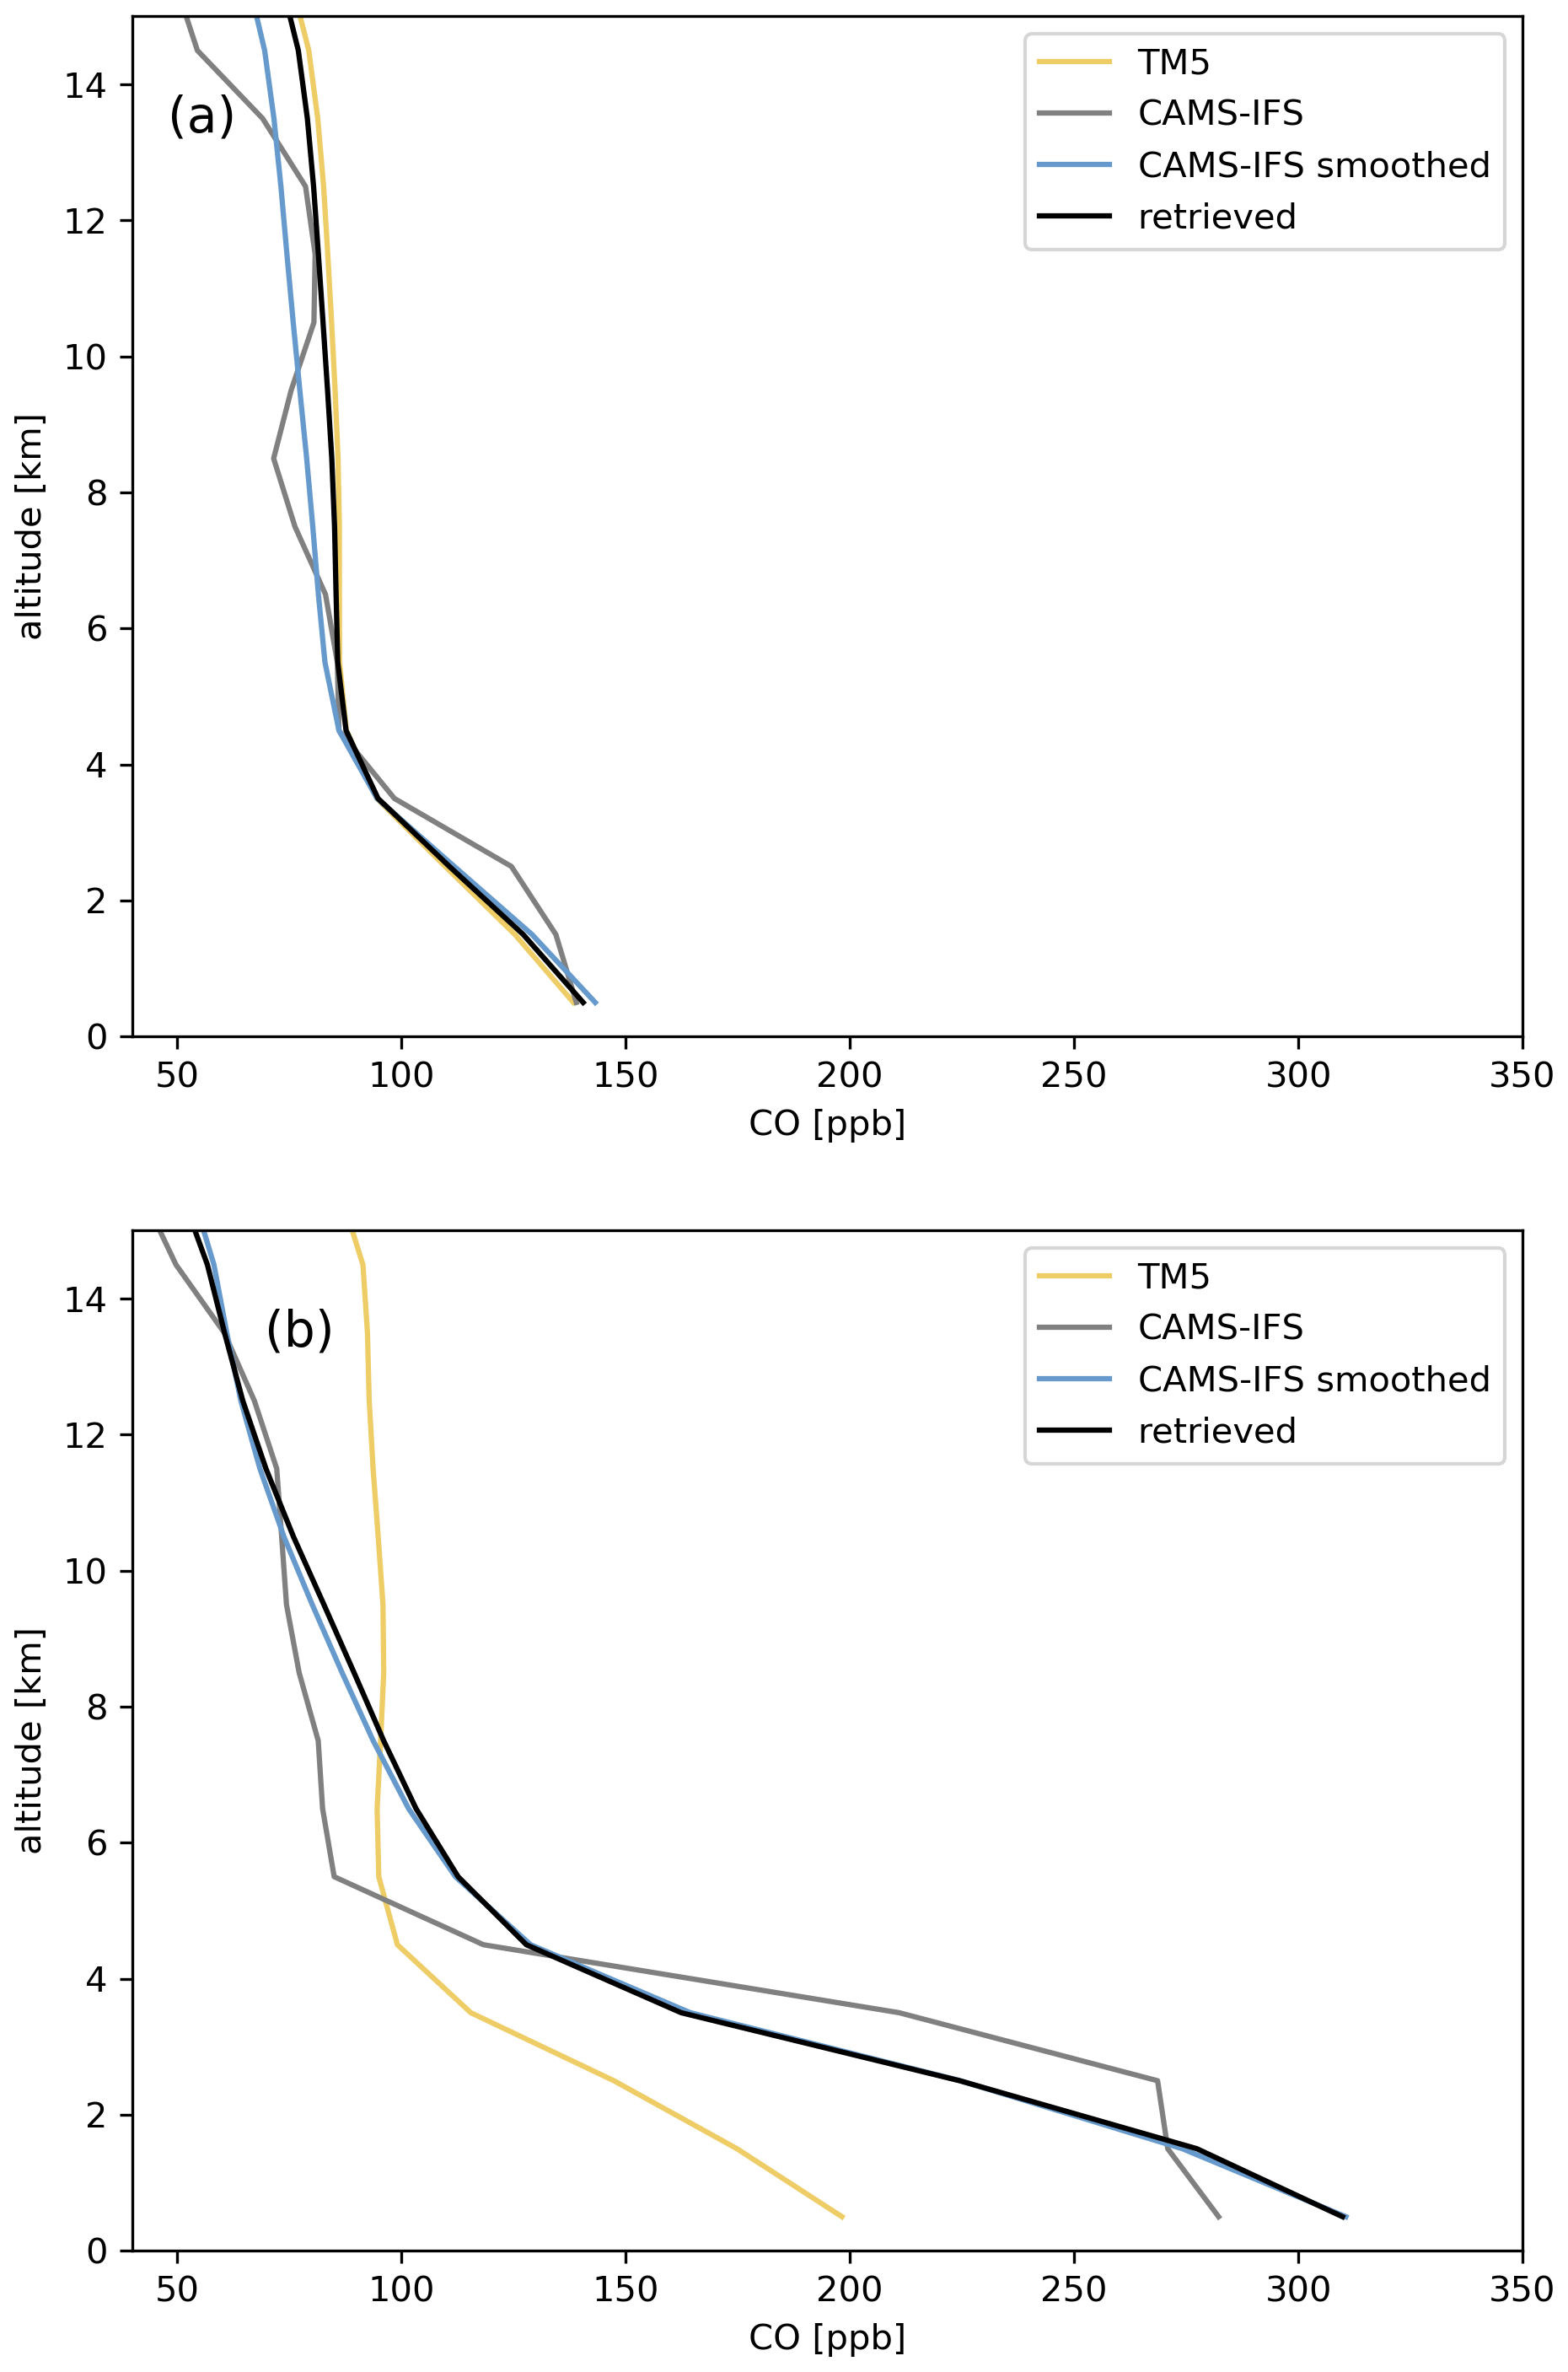
Figure 9Vertical CO profiles retrieved from TROPOMI CO column measurements over the Amazon before (16 July to 1 August 2019) and within the burning season (1 to 15 August 2019) in comparison with the one of TM5 (yellow) and CAMS-IFS (original data in grey and smoothed with the averaging kernel of the a posteriori profile retrieval in blue).
In this study, we deploy an a posteriori profile retrieval that combines individual TROPOMI CO column retrievals with different vertical sensitivities and obtains a vertical concentration profile of the CO. We test the approach on three CO pollution events for which we compare the retrieved vertical CO profiles and total columns of TROPOMI with collocated CAMS-IFS simulations that do not assimilate TROPOMI CO data yet.
An example of a small-scale pollution event is the Rabbit Foot Fire in Idaho on 12 August 2018. Here, a distinct CO pollution plume is sensed by the retrieved CO columns from measurements of only one TROPOMI overpass. CAMS-IFS shows good agreement with the background CO concentration measured by TROPOMI, but no pollution plume is present in the model data. We found that for this case no MOPITT data were available and that also the IASI data did not capture the plume. Hence, here the CAMS-IFS simulation fully relies on the emissions assumed in the model. The vertical CO profile that we retrieved from the TROPOMI column retrievals within the plume shows the pollution at an altitude of about 5 km, which agrees reasonably well with airborne in situ measurements of the BB-FLUX campaign registering the maximum at 3–4 km. This example depicts a challenging case to estimate a vertical profile of CO with the a posteriori retrieval because of the limited data available for a single event. Since CAMS-IFS does not include the pollution event, the example indicates the potential of TROPOMI data to improve the model on finer spatial scales.
The transport of CO pollution from wildfires in Siberia to Canada that took place between 14 and 17 August 2018 is an example of a large-scale event. For both days, we find the CAMS-IFS and TROPOMI total columns in good agreement. However the CO enhancement in the pollution plume is generally lower in the CAMS-IFS data than in the TROPOMI observations. The reason for this could be a time lag of the assumed emissions in the model which are taken from the day before, since the elevated CO at the source region seems to be higher in CAMS-IFS compared to the TROPOMI data on 17 August 2019. Furthermore, the pollution sources reflected by the CAMS-IFS columns seem to be more dispersed as shown by the TROPOMI data. We retrieved a vertical profile of CO by selecting the TROPOMI column measurements within the pollution plume over Canada on 17 August 2018. The shape of the profile agrees well with the modeled one by CAMS-IFS but detects the pollution a bit higher up in the atmosphere (7 km compared to 5 km).
An example of a pollution event that spans over a longer time is the seasonal biomass burning in the Amazon region. Here, we analyze the period before (16 July–1 August 2019) and during the burning (1 August–15 August 2019). The total columns of TROPOMI and CAMS-IFS agree reasonably well, but point sources in the CAMS-IFS data seem to be too dispersed compared to TROPOMI. The vertical CO profile we retrieved before the burning season does not deviate significantly from our a priori assumption based on TM5. The profile derived from the TROPOMI measurements during the burning season agrees very well with the CAMS-IFS data, showing even a similar vertical gradient between ground and 14 km altitude.
The vast amount of TROPOMI data will strongly constrain the total column field of CAMS-IFS model. Moreover, in this study we conclude that to some extent the vertical distribution of CO assumed in the model can be improved by assimilating the TROPOMI data product. This is due to the fact that retrievals under clear-sky and cloud conditions as well as varying observations geometries have distinct vertical sensitivities and by that are effectively probing CO at different altitudes. This shows the benefit and need to interpret the TROPOMI CO column measurements together with their vertical sensitivities whenever possible. Finally, not only clear-sky measurements are valuable, but also cloud-impacted measurements can yield useful remotely sensed data.
The TROPOMI CO dataset is available for download at https://s5phub.copernicus.eu/dhus/#/home (ESA, 2023). The in situ measurements of the BB-FLUX project can be downloaded from https://doi.org/10.26023/XESM-PE98-TT0T (Volkamer, 2023). The CAMS-IFS data are available at https://ads.atmosphere.copernicus.eu/cdsapp#!/dataset/cams-global-atmospheric-composition-forecasts?tab=overview (ECMWF, 2023).
TB and JL performed the TROPOMI CO retrieval and data analysis. The BB-FLUX team provided the airborne in situ measurements. All authors discussed the results and commented on the manuscript.
At least one of the (co-)authors is a member of the editorial board of Atmospheric Measurement Techniques. The peer-review process was guided by an independent editor, and the authors also have no other competing interests to declare.
The presented work has been performed in the framework of the Sentinel-5 Precursor Validation Team (S5PVT) or Level 1/Level 2 Product Working Group activities. The results are based on S5P L1B version 1 data.
Publisher's note: Copernicus Publications remains neutral with regard to jurisdictional claims in published maps and institutional affiliations.
The presented material contains modified Copernicus data (2017, 2018). The TROPOMI data processing was carried out on the Dutch national e-infrastructure with the support of the SURF cooperative. Rainer Volkamer acknowledges financial support from US National Science Foundation.
This research has been supported by the National Science Foundation (grant no. AGS-1754019).
This paper was edited by Sandip Dhomse and reviewed by two anonymous referees.
Borsdorff, T., Hasekamp, O. P., Wassmann, A., and Landgraf, J.: Insights into Tikhonov regularization: application to trace gas column retrieval and the efficient calculation of total column averaging kernels, Atmos. Meas. Tech., 7, 523–535, https://doi.org/10.5194/amt-7-523-2014, 2014. a, b, c
Borsdorff, T., aan de Brugh, J., Hu, H., Hasekamp, O., Sussmann, R., Rettinger, M., Hase, F., Gross, J., Schneider, M., Garcia, O., Stremme, W., Grutter, M., Feist, D. G., Arnold, S. G., De Mazière, M., Kumar Sha, M., Pollard, D. F., Kiel, M., Roehl, C., Wennberg, P. O., Toon, G. C., and Landgraf, J.: Mapping carbon monoxide pollution from space down to city scales with daily global coverage, Atmos. Meas. Tech., 11, 5507–5518, https://doi.org/10.5194/amt-11-5507-2018, 2018a. a, b
Borsdorff, T., de Brugh, J. A., Hu, H., Aben, I., Hasekamp, O., and Landgraf, J.: Measuring Carbon Monoxide With TROPOMI: First Results and a Comparison With ECMWF‐IFS Analysis Data, Geophys. Res. Lett., 45, 2826–2832, https://doi.org/10.1002/2018GL077045, 2018b. a, b
Borsdorff, T., aan de Brugh, J., Pandey, S., Hasekamp, O., Aben, I., Houweling, S., and Landgraf, J.: Carbon monoxide air pollution on sub-city scales and along arterial roads detected by the Tropospheric Monitoring Instrument, Atmos. Chem. Phys., 19, 3579–3588, https://doi.org/10.5194/acp-19-3579-2019, 2019. a, b, c
Borsdorff, T., García Reynoso, A., Maldonado, G., Mar-Morales, B., Stremme, W., Grutter, M., and Landgraf, J.: Monitoring CO emissions of the metropolis Mexico City using TROPOMI CO observations, Atmos. Chem. Phys., 20, 15761–15774, https://doi.org/10.5194/acp-20-15761-2020, 2020. a
Clerbaux, C., Boynard, A., Clarisse, L., George, M., Hadji-Lazaro, J., Herbin, H., Hurtmans, D., Pommier, M., Razavi, A., Turquety, S., Wespes, C., and Coheur, P.-F.: Monitoring of atmospheric composition using the thermal infrared IASI/MetOp sounder, Atmos. Chem. Phys., 9, 6041–6054, https://doi.org/10.5194/acp-9-6041-2009, 2009. a
Cordero, P. R. F., Bayly, K., Man Leung, P., Huang, C., Islam, Z. F., Schittenhelm, R. B., King, G. M., and Greening, C.: Atmospheric carbon monoxide oxidation is a widespread mechanism supporting microbial survival, The ISME Journal, 13, 2868–2881, https://doi.org/10.1038/s41396-019-0479-8, 2019. a
Deeter, M., Francis, G., Gille, J., Mao, D., Martínez-Alonso, S., Worden, H., Ziskin, D., Drummond, J., Commane, R., Diskin, G., and McKain, K.: The MOPITT Version 9 CO product: sampling enhancements and validation, Atmos. Meas. Tech., 15, 2325–2344, https://doi.org/10.5194/amt-15-2325-2022, 2022. a
Deeter, M. N., Martínez-Alonso, S., Edwards, D. P., Emmons, L. K., Gille, J. C., Worden, H. M., Pittman, J. V., Daube, B. C., and Wofsy, S. C.: Validation of MOPITT Version 5 thermal-infrared, near-infrared, and multispectral carbon monoxide profile retrievals for 2000–2011, J. Geophys. Res.-Atmos., 118, 6710–6725, https://doi.org/10.1002/jgrd.50272, 2013. a
ECMWF: CAMS global atmospheric composition forecasts, ECMWF [data set], https://ads.atmosphere.copernicus. eu/cdsapp#!/dataset/cams-global-atmospheric-composition-forecasts?tab=overview, last access: 7 June 2023. a
ESA: TROPOMI Carbon Monoxide Product, ESA [data set], https://s5phub.copernicus.eu/dhus/#/home, last access: 7 June 2023. a
George, M., Clerbaux, C., Bouarar, I., Coheur, P.-F., Deeter, M. N., Edwards, D. P., Francis, G., Gille, J. C., Hadji-Lazaro, J., Hurtmans, D., Inness, A., Mao, D., and Worden, H. M.: An examination of the long-term CO records from MOPITT and IASI: comparison of retrieval methodology, Atmos. Meas. Tech., 8, 4313–4328, https://doi.org/10.5194/amt-8-4313-2015, 2015. a
Gerbig, C., Schmitgen, S., Kley, D., Volz-Thomas, A., Dewey, K., and Haaks, D.: An improved fast-response vacuum-UV resonance fluorescence CO instrument, J. Geophys. Res.-Atmos., 104, 1699–1704, https://doi.org/10.1029/1998JD100031, 1999. a
Gloudemans, A. M. S., de Laat, A. T. J., Schrijver, H., Aben, I., Meirink, J. F., and van der Werf, G. R.: SCIAMACHY CO over land and oceans: 2003–2007 interannual variability, Atmos. Chem. Phys., 9, 3799–3813, https://doi.org/10.5194/acp-9-3799-2009, 2009. a
Hansen, P. C. and O'Leary, D. P.: The Use of the L-Curve in the Regularization of Discrete Ill-Posed Problems, SIAM J. Sci. Comput., 14, 1487–1503, https://doi.org/10.1137/0914086, 1993. a
Holloway, T., Levy, H., and Kasibhatla, P.: Global distribution of carbon monoxide, J. Geophys. Res.-Atmos., 105, 12123–12147, https://doi.org/10.1029/1999jd901173, 2000. a
Inness, A., Blechschmidt, A.-M., Bouarar, I., Chabrillat, S., Crepulja, M., Engelen, R. J., Eskes, H., Flemming, J., Gaudel, A., Hendrick, F., Huijnen, V., Jones, L., Kapsomenakis, J., Katragkou, E., Keppens, A., Langerock, B., de Mazière, M., Melas, D., Parrington, M., Peuch, V. H., Razinger, M., Richter, A., Schultz, M. G., Suttie, M., Thouret, V., Vrekoussis, M., Wagner, A., and Zerefos, C.: Data assimilation of satellite-retrieved ozone, carbon monoxide and nitrogen dioxide with ECMWF's Composition-IFS, Atmos. Chem. Phys., 15, 5275–5303, https://doi.org/10.5194/acp-15-5275-2015, 2015. a, b
Inness, A., Flemming, J., Heue, K.-P., Lerot, C., Loyola, D., Ribas, R., Valks, P., van Roozendael, M., Xu, J., and Zimmer, W.: Monitoring and assimilation tests with TROPOMI data in the CAMS system: near-real-time total column ozone, Atmos. Chem. Phys., 19, 3939–3962, https://doi.org/10.5194/acp-19-3939-2019, 2019. a
Inness, A., Aben, I., Ades, M., Borsdorff, T., Flemming, J., Jones, L., Landgraf, J., Langerock, B., Nedelec, P., Parrington, M., and Ribas, R.: Assimilation of S5P/TROPOMI carbon monoxide data with the global CAMS near-real-time system, Atmos. Chem. Phys., 22, 14355–14376, https://doi.org/10.5194/acp-22-14355-2022, 2022. a
Krol, M., Houweling, S., Bregman, B., van den Broek, M., Segers, A., van Velthoven, P., Peters, W., Dentener, F., and Bergamaschi, P.: The two-way nested global chemistry-transport zoom model TM5: algorithm and applications, Atmos. Chem. Phys., 5, 417–432, https://doi.org/10.5194/acp-5-417-2005, 2005. a, b
Landgraf, J., aan de Brugh, J., Scheepmaker, R., Borsdorff, T., Hu, H., Houweling, S., Butz, A., Aben, I., and Hasekamp, O.: Carbon monoxide total column retrievals from TROPOMI shortwave infrared measurements, Atmos. Meas. Tech., 9, 4955–4975, https://doi.org/10.5194/amt-9-4955-2016, 2016. a, b
Pommier, M., McLinden, C. A., and Deeter, M.: Relative changes in CO emissions over megacities based on observations from space, Geophys. Res. Lett., 40, 3766–3771, https://doi.org/10.1002/grl.50704, 2013. a
Rowe, J. P., Zarzana, K. J., Kille, N., Borsdorff, T., Goudar, M., Lee, C. F., Koenig, T. K., Romero-Alvarez, J., Campos, T., Knote, C., Theys, N., Landgraf, J., and Volkamer, R.: Carbon Monoxide in Optically Thick Wildfire Smoke: Evaluating TROPOMI Using CU Airborne SOF Column Observations, ACS Earth Space Chem., 6, 1799–1812, https://doi.org/10.1021/acsearthspacechem.2c00048, 2022. a
Schneising, O., Buchwitz, M., Reuter, M., Bovensmann, H., and Burrows, J. P.: Severe Californian wildfires in November 2018 observed from space: the carbon monoxide perspective, Atmos. Chem. Phys., 20, 3317–3332, https://doi.org/10.5194/acp-20-3317-2020, 2020. a
Sha, M. K., Langerock, B., Blavier, J.-F. L., Blumenstock, T., Borsdorff, T., Buschmann, M., Dehn, A., De Mazière, M., Deutscher, N. M., Feist, D. G., García, O. E., Griffith, D. W. T., Grutter, M., Hannigan, J. W., Hase, F., Heikkinen, P., Hermans, C., Iraci, L. T., Jeseck, P., Jones, N., Kivi, R., Kumps, N., Landgraf, J., Lorente, A., Mahieu, E., Makarova, M. V., Mellqvist, J., Metzger, J.-M., Morino, I., Nagahama, T., Notholt, J., Ohyama, H., Ortega, I., Palm, M., Petri, C., Pollard, D. F., Rettinger, M., Robinson, J., Roche, S., Roehl, C. M., Röhling, A. N., Rousogenous, C., Schneider, M., Shiomi, K., Smale, D., Stremme, W., Strong, K., Sussmann, R., Té, Y., Uchino, O., Velazco, V. A., Vigouroux, C., Vrekoussis, M., Wang, P., Warneke, T., Wizenberg, T., Wunch, D., Yamanouchi, S., Yang, Y., and Zhou, M.: Validation of methane and carbon monoxide from Sentinel-5 Precursor using TCCON and NDACC-IRWG stations, Atmos. Meas. Tech., 14, 6249–6304, https://doi.org/10.5194/amt-14-6249-2021, 2021. a
Spivakovsky, C. M., Logan, J. A., Montzka, S. A., Balkanski, Y. J., Foreman-Fowler, M., Jones, D. B. A., Horowitz, L. W., Fusco, A. C., Brenninkmeijer, C. A. M., Prather, M. J., Wofsy, S. C., and McElroy, M. B.: Three-dimensional climatological distribution of tropospheric OH: Update and evaluation, J. Geophys. Res.-Atmos., 105, 8931–8980, https://doi.org/10.1029/1999jd901006, 2000. a
Stein, O., Schultz, M. G., Bouarar, I., Clark, H., Huijnen, V., Gaudel, A., George, M., and Clerbaux, C.: On the wintertime low bias of Northern Hemisphere carbon monoxide found in global model simulations, Atmos. Chem. Phys., 14, 9295–9316, https://doi.org/10.5194/acp-14-9295-2014, 2014. a
Veefkind, J., Aben, I., McMullan, K., Förster, H., de Vries, J., Otter, G., Claas, J., Eskes, H., de Haan, J., Kleipool, Q., van Weele, M., Hasekamp, O., Hoogeveen, R., Landgraf, J., Snel, R., Tol, P., Ingmann, P., Voors, R., Kruizinga, B., Vink, R., Visser, H., and Levelt, P.: TROPOMI on the ESA Sentinel-5 Precursor: A GMES mission for global observations of the atmospheric composition for climate, air quality and ozone layer applications, Remote Sens. Environ., 120, 70–83, https://doi.org/10.1016/j.rse.2011.09.027, 2012. a
Volkamer, R.: BB-FLUX: CU AirSOF Data, Version 1.0, UCAR/NCAR - Earth Observing Laboratory [data set], https://doi.org/10.26023/XESM-PE98-TT0T, 2023. a