the Creative Commons Attribution 4.0 License.
the Creative Commons Attribution 4.0 License.
 | 19 Jun 2023
Satellite-based, top-down approach for the adjustment of aerosol precursor emissions over East Asia: the TROPOspheric Monitoring Instrument (TROPOMI) NO2 product and the Geostationary Environment Monitoring Spectrometer (GEMS) aerosol optical depth (AOD) data fusion product and its proxy
Jincheol Park
Jia Jung
Hyunkwang Lim
Minseok Kim
Kyunghwa Lee
Yun Gon Lee
Jhoon Kim
In response to the need for an up-to-date emissions inventory and the recent achievement of geostationary observations afforded by the Geostationary Environment Monitoring Spectrometer (GEMS) and its sister instruments, this study aims to establish a top-down approach for adjusting aerosol precursor emissions over East Asia. This study involves a series of the TROPOspheric Monitoring Instrument (TROPOMI) NO2 product, the GEMS aerosol optical depth (AOD) data fusion product and its proxy product, and chemical transport model (CTM)-based inverse modeling techniques. We begin by sequentially adjusting bottom-up estimates of nitrogen oxides (NOx) and primary particulate matter (PM) emissions, both of which significantly contribute to aerosol loadings over East Asia to reduce model biases in AOD simulations during the year 2019. While the model initially underestimates AOD by 50.73 % on average, the sequential emissions adjustments that led to overall increases in the amounts of NOx emissions by 122.79 % and of primary PM emissions by 76.68 % and 114.63 % (single- and multiple-instrument-derived emissions adjustments, respectively) reduce the extents of AOD underestimation to 33.84 % and 19.60 %, respectively. We consider the outperformance of the model using the emissions constrained by the data fusion product to be the result of the improvement in the quantity of available data. Taking advantage of the data fusion product, we perform sequential emissions adjustments during the spring of 2022, the period during which the substantial reductions in anthropogenic emissions took place accompanied by the COVID-19 pandemic lockdowns over highly industrialized and urbanized regions in China. While the model initially overestimates surface PM2.5 concentrations by 47.58 % and 20.60 % in the North China Plain (NCP) region and South Korea (hereafter referred to as Korea), the sequential emissions adjustments that led to overall decreases in NOx and primary PM emissions by 7.84 % and 9.03 %, respectively, substantially reduce the extents of PM2.5 underestimation to 19.58 % and 6.81 %, respectively. These findings indicate that the series of emissions adjustments, supported by the TROPOMI and GEMS-involved data fusion products, performed in this study are generally effective at reducing model biases in simulations of aerosol loading over East Asia; in particular, the model performance tends to improve to a greater extent on the condition that spatiotemporally more continuous and frequent observational references are used to capture variations in bottom-up estimates of emissions. In addition to reconfirming the close association between aerosol precursor emissions and AOD as well as surface PM2.5 concentrations, the findings of this study could provide a useful basis for how to most effectively exploit multisource top-down information for capturing highly varying anthropogenic emissions.
- Article
(9165 KB) - Full-text XML
-
Supplement
(3236 KB) - BibTeX
- EndNote


In East Asia, atmospheric aerosols, such as particulate matter (PM), have been a focus of great concern because of their adverse impact on public health and safety, accompanied by rapid urban and industrial growth that has elevated levels of anthropogenic emissions over time (Hatakeyama et al., 2001; Ohara et al., 2007). In response to the growing interest in airborne hazards, many research entities, using ground-based networks of monitoring sites in many industrial regions and megacities over East Asia, have devoted considerable effort to systemically monitoring local and regional air quality. Unfortunately, the limited number of stations often impedes efforts to secure efficient sampling coverage and data availability for aerosol studies (Kumar et al., 2007; Tian and Chen, 2010).
To overcome this limitation, many research entities have substantially improved the collection and, thus, the availability of satellite observational data, which enables them to estimate the spatiotemporal distributions of aerosols over vast areas that are not in close proximity to monitoring sites (Remer et al., 2013; Levy et al., 2013). A variety of aerosol products derived from sun-synchronous low Earth orbit (LEO) satellite instruments, such as the Advanced Very High Resolution Radiometer, the Visible Infrared Imaging Radiometer (VIIRS), the MODerate-resolution Imaging Spectroradiometer (MODIS), and the Multiangle Imaging SpectroRadiometer (MISR), have been available for many years (Chan et al., 2013; Ahn et al., 2014; Levy et al., 2015; Garay et al., 2020). For example, researchers have conducted a number of comprehensive air quality assessments on local to global scales using the aerosol optical depth (AOD), an essential property of aerosols that represents columnar aerosol loadings in the atmosphere (Bellouin et al., 2005; Remer et al., 2008, Munchak et al., 2013; Filonchyk et al., 2019; Jung et al., 2019, 2021; K. Lee et al., 2022).
Since the recent advent of satellite products, researchers have increased their efforts to use top-down observational data to improve the performance of chemical transport models (CTMs) such as the Community Multiscale Air Quality (CMAQ) model (Byun and Schere, 2006). A number of studies have applied satellite data in CTM-based numerical approaches, such as inverse modeling and data assimilation, to reduce the uncertainties in bottom-up estimates of air pollutant emissions and perform more accurate air quality simulations (Wang et al., 2012; Ku and Park, 2013; Koo et al., 2015; Pang et al., 2018; Xia et al., 2019; Wang et al., 2020; Li et al., 2021; S. Lee et al., 2022); most of these studies, however, share a common challenge in resolving uncertainties originating from retrieval discontinuity (i.e., coarse orbiting cycles of satellite instruments and cloud contamination). Using Ozone Mapping and Profiler Suite products, Wang et al. (2020) performed top-down optimizations of nitrogen dioxide (NO2) and sulfur dioxide (SO2) emissions and examined the sensitivity of AOD to concentrations of secondary inorganic aerosols over East Asia. Their results suggested a need for spatiotemporally more continuous satellite data. To improve model estimates of the AOD over East Asia, Li et al. (2021) used Ozone Monitoring Instrument data to perform a top-down inversion of SO2 emissions. Their results emphasized the need for satellite data at finer temporal scales, which would allow one to capture highly variable SO2 emissions over East Asia.
To address such instrument-inherent challenges, researchers have developed a number of approaches to applying more continuous and frequent observational data afforded by geostationary Earth orbit (GEO) satellite instruments; temporal resolutions of GEO satellite instruments (e.g., from a few minutes to an hour) are relatively finer than those of LEO satellite instruments on a 12 h orbit cycle at best over given geographic locations (Vijayaraghavan et al., 2008). Leveraging aerosol product data derived from GEO satellite instruments such as the Geostationary Ocean Color Imager (GOCI) and the Advanced Himawari Imager (AHI), several CTM-based studies have shown substantial improvements in model performances in estimating aerosol loadings in East Asia (Jeon et al., 2016; Lee et al., 2016; Yumimoto et al., 2016; Jin et al., 2019). In addition, in response to the increasing demand for satellite data available at finer temporal resolutions, the Committee on Earth Observation Satellites has led an international effort to coordinate a new constellation of GEO satellite instruments for monitoring the behaviors of atmospheric constituents over the globe at faster sampling rates. For example, the Geostationary Environment Monitoring Spectrometer (GEMS), jointly developed by the Korea Aerospace Research Institute and Ball Aerospace, was launched on board the Geostationary KOrea Multi-Purpose SATellite 2B (GEO-KOMPSAT-2B) satellite in 2020 as the first ultraviolet–visible (UV–Vis) instrument of its kind that can measure the columnar loadings of both trace gases and aerosols over the Asia–Pacific region in a geostationary manner up to eight times during daytime (W. J. Choi et al., 2018; J. Kim et al., 2018, 2020); before the advent of the GEMS mission, all UV–Vis instruments had been operating on LEO platforms. Furthermore, equipped with similar observational capabilities, a series of GEO satellite instruments are planned to be launched in 2023 to finish building the future constellation, which includes NASA's Tropospheric Emissions: Monitoring of Pollution (TEMPO) above North America (Zoogman et al., 2011) and the European Space Agency Sentinel-4 above Europe and northern Africa (Ingmann et al., 2012) and ultimately serves the needs of more detailed and frequent air quality measurements over the Northern Hemisphere.
In addition to taking advantage of such finer spatiotemporal resolutions afforded by GEO satellite instruments, researchers have developed numerous data fusion approaches to integrating atmospheric properties retrieved by multiple individual instruments in order to further improve the quality of satellite products; the products derived from multiple instruments can be spatiotemporally complementary in terms of the completeness of observational data (Zou et al., 2020). For example, several studies have fused multisource satellite products to yield more accurate estimates of air quality over East Asia (Choi et al., 2019; Go et al., 2020; Lim et al., 2021) in response to the upcoming releases of GEMS products. Choi et al. (2019) fused multiple aerosol products afforded by three LEO satellite instruments (i.e., MODIS, MISR, and VIIRS) and two GEO satellite instruments (i.e., GOCI and AHI) to examine how effective the data fusion approach was at improving the accuracy of AOD estimates over East Asia. Their results showed that the multisource aerosol product could substantially improve observational coverage and frequency, and the AOD estimates from these showed closer spatiotemporal agreement with in situ ground-based measurements at AErosol RObotic NETwork (AERONET) sites (Holben et al., 1998) than those from AOD estimates provided by each of the individual satellite instruments (Choi et al., 2019). As a follow-up study over East Asia, Lim et al. (2021) fused the GOCI AOD with AHI AOD (hereafter referred to as GOCI-AHI AOD) products by using multisource aerosol properties and land surface parameters from those in ensemble-mean and maximum-likelihood-estimation (MLE) methods in order to reduce observational and systematic biases occurring during the retrieval process. Their multisource AOD estimates showed substantially improved agreement with AERONET AOD measurements over East Asia, which they considered to be the result of complementary retrievals that reduced the number of pixels with missing values and ensured more cloud-free pixels (Lim et al., 2021). Note that their study aimed to develop and examine data fusion algorithms for near-future use, which would be applied to producing synergistic satellite products after the full product releases of GEMS and its sister instruments, including the Advanced Meteorological Imager (AMI) on board the GEO-KOMPSAT-2A satellite and Geostationary Ocean Color Imager 2 (GOCI-2) on board the GEO-KOMPSAT-2B satellite.
Despite the availability of the many numerical approaches and data fusion techniques for reducing the uncertainties in the model and observations, efforts to couple them have not been sufficiently rigorous over East Asia; therefore, this study aimed to examine the utility of synergistic satellite observation data in improving the performance of CTM-based simulations of aerosol loadings over East Asia. Hypothesizing that finer spatiotemporal resolutions of multisource data fusion products would provide more observational references available for use, we employed the GEMS data fusion product and its proxy data in adjusting the emissions inventory in East Asia in a top-down manner. This study largely consists of two phases: (1) the implementation and evaluation of emissions adjustments using the TROPOspheric Monitoring Instrument (TROPOMI) tropospheric NO2 columns (hereafter referred to as TROPOMI NO2 columns) and AHI AOD and GOCI-AHI fused AOD (the proxies of GEMS AOD and GEMS-AHI-GOCI-2 fused AOD, respectively) for the simulation year 2019 and (2) the application of the emissions adjustment approach using the TROPOMI NO2 columns and GEMS-AHI-GOCI-2 fused AOD for the spring of 2022. For the former period, which represents the most recent year before the COVID-19 outbreak in this study, we first performed inverse modeling to constrain bottom-up estimates of nitrogen oxide (NOx) emissions using TROPOMI NO2 columns, and then we constrained bottom-up estimates of primary PM emissions using each of the AHI AOD and GOCI-AHI fused AOD. Prior to proceeding with the second phase, we compared the model performances from using the single-instrument- and multisource-derived AOD products in constraining primary PM emissions. For the latter period, which was considered to be severely affected by the resumptions of city- and province-wide lockdowns (Dyer, 2022) in China, we used the TROPOMI NO2 columns and GEMS-AMI-GOCI-2 fused AOD to sequentially constrain NOx and primary PM emissions based on the earlier top-down approach. Note that we did not focus on other gaseous air pollutants than NOx considering the future application of the GEMS tropospheric NO2 product, which was recently released (as of 23 November 2022) by the Environmental Satellite Center of the Korean National Institute of Environmental Research (NIER) (https://nesc.nier.go.kr/, last access: 15 July 2022). Then, using a series of a posteriori emissions (i.e., NOx-constrained emissions and NOx- and primary PM-constrained emissions) in CMAQ, we simulated AOD and PM2.5 concentrations over East Asia to examine the utility of the GEMS-involved synergistic product in inverse modeling and ultimately to improve model performances in estimating aerosol loadings over East Asia.
2.1 Modeling setup and preparation of base emissions
Using the 2016 KORUS-AQ emissions inventory version 5.0 developed by Konkuk University (Woo et al., 2020), we prepared CMAQ-ready anthropogenic emissions inputs over the modeling domain, shown in Fig. 1, which encloses the eastern half of China, the Korean Peninsula, the southern Russian Far East, and Japan. The KORUS-AQ emissions inventory consists of multiple individual emissions inventories, including the Comprehensive Regional Emissions for Atmospheric Transport Experiments version 2.3 (Jang et al., 2019), Clean Air policy Support System 2015 (Yeo et al., 2019), and Studies of Emissions and Atmospheric Composition, Clouds, and Climate Coupling by Regional Surveys (Toon et al., 2016). To prepare biogenic emissions inputs, we employed the Model of Emissions of Gases and Aerosols from Nature (MEGAN) version 3.0 (Guenther et al., 2012), which can speciate, quantify, and regrid biogenic emissions from terrestrial ecosystems based on a series of input data (e.g., meteorological fields and land surface parameters) (Guenther et al., 2006, 2020). We used reprocessed MODIS version 6 leaf area index (LAI) products (Yuan et al., 2011) and VIIRS global green vegetation fraction (GVF) products (Jiang et al., 2016) as input data for MEGAN. We merged the anthropogenic and biogenic emissions to prepare the a priori emissions inputs (hereafter referred to as base emissions).
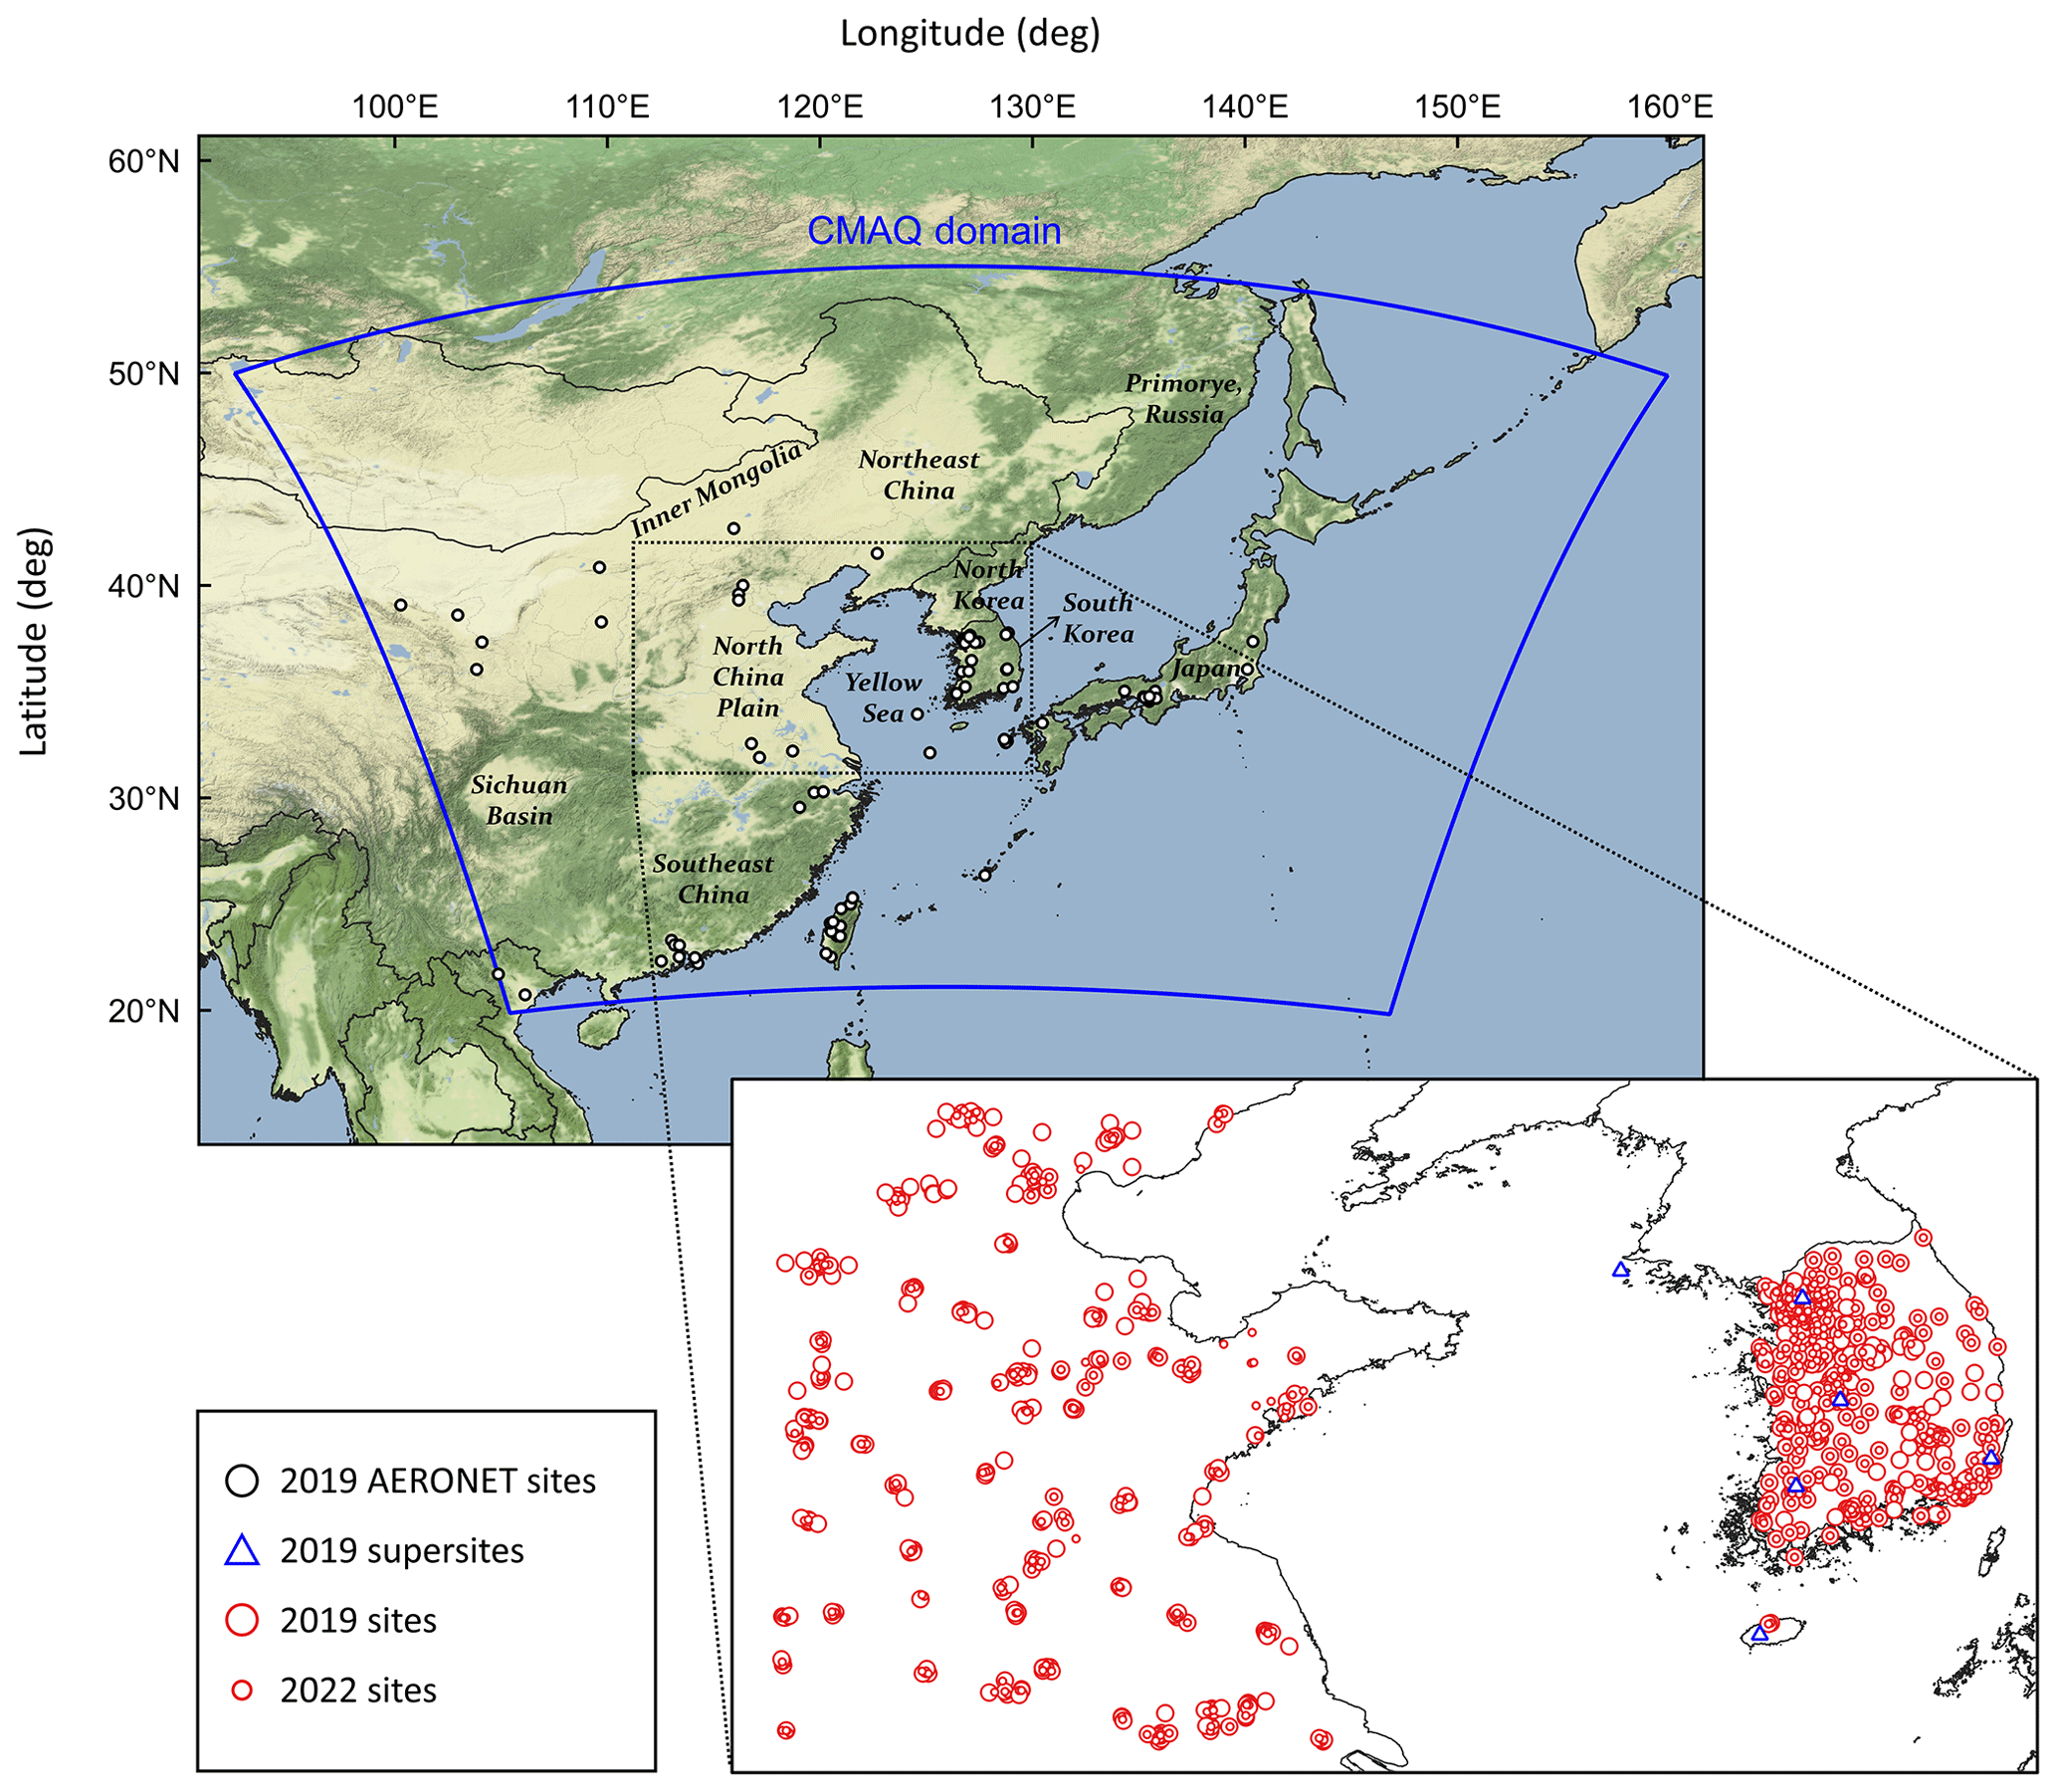
Figure 1Modeling domain and the locations of the ground-based in situ measurement sites used for model evaluation. AERONET sites are presented in the upper panel, and the rest of the air quality monitoring sites are in the lower panel.
To simulate the meteorological fields and ambient concentrations of gaseous air pollutants and aerosols for each of the study periods, we used the Weather Research and Forecasting (WRF) version 3.8 developed by the National Center for Atmospheric Research (NCAR) (Skamarock et al., 2008) and CMAQ version 5.2 developed by the U.S. Environmental Protection Agency (EPA) (Byun and Schere, 2006). Employing the same modeling setups and initial conditions used in our previous studies over East Asia (Jung et al., 2019, 2021; Pouyaei et al., 2020, 2021; Park et al., 2022), we configured WRF and CMAQ to cover the modeling domain at a horizontal resolution of 27 km and 35 vertical variable thickness layers from the surface up to 100 hPa. Detailed model configurations are listed in Table S1 in the Supplement. Then, using the WRF-simulated meteorological fields and base emissions in CMAQ, we simulated NO2 columns and concentrations, AOD, and PM2.5 concentrations over the modeling domain for the entire year 2019 and the period from March to May 2022. For each of these two study periods, we initiated both WRF and CMAQ simulations with a 10 d spinup time.
2.2 TROPOMI NO2 product
TROPOMI, a LEO satellite instrument launched on board the Copernicus Sentinel-5 Precursor satellite in 2017, provides global observations of trace gases and aerosols (Veefkind et al., 2012). To obtain daily tropospheric NO2 and SO2 column densities observed during the study periods, we used TROPOMI Level-2 NO2 and SO2 products. The spatial resolution of TROPOMI was initially 3.5 km × 7 km and was improved to 3.5 km × 5.5 km in early August 2019. The daily acquisition time of the column data was approximately 04:30 UTC, when the instrument overpassed the modeling domain during the study period. For the NO2 columns, we used pixels with quality assurance values (qa_values) larger than 0.75 and cloud fractions smaller than 0.3. To ensure consistency in the horizontal spacings between the TROPOMI NO2 columns and CMAQ's modeling grids, we regridded the TROPOMI NO2 columns into 27 km × 27 km grids by using distance-weighted means of those observation references with a radius of 0.25∘ (approximately 27 km).
2.3 AHI AOD and GOCI-AHI fused AOD products
The AHI, a GEO satellite instrument launched on board the Himawari-8 geostationary meteorological satellite in 2014, provides regional observations of aerosol properties over the East Asia and western Pacific regions in a spatiotemporally continuous manner (Okuyama et al., 2015; Bessho et al., 2016). For the study period 2019, we used the Japan Aerospace Exploration Agency (JAXA) AHI Level-3 aerosol product to obtain the hourly estimates of AOD over the modeling domain, the spatiotemporal resolutions of which are 0.05∘ × 0.05∘ and 1 h for eight consecutive daytime (00:30 to 07:30 UTC) retrievals per day. To ensure consistency between the observed AOD and modeled AOD, the latter of which was estimated based on the light extinction of aerosols at a wavelength of 550 nm (Pitchford et al., 2007), we converted the AHI AOD retrieved at 500 nm wavelength to those at a 550 nm wavelength following Eq. (1) (ÅngstrÖm, 1961):
where AOD550 nm and AOD500 nm are AODs at 550 and 500 nm wavelengths, respectively, and AE is the Ångström exponent at 400–600 nm wavelengths provided in the AHI aerosol product. To ensure the retrieval quality, we used pixels with quality assurance values (AOT_merged_uncertainty) smaller than 1 (very good and good retrievals).
To explore the utility of the synergistic observational data in the emissions adjustments, we employed the GOCI-AHI fused AOD product developed by Lim et al. (2021), which provides near-real-time bias-corrected AOD estimates over East Asia, taking advantage of multisource retrievals of aerosol optical properties that complement each other. GOCI, a GEO satellite instrument launched on board the Communication, Ocean and Meteorological Satellite (COMS-1) in 2010, provides regional observations of ocean environments (i.e., sea surface albedo and reflectance) and aerosol properties (i.e., the AOD) over the East Asia and western Pacific regions (Lee et al., 2010). The GOCI-AHI AOD product affords the best compromise among four individual retrievals postprocessed based on Yonsei Aerosol Retrieval (YAER) retrieval algorithms (M. Choi et al., 2016, 2018; Lim et al., 2018); the data fusion process comprises a series of postprocessing and data fusion techniques to complement the error characteristics of each other (i.e., the spatiotemporal collocation, the cloud removal process, the ensemble-mean method, the MLE method, and systematic bias correction based on the long-term validation of AERONET AOD measurements) (Lim et al., 2021). For the study period 2019, we used the GOCI-AHI fused AOD product to obtain hourly estimates of the AOD (at a 550 nm wavelength) over the modeling domain, the spatial resolution of which was initially 6 km ×6 km and regridded into 0.05∘ × 0.05∘ and the temporal resolution of which is identical to that of the AHI AOD product described above. The consistency in the grid spacings among AHI AOD, GOCI-AHI AOD, and CMAQ's modeling grids was ensured in the same approach described in Sect. 2.2 above.
2.4 GEMS-AMI-GOCI-2 fused AOD product
The GEMS-AMI-GOCI-2 fused AOD product is a synergistic science product jointly developed by Yonsei University, Chungnam National University, and the Korean NIER based on their earlier data fusion approach applied to the GOCI-AHI fused AOD product (the proxy of the GEMS-AMI-GOCI-2 fused AOD product in this study) described in Sect. 2.3. GEMS provides hourly daytime observations of the columnar loadings of gaseous air pollutants (i.e., ozone, NO2, SO2, formaldehyde, and glyoxal) and aerosols (i.e., the AOD) (J. Kim et al., 2020). The AMI, a meteorological satellite instrument, provides regional observations of meteorology (i.e., cloud mask) and terrestrial environments (i.e., vegetation indices, surface reflectivity, albedo, and turbid water) as well as aerosol optical properties (i.e., fine-mode fraction (FMF) and AOD) every 10 min at spatial resolutions of 0.5–1.0 km for visible channels and of 2 km for near-infrared and infrared channels (Chung et al., 2020; Kim et al., 2021). GOCI-2, an advanced ocean color imager that succeeded the mission of GOCI, provides hourly observations of ocean environments (i.e., ocean current, green tide, and red tide) and aerosol optical properties (i.e., FMF and AOD) over the ocean surface at a full-domain spatial resolution of 1 km (J. Kim et al., 2020). Note that these three individual instruments are in operation on board two sister GEO platforms (i.e., the AMI on board GEO-KOMPSAT-2A and GEMS and GOCI-2 on board GEO-KOMPSAT-2B) over the Asia–Pacific region. To create the best synergy from the superiorities of these instruments over each other (i.e., GEMS' retrieval accuracy over bright surfaces and AMI's and GOCI-2's sampling performances over cloud-free pixels at finer spatiotemporal resolutions) (M. Kim et al., 2020), the data fusion process utilizes GEMS Level-2 aerosol product version 1 and AMI and GOCI-2 aerosol products postprocessed based on the YAER algorithm (M. Kim et al., 2020) to produce the GEMS-AMI-GOCI-2 AOD product. For the study period 2022, we used the GEMS-AMI-GOCI-2 AOD product to obtain the hourly estimates of AOD (at a 550 nm wavelength) collocated into the spatiotemporal resolutions identical to those of the AHI AOD and GOCI-AHI AOD products described earlier. Detailed information about the data fusion process is provided by M. Kim et al. (2020).
2.5 Top-down approaches for NOx and primary PM emissions adjustments
2.5.1 Emissions adjustments for the study period 2019
To constrain the NOx and primary PM emissions based on top-down information provided by satellite instruments for the study period 2019, we employed a series of inverse modeling techniques. To adjust the a priori NOx emissions, we performed analytical (or Bayesian) inverse modeling towards mathematically minimizing the difference between TROPOMI NO2 and CMAQ-simulated NO2 columns based on the following cost function in Eq. (2) under the assumptions that (1) the relationship between the changes in NO2 columns and NOx emissions is not rigorously nonlinear, (2) observation and emission error covariances are described by zero-bias Gaussian probability density functions, and (3) observation and emission error covariances are independent of each other (Rodgers, 2000):
where x is a posteriori NOx emissions, xa a priori NOx emissions, So the observational error covariance provided in the TROPOMI NO2 product, and Se the error covariance of the a priori NOx emissions, the uncertainty of which was calculated by combining the error covariances of anthropogenic (50 %) and biogenic (200 %) NOx emissions (Souri et al., 2020; Jung et al., 2022). F is the first-order sensitivity coefficient that correlates NOx emissions with tropospheric NO2 columns. We used the CMAQ decoupled direct method in three dimensions (CMAQ DDM-3D) version 5.2 (Napelenok et al., 2006) to compute the initial sensitivity coefficient, a measure of the responses of modeled NO2 columns to changes in NOx emissions. We used the same model configurations in CMAQ DDM-3D as those used in CMAQ described in Sect. 2.1. To infer the a posteriori emissions, we used the Gauss–Newton method in Eq. (3) (Rodgers, 2000):
where i is the number of iterations, and K is the Jacobian matrix calculated in CMAQ DDM-3D. We iterated Eq. (3) two times within each month to attain convergence, and F and K were updated after each iteration. It should be noted that we derived log (x) instead of x to constrain negative a posteriori values, the details of which are described in Souri et al. (2018). Then, we applied the monthly emissions adjustment ratios derived from Eqs. (2) and (3) to the base emissions to update the bottom-up estimates of NOx emissions over the modeling domain (hereafter referred to as 2019 NOx-constrained emissions). Further details about the analytical inverse modeling approach employed in this study are provided by Souri et al. (2020) and Jung et al. (2022).
To adjust the primary PM emissions, we applied analytical inversion described in Eqs. (2) and (3) to the emissions of 19 primary PM species predefined as contributors to the AOD in the sixth-generation CMAQ aerosol module (AERO6) (Simon, 2015) listed in Table S2. Note that the primary PM emissions, hereafter, refer to the summation of the emissions of all 19 individual primary PM species. In Eq. (2), x is a posteriori primary PM emissions, xa is a priori primary PM emissions (in the NOx-constrained emissions inventory obtained earlier), and Se is the error covariance of the a priori primary PM emissions, the uncertainty of which was set to 100 % (Crippa et al., 2019). For So, we employed (Zhang et al., 2018) and (Lim et al., 2021) as the observational error covariances of the AHI AOD and GOCI-AHI AOD, respectively. To compute F, since CMAQ DDM-3D is not available for aerosols, we employed the brute-force method (BFM) described in Eq. (4) (Napelenok et al., 2006):
where Fbfm is the approximate first-order sensitivity coefficient that correlates primary PM emissions with the AOD, C+10 % the CMAQ-simulated AOD of the primary PM emissions perturbed by +10 %, and C−10 % the CMAQ-simulated AOD of the primary PM emissions perturbed by −10 %. In this approach, Fbfm represents the sensitivity of the total primary PM emissions with regard to changes in the AOD; therefore, the resultant adjustment ratio was applied to the emissions of each of the primary PM species equally, not in a selective manner due to the limited data availability. Note that no routine observations have been made until today for the loadings of such species over vast areas in East Asia in a top-down manner. We applied the daily emissions adjustment ratios derived from Eqs. (2), (3), and (4) to the 2019 NOx-constrained emissions to update the bottom-up estimates of primary PM emissions over the modeling domain (hereafter referred to as 2019 NOx- and PM-constrained emissions). To evaluate the model performance before and after the application of the sequential emissions adjustments, we used the series of a priori and a posteriori emissions (i.e., the base emissions, 2019 NOx-constrained emissions, and a pair of 2019 NOx- and PM-constrained emissions using the AHI AOD and GOCI-AHI AOD) to perform CMAQ simulations for the study period 2019. It should be noted that NOx emissions were adjusted monthly due to the relatively coarse temporal resolution of TROPOMI NO2 columns (providing zero to one valid snapshot of columnar NO2 per day over the modeling domain), while primary PM emissions were adjusted daily by using the AOD products at sufficiently fine temporal resolutions afforded by geostationary platforms.
2.5.2 Emissions adjustments for the study period 2022
Similar to the approach described in Sect. 2.5.1, we first adjusted NOx emissions by using the TROPOMI NO2 columns obtained for the study period 2022 prior to proceeding with the primary PM emissions adjustment. To adjust the a priori NOx emissions, we employed the basic mass balance method described by Martin et al. (2003) and Cooper et al. (2017). Assuming a direct linear relationship between changes in both the NO2 columns and the NOx emissions, we adjusted the a priori NOx emissions based on the ratios between the TROPOMI NO2 and CMAQ-simulated NO2 columns following Eq. (5):
where E2022 represents the a posteriori NOx emissions, E2019 the a priori NOx emissions (from the 2019 NOx-constrained emissions described in Sect. 2.5.1), and Ω2019 and Ω2022 the TROPOMI NO2 columns obtained for the study periods 2019 and 2022, respectively. We then applied the monthly emissions adjustment ratios derived from Eq. (5) to the 2019 NOx-constrained emissions to update the NOx emissions for the study period 2022 (hereafter referred to as 2022 NOx-constrained emissions).
Then, to adjust the primary PM emissions, we used the GEMS-AMI-GOCI-2 AOD obtained for the study period 2022 to perform the analytical inversion and BFM described in Sect. 2.5.1 by using the So of provided in the GEMS-AMI-GOCI-2 AOD product and the perturbed (±10 %) primary PM emissions. The daily emissions adjustment ratios were applied to the 2022 NOx-constrained emissions to update the primary PM emissions (hereafter referred to as 2022 NOx- and PM-constrained emissions). Using the base emissions, 2022 NOx-constrained emissions, and 2022 NOx- and PM-constrained emissions to perform CMAQ simulations for the study period 2022, we evaluated the performance of the model.
2.6 Ground-based measurements for model evaluation
To evaluate the model performance, we used ground-based in situ observations across South Korea (hereafter referred to as Korea) and the North China Plain (NCP) region. To validate the accuracy of the WRF-simulated meteorological fields, we obtained hourly measurements of the 2 m air temperature and 10 m wind U and V components from the Korean Meteorological Administration database (132 sites for 2019 and 95 for 2022). The WRF-simulated hourly meteorological fields showed fair agreements with the in situ measurements (Figs. S1 and S2 in the Supplement; Table S3), which we considered sufficient for further use as meteorological inputs for CMAQ.
To evaluate the performance of the CMAQ model, we obtained the hourly measurements of surface NO2 and PM2.5 concentrations from the AirKorea website (https://www.airkorea.or.kr, last access: 15 July 2022) (346 sites for 2019 and 425 for 2022) and from the Chinese Ministry of Ecology and Environment database (MEE) (235 sites for 2019 and 312 sites for 2022) and hourly sun-photometer measurements of the AOD (at a 550 nm wavelength) (85 AERONET sites for 2019). To ensure the quality of the validation sets, we excluded observation sites in which the frequency of missing values exceeded 50 % of all observations made during the study period. For the measurements collected from the MEE sites, we applied the quality assurance processes (e.g., elimination of negative values) that we used in our previous study over mainland China (Mousavinezhad et al., 2021). To quantify the extent of model overestimation and underestimation, we employed a normalized mean bias (NMB) following Eq. (6):
where M represents the model predictions, O the observations, and n the total number of pairs.
To discuss the success of the sequential NOx and primary PM emissions adjustments described in Sect. 2.5, we obtained the seasonal compositions of surface PM2.5 assessed at six ground-based supersites in Korea, the constituents of which include secondary inorganic aerosols (i.e., nitrate, sulfate, and ammonium aerosols), organic carbon (the total mass of both primary and secondary organic carbon), elemental carbon, the lumped summation of other PM species listed in Table S2, and the rest remaining undefined (the lumped summation of all unidentified species in 2.5 µm or less in diameter, which still constitute the total PM2.5 mass). The locations of the supersites are as follows: Incheon (37.61∘ N, 126.93∘ E), Seoul (37.96∘ N, 124.63∘ E), Daejeon (35.23∘ N, 126.85∘ E), Gwangju (36.32∘ N, 127.41∘ E), Ulsan (35.58∘ N, 129.32∘ E), and Jeju (33.35∘ N, 126.39∘ E).
3.1 Evaluation of the top-down approach using TROPOMI NO2, AHI AOD, and GOCI-AHI AOD
We performed a series of emissions adjustments by using the TROPOMI NO2 columns, AHI AOD, and GOCI-AHI AOD as the constraints to updating the bottom-up estimates of NOx and primary PM emissions over the modeling domain. Prior to proceeding with the primary PM emissions adjustments, we examined the model performances in simulating NO2 columns during the study period 2019 on a seasonal basis. The model using the base emissions tended to underestimate NO2 columns over the major portion of the modeling domain during the entire study period (Fig. S3). After the NOx emissions adjustment, which resulted in overall increases in NOx emissions by 71.64 %–174.16 % (Fig. S4; Table S4), the modeled NO2 columns showed closer spatial agreements with the observed NO2 columns (Fig. S5). Then we evaluated the model performances in simulating daily surface NO2 concentrations at ground-based in situ measurement sites in Korea and the NCP region in a time series. Overall, the NOx emissions adjustment led to a closer temporal agreement between the modeled and observed NO2 concentrations with reduced model biases. While the model using the base emissions showed NMBs (Rs) of −24.20 %, 15.63 %, −2.06 %, and −23.54 % (0.66, 0.45, 0.72, and 0.71) in the spring, summer, fall, and winter, respectively, the model using the NOx-constrained emissions showed NMBs of −5.66 %, 1.83 %, 21.66 %, and 13.45 % (0.72, 0.63, 0.82, and 0.76) in the corresponding seasons, the results of which indicate that the NOx emissions adjustment was effective (Fig. S6; Table S5) at reducing the model biases in most seasons. However, in the NCP region, the NOx emissions adjustment showed mixed results in reducing the model biases. While the model using the base emissions showed NMBs (Rs) of −13.90 %, 5.25 %, −11.43 %, and −1.05 % (0.75, 0.54, 0.50, and 0.55) in the spring, summer, fall, and winter, respectively, the model using the NOx-constrained emissions showed NMBs of 12.34 %, 22.32 %, 15.24 %, and 33.75 % (0.75, 0.52, 0.55, and 0.59) in the corresponding seasons. Although the NOx emissions adjustment led to some improvements in Rs in the NCP region, NMBs showed increases in the summer, fall, and winter seasons, which indicate that the emissions adjustment was not as effective at reducing the model biases in the NCP region as it was in Korea.
In addition to the NOx emissions adjustment, we performed primary PM emissions adjustments followed by evaluating the model performance in simulating AOD during the study period 2019. To compare the use of the single-instrument- and multisource-derived AOD products for constraining primary PM emissions, we performed two separate emissions adjustments, using each of the AHI AOD and GOCI-AHI AOD as a constraint to update the primary PM emissions over the modeling domain. To ensure the consistency between the comparisons, we spatially collocated the CMAQ-simulated AOD to each of the AHI AOD and GOCI-AHI AOD. We found that, during the entire study period, the model using the base emissions tended to underestimate AODs over a major portion of the modeling domain except for a few inland regions in China (Figs. 2a, b and 3a, b). After the NOx emissions adjustment, the modeled AODs showed closer spatial agreement with the observed AODs in Korea and the NCP region (Figs. 2c and 3c); the model, however, tended to overestimate the AODs in some inland regions such as southeastern China and the Sichuan Basin region; we consider this tendency to be the result of uncertainty in the bottom-up estimates of air pollutant emissions coming from the unique basin landform that often encloses highly concentrated anthropogenic emissions (Chen et al., 2021). After the primary PM emissions adjustments using the AHI AOD and GOCI-AHI AOD, which resulted in overall increases in primary PM emissions by 19.55 %–31.79 % (Fig. S7; Table S6) and 87.54 %–142.96 % (Fig. S8; Table S6), respectively, the modeled AODs showed even closer spatial agreement with the observed AODs (Figs. 2d and 3d).
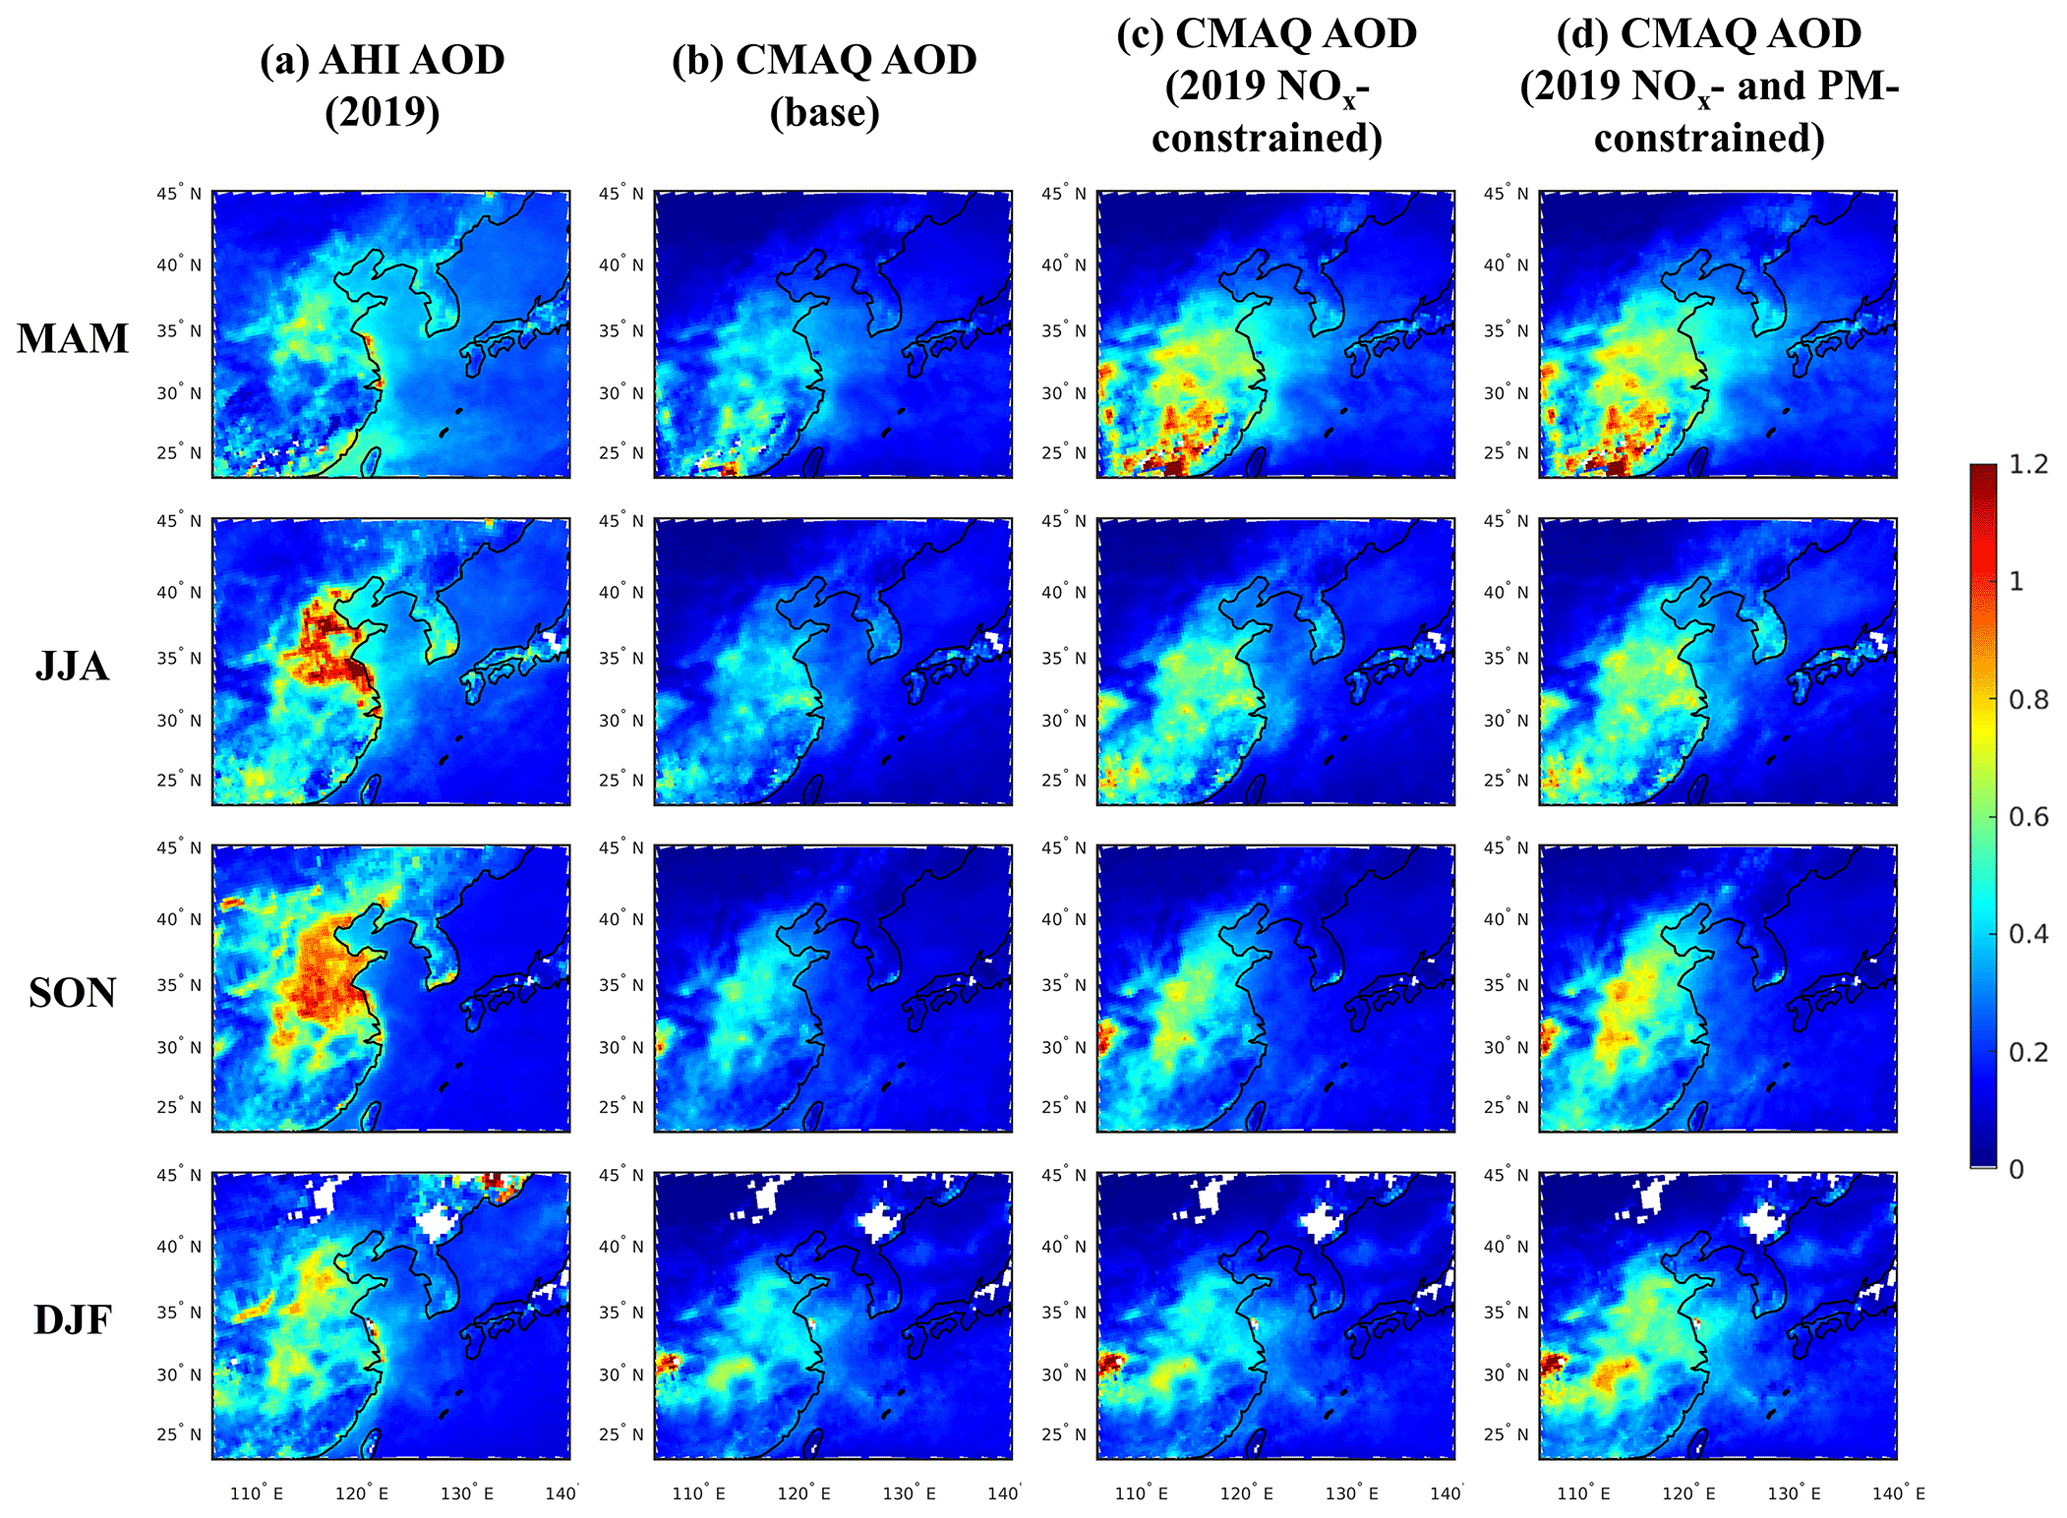
Figure 2Spatial distributions of the AHI and CMAQ-simulated AODs before and after the NOx emissions adjustment (based on TROPOMI NO2 columns) and primary PM emissions adjustment (based on AHI AOD) during the study period 2019. (a) The AHI AOD, (b) the CMAQ-simulated AOD using base emissions, (c) the CMAQ-simulated AOD using 2019 NOx-constrained emissions, and (d) the CMAQ-simulated AOD using 2019 NOx- and PM-constrained emissions. Note that CMAQ-simulated AODs were temporally collocated to the AHI AOD.
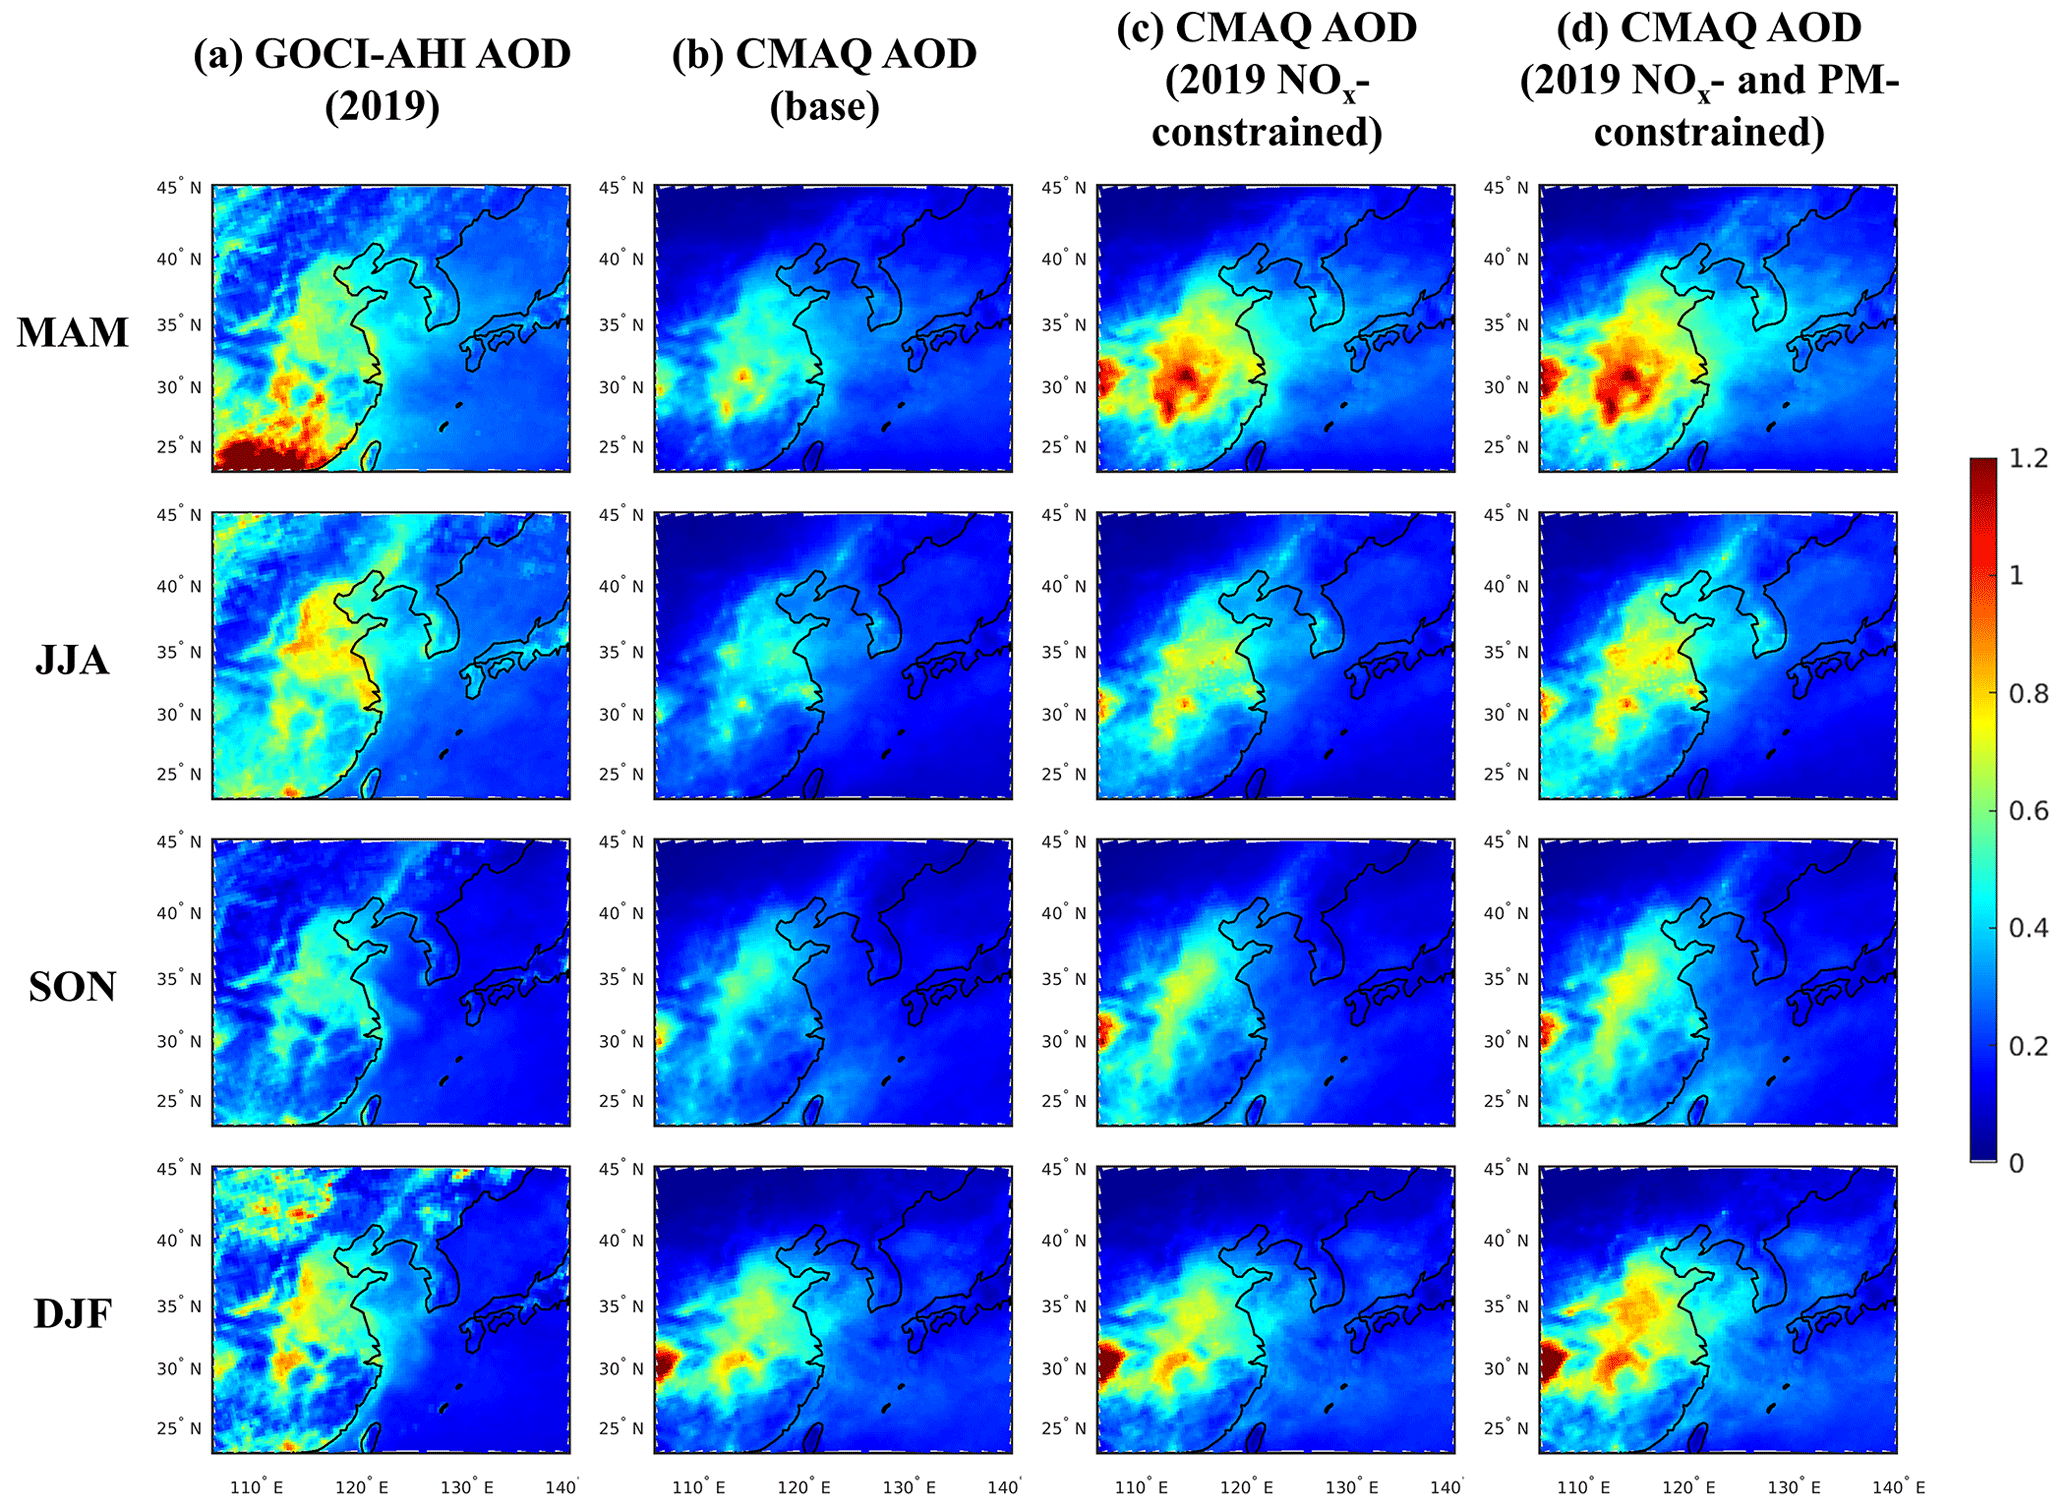
Figure 3Spatial distributions of GOCI-AHI fused and CMAQ-simulated AODs before and after the NOx emissions adjustment (based on TROPOMI NO2 columns) and primary PM emissions adjustment (based on GOCI-AHI AOD) during the study period 2019. (a) The GOCI-AHI AOD, (b) the CMAQ-simulated AOD using base emissions, (c) the CMAQ-simulated AOD using 2019 NOx-constrained emissions, and (d) the CMAQ-simulated AOD using 2019 NOx- and PM-constrained emissions. Note that CMAQ-simulated AODs were temporally collocated to the GOCI-AHI AOD.
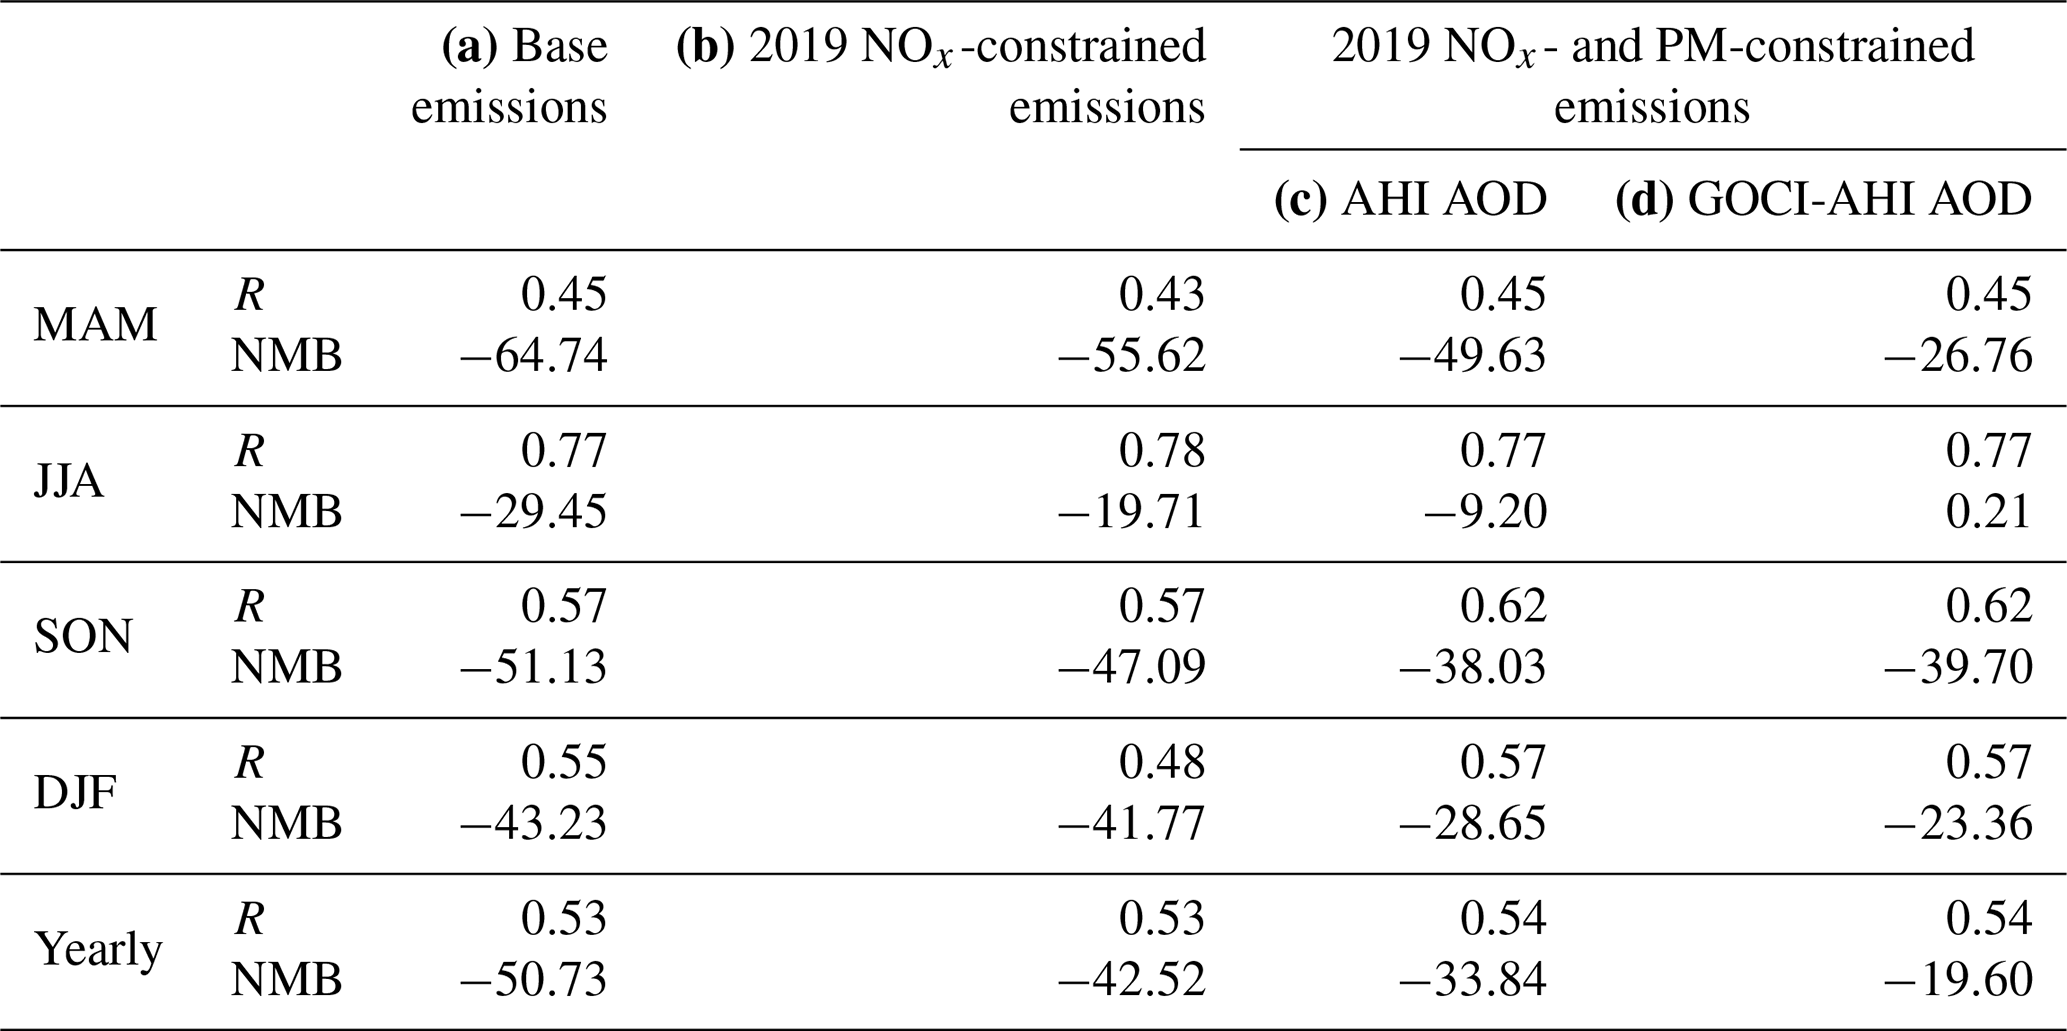
We then evaluated the performance of the model in simulating daily mean AODs at AERONET sites in time series and found that, overall, the series of emissions adjustments resulted in improvements in the performance of the model during the entire study period 2019. In brief, the model's initial underestimation of AOD was mitigated by the NOx emissions adjustment, which led to increased NOx emissions, and then by the subsequent primary PM emissions adjustment, which resulted in overall increases in primary PM emissions. While the model using the base emissions showed an average NMB of −50.73 % (Fig. 4a; Table 1a), the model using the 2019 NOx-constrained emissions showed an average NMB of −42.52 % (Fig. 4b; Table 1b). The model using the 2019 NOx- and PM-constrained emissions showed average NMBs of −33.84 % (using the AHI AOD) and −19.60 % (using the GOCI-AHI AOD), respectively (Fig. 4c and d; Table 1c and d). These results indicate that the sequential adjustments of NOx and primary PM emissions were generally effective at improving model performance in simulating the AOD; in particular, the use of the multisource AOD product led to a greater reduction in model biases than that of the single-instrument AOD product. Despite the success of the sequential adjustments of NOx and primary PM emissions in improving the model's AOD simulations, there are still uncertainties remaining regarding the accuracy of NOx emissions. For example, in the NCP region, the NOx emissions adjustment caused the model to overestimate surface NO2 concentrations in some seasons and consequently increased the model biases. Nevertheless, this overestimation was shown to help the model to reduce its AOD underestimation. Addressing this issue requires the development of region-specific tactics for adjusting the bottom-up estimates of gas-phase air pollutant emissions in future studies.
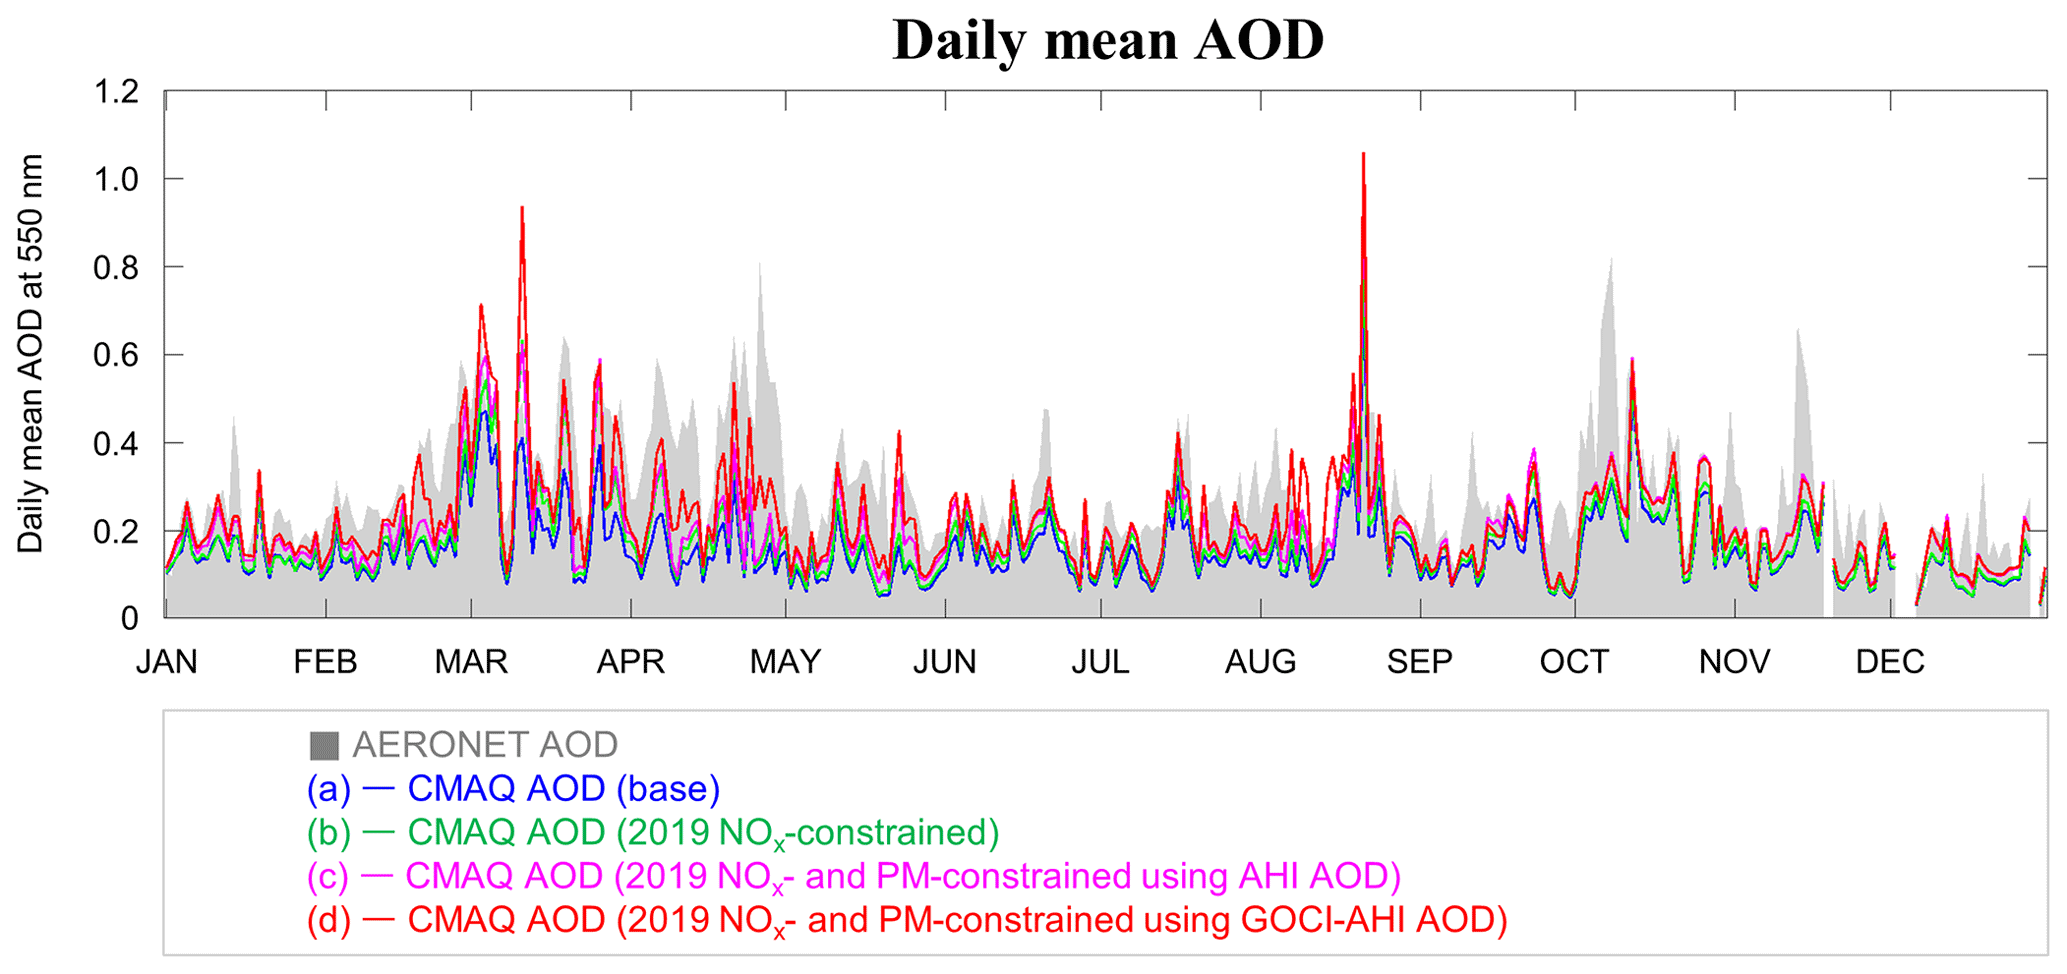
Figure 4Comparisons of the time series of daily mean AERONET AODs (85 sites) and CMAQ-simulated daily mean AODs before and after the NOx and primary PM emissions adjustments during the study period 2019. (a) The CMAQ-simulated AOD using the base emissions, (b) the CMAQ-simulated AOD using the 2019 NOx-constrained emissions, (c) the CMAQ-simulated AOD using the 2019 NOx- and PM-constrained emissions using the AHI AOD, and (d) the CMAQ-simulated AOD using the 2019 NOx- and PM-constrained emissions using the GOCI-AHI fused AOD.
Table 1Summary statistics of the daily mean AERONET AOD (85 sites) and the CMAQ-simulated daily mean AOD before and after the NOx emissions adjustment (based on TROPOMI NO2 columns) and primary PM emissions adjustment (based on AHI AOD and GOCI-AHI AOD) during the study period 2019. (a) The CMAQ-simulated AOD using the base emissions, (b) the CMAQ-simulated AOD using 2019 NOx-constrained emissions, (c) the CMAQ-simulated AOD using 2019 NOx- and PM-constrained emissions using the AHI AOD, and (d) the CMAQ-simulated AOD using 2019 NOx- and PM-constrained emissions using GOCI-AHI fused AOD. R: Pearson's correlation coefficient; NMB (%): normalized mean bias.
3.2 Merits and limitations of the sequential emissions adjustments and the use of the data fusion product
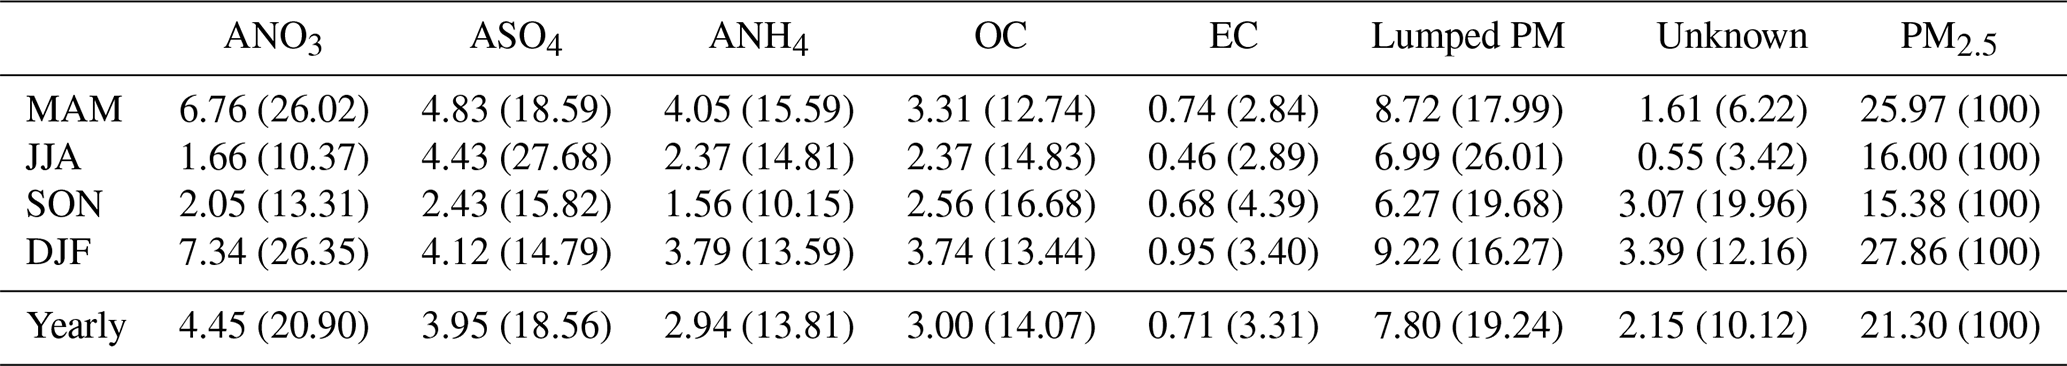
Despite the many top-down approaches to achieving more up-to-date emissions inventories, questions still remain about the extent to which each of the aerosol components contributes to aerosol loadings. To ascertain the possible implications for our understanding of sequential improvements in the performance of the model in simulating the AOD, we examined the chemical compositions of surface PM2.5 in Korea during the study period 2019 on a seasonal basis. While a slightly larger portion (53.26 % on average) of surface PM2.5 loadings was comprised of secondary inorganic aerosols such as nitrate, sulfate, and ammonium aerosols (20.90 %, 18.56 %, and 13.81 %, respectively), the total of the remaining portion (46.74 % on average) was mostly comprised of primary PM and some secondary aerosols such as the organic carbon category used in this study (Table 2).
Table 2Concentrations (µg m−3) and compositions (%) of surface PM2.5 and its components in Korea during the study period 2019. ANO3, ASO4, and ANH4: nitrate, sulfate, and ammonium aerosols, respectively; OC: primary and secondary organic carbon; EC: elemental carbon; lumped PM: the lumped summation of PM species noted in Sect. 2.6; unknown: undefined PM2.5 species noted in Sect. 2.6.
As both the contributions of primary and secondary aerosols to aerosol loadings were significant, we considered the sequential adjustments of NOx and primary PM emissions effective at improving model performance. However, setting aside the earlier improvements in the model performances achieved for the study period 2019, such a chemical makeup of PM2.5 observed implies that the adjustment of solely NOx emissions performed in this study might not have sufficiently reduced the uncertainty underlying the emissions of the precursors of other secondary inorganic aerosols, such as sulfate and ammonium aerosols. Considering the impending availability of the GEMS tropospheric NO2 product in its mature stage, this study mainly focused on examining the utility of NO2 columns, not the other gas-phase precursors, which could have been beneficial for constraining the remaining secondary inorganic aerosols. This limitation presents a need for follow-up research that employs more comprehensive sets of top-down constraints (e.g., observational references for SO2 and ammonia loadings in the troposphere).
To account for the outperformance of the model that used the adjusted emissions based on the data fusion product, we quantified the number of observational references available from each of the AHI AOD and GOCI-AHI AOD products. The benefit of securing more continuous and frequent observations, which provide more data available for constraining model biases, has often been highlighted in many satellite-based inverse modeling and data assimilation studies (Jeon et al., 2016; Lee et al., 2016; Yumimoto et al., 2016; Jin et al., 2019; Choi et al., 2019). We compared the numbers of valid AOD retrievals made for each of the modeling grids (hereafter referred to as AOD records) obtained from the AHI AOD and GOCI-AHI AOD products. Note that the grid-specific number of AOD records does not necessarily indicate the instrumental sampling frequency of the satellite instrument in this comparison. While the AHI AOD product showed some clusters of missing values over several inland regions (i.e., southeastern and northeastern China, the Sichuan Basin, and some areas in Primorye in Russia, North Korea, and Japan), the GOCI-AHI AOD product produced more spatially complete domain-wide observations during the study period 2019 (Fig. 5).
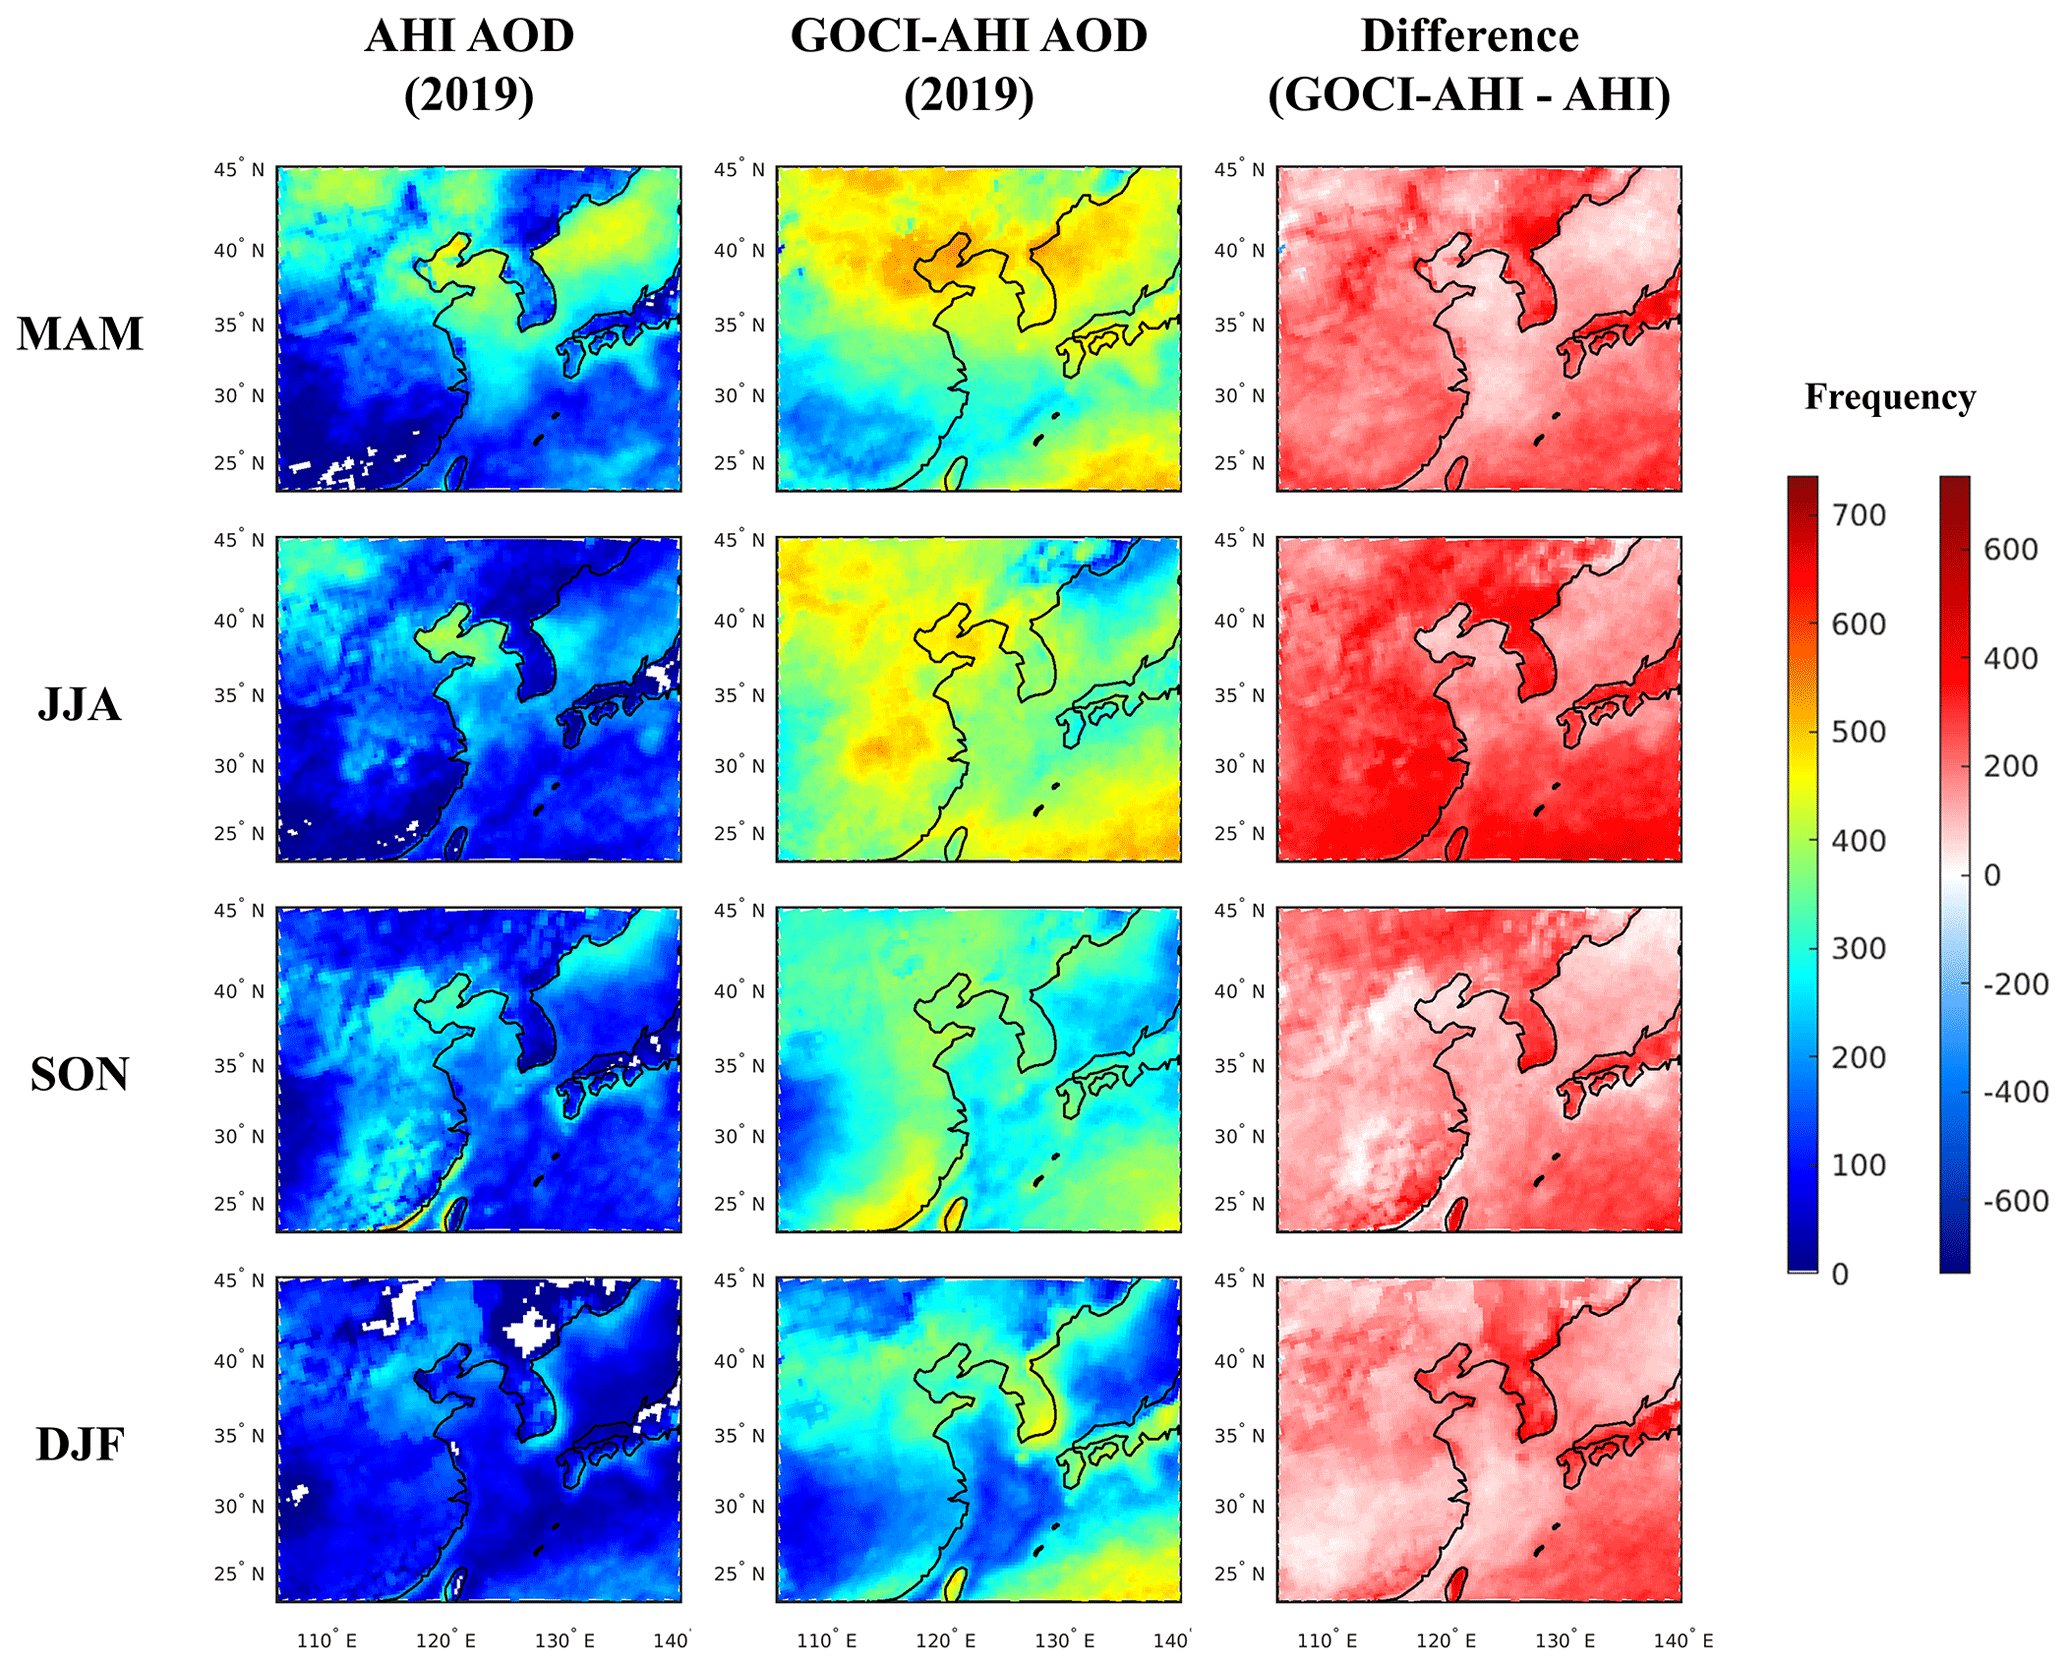
Figure 5The number of AOD records (in each of the modeling grids) obtained from the AHI AOD product and the GOCI-AHI fused AOD product during the study period 2019.
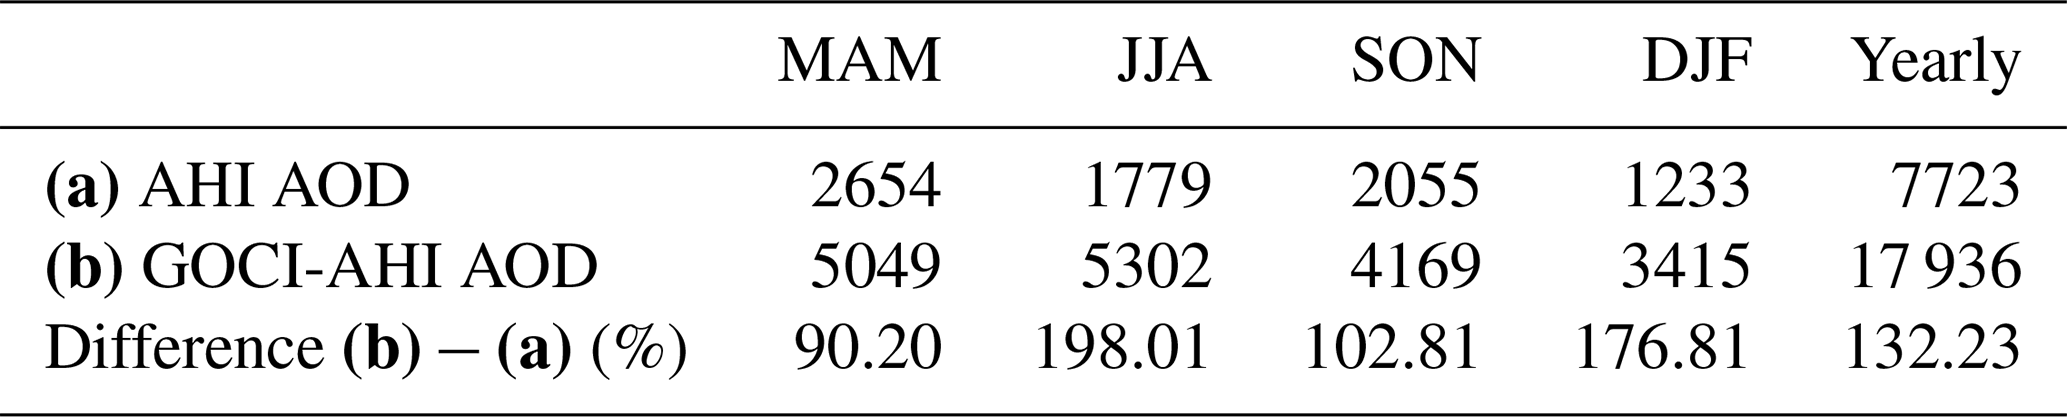
In addition to the improvement in the observational coverage, the GOCI-AHI AOD product showed a noticeable improvement in the amount of available data. Compared to the AHI AOD product, the GOCI-AHI AOD product showed increases in the numbers of AOD records by 132.23 % on average during the entire study period, the seasonal extents of which ranged from 90.20 % to 198.01 % (Fig. 5; Table 3). In other words, even though the AHI AOD and GOCI-AHI AOD were given over the modeling domain at identical spatiotemporal resolutions in the first place, there was a substantial difference in the volume of the information available in the end. We accounted for the greater improvement in the model performance afforded by the use of GOCI-AHI AOD (Figs. 3 and 4; Table 1) by the instruments supplementing undetected or discarded pixels of other instruments that originate from different aerosol retrieval algorithms and by the additional bias correction approaches (Lim et al., 2018; Choi et al., 2019; Lim et al., 2021).
Table 3The number of AOD records (domain-wide) in thousands obtained from the AHI AOD product and the GOCI-AHI fused AOD product during the study period 2019.
Such an improvement in the quantity of observation references seemed to be beneficial for improving the model performance in AOD estimation. For example, in March–April–May (MAM) 2019, the use of the emissions constrained based on GOCI-AHI AOD reduced the model bias more effectively compared to that based on AHI AOD. This improvement (or the difference in the extent of emissions adjustment) was considered to be due to whether the high AOD peaks along southeastern China were captured (Fig. 3a) or not (Fig. 2a). Throughout the entire year 2019, the season MAM showed the most frequent occurrences of high AOD peaks over AERONET sites compared to other seasons (Fig. 5). Considering the locations of those ground-based sites (Fig. 1 above), many of which cover southeastern China, we first presumed that GOCI-AHI AOD would represent the aerosol loadings more realistically. Then, this was supported by the grid-specific number of AOD records afforded by AHI AOD and GOCI-AHI AOD (Fig. 5), the former of which showed noticeably less information available for use. Therefore, we concluded that the use of the emissions constrained based on GOCI-AHI AOD, which was considered to better capture the high AOD peaks across southeastern China in a spatiotemporally more frequent and continuous manner, was more effective at resolving the model's initial AOD underestimation.
3.3 Application of the top-down approach using the GEMS-AMI-GOCI-2 fused AOD product
Upon the earlier success of the use of the proxy of GEMS-AMI-GOCI-2 AOD (GOCI-AHI AOD described in Sect. 3.1) in updating the emissions inventory, which resulted in further reduced model biases compared to those from the use of the proxy of GEMS AOD (AHI AOD described in Sect. 3.1), we employed the GEMS-AMI-GOCI-2 AOD product to proceed with the emissions adjustment for the study period 2022. Note that the GOCI-AHI AOD product used earlier served as a prototype for the development of the GEMS-AMI-GOCI-2 AOD product; the production of the GOCI-AHI AOD product has been discontinued, and it is currently only available for research purposes for the year 2019. To explore the utility of the multisource data fusion product in constraining the temporal variations of aerosol precursor emissions and ultimately to leverage the up-to-date emissions inventory to improve model performance at simulating AOD and PM2.5 concentrations, we used the GEMS-AMI-GOCI-2 fused AODs as top-down constraints to adjust primary PM emissions over the modeling domain. Similarly to the earlier top-down approach, we used TROPOMI NO2 columns in advance of the primary PM emissions adjustments to constrain NOx emissions.
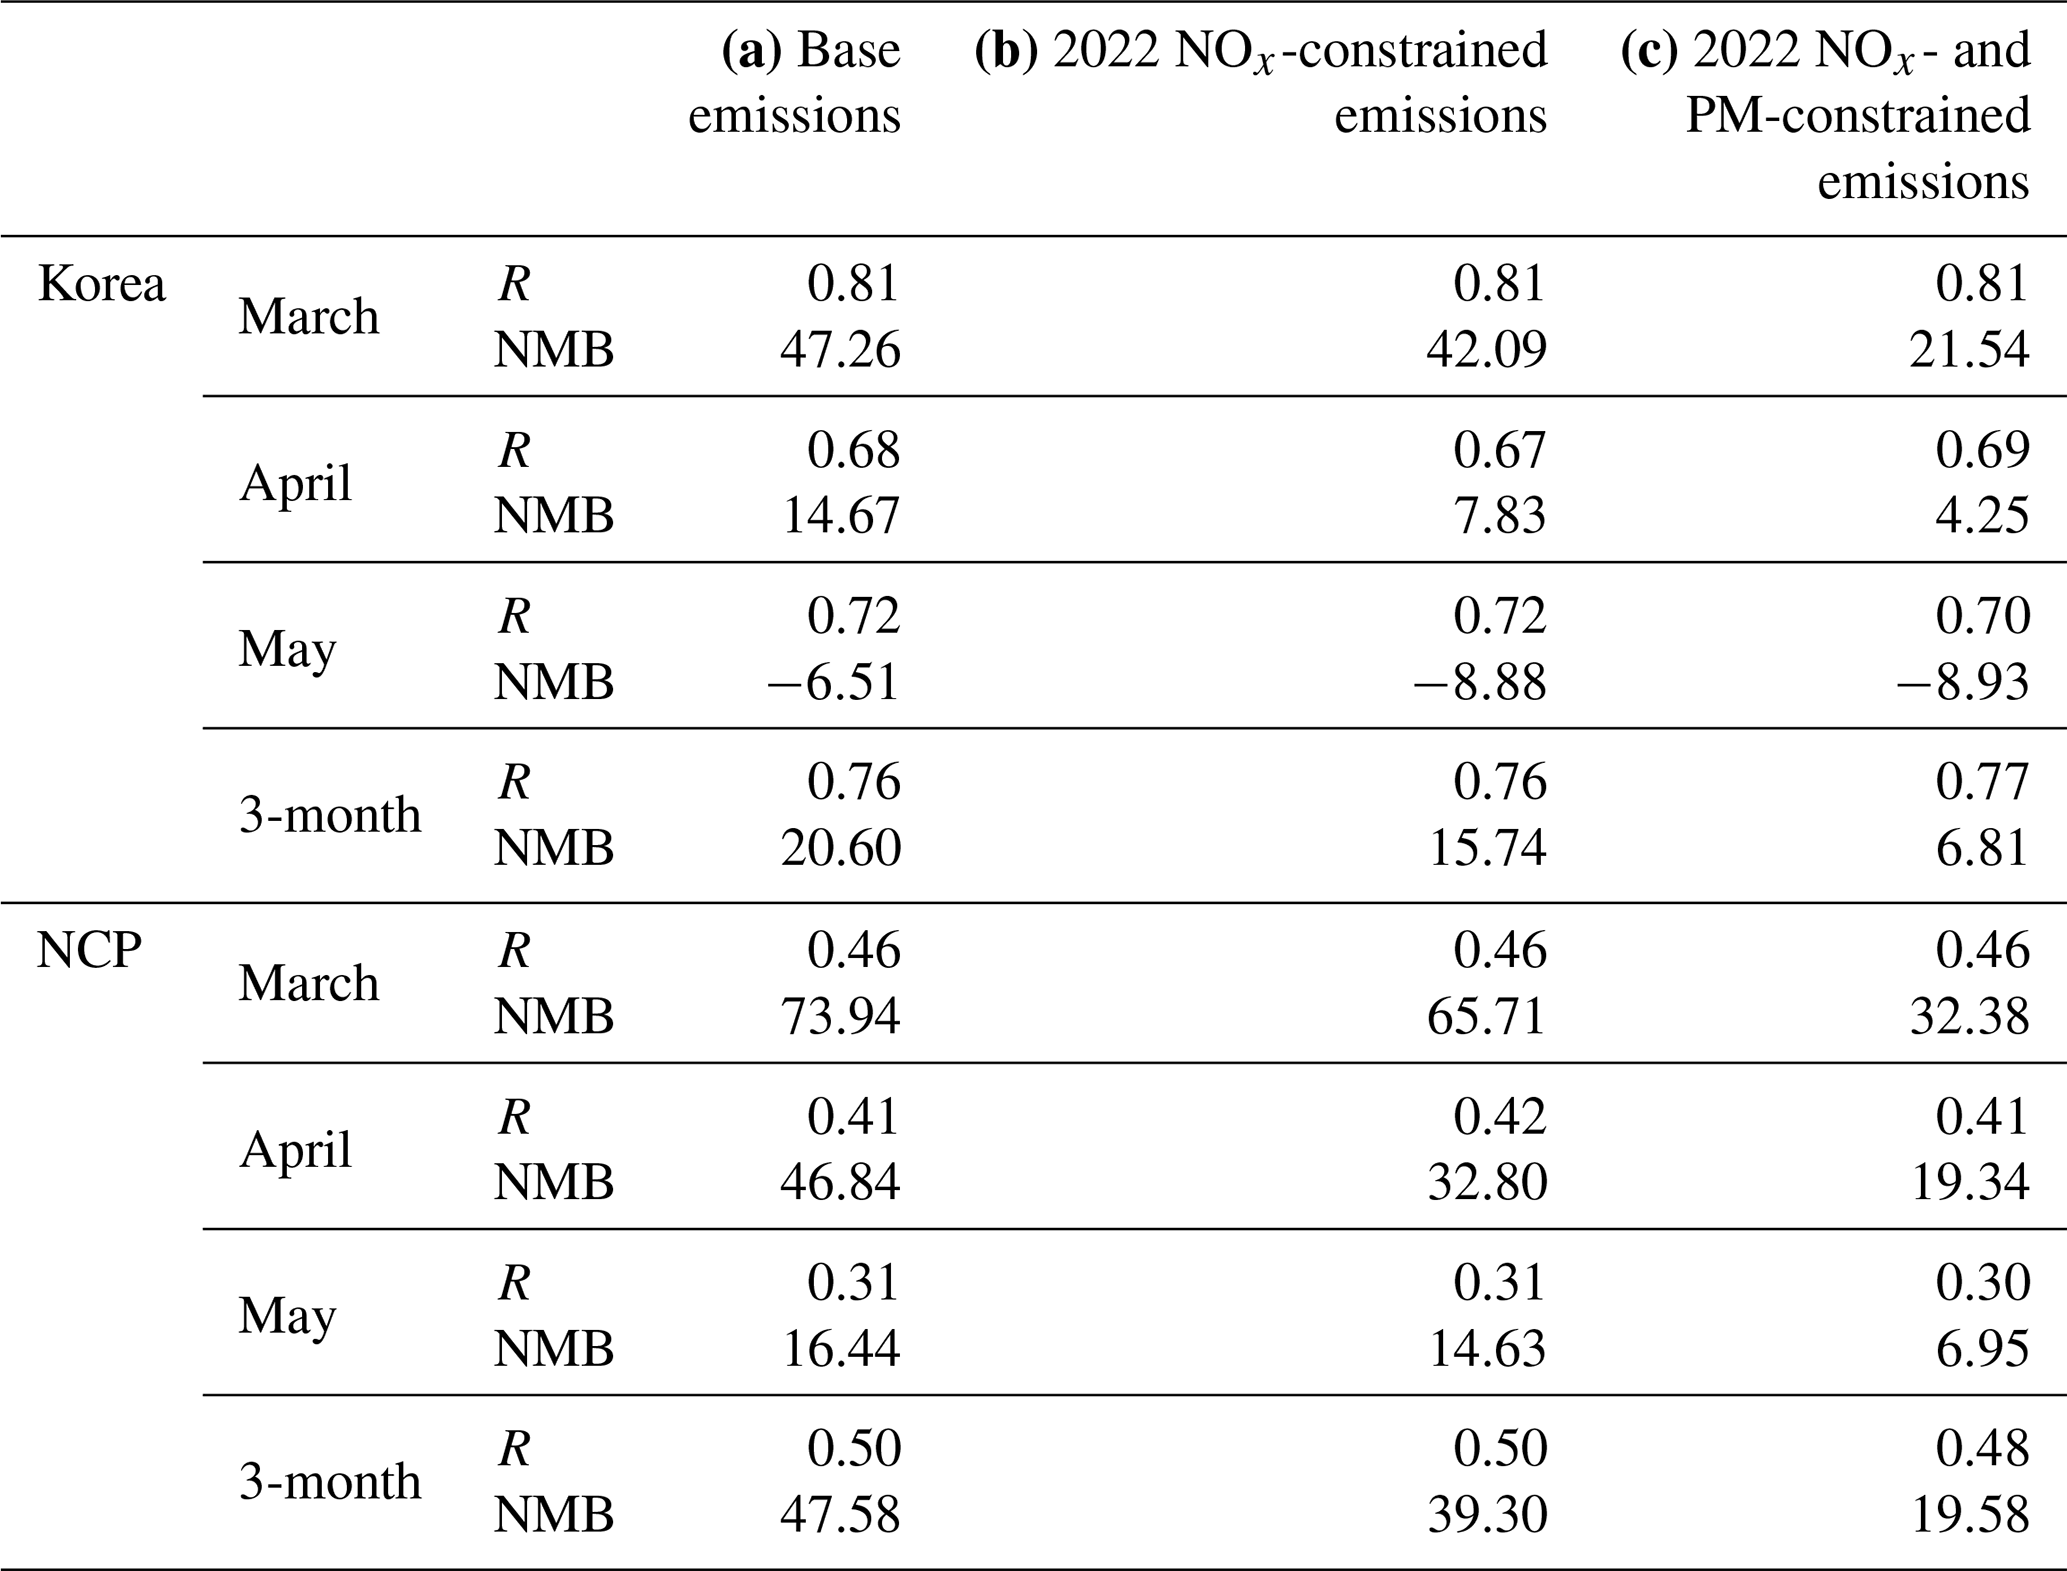
Using the base emissions, the model tended to overestimate AODs over a major portion of the modeling domain, particularly across the NCP region, during the study period 2022 (Fig. 6a and b). Upon the relative decreases in monthly mean NO2 columns in March, April, and May 2022 compared to the corresponding months in 2019 (Fig. S9), the NOx emissions adjustment led to overall reductions in NOx emissions by 2.83 %–13.40 % (Fig. S10; Table S7), which appeared to be effective at reducing the discrepancy between the observed and modeled AODs (Fig. 6c). After the primary PM emissions adjustment, which resulted in an overall decrease in primary PM emissions by 9.03 % (Fig. S11; Table S8), the modeled AODs showed even closer spatial agreements with the observed AODs (Fig. 6d). Then we evaluated the model performance in simulating daily mean surface PM2.5 concentrations in Korea and the NCP region in a time series. Similar to the earlier results shown for the study period 2019, the NOx and primary PM emissions adjustments led to overall improvements in the model performances during the study period 2022. Using the base emissions, the model overestimated PM2.5 concentrations by 20.60 % in Korea and 47.58 % in the NCP region (Fig. 7a; Table 4a); on the other hand, using the NOx emissions adjustment, the model reduced the extent of overestimation to 15.74 % in Korea and 39.80 % in the NCP region (Fig. 7b; Table 4b), and then the primary PM emissions adjustment further reduced those to 6.81 % and 19.58 % (Fig. 7c; Table 4c).
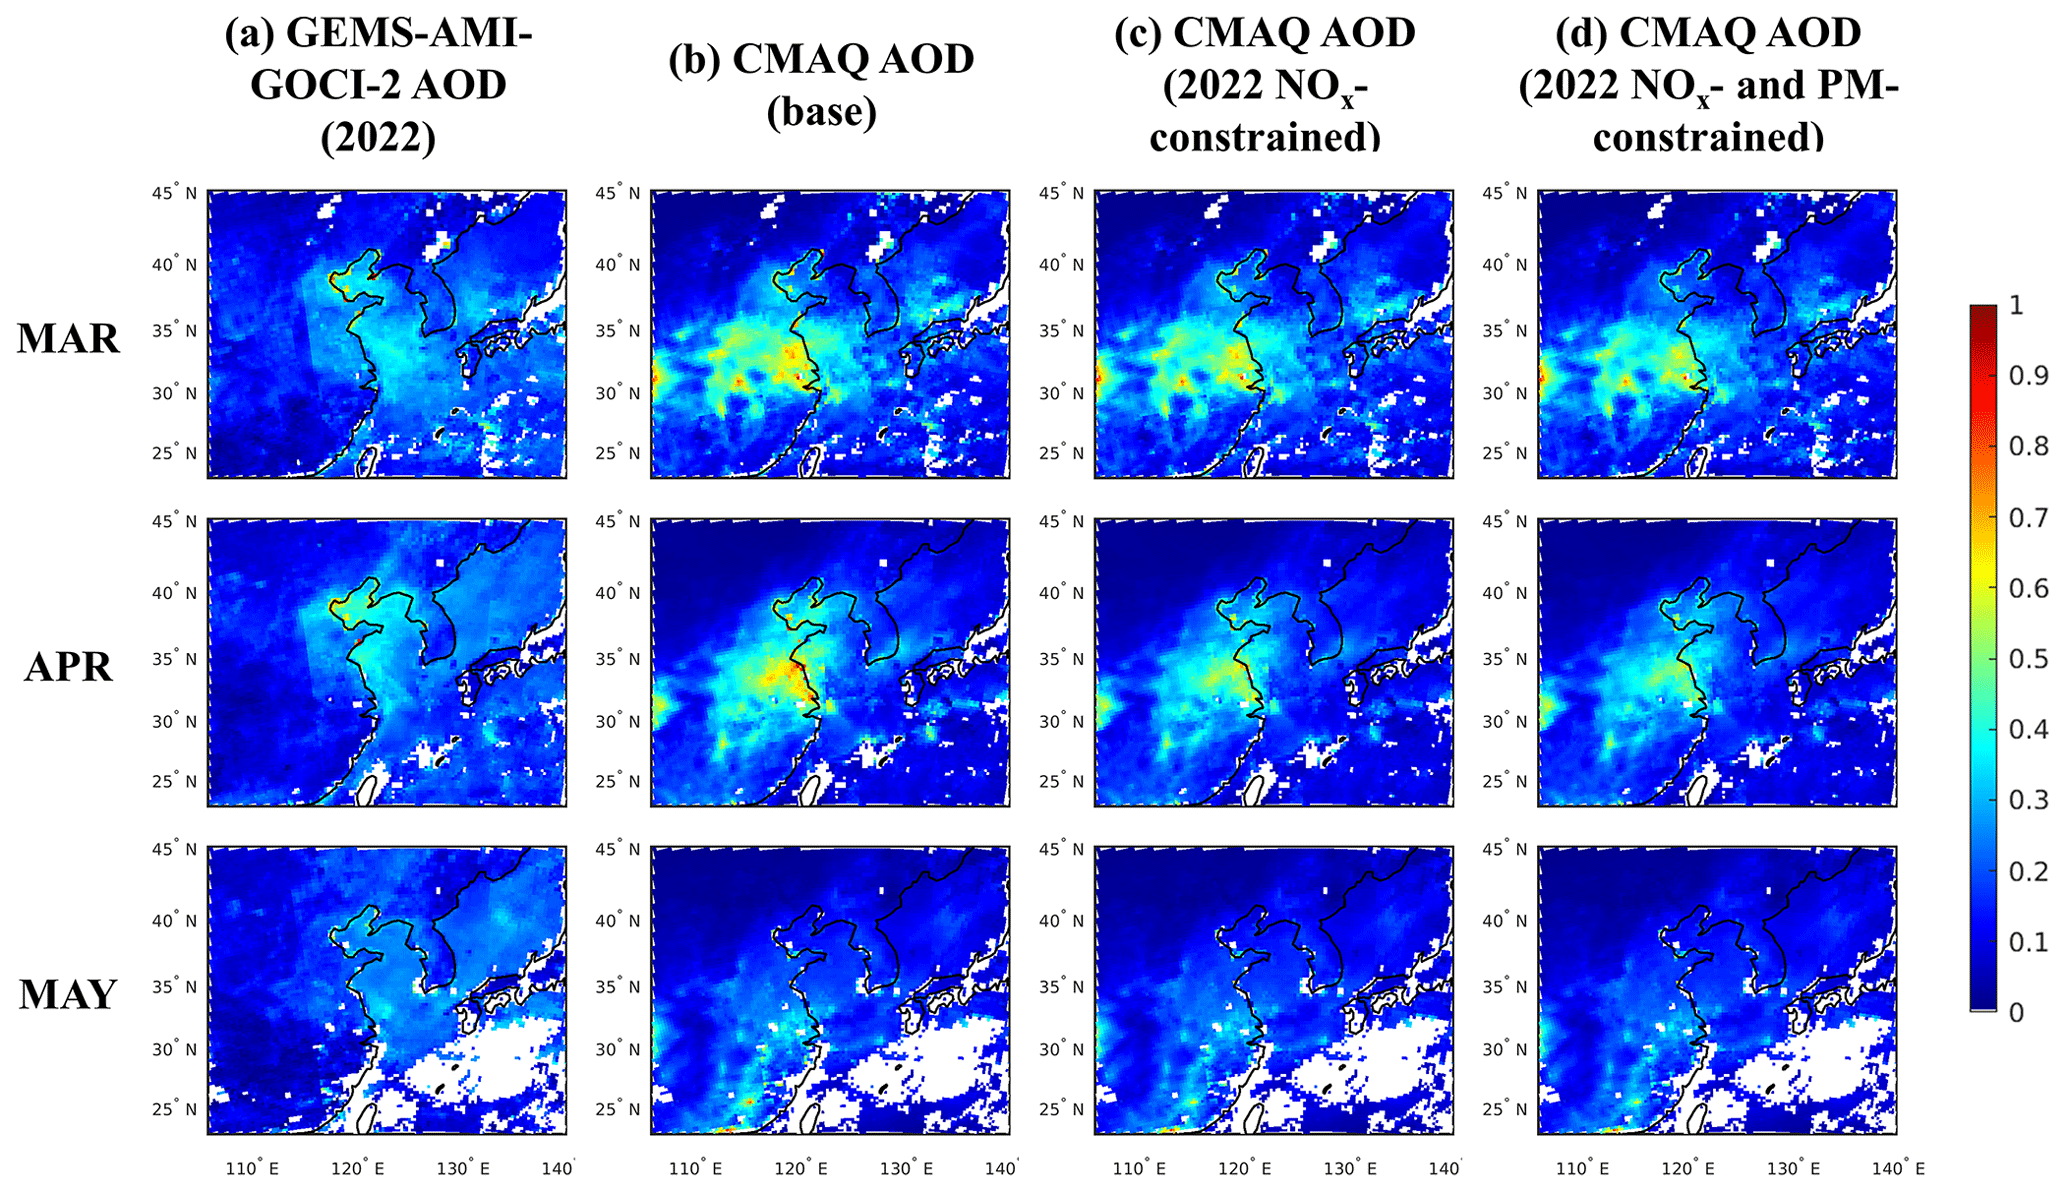
Figure 6Spatial distributions of GEMS-AMI-GOCI-2 fused AOD and CMAQ-simulated AODs before and after the NOx and primary PM emissions adjustments during the study period 2022. (a) The GEMS-AMI-GOCI-2 AOD, (b) the CMAQ-simulated AOD using base emissions, (c) the CMAQ-simulated AOD using 2022 NOx-constrained emissions, and (d) the CMAQ-simulated AOD using 2022 NOx- and PM-constrained emissions.
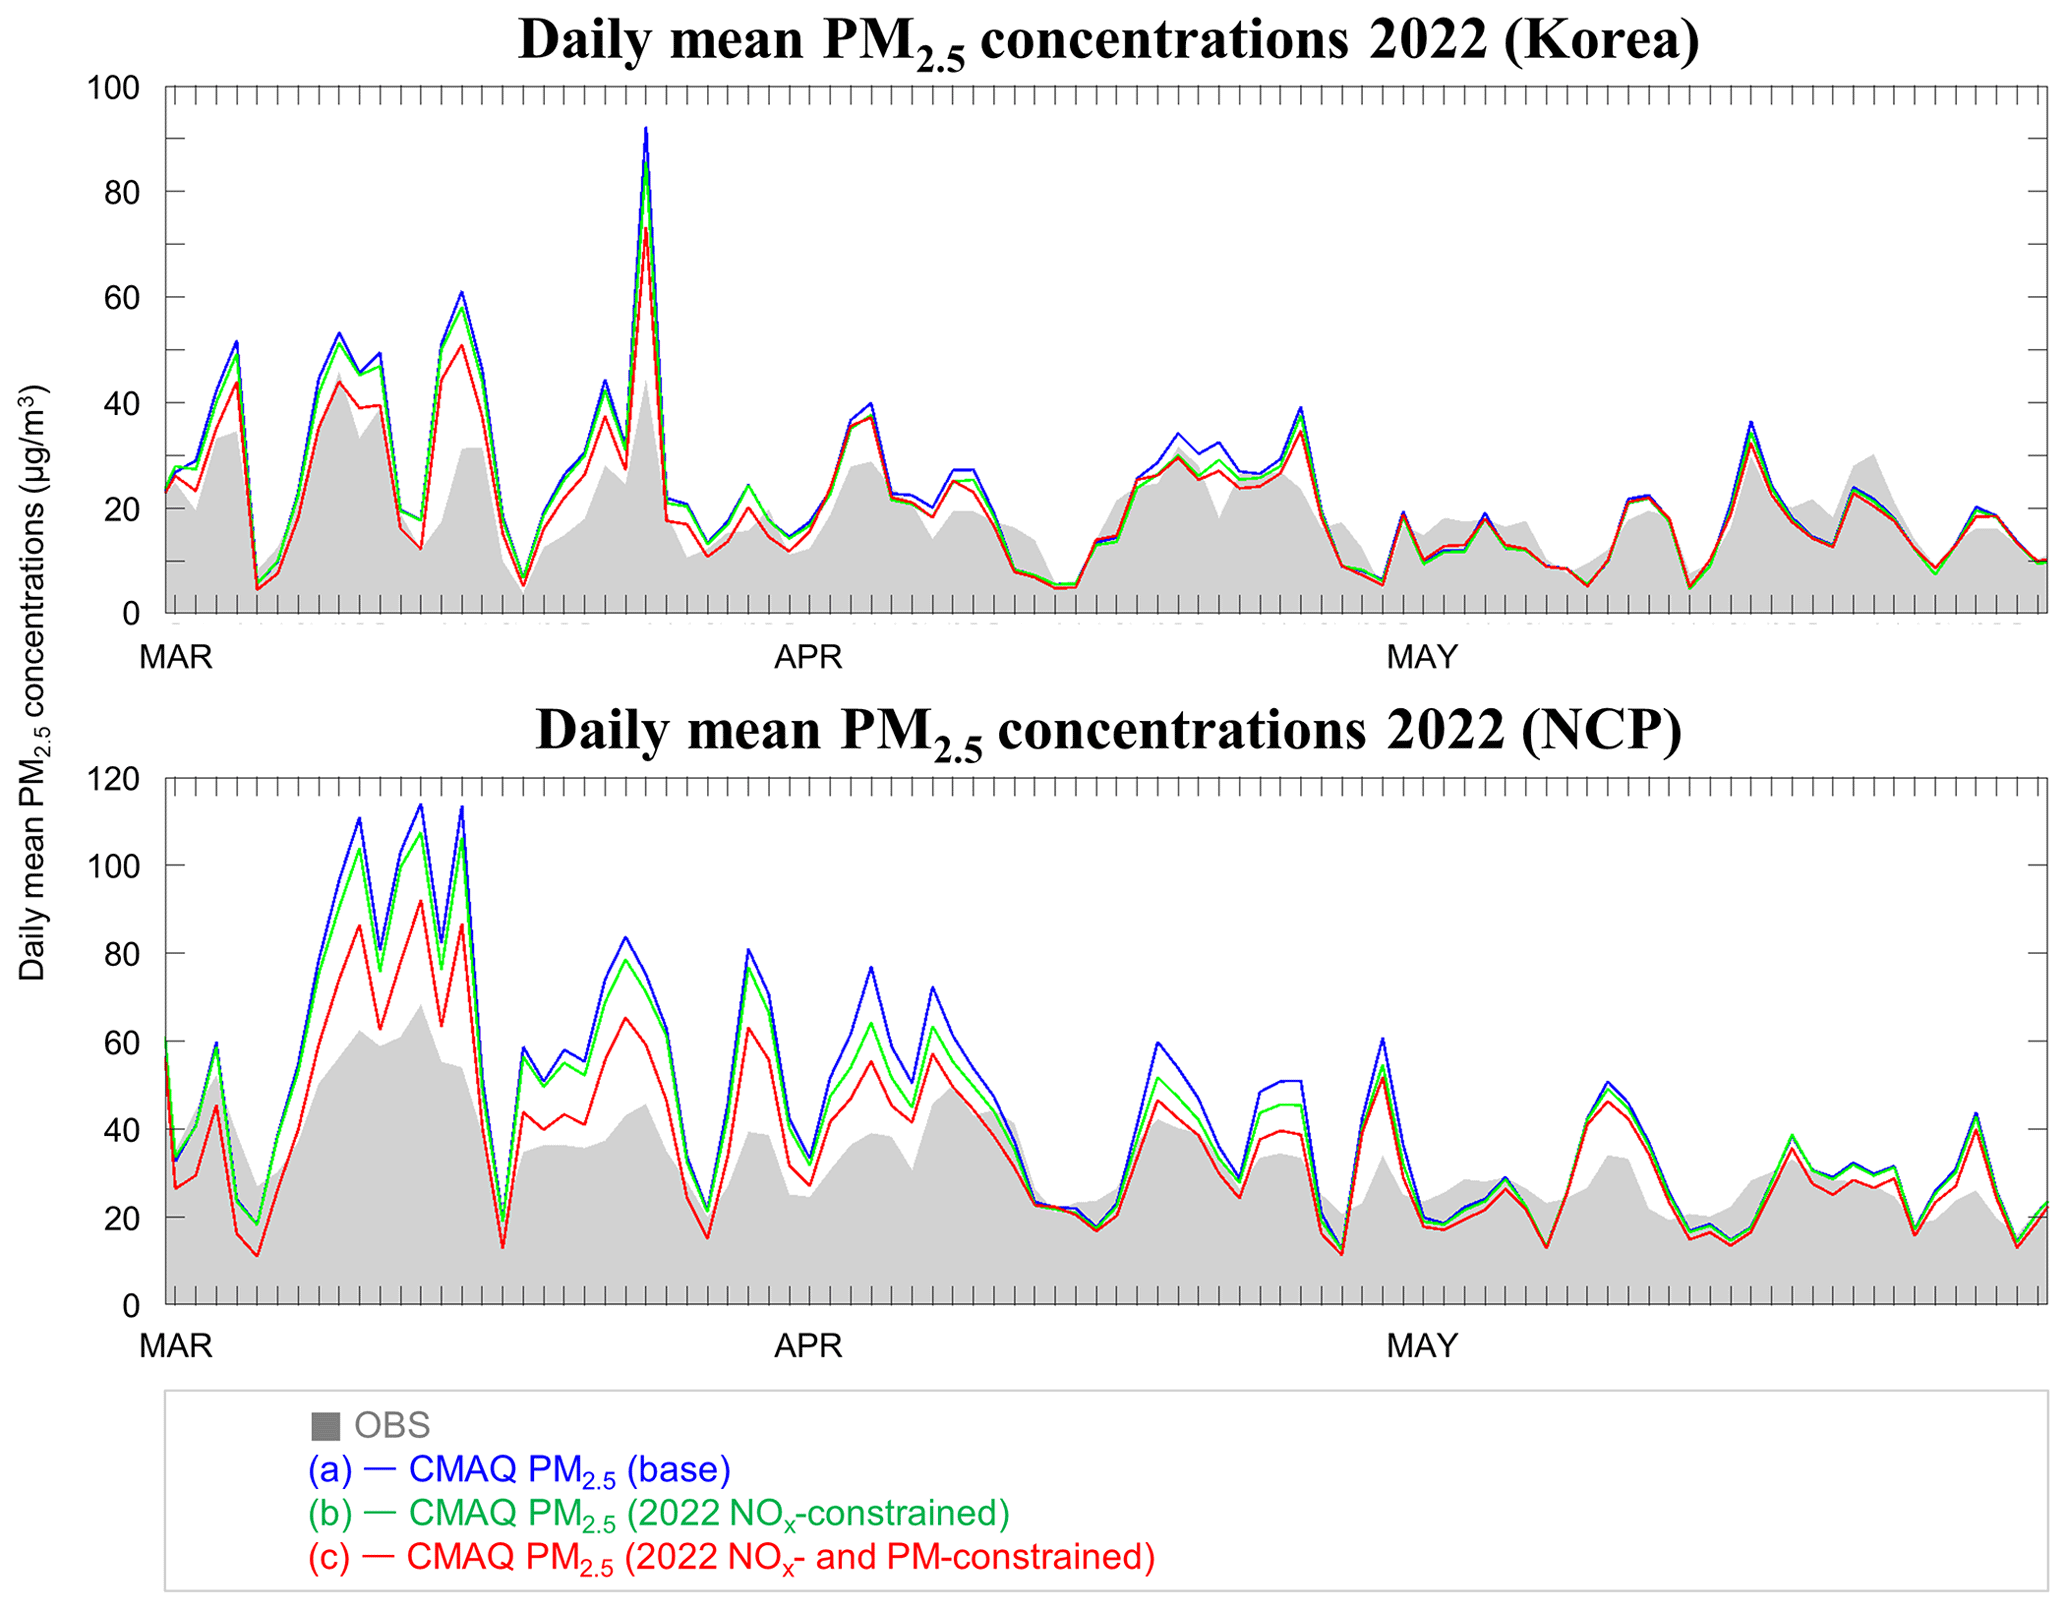
Figure 7Comparisons of the time series of the CMAQ-simulated daily mean surface PM2.5 concentrations (µg m−3) before and after the NOx and primary PM emissions adjustments and ground-based in situ measurements in Korea (425 sites) and the NCP region (312 sites) during the study period 2022. OBS: ground-based in situ measurements; (a) CMAQ-simulated PM2.5 using base emissions, (b) CMAQ-simulated PM2.5 using 2022 NOx-constrained emissions, and (c) CMAQ-simulated PM2.5 using 2022 NOx- and PM-constrained emissions.
Table 4Summary statistics of CMAQ-simulated daily mean PM2.5 concentrations before and after the NOx and primary PM emissions adjustments and ground-based in situ measurements in Korea (425 sites) and the NCP region (312 sites) during the study period 2022. (a) CMAQ-simulated PM2.5 using base emissions, (b) CMAQ-simulated PM2.5 using NOx-constrained emissions, and (c) CMAQ-simulated PM2.5 using 2022 NOx- and PM-constrained emissions.
Unlike top-down constraints used during the study period 2019, those used during the study period 2022 led to overall reductions in NOx and primary PM emissions, particularly over the highly industrialized regions (e.g., the NCP region and other major metropolitan areas in China) (Figs. S10 and S11). An explanation for the noticeable decreases in NO2 columns and AODs observed across these regions in March, April, and May 2022 compared to those observed in the corresponding months during the pre-COVID-19 period (the year 2019 in this study) (Figs. 2a, 3a, 6a, and S9) was the strict city- and province-wide lockdown regulations (the so-called “zero-COVID strategy” that resumed in March 2022) (Dyer, 2022), which led to substantial reductions in the amounts of anthropogenic emissions (e.g., vehicular, industrial, and agricultural emissions) (Caporale et al., 2022) in China. In addition, the updated emissions inventory yielded more accurate representations of the aerosol loadings over the sea surface (i.e., the Yellow Sea), which could benefit other studies that involve the long-range transport of aerosols emitted from inland sources (Hatakeyama et al., 2001; Carmichael et al., 2002; Pouyaei et al., 2020, 2021; Jung et al., 2021).
In summary, this study attempted to sequentially adjust bottom-up estimates of NOx and primary PM emissions over East Asia by employing observational references afforded by multiple satellite instruments retrofitted on various platforms and the synergistic science product. During the study period 2019, we reconfirmed the utility of LEO and GEO satellite products in emissions adjustments and then explored that of the multisource data fusion product, whose enhanced observational quantity and quality appeared to reduce model biases in AOD simulations to a great extent. During the study period 2022, which experienced noticeable reductions in the amounts of anthropogenic emissions primarily resulting from severe lockdowns across major urban regions in China, the earlier top-down approach to constraining aerosol precursor emissions was also effective at reducing spatiotemporal discrepancies between the modeled and observed loadings of aerosols and their precursors; in particular, the emissions adjustments were effective at improving the model performances in simulating surface PM2.5 concentrations during the lockdown period.
In light of such findings, we conclude that the series of emissions adjustments in this study, which were capable of closely capturing variations in the emissions of both primary aerosols and the precursors of secondary aerosols in a top-town manner, were generally effective at improving the model performances in estimating aerosol loadings over East Asia. The enhanced observation quality and quantity afforded by the GEMS-involved synergistic product and its proxy appeared to be beneficial for capturing the spatiotemporal variations in the emissions of the aerosol precursors. In terms of possible uncertainties that could originate from other aerosol precursor species, which was outside the scope of this study, the methodology used left some room for further improvement; nonetheless, this study reconfirmed the significant association between emissions of aerosol precursors and the AOD as well as surface PM2.5 concentrations and underscored the benefit of using multisource, top-down information to best exploit available observational references. In light of the improvement in data availability (e.g., tropospheric SO2 columns and the operational version of the data fusion product) in the near future, afforded by GEMS and its sister instruments, we conclude that the findings of this study could provide a useful basis for how to more effectively use the new data for producing more up-to-date emission inventories, the expected results of which could provide more precise insight into the spatiotemporal behaviors of air pollutants in pandemic situations.
AHI aerosol products can be accessed at https://www.eorc.jaxa.jp/ptree/index.html (Japan Aerospace Exploration Agency Himawari Monitor (P-Tree system) database, 2022). TROPOMI tropospheric NO2 columns sampled along the study area are available at https://cophub.copernicus.eu/ (European Space Agency Copernicus Services Data Hub, 2022). Data fusion products may be available upon request to the authors. Ground-based in situ measurements of NO2 and PM2.5 concentrations are available from https://www.airkorea.or.kr (Korean Ministry of Environment AirKorea database, 2022) and http://www.cnemc.cn/en/ (China National Environmental Monitoring Center database, 2022).
The supplement related to this article is available online at: https://doi.org/10.5194/amt-16-3039-2023-supplement.
JP took the lead in drafting the original manuscript. JP, JJ, YC, and KL set up the experimental design. JP and JJ set up the modeling system and conducted emissions adjustments and model simulations. HL, MK, YL, and JK developed and provided the multisource data fusion products (GOCI-AHI and GEMS-AMI-GOCI-2 aerosol products). KL provided AirKorea datasets for model evaluation. YC and KL provided overall context as a principal investigator and project manager, respectively, and supervised the entire research. All the authors discussed the results, exchanged comprehensive feedback on the original manuscript draft, and contributed to preparing the final version of the manuscript.
At least one of the (co-)authors is a guest member of the editorial board of Atmospheric Measurement Techniques for the special issue “GEMS: first year in operation (AMT/ACP inter-journal SI)”. The peer-review process was guided by an independent editor, and the authors also have no other competing interests to declare.
Publisher’s note: Copernicus Publications remains neutral with regard to jurisdictional claims in published maps and institutional affiliations.
This article is part of the special issue “GEMS: first year in operation (AMT/ACP inter-journal SI)”. It is not associated with a conference.
We are grateful for the support of the Research Computing Data Core at the University of Houston for assistance with the calculations carried out in this work
This research has been supported by the National Institute of Environment Research (NIER) under the Ministry of Environment of the Republic of Korea (grant no. NIER-2022-04-02-088). Jia Jung was supported by NASA grant no. 80HQTR21T0069 at Pacific Northwest National Laboratory (PNNL). PNNL is operated for the U.S. Department of Energy (DOE) by Battelle Memorial Institute under contract no. DE-AC06-76RLO 1830.
This paper was edited by Ben Veihelmann and reviewed by three anonymous referees.
Ahn, C., Torres, O., and Jethva, H.: Assessment of OMI near-UV aerosol optical depth over land, J. Geophys. Res.-Atmos., 119, 2457–2473, https://doi.org/10.1002/2013JD020188, 2014.
ÅngstrÖm, A.: Techniques of Determining the Turbidity of the Atmosphere, Tellus, 13, 214–223, https://doi.org/10.3402/tellusa.v13i2.9493, 1961.
Bellouin, N., Boucher, O., Haywood, J., and Reddy, M. S.: Global estimate of aerosol direct radiative forcing from satellite measurements, Nature, 438, 1138–1141, https://doi.org/10.1038/nature04348, 2005.
Bessho, K., Date, K., Hayashi, M., Ikeda, A., Imai, T., Inoue, H., Kumagai, Y., Miyakawa, T., Murata, H., Ohno, T., Okuyama, A., Oyama, R., Sasaki, Y., Shimazu, Y., Shimoji, K., Sumida, Y., Suzuki, M., Taniguchi, H., Tsuchiyama, H., Uesawa, D., Yokota, H., and Yoshida, R.: An Introduction to Himawari-8/9 – Japan's New-Generation Geostationary Meteorological Satellites, J. Meteorol. Soc. Jpn. Ser. II, 94, 151–183, https://doi.org/10.2151/jmsj.2016-009, 2016.
Byun, D. and Schere, K. L.: Review of the Governing Equations, Computational Algorithms, and Other Components of the Models-3 Community Multiscale Air Quality (CMAQ) Modeling System, Appl. Mech. Rev., 59, 51–77, https://doi.org/10.1115/1.2128636, 2006.
Caporale, G. M., Carmona-González, N., and Gil-Alana, L. A.: Atmospheric Pollution in Chinese Cities: Trends and Persistence, CESifo Working Paper No. 10161, SSRN Scholarly Paper No. 4309213, 16 pp., https://doi.org/10.2139/ssrn.4309213, 2022.
Carmichael, G. R., Streets, D. G., Calori, G., Amann, M., Jacobson, M. Z., Hansen, J., and Ueda, H.: Changing trends in sulfur emissions in Asia: Implications for acid deposition, Environ. Sci. Technol., 36, 4707–4713, https://doi.org/10.1021/es011509c, 2002.
Chan, P. K., Zhao, X.-P., and Heidinger, A. K.: Long-Term Aerosol Climate Data Record Derived from Operational AVHRR Satellite Observations, Dataset Papers in Geosciences, 2013, 140791, https://doi.org/10.7167/2013/140791, 2013.
Chen, L., Fei, Y., Wang, R., Fang, P., Han, J., and Zha, Y.: Retrieval of High Temporal Resolution Aerosol Optical Depth Using the GOCI Remote Sensing Data, Remote Sens.-Basel, 13, 2376, https://doi.org/10.3390/rs13122376, 2021.
China National Environmental Monitoring Center database: http://www.cnemc.cn/en/, last access: 2 September 2022.
Choi, M., Kim, J., Lee, J., Kim, M., Park, Y.-J., Jeong, U., Kim, W., Hong, H., Holben, B., Eck, T. F., Song, C. H., Lim, J.-H., and Song, C.-K.: GOCI Yonsei Aerosol Retrieval (YAER) algorithm and validation during the DRAGON-NE Asia 2012 campaign, Atmos. Meas. Tech., 9, 1377–1398, https://doi.org/10.5194/amt-9-1377-2016, 2016.
Choi, M., Kim, J., Lee, J., Kim, M., Park, Y.-J., Holben, B., Eck, T. F., Li, Z., and Song, C. H.: GOCI Yonsei aerosol retrieval version 2 products: an improved algorithm and error analysis with uncertainty estimation from 5-year validation over East Asia, Atmos. Meas. Tech., 11, 385–408, https://doi.org/10.5194/amt-11-385-2018, 2018.
Choi, M., Lim, H., Kim, J., Lee, S., Eck, T. F., Holben, B. N., Garay, M. J., Hyer, E. J., Saide, P. E., and Liu, H.: Validation, comparison, and integration of GOCI, AHI, MODIS, MISR, and VIIRS aerosol optical depth over East Asia during the 2016 KORUS-AQ campaign, Atmos. Meas. Tech., 12, 4619–4641, https://doi.org/10.5194/amt-12-4619-2019, 2019.
Choi, W. J., Moon, K.-J., Yoon, J., Cho, A., Kim, S., Lee, S., Ko, D. h., Kim, J., Ahn, M. H., Kim, D.-R., Kim, S.-M., Kim, J.-Y., Nicks, D., and Kim, J.-S.: Introducing the geostationary environment monitoring spectrometer, J. Appl. Remote Sens., 12, 044005, https://doi.org/10.1117/1.JRS.12.044005, 2018.
Chung, S.-R., Ahn, M.-H., Han, K.-S., Lee, K.-T., and Shin, D.-B.: Meteorological Products of Geo-KOMPSAT 2A (GK2A) Satellite. Asia-Pac. J. Atmos. Sci., 56, 185–185, https://doi.org/10.1007/s13143-020-00199-x, 2020.
Cooper, M., Martin, R. V., Padmanabhan, A., and Henze, D. K.: Comparing mass balance and adjoint methods for inverse modeling of nitrogen dioxide columns for global nitrogen oxide emissions, J. Geophys. Res.-Atmos., 122, 4718–4734, https://doi.org/10.1002/2016JD025985, 2017.
Crippa, M., Janssens-Maenhout, G., Guizzardi, D., Van Dingenen, R., and Dentener, F.: Contribution and uncertainty of sectorial and regional emissions to regional and global PM2.5 health impacts, Atmos. Chem. Phys., 19, 5165–5186, https://doi.org/10.5194/acp-19-5165-2019, 2019.
Dyer, O.: Covid-19: Lockdowns spread in China as omicron tests “zero covid” strategy, BMJ, 376, o859, https://doi.org/10.1136/bmj.o859, 2022.
European Space Agency Copernicus Services Data Hub: https://cophub.copernicus.eu/, last access: 15 July 2022.
Filonchyk, M., Yan, H., Zhang, Z., Yang, S., Li, W., and Li, Y.: Combined use of satellite and surface observations to study aerosol optical depth in different regions of China, Sci. Rep.-UK, 9, 6174, https://doi.org/10.1038/s41598-019-42466-6, 2019.
Garay, M. J., Witek, M. L., Kahn, R. A., Seidel, F. C., Limbacher, J. A., Bull, M. A., Diner, D. J., Hansen, E. G., Kalashnikova, O. V., Lee, H., Nastan, A. M., and Yu, Y.: Introducing the 4.4 km spatial resolution Multi-Angle Imaging SpectroRadiometer (MISR) aerosol product, Atmos. Meas. Tech., 13, 593–628, https://doi.org/10.5194/amt-13-593-2020, 2020.
Guenther, A., Karl, T., Harley, P., Wiedinmyer, C., Palmer, P. I., and Geron, C.: Estimates of global terrestrial isoprene emissions using MEGAN (Model of Emissions of Gases and Aerosols from Nature), Atmos. Chem. Phys., 6, 3181–3210, https://doi.org/10.5194/acp-6-3181-2006, 2006.
Guenther, A., Jiang, X., Shah, T., Huang, L., Kemball-Cook, S., and Yarwood, G.: Model of Emissions of Gases and Aerosol from Nature Version 3 (MEGAN3) for Estimating Biogenic Emissions, in: Air Pollution Modeling and its Application XXVI, ITM 2018, Springer Proceedings in Complexity, edited by: Mensink, C., Gong, W., and Hakami, A., Springer, Cham, https://doi.org/10.1007/978-3-030-22055-6_29, 2020.
Guenther, A. B., Jiang, X., Heald, C. L., Sakulyanontvittaya, T., Duhl, T., Emmons, L. K., and Wang, X.: The Model of Emissions of Gases and Aerosols from Nature version 2.1 (MEGAN2.1): an extended and updated framework for modeling biogenic emissions, Geosci. Model Dev., 5, 1471–1492, https://doi.org/10.5194/gmd-5-1471-2012, 2012.
Go, S., Kim, J., Park, S. S., Kim, M., Lim, H., Kim, J.-Y., Lee, D.-W., and Im, J.: Synergistic Use of Hyperspectral UV-Visible OMI and Broadband Meteorological Imager MODIS Data for a Merged Aerosol Product, Remote Sens.-Basel, 12, 23, https://doi.org/10.3390/rs12233987, 2020.
Hatakeyama, S., Murano, K., Sakamaki, F., Mukai, H., Bandow, H., and Komazaki, Y.: Transport of Atmospheric Pollutants from East Asia, Water Air Soil Poll., 130, 373–378, https://doi.org/10.1023/A:1013877000169, 2001.
Holben, B. N., Eck, T. F., Slutsker, I., Tanré, D., Buis, J. P., Setzer, A., Vermote, E., Reagan, J. A., Kaufmann, Y. J., Nakajima, T., Lavenu, F., Jankowiak, I., and Smirnov, A.: AERONET: A federated instrument network and data archive for aerosol characterisation, Remote. Sens. Environ., 66, 1–16, https://doi.org/10.1016/S0034-4257(98)00031-5, 1998.
Ingmann, P., Veihelmann, B., Langen, J., Lamarre, D., Stark, H., and Courrèges-Lacoste, G. B.: Requirements for the GMES Atmosphere Service and ESA's implementation concept: Sentinels-4/-5 and -5p, Remote. Sens. Environ., 120, 58–69, https://doi.org/10.1016/j.rse.2012.01.023, 2012.
Jang, Y., Lee, Y., Kim, J., Kim, Y., and Woo, J.-H.: Improvement China Point Source for Improving Bottom-Up Emission Inventory, Asia-Pac. J. Atmos. Sci., 56, 107–118, https://doi.org/10.1007/s13143-019-00115-y, 2019.
Japan Aerospace Exploration Agency Himawari Monitor (P-Tree system) database: https://www.eorc.jaxa.jp/ptree/index.html, last access: 15 July 2022.
Jeon, W., Choi, Y., Percell, P., Souri, A. H., Song, C.-K., Kim, S.-T., and Kim, J.: Computationally efficient air quality forecasting tool: implementation of STOPS v1.5 model into CMAQ v5.0.2 for a prediction of Asian dust, Geosci. Model Dev., 9, 3671–3684, https://doi.org/10.5194/gmd-9-3671-2016, 2016.
Jiang, Z., Vargas, M., and Csiszar, I.: New oprational real-time daily rolling weekly Green Vegetation fraction product derived from suomi NPP VIIRS reflectance data, 2016 IEEE International Geoscience and Remote Sensing Symposium (IGARSS), Beijing, China, 10–15 July 2016, IEEE, 3524–3527, https://doi.org/10.1109/IGARSS.2016.7729911, 2016.
Jin, J., Segers, A., Heemink, A., Yoshida, M., Han, W., and Lin, H.-X.: Dust Emission Inversion Using Himawari-8 AODs Over East Asia: An Extreme Dust Event in May 2017, J. Adv. Model. Earth. Sy., 11, 446–467, https://doi.org/10.1029/2018MS001491, 2019.
Jung, J., Souri, A. H., Wong, D. C., Lee, S., Jeon, W., Kim, J., and Choi, Y.: The Impact of the Direct Effect of Aerosols on Meteorology and Air Quality Using Aerosol Optical Depth Assimilation During the KORUS-AQ Campaign, J. Geophys. Res.-Atmos., 124, 8303–8319, https://doi.org/10.1029/2019JD030641, 2019.
Jung, J., Choi, Y., Wong, D. C., Nelson, D., and Lee, S.: Role of Sea Fog Over the Yellow Sea on Air Quality With the Direct Effect of Aerosols, J. Geophys. Res.-Atmos., 126, e2020JD033498, https://doi.org/10.1029/2020JD033498, 2021.
Jung, J., Choi, Y., Souri, A. H., Mousavinezhad, S., Sayeed, A., and Lee, K.: The Impact of Springtime-Transported Air Pollutants on Local Air Quality With Satellite-Constrained NOx Emission Adjustments Over East Asia, J. Geophys. Res.-Atmos., 127, e2021JD035251, https://doi.org/10.1029/2021JD035251, 2022.
Kim, D., Gu, M., Oh, T.-H., Kim, E.-K., and Yang, H.-J.: Introduction of the Advanced Meteorological Imager of Geo-Kompsat-2a: In-Orbit Tests and Performance Validation, Remote Sens.-Basel, 13, 7, https://doi.org/10.3390/rs13071303, 2021.
Kim, J., Choi, M., Kim, M., Lim, H., Lee, S., Moon, K. J., Choi, W. J., Yoon, J. M., Kim, S.-K., Ko, D. H., Lee, S. H., Park, Y., and Chung, C.-Y.: Monitoring Atmospheric Composition by Geo-Kompsat-2: GOCI-2, AMI and GEMS, in: 2018 IEEE International Geoscience and Remote Sensing Symposium (IGARSS), Valencia, Spain, 22–27 July 2018, IEEE, 7750–7752, https://doi.org/10.1109/IGARSS.2018.8518713, 2018.
Kim, J., Jeong, U., Ahn, M.-H., et al.: New Era of Air Quality Monitoring from Space: Geostationary Environment Monitoring Spectrometer (GEMS), B. Am. Meteorol. Soc., 101, E1–E22, https://doi.org/10.1175/BAMS-D-18-0013.1, 2020.
Kim, M., Kim, J., Lim, H., and Chan, P. W.: The implementation of Yonsei Aerosol Retrieval (YAER) Algorithm to GK-2A/AMI and FY-4A/AGRI, 2020 AGU Fall Meeting, A141-0007, 2020.
Koo, Y.-S., Choi, D.-R., Kwon, H.-Y., Jang, Y.-K., and Han, J.-S.: Improvement of PM10 prediction in East Asia using inverse modeling, Atmos. Environ., 106, 318–328, https://doi.org/10.1016/j.atmosenv.2015.02.004, 2015.
Korean Ministry of Environment AirKorea database: https://www.airkorea.or.kr/, last access: 15 July 2022.
Ku, B. and Park, R. J.: Comparative inverse analysis of satellite (MODIS) and ground (PM10) observations to estimate dust emissions in East Asia, Asia-Pac. J. Atmos. Sci., 49, 3–17, https://doi.org/10.1007/s13143-013-0002-5, 2013.
Kumar, N., Chu, A., and Foster, A.: An empirical relationship between PM2.5 and aerosol optical depth in Delhi Metropolitan, Atmos. Environ., 41, 4492–4503, https://doi.org/10.1016/j.atmosenv.2007.01.046, 2007.
Lee, J., Kim, J., Song, C. H., Ryu, J.-H., Ahn, Y.-H., and Song, C. K.: Algorithm for retrieval of aerosol optical properties over the ocean from the Geostationary Ocean Color Imager, Remote. Sens. Environ., 114, 1077–1088, https://doi.org/10.1016/j.rse.2009.12.021, 2010.
Lee, K., Kim, M., Choi, M., Kim, K., Choi, Y., Jeong, J., Moon, K-J., and Lee, S.: Fast and operational gap filling in satellite-derived aerosol optical depths using statistical techniques, J. Appl. Remote Sens., 16, 044507, https://doi.org/10.1117/1.JRS.16.044507, 2022.
Lee, S., Song, C. H., Park, R. S., Park, M. E., Han, K. M., Kim, J., Choi, M., Ghim, Y. S., and Woo, J.-H.: GIST-PM-Asia v1: development of a numerical system to improve particulate matter forecasts in South Korea using geostationary satellite-retrieved aerosol optical data over Northeast Asia, Geosci. Model Dev., 9, 17–39, https://doi.org/10.5194/gmd-9-17-2016, 2016.
Lee, S., Song, C. H., Han, K. M., Henze, D. K., Lee, K., Yu, J., Woo, J.-H., Jung, J., Choi, Y., Saide, P. E., and Carmichael, G. R.: Impacts of uncertainties in emissions on aerosol data assimilation and short-term PM2.5 predictions over Northeast Asia, Atmos. Environ., 271, 118921, https://doi.org/10.1016/j.atmosenv.2021.118921, 2022.
Levy, R. C., Mattoo, S., Munchak, L. A., Remer, L. A., Sayer, A. M., Patadia, F., and Hsu, N. C.: The Collection 6 MODIS aerosol products over land and ocean, Atmos. Meas. Tech., 6, 2989–3034, https://doi.org/10.5194/amt-6-2989-2013, 2013.
Li, N., Tang, K., Wang, Y., Wang, J., Feng, W., Zhang, H., Liao, H., Hu, J., Long, X., Shi, C., and Su, X.: Is the efficacy of satellite-based inversion of SO2 emission model dependent?, Environ. Res. Lett., 16, 035018, https://doi.org/10.1088/1748-9326/abe829, 2021.
Lim, H., Choi, M., Kim, J., Kasai, Y., and Chan, P. W.: AHI/Himawari-8 Yonsei Aerosol Retrieval (YAER): Algorithm, Validation and Merged Products, Remote. Sens.-Basel, 10, 699, https://doi.org/10.3390/rs10050699, 2018.
Lim, H., Go, S., Kim, J., Choi, M., Lee, S., Song, C.-K., and Kasai, Y.: Integration of GOCI and AHI Yonsei aerosol optical depth products during the 2016 KORUS-AQ and 2018 EMeRGe campaigns, Atmos. Meas. Tech., 14, 4575–4592, https://doi.org/10.5194/amt-14-4575-2021, 2021.
Martin, R. V., Jacob, D. J., Chance, K., Kurosu, T. P., Palmer, P. I., and Evans, M. J.: Global inventory of nitrogen oxide emissions constrained by space-based observations of NO2 columns, J. Geophys. Res-Atmos., 108, 4537, https://doi.org/10.1029/2003JD003453, 2003.
Mousavinezhad, S., Choi, Y., Pouyaei, A., Ghahremanloo, M., and Nelson, D. L.: A comprehensive investigation of surface ozone pollution in China, 2015–2019: Separating the contributions from meteorology and precursor emissions, Atmos. Res., 257, 105599, https://doi.org/10.1016/j.atmosres.2021.105599, 2021.
Munchak, L. A., Levy, R. C., Mattoo, S., Remer, L. A., Holben, B. N., Schafer, J. S., Hostetler, C. A., and Ferrare, R. A.: MODIS 3 km aerosol product: applications over land in an urban/suburban region, Atmos. Meas. Tech., 6, 1747–1759, https://doi.org/10.5194/amt-6-1747-2013, 2013.
Napelenok, S. L., Cohan, D. S., Hu, Y., and Russell, A. G.: Decoupled direct 3D sensitivity analysis for particulate matter (DDM-3D/PM), Atmos. Environ., 40, 6112–6121, https://doi.org/10.1016/j.atmosenv.2006.05.039, 2006.
Ohara, T., Akimoto, H., Kurokawa, J., Horii, N., Yamaji, K., Yan, X., and Hayasaka, T.: An Asian emission inventory of anthropogenic emission sources for the period 1980–2020, Atmos. Chem. Phys., 7, 4419–4444, https://doi.org/10.5194/acp-7-4419-2007, 2007.
Okuyama, A., Andou, A., Date, K., Hoasaka, K., Mori, N., Murata, H., Tabata, T., Takahashi, M., Yoshino, R., and Bessho, K.: Preliminary validation of Himawari-8/AHI navigation and calibration, P. Soc. Photo-Opt. Ins., 9607, 663–672, https://doi.org/10.1117/12.2188978, 2015.
Pang, J., Liu, Z., Wang, X., Bresch, J., Ban, J., Chen, D., and Kim, J.: Assimilating AOD retrievals from GOCI and VIIRS to forecast surface PM2.5 episodes over Eastern China, Atmos. Environ., 179, 288–304, https://doi.org/10.1016/j.atmosenv.2018.02.011, 2018.
Park, J., Jung, J., Choi, Y., Mousavinezhad, S., and Pouyaei, A.: The sensitivities of ozone and PM2.5 concentrations to the satellite-derived leaf area index over East Asia and its neighboring seas in the WRF-CMAQ modeling system, Environ. Pollut., 306, 119419, https://doi.org/10.1016/j.envpol.2022.119419, 2022.
Pitchford, M., Maim, W., Schichtel, B., Kumar, N., Lowenthal, D., and Hand, J.: Revised algorithm for estimating light extinction from IMPROVE particle speciation data, Japca, J. Air Waste. Manage., 57, 1326–1336, https://doi.org/10.3155/1047-3289.57.11.1326, 2007.
Pouyaei, A., Choi, Y., Jung, J., Sadeghi, B., and Song, C. H.: Concentration Trajectory Route of Air pollution with an Integrated Lagrangian model (C-TRAIL Model v1.0) derived from the Community Multiscale Air Quality Model (CMAQ Model v5.2), Geosci. Model Dev., 13, 3489–3505, https://doi.org/10.5194/gmd-13-3489-2020, 2020.
Pouyaei, A., Sadeghi, B., Choi, Y., Jung, J., Souri, A. H., Zhao, C., and Song, C. H.: Development and Implementation of a Physics-Based Convective Mixing Scheme in the Community Multiscale Air Quality Modeling Framework, J. Adv. Model. Earth. Sy., 13, e2021MS002475, https://doi.org/10.1029/2021MS002475, 2021.
Remer, L. A., Mattoo, S., Levy, R. C., and Munchak, L. A.: MODIS 3 km aerosol product: algorithm and global perspective, Atmos. Meas. Tech., 6, 1829–1844, https://doi.org/10.5194/amt-6-1829-2013, 2013.
Remer, L. A., Kleidman, R. G., Levy, R. C., Kaufman, Y. J., Tanré, D., Mattoo, S., Martins, J. V., Ichoku, C., Koren, I., Yu, H., and Holben, B. N.: Global aerosol climatology from the MODIS satellite sensors, J. Geophys. Res.-Atmos., 113, D14S07, https://doi.org/10.1029/2007JD009661, 2008.
Rodgers, C. D.: Inverse Methods for Atmospheric Sounding: Theory and Practice, Series on Atmospheric, Oceanic and Planetary Physics, World Scientific, https://doi.org/10.1142/3171, 2000.
Simon, H.: CMAQv5.0 PMother speciation, Community Multiscale Air Quality (CMAQ) Model Wiki, https://www.airqualitymodeling.org/index.php/CMAQv5.0_PMother_speciation (last access: 15 July 2022), 2015.
Skamarock, W. C., Klemp, J. B., Dudhia, J., Gill, D. O., Barker, D., Duda, M. G., Huang, X.-Y., Wang, W., and Powers, J. G.: A Description of the Advanced Research WRF Version 3, NCAR Technical Note, No. NCAR/TN-475+STR, University Corporation for Atmospheric Research, https://doi.org/10.5065/D68S4MVH, 2008.
Souri, A. H., Choi, Y., Pan, S., Curci, G., Nowlan, C. R., Janz, S. J., Kowalewski, M. G., Liu, J., Herman, J. R., and Weinheimer, A. J.: First Top-Down Estimates of Anthropogenic NOx Emissions Using High-Resolution Airborne Remote Sensing Observations, J. Geophys. Res.-Atmos., 123, 3269–3284, https://doi.org/10.1002/2017JD028009, 2018.
Souri, A. H., Nowlan, C. R., González Abad, G., Zhu, L., Blake, D. R., Fried, A., Weinheimer, A. J., Wisthaler, A., Woo, J.-H., Zhang, Q., Chan Miller, C. E., Liu, X., and Chance, K.: An inversion of NOx and non-methane volatile organic compound (NMVOC) emissions using satellite observations during the KORUS-AQ campaign and implications for surface ozone over East Asia, Atmos. Chem. Phys., 20, 9837–9854, https://doi.org/10.5194/acp-20-9837-2020, 2020.
Tian, J. and Chen, D.: Spectral, spatial, and temporal sensitivity of correlating MODIS aerosol optical depth with ground-based fine particulate matter (PM2.5) across southern Ontario, Can. J. Remote Sens., 36, 119–128, https://doi.org/10.5589/m10-033, 2010.
Toon, O. B., Maring, H., Dibb, J., Ferrare, R., Jacob, D. J., Jensen, E. J., Luo, Z. J., Mace, G. G., Pan, L. L., Pfister, L., Rosenlof, K. H., Redemann, J., Reid, J. S., Singh, H. B., Thompson, A. M., Yokelson, R., Minnis, P., Chen, G., Jucks, K. W., and Pszenny, A.: Planning, implementation and scientific goals of the Studies of Emissions and Atmospheric Composition, Clouds and Climate Coupling by Regional Surveys (SEAC4RS) field mission, J. Geophys. Res.-Atmos., 121, 4967–5009, https://doi.org/10.1002/2015JD024297, 2016.
Veefkind, J. P., Aben, I., McMullan, K., Förster, H., de Vries, J., Otter, G., Claas, J., Eskes, H. J., de Haan, J. F., Kleipool, Q., van Weele, M., Hasekamp, O., Hoogeveen, R., Landgraf, J., Snel, R., Tol, P., Ingmann, P., Voors, R., Kruizinga, B., Vink, R., Visser, H., and Levelt, P. F.: TROPOMI on the ESA Sentinel-5 Precursor: A GMES mission for global observations of the atmospheric composition for climate, air quality and ozone layer applications, Remote. Sens. Environ., 120, 70–83, https://doi.org/10.1016/j.rse.2011.09.02, 2012.
Vijayaraghavan, K., Snell, H. E., and Seigneur, C.: Practical Aspects of Using Satellite Data in Air Quality Modeling, Environ. Sci. Technol., 42, 8187–8192, https://doi.org/10.1021/es7031339, 2008.
Wang, J., Xu, X., Henze, D. K., Zeng, J., Ji, Q., Tsay, S.-C., and Huang, J.: Top-down estimate of dust emissions through integration of MODIS and MISR aerosol retrievals with the GEOS-Chem adjoint model, Geophys. Res. Lett., 39, L08802, https://doi.org/10.1029/2012GL051136, 2012.
Wang, Y., Wang, J., Xu, X., Henze, D. K., Qu, Z., and Yang, K.: Inverse modeling of SO2 and NOx emissions over China using multisensor satellite data – Part 1: Formulation and sensitivity analysis, Atmos. Chem. Phys., 20, 6631–6650, https://doi.org/10.5194/acp-20-6631-2020, 2020.
Woo, J.-H., Kim, Y., Kim, H.-K., Choi, K.-C., Eum, J.-H., Lee, J.-B., Lim, J.-H., Kim, J., and Seong, M.: Development of the CREATE Inventory in Support of Integrated Climate and Air Quality Modeling for Asia, Sustainability-Basel, 12, 7930, https://doi.org/10.3390/su12197930, 2020.
Xia, X., Min, J., Shen, F., Wang, Y., and Yang, C.: Aerosol Data Assimilation Using Data from Fengyun-3A and MODIS: Application to a Dust Storm over East Asia in 2011, Adv. Atmos. Sci., 36, 1–14, https://doi.org/10.1007/s00376-018-8075-9, 2019.
Yeo, S. Y., Lee, H. K., Choi, S. W., Seol, S. H., Jin, H. A., Yoo, C., Lim, J. Y., and Kim, J. S.: Analysis of the national air pollutant emission inventory (CAPSS 2015) and the major cause of change in Republic of Korea, Asian Journal of Atmospheric Environment, 13, 212–231, https://doi.org/10.5572/ajae.2019.13.3.212, 2019.
Yuan, H., Dai, Y., Xiao, Z., Ji, D., and Shangguan, W.: Reprocessing the MODIS Leaf Area Index products for land surface and climate modelling, Remote. Sens. Environ., 115, 1171–1187, https://doi.org/10.1016/j.rse.2011.01.001, 2011.
Yumimoto, K., Nagao, T. M., Kikuchi, M., Sekiyama, T. T., Murakami, H., Tanaka, T. Y., Ogi, A., Irie, H., Khatri, P., Okumura, H., Arai, K., Morino, I., Uchino, O., and Maki, T.: Aerosol data assimilation using data from Himawari-8, a next-generation geostationary meteorological satellite, Geophys. Res. Lett., 43, 5886–5894, https://doi.org/10.1002/2016GL069298, 2016.
Zhang, W., Xu, H., and Zheng, F.: Aerosol Optical Depth Retrieval over East Asia Using Himawari-8/AHI Data, Remote Sens.-Basel, 10, 137, https://doi.org/10.3390/rs10010137, 2018.
Zoogman, P., Jacob, D. J., Chance, K., Zhang, L., Le Sager, P., Fiore, A. M., Eldering, A., Liu, X., Natraj, V., and Kulawik, S. S.: Ozone air quality measurement requirements for a geostationary satellite mission, Atmos. Environ., 45, 7143–7150, https://doi.org/10.1016/j.atmosenv.2011.05.058, 2011.
Zou, B., Liu, N., Wang, W., Feng, H., Liu, X., and Lin, Y.: An Effective and Efficient Enhanced Fixed Rank Smoothing Method for the Spatiotemporal Fusion of Multiple-Satellite Aerosol Optical Depth Products, Remote Sens.-Basel, 12, 1102, https://doi.org/10.3390/rs12071102, 2020.