the Creative Commons Attribution 4.0 License.
the Creative Commons Attribution 4.0 License.
Angular sampling of a monochromatic, wide-field-of-view camera to augment next-generation Earth radiation budget satellite observations
K. Sebastian Schmidt
Hong Chen
Daniel R. Feldman
Bruce C. Kindel
Joshua Mauss
Mathew van den Heever
Maria Z. Hakuba
Peter Pilewskie
Earth radiation budget (ERB) satellite observations require conversion of the measured radiance, which is a remotely sensed quantity, to a derived irradiance, which is the relevant energy balance quantity routinely used in modeling and analysis of the climate system. The state-of-the-art approach for radiance-to-irradiance conversion taken by the Clouds and the Earth's Radiant Energy System (CERES) benefits from the exhaustive sampling of radiance anisotropy by multiple CERES instruments across many years. Unfortunately, the CERES approach is not easily extended to new ERB spectral channels that lack previous sampling, such as the “split-shortwave” planned to be part of the next-generation ERB mission Libera. As an alternative approach, the capability of a monochromatic, wide-field-of-view camera to provide dense angular sampling in a much shorter time frame is assessed. We present a general concept for how this can be achieved and quantify the proficiency of a camera to provide rapid angular distribution model (ADM) generation for the new Libera ultraviolet and visible (VIS) sub-band. A single mid-visible camera wavelength (555 nm) is shown to be ideal for representing the VIS sub-band, requiring only basic scene stratification for 555 nm to VIS conversion. Synthetic camera sampling with realistic operating constraints also demonstrates that the angular radiance field of various scenes can be well populated within a single day of sampling, a notable advance over existing approaches. These results provide a path for generating observationally based VIS ADMs with minimal lag time following Libera's launch. Coupled with efforts to utilize a camera for scene identification, this may also pave the way for future ERB satellite systems to develop stand-alone irradiance products for arbitrary sets of spectral channels, opening up new measurement and science possibilities.
- Article
(11996 KB) - Full-text XML
- BibTeX
- EndNote
Satellite observations of the Earth radiation budget (ERB) are essential for monitoring Earth's climate because they track the amount of energy available to the Earth system. Consequently, they have been a mainstay from the dawn of the satellite era through the present day (Harries et al., 2005; Kandel et al., 1998; Wielicki et al., 1996; Kyle et al., 1993; Barkstrom, 1984; Jacobowitz et al., 1984; Raschke et al., 1973; Vonder Haar and Suomi, 1971; Raschke and Bandeen, 1970). A persistent challenge associated with ERB observations is the conversion of the measured radiance – a quantity dependent on the angle at which a scene is viewed – to a derived irradiance – a quantity that encompasses all view angles. This radiance-to-irradiance conversion is particularly crucial in the shortwave (SW) where strong anisotropy is common, resulting from the surface bidirectional reflectance and the optical properties of the atmosphere including those of absorbing gases, particles, and condensates. The irradiance is far more relevant for Earth system energetics, and therefore it is the derived irradiance products, rather than the direct radiance observations, that are most useful to quantify climate forcing and feedbacks (e.g., Ceppi and Nowack, 2021; Cesana and del Genio, 2021; Kramer et al., 2021; Myers et al., 2021; Raghuraman et al., 2021), constrain and improve climate models (e.g., Hartmann and Ceppi, 2014; Tett et al., 2013b, a; Forster and Gregory, 2006), and inform ERB assessments and scientific understanding (Loeb and Wielicki, 2015; Wild et al., 2015; Stephens et al., 2012; Trenberth, 2009; Vonder Haar and Suomi, 1971).
The solution to the radiance-to-irradiance conversion challenge is provided by so-called angular distribution models (ADMs). These models consist of a set of anisotropic factors, R, to convert the satellite-measured radiance, I, to an irradiance F:
where the subscript s represents the dependence on scene composition, and the subscripts i, j, and k represent the angular dependences on solar zenith angle (SZA), viewing zenith angle (VZA), and relative azimuth angle (RAA), respectively. A full derivation of SW ADMs and a discussion of their intricacies were recently outlined in a review article (Gristey et al., 2021). Here, it suffices to recognize that while the perfect ADM would require perfect knowledge of the properties of a given scene, ADMs are often parameterized into discrete scene types and solar-viewing geometries and that these dimensions are highly stratified in current ERB products from the Clouds and the Earth's Radiant Energy System (CERES) (Su et al., 2015a; Loeb et al., 2005, 2003a). It has been shown that the higher stratification in CERES SW ADMs leads to reduced uncertainty in irradiance products at local and regional scales (Su et al., 2015b; Loeb et al., 2007, 2003b). This approach is made possible by both the retrieval of detailed scene properties using co-flying imager observations and direct sampling of radiance anisotropy accumulated over many years from multiple CERES instruments. The direct sampling of SW radiance anisotropy has largely been achieved through the operation of CERES instruments in rotating azimuth plane scan (RAPS) mode, where the instrument scans in elevation as it rotates in azimuth.
NASA's next-generation ERB satellite mission Libera, which is supported as the first Earth Venture Continuity mission and is due to launch in 2027, will provide continuity to the CERES data record. In addition to hosting heritage spectral channels for continuity, Libera will also host a “split-SW” radiometer to separately derive ultraviolet to visible (VIS; 0.3–0.7 µm) and near-infrared (NIR; 0.7–5.0 µm) sub-band irradiances. While detailed spectral information is typically needed to retrieve specific atmospheric properties (e.g., to separate between water vapor and cloud absorptions), the split-SW will bring new science advances by probing how SW energy is partitioned at the surface and in the atmosphere (Hakuba et al., 2022; Carlson et al., 2019; Collins et al., 2006). However, there are two challenges with applying the state-of-the-art CERES approach for radiance-to-irradiance conversion of Libera split-SW observations. First, the existing CERES SW ADMs cannot be directly applied because the surface and atmospheric absorption, reflection, and scattering differ markedly between the total SW and split-SW. Second, the extensive angular sampling required to generate new split-SW ADMs does not yet exist. While Libera will have the capability to operate in RAPS mode and will co-fly with the Visible Infrared Imaging Radiometer Suite (VIIRS), it is expected to operate primarily in cross-track scan mode to meet continuity requirements; RAPS mode is only anticipated to be available for 12–36 d per year and will be limited to a finite number of RAPS scans expected to be substantially fewer than for the CERES instruments. Implementing highly stratified ADMs for the new split-SW sub-bands following the CERES SW ADM approach is therefore simply not feasible, especially since the development of VIS and NIR irradiance products cannot wait for years to exhaustively sample radiance anisotropy with Libera in RAPS mode.
To address the absence of sufficient angular sampling in the split-SW sub-bands, Libera plans to fly a monochromatic wide-field-of-view (WFOV) camera as part of its instrument package. The camera will continuously take images of the entire Earth disk from horizon to horizon with sub-kilometer pixel spacing at nadir, providing dense angular sampling of the radiance field. Uniformity in the camera pixel radiances across the WFOV, expected to be within 1.5 % for the Libera camera, will be essential to derive anisotropic factors as in Eq. (1). However, the camera radiances are not bound by similarly stringent requirements on absolute accuracy, expected to be within 5 %, because the anisotropic factors are calculated as a ratio of radiances in different directions, making a camera appropriate for this task. A camera also provides several other potentially useful sampling opportunities for ERB, such as continuous imaging of the radiometer footprint for rudimentary scene identification, multi-angle views to aid cloud detection and cloud tomography retrieval, and detailed angular radiance variations of a given scene for ADM validation. While the exact specifications of the Libera camera are being actively refined and will be documented in a separate technical paper, we apply several aspects of the expected performance of the Libera camera as realistic constraints during this study.
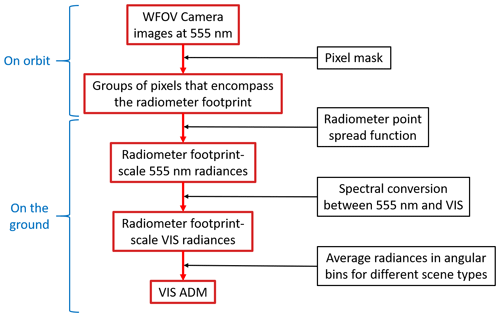
The purpose of this study is to outline the concept and quantify the capability of a monochromatic WFOV camera to produce VIS ADMs. We focus on the VIS sub-band for reasons outlined in Sect. 4, but we note that the NIR irradiance can subsequently be determined via subtraction of the derived VIS irradiance from the total SW irradiance. An overview of the process is shown in the flow diagram in Fig. 1 and proceeds as follows. First, since anticipated data rate constraints dictate that entire camera images are unlikely to be downlinked during the Libera mission, we develop pixel masks that extract a small subset of camera image pixels to meet ADM development needs. Section 3 outlines the choice of pixel masks to provide monochromatic radiances at the radiometer footprint scale across a wide range of viewing angles. One can reasonably question how monochromatic (single-channel) camera observations translate to VIS ADMs, and in Sect. 4 we show that a mid-visible wavelength provides a very tight relationship with the VIS sub-band requiring only minimal stratification by solar-viewing geometry and scene, thereby enabling a spectral conversion that is required to use monochromatic observations to generate VIS ADMs. In Sect. 5, we quantify the capability of the camera to provide dense angular sampling needed for ADMs by simulating synthetic camera samples and determining how they would populate the angular space of various scene types.
To assess the spectral relationship between a monochromatic camera wavelength and the split-SW bands (Sect. 4) we employ multiple datasets. First and primarily, we assess spectral relationships with the Climate Absolute Radiance and Refractivity Observatory (CLARREO; Wielicki et al., 2013) observing system simulation experiment (OSSE; Feldman et al., 2015, 2011a, b). The CLARREO OSSE is based on radiative transfer calculations using the MODerate resolution atmospheric TRANsmission (MODTRAN; Berk et al., 2014) computer code with input atmospheric profiles from climate models, providing a global perspective. Here, we use top-of-atmosphere (TOA) outgoing SW spectral radiances obtained with profiles from the Commonwealth Scientific and Industrial Research Organisation (CSIRO) climate model output. There are a couple of important limitations of the CLARREO OSSE in the context of the present study including limited spectral and angular resolution in the input surface spectral bidirectional reflectance distribution function (BRDF) and the fact that the spectral radiances are only output at nadir. These limitations are addressed with additional observations and simulations, summarized together with all other datasets used in this study in Table 1.
Table 1Datasets used in this study. Unless otherwise stated, no subsetting of scene properties is applied.
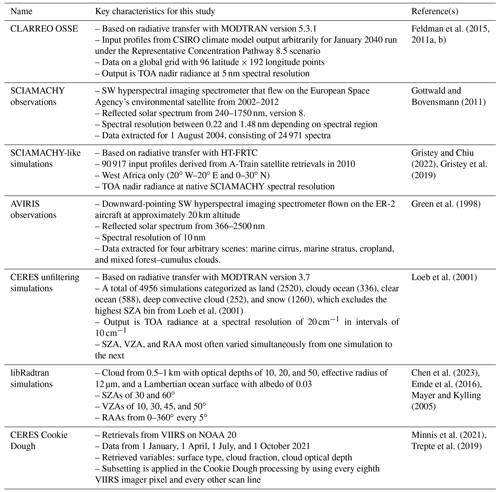
For an observational perspective, we compare the CLARREO OSSE with satellite observations from the Scanning Imaging Absorption Spectrometer for Atmospheric Chartography (SCIAMACHY; Gottwald and Bovensmann, 2011) and aircraft observations from the Airborne Visible Infrared Imaging Spectrometer (AVIRIS; Green et al., 1998). Since the SCIAMACHY data volume is large, and extensive SCIAMACHY observations are not required for this study, we arbitrarily use data from 1 August 2004. We also use “SCIAMACHY-like” simulations over West Africa in 2010 (Gristey and Chiu, 2022; Gristey et al., 2019) that were generated via the Havemann–Taylor Fast Radiative Transfer Code (HT-FRTC; Havemann et al., 2018). A distinct observational perspective is provided by AVIRIS, where we select just four scenes that are frequently encountered across the globe. While limited in global representativeness, these AVIRIS scenes provide a valuable consistency check against the CLARREO OSSE and have some advantages over SCIAMACHY such as covering a larger fraction of the incoming solar spectrum with much finer spatial resolution, enabling better physical interpretation.
To provide some initial insights into the solar-viewing geometry dependence of spectral relationships, we also analyze a dataset of MODTRAN calculations that was used for CERES radiance unfiltering (Loeb et al., 2001). This dataset includes almost 5000 TOA spectral radiances at SZAs, VZAs, and RAAs that are most often varied simultaneously from one calculation to the next. Since the angular resolution of this CERES unfiltering dataset is still relatively coarse, we further explore detailed angular variations for a given scene by running radiative transfer calculations with libRadtran (Emde et al., 2016; Mayer and Kylling, 2005) using a wrapper code included within the Education and Research 3D Radiative Transfer Toolbox (EaR3T; Chen et al., 2023). This diverse set of radiative transfer calculations and observations helps ensure that our analyses are minimally susceptible to radiative transfer model errors and existing observational limitations.
To assess the angular sampling of various scene types that a WFOV camera could observe (Sect. 5), we use an intermediate dataset that is applied in the production of CERES Single Scanner Footprint (SSF) data products (Loeb et al., 2003a) called “Cookie Dough”. This dataset contains a swath of retrieved geophysical variables (Minnis et al., 2021; Trepte et al., 2019) along the orbit and at the spatial resolution of the spectral imager that is co-flying on the same satellite as a given CERES instrument. In CERES processing, CERES radiometer footprints are then matched to this dataset and applied as a “cookie cutter” to extract the footprint scene properties, hence the colloquial analogy. Specifically, we use Cookie Dough derived from the VIIRS imager on the NOAA-20 satellite for 4 d spread evenly throughout an annual cycle. While a large number of retrieved geophysical variables are available in the dataset, we only extract those that are of most importance for exploring the scene stratification of VIS ADMs: surface type, cloud fraction, and cloud optical depth.
Continuously capturing high-resolution images of the entire Earth disk viewable from satellite altitude creates significant demands on satellite data storage and downlink. For example, the 2048 × 2048 12-bit camera images anticipated every 5 s during the Libera mission, shown schematically in Fig. 2, equate to a data rate greater than 10 000 kbit s−1, which is orders of magnitude larger than the allocation when Libera was proposed. To address this challenge, we recognize that entire images are not necessarily required to meet angular sampling needs for ADM generation. Instead, it is possible to extract a small subset of the overall pixels in each image that encompass a variety of viewing geometries and only save/downlink those pixels. These subsets of pixels can be selected by carefully designing and applying pre-designed pixel masks to camera images.
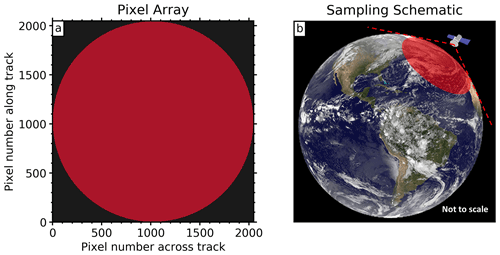
Figure 2(a) A 2048 × 2048 camera pixel array providing 750 m resolution at nadir (red pixels are viewing Earth, while black pixels fall beyond the horizon) and (b) an instantaneous sampling schematic of a WFOV camera viewing Earth (footprint in red shading). This design is broadly consistent with the camera proposed to fly as part of the Libera instrument package at an estimated altitude of 824 km (Earth image credit: NASA).
To ensure that a pixel mask provides dense angular sampling needed for ADM generation, we structure it around the angular bins applied for SW ADMs from the CERES instrument on the Tropical Rainfall Measuring Mission (TRMM) (henceforth CERES-TRMM; Loeb et al., 2003a). These consist of SZA and VZA bins with 10∘ width and RAA bins with 20∘ width. While other angular bin definitions could be considered, sampling each of these angular bins at each camera exposure provides a reasonable balance of dense angular sampling while drastically decreasing the data rate. The sampling can also be scaled as needed (see below), so the approach is largely insensitive to the initial angular bins used as a reference.
We propose a nominal sampling pattern that consists of separate groups of pixels (henceforth ADM samples) at the center of every CERES-TRMM angular bin for each camera exposure (Fig. 3a and b). In this case, only 79 218 of 4 194 304 (1.89 %) pixels in each image are extracted. One implication of this fixed nominal pixel mask is that identical VZAs are sampled from one camera exposure to the next. Since the angular distribution of reflected solar radiation can be nonlinear within angular bins, samples taken at the center of an angular bin may not be representative of that angular bin as a whole. To address this issue, the location of the ADM sample can be randomized within each angular bin on orbit (e.g., Fig. 3c and d). Randomization can be implemented from one camera exposure to the next or updated periodically, so long as the net result does not lead to sampling bias within angular bins. Note that the geolocated ADM samples (e.g., Fig. 3b and d) experience significant stretching with increasing VZA resulting from a combination of three factors: the view angle projection onto a flat surface, the additional curvature of the Earth, and a further additional distortion from the “fish-eye” camera lens.
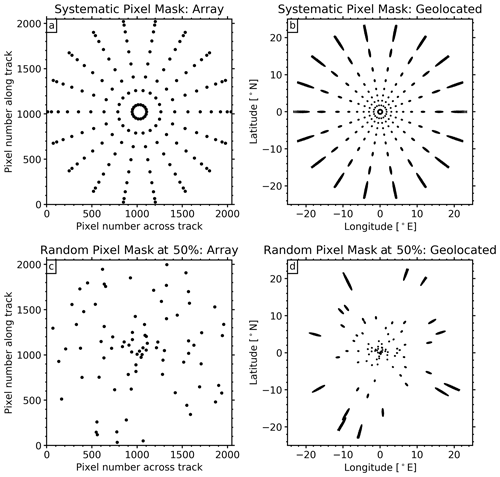
Figure 3Preliminary camera pixel masks to provide dense angular sampling while limiting downlink data rate. A systematic camera pixel mask (a, b) consists of groups of pixels (ADM samples) at the center of each CERES-TRMM angular bin, while a randomized camera pixel mask with a scaling factor of 50 % (c, d) consists of half of the total number of ADM samples randomly located across and within CERES-TRMM angular bins. Data are plotted in two coordinate systems: the camera pixel array (a, c) and geolocated nominally at the Equator and Prime Meridian (b, d). Note that pixels within an ADM sample that fall beyond the horizon are not shown.
Given that it is not strictly necessary to sample every VZA and RAA bin per camera exposure to generate ADMs, an important flexibility of this pixel mask is the ability to implement a scaling factor to adjust the number of ADM samples for each camera exposure. This enables tailoring to a given bandwidth. For the example given in Fig. 3c and d, a scaling factor of 50 % is applied, leading to a pixel mask where only 50 % of the angular bins contain an ADM sample at each camera exposure, equivalent to only 39 609 of 4 194 304 (0.94 %) pixels in each image. The selection of which angular bins are sampled can also be randomized to avoid sampling biases over an extended time period. A 50 % scaling factor with randomization from one exposure to the next is applied in the simulation experiments in Sect. 5.
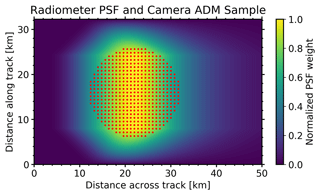
Each ADM sample within a pixel mask contains almost 500 pixels that are selected to encompass the radiometer footprint of approximately 20 km in diameter at nadir. Camera pixel-level radiances can then be weighted by the radiometer point spread function (PSF). The purpose of this is to ensure that the spatial resolution of the sampling is consistent for the radiances that are used to generate ADMs and the radiances that will utilize ADMs which will come from the split-SW radiometer. When comparing to the actual PSF of the CERES radiometer that is planned to be identical for Libera (Fig. 4), it is clear that some non-negligible contributions to the equivalent radiometer measurement could originate outside the ADM sample. The size of the ADM sample can easily be increased as needed and should not influence the results of this study, but note that this situation at nadir represents a worst-case scenario since the actual coverage of the radiometer PSF increases with VZA due to the additional camera lens distortion not experienced by the radiometers. The camera ADM samples will therefore match the view-angle variation in Libera footprint size with increasing fidelity.
Application of monochromatic angular radiances to generate broadband ADMs is inspired partly by Corbett and Su (2015), who found that, of the Multi-angle Imaging SpectroRadiometer (MISR; Diner et al., 1998) spectral channels, the 865 nm channel correlates best with the CERES total SW and subsequently incorporated radiances from this MISR channel to create CERES SW ADMs over Antarctic sastrugi. To determine the applicability of a similar spectral conversion to aid the generation of split-SW ADMs, we examine a variety of independent datasets containing spectrally resolved reflected SW radiances. For a given wavelength to act as a good proxy for one of the split-SW sub-bands, a very high correlation between them should exist. That way, the measured radiance in the monochromatic channel can serve as a predictor for radiance across the spectral channel of interest for a given solar-viewing geometry and scene, and it can subsequently be used for split-SW ADM generation. Note that this implies a conversion from monochromatic radiances to broadband radiances to inform broadband ADMs and therefore does not directly concern monochromatic ADMs.
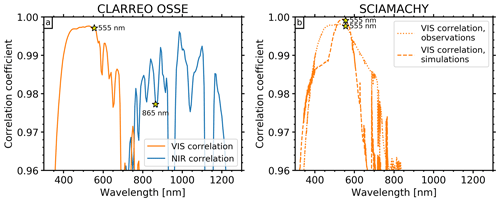
Figure 5Pearson correlation coefficient between TOA spectral radiances and the VIS (orange) and NIR (blue) sub-band radiances for (a) all scenes in the CLARREO OSSE and (b) SCIAMACHY observations as well as SCIAMACHY-like simulations. Star symbols highlight the wavelengths of focus: 555 and 865 nm. Correlations extend beyond the given vertical axis range, but only the highest correlations are shown. Note that the NIR sub-band correlation is not shown for SCIAMACHY because of spectrally incomplete data in the NIR.
The CLARREO OSSE that includes scenes across the entire globe (Fig. 5a) suggests that, while 865 nm is amongst the highest correlations for the NIR sub-band, it is not an optimal proxy for either of the split-SW bands. The primary reasons for this lower correlation are that water vapor, liquid and ice absorption, and surface bidirectional reflectance all affect the NIR sub-band strongly, vary significantly across scene type, and produce spectrally varying impacts across the NIR sub-band (discussed further below; see Fig. 7). Instead, we find that the highest correlation occurs between mid-visible wavelengths and the VIS sub-band, where absorption is minimal and surface bidirectional reflectance has less spectral dependence. These high VIS sub-band correlations are broadly consistent with results from SCIAMACHY observations and SCIAMACHY-like simulations (Fig. 5b). Some differences are expected given that the CLARREO OSSE is based on global gridded data, while the SCIAMACHY observations are only extracted for a single day, exhibiting denser sampling in polar regions, and the SCIAMACHY-like simulations are for an entire year but only over a limited region (see details in Sect. 2). Despite the different characteristics of the datasets, the consistently high correlation at mid-visible wavelengths provides reassurance that the result is robust. Although a range of mid-visible wavelengths exists where similarly high correlations occur, we proceed specifically with 555 nm because it is expected to have several operational advantages for the Libera mission. These include matching the VIIRS M4 band due to co-fly with Libera that will be useful for consistency checks and flat-fielding activities (not discussed here), and 555 nm is at the longer-wavelength end of the highest correlations, which is important to minimize on-orbit optical degradation that occurs preferentially at shorter wavelengths (Béland et al., 2014).
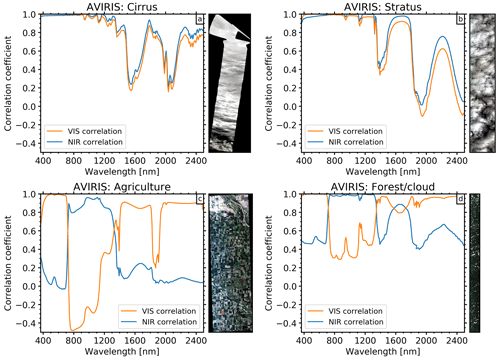
Figure 6Pearson correlation coefficient between upwelling spectral radiances at aircraft altitude and the VIS (orange) and NIR (blue) sub-band radiances for AVIRIS scenes of (a) marine cirrus cloud, (b) marine stratocumulus cloud, (c) agriculture, and (d) mixed forest and cumulus clouds. The true-color image associated with the AVIRIS observations is given to the right of each panel.
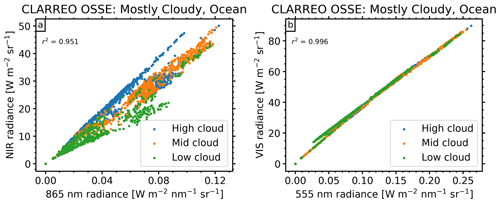
Figure 7Relationship between nadir radiance at (a) 865 nm and the NIR sub-band and between (b) 555 nm and the VIS sub-band for mostly cloudy-over-ocean scenes in the CLARREO OSSE. Data points are colored as high cloud (blue), mid-level cloud (orange), or low cloud (green), defined using the International Satellite Cloud Climatology Project (ISCCP) cloud-top pressure boundaries.
As an additional test of the spectral relationships determined from the CLARREO OSSE and SCIAMACHY data (Fig. 5), selected AVIRIS scenes are examined (Fig. 6), this time with the full dynamic range of correlations retained to reveal the spectral character of the individual scenes. The AVIRIS correlation spectra largely tell the same story; mid-visible wavelengths consistently exhibit the highest correlation with the VIS sub-band. The NIR sub-band correlation, however, varies substantially more between these scenes for any given wavelength. When clouds dominate the scene (Fig. 6a and b), the VIS and NIR sub-band correlations are themselves correlated given the generally high reflectance of clouds throughout the spectrum. In contrast, when vegetation dominates the scene (Fig. 6c and d), the VIS and NIR correlations are themselves anticorrelated, with a sharp transition at the so-called near-infrared edge where vegetation is typically dark in the visible and becomes much brighter in the NIR. For the cloud-free agriculture scene (Fig. 6c), there is even a negative correlation between the VIS sub-band and NIR wavelengths from around 700–1200 nm. The correlation spectra closely mimic (or are the inverse of) typical surface or cloud reflectance spectra, demonstrating the dominance of the underlying surface or cloud spectral reflectance for the VIS or NIR sub-band correlation. Regardless of these spectral details, 555 nm maintains a very high correlation with the VIS sub-band across all scenes of around 0.99 or greater.
With multiple lines of evidence supporting 555 nm radiance as a reliable analog for VIS sub-band radiance, we proceed to stratify the globally representative CLARREO OSSE results by scene type to gain further insights as to why. Using the profile properties that were input to the CLARREO OSSE, we stratify scenes following the simple Earth Radiation Budget Experiment (ERBE) definitions of clear sky (0 %–5 %), partly cloudy (5 %–50 %), mostly cloudy (50 %–95 %), and overcast (95 %–100 %), as well as surface type categories of ocean, land, snow, and desert (henceforth “ERBE-like”; Suttles et al., 1988). When analyzing the spectral relationships by ERBE-like scene type, we found that one of the most challenging scene types is mostly cloudy over ocean. For this scene type, a large spread in the relationship between 865 nm and the NIR sub-band occurs, with data loosely falling into three branches associated with changes in cloud altitude (Fig. 7a). This occurs for two primary reasons: variations in water vapor above clouds and cloud thermodynamic phase. While 865 nm is largely insensitive to variations in these properties, the NIR sub-band is substantially influenced by differences in water vapor, cloud liquid, and cloud ice absorption (e.g., Gristey and Chiu, 2022; Gristey et al., 2019). Meanwhile, the same scenes exhibit very little spread in the relationship between 555 nm and VIS (Fig. 7b), as shown by the increase in the r2 value from 0.951 to 0.996. This difference is due to the fact that both 555 nm and VIS are largely insensitive to spectral absorption features of water in its various thermodynamic phases.
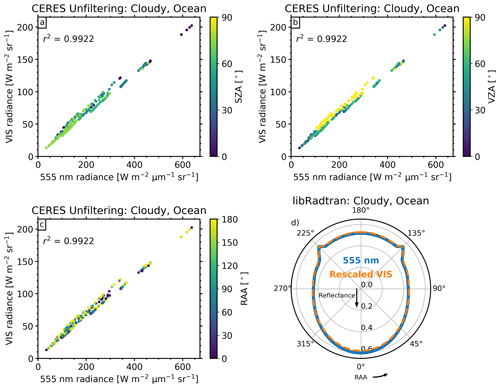
Figure 8The relationship between 555 nm and VIS radiance in (a, b, c) the CERES unfiltering dataset for cloudy-over-ocean scenes with data points colored by SZA, VZA, and RAA, respectively, and (d) the libRadtran calculation for a cloudy ocean scene at a fixed SZA (60∘) and VZA (45∘) showing the detailed variation in RAA.
While the CLARREO OSSE has proven useful for assessing spectral relationships thus far, one of the major limitations in the context of ADMs is that it only includes nadir radiances. It is necessary that the spectral relationships hold at nadir, but this is not sufficient; since a spectral conversion is desired for angular sampling, it is also important to confirm that these results hold at off-nadir view geometries. The SCIAMACHY observations in Fig. 5b and AVIRIS observations in Fig. 6 include off-nadir views, providing an initial indication that solar-viewing geometry is not playing a dominant role in the relationship between 555 nm and VIS radiances. A closer look with the CERES unfiltering dataset also suggests that any dependence on geometry is relatively small (Fig. 8a–c). The tight relationship between 555 nm and VIS holds across all SZA, VZA, and RAA combinations within this dataset (only cloudy ocean scenes are shown, but the result is consistent for other scenes within the dataset that all have r2 values greater than 0.97). There is no obvious trend in the relationship with SZA (Fig. 8a) or RAA (Fig. 8c), but there is a suggestion that limited spread in the spectral relationship is related to VZA (Fig. 8b), with larger VZA tending to exhibit larger VIS radiance for the same 555 nm radiance. Beyond this qualitative statement, the dependence is difficult to quantify with the CERES unfiltering dataset given that it only includes calculations at five discrete VZAs. Following the CLARREO OSSE approach, an updated and far more extensive set of MODTRAN calculations that use finer-resolution input profiles (in both space and time) and outputs radiances at fine angular resolution across the full range of solar-viewing geometries is currently under development. This dataset will be better suited to address detailed angular dependencies to implement the spectral conversion itself and quantify the associated uncertainties and will be the subject of a subsequent dedicated study.
The consistency of the relationship between 555 nm and VIS with solar-viewing geometry is further supported by a libRadtran calculation of TOA reflectance over a cloudy ocean scene as an example (Fig. 8d). This calculation shows that the detailed variations with relative azimuth angle follow an almost identical shape for both 555 nm and VIS, including the peak in reflectance near ±45∘ RAA associated with the cloud bow. The correspondence between 555 nm and VIS also holds with varying SZA, VZA, and cloud optical depth (see Appendix A). Analysis of detailed angular variations should be extended in the future to other scenes that might be more challenging such as sun glint, but this result already builds confidence that the tight spectral relationship also holds across detailed angular features to be incorporated into ADM generation.
Another option to address the lack of observational angular sampling in the split-SW is to apply a spectral conversion from total SW to split-SW to take advantage of the extensive angular sampling already obtained from the CERES instruments (Norman Loeb, personal communication, 2022). While this approach certainly warrants further investigation, it would undoubtedly require further scene stratification during the spectral conversion because the total SW includes the NIR spectral complexities discussed above. This could potentially be overcome by making the spectral conversion a function of properties such as the above-cloud water vapor. However, these properties would then need to be retrieved for every CERES footprint, which comes with its own challenges and uncertainties. We intentionally avoid these uncertainties for now given that such properties are important factors in determining where energy is deposited in the atmosphere, which is precisely what the split-SW observations can help to inform us on (Hakuba et al., 2022; Carlson et al., 2019; Collins et al., 2006).
To quantify the capability of a camera to provide dense angular sampling of various scene types required for rapid ADM generation, we ran a simulation experiment to project the camera sampling onto existing satellite retrievals. Figure 9 shows an example of instantaneous camera sampling following application of the pixel masks outlined in Sect. 3 onto the CERES Cookie Dough data described in Sect. 2. By matching the ADM samples to the underlying geophysical retrievals, we can determine the scene characteristics that a camera would have observed if it were flying on an existing satellite, in this case NOAA-20. It is immediately apparent that some ADM samples fall outside the Cookie Dough data (shown in purple). This is because VIIRS does not scan all the way to the horizon, whereas a WFOV camera would capture those geometries (see Fig. 2). However, most ADM samples are co-located with the Cookie Dough data (shown in red), including at acute VZA in the along-track directions with a modest time offset.
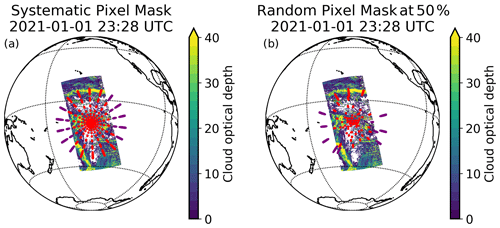
Figure 9An example of instantaneous synthetic camera sampling over the Pacific Ocean for (a) a systematic camera pixel mask with ADM samples at the center of every CERES-TRMM angular bin and (b) a randomized camera pixel mask with ADM samples randomly located in only 50 % of CERES-TRMM angular bins. ADM samples in red indicate that all pixels are co-located with VIIRS (retrieved cloud optical depth ±9 min is shown in colors as an example, which covers the instantaneous WFOV), while ADM samples in purple indicate that at least one pixel in the ADM sample falls outside the VIIRS swath. Snapshot is valid on 1 January 2021 at 23:28 UTC.
For each camera pixel within an ADM sample that is co-located with Cookie Dough, we determine the cloud fraction and surface type via nearest interpolation to the co-located Cookie Dough data. The surface type provided in Cookie Dough is based on the International Geosphere–Biosphere Programme (IGBP) surface classification, which we map to ERBE-like surface types using Table 2. We then calculate the surface type for an ADM sample as the mode of the pixel-level values and the cloud fraction as the mean of the pixel-level values. This enables us to assign the ADM sample to an ERBE-like scene type, providing an initial look at camera angular sampling stratified by scene type.
Table 2Mapping between IGBP and ERBE-like surface types. Three additional categories accounting for the variable surface in the cryosphere are added for CERES processing from the National Snow and Ice Data Center (NSIDC). Note: n/a – not applicable.
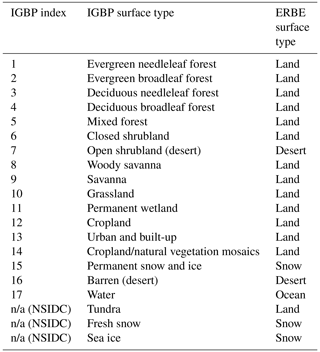
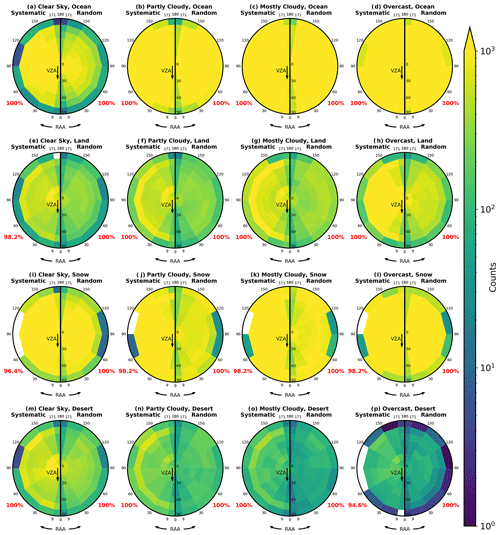
Figure 10Number of samples in each ERBE-like angular bin and scene type after 23 h of synthetic camera sampling. White indicates no samples. In each panel (a–p) results from the systematic pixel mask are shown on the left, and results from the randomized pixel mask with a 50 % scaling factor are shown on the right. The percentage of angular bins filled in each case is given in red. No stratification by solar zenith angle is shown. Data from 1 January 2021.
After just 23 h of sampling with the systematic pixel mask (Fig. 10, left half of panels), almost all angular bins for all scene types are sampled. The most frequent scene types (e.g., cloudy ocean) typically have every angular bin filled with hundreds to thousands of samples, whereas the least frequent scene types (e.g., cloudy desert) typically have around 10 or fewer samples in each angular bin. Only a couple of sporadic angular bins are not sampled in the outer VZA, mainly because fewer ADM samples are co-located with the Cookie Dough data (see Fig. 9) and are therefore not included in the counts.
The same 23 h of sampling with the randomized pixel mask at a scaling factor of 50 % (Fig. 10, right half of panels) also provides excellent angular sampling of these scene types. Despite the overall count being reduced by half, every angular bin for every scene type contains at least one sample in this configuration. This result is broadly consistent across 3 other simulated days spanning the annual cycle (1 April, 1 July, 1 October; not shown) and is therefore not dependent on the specific day chosen. Due to the improved angular coverage and the reduced data rate, the randomized pixel mask at a scaling factor of 50 % is used in the remainder of this section to explore the sampling in further detail.
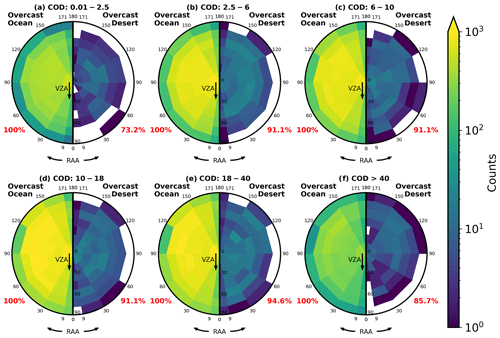
Figure 11Number of samples in ERBE-like angular bins and scene types after 23 h of synthetic camera sampling with the randomized pixel mask with a 50 % scaling factor, additionally stratified by (a–f) CERES-TRMM cloud optical depth (COD) bins over land. White indicates no samples. In each panel, results are shown for the most frequent scene type of overcast ocean on the left and the least frequent scene type of overcast desert on the right. The percentage of angular bins filled in each case is given in red. Data from 1 January 2021.
One major difference between the ERBE-like scene types applied thus far and those used in CERES products is the additional scene stratification by cloud optical depth. Since this variable is included in the Cookie Dough data, we can also look at the angular sampling as a function of cloud optical depth. For the most frequent scene type of overcast ocean (Fig. 11, left half of panels), the angular sampling remains excellent within CERES-TRMM land cloud optical depth bins. However, for the least frequent scene type of overcast desert (Fig. 11, right half of panels), sampling gaps start to appear. This suggests that the generation of camera-based ADMs for infrequent scenes that are stratified beyond ERBE-like would benefit from more than a single day of sampling. However, it is clear that ample angular sampling will be achieved in a much shorter time frame than could otherwise be achieved by traditional RAPS sampling, likely days to weeks rather than months to years.
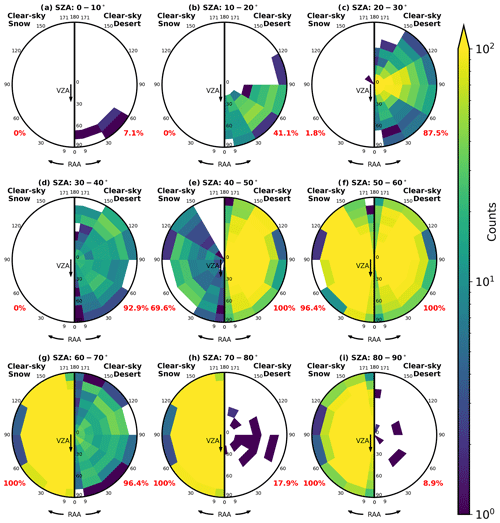
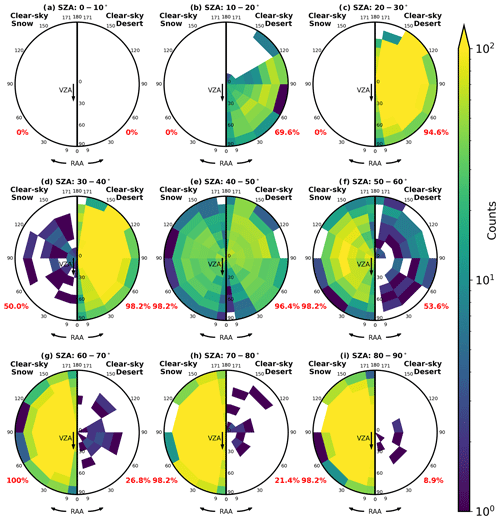
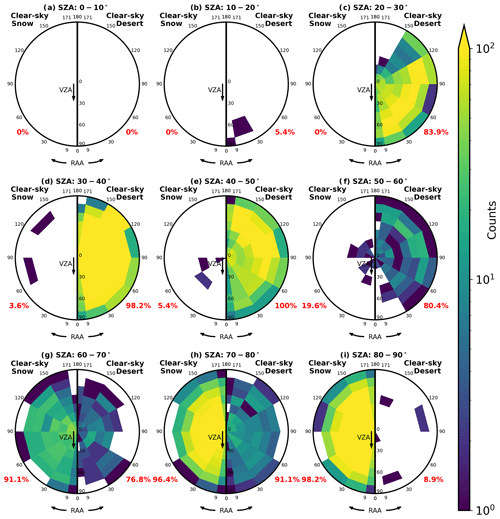
Figure 12Number of samples in ERBE-like angular bins and scene types after 23 h of synthetic camera sampling with the randomized pixel mask with a 50 % scaling factor, additionally stratified by (a–f) CERES-TRMM solar zenith angle (SZA) bins. White indicates no samples. In each panel, results are shown for the most challenging cases of clear-sky snow on the left and clear-sky desert on the right. The percentage of angular bins filled in each case is given in red. Data from 1 January 2021. Note that the maximum extent of the color bar is reduced from 1000 in Figs. 10 and 11 to 100 here.
Another dimension of ADMs not yet explored is the SZA. Figure 12 shows that angular sampling reduces with the additional stratification by CERES-TRMM SZA bins, as expected. However, this does not occur monotonically as demonstrated by the two most challenging cases of snow surfaces (with notable gaps at high sun) and desert surfaces (with notable gaps at both high and low sun). For snow-covered surfaces, this is due to their occurrence mostly at high latitudes where high sun is never encountered. For desert surfaces, this is related to the sun-synchronous 13:30 local time Equator-crossing orbit of NOAA-20 that passes over the low-latitude deserts in mid-afternoon when the sun is reasonably high in the sky, but not directly overhead. Unlike the other ADM dimensions, the SZA dependence exhibits a notable seasonal dependence (see Appendix B). In practice, these missing angular bins can often be filled with radiative transfer calculations or directional reciprocity (di Girolamo et al., 1998; Davies, 1994; Chandrasekhar, 1960). It should be noted that, since these sampling gaps are related to the orbital characteristics, they are not unique to the camera approach presented here; similar sampling gaps can be expected with the traditional radiometer RAPS approach. In fact, the sampling is in a sense self-balanced in that the superimposed SZA and scene statistics built up from camera sampling for ADM generation encounter a similar frequency of occurrence to the radiometer that will use these ADMs, given that they are flying on the same platform and that the radiometer cross-track scan always falls within the camera field of view.
Satellite-based Earth radiation budget (ERB) data products depend critically on conversion of measured radiances to derived irradiances, achieved via angular distribution models (ADMs). In this study, we present the concept of a space-based camera that views the Earth from horizon to horizon with a large pixel array at a single wavelength to serve as a valuable resource for the generation of new ADMs. Specifically, we focus on the capability of a camera proposed to fly as part of the upcoming Libera mission to provide angular sampling required to generate ADMs for the new split-SW spectral channel that Libera will host.
We start by addressing an immediate issue that arises when dealing with high-resolution camera images in space: the sheer amount of bandwidth required for frequent downlink of large arrays of pixels is operationally difficult. We note that entire camera images are not necessary for ADM generation, so we instead design a pixel mask that extracts only a small subset of pixels from each image. The presented pixel mask includes multiple groups of pixels that each encompass the Libera radiometer footprint, are randomly distributed across and within the discrete CERES-TRMM angular bins, and can be scaled according to the available bandwidth. We target a 50 % scaling (50 % of the angular bins are sampled in each image) that extracts less than 1 % of the pixels in each image.
Having extracted appropriate pixels from camera images, a spectral conversion is required to use single-wavelength radiances to generate split-SW ADMs. Various established and independent datasets all indicate that using a mid-visible wavelength to represent the VIS sub-band is the optimal choice, with physical reasoning supporting this choice revealed by analyzing spectral relationships by scene type. Spectral relationships involving the NIR are more complicated due to variations in the spectral absorption features of water in all three thermodynamic phases and variations in surface bidirectional reflectance. In contrast, the relationship between 555 nm and the VIS sub-band is largely insensitive to these properties, requiring only basic stratification by scene type and solar-viewing geometry to generate “proxy” VIS radiances.
With proxy VIS radiances distributed across angular bins, we finally quantify how the angular bins of different scene types are sampled by projecting this camera sampling onto retrieved scene properties from the existing NOAA-20 satellite. After less than a day of sampling, ERBE-like scene types and angular bins are found to be exceptionally well sampled, with every VZA and RAA bin of every scene type receiving at least one sample and in most cases many more. Some unavoidable gaps remain in the SZA dimension, and additional stratification by cloud optical depth leads to some unsampled angular bins for infrequent scene types within this short time frame.
While this study demonstrates the potential of a camera to augment existing ERB approaches, there are caveats that need mentioning. The presented pixel masks work well but are not necessarily optimal and could be refined further. The spectral conversion between 555 nm and VIS needs to be implemented, with a closer look at the angular dependencies; a new product is under development for this purpose and will be the focus of a subsequent study. Likewise, the synthetic angular sampling could be extended to a longer-duration dataset, which would more precisely quantify the timescale required to generate ADMs similar to current CERES SW ADMs that are substantially more stratified. More broadly, ADM generation is only one benefit that needs to be balanced with other potential ERB applications of a camera. We stress that camera-based ADMs for the Libera split-SW channels are intended as a demonstration and sit within a wider Libera split-SW ADM approach that will ultimately be constrained and tested with RAPS observations from the split-SW radiometers.
In summary, split-SW ADM generation for either ERBE-like scene types or more stratified scene types will be possible in a substantially shorter time frame than that from existing approaches if radiances from a monochromatic camera are used: days to weeks rather than months to years. This result can pave the way for the development of shortwave irradiance products across arbitrary sets of spectral bands through the use of monochromatic or polychromatic cameras with judiciously chosen, high-correlation wavelengths.
A representative example of the close correspondence between 555 nm and VIS reflectance as a function of RAA is shown in Fig. 8d using a fixed SZA, VZA, and scene. Figure A1 provides a further exploration of this relationship. It shows that correspondence at least as good exists across a variety of different SZA, VZA, and cloud optical depth combinations. This is not, nor is it intended to be, a comprehensive exploration of angle and scene space, but it rather provides a broader perspective to the example presented in Fig. 8d. The consistently close correspondence indicates that the spectral conversion that needs to be applied to map between the angular distribution at 555 nm (observed by the proposed camera) and VIS (the radiometer spectral channel of interest) is both minor and straightforward, thus reinforcing the conclusions of the study. Note that the scaling factor shown in each panel, which is separate from the RAA correspondence, varies between 0.93 and 0.98. This represents a single overall scaling in each case applied to rescale the VIS reflectance at each RAA and is expected given the spectrally varying scattering and absorption properties of the Earth system.
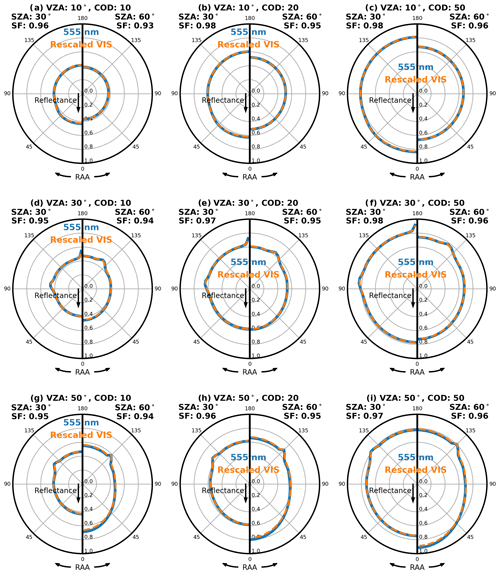
Figure A1Similar to Fig. 8d but for (a–i) various combinations of SZA, VZA, and cloud optical depth (COD). Unlike Fig. 8d, only 0–180∘ is shown for each case since the result is azimuthally symmetric. The scaling factor (SF) between the mean reflectance at 555 nm and VIS across all RAAs for each case is also given.
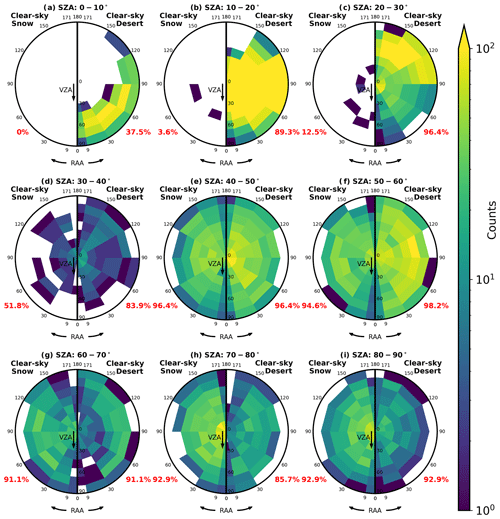
A representative example of synthetic camera angular sampling when stratified by SZA is given in Fig. 12 for data on 1 January 2021. However, as Earth's declination angle varies throughout the year, surfaces are tilted either toward or away from the sun, resulting in a seasonal dependence of the sampling when stratified by SZA, especially from a sun-synchronous orbit. Figures B1–B3 provide insight into this seasonal dependence. They show that when the synthetic sampling is repeated for 3 other days evenly spread across the annual cycle, the location of the missing angular bins for clear-sky snow and desert scenes shifts. It follows that there are benefits to collecting observations across a full annual cycle if the goal is to observe as much of the angular-scene space as possible from a sun-synchronous orbit.
All datasets used in this study have been made available at https://csl.noaa.gov/groups/csl9/datasets/data/cloud_phys/2023-Gristey-etal/ (Gristey et al., 2023).
JJG and KSS conceived and designed the study with input from all authors. JJG wrote the paper and created all final figures. DRF produced the CLARREO OSSE, BCK selected and retrieved the AVIRIS data for Fig. 6, JM provided the analysis for Fig. 8a–c, and HC provided the analysis for Fig. 8d. The paper received substantial editing from all authors.
At least one of the (co-)authors is a member of the editorial board of Atmospheric Measurement Techniques. The peer-review process was guided by an independent editor, and the authors also have no other competing interests to declare.
Publisher's note: Copernicus Publications remains neutral with regard to jurisdictional claims in published maps and institutional affiliations.
The authors thank the CERES science team, specifically Walter Miller, Kathleen Dejwakh, and Norman Loeb for their open sharing and guidance of CERES datasets.
This research has been supported by the Earth Venture Continuity 1 (EVC-1): Libera project under NASA Contract 80LARC20D0006 and the NOAA Cooperative Agreement NA22OAR4320151.
This paper was edited by Piet Stammes and reviewed by two anonymous referees.
Barkstrom, B. R.: The Earth Radiation Budget Experiment (ERBE), B. Am. Meteorol. Soc., 65, 1170–1185, https://doi.org/10.1175/1520-0477(1984)065<1170:TERBE>2.0.CO;2, 1984.
Béland, S., Harder, J., and Woods, T.: Eleven years of tracking the SORCE SIM instrument degradation caused by space radiation and solar exposure, SPIE conference on Astronomical Telescopes + Instrumentation, 22–27 June 2014, Montreal, Quebec, Canada, SPIE, 91434W, https://doi.org/10.1117/12.2057385, 2014.
Berk, A., Conforti, P., Kennett, R., Perkins, T., Hawes, F., and van den Bosch, J.: MODTRAN® 6: A major upgrade of the MODTRAN® radiative transfer code, Workshop on Hyperspectral Image and Signal Processing, Evolution in Remote Sensing, 24–27 June 2014, Lausanne, Switzerland, IEEE, https://doi.org/10.1109/WHISPERS.2014.8077573, 2014.
Carlson, B., Lacis, A., Colose, C., Marshak, A., Su, W., and Lorentz, S.: Spectral Signature of the Biosphere: NISTAR Finds It in Our Solar System From the Lagrangian L-1 Point, Geophys. Res. Lett., 46, 10679–10686, https://doi.org/10.1029/2019GL083736, 2019.
Ceppi, P. and Nowack, P.: Observational evidence that cloud feedback amplifies global warming, P. Natl. Acad. Sci. USA, 118, e2026290118, https://doi.org/10.1073/pnas.2026290118, 2021.
Cesana, G. V. and del Genio, A. D.: Observational constraint on cloud feedbacks suggests moderate climate sensitivity, Nat. Clim. Chang., 11, 213–218, https://doi.org/10.1038/s41558-020-00970-y, 2021.
Chandrasekhar, S.: Radiative Transfer, Dover Publications, 416 pp., ISBN 978-0486605906, 1960.
Chen, H., Schmidt, K. S., Massie, S. T., Nataraja, V., Norgren, M. S., Gristey, J. J., Feingold, G., Holz, R. E., and Iwabuchi, H.: The Education and Research 3D Radiative Transfer Toolbox (EaR3T) – towards the mitigation of 3D bias in airborne and spaceborne passive imagery cloud retrievals, Atmos. Meas. Tech., 16, 1971–2000, https://doi.org/10.5194/amt-16-1971-2023, 2023.
Collins, W. D., Lee-Taylor, J. M., Edwards, D. P., and Francis, G. L.: Effects of increased near-infrared absorption by water vapor on the climate system, J. Geophys. Res.-Atmos., 111, 18109, https://doi.org/10.1029/2005JD006796, 2006.
Corbett, J. and Su, W.: Accounting for the effects of sastrugi in the CERES clear-sky Antarctic shortwave angular distribution models, Atmos. Meas. Tech., 8, 3163–3175, https://doi.org/10.5194/amt-8-3163-2015, 2015.
Davies, R.: Spatial autocorrelation of radiation measured by the Earth Radiation Budget Experiment: Scene inhomogeneity and reciprocity violation, J. Geophys. Res., 99, 20879–20887, https://doi.org/10.1029/94JD01680, 1994.
di Girolamo, L., Várnai, T., and Davies, R.: Apparent breakdown of reciprocity in reflected solar radiances, J. Geophys. Res.-Atmos., 103, 8795–8803, https://doi.org/10.1029/98JD00345, 1998.
Diner, D. J., Beckert, J. C., Reilly, T. H., Bruegge, C. J., Conel, J. E., Kahn, R. A., Martonchik, J. V., Ackerman, T. P., Davies, R., Gerstl, S. A. W., Gordon, H. R., Muller, J. P., Myneni, R. B., Sellers, P. J., Pinty, B., and Verstraete, M. M.: Multi-angle imaging spectroradiometer (MISR) instrument description and experiment overview, IEEE T. Geosci. Remote, 36, 1072–1087, https://doi.org/10.1109/36.700992, 1998.
Emde, C., Buras-Schnell, R., Kylling, A., Mayer, B., Gasteiger, J., Hamann, U., Kylling, J., Richter, B., Pause, C., Dowling, T., and Bugliaro, L.: The libRadtran software package for radiative transfer calculations (version 2.0.1), Geosci. Model Dev., 9, 1647–1672, https://doi.org/10.5194/gmd-9-1647-2016, 2016.
Feldman, D. R., Algieri, C. A., Ong, J. R., and Collins, W. D.: CLARREO shortwave observing system simulation experiments of the twenty-first century: Simulator design and implementation, J. Geophys. Res., 116, D10107, https://doi.org/10.1029/2010JD015350, 2011a.
Feldman, D. R., Algieri, C. A., Collins, W. D., Roberts, Y. L., and Pilewskie, P. A.: Simulation studies for the detection of changes in broadband albedo and shortwave nadir reflectance spectra under a climate change scenario, J. Geophys. Res.-Atmos., 116, D24103, https://doi.org/10.1029/2011JD016407, 2011b.
Feldman, D. R., Collins, W. D., and Paige, J. L.: Pan-spectral observing system simulation experiments of shortwave reflectance and long-wave radiance for climate model evaluation, Geosci. Model Dev., 8, 1943–1954, https://doi.org/10.5194/gmd-8-1943-2015, 2015.
Forster, P. M. F. and Gregory, J. M.: The Climate Sensitivity and Its Components Diagnosed from Earth Radiation Budget Data, J. Climate, 19, 39–52, https://doi.org/10.1175/JCLI3611.1, 2006.
Gottwald, M. and Bovensmann, H. (Eds.): SCIAMACHY – Exploring the Changing Earth's Atmosphere, Springer Netherlands, Dordrecht, https://doi.org/10.1007/978-90-481-9896-2, 2011.
Green, R. O., Eastwood, M. L., Sarture, C. M., Chrien, T. G., Aronsson, M., Chippendale, B. J., Faust, J. A., Pavri, B. E., Chovit, C. J., Solis, M., Olah, M. R., and Williams, O.: Imaging Spectroscopy and the Airborne Visible/Infrared Imaging Spectrometer (AVIRIS), Remote Sens. Environ., 65, 227–248, https://doi.org/10.1016/S0034-4257(98)00064-9, 1998.
Gristey, J. J. and Chiu, J. C.: Understanding our Climate System through the Lens of Spectral Reflected Solar Radiation, in: International Radiation Symposium, 4–8 July 2022, Thessaloniki, Greece, AIP Proceedings, in press, 2022.
Gristey, J. J., Chiu, J. C., Gurney, R. J., Shine, K. P., Havemann, S., Thelen, J. C., and Hill, P. G.: Shortwave Spectral Radiative Signatures and Their Physical Controls, J. Climate, 32, 4805–4828, https://doi.org/10.1175/JCLI-D-18-0815.1, 2019.
Gristey, J. J., Su, W., Loeb, N. G., Vonder Haar, T. H., Tornow, F., Schmidt, K. S., Hakuba, M. Z., Pilewskie, P., and Russell, J. E.: Shortwave Radiance to Irradiance Conversion for Earth Radiation Budget Satellite Observations: A Review, Remote Sens., 13, 2640, https://doi.org/10.3390/RS13132640, 2021.
Gristey, J. J., Schmidt, K. S., Chen, H., Feldman, D. R., Kindel, B. C., Mauss, J., van den Heever, M., Hakuba, M. Z., and Pilewskie, P.: Dataset for “Angular sampling of a monochromatic, wide-field-of-view camera to augment next-generation Earth Radiation Budget satellite observations”, NOAA Chemical Sciences Laboratory [data set], https://csl.noaa.gov/groups/csl9/datasets/data/cloud_phys/2023-Gristey-etal/, last access: 3 August 2023.
Hakuba, M. Z., Kindel, B., Gristey, J. J., Bodas-Salcedo, A., Stephens, G., and Pilewskie, P.: Simulated variability in visible and near-IR irradiances in preparation for the upcoming Libera mission, in: International Radiation Symposium, 4–8 July 2022, Thessaloniki, Greece, AIP Proceedings, in press, 2022.
Harries, J. E., Russell, J. E., Hanafin, J. A., Brindley, H., Futyan, J., Rufus, J., Kellock, S., Matthews, G., Wrigley, R., Last, A., Mueller, J., Mossavati, R., Ashmall, J., Sawyer, E., Parker, D., Caldwell, M., Allan, P. M., Smith, A., Bates, M. J., Coan, B., Stewart, B. C., Lepine, D. R., Cornwall, L. A., Corney, D. R., Ricketts, M. J., Drummond, D., Smart, D., Cutler, R., Dewitte, S., Clerbaux, N., Gonzalez, L., Ipe, A., Bertrand, C., Joukoff, A., Crommelynck, D., Nelms, N., Llewellyn-Jones, D. T., Butcher, G., Smith, G. L., Szewczyk, Z. P., Mlynczak, P. E., Slingo, A., Allan, R. P., and Ringer, M. A.: The Geostationary Earth Radiation Budget Project, B. Am. Meteorol. Soc., 86, 945–960, https://doi.org/10.1175/BAMS-86-7-945, 2005.
Hartmann, D. L. and Ceppi, P.: Trends in the CERES Dataset, 2000–13: The Effects of Sea Ice and Jet Shifts and Comparison to Climate Models, J. Climate, 27, 2444–2456, https://doi.org/10.1175/JCLI-D-13-00411.1, 2014.
Havemann, S., Thelen, J.-C., Taylor, J. P., and Harlow, R. C.: The Havemann-Taylor Fast Radiative Transfer Code (HT-FRTC): A multipurpose code based on principal components, J. Quant. Spectrosc. Ra., 220, 180–192, https://doi.org/10.1016/J.JQSRT.2018.09.008, 2018.
Jacobowitz, H., Soule, H. V., Kyle, H. L., and House, F. B.: The Earth Radiation Budget (ERB) Experiment: An overview, J. Geophys. Res.-Atmos., 89, 5021–5038, https://doi.org/10.1029/JD089iD04p05021, 1984.
Kandel, R., Viollier, M., Raberanto, P., Duvel, J. P., Pakhomov, L. A., Golovko, V. A., Trishchenko, A. P., Mueller, J., Raschke, E., Stuhlmann, R. R., and the International ScaRaB Scientific Working Group (ISSWG): The ScaRaB Earth Radiation Budget Dataset, B. Am. Meteorol. Soc., 79, 765–783, https://doi.org/10.1175/1520-0477(1998)079<0765:TSERBD>2.0.CO;2, 1998.
Kramer, R. J., He, H., Soden, B. J., Oreopoulos, L., Myhre, G., Forster, P. M., and Smith, C. J.: Observational Evidence of Increasing Global Radiative Forcing, Geophys. Res. Lett., 48, e2020GL091585, https://doi.org/10.1029/2020GL091585, 2021.
Kyle, H. L., Arking, A., Hickey, J. R., Ardanuy, P. E., Jacobowitz, H., Stowe, L. L., Campbell, G. G., Vonder Haar, T., House, F. B., Maschhoff, R., and Smith, G. L.: The Nimbus Earth Radiation Budget (ERB) Experiment: 1975 to 1992, B. Am. Meteorol. Soc., 74, 815–830, https://doi.org/10.1175/1520-0477(1993)074<0815:TNERBE>2.0.CO;2, 1993.
Loeb, N. G. and Wielicki, B. A.: Satellites and Satellite Remote Sensing: Earth's Radiation Budget, in: Encyclopedia of Atmospheric Sciences: Second Edition, Elsevier Inc., 67–76, https://doi.org/10.1016/B978-0-12-382225-3.00349-2, 2015.
Loeb, N. G., Priestley, K. J., Kratz, D. P., Geier, E. B., Green, R. N., Wielicki, B. A., Hinton, P. O., and Nolan, S. K.: Determination of Unfiltered Radiances from the Clouds and the Earth's Radiant Energy System Instrument, J. Appl. Meteorol., 40, 822–835, https://doi.org/10.1175/1520-0450(2001)040<0822:DOURFT>2.0.CO;2, 2001.
Loeb, N. G., Manalo-Smith, N., Kato, S., Miller, W. F., Gupta, S. K., Minnis, P., and Wielicki, B. A.: Angular Distribution Models for Top-of-Atmosphere Radiative Flux Estimation from the Clouds and the Earth's Radiant Energy System Instrument on the Tropical Rainfall Measuring Mission Satellite. Part I: Methodology, J. Appl. Meteorol., 42, 240–265, https://doi.org/10.1175/1520-0450(2003)042<0240:ADMFTO>2.0.CO;2, 2003a.
Loeb, N. G., Loukachine, K., Manalo-Smith, N., Wielicki, B. A., and Young, D. F.: Angular distribution models for top-of tmosphere radiative flux estimation from the clouds and the Earth's Radiant Energy system instrument on the Tropical Rainfall Measuring Mission satellite. Part II: Validation, J. Appl. Meteorol., 42, 1748–1769, https://doi.org/10.1175/1520-0450(2003)042<1748:ADMFTR>2.0.CO;2, 2003b.
Loeb, N. G., Kato, S., Loukachine, K., and Manalo-Smith, N.: Angular Distribution Models for Top-of-Atmosphere Radiative Flux Estimation from the Clouds and the Earth's Radiant Energy System Instrument on the Terra Satellite. Part I: Methodology, J. Atmos. Ocean. Tech., 22, 338–351, https://doi.org/10.1175/JTECH1712.1, 2005.
Loeb, N. G., Kato, S., Loukachine, K., Manalo-Smith, N., and Doelling, D. R.: Angular distribution models for top-of-atmosphere radiative flux estimation from the Clouds and the Earth's Radiant Energy System instrument on the Terra Satellite. Part II: Validation, J. Atmos. Ocean. Tech., 24, 564–584, https://doi.org/10.1175/JTECH1983.1, 2007.
Mayer, B. and Kylling, A.: Technical note: The libRadtran software package for radiative transfer calculations – description and examples of use, Atmos. Chem. Phys., 5, 1855–1877, https://doi.org/10.5194/acp-5-1855-2005, 2005.
Minnis, P., Sun-Mack, S., Chen, Y., Chang, F. L., Yost, C. R., Smith, W. L., Heck, P. W., Arduini, R. F., Bedka, S. T., Yi, Y., Hong, G., Jin, Z., Painemal, D., Palikonda, R., Scarino, B. R., Spangenberg, D. A., Smith, R. A., Trepte, Q. Z., Yang, P., and Xie, Y.: CERES MODIS Cloud Product Retrievals for Edition 4 – Part I: Algorithm Changes, IEEE T. Geosci. Remote, 59, 2744–2780, https://doi.org/10.1109/TGRS.2020.3008866, 2021.
Myers, T. A., Scott, R. C., Zelinka, M. D., Klein, S. A., Norris, J. R., and Caldwell, P. M.: Observational constraints on low cloud feedback reduce uncertainty of climate sensitivity, Nat. Clim. Chang., 11, 501–507, https://doi.org/10.1038/s41558-021-01039-0, 2021.
Raghuraman, S. P., Paynter, D., and Ramaswamy, V.: Anthropogenic forcing and response yield observed positive trend in Earth's energy imbalance, Nat. Commun., 12, 1–10, https://doi.org/10.1038/s41467-021-24544-4, 2021.
Raschke, E. and Bandeen, W. R.: The Radiation Balance of the Planet Earth from Radiation Measurements of the Satellite Nimbus II, J. Appl. Meteorol., 9, 215–238, https://doi.org/10.1175/1520-0450(1970)009<0215:trbotp>2.0.co;2, 1970.
Raschke, E., Vonder Haar, T. H., Bandeen, W. R., and Pasternak, M.: The Annual Radiation Balance of the Earth-Atmosphere System During 1969–70 from Nimbus 3 Measurements, J. Atmos. Sci., 30, 341–364, https://doi.org/10.1175/1520-0469(1973)030<0341:TARBOT>2.0.CO;2, 1973.
Stephens, G. L., Li, J., Wild, M., Clayson, C. A., Loeb, N., Kato, S., L'Ecuyer, T., Stackhouse, P. W., Lebsock, M., and Andrews, T.: An update on Earth's energy balance in light of the latest global observations, Nat. Geosci., 5, 691–696, https://doi.org/10.1038/ngeo1580, 2012.
Su, W., Corbett, J., Eitzen, Z., and Liang, L.: Next-generation angular distribution models for top-of-atmosphere radiative flux calculation from CERES instruments: methodology, Atmos. Meas. Tech., 8, 611–632, https://doi.org/10.5194/amt-8-611-2015, 2015a.
Su, W., Corbett, J., Eitzen, Z., and Liang, L.: Next-generation angular distribution models for top-of-atmosphere radiative flux calculation from CERES instruments: validation, Atmos. Meas. Tech., 8, 3297–3313, https://doi.org/10.5194/amt-8-3297-2015, 2015b.
Suttles, J., Green, R., Minnis, P., Smith, G., Staylor, W., Wielicki, B., Walker, I., Young, D., Taylor, V., and Stowe, L.: Angular Radiation Models for Earth-Atmosphere Systems, Vol. I Shortwave Radiation, Hampton, Technical report, https://ntrs.nasa.gov/citations/19880018293 (last access: 3 August 2023), 1988.
Tett, S. F. B., Rowlands, D. J., Mineter, M. J., and Cartis, C.: Can Top-of-Atmosphere Radiation Measurements Constrain Climate Predictions? Part II: Climate Sensitivity, J. Climate, 26, 9367–9383, https://doi.org/10.1175/JCLI-D-12-00596.1, 2013a.
Tett, S. F. B., Mineter, M. J., Cartis, C., Rowlands, D. J., and Liu, P.: Can Top-of-Atmosphere Radiation Measurements Constrain Climate Predictions? Part I: Tuning, J. Climate, 26, 9348–9366, https://doi.org/10.1175/JCLI-D-12-00595.1, 2013b.
Trenberth, K. E.: An imperative for climate change planning: tracking Earth's global energy, Curr. Opin. Environ. Sustain., 1, 19–27, https://doi.org/10.1016/j.cosust.2009.06.001, 2009.
Trepte, Q. Z., Minnis, P., Sun-Mack, S., Yost, C. R., Chen, Y., Jin, Z., Hong, G., Chang, F. L., Smith, W. L., Bedka, K. M., and Chee, T. L.: Global Cloud Detection for CERES Edition 4 Using Terra and Aqua MODIS Data, IEEE T. Geosci. Remote, 57, 9410–9449, https://doi.org/10.1109/TGRS.2019.2926620, 2019.
Vonder Haar, T. H. and Suomi, V. E.: Measurements of the Earth's Radiation Budget from Satellites During a Five-Year Period. Part I: Extended Time and Space Means, J. Atmos. Sci., 28, 305–314, https://doi.org/10.1175/1520-0469(1971)028<0305:MOTERB>2.0.CO;2, 1971.
Wielicki, B. A., Barkstrom, B. R., Harrison, E. F., Lee, R. B., Louis Smith, G., and Cooper, J. E.: Clouds and the Earth's Radiant Energy System (CERES): An Earth Observing System Experiment, B. Am. Meteorol. Soc., 77, 853–868, https://doi.org/10.1175/1520-0477(1996)077<0853:CATERE>2.0.CO;2, 1996.
Wielicki, B. A., Young, D. F., Mlynczak, M. G., Thome, K. J., Leroy, S., Corliss, J., Anderson, J. G., Ao, C. O., Bantges, R., Best, F., Bowman, K., Brindley, H., Butler, J. J., Collins, W., Dykema, J. A., Doelling, D. R., Feldman, D. R., Fox, N., Huang, X., Holz, R., Huang, Y., Jin, Z., Jennings, D., Johnson, D. G., Jucks, K., Kato, S., Kirk-Davidoff, D. B., Knuteson, R., Kopp, G., Kratz, D. P., Liu, X., Lukashin, C., Mannucci, A. J., Phojanamongkolkij, N., Pilewskie, P., Ramaswamy, V., Revercomb, H., Rice, J., Roberts, Y., Roithmayr, C. M., Rose, F., Sandford, S., Shirley, E. L., Smith, W. L., Soden, B., Speth, P. W., Sun, W., Taylor, P. C., Tobin, D., and Xiong, X.: Achieving Climate Change Absolute Accuracy in Orbit, B. Am. Meteorol. Soc., 94, 1519–1539, https://doi.org/10.1175/BAMS-D-12-00149.1, 2013.
Wild, M., Folini, D., Hakuba, M. Z., Schär, C., Seneviratne, S. I., Kato, S., Rutan, D., Ammann, C., Wood, E. F., and König-Langlo, G.: The energy balance over land and oceans: an assessment based on direct observations and CMIP5 climate models, Clim. Dynam., 44, 3393–3429, https://doi.org/10.1007/s00382-014-2430-z, 2015.
- Abstract
- Introduction
- Data
- Subsetting of camera images for dense angular sampling
- Choice of camera wavelength
- Synthetic camera angular sampling
- Summary and conclusions
- Appendix A: Further exploration of the angular reflectance correspondence between 555 nm and VIS
- Appendix B: Further exploration of the SZA dependence of sampling
- Data availability
- Author contributions
- Competing interests
- Disclaimer
- Acknowledgements
- Financial support
- Review statement
- References


