the Creative Commons Attribution 4.0 License.
the Creative Commons Attribution 4.0 License.
 | 23 Aug 2023
Evaluation of error components in rainfall retrieval from collocated commercial microwave links
Martin Fencl
Vojtěch Bareš
Opportunistic rainfall sensing using commercial microwave links (CMLs) operating in telecommunication networks has the potential to complement conventional rainfall monitoring; however, the diversity of sensors and their errors are difficult to handle. This analysis empirically evaluates errors in CML observations that manifest discrepancies between collocated sensors without reference to rainfall measurements. Collocated CMLs are evaluated as independent rainfall sensors and enable us to assess the effect of hardware homogeneity and measurement consistency using CML observations at 12 sites within a real telecommunication network in Prague. The evaluation considers 33 rainfall events distinguishing between stratiform and convective rainfall types in the period of 2014–2016, monitored at 1 min temporal resolution. Collocated CMLs of identical and different frequencies are evaluated, and different rainfall types are discussed. The collocated CMLs are in excellent agreement. The inherent error in rain-induced attenuation for paired independent CMLs is 0.4 dB. The high correlation of the rainfall intensity measurements between the collocated sensors was obtained in a range of 0.96 to 0.99, and the root mean square error ranges from 0.4 to 1.7 mm h−1. This confirms the homogeneous behaviour of the hardware in a real network. Therefore, the data of CMLs of the same characteristics can be processed with identical parameters for rainfall retrieval models.
- Article
(2801 KB) - Full-text XML
- BibTeX
- EndNote


Commercial microwave links (CMLs) are appealing opportunistic rainfall sensors which have great potential to complement traditional rain gauge networks (Graf et al., 2020) and to provide rainfall observations in sparsely gauged regions (Walraven et al., 2022). CMLs are point-to-point radio connections used worldwide as the backhaul of telecommunication networks. When it rains, the CML radio connection is attenuated by raindrops. Rainfall estimation takes advantage of the nearly proportional relationship between raindrop attenuation and rain rate along a CML path at frequencies typically used by cellular operators.
Several studies have demonstrated the potential of CMLs for different hydrometeorological applications. For example, Bianchi et al. (2013) assimilated them with radar observations, Graf et al. (2020) reconstructed German-wide rainfall maps, and Imhoff et al. (2020) used CMLs for nowcasting. Locally, Pastorek et al. (2021) demonstrated that CMLs can conveniently complement relatively dense rain gauge networks and can be successfully used for rainfall–runoff modelling.
CML networks are substantially denser in comparison to rain gauge networks operated by national meteorological offices in developed countries (van de Beek et al., 2020), and the coverage extends well into emerging countries which have sparse conventional monitoring networks (Doumounia et al., 2014). CMLs provide path-averaged measurements which can be acquired online from a network operation centre with a delay of only a few seconds (Chwala et al., 2016). Compared to weather radar, they usually measure rainfall only several tens of metres above ground, and the relationship between attenuation and rain rate is less sensitive to drop size distribution (DSD) than the Z–R relationship (Berne and Uijlenhoet, 2007).
On the other hand, there are also many challenges related to CML rainfall estimation. One of the main challenges of opportunistic sensors is the lack of control over them, as well as incomplete metadata about their hardware and operation (e.g. de Vos et al., 2019). CMLs are not an exception as telecommunication networks are formed by a variety of devices which affect the homogeneity of attenuation observations. This may lead to different requirements for raw data processing for individual CMLs and differences in error types, as well as their magnitudes. In addition, even the same type of hardware does not ensure consistent performance in terms of rainfall estimation as CMLs are primarily telecommunication devices, and their design, deployment, and maintenance are exclusively focused on their primary function.
The models used to separate raindrop path attenuation from other attenuation components rely on empirically estimated parameters. If, for example, wet-antenna attenuation (discussed in greater detail in Sect. 2) differs significantly among CMLs, extensive calibration campaigns are required to obtain accurate rainfall estimates from the network of CMLs. High requirements for CML calibration hinder both the upscaling of rainfall estimation and its the application in sparsely gauged regions, where rainfall information from opportunistic sensors, such as CMLs, has the greatest added value. Understanding the effects of hardware heterogeneity on CML rainfall retrieval is also crucial when estimating the uncertainties in retrieved CML rain rates. Spatially inconsistent errors make it difficult to interpolate or reconstruct gridded rainfall fields from CML observations and hinder assimilation with other rainfall observations (Graf et al., 2021).
Until now, studies evaluating CML reliability have focused on comparisons with traditional observations used for reference, although the path-integrated character of CML observations makes such comparisons difficult. Experimental set-ups with a single CML obtain reference rainfall observations from several rain gauges or disdrometers along a CML path (van Leth et al., 2018; Špačková et al., 2021; Moroder et al., 2020). Gathering such high-quality reference data is not feasible at the scale of the entire network or its parts. In these cases, gauge-adjusted radar is the most used reference (Graf et al., 2020; Overeem et al., 2013). Such comparisons are affected by substantial errors, especially during heavier rainfall events (Schleiss et al., 2020) and at sub-hourly timescales (Ochoa-Rodriguez et al., 2019). Studies primarily evaluating consistency between rain rate estimates of different CMLs have not been reported to the best of our knowledge.
Inconsistency between rain rate observations also occurs in traditional monitoring networks as they evolve over time and rarely consist of the same devices. Studies evaluating observations from collocated devices are often used to investigate discrepancies between different types of instruments. For example, their results are used for homogeneity adjustments of atmospheric climate data (e.g. Peterson et al., 1998). Collocated devices of the same type, where none of the measurements are considered to be error-prone references, are also used to calibrate error models. For example, Ciach and Krajewski (2005) and Peleg et al. (2013) used pairs of rain gauges located at different sites when investigating the small-scale variability in rainfall to quantify the nugget of variograms.
In this paper, we investigate the consistency between different CMLs by comparing pairs of independent collocated devices operating at the same frequencies and at different frequencies. We quantify the discrepancies between their observations and identify the random and systematic components of such discrepancies. Finally, we discuss the effect of CML processing on the measurement consistency of collocated pairs. Twelve sites of collocated CMLs in the Prague CML network, with almost identical paths and thus exposed to the same atmospheric conditions, were selected for the experiment. The analysis is based on observations during 33 rainfall events over a 3-year period.
The paper is structured as follows: Sect. 2 elaborates on CML rainfall retrieval and sources of associated uncertainties in the rainfall estimates. The dataset and methodology used in this study are described in Sect. 3. Section 4 presents the results, which are further discussed in Sect. 5, and the conclusions are presented in Sect. 6.
CML rainfall retrieval uses significant attenuation of electromagnetic (EM) waves by raindrops at millimetre wavelengths (ITU-R, 2005). Raindrop path attenuation is not directly observed but estimated from the total path loss, typically as the difference between its level during wet and dry weather and accounting for wet-antenna attenuation (WAA) caused by the water film forming on antenna radomes during rain and/or dew events (Chwala and Kunstmann, 2019; van Leth et al., 2018). The specific raindrop attenuation (dB km−1), which is the total path loss divided by the link-path distance, is then converted to the rain rate. The reliability of CML rainfall estimates depends on the accuracy and precision of measured transmitted (TSL) and received signal power (RSL), the efficiency of separating raindrop attenuation from other losses, the accuracy of the attenuation–rain rate relationship, and the overall sensitivity of a CML to raindrop path attenuation.
Nominal values of TSL and RSL accuracies are usually unknown; nevertheless, maximal precision is given by the quantization of TSL and RSL records. Based on the hardware, the power levels are often provided at 0.1, 0.3, or 1.0 dB (Chwala and Kunstmann, 2019). Most modern CMLs feature automatic transmit power control (ATPC), which adjusts the power level of transmitted EM waves so that RSL is maintained at a specific level or in some predefined range. In the first case, TSL changes even with a small increase or decrease in RSL, whereas in the second case, TSL remains constant in some wider range of RSL values (e.g. 5 dB). When the quantization of RSL and TSL differs, the configuration of the ATPC affects the precision of the calculated total loss (TSL − RSL). For example. Ericsson MINI-LINK CMLs provide RSL and TSL readings with a quantization of 0.3 and 1 dB, respectively. In the first case, where TSL changes instantly, the quantization of total loss is practically only 1 dB, whereas in the second case remains constant, the quantization is 0.3 dB.
Total loss Lt (dB), which is the difference between the transmitted and received signal power, consists of several components, as described below:
where Lbf is free space loss; Lm represents losses in the medium; Ltc and Lrc are losses in the transmitting and receiving antennas, respectively; and Gt and Gr are gains in the transmitting and receiving antennas, respectively. The free space loss is uniquely defined by the distance between the transmitter and receiver and by the wavelength. Losses in the medium consist of gaseous attenuation, obstacles in the path, diffraction caused by the bending of a direct wave towards the ground, and losses due to raindrops along the CML path. The sum of losses and gains is determined by the CML hardware and includes WAA. WAA is an attenuation caused by the formation of wetness on an antenna radome and is a complex process influenced by atmospheric conditions and hydrophobic properties of the radome surface (van Leth et al., 2018).
Rain-induced attenuation Ar (dB) is expressed as total loss Lt (dB) with separated baseline attenuation B (dB). Baseline attenuation is usually estimated from attenuation during dry-weather conditions:
An important part of most baseline estimation methods is the classification of dry and wet weather from CML data (Chwala and Kunstmann, 2019). Baseline methods implicitly assume that components of total loss, other than raindrop attenuation and WAA, are identical during dry and wet weather. This is not entirely accurate as water vapour content in the air and temperature can differ between dry- and wet-weather periods (Minda and Nakamura, 2005). This inevitably leads to uncertainties in the estimated baseline and, thus, in estimated raindrop path attenuation. Furthermore, multipath inferences, diffraction losses (Valtr et al., 2011), and attenuation due to dust (Abuhdima and Saleh, 2010) and fog (David et al., 2009) affect the accuracy of the estimated baseline.
The specific raindrop path attenuation k (dB km−1) is usually obtained by separating wet-antenna attenuation Aw (dB) from rain-induced attenuation Ar (dB):
where l is CML path length (km). In practice, WAA is either assumed to be constant (Overeem et al., 2011), or it is estimated as a time-dependent process (Schleiss et al., 2013) or a function of rain rate or attenuation (Leijnse et al., 2008; Kharadly and Ross, 2001). For an intercomparison of different models see, for example, Pastorek et al. (2022). The variety of approaches reported in the literature indicate that patterns of WAA magnitude differ among CMLs. Therefore, WAA represents one of the most severe sources of uncertainty.
The relationship between specific raindrop attenuation k (dB km−1) and rain rate R (mm h−1) is approximated by the power law:
where α (mm h−1 dB−β kmβ) and β (–) are empirical parameters dependent on the CML frequency, polarization, and DSD. When estimating rainfall, the α and β parameters are either taken from International Telecommunication Union (ITU) recommendations (ITU-R, 2005) or estimated from local disdrometer observations (e.g. Schleiss et al., 2013). In both cases, one set of parameters is used for all rainfall types. Furthermore, uniform rain rate is assumed along a CML path. The uncertainties related to the variable DSD in real rainfall events are the lowest for frequencies between 15 and 40 GHz (with a minimum at 30 GHz), where β is close to unity (Berne and Uijlenhoet, 2007) but increases outside of this range.
The magnitude of the total rainfall estimation error and the ratio between its components are strongly related to CML sensitivity to raindrop path attenuation, which is given by the CML path length, frequency, and polarization. Sensitivity is defined as a measure of change in raindrop path attenuation per change in rainfall intensity.
For example, the limited precision of TSL and RSL readings or incorrectly estimated WAA results in larger errors by CMLs relatively insensitive to rainfall. On the other hand, errors related to the non-linearity of the k–R relationship can be more pronounced by longer CMLs, whereby rain rates along their path are more likely to be non-uniform. Diversity in CML length and frequencies common to standard cellular networks can help to estimate the contribution of different errors to the total measurement error and possibly reduce some systematic deviations. For example, Fencl et al. (2019) used extremely short CMLs insensitive to raindrop path attenuation to quantify WAA. Fencl et al. (2020) also quantified WAA during light rainfall events at E-band CMLs by comparing observations of CMLs with different path lengths. Collocated CMLs, investigated in this paper, could further improve error quantification, especially in cases where CML observations are a single available rainfall observation data source.
Collocated CMLs of the same frequency and polarization must be affected by the same free space losses (Lbf) and losses in the medium (Lm) as their paths are identical, and their EM waves are propagated through the same medium. The gains (Gt+Gr) and the losses (Ltc+Lrc) on the antennas of collocated CMLs can, however, differ due to the hardware used. Droplet patterns can substantially differ between the antennas depending on the material of a radome and on the condition of its hydrophobic coating (van Leth et al., 2018). On the other hand, antenna radomes are exposed to similar rain rates and other atmospheric conditions by collocated CMLs.
EM waves of collocated CMLs operating at different frequencies and/or polarizations are propagated by the same medium interacting differently with gases or droplets of different sizes. Therefore, discrepancies in their rain rate estimates combine hardware-related errors with errors related to the propagation through the medium.
This paper examines collocated CMLs with the same frequency and different frequencies. They are affected by the same weather conditions along their path. Discrepancies between collocated CMLs of the same frequency are only due to hardware characteristics and enable us to evaluate the effect of hardware homogeneity.
This study investigates observations of collocated independent CMLs at 12 sites located in Prague, Czech Republic (Fig. 1), for 33 rainfall periods (304 h) in the non-winter periods of the years 2014 to 2016. There are eight sites of CML pairs operating at identical frequency bands (indicated by “a” in the site name) and six sites of CML pairs operating at different frequency bands (indicated by “b” in the site name), which implies that “b” sites contain collocated CML pairs of similar lengths but of different frequencies. Sites 2 and 3 offer pairs of both identical and different frequency bands (Fig. 1).
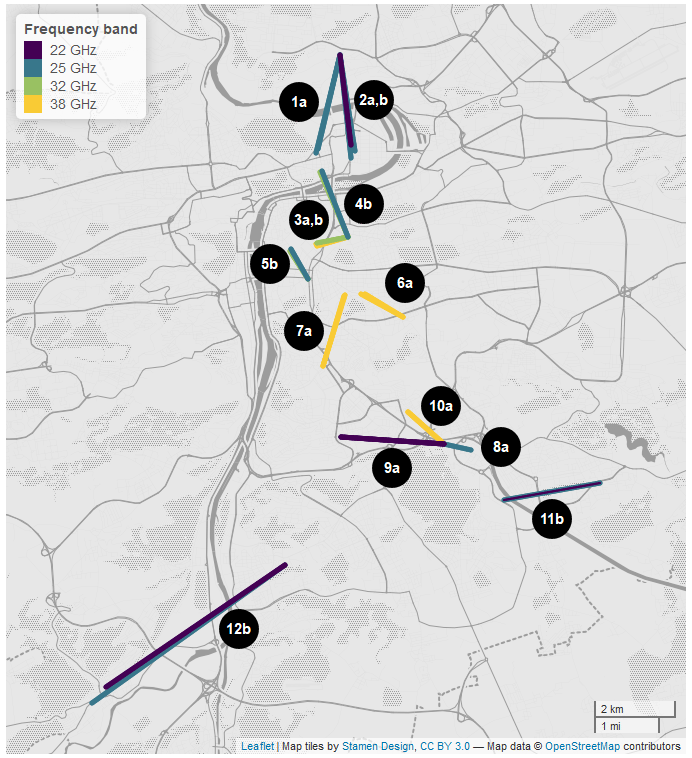
Figure 1Map of the 12 sites of collocated CMLs in the Prague CML network of the provider T-Mobile. The line colour indicates the frequency band at which CMLs operate. The “a” in the name of the site indicates pairs of CMLs with identical frequency bands, whereas “b” indicates pairs of CMLs with different frequency bands.
First, rain-induced attenuation is compared among sites with CML pairs operating at identical frequency bands. Second, the retrieved collocated rainfall intensity is evaluated for all the sites. For rainfall retrieval, the WAA model (Pastorek et al., 2022) optimized according to rain-gauge-adjusted weather radar rainfall observations is used.
3.1 Materials
3.1.1 CML
The collocated CMLs share one end point (e.g. the same rooftop), and the distance between the second end points is not greater than 10 % of the mean path lengths of the collocated CMLs. The maximum distance between the end nodes of the CMLs is 0.51 km and occurs at site 12b, which contains the longest CMLs. Such a distance is approximately half of a standard weather radar pixel. Most of the link paths cover urban areas. The CMLs operate at the 22, 25, 32, and 38 GHz frequency bands and have lengths of ∼ 0.7 to ∼ 5.8 km (Fig. 2).
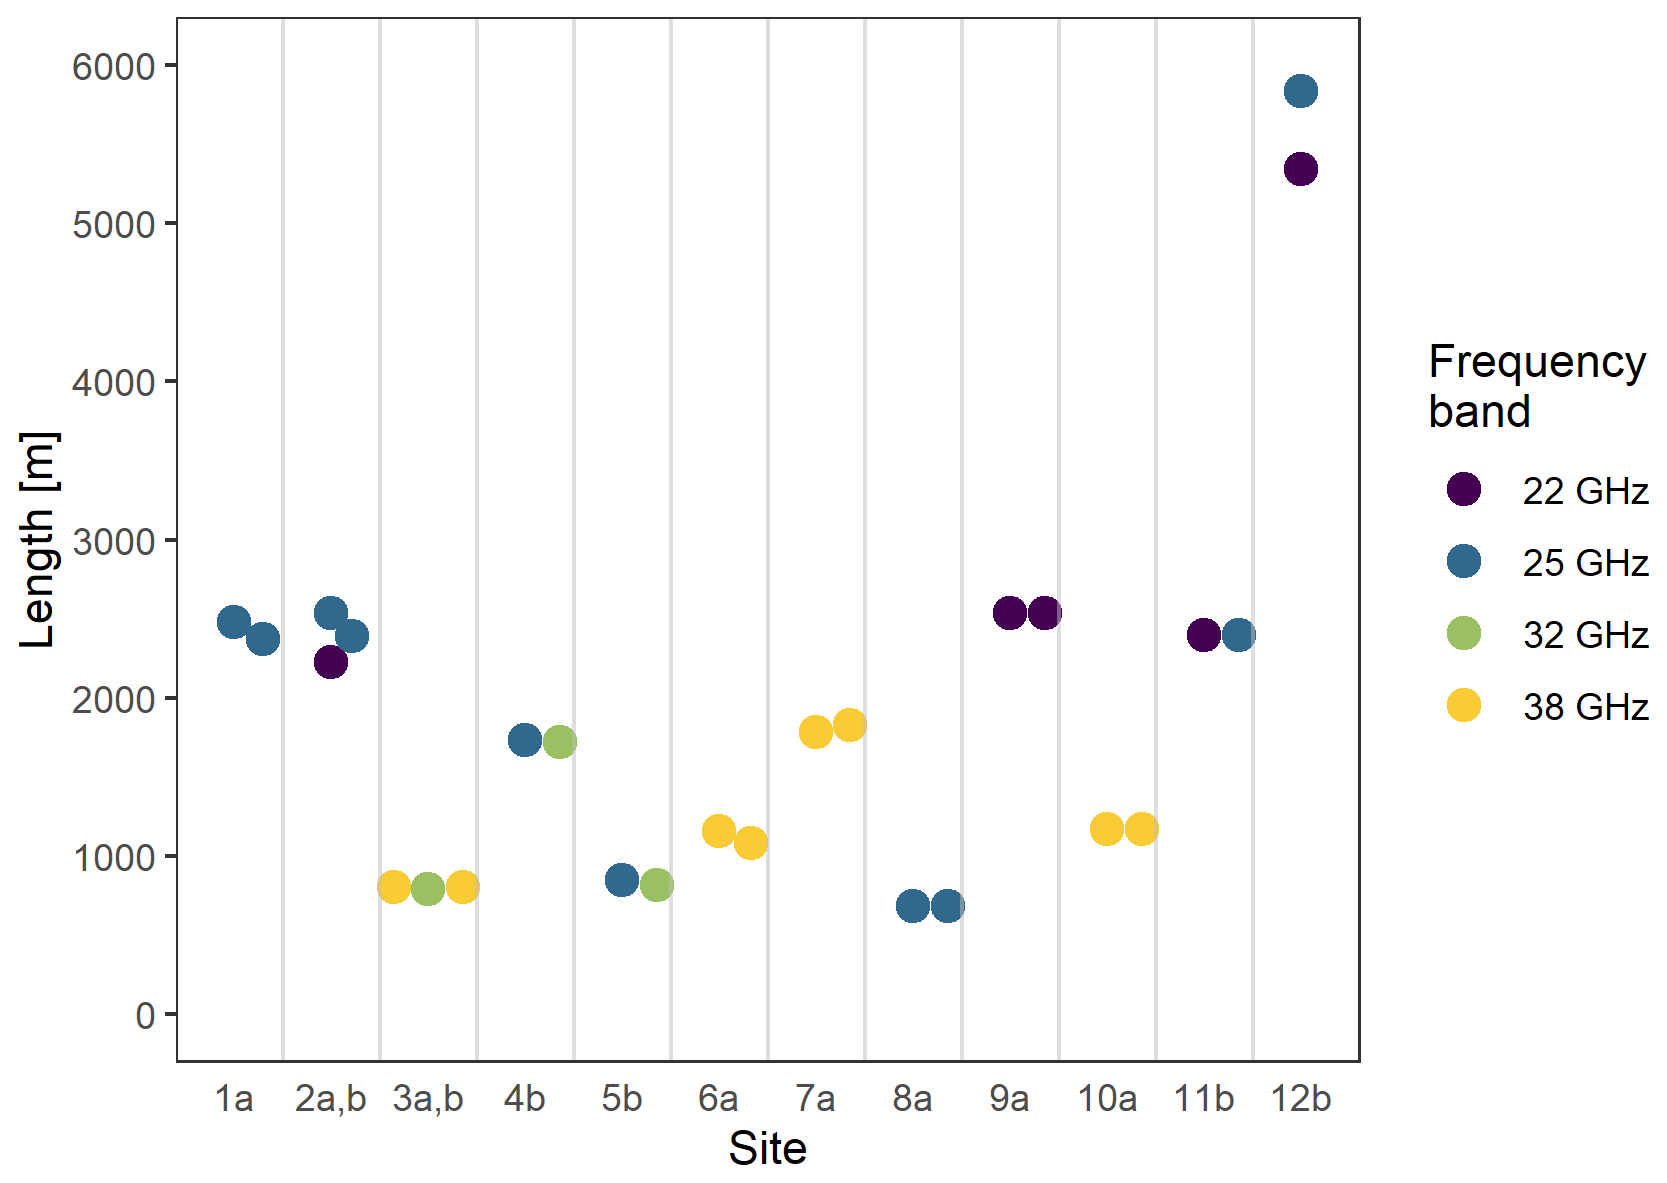
Figure 2Distribution of lengths and frequencies of CMLs used in this study. The colours indicate the frequency band at which CMLs operate. The “a” in the name of the site indicates pairs of CMLs with identical frequency bands, and “b” indicates pairs of CMLs with different frequency bands.
The CMLs are part of the telecommunication backhaul operated by T-Mobile Czech Republic a.s., which employs an Ericsson MINI-LINK platform (except for one Bosch Marconi PS UHP antenna at site 7a) featuring a duplex configuration with two sublinks with a frequency separation close to 1 GHz. The antenna radomes have a diameter of 30 or 60 cm. All the metadata including polarization are summarized in Appendix A. The transmitted and received data are collected by custom-made data acquisition software. The software assessed attenuation data approximately every 10 s from both sublinks of a single CML. TSL and RSL have a quantization of 1 and dB, respectively.
3.1.2 Gauge-adjusted radar rainfall
Adjusted weather radar observations are used for the optimization of the WAA model proposed by Pastorek et al. (2022) and for a visual classification of rainfall types.
Tipping bucket rain gauges are used for the adjustment of radar data. Prague's permanent municipal rain gauge network consists of 23 stations, operated and maintained by Pražské vodovody a kanalizace, a.s. Tipping bucket rain gauges have a sampling area of 500 cm2 and a resolution of 0.1 mm (MR3, METEOSERVIS v.o.s.). The rain gauges are maintained monthly and regularly dynamically calibrated. The recorded tips are transformed to 1 min rainfall intensity data.
Raw radar images are composites of two dual-polarized weather radars (CZRAD) operated by the Czech Hydrometeorological Institute (CHMI). Radar reflectivity is taken from an altitude of 2 km above sea level (constant-altitude plan position indicator, CAPPI, 2 km). The composite product has a spatial resolution of 1 km × 1 km and a temporal resolution of 5 min.
A 35 km × 35 km area covering Prague was selected from raw radar rainfall images (750 km × 550 km). Radar data were aggregated from 5 min to 1 h. Multiplicative bias correction was performed using the wradlib Python package (Heistermann et al., 2013) and data from 23 municipal rain gauge stations.
3.2 Rainfall events
This study uses a dataset collected during the monitoring of the period between July 2014 and October 2016. Winter periods are excluded as the CML signal would be attenuated by solid precipitation. In total, 33 rainfall events with a safety window of ±5 h were selected. Event durations range from 1 h to 1.5 d, which provides ∼ 304 h in total (of which 153 h is convective events and 151 h is stratiform events). Both stratiform events, with lower intensities having more uniform structures, and convective events, with spatially limited area and greater maximal intensities, are present in the collected data.
From a visual inspection of weather radar images and analysis of rain gauge rainfall intensities, events were divided into two groups: one consisting of convective rainfall events characterized by higher intensities, short durations, and a spatially limited area and the other consisting of stratiform rainfall events with lower intensities, longer duration, and a more extensive area. The maximum 5 min rainfall intensity was calculated for each of the 23 municipal rain gauges, as well as the median of these intensities. Figure 3 shows the maximum 5 min rainfall intensity of the 23 municipal rain gauges for each event and the event durations. The median maximum intensity during convective events was 68 mm h−1, and during stratiform events it was 21 mm h−1. The median durations of convective and stratiform events were 4 h (in the range of 1 to 18 h) and 12 h (in the range of 5 to 34 h), respectively. There were 10 stratiform events and 23 convective events, of which 21 were in the spring and summer seasons.
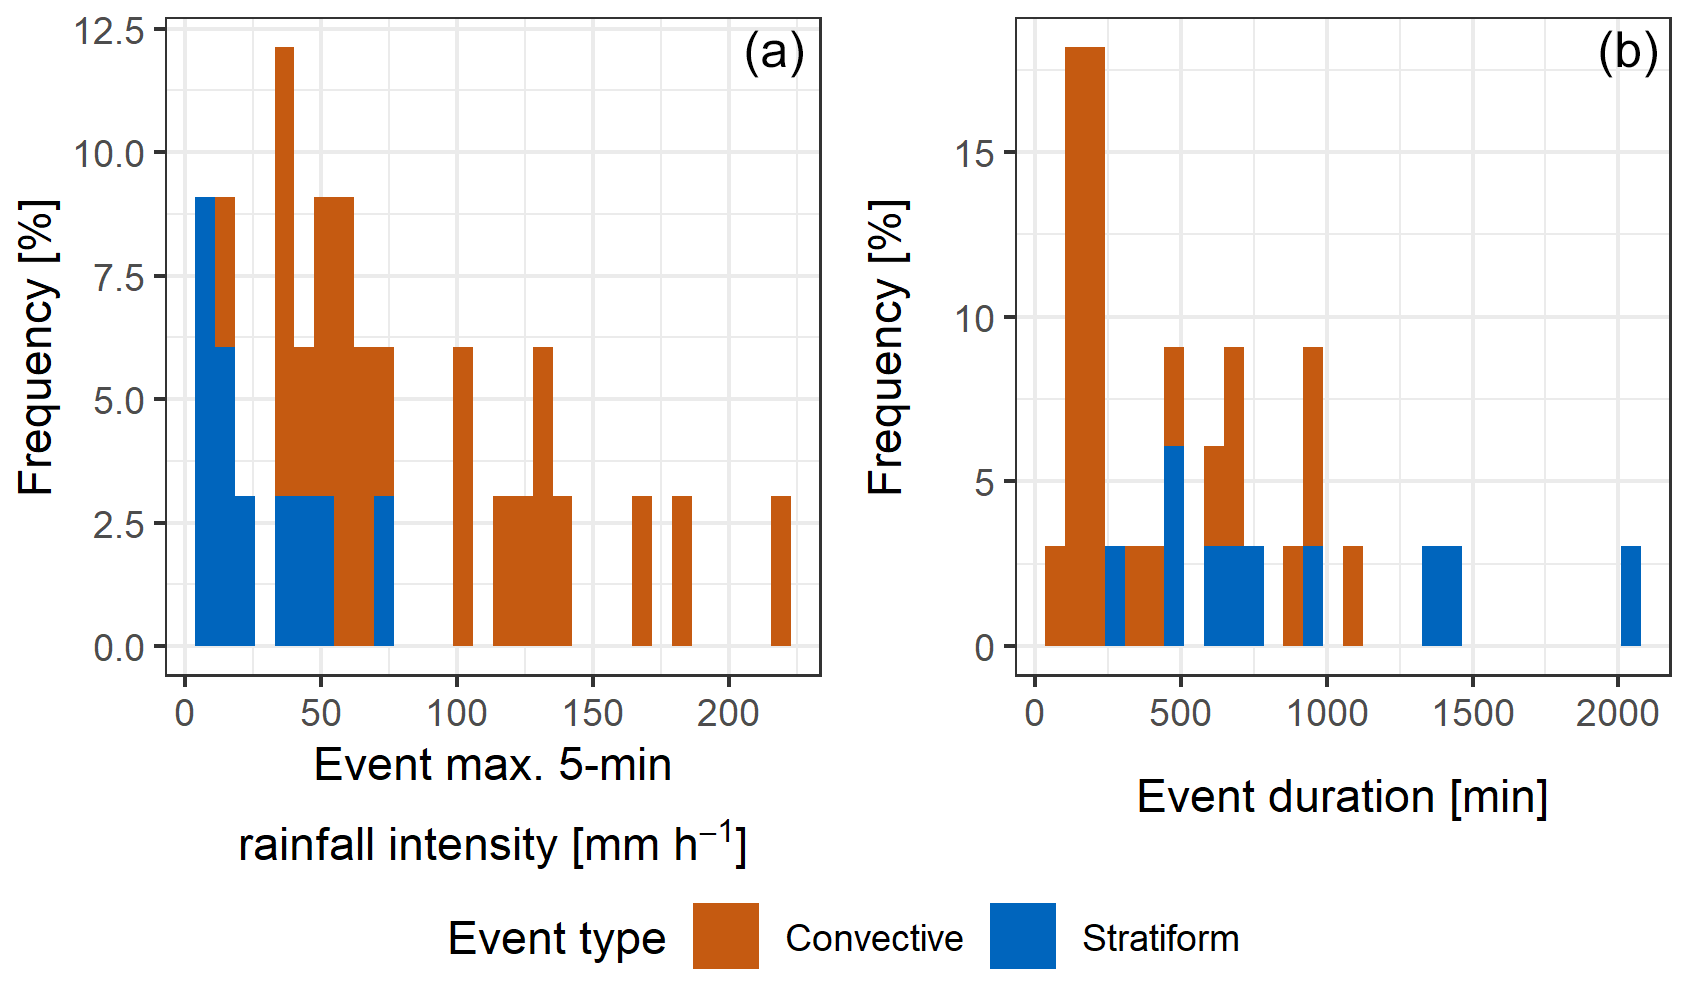
Figure 3Characteristics of 33 selected rainfall events. (a) Histogram of maximum event rainfall intensity based on 5 min moving average of 23 municipal rain gauge measurements. (b) Histogram of event durations. The colour indicates the type of rainfall event (convective or stratiform).
3.3 Processing of raw CML data
First, total losses are calculated as the difference between TSL and RSL (Eq. 1) and aggregated to 1 min resolution by averaging the the assessed data (∼ 10 s). The data undergo a visual inspection of hardware-related errors and erratic behaviour. Issues, such as degraded sublink resolution, sudden change in baseline, and constant signal level during a rainfall event, are flagged (similar to Fencl et al., 2020) and removed from the processing.
Baseline B for a certain time step n is estimated as a centred 10 d moving average of the total loss:
where n is the time step of interest (the centre of the 10 d period), and p is the number of time steps in a 5 d period (half of the 10 d period).
Further, a WAA model is used and explicitly derived from rainfall intensity Rest, which is not available directly but is estimated from observed attenuation (Pastorek et al., 2022):
where C (dB) is the maximum Aw, and d and z are power law parameters. Parameter d is 0.1. Parameters C and z are optimized for all the CMLs together by minimizing the difference between CML rain rates with WAA correction and reference rain rates along the CML path obtained from gauge-adjusted weather radar. Reference rain rates were calculated as the mean of rain rates along a CML path weighted by a CML path length intersecting radar product pixels. The parameters for all links are optimized to minimum root mean square error (RMSE) between the CML and radar rain rates at hourly time steps. The optimization uses complete hourly observations from the same rainfall events as those used in the analysis. Having estimated both baseline attenuation and WAA, the specific attenuation kSUB (dB km−1) can be calculated using Eqs. (2) and (3). Rainfall intensity is calculated for individual sublinks using Eq. (4) with parameters taken from ITU recommendations (ITU-R, 2005). The mean rainfall intensity of the two sublinks is used for the evaluation of the collocated CMLs.
3.4 Quantitative evaluation
CML measurement consistency is evaluated by comparing the observations of the CML pairs during 33 events.
First, rain-induced attenuations of collocated CMLs operating at identical frequency bands are compared. The mean attenuation of CML sublinks is used for this purpose. Second, the estimated rain rates from the collocated CMLs are compared. Sites with identical- and different-frequency-band pairs are evaluated separately. Third, the effect of time aggregations (1, 5, 15, 30, and 60 min) on the consistency of CML rain rates is evaluated, and fourth, the evaluation is performed separately for events of different rainfall type.
Data visualizations via scatterplots are complemented with metrics for the overall evaluation, i.e. Pearson correlation coefficient r (hereafter referred to as correlation) and root mean square error (RMSE). Furthermore, double-mass curves and relative error are used. All time steps in which at least one of the CMLs in the pair is lacking data are excluded from the evaluation.
The correlation expresses the level of the linearity relationship between collocated CML observations. As none of the collocated observations can be considered to be a true reference, RMSE and relative error reflect only the agreement of two measurements and are quantified with respect to one CML from the pair, which is further referred to as CML 1. In the case of the “b” sites, CML 1 is always the CML with the lower frequency in the pair. In this context, the RMSE reflects the deviation or random component rather than an error from the truth. Similarly, the relative error and double-mass curves assess systematic deviations between the CMLs. The double-mass curve compares rainfall cumulation of two datasets and is used to observe the consistency of the measurements during the observation period.
4.1 Evaluation of CML pairs operating at identical frequency bands
Eight sites contain CMLs operating at pairwise-identical frequency bands (Figs. 1 and 2). Figure 4 demonstrates a single event with excellent agreement between two collocated CMLs. There is clear similarity in the time series of the collocated sensors for both rain-induced attenuation and rainfall intensity. However, relatively higher differences can be seen for lower rainfall intensities.
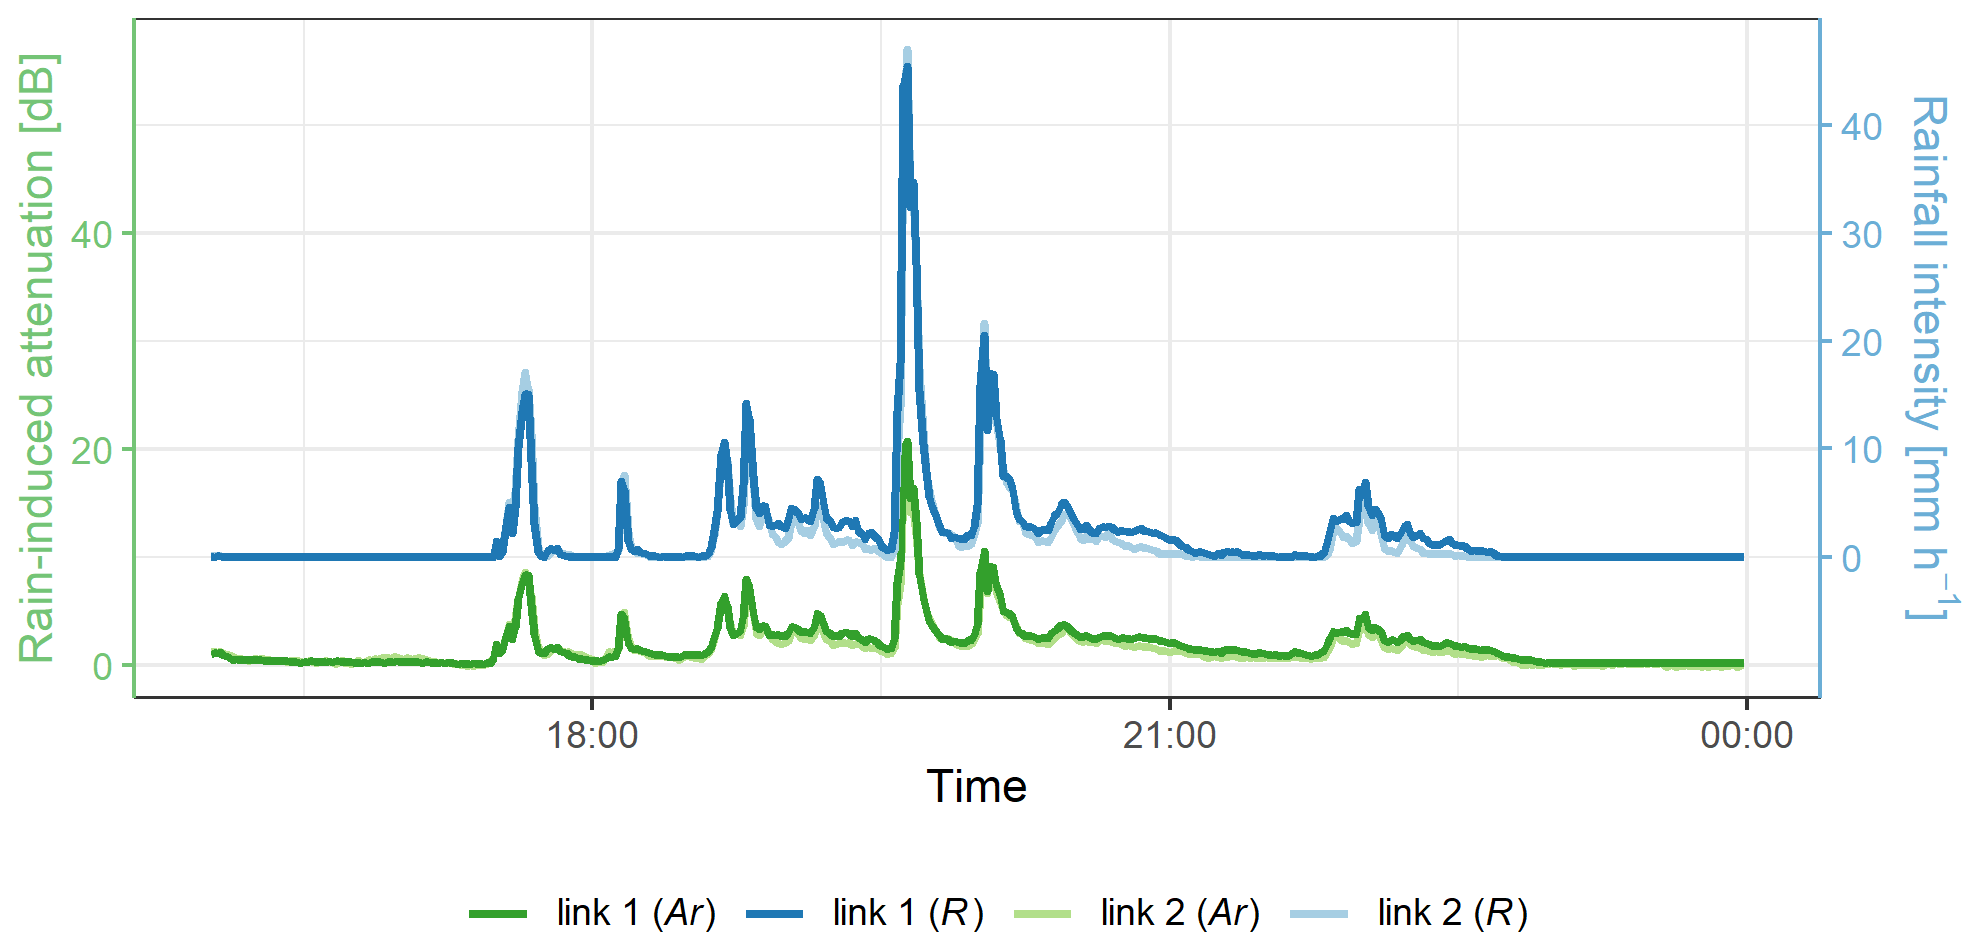
Figure 4Example of a time series of collocated independent sensors at site 2a for (green) rain-induced attenuation and (blue) rainfall intensity on 21 July 2014.
Figure 5 shows all eight CML pairs and shows a high correlation of 0.98 and low RMSE of 0.4 dB of rainfall-induced attenuation, on average, for all pairs of CMLs. Within the eight pairs, the correlation ranges from 0.96 to 0.99, and RMSE ranges from 0.2 to 0.5 dB. Overall, RMSE in rain-induced attenuation is 0.4 dB, which is close to signal quantization. The effect of the hardware on observed attenuation is similar within the CML pairs. This indicates that the component of random error in total CML observation error is low.
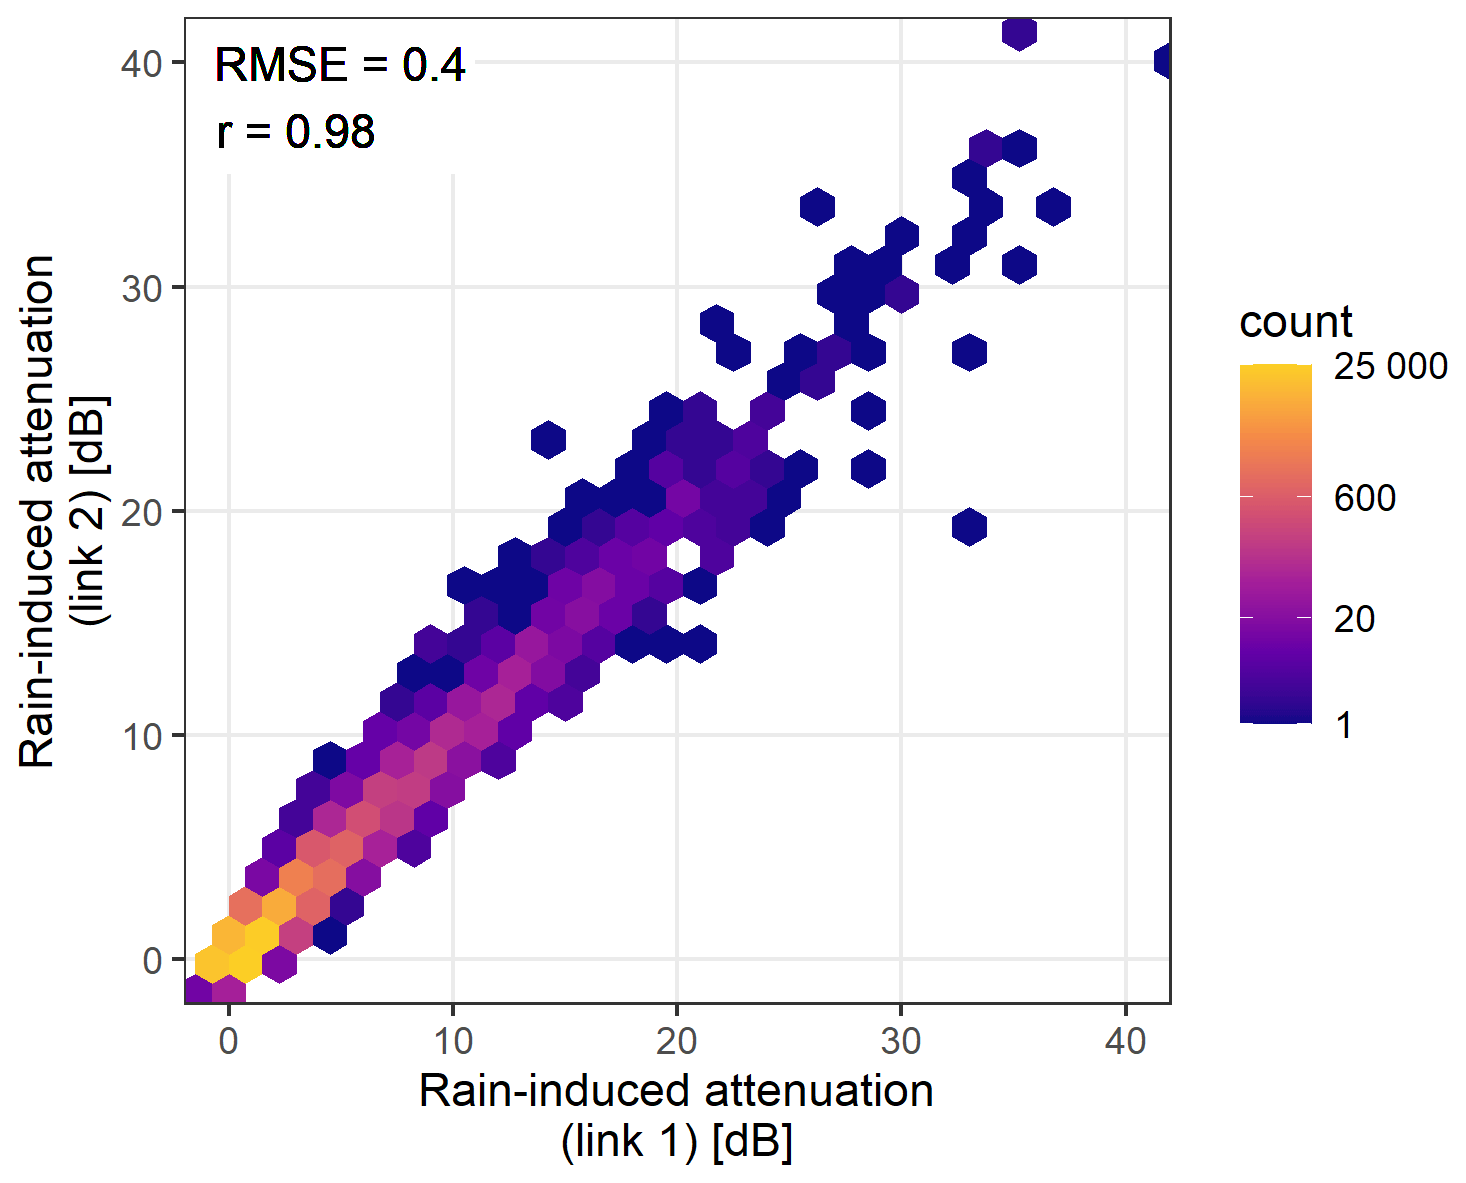
Figure 5Density scatterplot of rain-induced attenuation for eight collocated CML pairs with identical frequencies. The axis range of the plot is cut to 40 dB as there were only four data points out of this range. The performance metrics (correlation and RMSE in decibels) are in the top left corner.
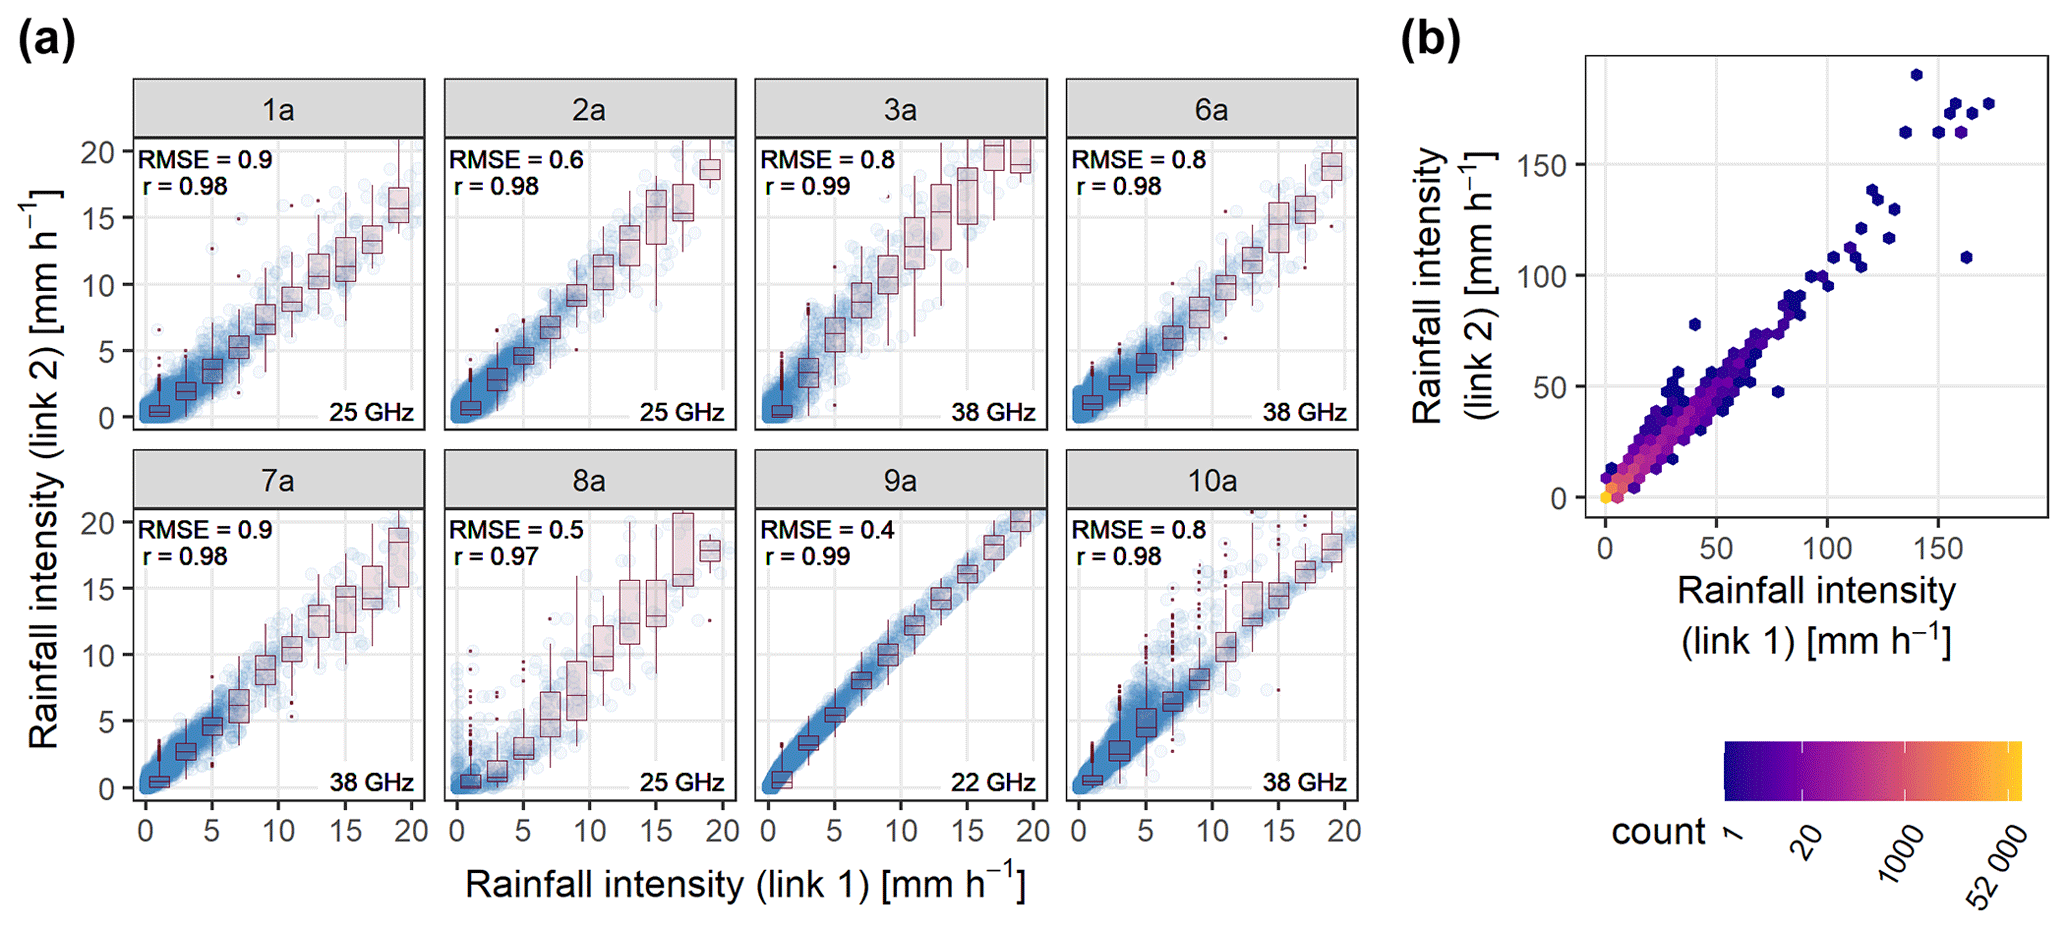
Figure 6(a) Scatterplot of CML-derived rainfall intensity for eight collocated CML pairs with identical frequencies. Values under 20 mm h−1 are shown. The boxplots show a spread when binned to 2 mm h−1 bins by link 1. The performance metrics (correlation and RMSE in millimetres per hour) are in the top left corner, and the frequency band is indicated in the bottom right corner for each site. (b) Density scatterplot of rainfall intensity for all pairs at the full range of values.
Figure 6 shows scatterplots, and performance measures of rainfall intensities confirm the small variability in independent collocated measurements. The correlation ranges from 0.97 to 0.99, and RMSE is between 0.4 and 0.9 mm h−1. The highest RMSE is for the least sensitive CMLs at site 7a (sensitivity of 0.7 dB mm−1 h−1) and site 1a (sensitivity of 0.4 dB mm−1 h−1). Sites 2a and 6a, with the same sensitivity as 1a, reach, inconsistently, RMSEs of 0.6 and 0.8 mm h−1.
The standard deviation of the binned rainfall intensities (by 2 mm h−1) is in the range of 0.7 to 1.7 mm h−1 for rainfall intensities under 10 mm h−1, whereas for rainfall intensities between 10 and 20 mm h−1 it increases slightly to a range of 1.0 to 3.4 mm h−1. For all heavy-rainfall intensities over 20 mm h−1 it falls in the range of 1.0 to 4.9 mm h−1. The median in the bins follows the direct proportionality well up to 50 mm h−1.
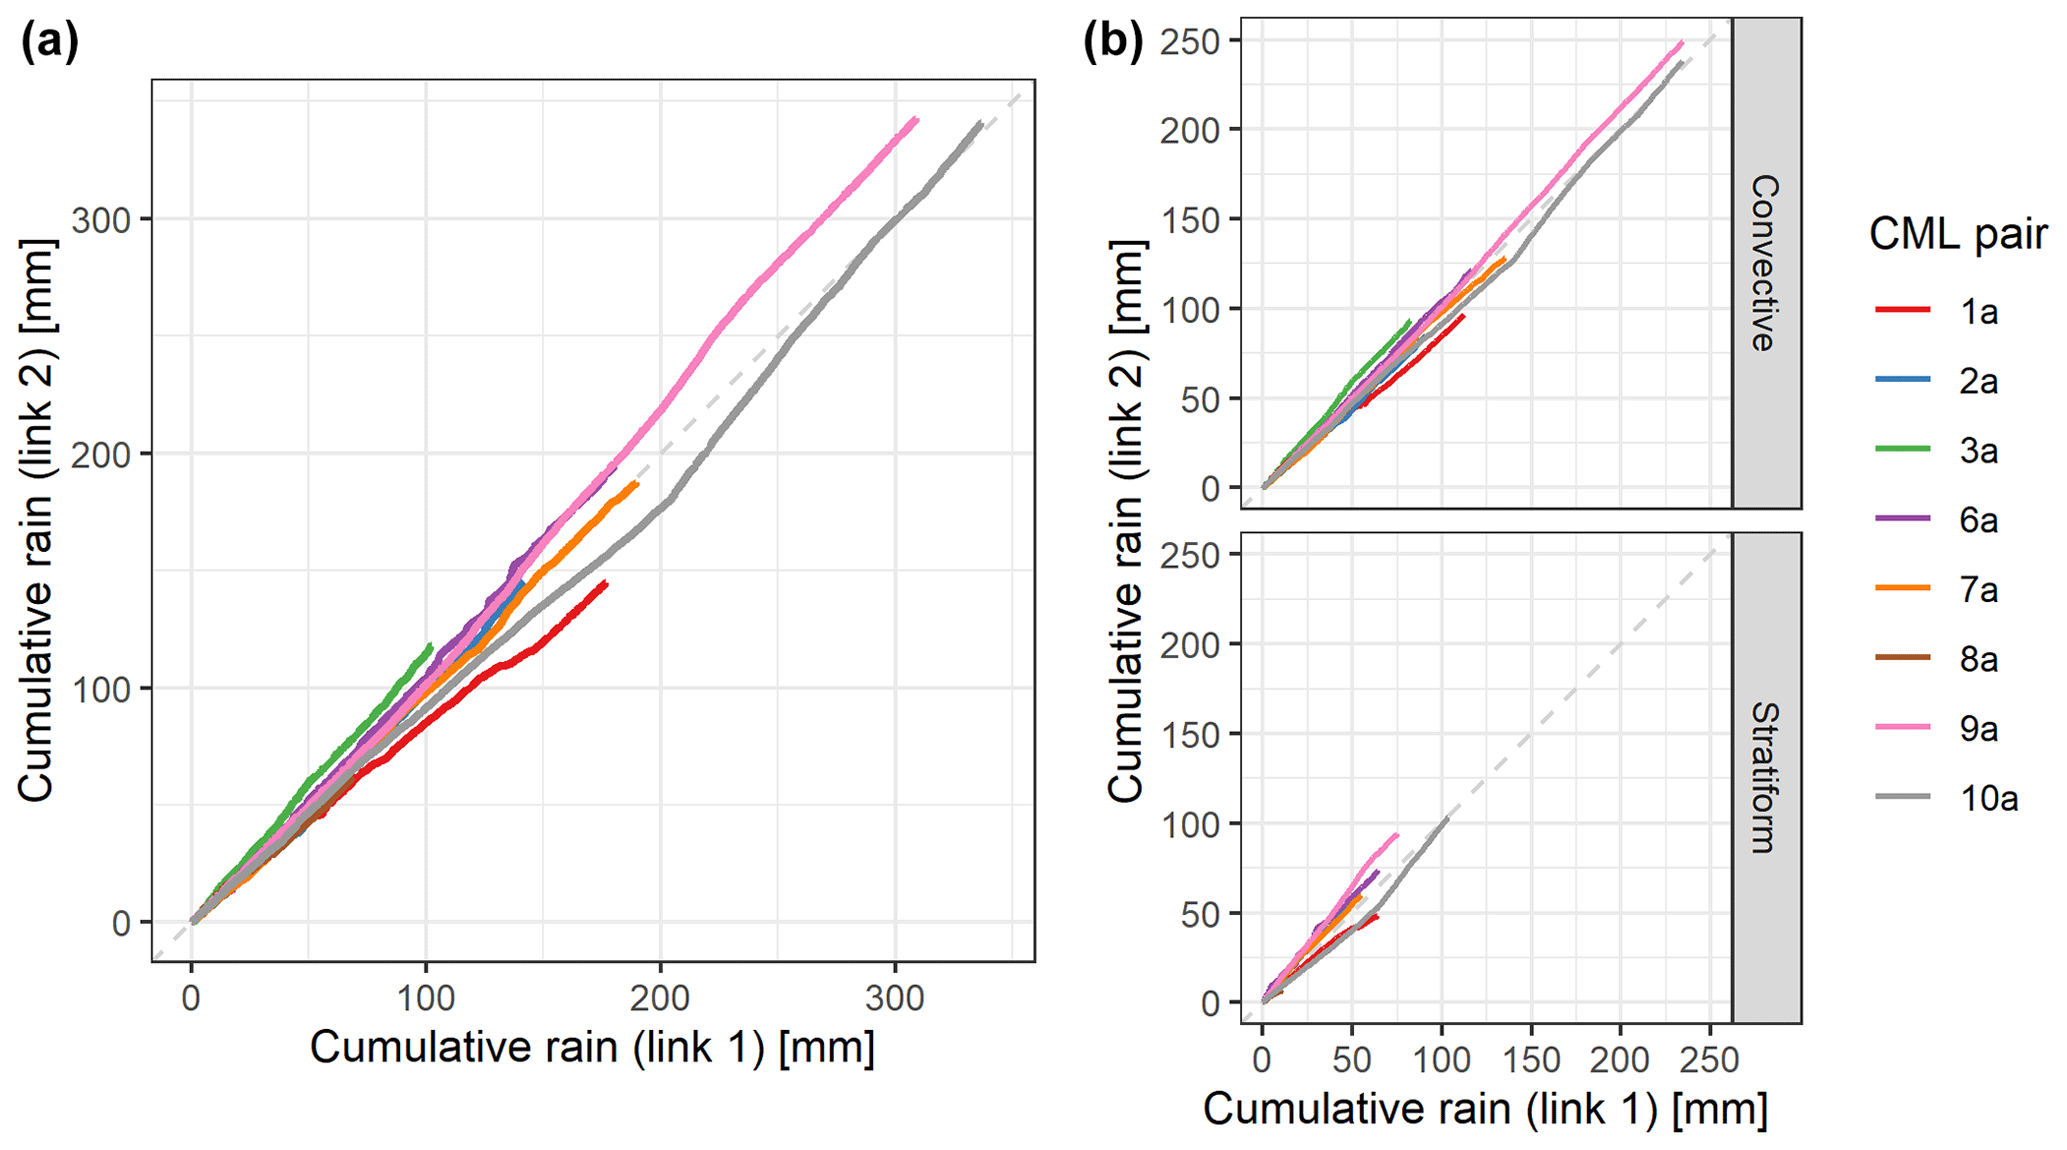
Figure 7(a) Double-mass curve for collocated sensors operating at identical frequency bands. (b) The same, but the convective and stratiform rainfall types are separated.
To explore the systematic component of the measurement deviations, double-mass curves of cumulative rain of the CML pairs are displayed in Fig. 7a. The lines show the main direction of the curves parallel to the diagonal, which indicates synchronized systematic errors in the independent sensors. Distinguishing the convective and stratiform events does not highlight any change in overall good fit (Fig. 7b). However, changes in the trend of systematic errors can be observed over the course of time. For example, for the pair with the highest cumulative rainfall (site 10a), link 2 observes systematically lower rain rates than link 1 up to rainfall depths around 200 mm; however, this trend then changes, resulting in very low relative error between overall cumulative rainfall events at the end of the observation period. Overall, the pairs have a relative error between 0.01 and 0.18.
4.2 Evaluation of CML pairs operating at different frequency bands
Six sites contain pairs of CMLs operating at dissimilar frequency bands (indicated by “b” in the site name; see Figs. 1 and 2). At sites 2b, 11b, and 12b the pairs combine 22 and 25 GHz frequency band CMLs. Site 3b combines 32 and 38 GHz frequency band CMLs, while sites 4b and 5b combine 25 and 32 GHz frequency band CMLs.
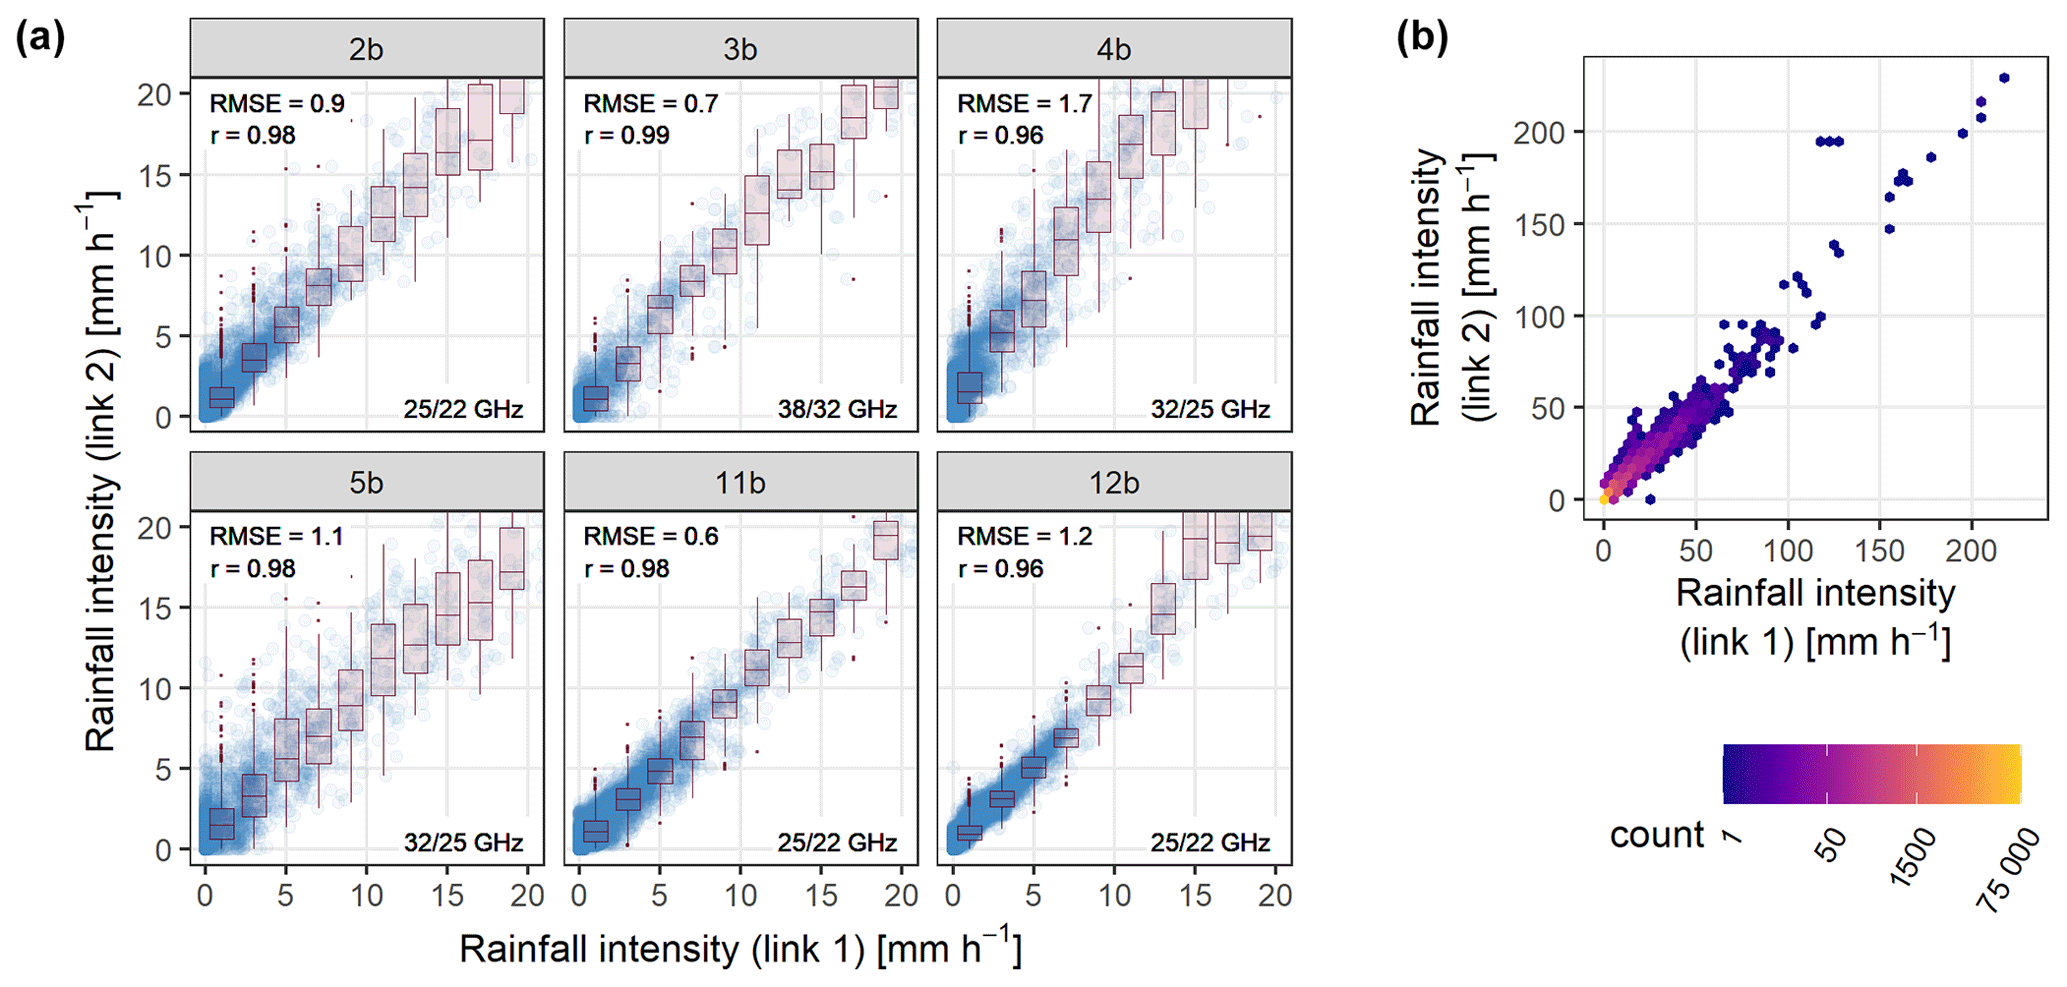
Figure 8(a) Scatterplot of CML-derived rainfall intensity for six collocated CML pairs with different frequencies. Values under 20 mm h−1 are shown. The boxplots show a spread when binned to 2 mm h−1 bins by link 1. The performance metrics (correlation and RMSE in millimetres per hour) are in the top left corner, and the frequency band is indicated in the bottom right corner for each site. (b) Density scatterplot of rainfall intensity for all pairs at the full range of values.
Figure 8 shows a high correlation of 0.98 and low RMSE of 1.0 mm h−1, on average, for all pairs of CMLs. Within the six pairs, the correlation ranges from 0.96 to 0.99, and RMSE ranges from 0.6 to 1.7 mm h−1. Sites 4b, 5b, and 12b indicate slightly higher RMSE (1.7, 1.1, and 1.2 mm h−1). We did not find any clear link between CML characteristics (length, frequency) and their magnitude of RMSE or other performance metrics. Overall, the performance worsened compared to the pairs operating at an identical frequency band.
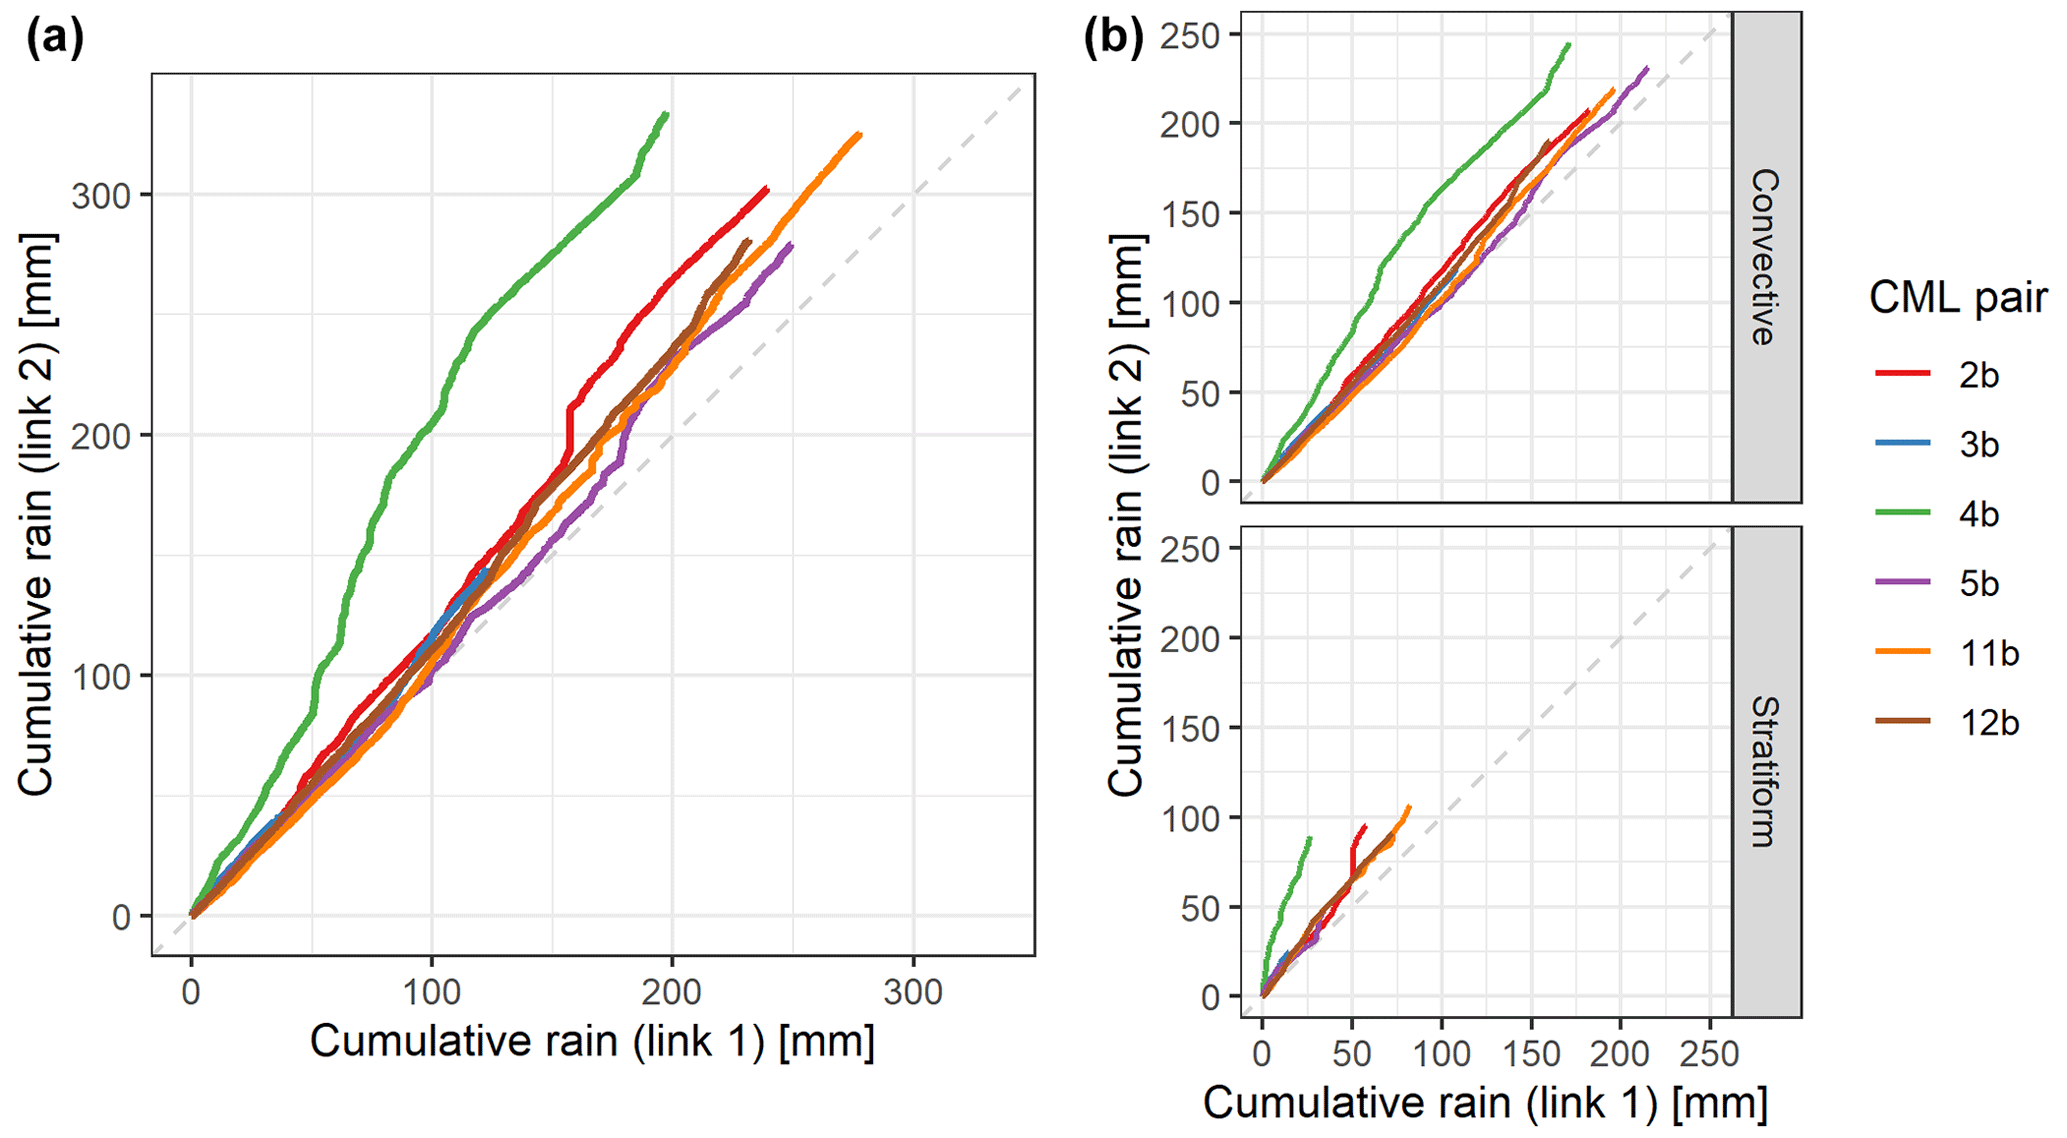
Figure 9(a) Double-mass curve for collocated sensors operating at different frequency bands. (b) The same, but the convective and stratiform rainfall types are separated.
The double-mass curves of cumulative rain of the CML pairs are also displayed for “b” sites (Fig. 9). All missing time steps for one of the links in the pair were excluded. The lines show the main direction of the curves parallel to the diagonal, which indicates agreement of the independent sensors. However, CMLs operating at higher-frequency bands (link 2) tend to overestimate a CML operating at a lower-frequency band (link 1). The worst agreement between CML pairs is observed at site 4b, where compared to the 25 GHz CML, the 32 GHz CML overestimates more than at other sites, with a relative error of 0.69. However, there are periods with direct-proportionality behaviour; i.e. the curve is parallel to the line indicating a perfect fit. An identical set-up (32 and 25 GHz CMLs) at site 5b, with the same differences in frequency bands as 4b, does not mirror such a strong tendency for overestimation, with a relative error of only 0.12. Furthermore, there are also short, steep rises in the courses of three other double-mass curves (sites 2b, 5b, and 11b). Two increases are associated with the longest stratiform event at sites 2b and 5b and are caused by systematic underestimation of rainfall intensity by link 1 in the pairs, while link 2 perceives low rainfall intensities (up to 4 mm h−1) for a long time (approximately 11 h of the event). The third steep rise is associated with a convective event at site 11b. In that event, a similar pattern occurred; link 2 perceives low rainfall intensity (around 2 mm h−1) for approximately 4 h between two rainfall peaks of the convective event. Overall, the pairs have a relative error between 0.12 and 0.26 excluding site 4b. The relative error is higher than in the case of sites with identical-frequency CMLs in the pair.
A different frequency could affect wet-antenna attenuation. Leijnse et al. (2008) presented a ratio of rain-induced attenuation to wet-antenna attenuation, where the dominance of the numerator to the denominator changes with respect to the frequency. The CMLs at “b” sites are separated by 3 GHz (25 and 22 GHz), 6 GHz (38 and 32 GHz), and 7 GHz (32 and 25 GHz); however, the WAA model used a single set of parameters for all CMLs.
Berne and Uijlenhoet (2007) demonstrated the effects of DSD, which might be significant for inadequate coefficients in power law relationship. They showed that DSD-related errors are dependent on CML frequency. This could partly explain the lower agreement between CML pairs of different frequencies observed in this study.
4.3 Effect of the type of the event and time aggregation
Both convective and stratiform rainfall events (Fig. 10) have a similar quality of the agreement measured by the correlation coefficient (0.92–0.98). RMSE is in the range of 0.5 to 1.4 mm h−1 for all combinations of rainfall and site types. RMSE decreases from 1.1 to 0.6 mm h−1 for stratiform events, as the rainfall intensity is lower for such events.
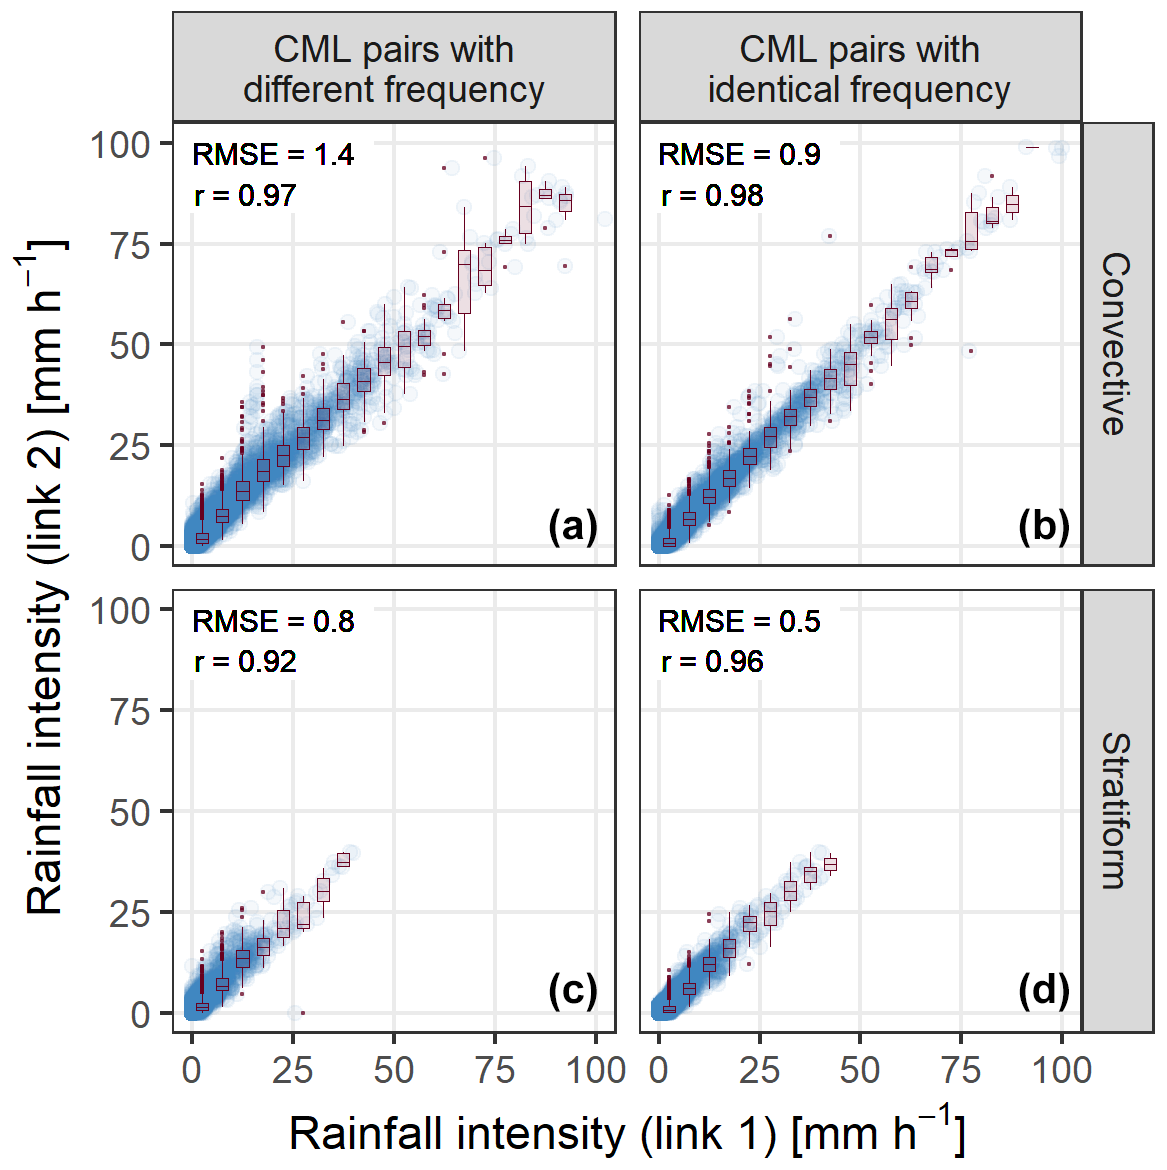
Figure 10Scatterplots of CML-derived rainfall intensity for collocated CML pairs of (a, c) different frequency bands and (b, d) identical frequency bands at 1 min temporal resolution for (a, b) convective and (c, d) stratiform rainfall events. The performance measures (correlation and RMSE in millimetres per hour) are in the top left corner. Values under 100 mm h−1 are shown.
RMSE and correlation were calculated for time aggregations of 1, 5, 15, 30, and 60 min (Fig. 11) for both rainfall types (convective and stratiform) and for both types of sites (sites “a”, including the sites with identical-frequency-band CMLs, and sites “b”, with CMLs with different frequency bands). The aggregation brings a reduction in noisiness. The correlation coefficient is consistently greater than 0.92. The increase in correlation is more pronounced for the time aggregation between 1 and 5 min. Further aggregation did not bring any additional improvement in this performance measure. The agreement of devices expressed as RMSE improves particularly quickly for convective rainfall types in aggregation between 1 and 15 min from an RMSE of 0.9 to 0.6 mm h−1 for pairs of identical frequency bands and from 1.3 to 1.1 mm h−1 for pairs of different frequency bands. The RMSEs of stratiform rainfall types do not rapidly improve with greater time aggregation, but the enhancement occurs linearly with greater time aggregation. On the other hand, for convective rainfall types improvement accelerates, and it is even more pronounced for CML pairs at an identical frequency band.
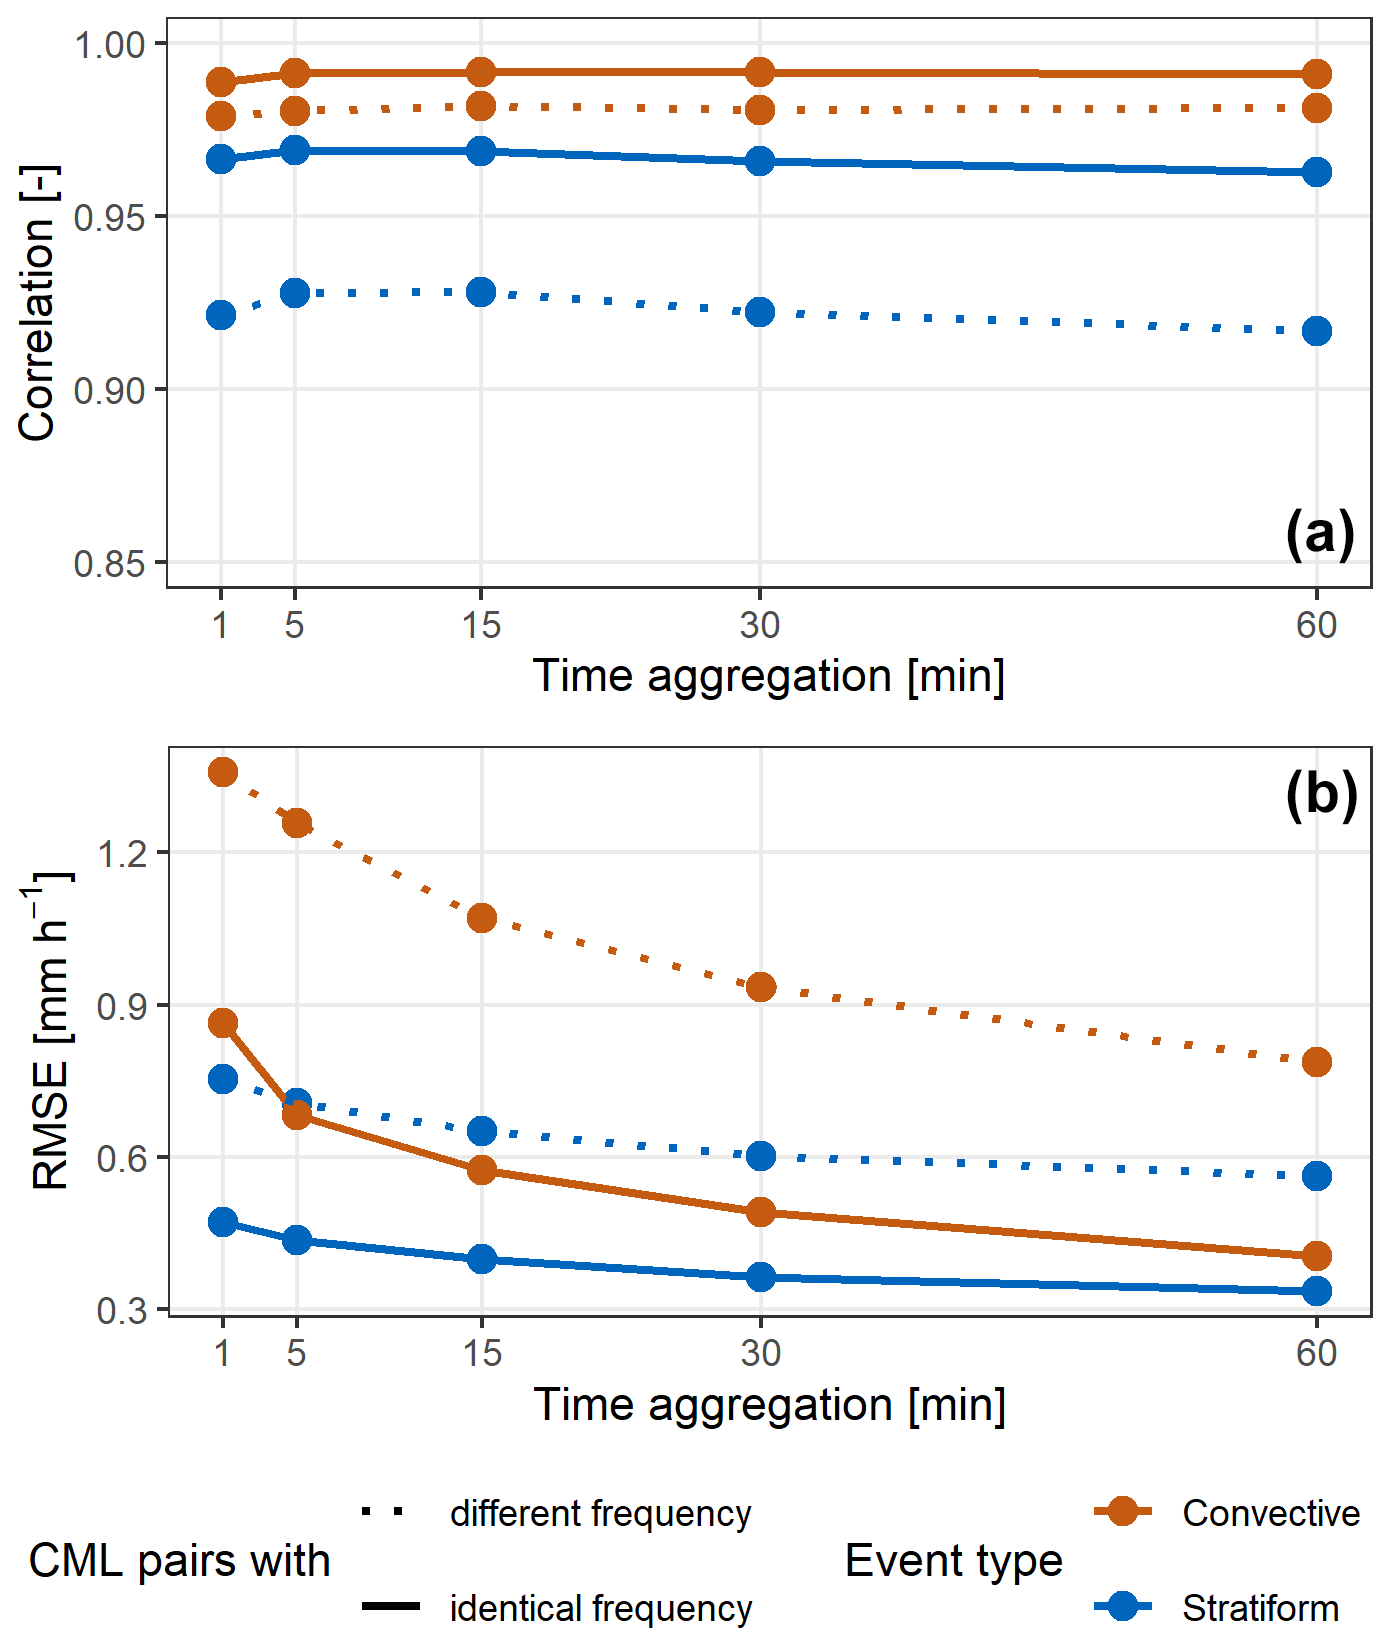
Figure 11Influence of time aggregation (1, 5, 15, 30, and 60 min) on (a) correlation and (b) RMSE in millimetres per hour.
In general, the collocated CMLs are in excellent agreement. The rain-induced attenuation error in CML pairs operating at identical frequency bands is 0.4 dB, which is close to the signal quantization level. The random error in rain-induced attenuation is minor compared to the systematic errors. The excellent agreement between collocated CMLs of the same frequency shows that CML hardware under the same atmospheric conditions provides homogeneous measurements of rain-induced attenuation.
The errors in collocated CMLs operating at different frequencies are larger. Relative errors in estimated rain rate depths are 0.12–0.24, compared to 0.01–0.18 by CMLs of identical frequency. The increase in the relative error can be partly explained by the different sensitivity of the k–R relationship accuracy to the variable DSD along a CML path. Berne and Uijlenhoet (2007) simulated this effect and reported that systematic errors in rainfall depths (compared to the true rainfall) are relatively insensitive to CML path length and, for frequency ranges used in this study, decrease with increasing frequency by approximately −0.7 mm h−1 GHz−1. For the collocated CMLs operating at different frequency bands, the frequency separation reaches 3 to 7 GHz, and one can thus expect DSD-related bias in the range of 2 to 5 mm h−1. The rest of the relative error is probably attributed to the hardware and differences in WAA. As this “residual relative error” is in a similar range to the collocated CMLs of the same frequency, we suppose that CML frequency has a relatively low impact on the WAA magnitude and pattern. In general, all the collocated CMLs are affected by almost the same WAA.
The errors reported in this study are attributed to hardware inhomogeneity and have a similar magnitude to the errors reported by the studies evaluating CML performance against independent references in dedicated experiments with an optimal WAA model. For example, a dedicated experiment with an accurate reference along the CML path reported errors of 1.4 mm h−1 (constant WAA model) to 0.7 mm h−1 (optimal dynamic model) for the 38 GHz CML, which is mainly attributed to WAA (Schleiss et al., 2013). The errors reported in larger case studies are, however, higher. The measurement accuracy errors might be partly explained by larger hardware inhomogeneity (de Vos et al., 2019). However, a substantial portion of these errors are probably also attributed to the uncertainties in the reference measurements, which are difficult to quantify in large-scale evaluations, and thus none of these studies explicitly account for them.
Other aspects affecting the performance of collocated CMLs, such as different hardware, size of the dataset, and different complexity of the data processing, are discussed in the following subsections.
5.1 Effect of different hardware
There were three sites of collocated sensors operating at identical frequency bands but with a different hardware set-up. The differences at the three sites are as follows. The antenna radome at one node at site 1a (25 GHz CMLs) has a diameter of 0.6 m, unlike the 0.3 m diameters of the three remaining nodes. The antenna radome at one node at site 7a (38 GHz CMLs) is a Bosch Marconi PS UHP antenna, whereas the MINI-LINK platform is used at the rest of the nodes. Each CML in the pair at site 10a (38 GHz CMLs) has one node with an antenna radome diameter of 0.6 m, unlike the 0.3 m diameter of the other nodes.
Despite the differences in hardware, CML pairs at these sites do not exhibit any differences in performance for rain-induced attenuation compared to the sites with an identical hardware set-up. RMSE is in the range of 0.3 to 0.5 dB, and the correlation is between 0.96 and 0.98, which is in line with the other “a” sites discussed in Sect. 4.1.
The antenna radomes at site 12b are 0.6 m in diameter, which is the only distinction in antenna size or type within the metadata of the “b” sites. Together with the almost twice-as-long CML paths at other sites, this makes this site unique in the dataset. Compared to the other sites combining 25 and 22 GHz CMLs, the results at 12b are not as good, with RMSE of 1.2 mm h−1 and a correlation of 0.96 (sites 2b and 11b have RMSEs of 0.6 and 0.9 mm h−1, and the correlation for both is 0.98). From the material used, it cannot be concluded whether the difference is caused by different CML path length (sensitivity) or the different antenna radome.
Overall, the differences in hardware did not cause a significant decline in the performance of independent sensors. It needs to be noted, though, that the dataset contains only three sites of CMLs operating at identical frequency bands using different hardware, and each of the hardware differences is unique. Notably, the dedicated experiment presented by van Leth et al. (2018), for example, demonstrated differences in Nokia and Rutherford Appleton Laboratories (RAL) hardware operating at almost the same frequency.
5.2 Size of the dataset
The size of the dataset is affected by the data availability of both independent sensors and the visual inspection of erratic behaviour. Therefore, not all sites are equally represented in the dataset. Data availability is summarized in Appendix A. Overall, there was higher availability for the “b” sites of CMLs operating at different frequency bands, with a mean availability of 80 % (57 %–100 %). The availability for “a” sites ranges from 46 % to 100 %, with a mean of 66 %.
The lower number of values for the “a” sites is particularly striking in plots of the double-mass curves (Figs. 7 and 9), where cumulative rainfall reaches 190 mm on average, in contrast to the “b” sites, where it reaches 248 mm on average.
The data availability for convective events is in the range of 52 % to 100 % (with a mean of 75 %), and for stratiform events it is in the range of 40 % to 100 % (with a mean of 69 %). Subsetting the sites independently, the mean difference in the availability of convective and stratiform event types is 6 % (with a range of −24 % to 23 %). Thus, convective events are slightly better represented across all the sites. It is worth mentioning that the durations of the periods of both event types selected for the study are similar (153 h for convective events and 151 h and 15 min for stratiform events).
5.3 Effect of different processing methods
To demonstrate the effect of different data processing methods and their complexity, four CML processing methods were tested on a smaller dataset with cumulative rainfall of 76 mm in September 2014. In addition to the rainfall retrieval procedure described above (Eqs. 1–6, referred to as method 1), three other modifications of the procedure were tested and evaluated on a 1-month-long subset of the data. They differ in the algorithm used for the baseline and/or WAA estimation:
-
The baseline is estimated as a monthly 1 % quantile of the total losses and a constant WAA (1.5 dB) separation model (referred to as method 2).
-
The constant baseline model is based on the preceding dry period (a centred 60 min window of rolling standard deviation suggested by Schleiss and Berne, 2010) and the semiempirical WAA model proposed by Leijnse et al. (2008) for WAA (referred to as method 3).
-
The baseline is the same as the previous in combination with the time-dependent WAA model with parameters suggested by Schleiss et al. (2013) (referred to as method 4).
As the complexity of processing methods increases, performance metrics improve. One needs to be aware that the more a method reduces observed attenuation, the more zeros are in the obtained data, which would inadequately improve performance metrics. The performance comparing the collocated measurements of the methods is summarized in Table 1. Setting the subset criteria to light rainfall (< 5 mm h−1) time steps for at least one CML of the pair, method 1 is as good as or outperforms the other methods.
Table 1Comparison of the performance of four processing methods.
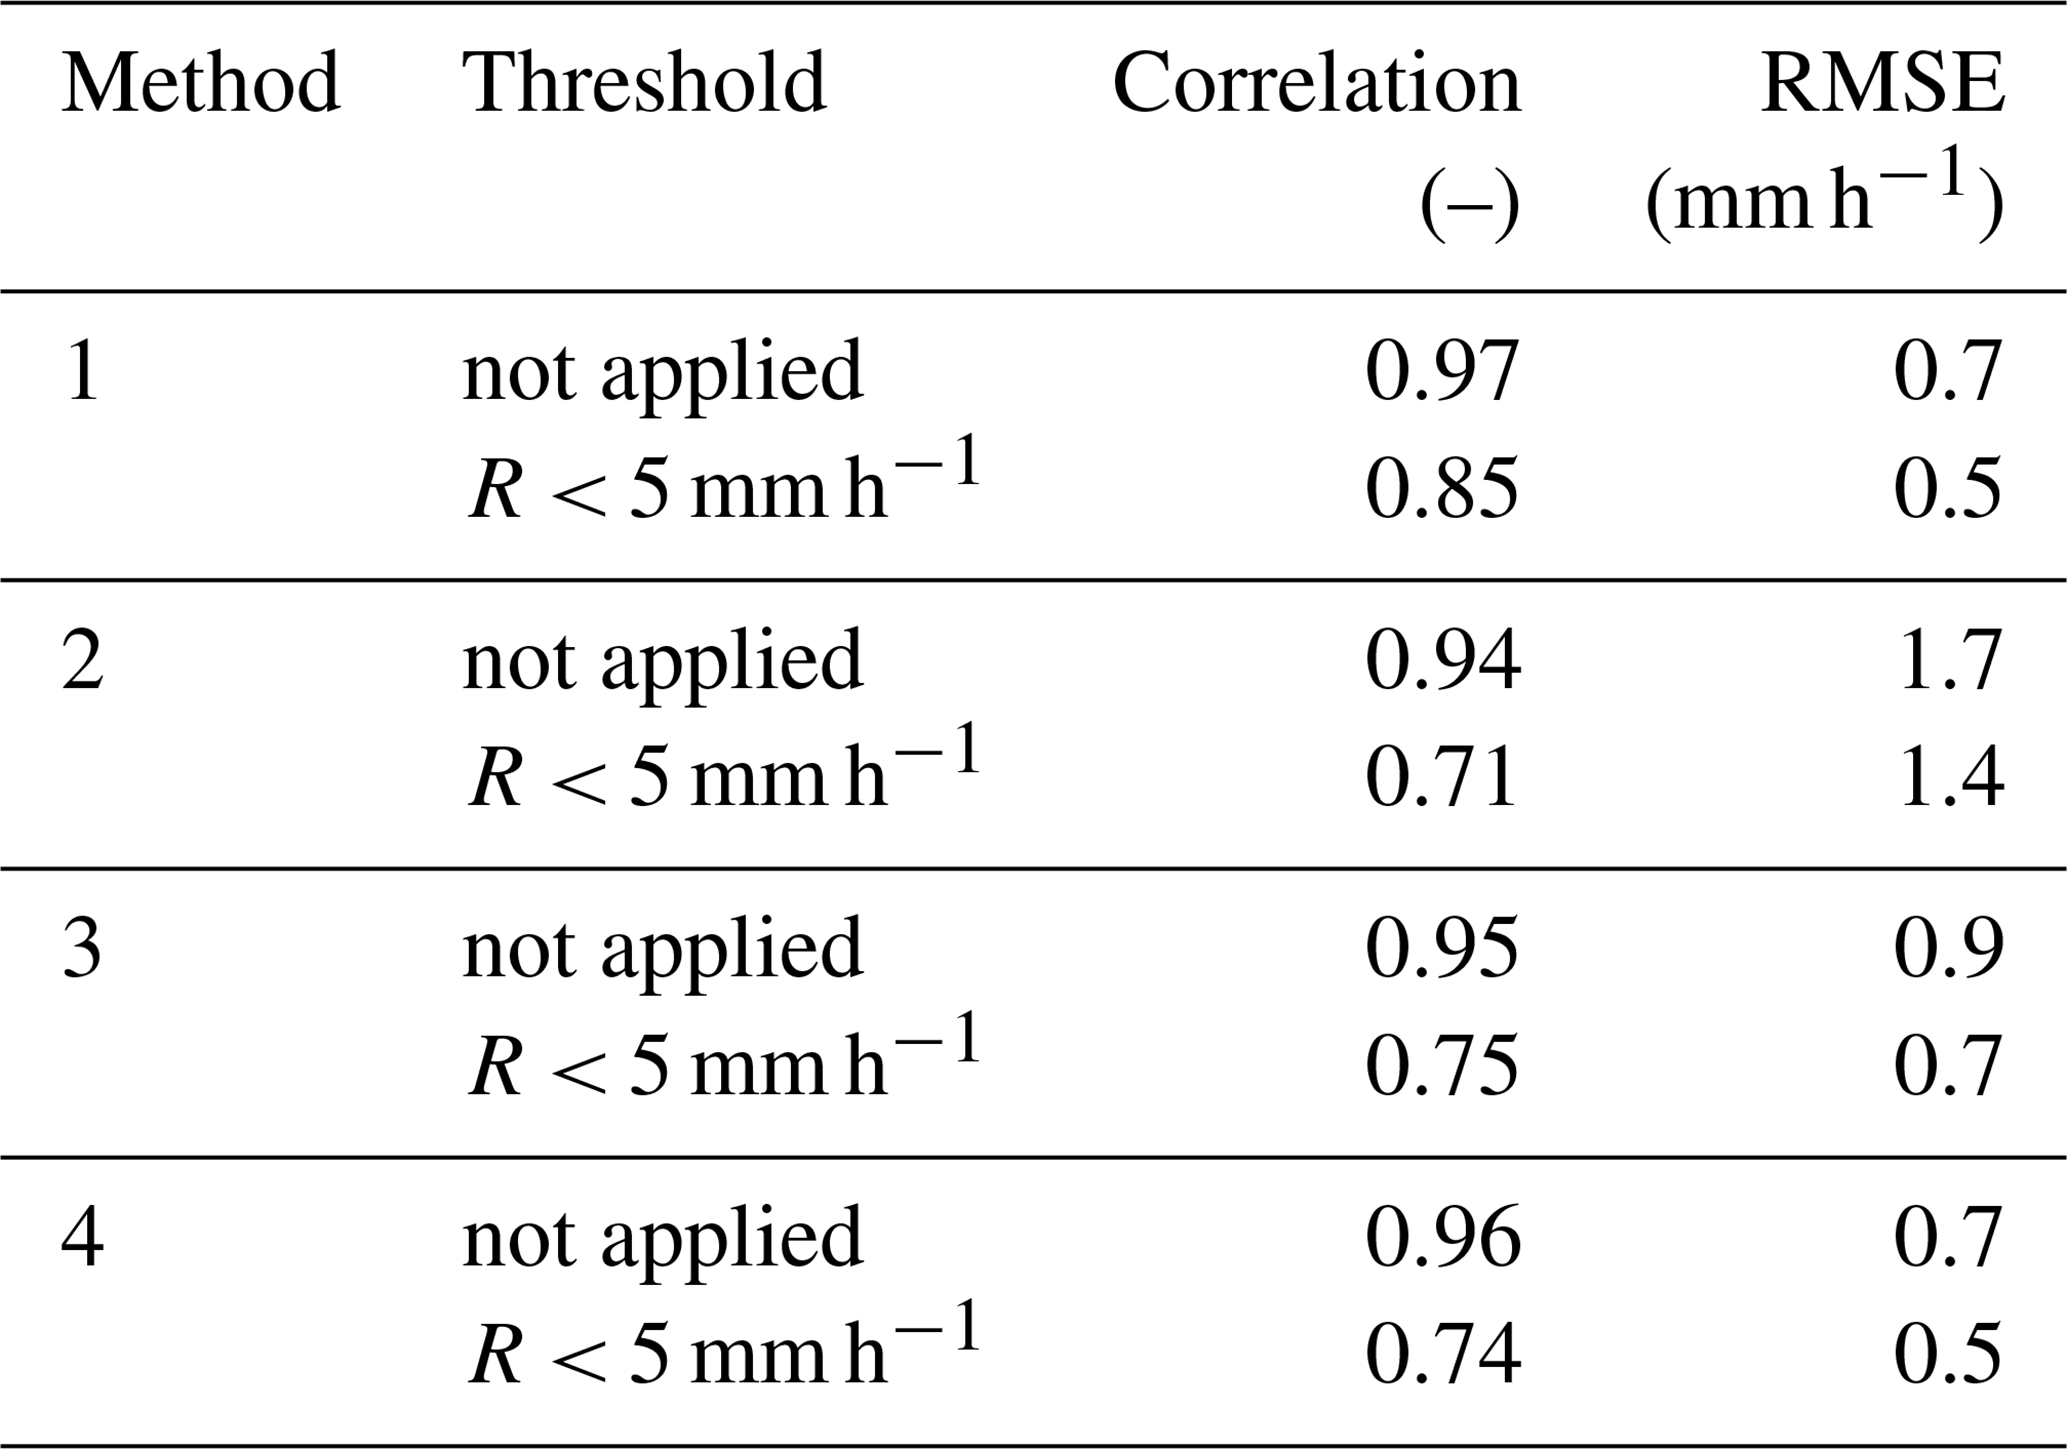
The results of this case study indicate that method 1, featuring the WAA separation method proposed by Pastorek et al. (2022), fits the data the best.
This study investigates the consistency between different CMLs by comparing pairs of independent collocated devices operating at the same and at different frequencies, including the identification of random and systematic components of CML discrepancies. This study empirically evaluates errors in CML observations without reference rainfall measurements, which enables assessment of hardware homogeneity. In total, eight pairs of independent collocated K-band CMLs operating at identical frequency bands and six pairs operating at different frequency bands were analysed in the study at high temporal resolution (1 min).
Rain-induced attenuation of collocated CMLs operating at identical frequency bands shows very good agreement. The RMSE in rain-induced attenuation is 0.4 dB, which is close to the signal quantization level. The random error is low in the total CML observation error.
For collocated CMLs operating at identical frequency bands, the RMSEs (differences) of the retrieved rainfall information are between 0.4 and 0.9 mm h−1 and have correlations between 0.97 and 0.99. Collocated CMLs operating at different frequency bands perform less consistently, with RMSEs between 0.6 and 1.7 mm h−1. The correlation has similar values between 0.96 and 0.99. Additionally, separating the rainfall types (convective and stratiform), the correlation is higher than 0.92 for both convective and stratiform events. The RMSE is lower for stratiform events as such events have overall lower rainfall intensities. The systematic errors are more pronounced for collocated CMLs operating at different frequency bands. CMLs operating at higher frequencies tend to observe higher rain rates than those operating at lower frequencies. We argue that the discrepancies between CMLs operating at different frequencies can be explained by the effect of DSD on the k–R relationship and that the sensitivity of the WAA pattern and magnitude to CML frequency is relatively low. Overall, the observations are in very good agreement, which confirms the homogeneous measurements of the hardware in the real network and, moreover, homogeneous patterns and magnitudes of WAA.
It is shown that the more complex the processing method is, the better the agreement between collocated CMLs will be. This also applies to rainfall events with lower intensity. This study also provides some insight into collocated CMLs of different radome sizes and antenna types. It might be interesting to evaluate collocated CMLs of different antenna types and sizes within a real CML network if a greater dataset were available in further studies.
Even though CMLs have not been primarily deployed for rainfall monitoring, this study proves that such collocated opportunistic rainfall sensors are in excellent agreement, and the hardware is homogeneous in its behaviour. The performance is at a similar level to collocated rain gauges (e.g. Peleg et al., 2013, demonstrated a rain gauge correlation of 0.92 for 1 min resolution).
The collocated CMLs operating at identical frequency bands perform consistently well. This confirms that the data of CMLs with the same characteristics can be processed with identical parameters for rainfall retrieval models.
Table A1Characteristics of the CMLs at the sites and pairwise data availability. The sites indicated by “a” are operated at identical frequency bands, and those indicated by “b” are operated at different frequency bands. The frequencies and parameters α and β are averaged for both sublinks in one link path. The last column indicates the percentage of pairwise data availability relative to the duration of all events.
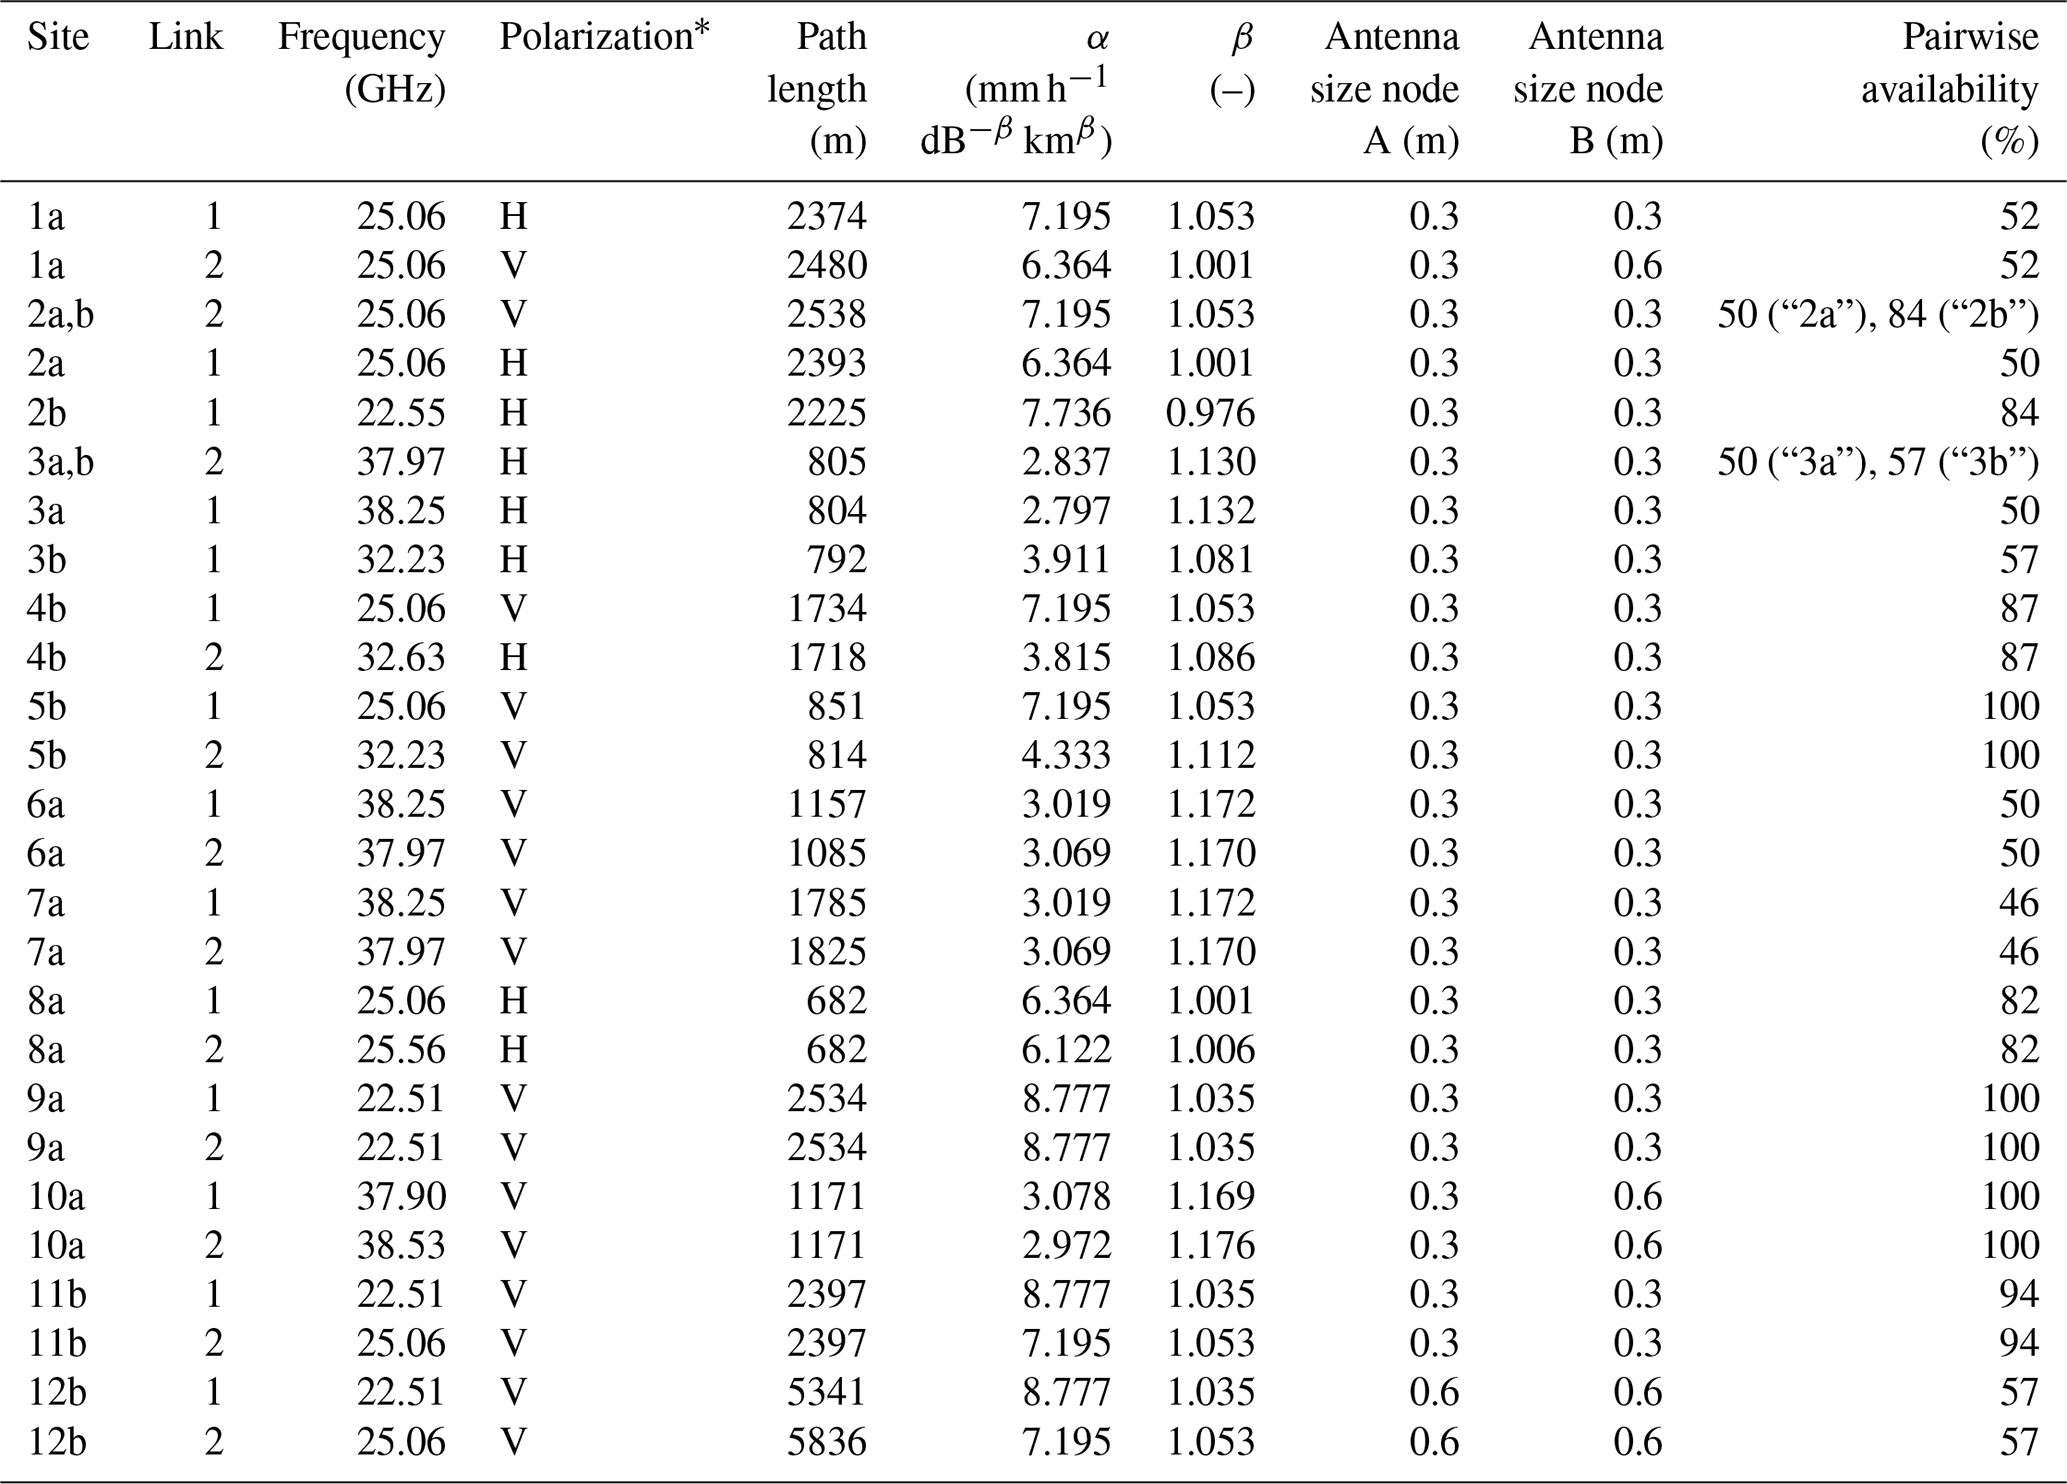
∗ “V” means vertical, and “H” means horizontal.
The data are publicly available at Zenodo: https://doi.org/10.5281/zenodo.8009877 (Špačková et al., 2023).
AŠ performed the analysis and wrote the first draft. MF and VB provided critical revisions and suggested further analysis. MF proposed relevant changes in the introduction and composed the second section. All authors contributed to the response to the review comments.
The contact author has declared that none of the authors has any competing interests.
Publisher’s note: Copernicus Publications remains neutral with regard to jurisdictional claims in published maps and institutional affiliations.
The authors gratefully acknowledge financial support from the Czech Science Foundation (GACR; SpraiLINK project no. 20-14151J) and the Czech Technical University in Prague (project no. SGS23/048/OHK1/1T/11). We would like to thank T-Mobile Czech Republic a.s. for providing the CML data. Special thanks are extended to Pražská vodohospodářská společnost a.s. for providing rainfall data from their rain gauge network and Pražské vodovody a kanalizace, a.s., who carefully maintain the rain gauges. We also thank Christian Chwala and Nico Blettner for introducing alternative CML processing and radar adjustment methods.
This research has been supported by the Grantová Agentura České Republiky (grant no. 20-14151J) and the Czech Technical University in Prague (project no. SGS23/048/OHK1/1T/11).
This paper was edited by Stefan Kneifel and reviewed by two anonymous referees.
Abuhdima, E. M. and Saleh, I. M.: Effect of sand and dust storms on microwave propagation signals in southern Libya, Melecon 2010 – 2010 15th IEEE Mediterranean Electrotechnical Conference, 26–28 April 2010, Valletta, Malta, IEEE, 695–698, https://doi.org/10.1109/MELCON.2010.5475995, 2010. a
Berne, A. and Uijlenhoet, R.: Path-averaged rainfall estimation using microwave links: Uncertainty due to spatial rainfall variability, Geophys. Res. Lett., 34, L07403, https://doi.org/10.1029/2007GL029409, 2007. a, b, c, d
Bianchi, B., Jan van Leeuwen, P., Hogan, R. J., and Berne, A.: A variational approach to retrieve rain rate by combining information from rain gauges, radars, and microwave links, J. Hydrometeorol., 14, 1897–1909, https://doi.org/10.1175/JHM-D-12-094.1, 2013. a
Chwala, C. and Kunstmann, H.: Commercial microwave link networks for rainfall observation: Assessment of the current status and future challenges, WIREs Water, 6, e1337, https://doi.org/10.1002/wat2.1337, 2019. a, b, c
Chwala, C., Keis, F., and Kunstmann, H.: Real-time data acquisition of commercial microwave link networks for hydrometeorological applications, Atmos. Meas. Tech., 9, 991–999, https://doi.org/10.5194/amt-9-991-2016, 2016. a
Ciach G. J. and Krajewski W. F.: Analysis and modeling of spatial correlation structure in small-scale rainfall in Central Oklahoma, Adv. Water Resour., 29, 1450–1463, https://doi.org/10.1016/j.advwatres.2005.11.003, 2005. a
David, N., Alpert, P., and Messer, H.: Technical Note: Novel method for water vapour monitoring using wireless communication networks measurements, Atmos. Chem. Phys., 9, 2413–2418, https://doi.org/10.5194/acp-9-2413-2009, 2009. a
de Vos, L. W., Leijnse, H., Overeem, A., and Uijlenhoet, R.: Quality control for crowdsourced personal weather stations to enable operational rainfall monitoring, Geophys. Res. Lett., 46, 8820–8829, https://doi.org/10.1029/2019GL083731, 2019. a, b
Doumounia, A., Gosset, M., Cazenave, F., Kacou, M., and Zougmore, F.: Rainfall monitoring based on microwave links from cellular telecommunication networks: First results from a West African test bed, Geophys. Res. Lett., 41, 6016–6022, https://doi.org/10.1002/2014GL060724, 2014. a
Fencl, M., Valtr, P., Kvicera, M., and Bareš, V.: Quantifying wet antenna attenuation in 38-GHz commercial microwave links of cellular backhaul, IEEE Geosci. Remote S., 16, 514–518, https://doi.org/10.1109/LGRS.2018.2876696, 2019. a
Fencl, M., Dohnal, M., Valtr, P., Grabner, M., and Bareš, V.: Atmospheric observations with E-band microwave links – challenges and opportunities, Atmos. Meas. Tech., 13, 6559–6578, https://doi.org/10.5194/amt-13-6559-2020, 2020. a, b
Graf, M., Chwala, C., Polz, J., and Kunstmann, H.: Rainfall estimation from a German-wide commercial microwave link network: optimized processing and validation for 1 year of data, Hydrol. Earth Syst. Sci., 24, 2931–2950, https://doi.org/10.5194/hess-24-2931-2020, 2020. a, b, c
Graf, M., El Hachem, A., Eisele, M., Seidel, J., Chwala, C., Kunstmann, H., and Bárdossy, A.: Rainfall estimates from opportunistic sensors in Germany across spatio-temporal scales, Journal of Hydrology: Regional Studies, 37, 100883, https://doi.org/10.1016/j.ejrh.2021.100883, 2021. a
Heistermann, M., Jacobi, S., and Pfaff, T.: Technical Note: An open source library for processing weather radar data (wradlib), Hydrol. Earth Syst. Sci., 17, 863–871, https://doi.org/10.5194/hess-17-863-2013, 2013. a
Imhoff, R. O., Overeem, A., Brauer, C. C., Leijnse, H., Weerts, A. H., and Uijlenhoet, R.: Rainfall nowcasting using commercial microwave links, Geophys. Res. Lett., 47, e2020GL089365. https://doi.org/10.1029/2020GL089365, 2020. a
ITU-R: Specific attenuation model for rain for use in prediction methods (Recommendation P.838-3), ITU-R, Geneva, Switzerland, https://www.itu.int/rec/R-REC-P.838-3-200503-I/en (last access: 12 May 2022), 2005. a, b, c
Kharadly, M. and Ross, R.: Effect of wet antenna attenuation on propagation data statistics, IEEE T. Antenn. Propag., 49, 1183–1191, https://doi.org/10.1109/8.943313, 2001. a
Leijnse, H., Uijlenhoet, R., and Stricker, J.: Microwave link rainfall estimation: Effects of link length and frequency, temporal sampling, power resolution, and wet antenna attenuation, Adv. Water Resour., 31, 1481–1493, https://doi.org/10.1016/j.advwatres.2008.03.004, 2008. a, b, c
Minda, H. and Nakamura, K.: High temporal resolution path-average rain gauge with 50-GHz band microwave, J. Atmos. Ocean. Tech., 22, 165–179, https://doi.org/10.1175/JTECH-1683.1, 2005. a
Moroder, C., Siart, U., Chwala, C., and Kunstmann, H.: Modeling of wet antenna attenuation for precipitation estimation from microwave links, IEEE Geosci. Remote S., 17, 386–390, https://doi.org/10.1109/LGRS.2019.2922768, 2020. a
Ochoa‐Rodriguez, S., Wang, L.‐P., Willems, P., and Onof, C.: A review of radar‐rain gauge data merging methods and their potential for urban hydrological applications, Water Resour. Res., 55, 6356–6391, https://doi.org/10.1029/2018WR023332, 2019. a
Overeem, A., Leijnse, H., and Uijlenhoet, R.: Measuring urban rainfall using microwave links from commercial cellular communication networks, Water Resour. Res., 47, W12505, https://doi.org/10.1029/2010WR010350, 2011. a
Overeem, A., Leijnse, H., and Uijlenhoet, R.: Country-wide rainfall maps from cellular communication networks, P. Natl. Acad. Sci. USA, 110, 2741–2745, https://doi.org/10.1073/pnas.1217961110, 2013. a
Pastorek, J., Fencl, M., Rieckermann, J., and Bareš, V.: Microwave link rainfall data for urban drainage modelling: Reducing the systematic errors under data-scarce conditions in Conference Proceedings – 15th International Conference on Urban Drainage, 25–28 October 2021, Oxford, UK, International Water Association, 15th International Conference on Urban Drainage 2021 Delegate Handbook, edited by: McCarthy, D., 683–685, 2021. a
Pastorek, J., Fencl, M., Rieckermann, J., and Bareš, V.: Precipitation estimates from commercial microwave links: Practical approaches to wet-antenna correction, IEEE T. Geosci. Remote, 60, 1–9, https://doi.org/10.1109/TGRS.2021.3110004, 2022. a, b, c, d, e
Peleg, N., Ben-Asher, M., and Morin, E.: Radar subpixel-scale rainfall variability and uncertainty: lessons learned from observations of a dense rain-gauge network, Hydrol. Earth Syst. Sci., 17, 2195–2208, https://doi.org/10.5194/hess-17-2195-2013, 2013. a, b
Peterson, T. C., Easterling, D. R., Karl, T. R., Groisman, P., Nicholls, N., Plummer, N., Torok, S., Auer, I., Boehm, R., Gullett, D., Vincent, L., Heino, R., Tuomenvirta, H., Mestre, O., Szentimrey, T., Salinger, J., Førland, E. J., Hanssen-Bauer, I., Alexandersson, H., Jones, P., and Parker, D.: Homogeneity adjustments of in situ atmospheric climate data: A review, Int. J. Climatol., 18, 1493–1517, https://doi.org/10.1002/(SICI)1097-0088(19981115)18:13<1493::AID-JOC329>3.0.CO;2-T, 1998. a
Schleiss, M. and Berne, A.: Identification of dry and rainy periods using telecommunication microwave links, IEEE Geosci. Remote S., 7, 611–615, https://doi.org/10.1109/LGRS.2010.2043052, 2010. a
Schleiss, M., Rieckermann, J., and Berne, A.: Quantification and modeling of wet-antenna attenuation for commercial microwave links, in IEEE Geosci. Remote S., 10, 1195–1199, https://doi.org/10.1109/LGRS.2012.2236074, 2013. a, b, c, d
Schleiss, M., Olsson, J., Berg, P., Niemi, T., Kokkonen, T., Thorndahl, S., Nielsen, R., Ellerbæk Nielsen, J., Bozhinova, D., and Pulkkinen, S.: The accuracy of weather radar in heavy rain: a comparative study for Denmark, the Netherlands, Finland and Sweden, Hydrol. Earth Syst. Sci., 24, 3157–3188, https://doi.org/10.5194/hess-24-3157-2020, 2020. a
Špačková, A., Bareš, V., Fencl, M., Schleiss, M., Jaffrain, J., Berne, A., and Rieckermann, J.: A year of attenuation data from a commercial dual-polarized duplex microwave link with concurrent disdrometer, rain gauge, and weather observations, Earth Syst. Sci. Data, 13, 4219–4240, https://doi.org/10.5194/essd-13-4219-2021, 2021. a
Špačková, A., Fencl, M., and Bareš, V.: Data for the paper Evaluation of error components in rainfall retrieval from collocated commercial microwave links, Zenodo [data set], https://doi.org/10.5281/zenodo.8009877, 2023. a
Valtr, P., Pechac, P., Kvicera, V., and Grabner, M.: Estimation of the refractivity structure of the lower troposphere from measurements on a terrestrial multiple-receiver 85 radio link, IEEE T. Antenn. Propag., 59, 1707–1715, https://doi.org/10.1109/TAP.2011.2122234, 2011. a
van de Beek, R. (C. Z. )., Olsson, J., and Andersson, J.: Optimal grid resolution for precipitation maps from commercial microwave link networks, Adv. Sci. Res., 17, 79–85, https://doi.org/10.5194/asr-17-79-2020, 2020. a
van Leth, T. C., Overeem, A., Leijnse, H., and Uijlenhoet, R.: A measurement campaign to assess sources of error in microwave link rainfall estimation, Atmos. Meas. Tech., 11, 4645–4669, https://doi.org/10.5194/amt-11-4645-2018, 2018. a, b, c, d, e
Walraven, B., Overeem, A., Leijnse, H., Coenders, M., Hut, R., van der Valk, L., and Uijlenhoet, R.: Considering local network characteristics and environmental conditions improves rainfall estimates from commercial microwave links in Sri Lanka, EGU General Assembly 2022, Vienna, Austria, 23–27 May 2022, EGU22-9544, https://doi.org/10.5194/egusphere-egu22-9544, 2022. a