the Creative Commons Attribution 4.0 License.
the Creative Commons Attribution 4.0 License.
 | 23 Aug 2023
Development and characterization of the Portable Ice Nucleation Chamber 2 (PINCii)
Dimitri Castarède
Yusheng Wu
Zamin A. Kanji
Markus Hartmann
Lauri Ahonen
Merete Bilde
Markku Kulmala
Tuukka Petäjä
Jan B. C. Pettersson
Berko Sierau
Olaf Stetzer
Frank Stratmann
Birgitta Svenningsson
Erik Swietlicki
Quynh Thu Nguyen
Jonathan Duplissy
The Portable Ice Nucleation Chamber 2 (PINCii) is a newly developed continuous flow diffusion chamber (CFDC) for measuring ice nucleating particles (INPs). PINCii is a vertically oriented parallel-plate CFDC that has been engineered to improve upon the limitations of previous generations of CFDCs. This work presents a detailed description of the PINCii instrument and the upgrades that make it unique compared with other operational CFDCs. The PINCii design offers several possibilities for improved INP measurements. Notably, a specific icing procedure results in low background particle counts, which demonstrates the potential for PINCii to measure INPs at low concentrations (<10 L−1). High-spatial-resolution wall-temperature mapping enables the identification of temperature inhomogeneities on the chamber walls. This feature is used to introduce and discuss a new method for analyzing CFDC data based on the most extreme lamina conditions present within the chamber, which represent conditions most likely to trigger ice nucleation. A temperature gradient can be maintained throughout the evaporation section in addition to the main chamber, which enables PINCii to be used to study droplet activation processes or to extend ice crystal growth. A series of both liquid droplet activation and ice nucleation experiments were conducted at temperature and saturation conditions that span the spectrum of PINCii's operational conditions ( temperature ∘C and 100 ≤ relative humidity with respect to ice ≤160 %) to demonstrate the instrument's capabilities. In addition, typical sources of uncertainty in CFDCs, including particle background, particle loss, and variations in aerosol lamina temperature and relative humidity, are quantified and discussed for PINCii.
- Article
(10562 KB) - Full-text XML
- BibTeX
- EndNote


Ice crystals are abundant in the atmosphere, and approximately 70 % of all cloud occurrences contain ice (Stubenrauch et al., 2013; Matus and L'Ecuyer, 2017). Nevertheless, ice crystal formation and multiplication processes are poorly represented in atmospheric models (Fletcher, 1962; Phillips et al., 2008; Niemand et al., 2012; Burrows et al., 2022; Frostenberg et al., 2022). In the atmosphere, ice crystals can form from supercooled aqueous droplets via homogeneous ice nucleation; however, this process occurs only at temperatures ∘C (Koop et al., 2000b; Murray et al., 2010). In fact, most atmospheric ice results from crystallization processes that occur at higher temperatures (−37 ∘C ∘C). This process, called heterogeneous ice nucleation, requires the presence of aerosol particles (Hoose and Möhler, 2012). Heterogeneous ice nucleation may occur within existing water droplets (immersion freezing, contact freezing, and pore condensation and freezing; Ladino Moreno et al., 2013; Vali et al., 2015; David et al., 2019) or under subsaturated water conditions directly from the vapor phase (deposition nucleation; Marcolli, 2014; Vali et al., 2015). The multiple mechanisms make understanding atmospheric ice nucleating particles (INPs) and their roles challenging (Vali et al., 2015).
The desire to better understand INPs has led to the development of different instruments and methods for investigating atmospheric ice nucleation mechanisms and processes since the 1940s. These instruments include cloud chambers (Aufm Kampe and Weickmann, 1951; Mason, 1962; DeMott et al., 2011; Möhler et al., 2021), filter sampling and nucleation testing methods (Langer and Rodgers, 1975; Conen et al., 2012; Hill et al., 2014; Stopelli et al., 2014; Schrod et al., 2016; Schiebel, 2017; Chen et al., 2018; Porter et al., 2020), and flow reactors, including continuous flow diffusion chambers (CFDCs). Since they were first developed in the 1980s, multiple generations of CFDCs have emerged for making semicontinuous, online ambient measurements of INPs (Hussain and Saunders, 1984; Tomlinson and Fukuta, 1985; Rogers, 1988; Petters et al., 2009; Richardson et al., 2007; DeMott et al., 2009; Kanji and Abbatt, 2009; Richardson, 2009; Eidhammer et al., 2010; Richardson et al., 2010; Kulkarni et al., 2020; Patnaude et al., 2021). In the mid-2000s, a vertical parallel-plate CFDC, called the Zurich Ice Nucleation Chamber (ZINC), was introduced (Stetzer et al., 2008). After the initial success of this chamber in laboratory studies, more parallel-plate CFDCs were constructed. The Portable Ice Nucleation Chamber (PINC) was developed at ETH Zurich with a focus on field and mobile measurements (Chou, 2011; Kanji et al., 2013, 2019). Several commercialized vertical CFDCs, such as the SPectrometer for Ice Nuclei (SPIN; Droplet Measurement Technologies, Longmont, Colorado, USA) chamber (Garimella et al., 2016) and the cylindrical Continuous Flow Diffusion Chamber Ice Activation Spectrometer (CFDC-IAS; Handix Scientific, Boulder, Colorado, USA), have also been produced, refined, and made available over the last decade. Horizontal parallel-plate CFDCs have also been developed (Kanji and Abbatt, 2009; Lacher et al., 2017). For instance, the automated Horizontal Ice Nucleation Chamber (HINC-Auto) is the first fully automated CFDC and has operated continuously at Jungfraujoch for more than a year (Brunner and Kanji, 2021).
Despite the number of CFDCs that have been developed, operated, and continue to operate today, new systems continue to appear, and no instrument standard has emerged to date. Here, we present a new instrument that has been built through a large multinational research collaboration (Boy et al., 2019) in an attempt to address the specific shortcomings of many existing instruments. This instrument, the second-generation Portable Ice Nucleation Chamber (PINCii), incorporates unique hardware and operational improvements. For example, engineering upgrades have been made to the ZINC-/PINC-based design, and the temperature control in PINCii has been improved by the addition and better distribution of thermocouples and coolant injection(s). The minimum wall temperature achievable with PINCii is ∘C due to its cascade cooling system. In addition, we show that the entire chamber can be run with a temperature gradient (including the evaporation section), meaning that the chamber can be used to extend ice crystal growth or to study droplet activation processes at cold temperatures. Finally, during PINCii's characterization and evaluation, new interpretation methods for CFDC observations have been developed to better account for temperature and relative humidity (RH) uncertainties within the chamber.
CFDCs follow a common principle: a thin layer of sample air containing particles, called a “lamina”, is injected into a chamber (Rogers, 1988). The lamina is sandwiched between two layers of dry and clean sheath air, and the total volume of sample plus sheath air flows in a laminar regime through an ice-coated chamber(s) that is held at subzero temperatures. Most CFDCs are composed of thermally separated sections with a “growth section” (or “main chamber”) and an “evaporation section”, as shown in Fig. 1. PINCii operates by the same principle, and a continuous ice coating acts as a source of water vapor within the main chamber and the evaporation section because the ice slowly sublimates into the sample flow in order to maintain the vapor pressure (p) at the equilibrium vapor pressure of ice (pi,eq), . Under static isothermal conditions, the chamber walls equilibrate with the flow at ice saturation RHi(T)=100 %. When a temperature gradient is applied by setting the temperatures of the walls to different set points, the resulting linear temperature and vapor pressure gradients lead to an actual vapor pressure away from the walls that exceeds the equilibrium vapor pressure of ice (i.e., ). This is due to the fact that there is an exponential relationship between temperature and saturation vapor pressure (Clapeyron, 1834; Clausius, 1850; Rogers, 1988). Therefore, the supersaturated conditions with respect to ice and/or water enable ice nucleation or droplet activation.
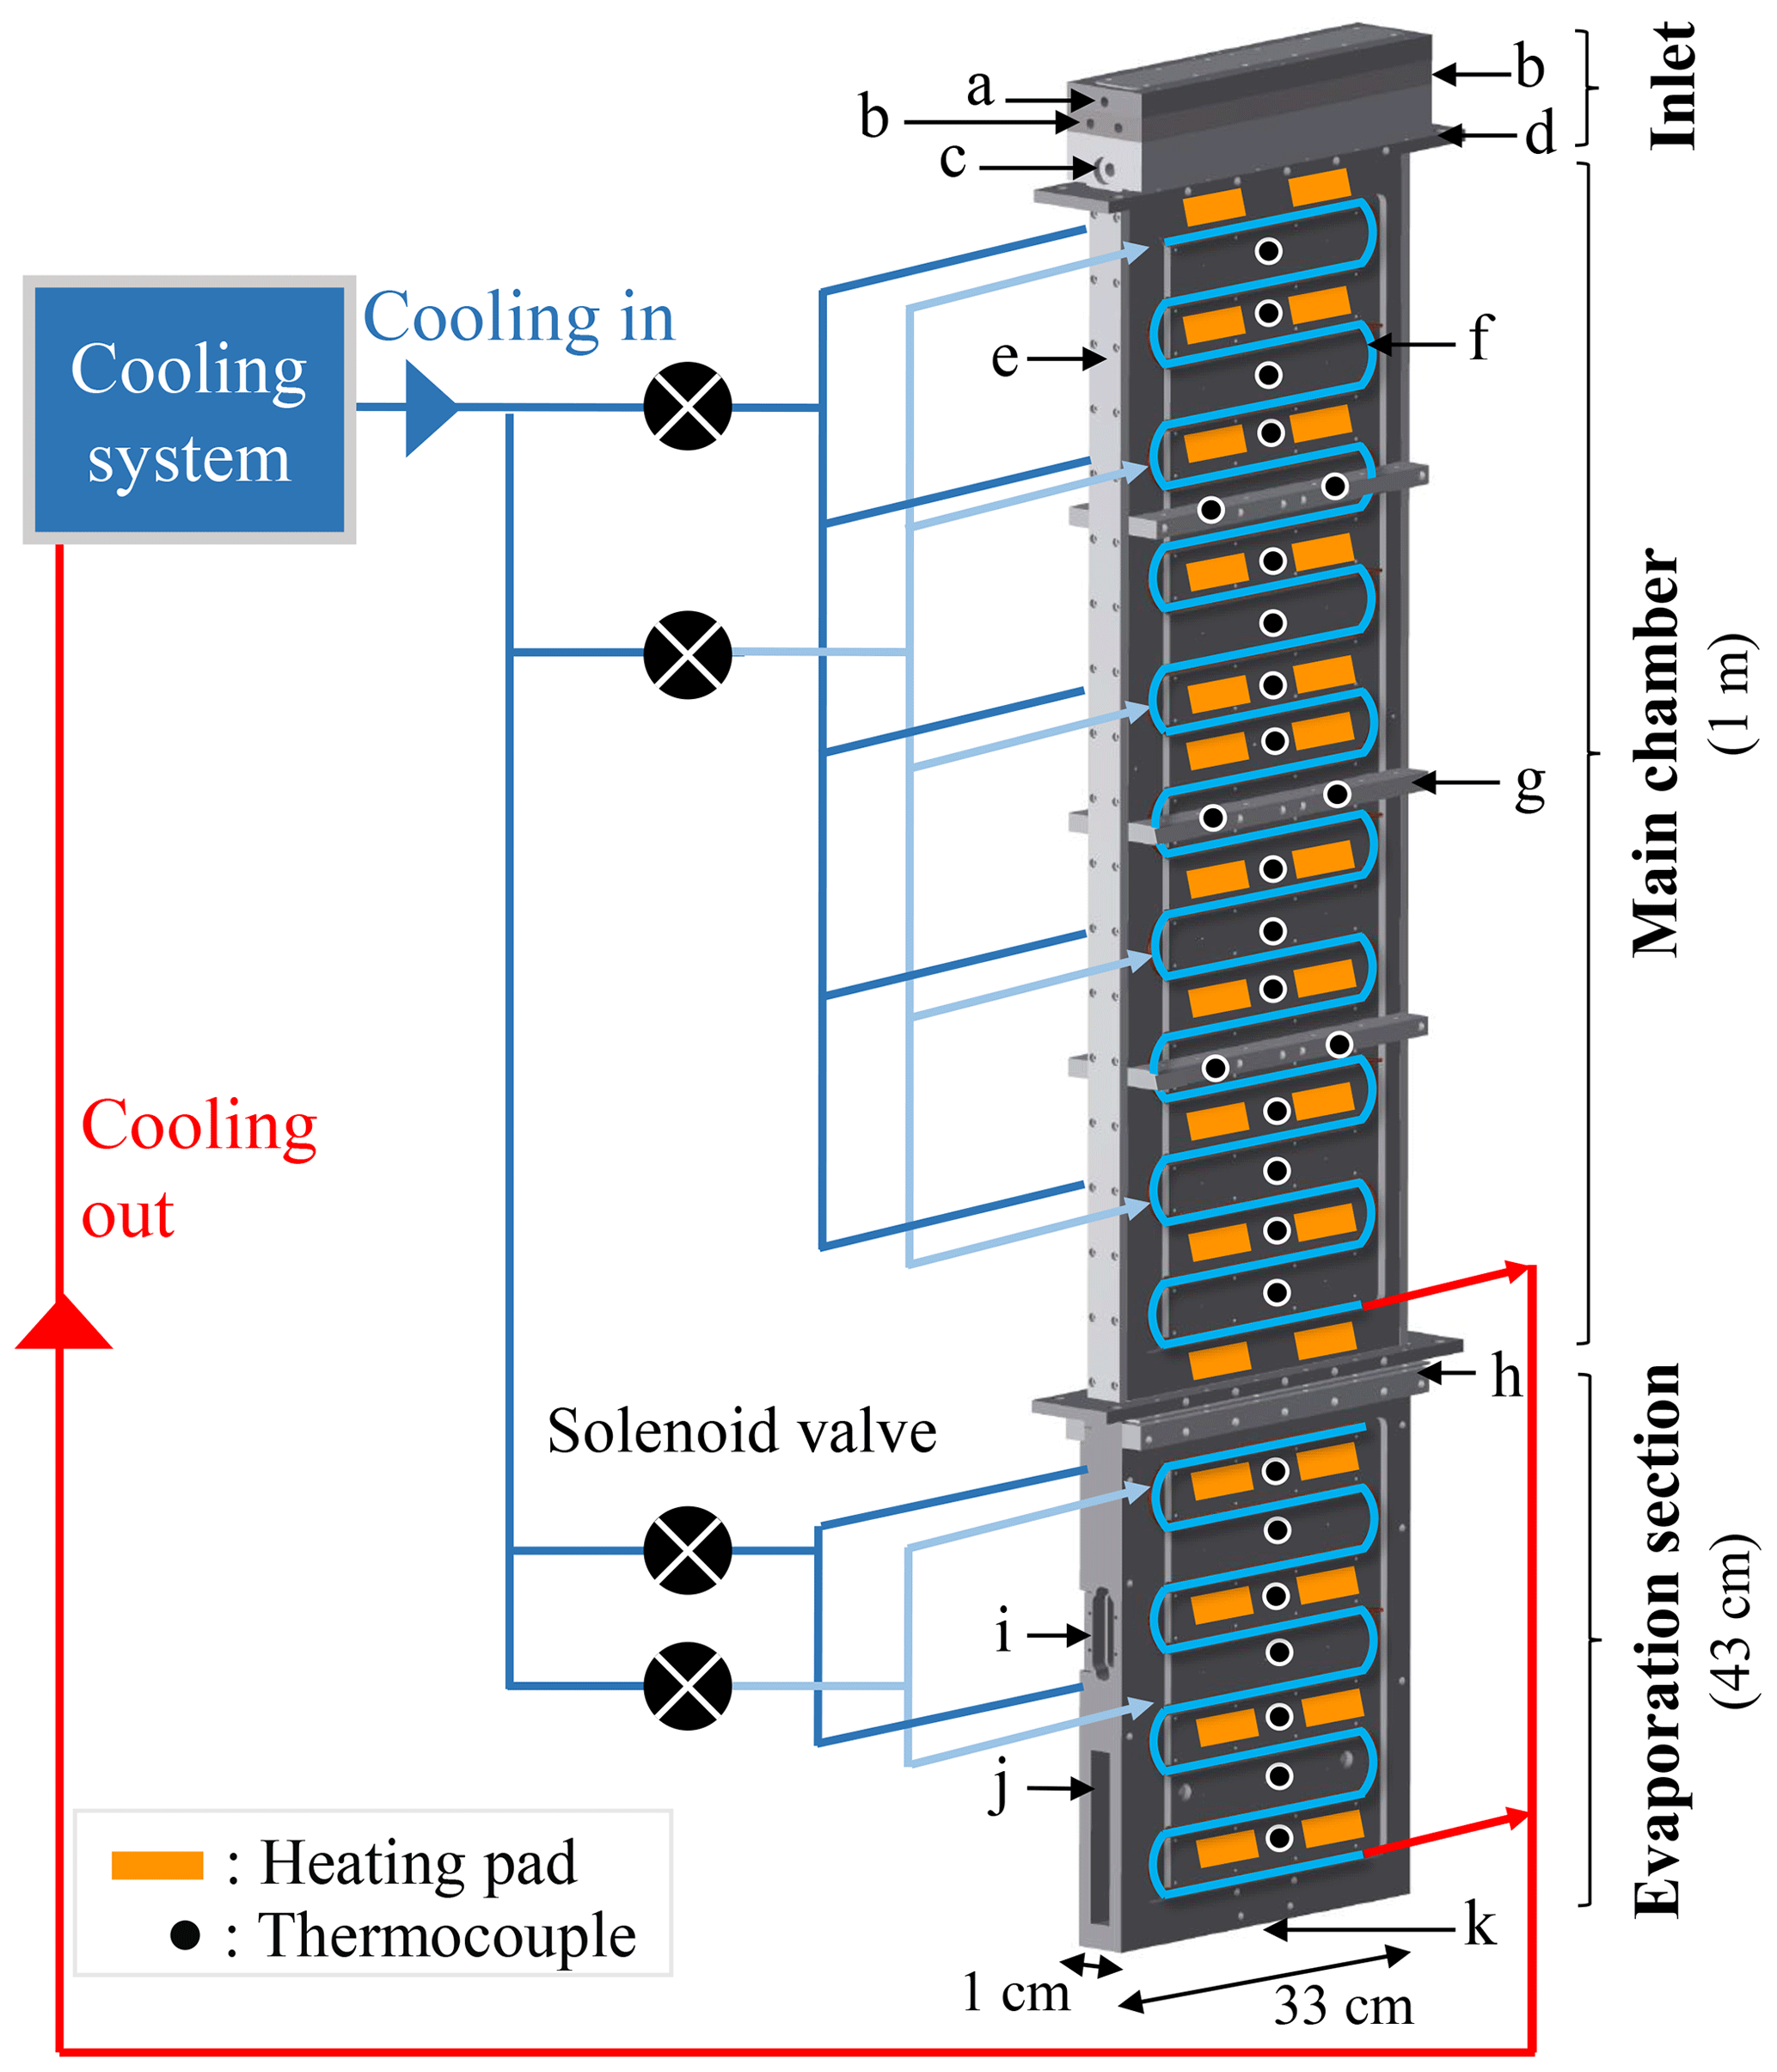
Figure 1Schematic of PINCii and its cooling system, including the main elements of the chamber: (a) the sample inlet, (b) the sheath flow inlets, (c) the water level sensor port, (d, e, h) the SustaPEEK flanges thermally isolating sections of the chamber, (f) the refrigerant cooling coil pipes, (g) the support bars, (i) the window port, (j) the lower evaporation section with material removed, and (k) the exit hole. The location of the coolant injections, heating pads, and thermocouples on a single wall are also depicted. The injection of coolant to the different chamber sections is controlled independently, and multiple thin capillaries located after the solenoid valves distribute the coolant evenly to the selected section.
Sampled particles, which are traveling within the thin, sandwiched lamina, are exposed to only a narrow range of lamina temperature (Tlam) and lamina relative humidity (RHlam) conditions that depend upon the chosen set-point temperatures. For a given Tlam and RHlam, particles may or may not nucleate ice depending on their capacity to act as INPs. Sampled particles that are prone to act as INPs under the given lamina conditions nucleate ice and continue to grow in the main chamber section. Meanwhile, the evaporation section is held at an isothermal condition at the temperature of the warmer main chamber wall. This makes the evaporation section saturated with respect to ice (relative humidity with respect to ice RHi=100 %) but subsaturated with respect to liquid water (relative humidity with respect to water RHliq<100 %). Thus, any liquid droplets are evaporated while ice particles remain at equilibrium. The ice crystals can ultimately be differentiated from other particles and counted at the exit of the chamber using particle counting techniques.
2.1 PINCii design
PINCii is a 112 cm × 70 cm × 190 cm instrument that weighs approximately 200 kg and is mounted on wheels to be transportable. As shown in Fig 1, the main chamber is 1 m long and 33 cm wide and is constructed of two parallel aluminum walls, which were sandblasted and anodized to a depth of 20±4 µm. The aluminum walls are separated by 1 cm of semicrystalline thermoplastic (SustaPEEK) sidewall pieces (Fig. 1e). The SustaPEEK material was chosen for its material properties after low-temperature experiments with polyvinylidene fluoride proved problematic due to mismatched cooling properties that led to chamber leakage at low temperatures. Flanges of SustaPEEK are also used to thermally isolate individual sections from others (Fig. 1d, h). An aerosol inlet head unit is located on top of the main chamber and composed of four machined pieces to create two sheath flows sandwiching the sample lamina. The inlet head unit has six ports, the sample flow inlet (Fig. 1a), four sheath flow inlets (two per side; Fig. 1b), and a water level sensor port (Fig. 1c). After entering, the sample flow is channeled through a 1 mm slit sandwiched with the sheath flows on each side. Located below the main chamber, the evaporation section is 43 cm long and contains a two-sided window port (Fig. 1i) designed for mounting the Ice Optical DEpolarization detector (IODE; Nicolet et al., 2010) used to distinguish between water droplets and ice crystals. After 20 cm, the 33 cm width of the evaporation section narrows smoothly to a 1 cm exit hole (Fig. 1k) where a chosen detector, such as an optical particle counter (OPC), can be mounted. To lighten the unit and optimize temperature control, material has been removed where the lower-evaporation section begins (Fig. 1j). Unlike the main chamber, which has thermally isolated walls, the evaporation section is constructed of two connected aluminum pieces. The purpose of the thermal connection is to allow the evaporation section to operate efficiently in an isothermal mode. However, the evaporation section can also act as an elongation of the main chamber by extending the temperature gradient along its walls. Figure 1 also highlights the refrigerant cooling coil pipes (Fig. 1f) that are press-fit into external, machined grooves on the chamber walls and the support bars (Fig. 1g) that are mounted to reduce chamber distortions from material contraction and/or expansion during cooling and heating cycles.
The PINCii has a two-stage cascade refrigerant compressor system that provides independent cooling to the two upper chamber walls and the two evaporation section walls via four solenoid valves (Fig. 1). To distribute cooling fluid evenly, a series of thin injection capillaries are distributed across each wall after the solenoid valves. The design of this system was optimized to reduce singular, cold injection points given that the refrigerant R-23 (trifluoromethane) operates with an evaporation temperature of −72 ∘C. With the instrument design and heat losses, the actual observed minimum wall temperature is ∘C. In addition to the cooling system, 60 adhesive silicon heating pads (output power of 20 W each) and 56 type-K thermocouples measuring at 1 Hz (embedded ≈7 mm into the chamber walls, or ≈5 mm from the ice layers) are used to control the temperature via 11 individual proportional–integral–derivative (PID) gain loops controlled with a custom-made LabVIEW program. The same program is used to operate a series of external pumps, mass flow controllers (MFCs), and valves used to manage the flows inside the chamber as well as to record all of the output data, including the OPC data.
2.2 Features unique to PINCii
Given the abundance of operational CFDCs (Chou, 2011; Garimella et al., 2016; Lacher et al., 2017; Brunner and Kanji, 2021), it is useful to distinguish unique features of the PINCii design. Some of these new design features initially motivated the PINCii project, whereas others have emerged during the development process. In fact, the chamber developed and introduced here is PINCii version 3.0, and three PINCii chambers of this version have been commissioned to date. While further incremental improvements are likely to emerge, it is likely they will do so in the context of the user community. The version presented here is considered to be the PINCii package for which the hardware and operation can be easily reproduced.
Compared with all but a few CFDCs, and in contrast to the first PINC, PINCii has an elongated design, where the main chamber (100 cm) and the evaporation section (43 cm) are longer than in other instruments (e.g., PINC and SPIN have respective main chambers of 56.8 and 100 cm and respective evaporation sections of 23 and 25 cm). The extended chamber(s) enable longer residence time(s) compared with other existing chambers and, thus, more time for nucleation and growth of both ice particles and water droplets in the main chamber and more time for water droplet evaporation in the evaporation section. As mentioned previously, the evaporation section can also act as an elongation of the main chamber by extending the temperature gradient applied to the main chamber. This feature can be used to perform droplet nucleation experiments or to expand ice crystal growth below water saturation where phase differentiation is not critical, particularly for low-temperature ice nucleation experiments where growth kinetics are limiting.
Furthermore, the capillary distribution of the coolant throughout the chamber, along with a dense spatial distribution of thermocouples and heating pads and a temperature control system, was developed to reduce local temperature variability in the walls. The dense temperature monitoring has also enabled improved analysis, and we suggest new protocols to analyze and interpret CFDC data in Sect. 3.3.
2.3 Typical chamber operation
In typical PINCii experiments, the chamber walls are coated with ≈1 mm thick ice layers to provide the water vapor source within the chamber. The icing procedure consists of cooling the walls and flushing the chamber with water (more details in Sect. 4.1). As previously outlined, the driving force for ice nucleation is established by setting a temperature gradient between the walls. As a standard, a 1 L min−1 sample aerosol flow is sandwiched between two 4.5 L min−1 dry-nitrogen or dry and clean air sheath flows, resulting in a total flow of 10 L min−1 through the chamber. The flow rates have been chosen to constrain the sample within a lamina with well-defined Tlam and RHlam and to avoid wall effects (Fig. 3). A thermodynamic model that includes the attenuating effect of the ice layer is described in more detail below (see Sect. 2.4).
All of the experiments presented in this study were conducted using a four-channel OPC (Remote 3104, Lighthouse Worldwide Solutions, USA) mounted at the exit of the PINCii. The size channels (Ch) correspond to the following sizing bins (where dp is the optical particle diameter): Ch1, µm; Ch2, µm; Ch3, µm; and Ch4, µm. In some of the results presented here, the channels have been cumulatively combined to result in the following: Ch1, dp≥0.3 µm; Ch2, dp≥1 µm; Ch3, dp≥3 µm; and Ch4, dp≥5 µm. Note that the OPC was recalibrated to operate with a 10 L min−1 flow rate.
2.4 Thermodynamic model
The actual thermodynamic conditions to which the sample is exposed are numerically modeled using the thermodynamic model of Rogers (1988) that has served as the reference for all subsequent CFDCs. The model quantifies temperature, RH, and flow fields within the chamber according to the measured flow rates and wall temperatures. Note that the calculations detailed by Rogers (1988) use several approximations which could potentially be adjusted depending on the CFDC and the experimental conditions used. For example, Patnaude et al. (2021) modified the approximations to better represent the geometry of their cylindrical CFDC and measurements at low temperatures and flow rates. Here, we updated the model to account for the 1 mm thick ice layers on the side walls (hatched gray region in Fig. 2). This thickness value is calculated by measuring the total volume of water exiting the chamber after an icing–melting cycle and dividing it by the total surface of the chamber walls. Accounting for the 1 mm thick ice layers changes both the chamber width and the boundary conditions (i.e., the temperature of the ice layers). First, the machined 1 cm gap between the chamber walls becomes 0.8 cm and the total chamber volume is decreased by ≈20 %. Then, the ice layers' temperatures are calculated accounting for the heat transfer between the aluminum chamber walls (in which the thermocouples are embedded) and the ice–gas interface. Finally, the chamber flow and thermodynamic conditions are calculated across the gap separating these two ice layers. The detailed calculations performed for PINCii can be found in Sect. 3.3.2 of Castarède (2021), which is available digitally. The results are presented in Fig. 2, where the thermodynamic model output was calculated for a total flow rate of 10 L min−1 and the Clausius–Clapeyron relation was used to express the dependence of saturation vapor pressure on temperature. It is noteworthy that accounting for the ice layer thickness changes the Tlam and RHlam and also simultaneously changes the lamina position and the velocity profile across the chamber (Figs. 2, 3a). The reduction in the gap between the chamber walls due to the ice layers affects flow reversal (negative velocity), as seen in Fig. 3a where the velocity is represented as a function of the ice thickness increasing from 0 to 1 mm. While the standard model from Rogers (1988) predicts flow reversal due to buoyancy, as shown in Garimella et al. (2016), the updated model predicts a laminar flow profile with negligible reversal even when strong temperature gradients are applied between the chamber walls, as seen in Fig. 3b where the fraction of reversed flow is represented over the full range of Tlam and RHlam achievable with PINCii.
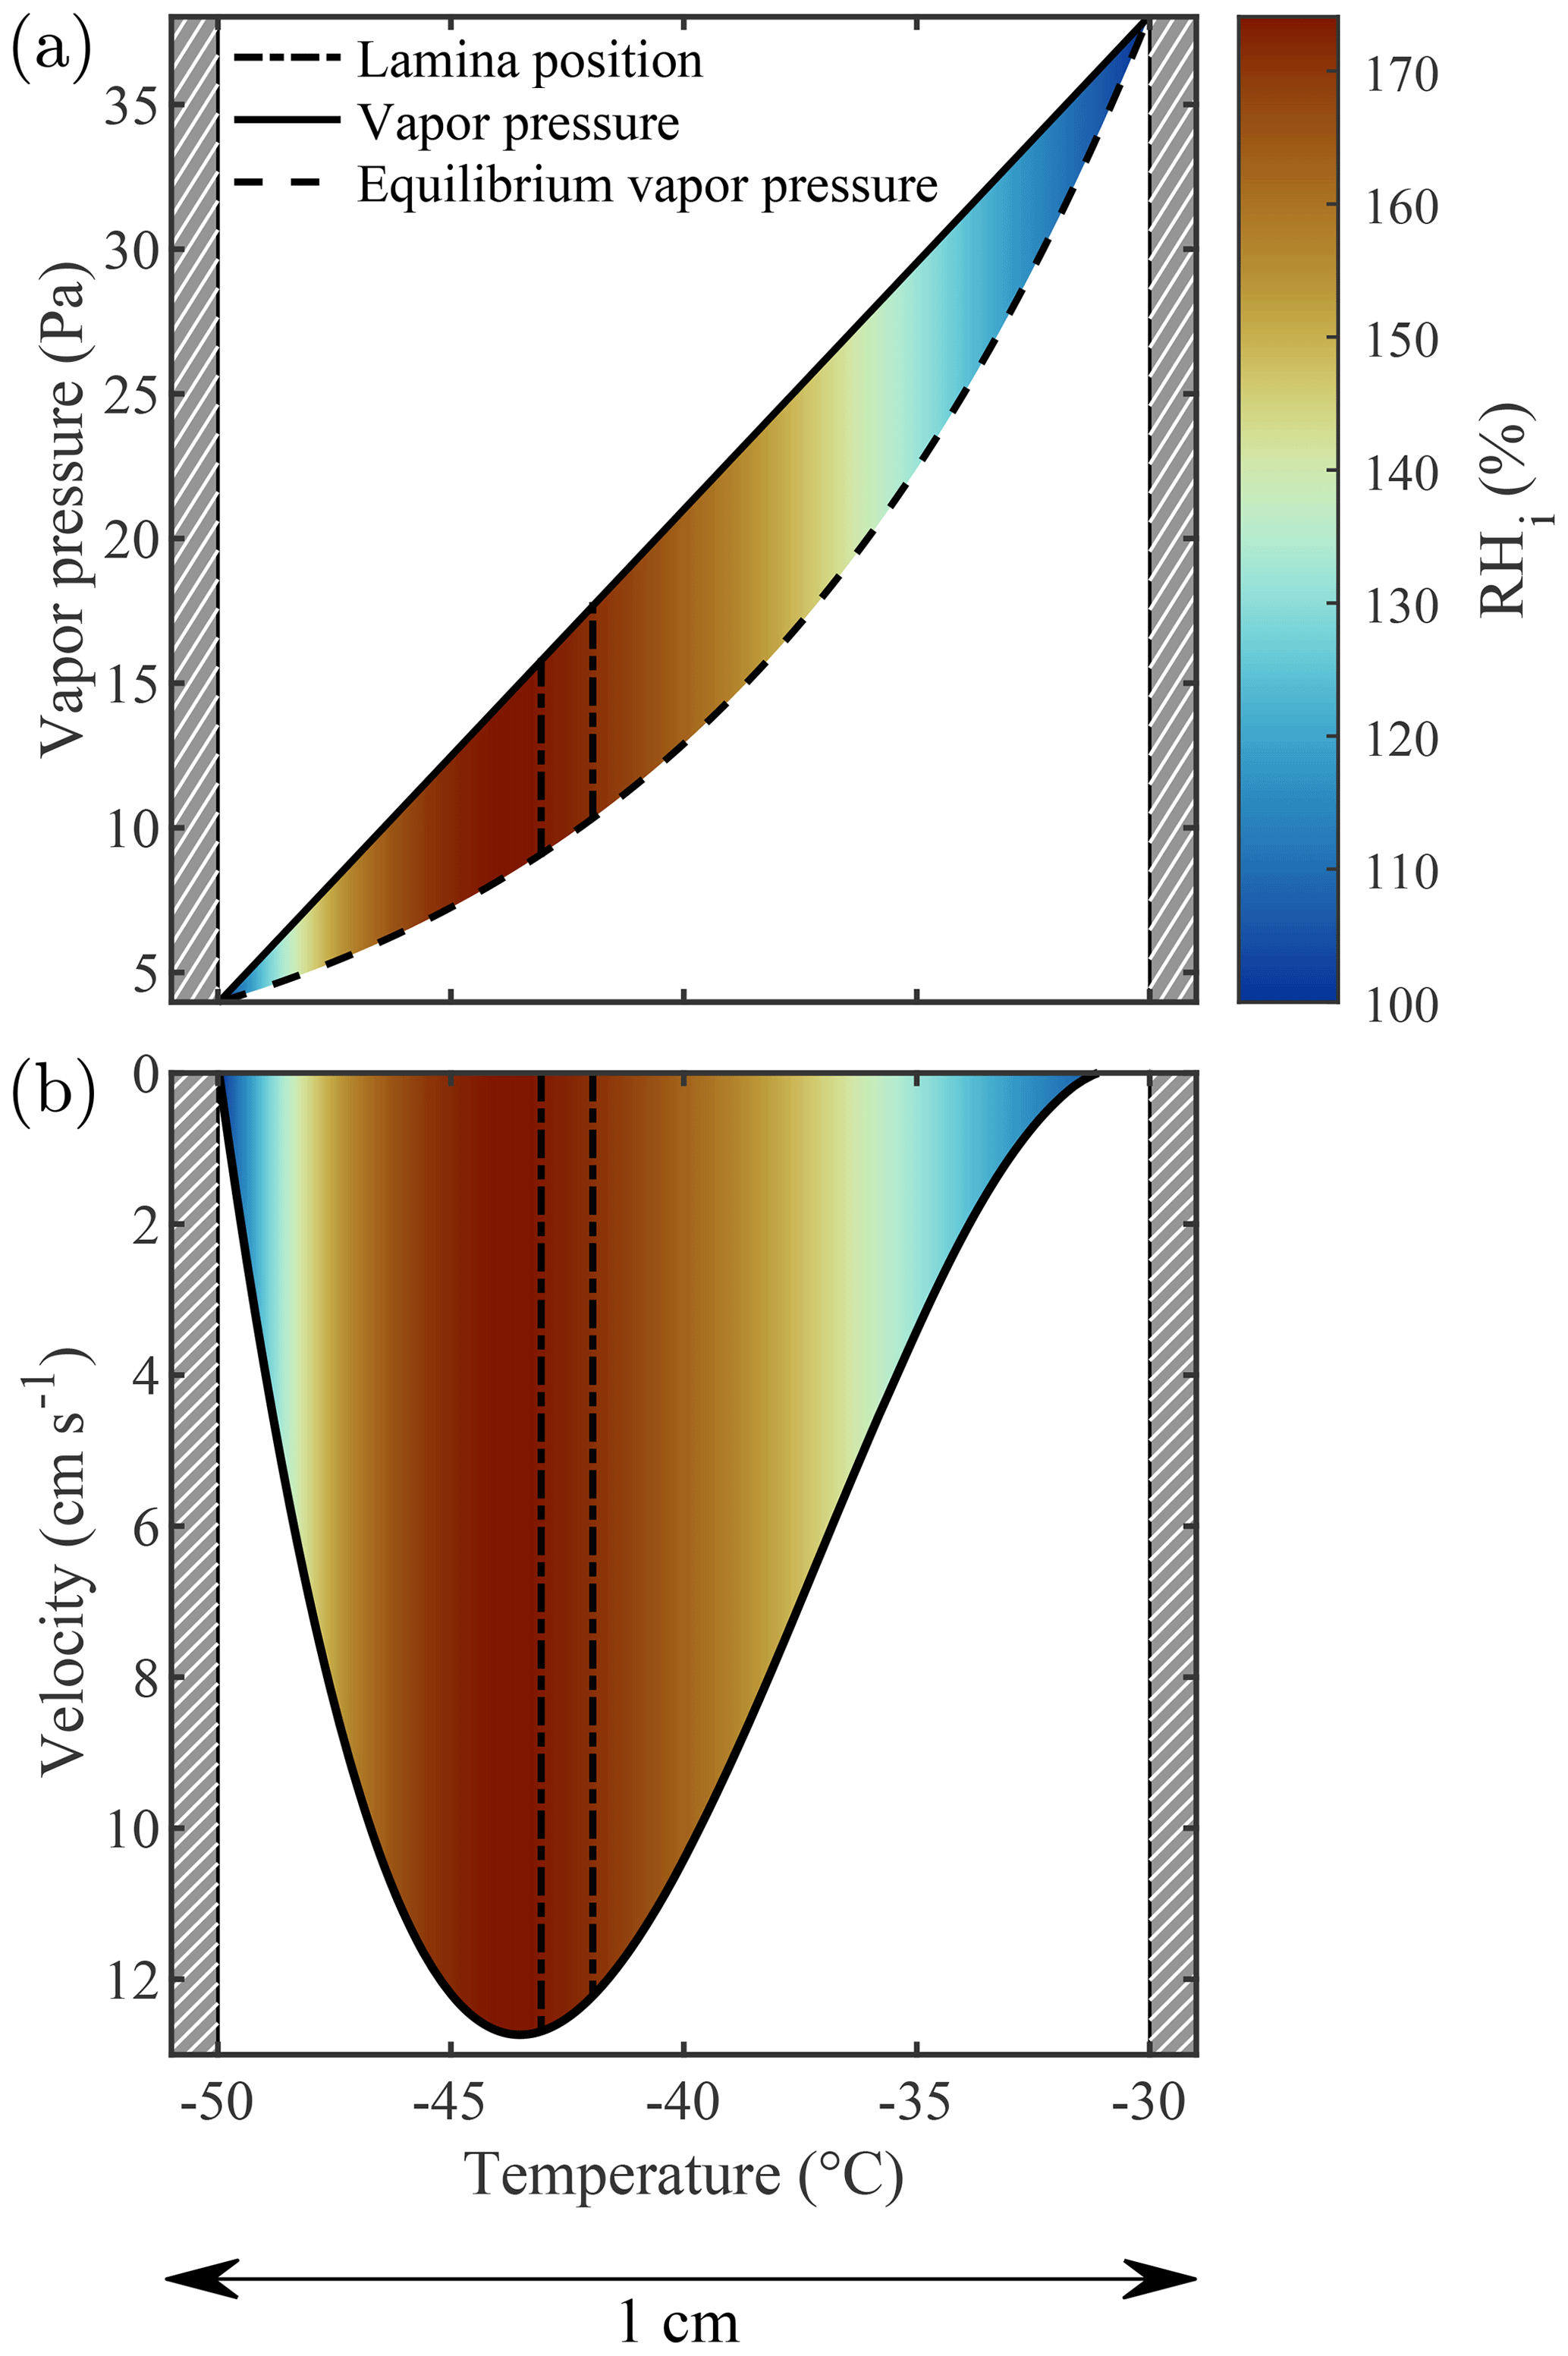
Figure 2Thermodynamic model output for the PINCii main chamber when the cold wall (left) is fixed at ∘C, the warm wall (right) is fixed at ∘C, and the total flow rate is 10 L min−1. In panel (a), the linear gradient of vapor pressure (solid line) is plotted along with the theoretical equilibrium vapor pressure over ice (dashed line). Panel (b) displays the flow velocity profile (solid line). In both panels, the sample lamina position (dot-dash lines), the predicted RHi (color map), and the 1 mm thick ice layers (hatched gray regions) are depicted.
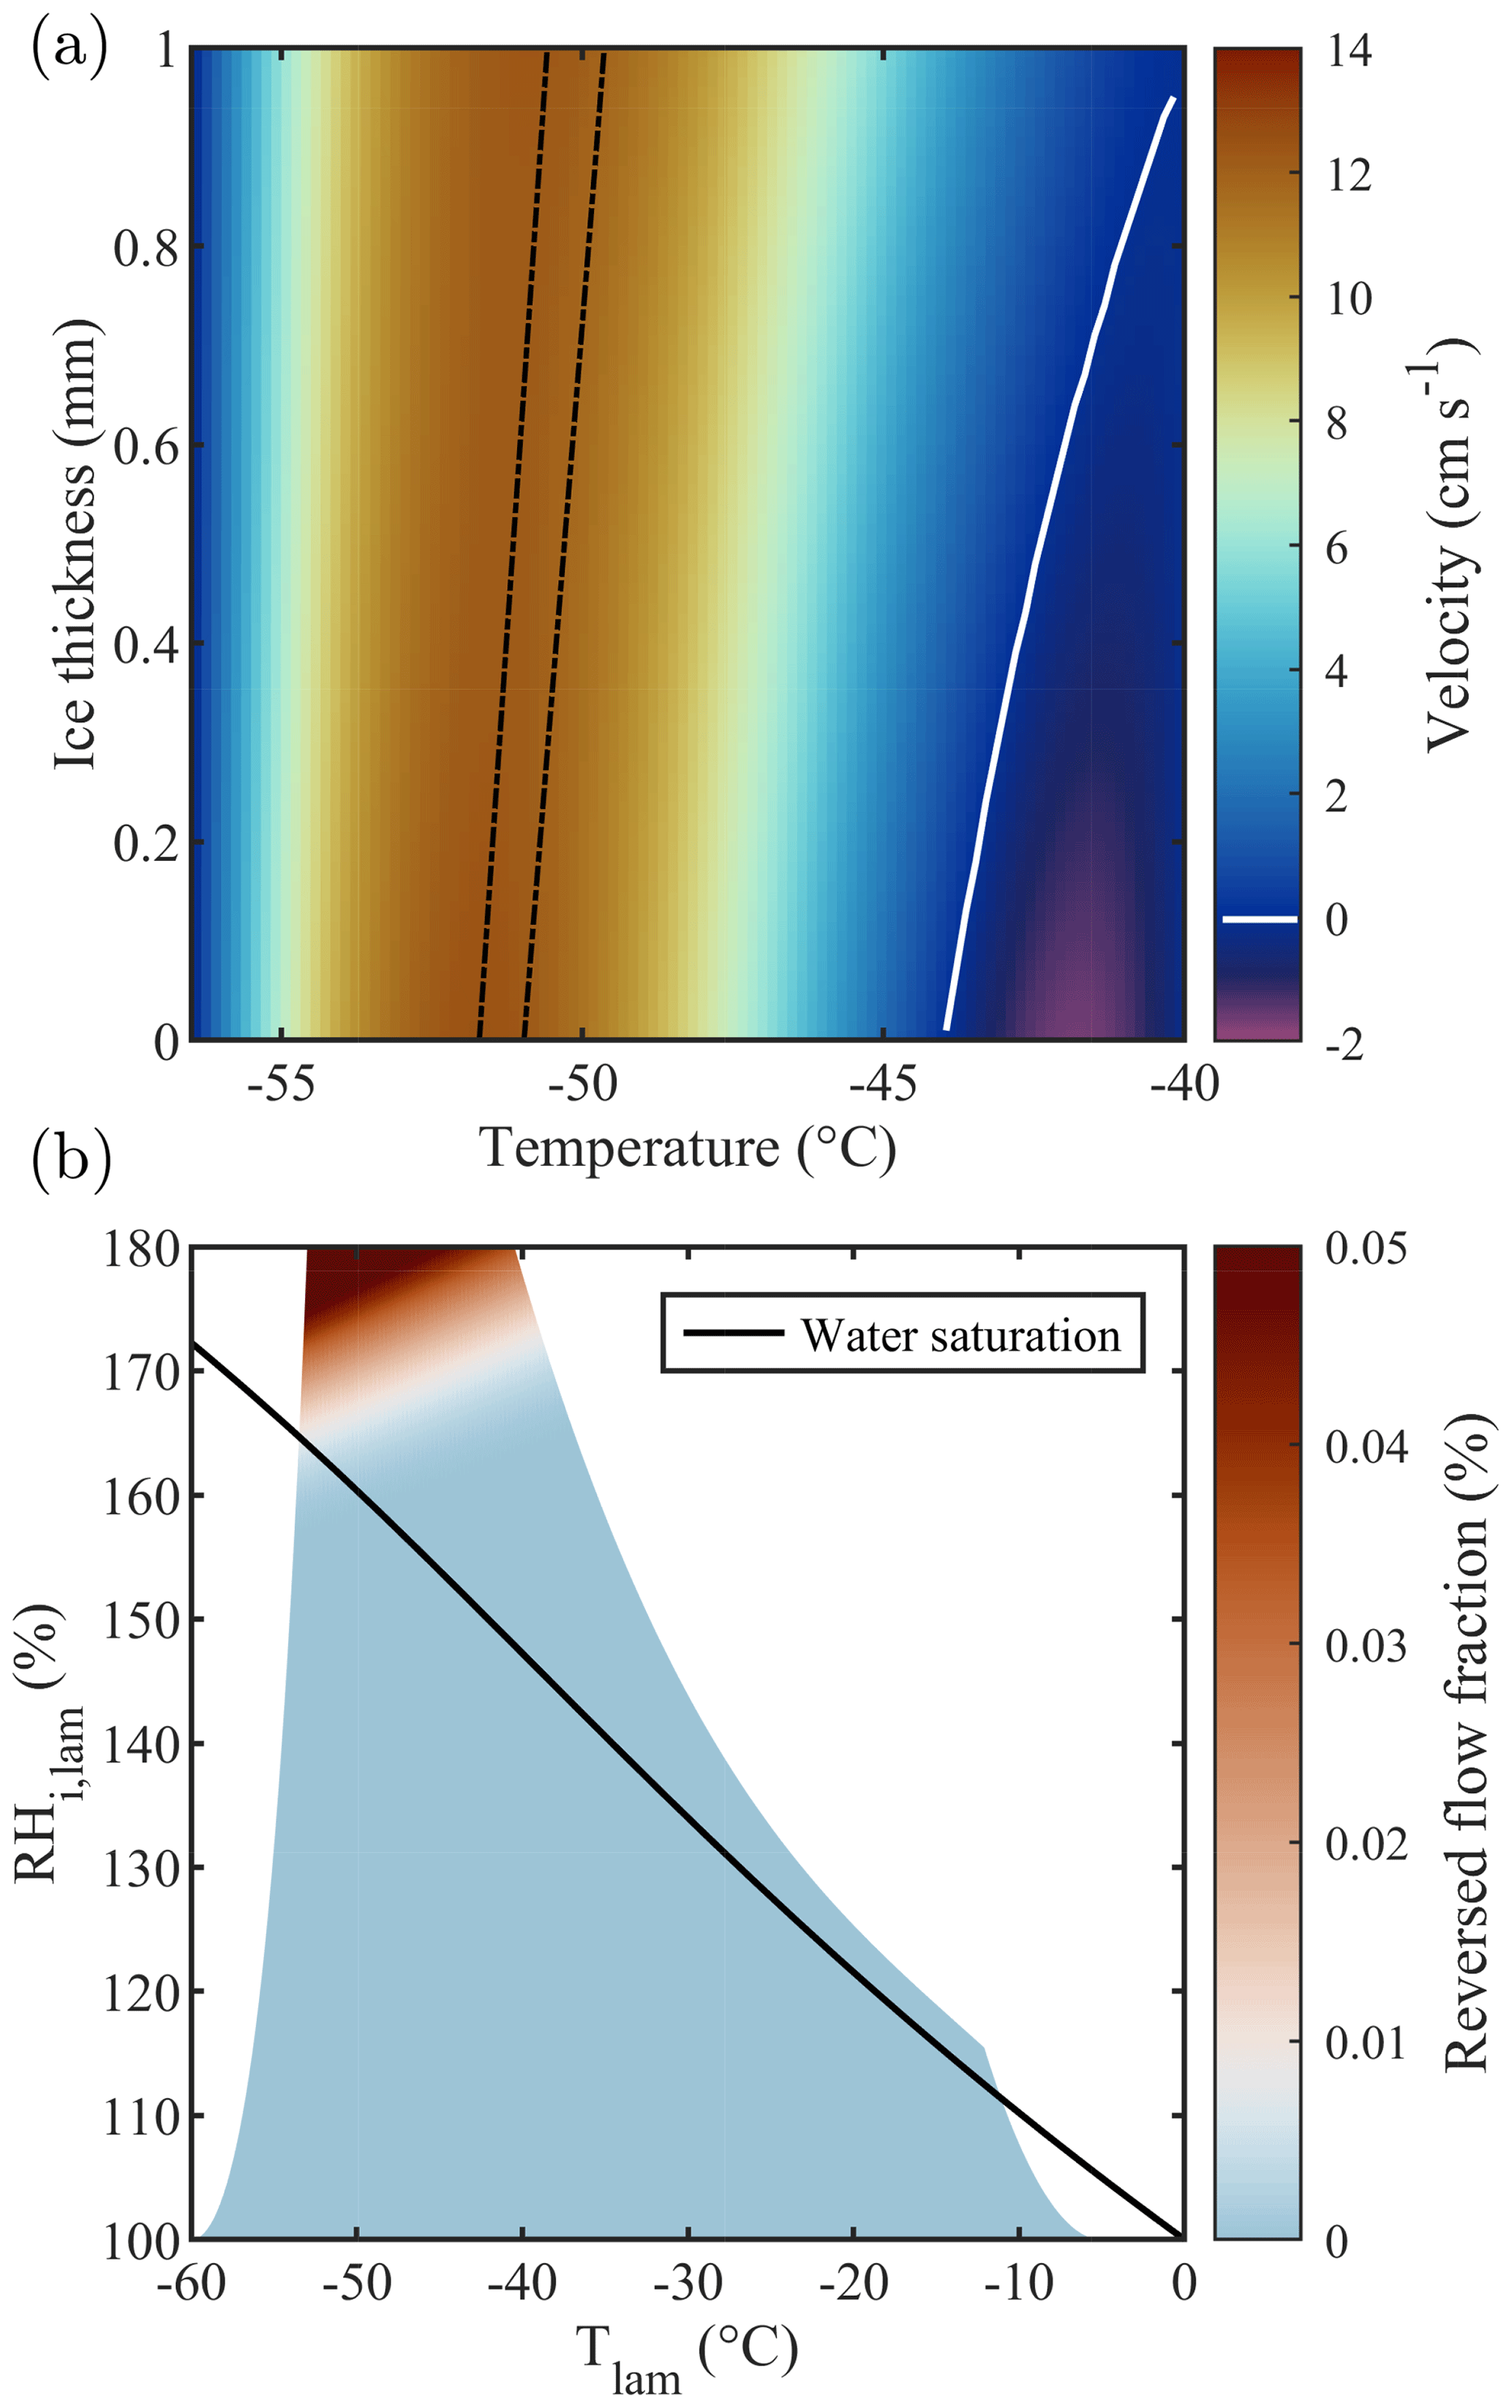
Figure 3(a) Flow velocity as a function of ice thickness for fixed wall temperatures of −40.0 and −56.5 ∘C, chosen to represent homogeneous freezing conditions in PINCii's main chamber. These conditions ( ∘C and RH % at ice thickness =0 mm and ∘C and RH % at ice thickness =1 mm) are representative of extreme chamber operations for PINCii, with the greatest potential for buoyancy effects. The lamina position is depicted by the dashed black lines. The white contour line corresponds to a velocity of 0 cm s−1 and emphasizes where the region with negative velocity starts. Note that the calculations were made for a total flow rate of 10 L min−1. Panel (b) shows the achievable Tlam and RHi,lam assuming fixed wall temperatures between −5 and −60 ∘C and accounting for the droplet breakthrough results presented in Sect. 3.1. The color map represents the reversed flow fraction, defined as the ratio between the reverse (upward) flow and the normal (downward) flow in the chamber, assuming a 1 mm ice layer on each wall. The solid black line represents water saturation (RH %).
The primary goal of this paper is to present the ability of PINCii to operate reliably and precisely at conditions relevant for atmospheric ice nucleation. Thus, the chamber was characterized and evaluated using a series of experiments that induce observable activation and/or nucleation processes and span the range of typical operating conditions. Droplet nucleation, droplet breakthrough, deliquescence, and homogeneous and heterogeneous freezing experiments have been performed and compared to theoretical predictions and previous experimental work (Köhler, 1936; Koop et al., 2000b, a; Welti et al., 2009).
3.1 Droplet nucleation and deliquescence
In addition to its use for ice nucleation experiments, PINCii can be used for droplet activation experiments in which a temperature gradient is maintained along the entire chamber length, including along the evaporation section. This effectively extends the main chamber, allowing droplets to continue to grow and reach the optical detector. In this work, we use this feature to show that the chamber can actively grow droplets. First, we study the droplet activation of polydisperse ambient aerosol particles. We then present a deliquescence experiment with 200 nm sodium chloride (NaCl) particles. For both experiment types, the temperature gradient along the main chamber is extended to the evaporation section, so the evaporation section is no longer evaporating droplets. The objective of these experiments is to evaluate PINCii's performance by comparing the RHlam measured to values predicted by theory and previous laboratory experiments, both for the deliquescence of NaCl and for the droplet activation of polydisperse ambient particles just above water saturation (RHliq=100 %).
Results from the droplet nucleation experiments are presented in Fig. 4. Two experiments were conducted with ambient laboratory air (i.e., polydisperse particles). For these experiments, we expect larger particles (of the order of magnitude of a micrometer) to activate just above water saturation (Köhler, 1936). The experiments were conducted on 2 separate days, and, as the concentration and composition of particles from the ambient laboratory air may have changed from one day to another, the results presented in Fig. 4 were normalized by the maximum droplet concentration reached during each ramp. During the experiments, the RHliq,lam was increased from 90 % to 110 % at a rate of 1 % min−1, and a total of seven ramps were conducted with Tlam between −20 and −35 ∘C. The temperature was kept above −37 ∘C because, at colder temperatures, homogeneous freezing processes obscure observations of droplet formation. For each ramp, droplet activation was observed at RH %, as predicted by the Köhler theory for the activation onset of microscopic particles (Köhler, 1936; Castarède and Thomson, 2018). At RH %, the continually increasing concentrations of hydrometeors with dp≥1 µm may either represent the activation of a larger fraction of the aerosol population, as supersaturation allows small particles to overcome the Kelvin barrier (Thomson, 1872; Orr et al., 1958), or the immersion freezing of nucleated droplets if INPs are present within the sampled particles.
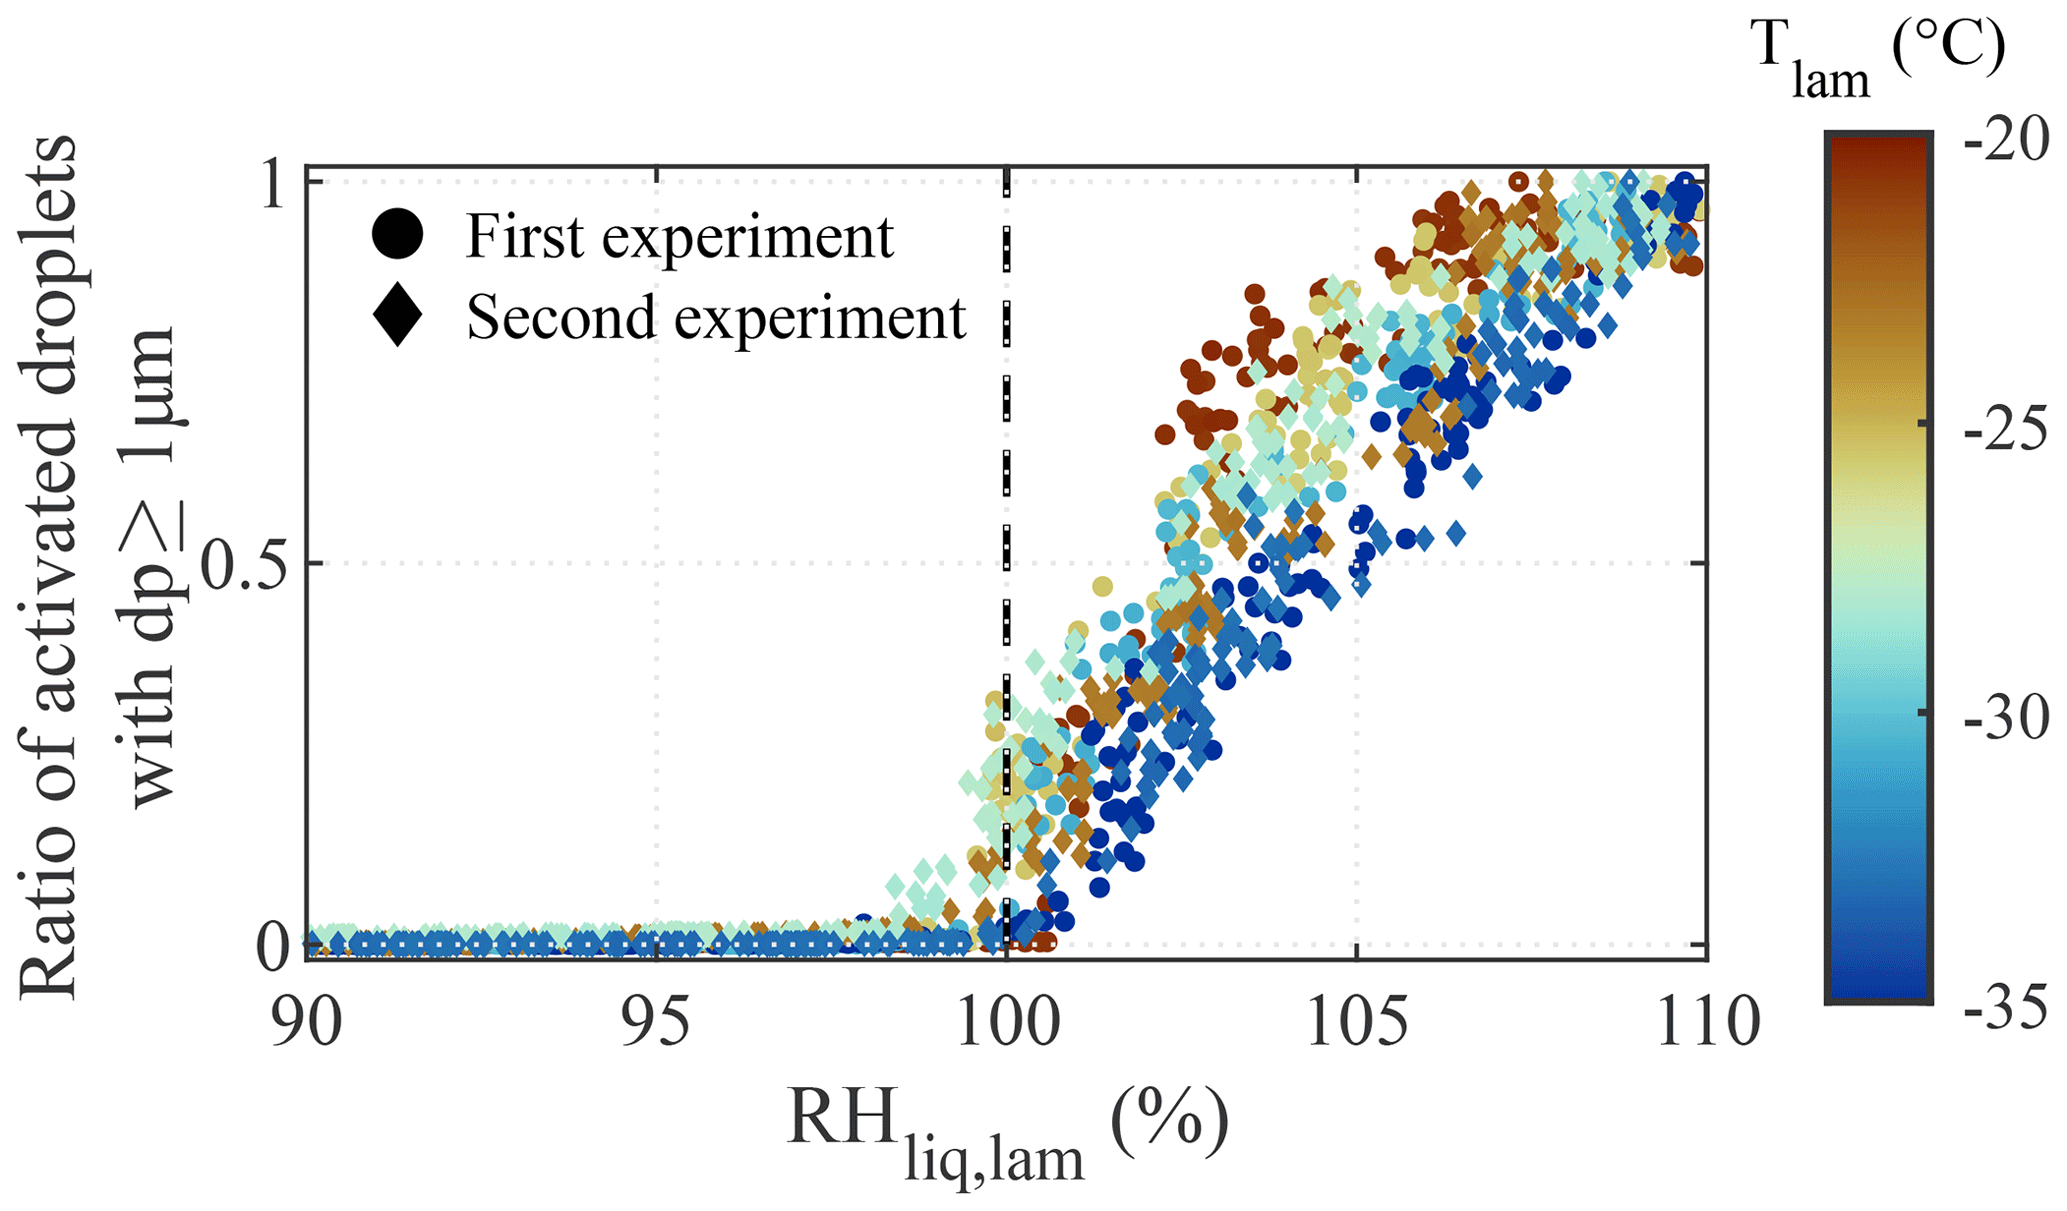
Figure 4Normalized concentration of droplets larger than 1 µm as a function of the RHliq,lam and temperature during the two droplet activation experiments conducted with polydisperse particles from ambient laboratory air. RH ramps were conducted from RH % to 110 % at a ramping rate of 1 % min−1. Droplet formation was observed at RH % (dashed line).
Experiments with deliquescing NaCl were performed to establish PINCii's coherence with theory well below water saturation. Deliquescence represents the transition from a soluble particle to a saturated solution droplet (Hämeri et al., 2001; Cheng et al., 2015; Castarède and Thomson, 2018) and is predicted using Köhler theory, which accounts for the size and composition of the initial particulate and resulting brine droplet (Köhler, 1936; Castarède and Thomson, 2018). The deliquescence experiments were conducted with NaCl particles, which were generated with an atomizer, dried, and then size-selected at 200 nm using an electrostatic classifier and differential mobility analyzer (DMA) (TSI models 3080 and 3081, respectively). The 200 nm NaCl particles were then delivered continuously to PINCii while increasing the RHliq,lam gradually from 70 % to 105 %. Results from the experiment conducted at −35 ∘C are presented in Fig. 5 and compared to experimental deliquescence data obtained at cold temperatures by Koop et al. (2000a). Note that, to account for any variation in the concentration of particles injected in the chamber, the results are presented as the ratio between the concentration of particles measured by the OPC at the exit of PINCii and the total particle concentration measured using a condensation particle counter (CPC; TSI model 3775) mounted in parallel to PINCii's inlet. The deliquescence of the 200 nm NaCl particles is difficult to observe with this setup due to the coarse resolution of the OPC and given that the growth factor for NaCl particles is ≈1.8 when transitioning from their dry to solvated state (Hämeri et al., 2001; Biskos et al., 2006; Cheng et al., 2015). The size transition is, however, visible in the smallest OPC size channel, µm, where we observe an increase in the concentration ratio at RH %, which agrees well with the earlier observations from Koop et al. (2000a) (vertical dashed line in Fig. 5).
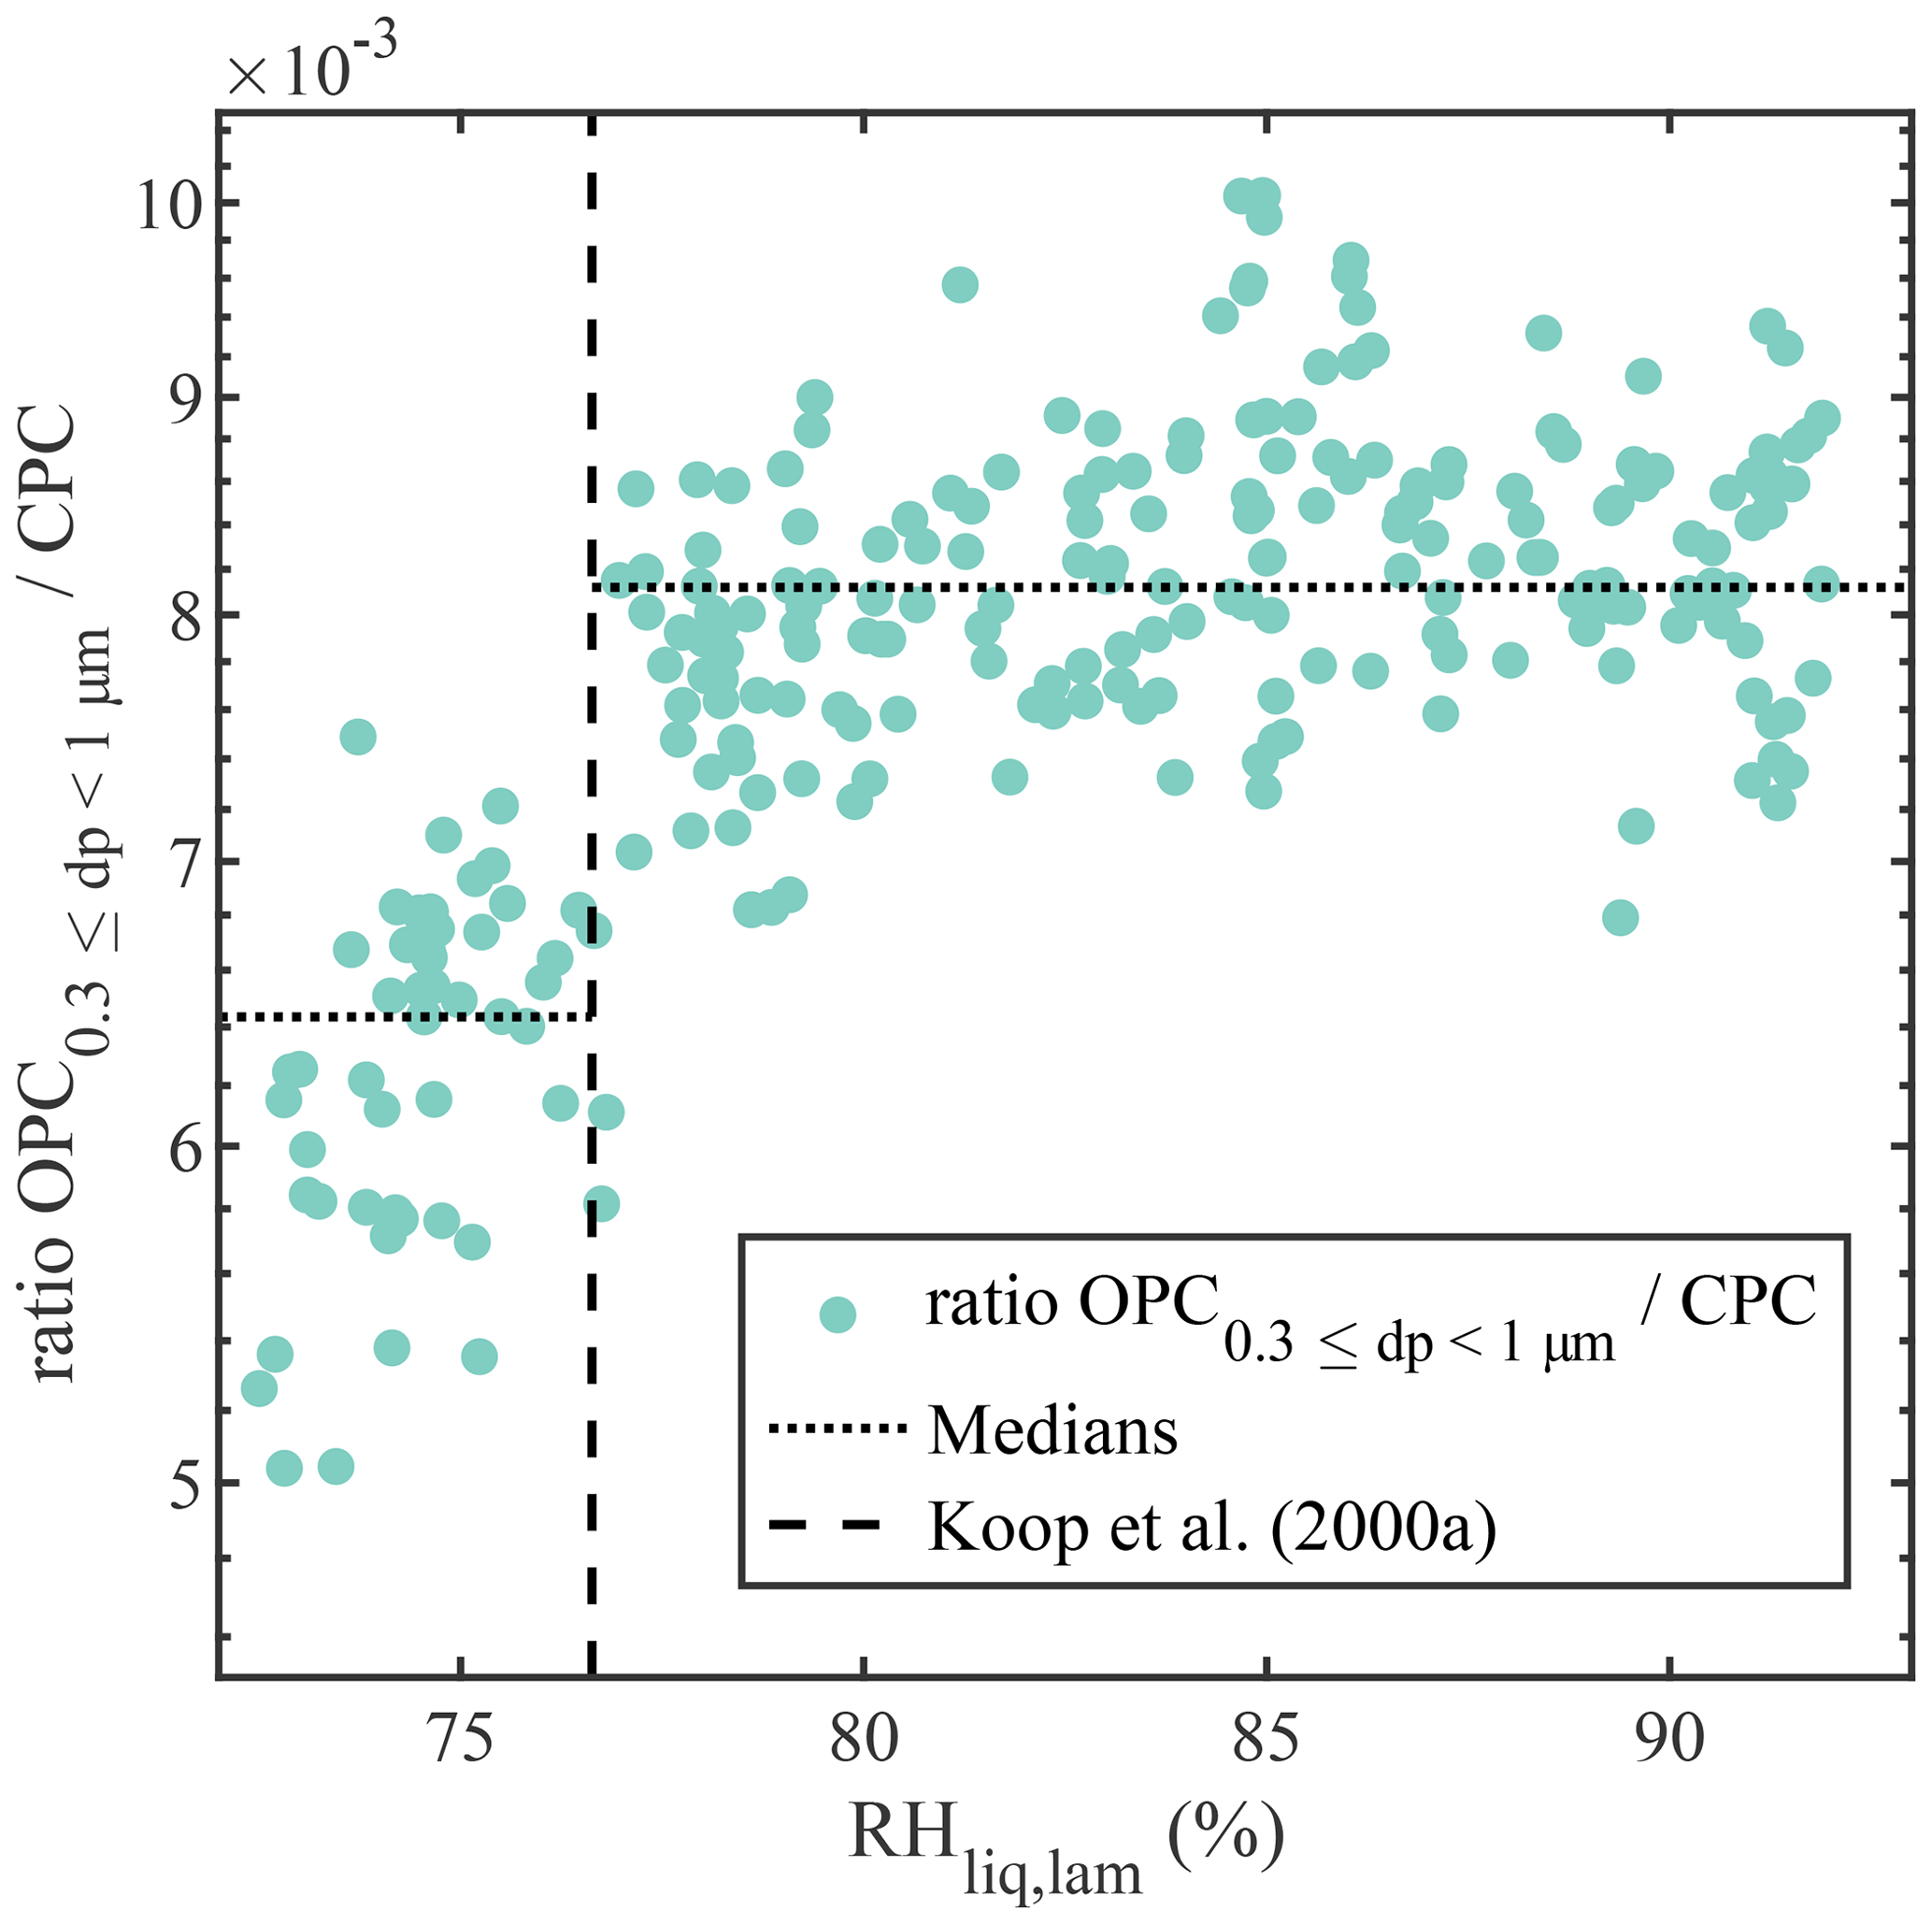
Figure 5Concentration of dry/solvated NaCl particles with µm divided by the particle concentration measured with the CPC mounted in parallel to PINCii's inlet, as a function of RHliq,lam at ∘C. Deliquescence is observed where the concentration increases at RH %, which is the deliquescence relative humidity also reported by Koop et al. (2000a) and represented here by the vertical dashed line. To emphasize the deliquescence, the median values of the concentration ratio before () and after () the deliquescence RH are shown as dotted lines.
These results suggest that PINCii can be used to study droplet activation at cold temperatures. Such a feature could potentially be further developed to use PINCii as a low-temperature cloud condensation nuclei counter (CCNC). This would, however, require a more rigorous characterization of the RHlam and its uncertainty. Indeed, the RHlam within the chamber is inferred based on measurements of the chamber wall temperatures and flow rates and is calculated at the average lamina position using the equations from Rogers (1988). Because the thermodynamic conditions are estimated using numerical routines, it is difficult to calculate the uncertainty in these conditions. Richardson (2009) used Monte Carlo methods to perturb and randomly sample analytical solutions to the Rogers (1988) equations in order to explore the uncertainty in the average lamina conditions in more detail. They found the uncertainty of the average lamina temperature to be insensitive to the wall temperatures and operational conditions, but they observed quite a large uncertainty in the supersaturation values (up to 10 %). Based on this, it is clear that using PINCii to explore low-temperature droplet activation processes would require careful development. For example, more experiments with well-characterized aerosol particles of known size distribution(s) and chemical composition(s) would be necessary and could be used to provide a reference to better constrain the measurements, as suggested by Richardson (2009). Moreover, it would also likely require using an optical detector with more size channels at the exit of the chamber.
3.2 Droplet breakthrough
Droplet breakthrough refers to chamber conditions under which the evaporation section no longer functions effectively to evaporate droplets to sizes at which they can be distinguished from ice crystals. Under these conditions, liquid water droplets grow large enough in the main chamber that they can propagate through the evaporation section and into the optical detector. This results in large droplets being counted in the same size channels as ice crystals; thus, the particle phase can no longer be reliably determined. Some phase-discriminating detectors exist that directly determine the phase during detection (Nicolet et al., 2010; Garimella et al., 2016; Mahrt et al., 2019), but these have other experimental challenges that limit their use. Moreover, for the purposes of a general introduction, the use of the simplified evaporation section-to-OPC coupling is considered to be best practice. With such a system, the results between chambers can be most straightforwardly discussed and the quantification of droplet breakthrough becomes important.
In Fig. 6, results from droplet breakthrough experiments are shown. These experiments were used to characterize the upper limit of the operating conditions for which we can achieve reliable measurements of ice crystals without the impact of droplet breakthrough. The experiments consisted of ramps from RH % to 115 % for four selected Tlam, −20, −25, −30, and −35 ∘C, with an aerosol sample consisting of 200 nm ammonium nitrate (NH4NO3) particles at a concentration of ≈350 cm−3. These particles are not generally ice active and, thus, deliquesce to form droplets and continue to grow with increasing RH (Köhler, 1936). Here, we conservatively define droplet breakthrough as the supersaturation point RHDB where the droplet concentration exceeds 1 cm−3 in the largest size channel (dp≥5 µm; dashed line in Fig. 6). Droplet breakthrough was observed at RHDB of 103 %, 104.5 %, 107.5 %, and 114.2 % for the experiments at Tlam of −20, −25, −30, and −35 ∘C, respectively, indicating that PINCii's evaporation section allows for experiments to be performed at a few percent above water saturation, even at the warmest tested Tlam, without needing to differentiate droplets from ice crystals.
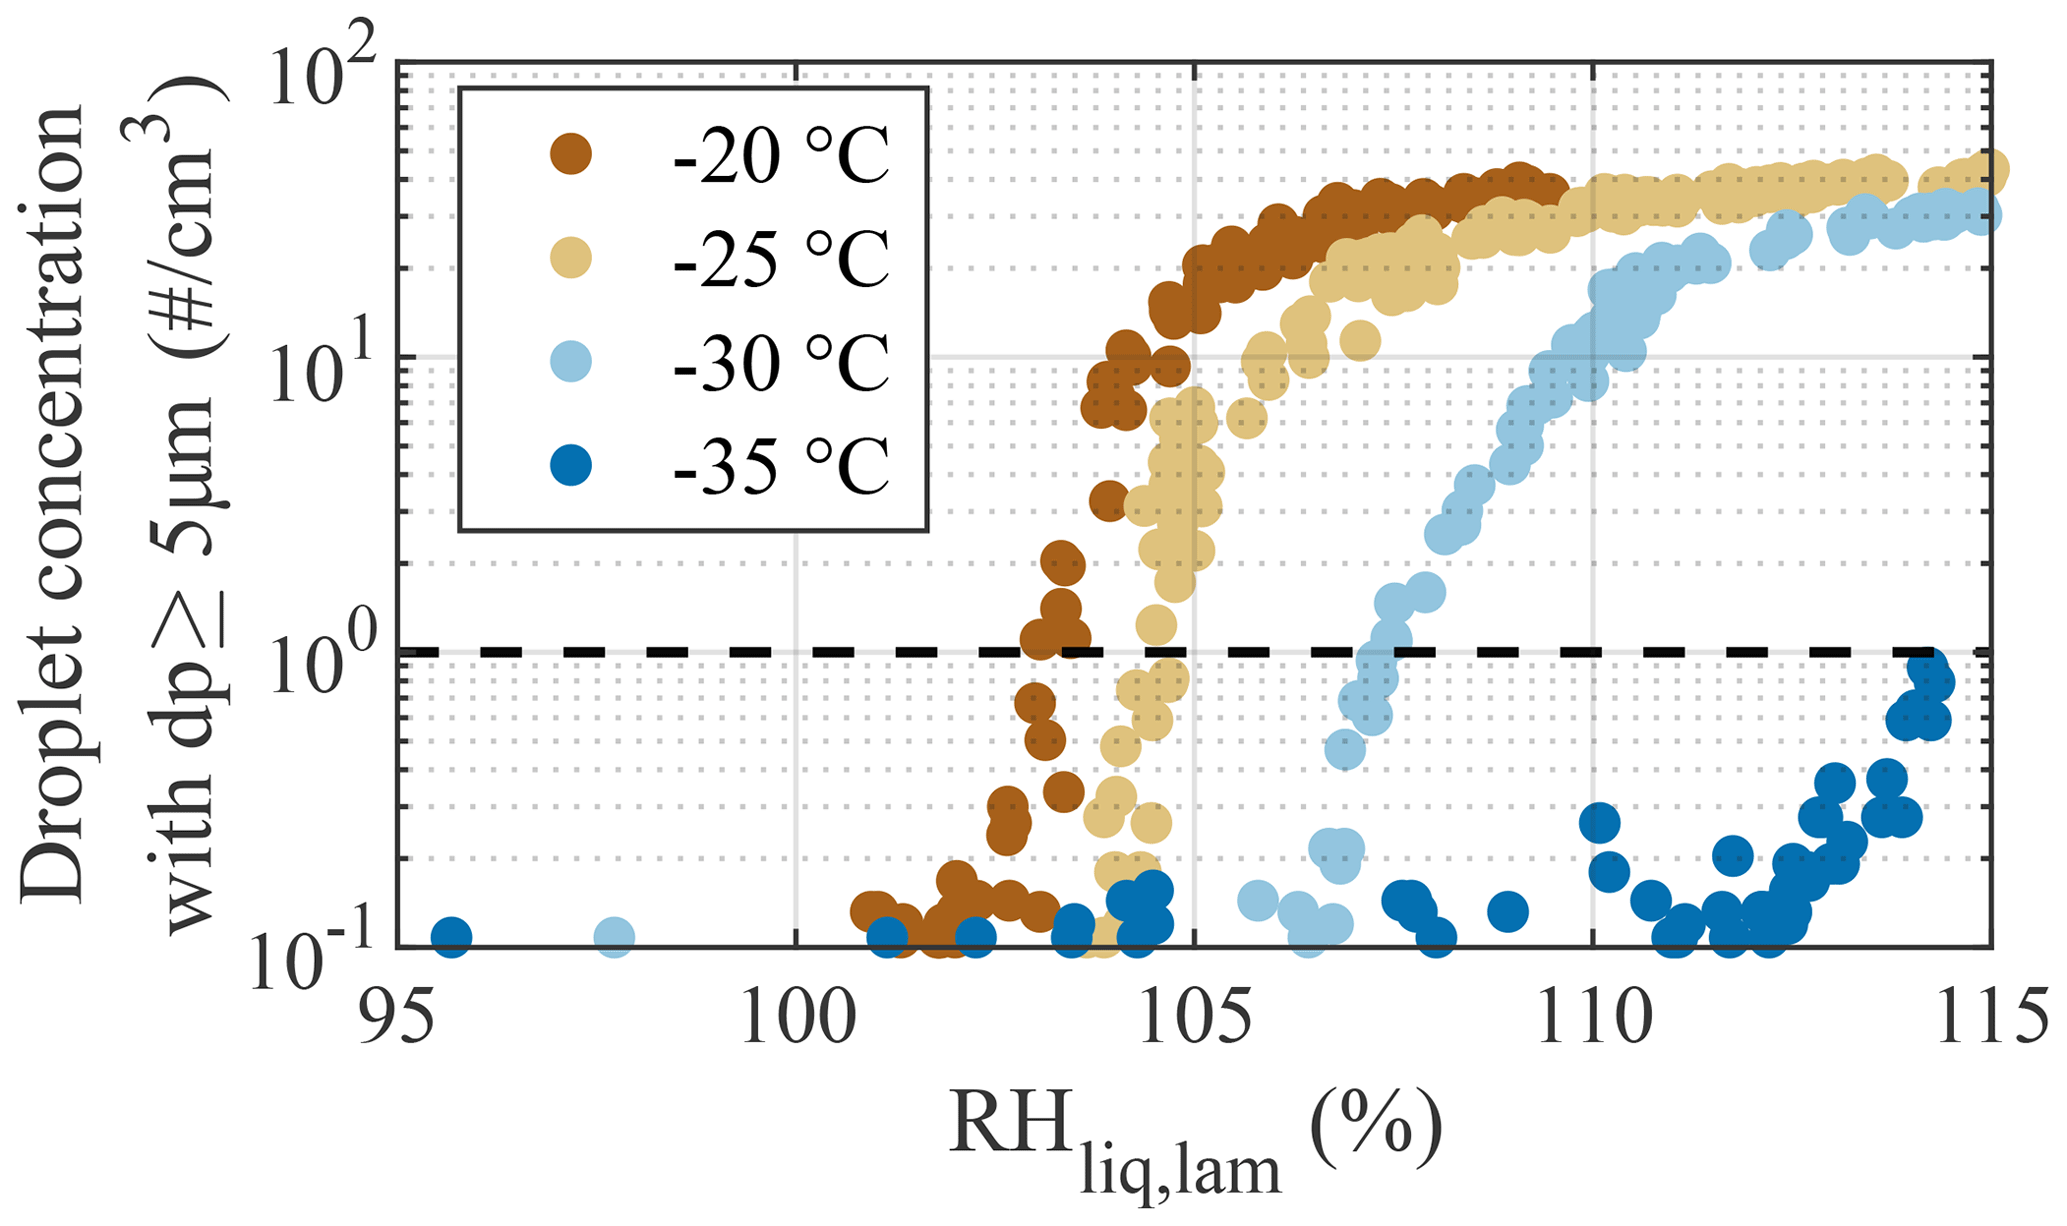
Figure 6Concentration of droplets with dp≥5 µm as a function of RHliq,lam during the droplet breakthrough experiments. RH ramps were conducted from 95 % to 115 % at a rate of 1 % min−1 for four fixed Tlam of −20, −25, −30, and −35 ∘C using 200 nm NH4NO3 particles. Droplet breakthrough is defined as occurring when the droplet concentration exceeds 1 cm−3 (dashed line).
3.3 Homogeneous and heterogeneous freezing experiments
3.3.1 Homogeneous freezing experiments
For comparison with Koop et al. (2000b), who modeled homogeneous freezing from solution droplets, experiments were performed using aerosolized 200 nm NaCl particles at −51 ∘C ∘C, and the results are presented in Fig. 7. The theoretical homogeneous freezing onset is plotted for a water-activity criterion Δaw=0.2946 (Koop et al., 2000b). This water-activity criterion is calculated assuming the homogeneous freezing of pure water at −36.45 ∘C (the warmest homogeneous freezing temperature reported in Murray et al., 2010) and used to represent the homogeneous freezing onset assuming equilibrium conditions. In Fig. 7a, b, and c, the activated fraction (AF) was calculated as the ratio between the concentration of particles exceeding a certain size threshold measured with the OPC and the total particle concentration measured using a CPC (TSI model 3775) mounted in parallel to PINCii's inlet. In Fig. 7a, the observed AF in the largest OPC size channel (dp≥5 µm) is plotted as a function of the average lamina conditions, Tlam and RHlam. Presenting data in this way shows an increasing deviation from the Koop et al. (2000b) curve towards lower RHi,lam as the temperature increases from ∘C, with the maximum deviation at ∘C where the freezing onset is observed 7.2 % RHi,lam below the Koop et al. (2000b) curve. Figure 7a also shows a slight deviation from the Koop et al. (2000b) curve at ∘C, where the freezing onset is observed 1.7 % RHi,lam above the Koop et al. (2000b) curve. These deviations are consistent with previous CFDC observations by Garimella et al. (2016), Welti et al. (2020), and Brunner and Kanji (2021), who attribute these deviations to either uncertainty in the supersaturation or time-dependent effects (aqueous aerosol does not reach equilibrium before freezing).
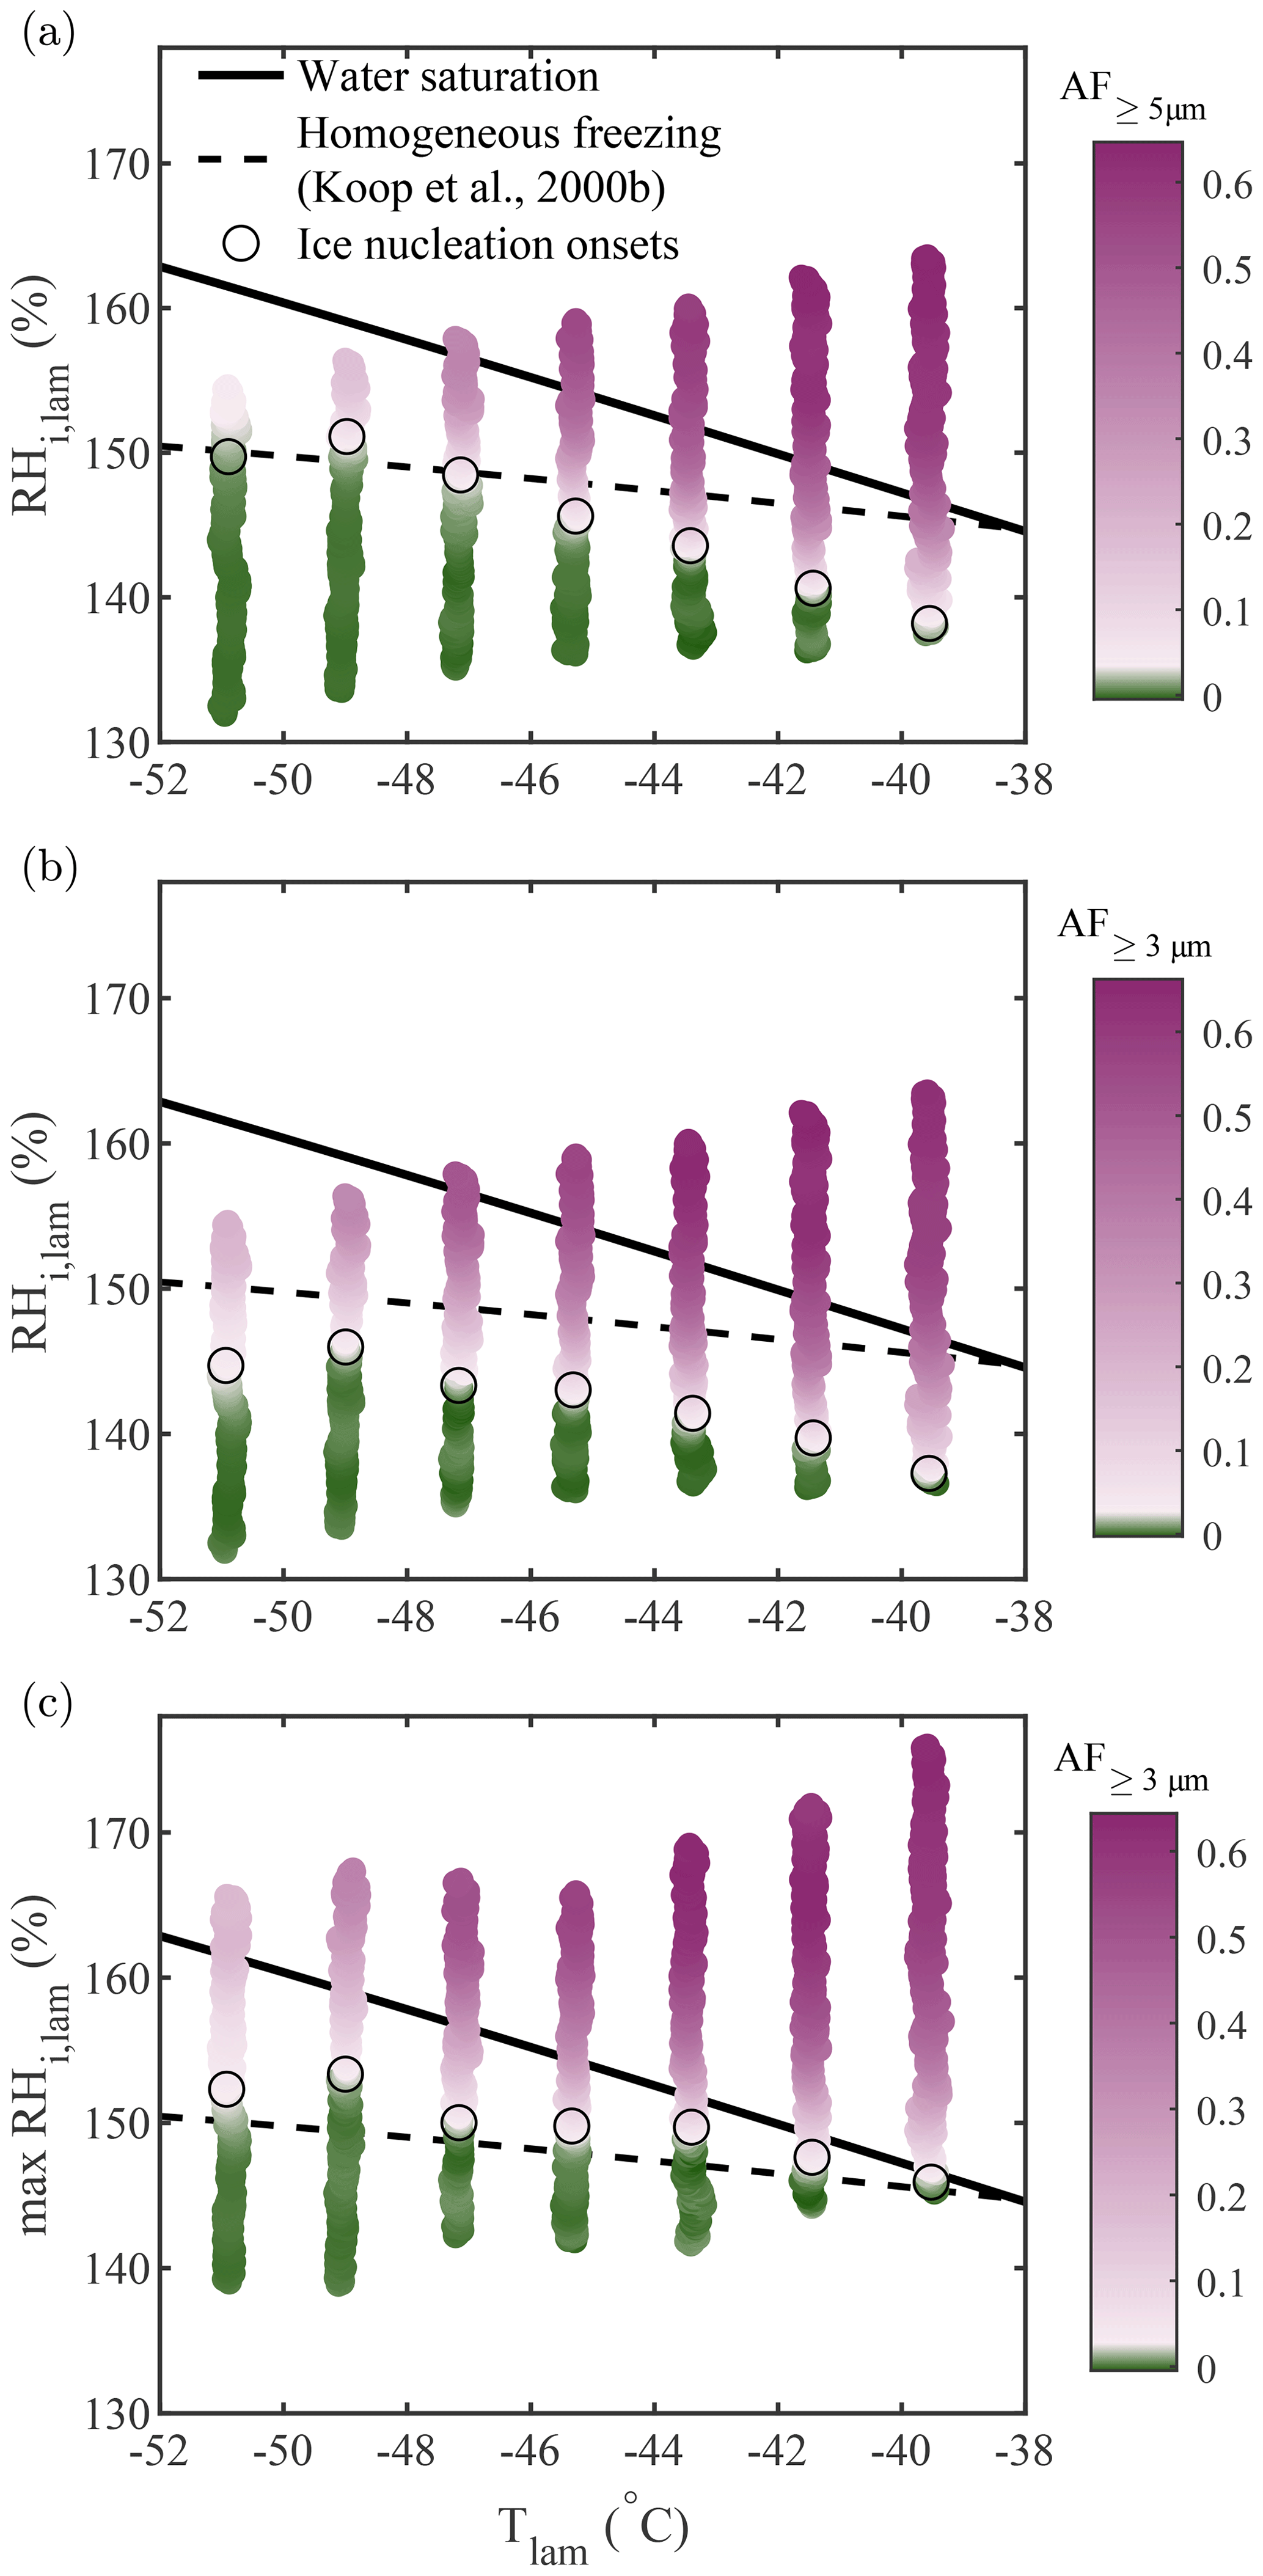
Figure 7Homogeneous freezing of 200 nm NaCl particles plotted using the AF as a function of Tlam and RHi,lam represented in three different manners: (a) the AF of aerosols with dp≥5 µm plotted as a function of the average Tlam and RHi,lam, (b) the AF of aerosols with dp≥3 µm plotted as a function of the average Tlam and RHi,lam, and (c) the AF of aerosols with dp≥3 µm plotted as a function of the average Tlam and the maximum RHi,lam. The theoretical curves for water saturation (solid black line) and homogeneous freezing (dashed black line, calculated with Δaw=0.2946 following Koop et al., 2000b) were added for supplementary information. In each plot, the color scale is used to represent changes in the AF. The lightest pink region in the color bars represents the ice nucleation onset (also highlighted by the black circles), which was estimated using the median of the inflection points obtained for each activation curve (see Sect. A1 for more information).
In Fig. 7b, the size threshold used to calculate the AF is changed from 5 to 3 µm to account for the fact that the growth of ice crystals becomes kinetically limited as temperature decreases (Rogers and Yau, 1989; Welti et al., 2020) and that, as a result, a fraction of nucleated crystals do not have long enough residence times to grow to sizes ≥5 µm to be counted in the OPC's largest detection channel. This is confirmed by calculating the ice crystal growth by diffusion for spherical ice crystals as a function of temperature for the typical residence time (tres≈15 s) in PINCii (see Fig. A3 in the Appendix). Following Welti et al. (2020), we determine that ice crystals grow up to 2.74 µm at ∘C and RH % when using a mass accommodation coefficient for ice α=0.3 and an initial seed particle diameter dp=200 nm. Although the change in the size threshold does not affect the activation curves for ∘C, the ice nucleation onsets shift towards lower RHi,lam for ∘C, illustrating the existence of activated ice crystals that have not grown fully to 5 µm for these temperatures. Note that similar observations were made by Burkert-Kohn et al. (2017), who compared two CFDCs using different size thresholds, and by Brunner and Kanji (2021), who used different size thresholds for different measurement regimes. Given that, in these cases, the activation onset is observed below water saturation, there is no risk that lowering the size threshold for counting ice would introduce droplet counting (see Sect. 3.2). However, kinetic limitations are not sufficient to explain the observed deviations, as Fig. 7a and b still show ice activation at a lower driving force than predicted by the theoretical homogeneous freezing onset (Koop et al., 2000b).
An alternative explanation for the observed deviations can be found by looking at the conditions triggering homogeneous freezing. Homogeneous freezing is an irreversible process during which ice formation occurs well above the equilibrium vapor pressure. Moreover, when the right conditions for nucleation exist and ice formation is stimulated, it will quickly drive water vapor towards the ice phase due to the strong supersaturation. This suggests that the critical condition for ice formation in PINCii is the lamina condition that represents the strongest p (i.e., the most extreme ice-triggering condition). The high spatial resolution of PINCii's temperature monitoring (thermocouples in Fig. 1) enables us to identify chamber wall temperature anomalies and calculate lamina conditions in more detail when post-processing the experimental data. The method used to identify the most extreme conditions is described in Castarède (2021), and we briefly summarize it here. The idea behind this method is that, if a specific location within the chamber favors homogeneous freezing, i.e., conditions above the Koop et al. (2000b) line, any ice crystals formed will continue to grow, even if the remaining aerosol trajectory experiences less favorable conditions for homogeneous freezing, i.e., conditions below the Koop et al. (2000b) line. In practice, the most extreme conditions are determined as outlined in the following. First, the lamina conditions (Tlam and RHlam) are calculated for each pair of opposing thermocouples. Ideally, the next step would be to determine the Euclidean distance between each lamina condition and the Koop et al. (2000b) line. The closest point to the Koop et al. (2000b) line would then be identified as the most extreme condition if all data points are below it. If one or more data points are measured above the Koop et al. (2000b) line, the point furthest above it would be considered the most extreme condition. More details can be found in Sect. 3.3.4 and Fig. 3.8 of Castarède (2021). It is important to note that we use the Koop et al. (2000b) line as a reference to compare our results because it is a widely accepted approximation of homogeneous ice nucleation, even though previous studies have shown deviations from this line (Garimella et al., 2016; Welti et al., 2020; Brunner and Kanji, 2021; Schneider et al., 2021). Moreover, as the onset of homogeneous freezing is only weakly dependent on temperature compared with saturation conditions and considering that the uncertainty associated with Tlam in the homogeneous freezing regime is low (see Fig. 12b), the method described here can be simplified by finding the highest within the lamina, which then represents the most extreme conditions.
To validate this new method for analyzing homogeneous freezing data, it was also applied to a more complex natural salt sample collected from a saline lake in the Qaidam Basin, China. More details concerning the sample collection and composition can be found in Kong et al. (2022). The sample was wet-dispersed and size-selected (200 nm), and (when the results were plotted against the greatest RHi,lam while using a size threshold of dp≥3 µm) the activation onset matched the Koop et al. (2000b) prediction for the entire temperature spectrum, as shown in Fig. A1.
3.3.2 Heterogeneous freezing experiments
Heterogeneous freezing experiments are significantly more problematic to predict than homogeneous freezing, and no robust theory for a priori prediction is widely accepted. Even relying on past measurements can be problematic, as uncontrolled variables, such as differences in experimental setups and material changes, can affect results substantially. That said, certain materials such as minerals, like NX illite, potassium feldspar (K-feldspar), and bacterial INP (e.g., Snomax®), have seen widespread use in laboratory tests of heterogeneous ice nucleation and for instrument intercomparison purposes (Welti et al., 2009; Hiranuma et al., 2015; DeMott et al., 2018). Here, we used NX illite (NX Nanopowder, Arginotec; see Hiranuma et al., 2015, for more information concerning the sample composition) from which particles were dry-generated and size-selected at 200 nm using the DMA. We conducted the experiments at fixed Tlam and with RHi,lam ramped linearly from RH % to RH % at 1 % min−1. In Fig. 8, the observed AF for particles with dp≥3 µm is plotted and compared to experimental observations from Welti et al. (2009), who performed similar experiments using the laboratory-based ZINC instrument (Stetzer et al., 2008). Figure 8 shows that our measured freezing onsets are in good agreement with the earlier measurements, with the exception of the ∘C scan, where we observe activation at an RHi,lam approximately 30 % below the RHi,lam of the onset reported by Welti et al. (2009). The deviation may partly result from uncertainty related to the lamina conditions, as discussed in the following section (see Sect. 4.3). Welti et al. (2009) reported a temperature dependence of the freezing onset for −40 ∘C ∘C, where one might expect Tlam to greatly influence the results. DeMott et al. (2018) also reported a strong sensitivity of NX illite to RHliq,lam and suggested that it might be partly responsible for the wide range of AF values obtained for NX illite experiments conducted with CFDCs. In addition, Hiranuma et al. (2015) mentioned that using different sample preparation techniques and measurement methods can result in different AF values, even when identical test samples are used. In our case, although we used the same sample as Welti et al. (2009) (NX Nanopowder, Arginotec), we followed two different sample preparation methods which could also partly explain the deviation observed. Indeed, Welti et al. (2009) used a fluidized bed aerosol generator (TSI model 3400A) to generate the particles, whereas, in our case, the particles were dry-generated using dried and filtered compressed air flowing vertically through a glass filter containing the dust sample and were subsequently mixed into a large volume to homogenize the sample before being transported to the DMA. It is important to note that evaluating experimental observations using other experimental observations comes with multiplicative uncertainty, and large deviations may result from accumulated uncertainty for both instruments. Such observations further motivate the thorough identification and quantification of instrumental uncertainties, which we discuss in the following section.
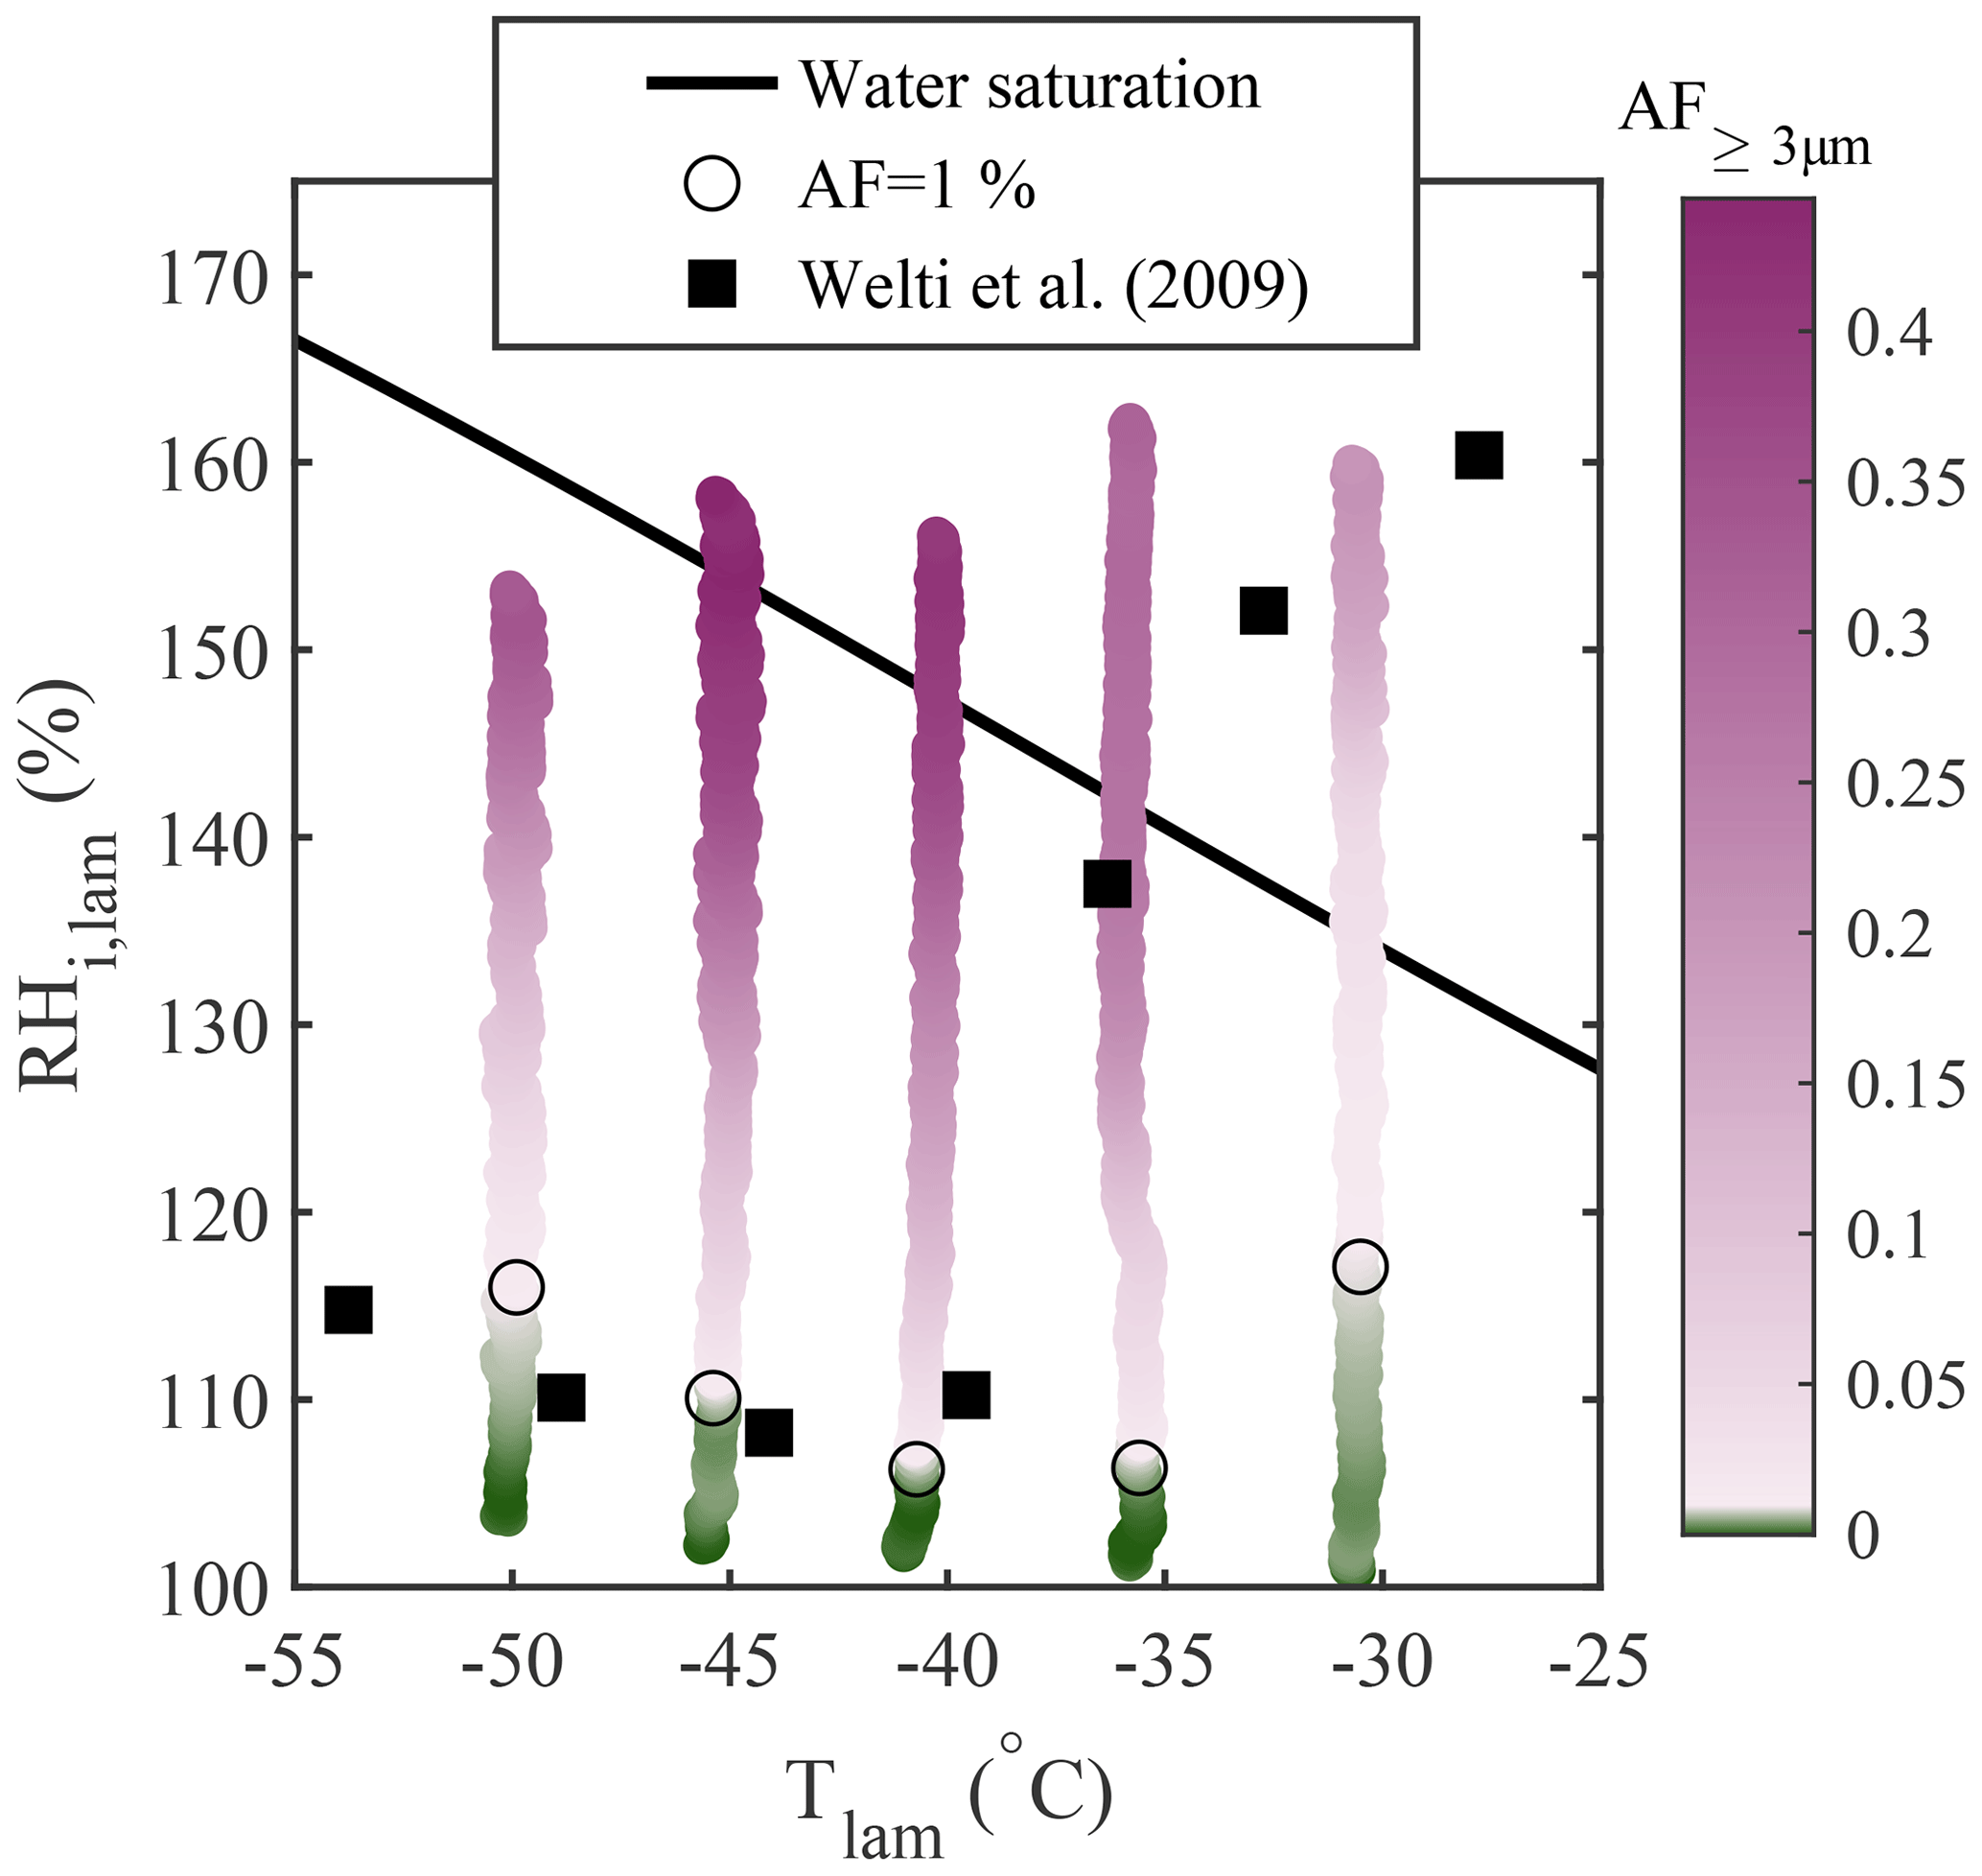
Figure 8Heterogeneous freezing of size-selected 200 nm NX illite particles. The AF of aerosols with dp≥3 µm is plotted as a function of the average Tlam and RHi,lam. The lightest pink region in the color bar represents AF =1 % (also highlighted by the black circles). For comparison, the AF =1 % onset of similar particles reported in Welti et al. (2009) is shown as black squares.
Chambers like PINCii come with inherent uncertainties that range from engineering choices to user-determined experimental implementations and settings. For vertically oriented CFDCs, the condensed ice layer is one known source of uncertainty. Ice crystals can detach from the wall and fall through the chamber and into the detector, being mistaken for nucleated crystals; this is generally referred to as the chamber “background”. In order to correct for this effect, checks are done during every experiment by sampling from clean, particle-free air. The measured background concentration is then subtracted from the concentration measured during ambient/sample measurements. The intermittency and averaging method used for both background and sample measurements are determined by the user and should be optimized for the systems being studied. Another source of uncertainty related to vertically oriented CFDCs is the deviation of the lamina position. Indeed, the temperature gradient applied to create the supersaturation condition can slightly shift the lamina position, which is then no longer at the center of the chamber (Fig. 2). In addition, steady-state modeling shows that, in certain cases where the temperature gradient is large, buoyancy processes become important and can lead to flow reversal (Rogers, 1988; Garimella et al., 2016), although (as shown in Fig. 3) this also depends on the thickness of the ice layer. Given these inherent sources of uncertainty, it is important to quantify the fraction of particles exposed to lamina conditions that deviate from the prediction, as well as the fraction of particles lost within the chamber. In addition, the complex combination of PID-controlled heating pads and pulse-injected refrigerant may result in wall temperature fluctuations which also increase uncertainty in the temperature and humidity conditions to which particles are exposed. This is explored in depth in Richardson (2009), who modeled the responses of the thermodynamic variables in the aerosol lamina to different temperature perturbations (temperature oscillations, gradients, etc.) and investigated the impact of these thermal non-idealities on freezing conditions.
4.1 Background
The ice coating on the chamber walls is one of the main limitations of vertical CFDC instruments. The quality and durability of the ice coatings determine the INP detection limits and the duration of instrument operation. Because the temperature gradient results in vapor diffusion from the warm wall to the cold wall, and thus in a net evaporation of the warm wall's ice layer, no CFDC has an unbounded running time. Typical operational times of 4–6 h between re-icing can be expected for CFDCs (Chou, 2011; Garimella et al., 2016; Lacher et al., 2017; Brunner and Kanji, 2021). However, these operational times are greatly affected by the initial quality of the ice layer. When the ice layers become unstable and increase the background, the CFDCs typically need to be warmed, drained, re-cooled, and re-iced to continue experiments.
Here, we briefly present the specifics of the icing procedure used with PINCii so that it may be adopted for future use. First, the main chamber walls are fixed at −23 ∘C and the evaporation section is fixed at −20 ∘C. Water is then flowed into the chamber via the exit hole (k in Fig. 1) at a flow rate of ≈6 L min−1 until the water level sensor detects water and stops the filling. After a delay of 5 s, the water is drained from the chamber using the same exit hole. When water flows into the chamber, it begins to freeze on the walls and the latent heat release warms the walls to nearly 0 ∘C. To avoid overly rapid cooling, which would deteriorate the quality of the ice coating and lead to high background counts, the set-point temperatures are changed from −23 and −20 to −5 ∘C while the water is being drained out. Then, both wall temperatures are decreased stepwise by 5 ∘C increments, and the temperature is stabilized at each interval until the desired experimental conditions are reached. Throughout the process, a 10 L min−1 flow of dry nitrogen is introduced through the sheath flow inlets in order to sublimate structural heterogeneities from the ice coating. Note that, in the field, the dry nitrogen is sometimes replaced by dry, particle-free air. When the desired experimental conditions are achieved, the outlet (which tends to accumulate water) is dried before the OPC is reattached. This is typically done using lint-free laboratory tissue or gently blowing pure nitrogen at the outlet while keeping the outlet valve closed. Although no direct measurements were realized, results from background measurements show that this icing procedure tends to stabilize the ice layers and lead to low and stable backgrounds.
Figure 9 shows the evolution of the background counts from good to mediocre after successive RHi,lam ramps at different temperatures. The shown data originate from two identical experiments that were conducted during a measurement campaign (RHi,lam ramped from 110 % to 160 % at Tlam −26, −38, and −50 ∘C, and each experiment took place over the course of ca. 3.5 h). It is important to note that experiments are typically done with ramps from the warmest to the coldest temperatures, as we have observed that doing so helps preserve a good background. Figure 9 shows the background counts with a new ice layer before the first ramp and at the end of the experiments after three ramps, when the ice layer had deteriorated. With a fresh ice layer, the background of PINCii is low, with 67 % of all data points (standard OPC sampling rate of 0.2 Hz) being zero counts (0 counts L−1) and 90 % of all counts being ≤4.8 counts L−1. However, after three RHi,lam ramps, the ice layer clearly deteriorated and the median background count was 60.0 counts L−1, which was too high to continue with the measurements. The authors want to emphasize that the chamber conditions during these experiments are far from ideal for preserving a mint layer of ice, but they do represent a real-world example, and potential users should be aware that the ice layer conditions evolve when conducting experiments. Overall, if the ice layer in PINCii is in good condition, the background is very stable and at the lower end of background measurements reported from earlier CFDCs, which typically range from 1 to 10 counts L−1 (Chou, 2011), and it is also within the same order of magnitude as backgrounds obtained in more recent studies (Boose et al., 2016; Lacher et al., 2021).
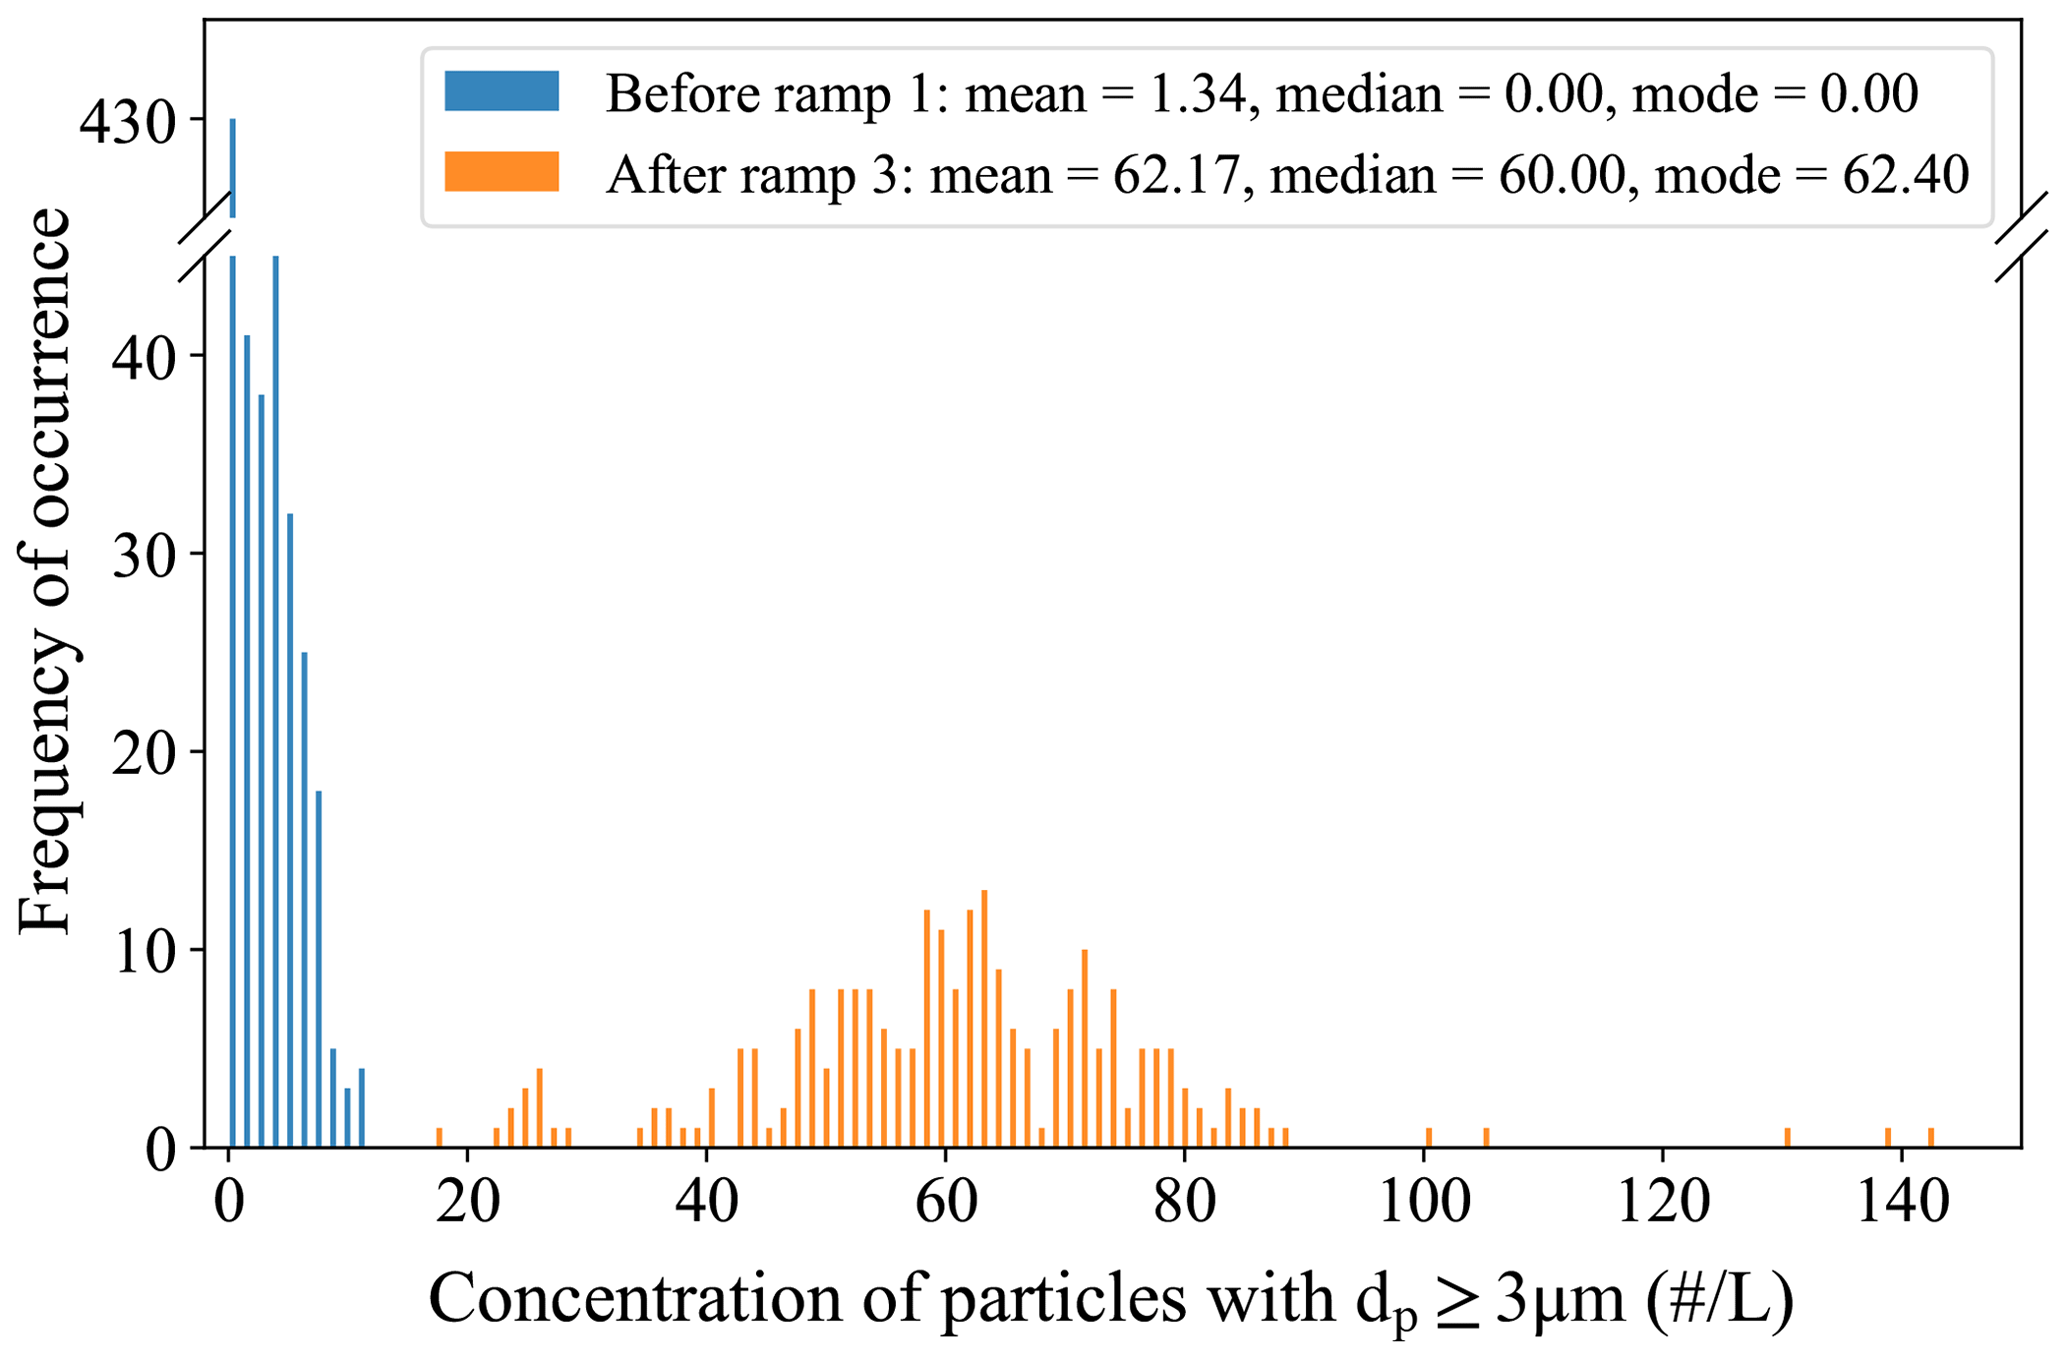
Figure 9Histogram of background counts before and after successive RHi,lam ramps from 110 % to 160 % at Tlam −26, −38, and −50 ∘C. Note that PINCii had been running for approximately 3.5 h at the end of ramp 3. The statistical values denoted in the figure legend have the same unit as the x axis.
4.2 Particle loss
Particle losses may arise depending on how the sample of interest travels to and through the chamber; losses may also occur if there are interactions with surfaces, other particles, and/or buoyancy or turbulence within the chamber. To quantify particle losses, experiments were conducted by injecting particles of known concentration and measuring the difference at the exit of the chamber. For these experiments, the total particle concentration was measured using a CPC at the chamber inlet (CPCin, TSI model 3775) and the output concentration was measured at the chamber exit (CPCout, TSI model 3787), where the OPC is usually mounted. The PL ratio represents the fraction of particles that are lost and is defined as follows:
where df is the dilution factor corresponding to the ratio between the total flow rate exiting PINCii and the sample flow rate entering the chamber (df =10). The CPC concentrations were adjusted at the beginning of each experiment to take any offset between the CPCs into account. Particle loss experiments were performed over the accessible range of thermodynamic conditions within PINCii using 100 nm polystyrene latex (PSL) spheres. PSL spheres were chosen because they are largely hydrophobic and non-ice active; thus, they minimize nucleation that could result in scavenging.
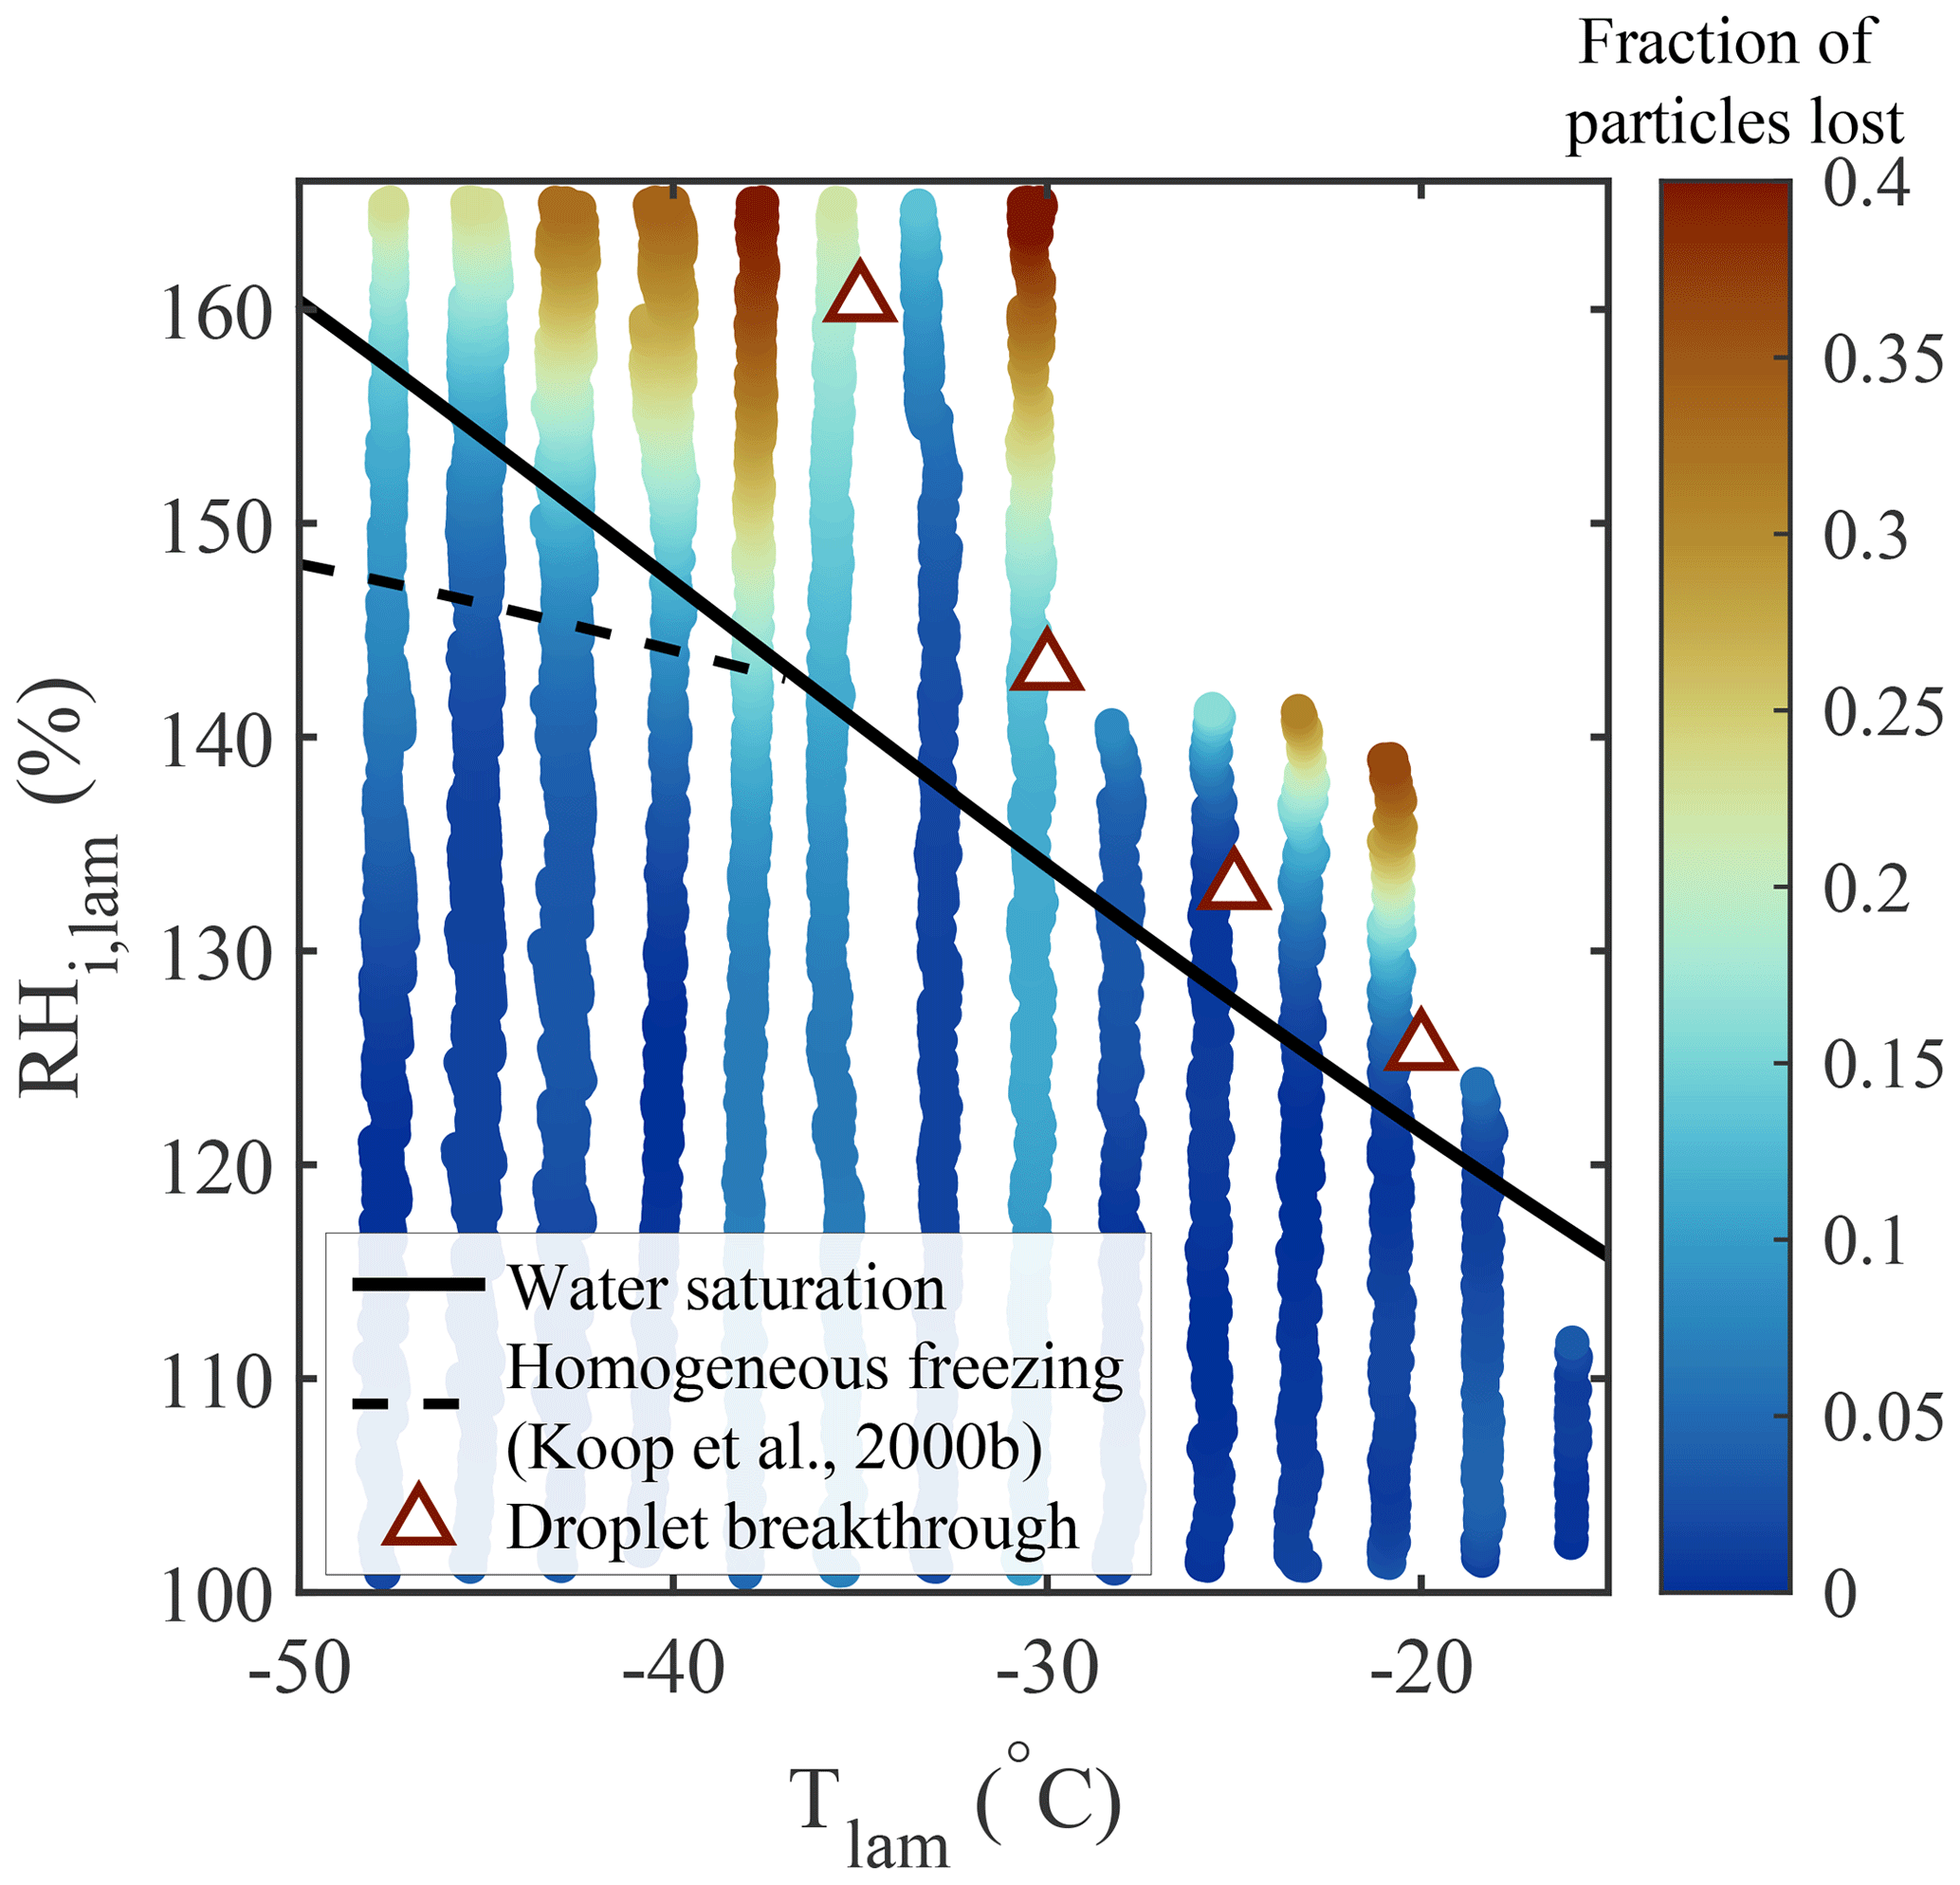
Figure 10Fraction of particles lost (PL, color bar), measured using 100 nm PSL spheres. For the experiments, the RH was increased at 1 % min−1, beginning from RH %, for fixed Tlam. Water saturation (solid black line), droplet breakthrough (triangles), and homogeneous freezing (dashed black line, calculated with Δaw=0.2946 following Koop et al., 2000b) curves are added for supplementary information.
The results presented in Fig. 10 show that negligible particle loss is observed for most chamber conditions, except when (i) the saturation condition exceeds droplet breakthrough and (ii) ∘C and RH %, where a PL of up to 40 % is observed. It is important to mention that meaningful ice nucleation experiments cannot be conducted in this regime. At warmer temperatures, beyond droplet breakthrough, a phase-discriminating detector could be used. On the other hand, the colder temperatures are within the realm of homogeneous freezing, and thus the distinction between INPs freezing and ice observed above the RH conditions for homogeneous freezing cannot be defined. An exception to this would be if laboratory experiments were done with an aerosol sample known not to freeze homogeneously. Any ice observed above the RH conditions for homogeneous freezing could then be attributed to INPs. It is also notable that particle scavenging from nucleated particles is not observed below the droplet breakthrough curve (at 100 % < RH RHDB). This is strong evidence that the laminar sample flow minimizes particle–particle interactions.
Additional experiments similar to those described in DeMott et al. (2015) were performed to evaluate whether particles deviate from the laminar flow. Pulses of 240 nm PSL spheres were input into the chamber by turning a DMA on and off, and the measured CPCin and CPCout concentrations are plotted in Fig. 11. For the duration of the experiment, the main chamber was run under fixed lamina conditions ( ∘C and RH %) with the evaporation section isothermally fixed at ∘C and RHi=100 %.
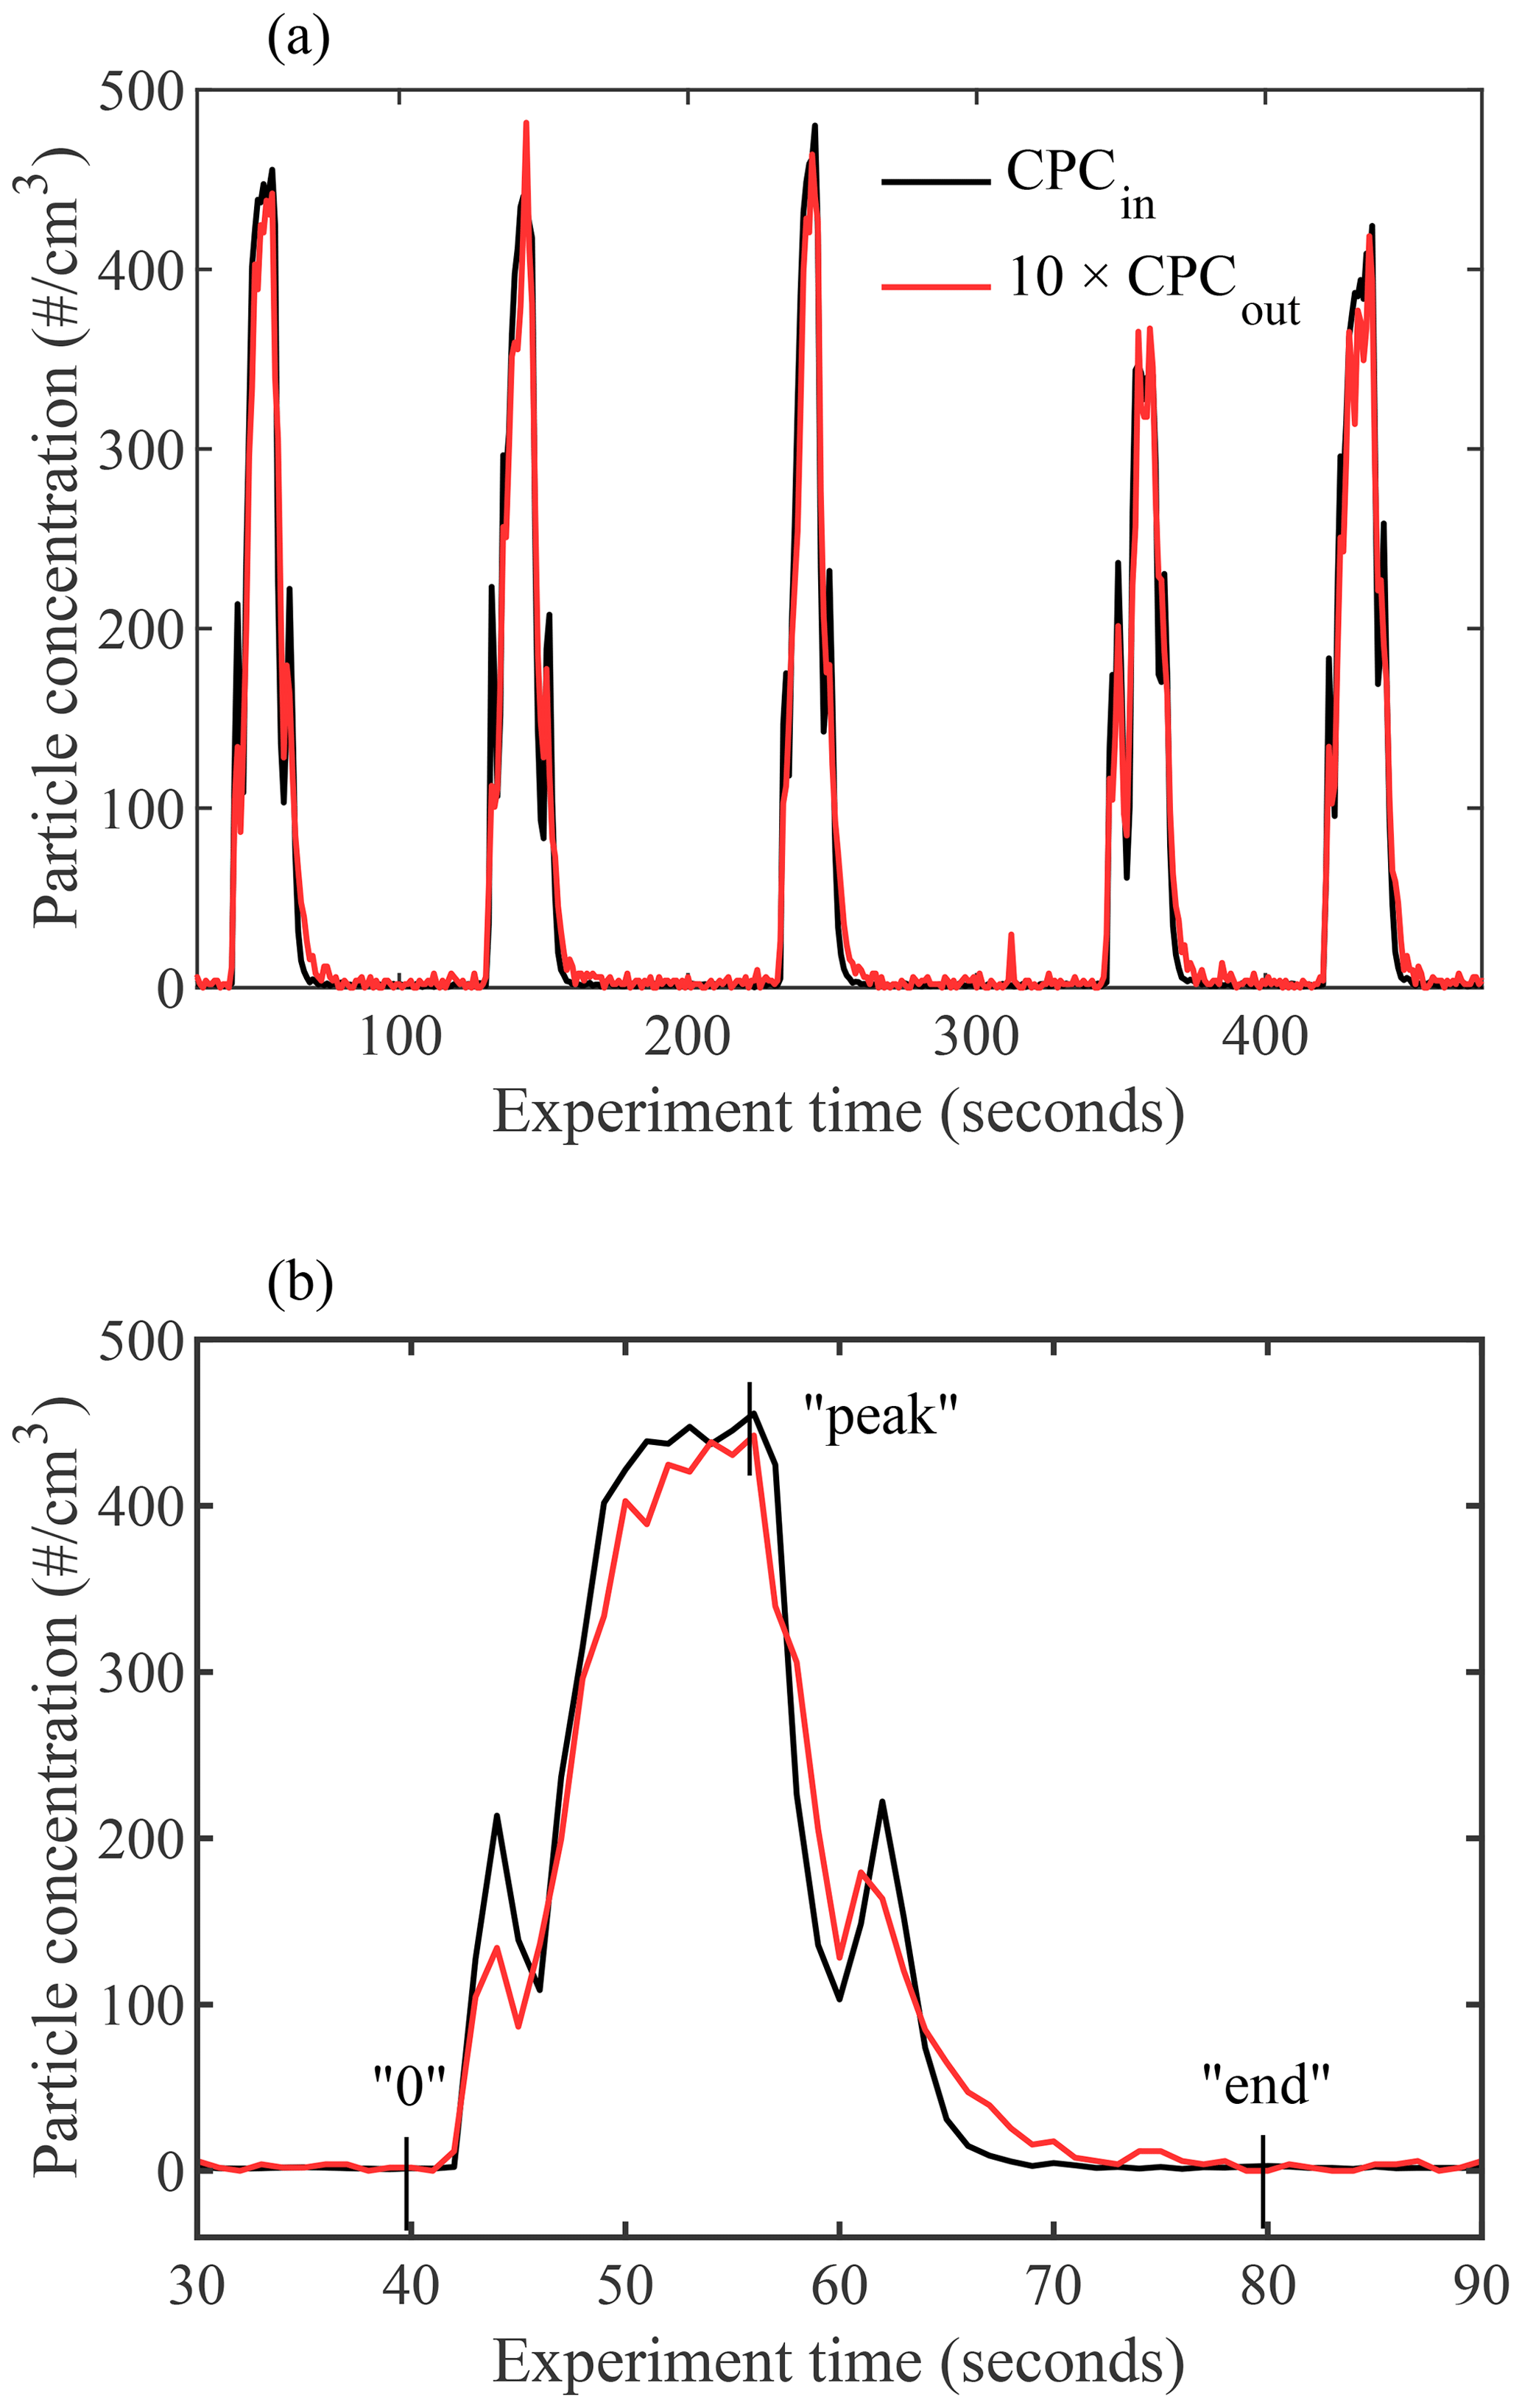
Figure 11Time series of measured particle concentrations at the entrance (CPCin, black) and exit (CPCout, red) of PINCii for experiments using inputs of 240 nm PSL spheres. The main chamber was run under fixed lamina conditions ( ∘C and RH %) with the evaporation section isothermally fixed at ∘C and RHi=100 %. The exiting pulses are time shifted by 15 s in order to overlap the pulse onset. In panel (b), the first pulse pair is highlighted, with the integration limits from Eqs. (2), (3), and (4) illustrated as an example (“0”, “end”, and “peak”, respectively).
When CPCout is scaled for the sheath flow dilution (by multiplying by 10) and shifted in time by 15 s (the chamber residence time under these conditions), the result clearly demonstrates the coherence of the input pulse, even upon exiting (Fig. 11a). However, a more detailed view of the first pulse shows slight variations in the peak shape, including an elongated tail resulting from delayed particles that have passed through the chamber more slowly than expected if they were traveling only within the sample lamina (Fig. 11b). Quantification of the fraction of delayed particles which most likely do not experience lamina condition is done by assessing the difference in the pulse distributions. Although a systematic calculation would require complex convolutions of the particle and velocity distributions, the task is simplified thanks to the experimental time resolution. As illustrated in Fig. 2, particles in the lamina do not travel at uniform velocity, nor do they always have the maximum flow velocity within the chamber. However, given the chamber residence time, the potential differences within the lamina and between the lamina and the maximum flow velocity would result in a spread of arrival times of less than the 1 s CPC time resolution. This means that, for measurement purposes, the lamina velocity can be considered constant. In addition, the input and output pulses should be identical and only diluted and shifted in time to achieve ideal lamina flow within the instrument resolution. Moreover, this allows us to utilize the onset of each CPCout pulse to represent particles that have traveled through the sample chamber within the sample lamina. Following Eq. (1), the total integrated particle loss can be calculated as follows:
where the pulse is integrated from the onset (0) until concentrations return to pre-pulse values (end), as shown in Fig. 11b. A percentage delayed fraction DF can then be calculated as follows:
where Delayed is calculated as
When the delayed quantity DF is calculated for the five presented pulse pairs, an average of 9.1 % of particles are found to be delayed, with a minimum of 8.0 % and a maximum of 11.1 %, which is 2 times lower than the ratio of delayed particles reported by Garimella et al. (2017) when they conducted similar pulse experiments with ZINC and SPIN. While these numbers are only valid under the experimental conditions used here, they represent the most turbulent achievable conditions obtained with typical flow rates. Furthermore, following the assumption that, for each pulse, the particle onset represents particles that traveled within the lamina, it is then likely that delayed particles were dispersed towards the regions of lower velocity, which are also the regions with lower RHi than the lamina (Fig. 2). Therefore, the delayed particles are less likely to initiate nucleation, especially in deposition mode. In other words, the small percentage of delayed particles that travel outside the lamina are unlikely to affect experimental results by showing a pre-activation, but they may lead to an underestimation of the INP concentrations that is proportional to the fraction of particles delayed (Fig. 10).
4.3 Temperature control
The chamber wall temperatures control both Tlam and RHi,lam. Variations and uncertainties in the wall temperatures propagate through the chamber(s) and can result in variability in the sample conditions, affecting parameters such as particle activation and calculation of uncertainties. Diagnosing unexpected (in)activation of particles and spurious INP counts relies on reliable temperature stability and well-resolved wall temperature monitoring. To achieve this, current PINCii models include a high spatial distribution of 58 type-K thermocouples that monitor temperatures at 1 Hz (Fig. 1). This leads to a high spatial resolution of the temperature distribution along the chamber and allows us to quantitatively assess the range of deviation. The high-spatial-resolution temperature monitoring can also be used to carefully assess forcing extremes (see Sect. 3.3). In Fig. 12, the standard errors of Tlam and RHi,lam calculated from wall temperature profiles measured over the full operational range of PINCii are presented. The standard errors were calculated using temperature measurements made during the previously presented experiments of droplet nucleation (Fig. 4), homogeneous freezing (Figs. 7, A1), and particle loss (Fig. 10). The Tlam and RHi,lam were calculated for each temperature measurement along the chamber walls before calculating the standard errors of the obtained values. The standard errors were then inserted into an empty RHi,lam, Tlam coordinate matrix, and missing points were calculated using a nearest-neighbors linear interpolation. Results show that uncertainties in RHi,lam are most important at ∘C and RH %, where the standard error can exceed 2 %. On the other hand, uncertainties in Tlam are most apparent at warm temperatures ( ∘C), where the standard error can exceed 0.35 ∘C. The lamina uncertainties are primarily the result of temperature inhomogeneities on the chamber walls caused by strong cooling near the coolant injection points. PINCii was designed with multiple injection points in order to minimize these effects, but our results show that improvements are still needed. Nevertheless, our results also emphasize the advantages of having a high spatial temperature resolution to help identify and potentially correct temperature heterogeneity during experiments. Note that the uncertainties presented here only account for the spatial variations in temperature measured by the thermocouples distributed along the chamber walls; they do not account for the other measurements uncertainties (e.g., thermocouple uncertainty or uncertainty related to flow rate or pressure). Thus, the results presented here represent ideal (minimum) uncertainties. The actual measurement uncertainties are higher, highly dependent on the operating mode used, and their calculations are not easy to generalize. Although such calculations are not further explored in this work, some methods have been developed, such as the Monte Carlo approach taken in Richardson (2009).
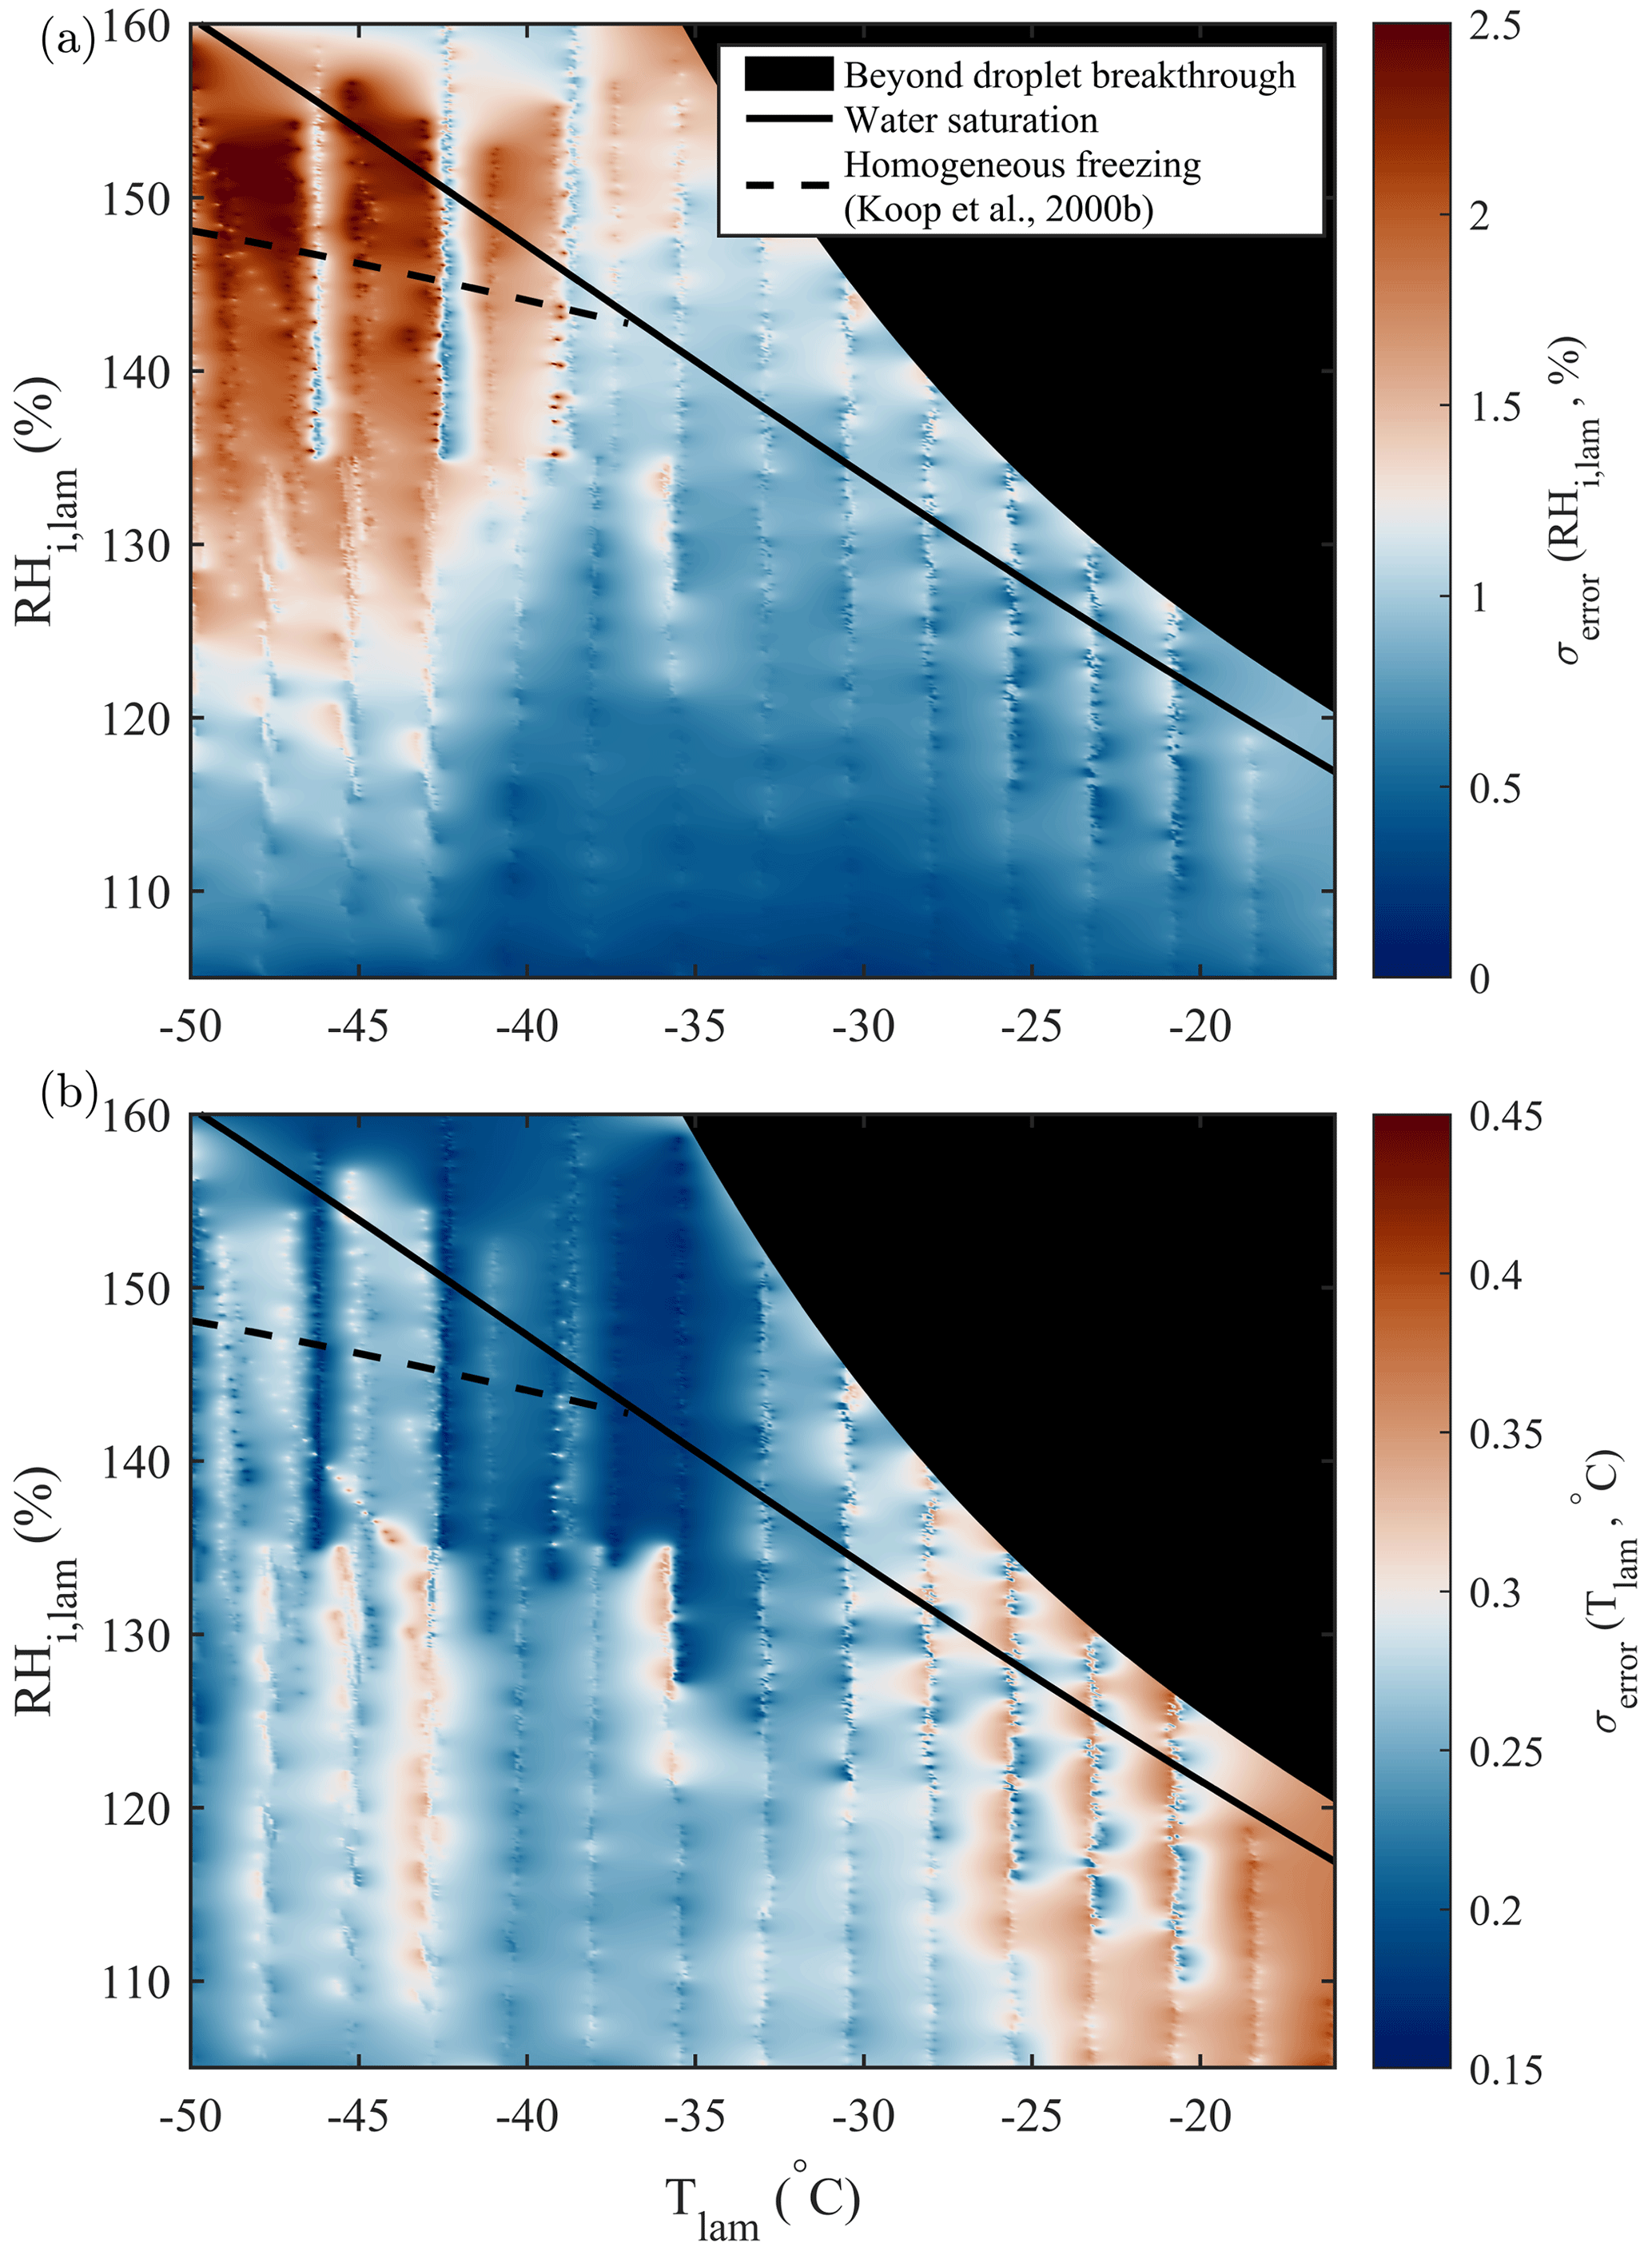
Figure 12Standard error of (a) RHi,lam and (b) Tlam calculated from the scanning done during droplet nucleation (Fig. 4), homogeneous freezing (Figs. 7, A1), and particle loss (Fig. 10) experiments. The theoretical curves for water saturation (solid black line) and homogeneous freezing (dashed black line, calculated with Δaw=0.2946 following Koop et al., 2000b) are added for supplementary information.
This study presents the design, working principles, and operating capabilities of the newly developed PINCii. Experimental results are used to assess the system operation and quantify system uncertainty. The upgraded capabilities of PINCii relative to most previous generations of deployable CFDCs are highlighted.
Engineering upgrades to the design include an elongated main chamber that enables a longer aerosol residence time (≈15 s) and, therefore, enhanced nucleation and growth. This may be helpful for experiments performed at cold temperatures (T≲ −45 ∘C), as ice crystals may not grow to size thresholds commonly used for ice detection (Fig. 7; Welti et al., 2020). An elongated evaporation section improves phase differentiation and, thus, results in more reliable data output under water-saturated conditions.
In addition to its cascade cooling system, PINCii has a large array of wall-mounted heating pads. Our results suggest that PINCii, coupled with the evaporation section whose temperature can be controlled independently and, thus, wherein a temperature gradient can also be maintained, has the potential to be used to study droplet activation processes at low temperatures. This feature can also be used for ice nucleation experiments below water saturation (homogeneous freezing of solutions or deposition freezing), where phase differentiation is not necessary.
PINCii has a dense thermocouple network embedded within all chamber walls (Fig. 1) that offers reliable monitoring of wall temperatures and is used to analyze data from homogeneous freezing experiments in new ways. We find that measured homogeneous freezing onsets agree better with the theoretical onset from Koop et al. (2000b) when using the most extreme lamina conditions present within the chamber (greatest RHi,lam), representing the conditions most likely to trigger ice nucleation (Figs. 7c, A1).
The Rogers (1988) thermodynamic model has been updated to account for the ice layers coating the chamber walls. The update shifts the predicted Tlam, RHlam, and flow profile across the chamber, and deviations of up to 1 ∘C in Tlam are found when compared with the model output without condensed ice layers. In addition, the updated model predicts a laminar flow profile with negligible flow reversal when accounting for the ice layers.
Results from a sequence of experiments show good agreement with applicable theories or previous studies and are summarized in Fig. 13. In this figure, the activation onset obtained for each experiment is represented. For the homogeneous freezing experiments (200 nm NaCl and 200 nm natural salt sample from Qaidam Basin, China, in Fig. 13), the ice nucleation onset was defined as the median of the inflection points obtained for each activation curve, as done in Fig. 7 (see Sect. A1 for more information). For the heterogeneous freezing experiments with 200 nm NX illite particles, the ice nucleation onset was defined as AF =1 % to compare our results to Welti et al. (2009). When the AF could not be calculated because the experiments did not include running a CPC in parallel to PINCii, the activation onset was defined as a fixed value. For the droplet formation experiments conducted with ambient polydisperse particles, the onset was defined as the ratio of activated droplets equal to 0.1 (see “Droplet nucleation” in Fig. 13). For the droplet breakthrough experiments, the onset was defined as 1 droplet cm−3. Figure 13 also shows the results of the deliquescence experiments conducted with 200 nm NaCl particles at both −35 and −36 ∘C. Overall, results show that droplet formation, deliquescence, and homogeneous and heterogeneous freezing onsets were observed under the predicted conditions (Köhler, 1936; Koop et al., 2000a, b; Welti et al., 2009).
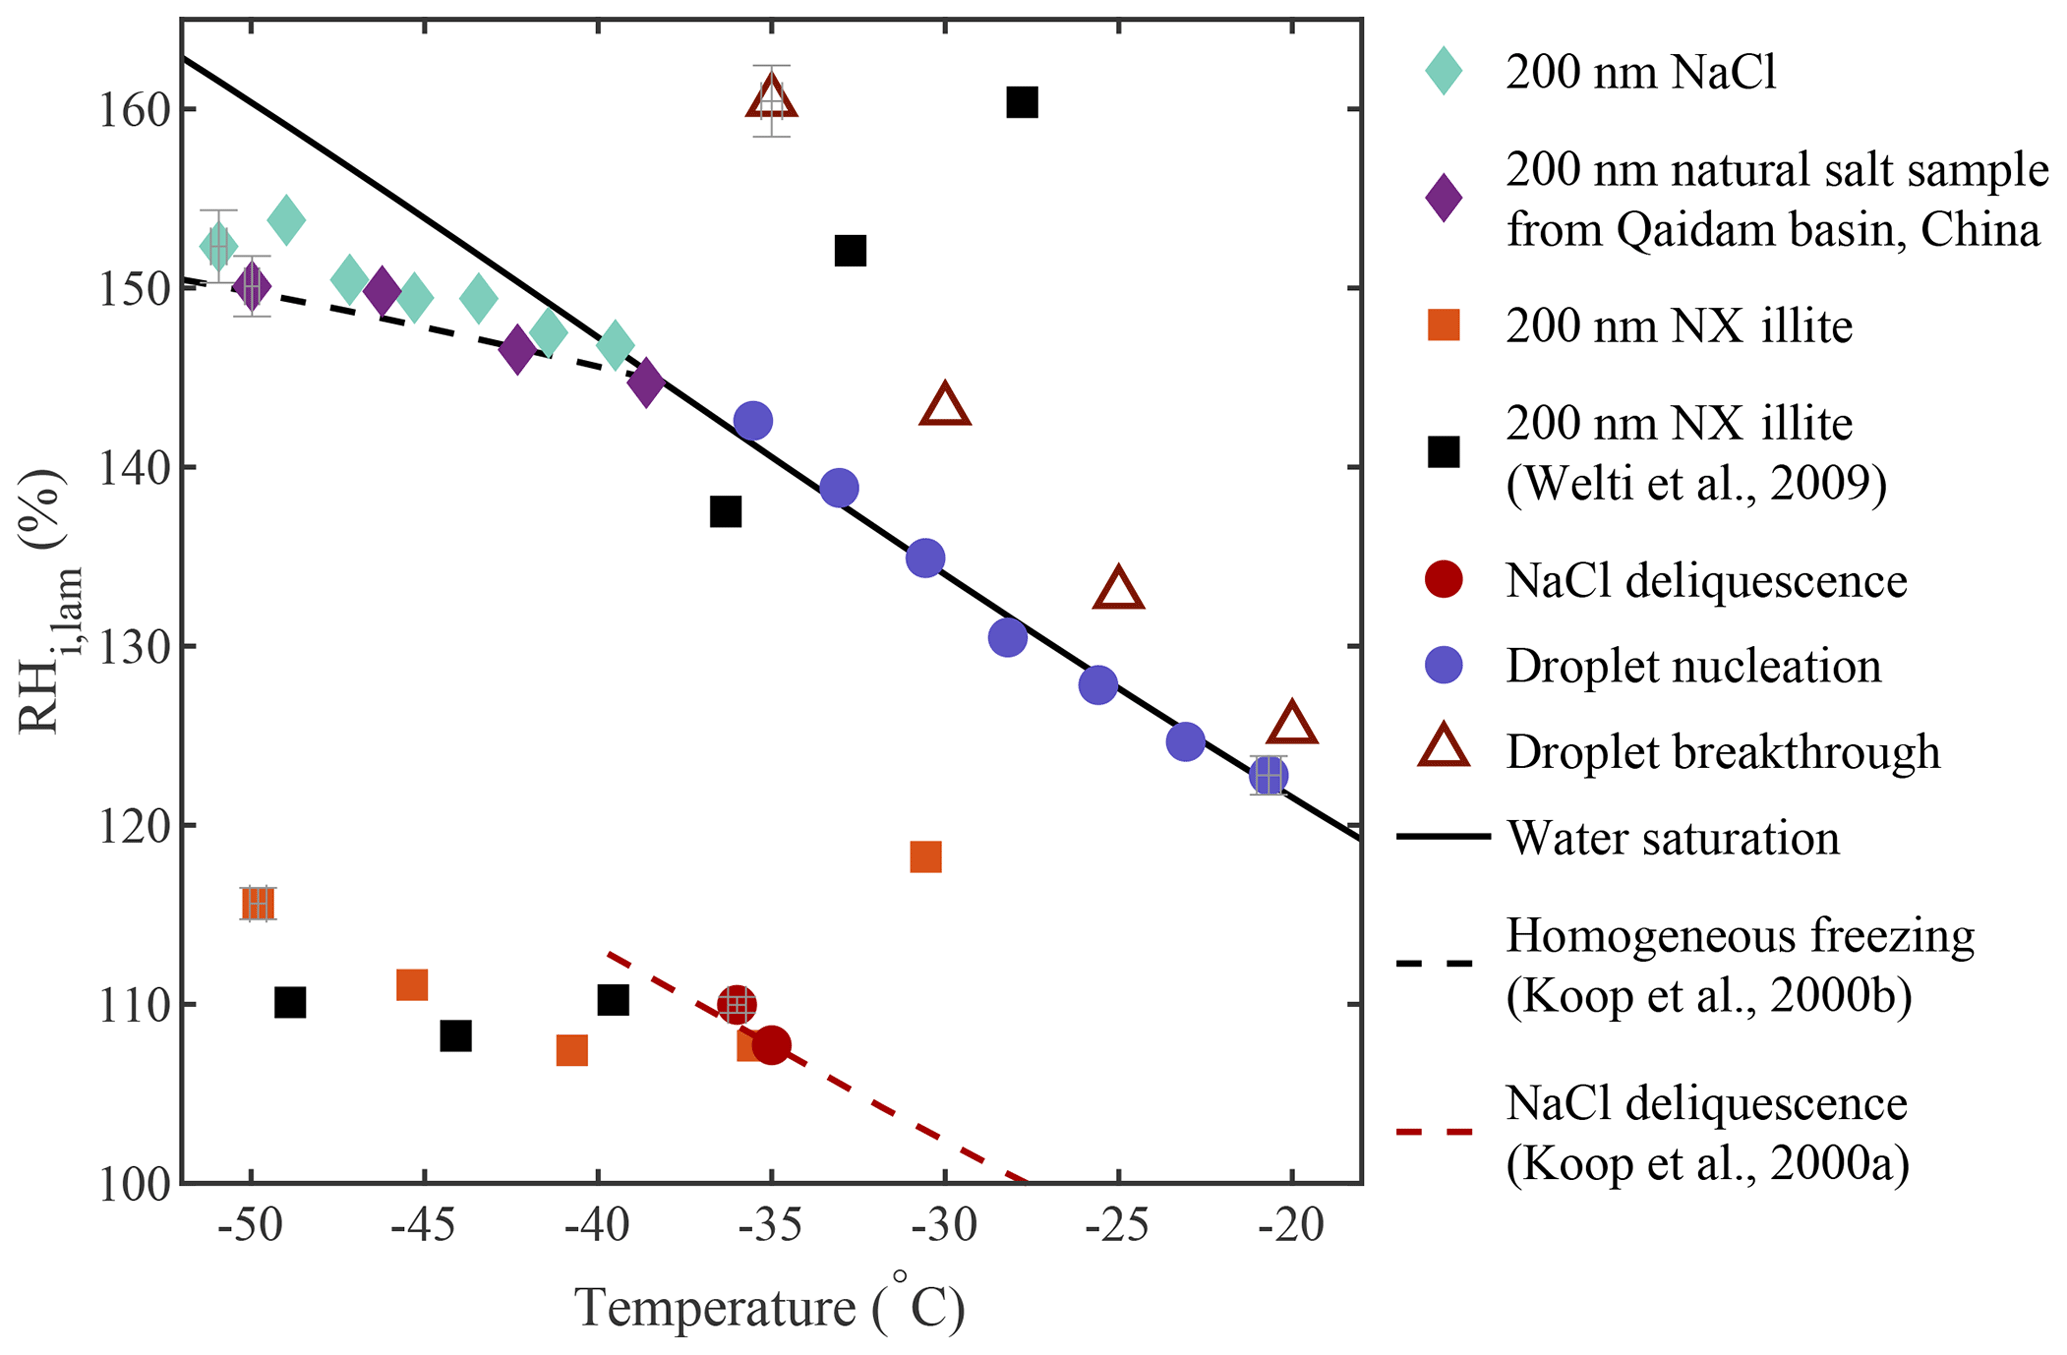
Figure 13Overview of the ice nucleation onsets measured during homogeneous freezing experiments (diamonds; also in Figs. 7c and A1) and heterogeneous freezing experiments (squares; also in Fig. 8) as well as results from NaCl deliquescence experiments (red circles; also in Fig. 5), droplet nucleation experiments (blue circles; also in Fig. 4), and droplet breakthrough experiments (red triangles; also in Fig. 6). The theoretical curves for water saturation (solid black line), homogeneous freezing (dashed black line, calculated with Δaw=0.2946 following Koop et al., 2000b), and NaCl deliquescence (red dashed line, digitized from Koop et al., 2000a) were added for supplementary information. Error bars representing the standard errors in Tlam and RHi,lam were added on a selection of data points covering each experiment.
PINCii is a flexible instrument able to reach a wide range of thermodynamic conditions (Fig. 3b) and capable of conducting nucleation experiments in both the ice and liquid phase. The analysis of the main instrumental uncertainties highlights that PINCii can operate with very low background signal and minimal particle losses (Figs. 9, 10). This means that PINCii is suited for sampling low INP concentrations (<10 L−1).
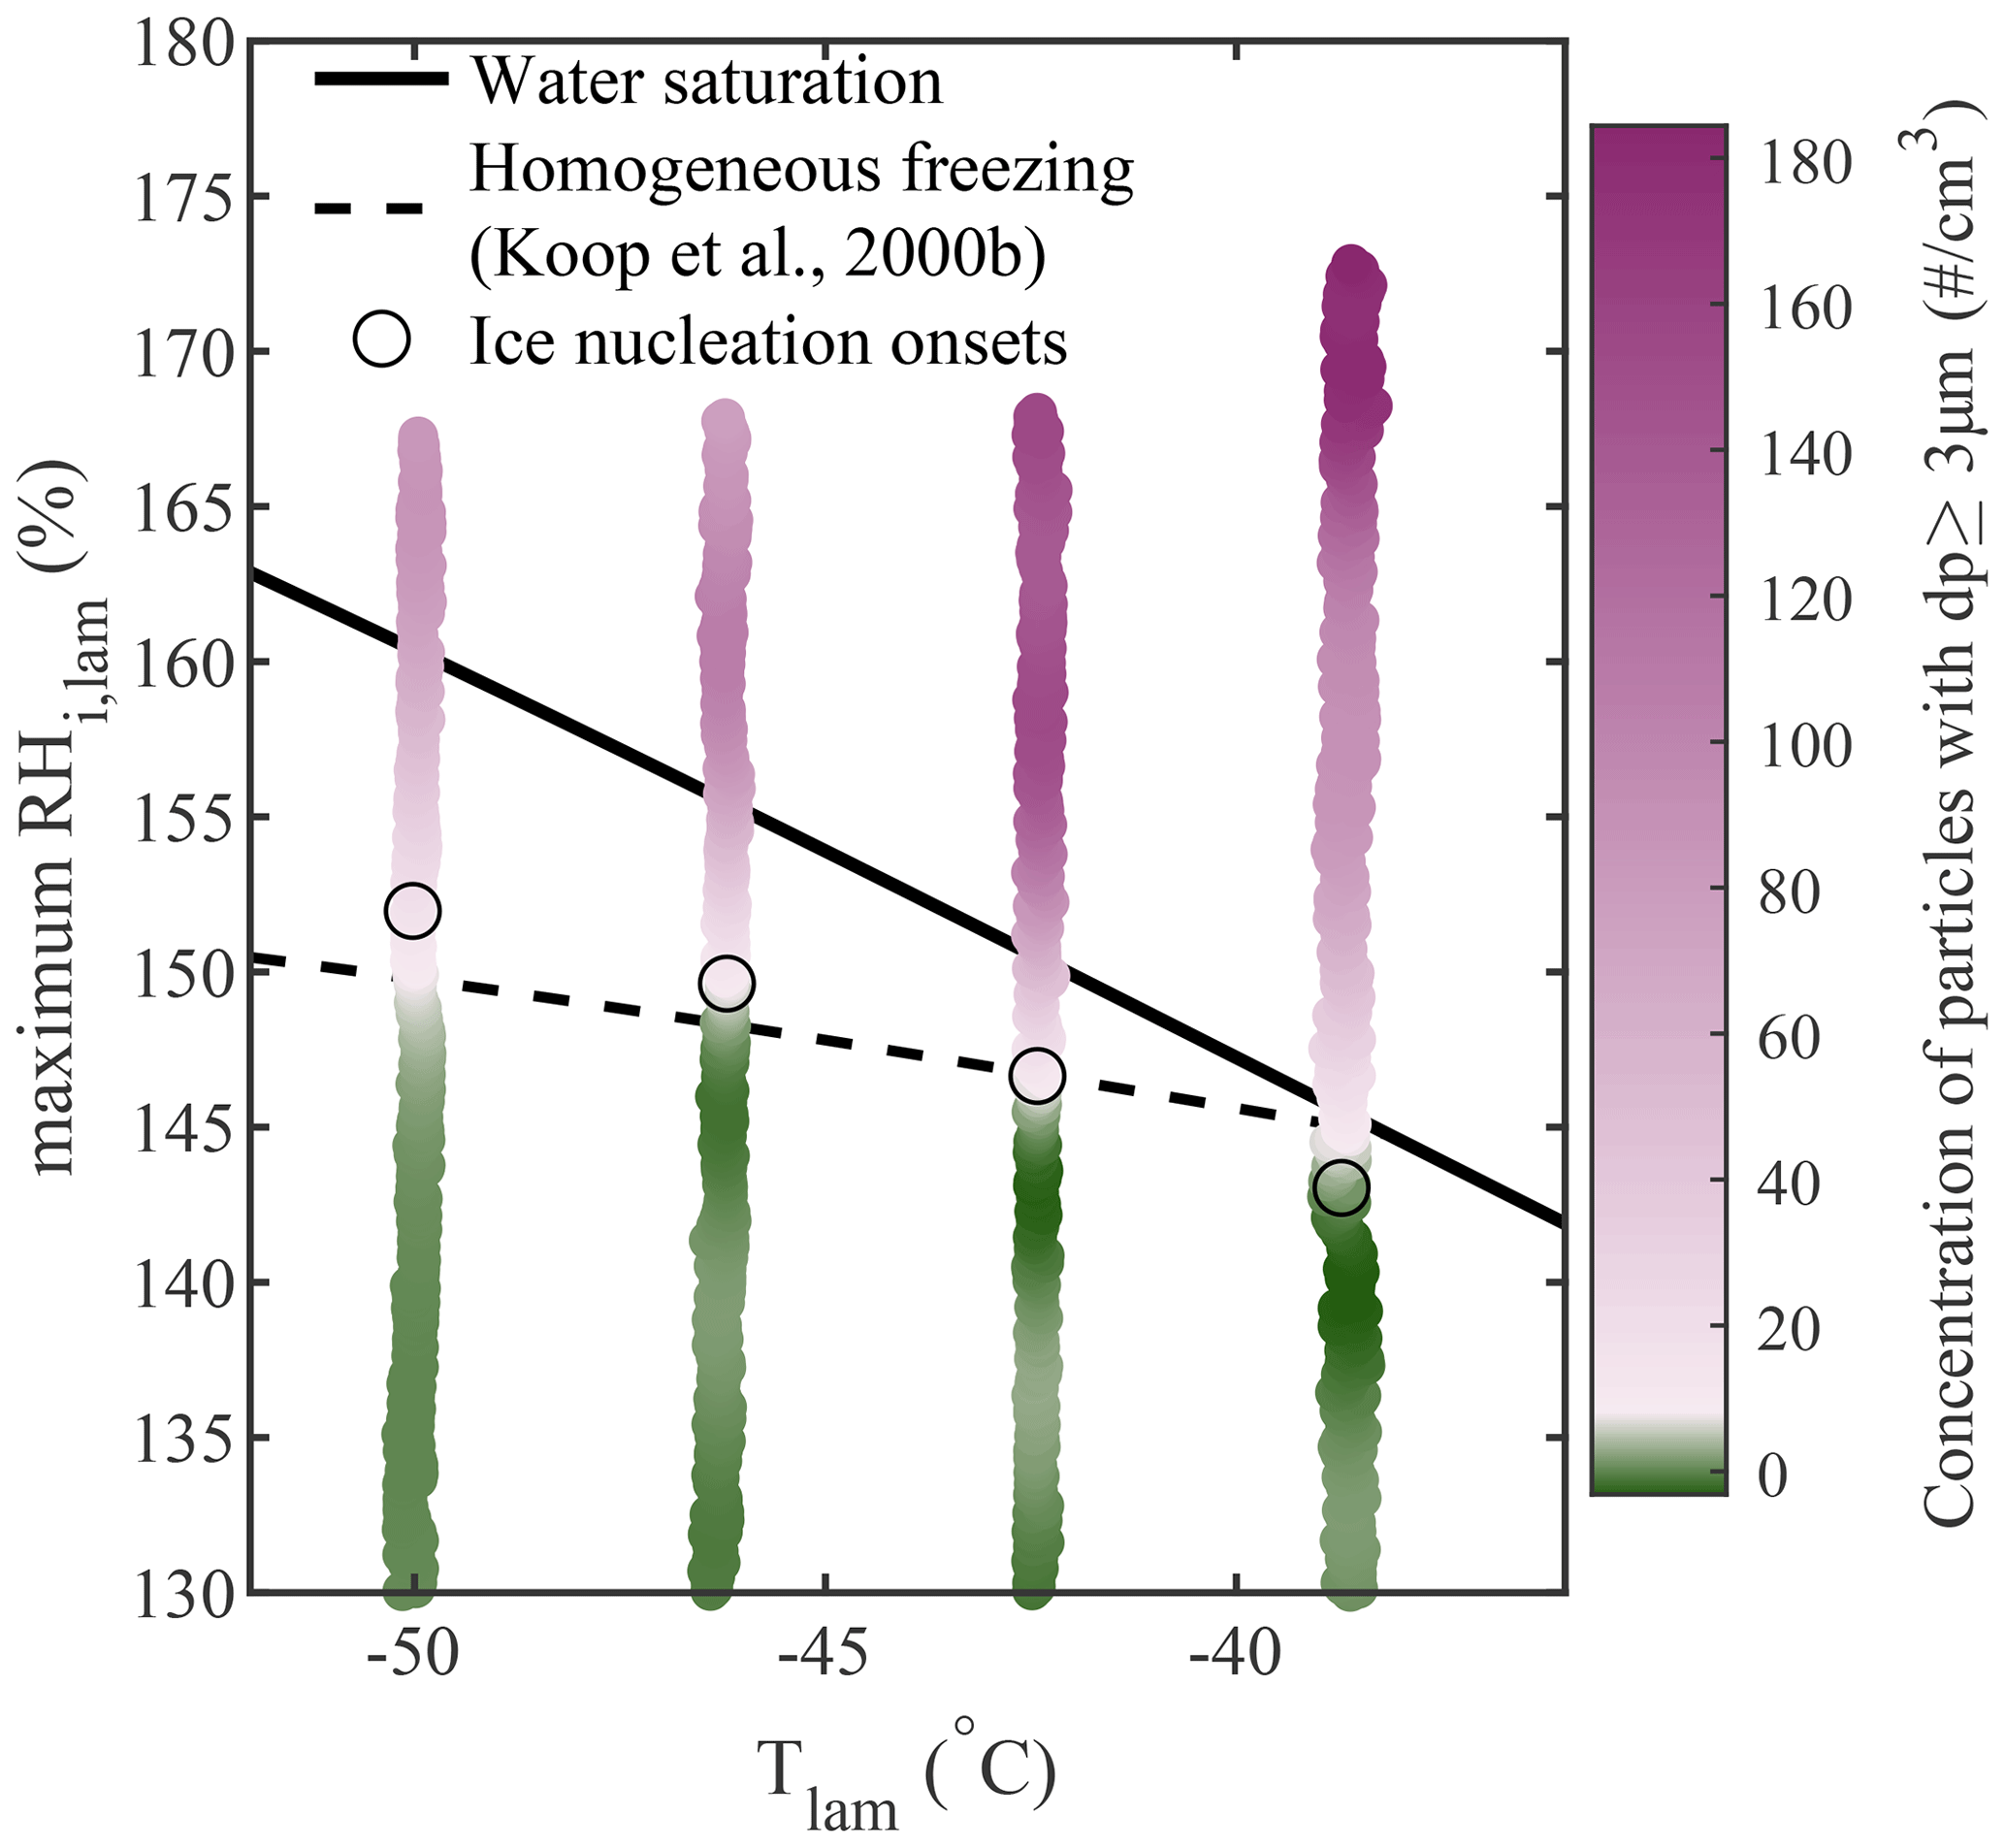
Figure A1Homogeneous freezing of 200 nm particles generated from a natural salt sample collected in the Qaidam Basin, China. Note that, due to an instrumental malfunction, the CPC was not running and, thus, the AF could not be calculated for this experiment. The concentration of aerosols with dp≥3 µm is plotted as a function of the average Tlam and the maximum RHi,lam, and the color scale is used to represent changes in the concentration. The white region in the color bars represents the ice nucleation onset, which was estimated using the median of the inflection points obtained for each activation curve (see Sect. A1 for more information). The theoretical curves for water saturation (solid black line) and homogeneous freezing (dashed black line, calculated with Δaw=0.2946 following Koop et al., 2000b) were added for supplementary information.
A1 Estimation of the ice nucleation onsets
Here, we describe the method followed to estimate the ice nucleation onsets represented as the white regions in the color bars of Fig. 7. First, the activation curves were resampled and averaged using a 10-point moving average (circles in Fig. A2a). A Gaussian filter was then used on the resampled and averaged data to obtain a continuous, smooth curve (solid blue line in Fig. A2a) from which the second derivative was calculated (dashed orange line in Fig. A2a). The inflection point was then defined as the maximum of the second derivative (vertical dashed line in Fig. A2a). This procedure was applied to each activation curve of the experiment as shown in Fig. A2b, and finally the median of the inflection points was calculated and used as an estimate of the ice nucleation onset in Fig. 7.
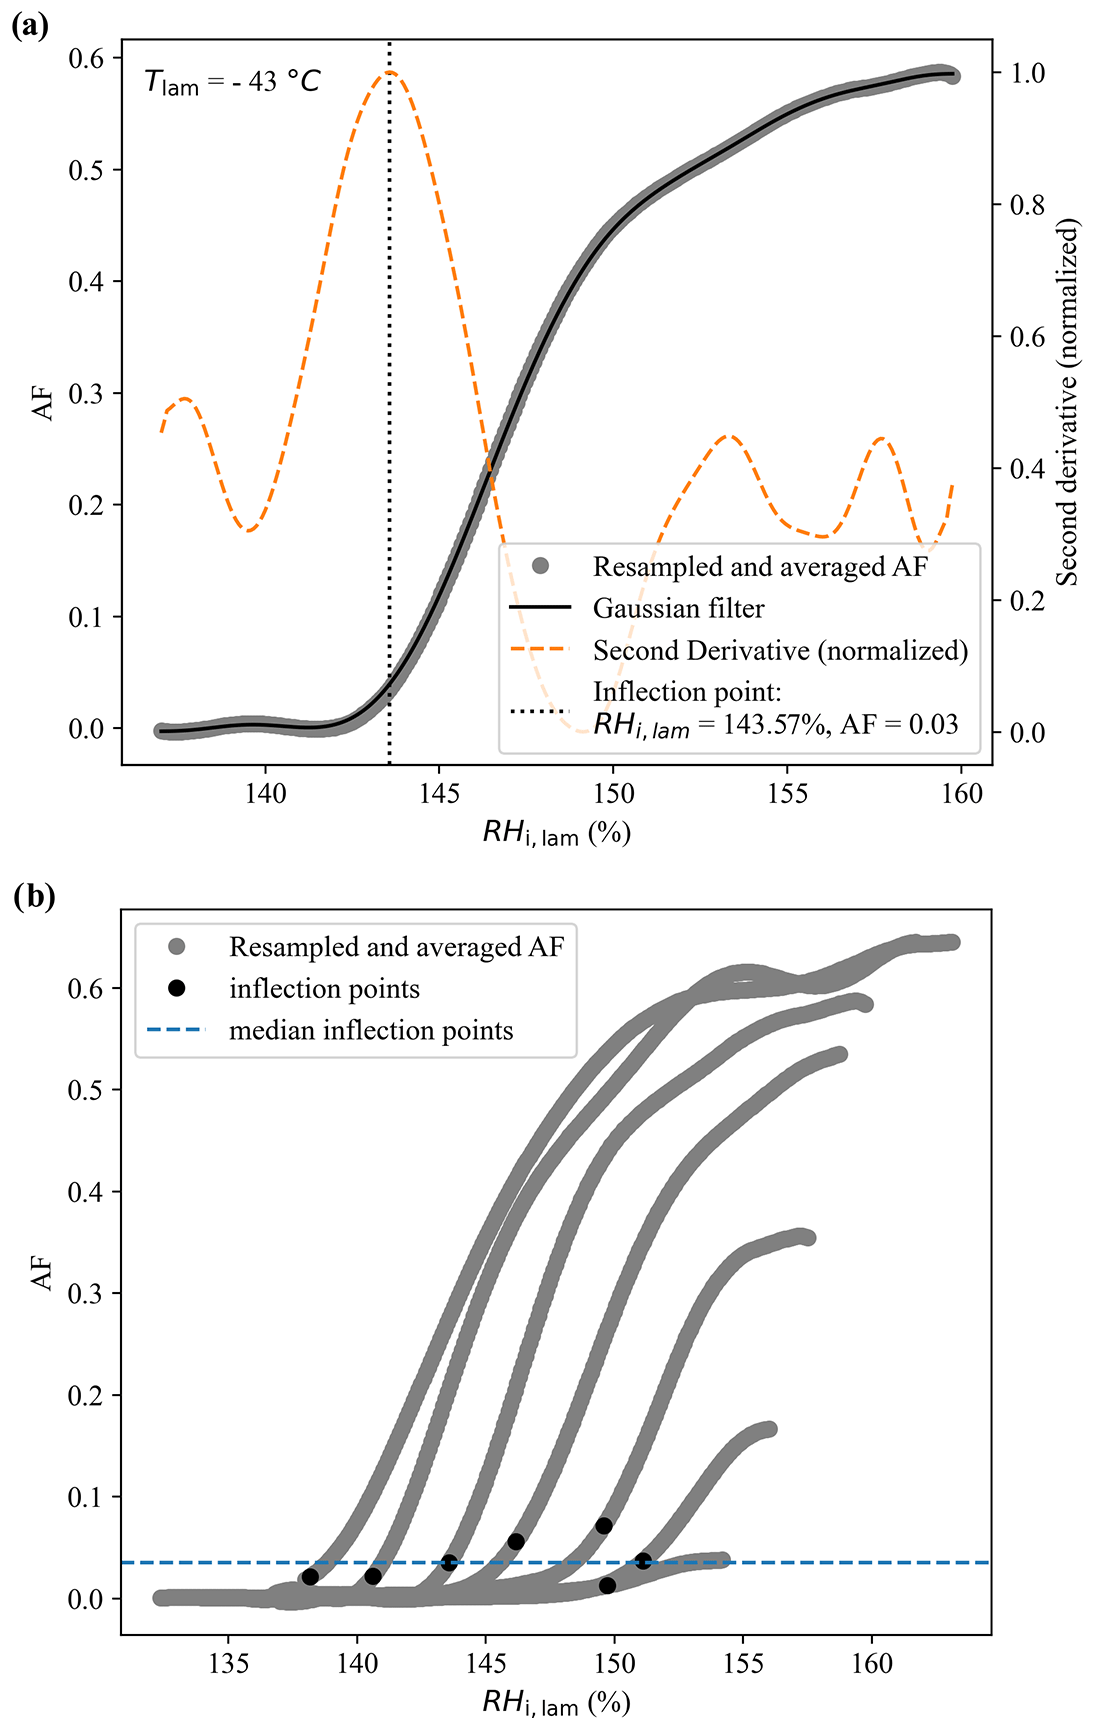
Figure A2(a) Example of an activation curve obtained during the RH ramp conducted at −43 ∘C, where the colored circles represent the data after they was resampled and averaged using a 10-point moving average. The solid blue line represents the Gaussian filter applied to the resampled data and the dashed orange line represents the normalized second derivative calculated from the Gaussian filter. The inflection point, highlighted with the vertical dashed line, was defined as the maximum of the normalized second derivative. Panel (b) presents all activation curves obtained during the experiments, with the black circles representing the inflection points obtained for each curve and the dashed blue line representing the median of these inflection points.
A2 Ice crystal growth
Ice crystal growth is determined using the approach presented in Welti et al. (2020), which is based on the mass growth rate of ice crystals given in Rogers and Yau (1989) and the simplifying assumption of spherical ice crystals:
with the time-dependent ice crystal radius r, the seed particle radius r0, the mass accommodation coefficient α, the saturation ratio with respect to ice Si, the mass density of ice ρi, and the residence time in the chamber tres. with the latent heat of sublimation Ls, the individual gas constant for water vapor Rv, and the thermal conductivity of moist air K. with the diffusivity of water vapor in air Dv and the saturation vapor pressure over ice psat,i. The values of the aforementioned variables were determined according to the respective references in Welti et al. (2020), except for Rv, which was determined from Skrotzki et al. (2013). It should be noted that the mass accommodation coefficient α represents the largest uncertainty in calculating the ice crystal diameter. Skrotzki et al. (2013) reported a range of 0.2–1 for α at T= 190–235 K. We chose α=0.3 in order to make the results comparable to Burkert-Kohn et al. (2017), who presented ice crystal growth calculations for PINCii's predecessor PINC and used α=0.3.
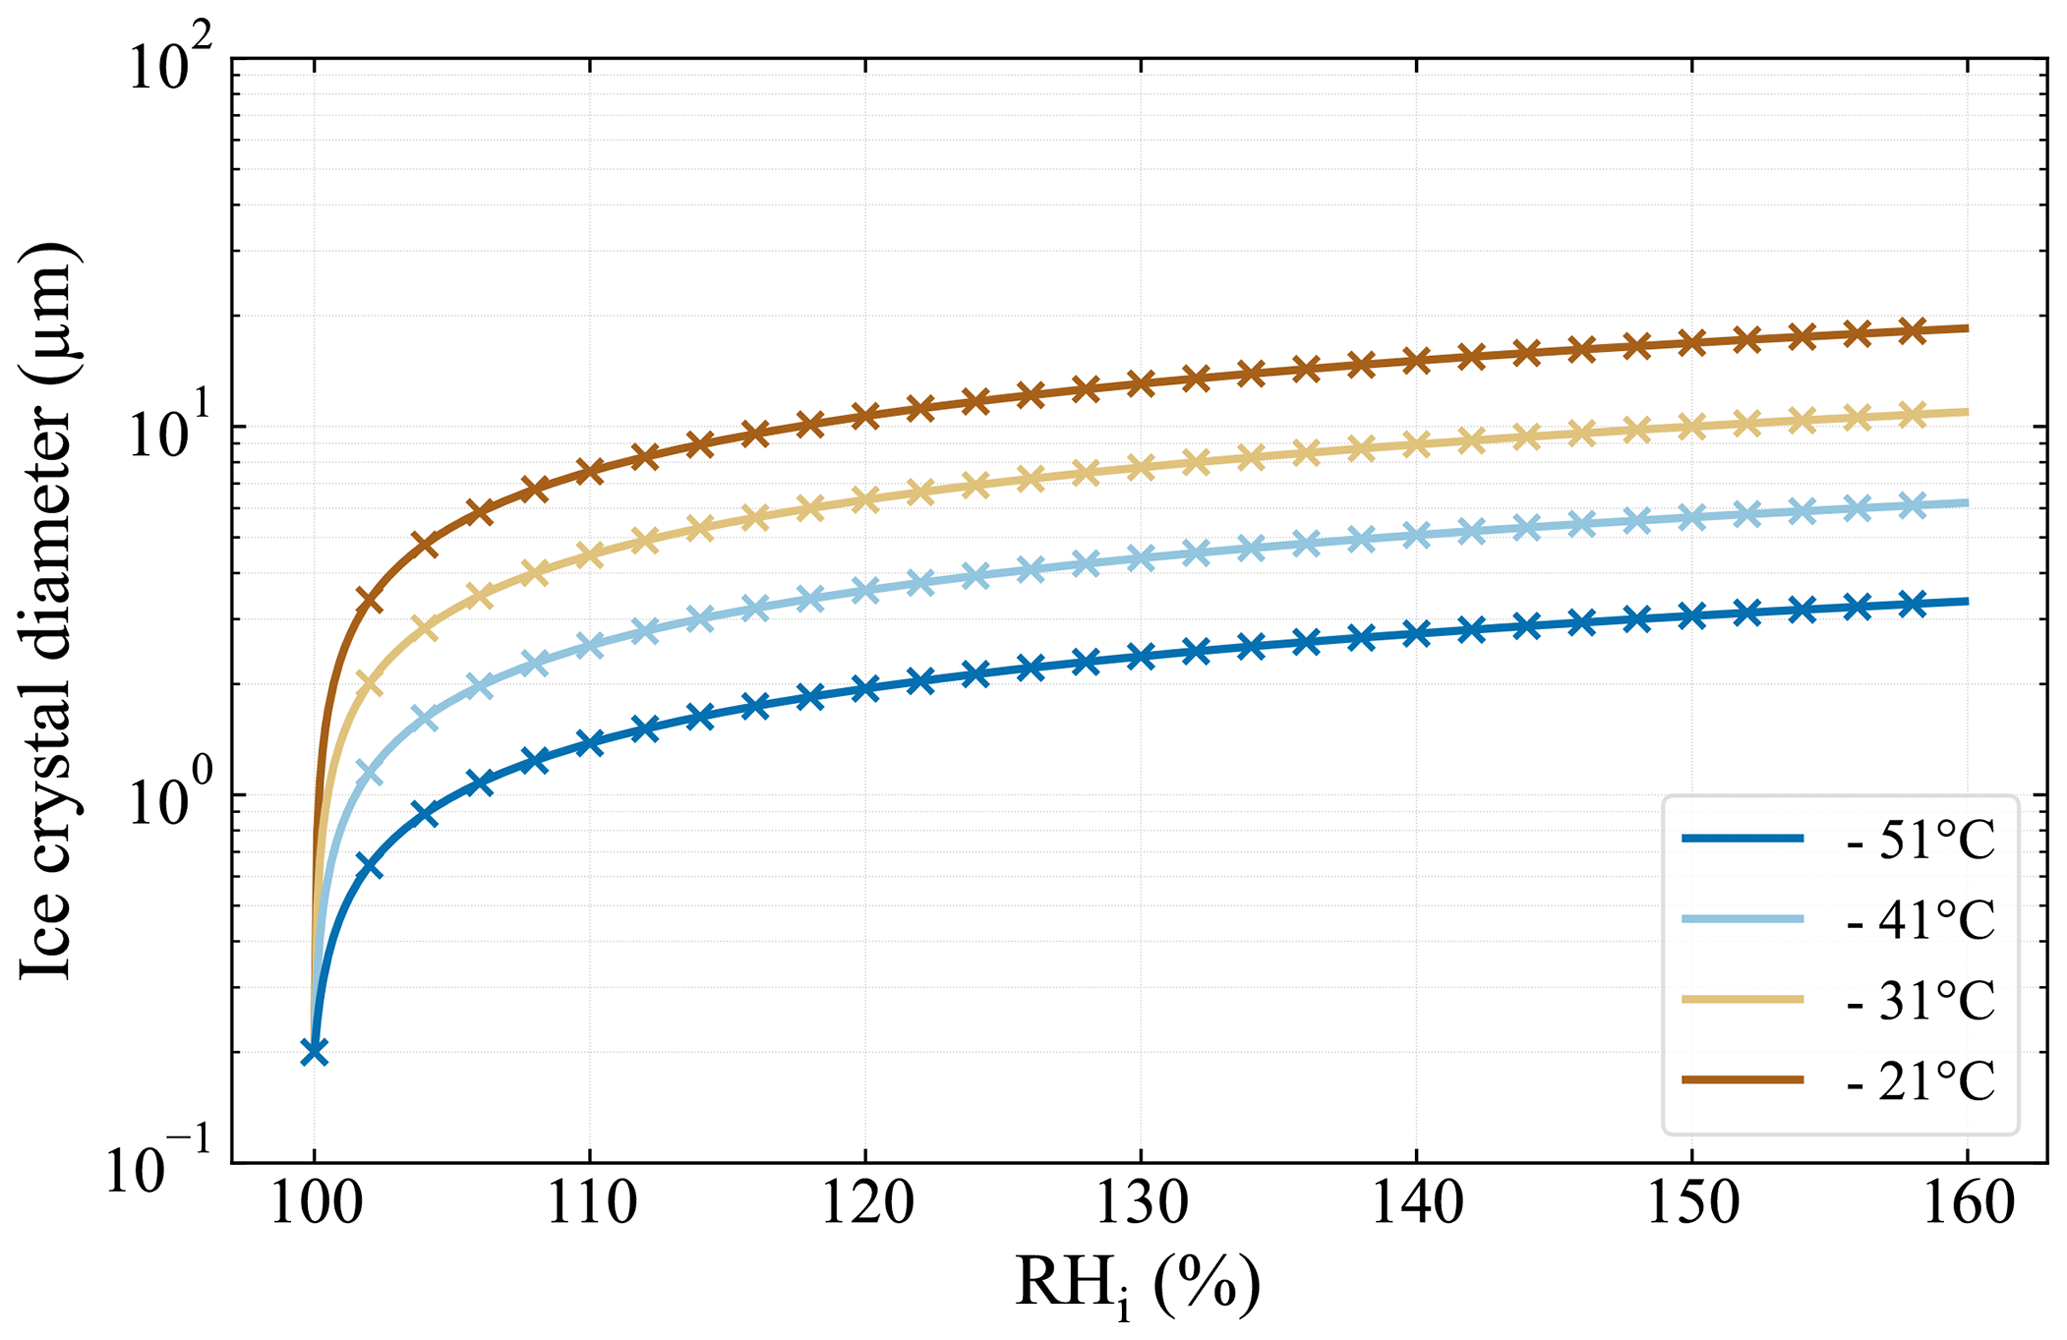
Figure A3Ice crystal growth calculations for the typical residence time of 15 s in PINCii following Welti et al. (2020) and using a mass accommodation coefficient of 0.3 and initial seed particle diameter of 200 nm. Line markers (x) are spaced at 2 % RHi increments.
The data shown in the paper are available upon request from the corresponding authors.
The authorship reflects the principal parties that established a PINCii technology sharing agreement, a project that began nearly a decade ago as a collaboration between ETH Zurich, Leibniz Institute for Tropospheric Research (TROPOS), the University of Gothenburg, Lund University, Aarhus University, and the University of Helsinki. All parties contributed resources and technical expertise to the PINCii development. The original PINCii design and engineering upgrades were suggested at a workshop hosted at ETH Zurich. OS led the workshop and presented his original ZINC and PINC designs, which established the basis for PINCii. All authors contributed to discussions and suggestions for engineering upgrades. QTN and MB, helped engineer and requisition the first chamber components. EST, DC, JD, ZB, and YU assembled the first PINCii chambers. DC, YW, ZB, and EST wrote the PINCii control and data management programs. DC, ZB, YW, JD, and EST first ran PINCii experiments and established the operating procedure. DC ran and collected the data from all experiments presented herein. DC, ZB, YW, ZAK, MH, JD, and EST reviewed and discussed all of the results from the experiments. DC, ZB, MH, and EST wrote the manuscript. All authors read, reviewed, and commented on the manuscript.
At least one of the (co-)authors is a member of the editorial board of Atmospheric Measurement Techniques. The peer-review process was guided by an independent editor, and the authors also have no other competing interests to declare.
Publisher's note: Copernicus Publications remains neutral with regard to jurisdictional claims in published maps and institutional affiliations.
Xiangrui Kong is acknowledged for the collection and use of the Qaidam Basin natural salt samples. Many current and former employees at the Swedish refrigeration company NR Kyl AB are acknowledged for their contributions to the cooling and temperature-control design and engineering; specifically, Jonas Nordmark, Patrik Hultberg, and Emil Sundgren are warmly thanked.
The PINCii project has been supported by the Nordic Centre of Excellence CRAICC (Cryosphere–Atmosphere Interactions in a Changing Arctic Climate). Erik S. Thomson and Dimitri Castarède have been supported by the Swedish Research Council (VR; 2013-05153 and 2020-03497) and FORMAS (2017-00564). Erik S. Thomson, Dimitri Castarède, and Birgitta Svenningsson have been supported by the Swedish strategic research area MERGE. The Gothenburg Air and Climate Network supported Zamin A. Kanji's sabbatical, during which Zamin A. Kanji participated in many of the characterization experiments. Zoé Brasseur, Yusheng Wu, Lauri Ahonen, Markku Kulmala, Tuukka Petäjä, and Jonathan Duplissy have been supported by the Jane and Aatos Erkko Foundation; the European Commission, via “Climate Relevant interactions and feedbacks: the key role of sea ice and Snow in the polar and global climate system” (CRiceS; grant no. 101003826); the Academy of Finland, via a Flagship program for the Atmospheric and Climate Competence Center (ACCC; project nos. 337549, 334792, 340791, 333397, 329274, 328616, 352415, and 345510); and by an academy professorship funded by the Academy of Finland (project no. 302958).
The article processing charges for this open-access publication were covered by the Gothenburg University Library.
This paper was edited by Pierre Herckes and reviewed by Paul DeMott and one anonymous referee.
Aufm Kampe, H. and Weickmann, H.: The effectiveness of natural and artificial aerosols as freezing nuclei, J. Atmos. Sci., 8, 283–288, 1951. a
Biskos, G., Russell, L., Buseck, P., and Martin, S. T.: Nanosize effect on the hygroscopic growth factor of aerosol particles, Geophys. Res. Lett., 33, L07801, https://doi.org/10.1029/2005gl025199, 2006. a
Boose, Y., Kanji, Z. A., Kohn, M., Sierau, B., Zipori, A., Crawford, I., Lloyd, G., Bukowiecki, N., Herrmann, E., Kupiszewski, P., Steinbacher, M., and Lohmann, U.: Ice nucleating particle measurements at 241 K during winter months at 3580 m MSL in the Swiss Alps, J. Atmos. Sci., 73, 2203–2228, https://doi.org/10.1175/jas-d-15-0236.1, 2016. a
Boy, M., Thomson, E. S., Acosta Navarro, J.-C., Arnalds, O., Batchvarova, E., Bäck, J., Berninger, F., Bilde, M., Brasseur, Z., Dagsson-Waldhauserova, P., Castarède, D., Dalirian, M., de Leeuw, G., Dragosics, M., Duplissy, E.-M., Duplissy, J., Ekman, A. M. L., Fang, K., Gallet, J.-C., Glasius, M., Gryning, S.-E., Grythe, H., Hansson, H.-C., Hansson, M., Isaksson, E., Iversen, T., Jonsdottir, I., Kasurinen, V., Kirkevåg, A., Korhola, A., Krejci, R., Kristjansson, J. E., Lappalainen, H. K., Lauri, A., Leppäranta, M., Lihavainen, H., Makkonen, R., Massling, A., Meinander, O., Nilsson, E. D., Olafsson, H., Pettersson, J. B. C., Prisle, N. L., Riipinen, I., Roldin, P., Ruppel, M., Salter, M., Sand, M., Seland, Ø., Seppä, H., Skov, H., Soares, J., Stohl, A., Ström, J., Svensson, J., Swietlicki, E., Tabakova, K., Thorsteinsson, T., Virkkula, A., Weyhenmeyer, G. A., Wu, Y., Zieger, P., and Kulmala, M.: Interactions between the atmosphere, cryosphere, and ecosystems at northern high latitudes, Atmos. Chem. Phys., 19, 2015–2061, https://doi.org/10.5194/acp-19-2015-2019, 2019. a
Brunner, C. and Kanji, Z. A.: Continuous online monitoring of ice-nucleating particles: development of the automated Horizontal Ice Nucleation Chamber (HINC-Auto), Atmos. Meas. Tech., 14, 269–293, https://doi.org/10.5194/amt-14-269-2021, 2021. a, b, c, d, e, f
Burkert-Kohn, M., Wex, H., Welti, A., Hartmann, S., Grawe, S., Hellner, L., Herenz, P., Atkinson, J. D., Stratmann, F., and Kanji, Z. A.: Leipzig Ice Nucleation chamber Comparison (LINC): intercomparison of four online ice nucleation counters, Atmos. Chem. Phys., 17, 11683–11705, https://doi.org/10.5194/acp-17-11683-2017, 2017. a, b
Burrows, S. M., McCluskey, C. S., Cornwell, G., Steinke, I., Zhang, K., Zhao, B., Zawadowicz, M., Raman, A., Kulkarni, G., China, S., Zelenyuk, A., and DeMott, P. J.: Ice-Nucleating Particles That Impact Clouds and Climate: Observational and Modeling Research Needs, Rev. Geophys., 60, e2021RG000745, https://doi.org/10.1029/2021rg000745, 2022. a
Castarède, D.: Water Condensation and Freezing in the Atmosphere: Exploring Deliquescence and Ice Nucleation, PhD thesis, University of Gothenburg, https://gupea.ub.gu.se/handle/2077/69972 (last access: 1 July 2023), 2021. a, b, c
Castarède, D. and Thomson, E. S.: A thermodynamic description for the hygroscopic growth of atmospheric aerosol particles, Atmos. Chem. Phys., 18, 14939–14948, https://doi.org/10.5194/acp-18-14939-2018, 2018. a, b, c
Chen, J., Pei, X., Wang, H., Chen, J., Zhu, Y., Tang, M., and Wu, Z.: Development, Characterization, and Validation of a Cold Stage-Based Ice Nucleation Array (PKU-INA), Atmosphere, 9, 357, https://doi.org/10.3390/atmos9090357, 2018. a
Cheng, Y., Su, H., Koop, T., Mikhailov, E., and Pöschl, U.: Size dependence of phase transitions in aerosol nanoparticles, Nat. Commun., 6, 1–7, https://doi.org/10.1038/ncomms6923, 2015. a, b
Chou, C.: Investigation of ice nucleation properties onto soot, bioaerosol and mineral dust during different measurement campaigns, PhD thesis, ETH Zurich, https://doi.org/10.3929/ethz-a-006541204, 2011. a, b, c, d
Clapeyron, É.: Mémoire sur la puissance motrice de la chaleur, Journal de l'École Polytechnique, 14, 153–190, 1834. a
Clausius, R.: Ueber die bewegende Kraft der Wärme und die Gesetze, welche sich daraus für die Wärmelehre selbst ableiten lassen, Annalen der Physik, 155, 368–397, 1850. a
Conen, F., Henne, S., Morris, C. E., and Alewell, C.: Atmospheric ice nucleators active ≥−12 ∘C can be quantified on PM10 filters, Atmos. Meas. Tech., 5, 321–327, https://doi.org/10.5194/amt-5-321-2012, 2012. a
David, R. O., Marcolli, C., Fahrni, J., Qiu, Y., Sirkin, Y. A. P., Molinero, V., Mahrt, F., Brühwiler, D., Lohmann, U., and Kanji, Z. A.: Pore condensation and freezing is responsible for ice formation below water saturation for porous particles, P. Natl. Acad. Sci. USA, 116, 8184–8189, https://doi.org/10.1073/pnas.1813647116, 2019. a
DeMott, P. J., Petters, M. D., Prenni, A. J., Carrico, C. M., Kreidenweis, S. M., Collett Jr., J. L., and Moosmüller, H.: Ice nucleation behavior of biomass combustion particles at cirrus temperatures, J. Geophys. Res.-Atmos., 114, D16205, https://doi.org/10.1029/2009JD012036, 2009. a
DeMott, P. J., Möhler, O., Stetzer, O., Vali, G., Levin, Z., Petters, M. D., Murakami, M., Leisner, T., Bundke, U., Klein, H., Kanji, Z. A., Cotton, R., Jones, H., Benz, S., Brinkmann, M., Rzesanke, D., Saathoff, H., Nicolet, M., Saito, A., Nillius, B., Bingemer, H., Abbatt, J., Ardon, K., Ganor, E., Georgakopoulos, D. G., and Saunders, C.: Resurgence in ice nuclei measurement research, B. Am. Meteorol. Soc., 92, 1623–1635, https://doi.org/10.1175/2011BAMS3119.1, 2011. a
DeMott, P. J., Prenni, A. J., McMeeking, G. R., Sullivan, R. C., Petters, M. D., Tobo, Y., Niemand, M., Möhler, O., Snider, J. R., Wang, Z., and Kreidenweis, S. M.: Integrating laboratory and field data to quantify the immersion freezing ice nucleation activity of mineral dust particles, Atmos. Chem. Phys., 15, 393–409, https://doi.org/10.5194/acp-15-393-2015, 2015. a
DeMott, P. J., Möhler, O., Cziczo, D. J., Hiranuma, N., Petters, M. D., Petters, S. S., Belosi, F., Bingemer, H. G., Brooks, S. D., Budke, C., Burkert-Kohn, M., Collier, K. N., Danielczok, A., Eppers, O., Felgitsch, L., Garimella, S., Grothe, H., Herenz, P., Hill, T. C. J., Höhler, K., Kanji, Z. A., Kiselev, A., Koop, T., Kristensen, T. B., Krüger, K., Kulkarni, G., Levin, E. J. T., Murray, B. J., Nicosia, A., O'Sullivan, D., Peckhaus, A., Polen, M. J., Price, H. C., Reicher, N., Rothenberg, D. A., Rudich, Y., Santachiara, G., Schiebel, T., Schrod, J., Seifried, T. M., Stratmann, F., Sullivan, R. C., Suski, K. J., Szakáll, M., Taylor, H. P., Ullrich, R., Vergara-Temprado, J., Wagner, R., Whale, T. F., Weber, D., Welti, A., Wilson, T. W., Wolf, M. J., and Zenker, J.: The Fifth International Workshop on Ice Nucleation phase 2 (FIN-02): laboratory intercomparison of ice nucleation measurements, Atmos. Meas. Tech., 11, 6231–6257, https://doi.org/10.5194/amt-11-6231-2018, 2018. a, b
Eidhammer, T., DeMott, P., Prenni, A., Petters, M., Twohy, C., Rogers, D., Stith, J., Heymsfield, A., Wang, Z., Pratt, K., Prather, K. A., Murphy, S. M., Seinfeld, J. H., Subramanian, R., and Kreidenweis, S. M.: Ice initiation by aerosol particles: Measured and predicted ice nuclei concentrations versus measured ice crystal concentrations in an orographic wave cloud, J. Atmos. Sci., 67, 2417–2436, 2010. a
Fletcher, N. H.: The Physics of Rainclouds, Cambridge University Press, https://doi.org/10.1002/qj.49708837821, 1962. a
Frostenberg, H. C., Welti, A., Luhr, M., Savre, J., S. Thomson, E., and Ickes, L.: The Chance of Freezing – Parameterizing temperature dependent freezing including randomness of INP concentrations, Atmos. Chem. Phys. Discuss. [preprint], https://doi.org/10.5194/acp-2022-696, in review, 2022. a
Garimella, S., Kristensen, T. B., Ignatius, K., Welti, A., Voigtländer, J., Kulkarni, G. R., Sagan, F., Kok, G. L., Dorsey, J., Nichman, L., Rothenberg, D. A., Rösch, M., Kirchgäßner, A. C. R., Ladkin, R., Wex, H., Wilson, T. W., Ladino, L. A., Abbatt, J. P. D., Stetzer, O., Lohmann, U., Stratmann, F., and Cziczo, D. J.: The SPectrometer for Ice Nuclei (SPIN): an instrument to investigate ice nucleation, Atmos. Meas. Tech., 9, 2781–2795, https://doi.org/10.5194/amt-9-2781-2016, 2016. a, b, c, d, e, f, g, h
Garimella, S., Rothenberg, D. A., Wolf, M. J., David, R. O., Kanji, Z. A., Wang, C., Rösch, M., and Cziczo, D. J.: Uncertainty in counting ice nucleating particles with continuous flow diffusion chambers, Atmos. Chem. Phys., 17, 10855–10864, https://doi.org/10.5194/acp-17-10855-2017, 2017. a
Hämeri, K., Laaksonen, A., Väkevä, M., and Suni, T.: Hygroscopic growth of ultrafine sodium chloride particles, J. Geophys. Res.-Atmos., 106, 20749–20757, https://doi.org/10.1029/2000jd000200, 2001. a, b
Hill, T. C., Moffett, B. F., DeMott, P. J., Georgakopoulos, D. G., Stump, W. L., and Franc, G. D.: Measurement of ice nucleation-active bacteria on plants and in precipitation by quantitative PCR, Appl. Environ. Microb., 80, 1256–1267, https://doi.org/10.1128/aem.02967-13, 2014. a
Hiranuma, N., Augustin-Bauditz, S., Bingemer, H., Budke, C., Curtius, J., Danielczok, A., Diehl, K., Dreischmeier, K., Ebert, M., Frank, F., Hoffmann, N., Kandler, K., Kiselev, A., Koop, T., Leisner, T., Möhler, O., Nillius, B., Peckhaus, A., Rose, D., Weinbruch, S., Wex, H., Boose, Y., DeMott, P. J., Hader, J. D., Hill, T. C. J., Kanji, Z. A., Kulkarni, G., Levin, E. J. T., McCluskey, C. S., Murakami, M., Murray, B. J., Niedermeier, D., Petters, M. D., O'Sullivan, D., Saito, A., Schill, G. P., Tajiri, T., Tolbert, M. A., Welti, A., Whale, T. F., Wright, T. P., and Yamashita, K.: A comprehensive laboratory study on the immersion freezing behavior of illite NX particles: a comparison of 17 ice nucleation measurement techniques, Atmos. Chem. Phys., 15, 2489–2518, https://doi.org/10.5194/acp-15-2489-2015, 2015. a, b, c
Hoose, C. and Möhler, O.: Heterogeneous ice nucleation on atmospheric aerosols: a review of results from laboratory experiments, Atmos. Chem. Phys., 12, 9817–9854, https://doi.org/10.5194/acp-12-9817-2012, 2012. a
Hussain, K. and Saunders, C.: Ice nucleus measurement with a continuous flow chamber, Q. J. Roy. Meteor. Soc., 110, 75–84, 1984. a
Kanji, Z. A. and Abbatt, J. P.: The University of Toronto Continuous Flow Diffusion Chamber (UT-CFDC): A simple design for ice nucleation studies, Aerosol Sci. Tech., 43, 730–738, https://doi.org/10.1080/02786820902889861, 2009. a, b
Kanji, Z. A., Welti, A., Chou, C., Stetzer, O., and Lohmann, U.: Laboratory studies of immersion and deposition mode ice nucleation of ozone aged mineral dust particles, Atmos. Chem. Phys., 13, 9097–9118, https://doi.org/10.5194/acp-13-9097-2013, 2013. a
Kanji, Z. A., Sullivan, R. C., Niemand, M., DeMott, P. J., Prenni, A. J., Chou, C., Saathoff, H., and Möhler, O.: Heterogeneous ice nucleation properties of natural desert dust particles coated with a surrogate of secondary organic aerosol, Atmos. Chem. Phys., 19, 5091–5110, https://doi.org/10.5194/acp-19-5091-2019, 2019. a
Köhler, H.: The nucleus in and the growth of hygroscopic droplets, T. Faraday Soc., 32, 1152–1161, 1936. a, b, c, d, e, f
Kong, X., Zhu, S., Shavorskiy, A., Li, J., Liu, W., Arroyo, P. C., Signorell, R., Wang, S., and Pettersson, J. B.: Surface solvation of Martian salt analogues at low relative humidities, Environmental Science: Atmospheres, 2, 137–145, 2022. a
Koop, T., Kapilashrami, A., Molina, L. T., and Molina, M. J.: Phase transitions of sea-salt/water mixtures at low temperatures: Implications for ozone chemistry in the polar marine boundary layer, J. Geophys. Res.-Atmos., 105, 26393–26402, https://doi.org/10.1029/2000jd900413, 2000a. a, b, c, d, e, f
Koop, T., Luo, B., Tsias, A., and Peter, T.: Water activity as the determinant for homogeneous ice nucleation in aqueous solutions, Nature, 406, 611–614, 2000b. a, b, c, d, e, f, g, h, i, j, k, l, m, n, o, p, q, r, s, t, u, v, w
Kulkarni, G., Hiranuma, N., Möhler, O., Höhler, K., China, S., Cziczo, D. J., and DeMott, P. J.: A new method for operating a continuous-flow diffusion chamber to investigate immersion freezing: assessment and performance study, Atmos. Meas. Tech., 13, 6631–6643, https://doi.org/10.5194/amt-13-6631-2020, 2020. a
Lacher, L., Lohmann, U., Boose, Y., Zipori, A., Herrmann, E., Bukowiecki, N., Steinbacher, M., and Kanji, Z. A.: The Horizontal Ice Nucleation Chamber (HINC): INP measurements at conditions relevant for mixed-phase clouds at the High Altitude Research Station Jungfraujoch, Atmos. Chem. Phys., 17, 15199–15224, https://doi.org/10.5194/acp-17-15199-2017, 2017. a, b, c
Lacher, L., Clemen, H.-C., Shen, X., Mertes, S., Gysel-Beer, M., Moallemi, A., Steinbacher, M., Henne, S., Saathoff, H., Möhler, O., Höhler, K., Schiebel, T., Weber, D., Schrod, J., Schneider, J., and Kanji, Z. A.: Sources and nature of ice-nucleating particles in the free troposphere at Jungfraujoch in winter 2017, Atmos. Chem. Phys., 21, 16925–16953, https://doi.org/10.5194/acp-21-16925-2021, 2021. a
Ladino Moreno, L. A., Stetzer, O., and Lohmann, U.: Contact freezing: a review of experimental studies, Atmos. Chem. Phys., 13, 9745–9769, https://doi.org/10.5194/acp-13-9745-2013, 2013. a
Langer, G. and Rodgers, J.: An experimental study of the detection of ice nuclei on membrane filters and other substrata, J. Appl. Meteorol. Clim., 14, 560–570, 1975. a
Mahrt, F., Wieder, J., Dietlicher, R., Smith, H. R., Stopford, C., and Kanji, Z. A.: A high-speed particle phase discriminator (PPD-HS) for the classification of airborne particles, as tested in a continuous flow diffusion chamber, Atmos. Meas. Tech., 12, 3183–3208, https://doi.org/10.5194/amt-12-3183-2019, 2019. a
Marcolli, C.: Deposition nucleation viewed as homogeneous or immersion freezing in pores and cavities, Atmos. Chem. Phys., 14, 2071–2104, https://doi.org/10.5194/acp-14-2071-2014, 2014. a
Mason, B.: The cloud chamber as a tool in cloud physics, Contemp. Phys., 4, 27–48, 1962. a
Matus, A. V. and L'Ecuyer, T. S.: The role of cloud phase in Earth's radiation budget, J. Geophys. Res.-Atmos., 122, 2559–2578, 2017. a
Murray, B., Broadley, S., Wilson, T., Bull, S., Wills, R., Christenson, H., and Murray, E.: Kinetics of the homogeneous freezing of water, Phys. Chem. Chem. Phys., 12, 10380–10387, https://doi.org/10.1039/c003297b, 2010. a, b
Möhler, O., Adams, M., Lacher, L., Vogel, F., Nadolny, J., Ullrich, R., Boffo, C., Pfeuffer, T., Hobl, A., Weiß, M., Vepuri, H. S. K., Hiranuma, N., and Murray, B. J.: The Portable Ice Nucleation Experiment (PINE): a new online instrument for laboratory studies and automated long-term field observations of ice-nucleating particles, Atmos. Meas. Tech., 14, 1143–1166, https://doi.org/10.5194/amt-14-1143-2021, 2021. a
Nicolet, M., Stetzer, O., Lüönd, F., Möhler, O., and Lohmann, U.: Single ice crystal measurements during nucleation experiments with the depolarization detector IODE, Atmos. Chem. Phys., 10, 313–325, https://doi.org/10.5194/acp-10-313-2010, 2010. a, b
Niemand, M., Möhler, O., Vogel, B., Vogel, H., Hoose, C., Connolly, P., Klein, H., Bingemer, H., DeMott, P., Skrotzki, J., and Leisner, T.: A Particle-Surface-Area-Based Parameterization of Immersion Freezing on Desert Dust Particles, J. Atmos. Sci., 69, 3077–3092, https://doi.org/10.1175/jas-d-11-0249.1, 2012. a
Orr Jr., C., Hurd, F. K., and Corbett, W. J.: Aerosol size and relative humidity, Journal of Colloid Science, 13, 472–482, https://doi.org/10.1016/0095-8522(58)90055-2, 1958. a
Patnaude, R. J., Perkins, R. J., Kreidenweis, S. M., and DeMott, P. J.: Is Ice Formation by Sea Spray Particles at Cirrus Temperatures Controlled by Crystalline Salts?, ACS Earth Space Chem., 5, 2196–2211, https://doi.org/10.1021/acsearthspacechem.1c00228, 2021. a, b
Petters, M. D., Parsons, M. T., Prenni, A. J., DeMott, P. J., Kreidenweis, S. M., Carrico, C. M., Sullivan, A. P., McMeeking, G. R., Levin, E., Wold, C. E., Collett Jr., J. L., and Moosmüller, H.: Ice nuclei emissions from biomass burning, J. Geophys. Res.-Atmos., 114, D07209, https://doi.org/10.1029/2008JD011532, 2009. a
Phillips, V. T. J., DeMott, P. J., and Andronache, C.: An Empirical Parameterization of Heterogeneous Ice Nucleation for Multiple Chemical Species of Aerosol, J. Atmos. Sci., 65, 2757–2783, https://doi.org/10.1175/2007jas2546.1, 2008. a
Porter, G. C. E., Sikora, S. N. F., Adams, M. P., Proske, U., Harrison, A. D., Tarn, M. D., Brooks, I. M., and Murray, B. J.: Resolving the size of ice-nucleating particles with a balloon deployable aerosol sampler: the SHARK, Atmos. Meas. Tech., 13, 2905–2921, https://doi.org/10.5194/amt-13-2905-2020, 2020. a
Richardson, M.: Making real time measurements of ice nuclei concentrations at upper tropospheric temperatures: Extending the capabilities of the continuous flow diffusion chamber, Colorado State University, ISBN: 978-1244085848, 2009. a, b, c, d, e
Richardson, M. S., DeMott, P. J., Kreidenweis, S. M., Cziczo, D. J., Dunlea, E. J., Jimenez, J. L., Thomson, D. S., Ashbaugh, L. L., Borys, R. D., Westphal, D. L., Casuccio, G. S., and Lersch, T. L.: Measurements of heterogeneous ice nuclei in the western United States in springtime and their relation to aerosol characteristics, J. Geophys. Res., 112, D02209, https://doi.org/10.1029/2006JD007500, 2007. a
Richardson, M. S., DeMott, P. J., Kreidenweis, S. M., Petters, M. D., and Carrico, C. M.: Observations of ice nucleation by ambient aerosol in the homogeneous freezing regime, Geophys. Res. Lett., 37, L04806, https://doi.org/10.1029/2009GL041912, 2010. a
Rogers, D. C.: Development of a continuous flow thermal gradient diffusion chamber for ice nucleation studies, Atmos. Res., 22, 149–181, 1988. a, b, c, d, e, f, g, h, i, j
Rogers, R. and Yau, M.: A short course of cloud physics, Pregamon, ISBN: 9780750632157, eBook ISBN: 9780080570945, 1989. a, b
Schiebel, T.: Ice nucleation activity of soil dust aerosols, PhD thesis, KIT-Bibliothek, https://doi.org/10.5445/IR/1000076327, 2017. a
Schneider, J., Höhler, K., Wagner, R., Saathoff, H., Schnaiter, M., Schorr, T., Steinke, I., Benz, S., Baumgartner, M., Rolf, C., Krämer, M., Leisner, T., and Möhler, O.: High homogeneous freezing onsets of sulfuric acid aerosol at cirrus temperatures, Atmos. Chem. Phys., 21, 14403–14425, https://doi.org/10.5194/acp-21-14403-2021, 2021. a
Schrod, J., Danielczok, A., Weber, D., Ebert, M., Thomson, E. S., and Bingemer, H. G.: Re-evaluating the Frankfurt isothermal static diffusion chamber for ice nucleation, Atmos. Meas. Tech., 9, 1313–1324, https://doi.org/10.5194/amt-9-1313-2016, 2016. a
Skrotzki, J., Connolly, P., Schnaiter, M., Saathoff, H., Möhler, O., Wagner, R., Niemand, M., Ebert, V., and Leisner, T.: The accommodation coefficient of water molecules on ice – cirrus cloud studies at the AIDA simulation chamber, Atmos. Chem. Phys., 13, 4451–4466, https://doi.org/10.5194/acp-13-4451-2013, 2013. a, b
Stetzer, O., Baschek, B., Lüönd, F., and Lohmann, U.: The Zurich Ice Nucleation Chamber (ZINC)-A new instrument to investigate atmospheric ice formation, Aerosol Sci. Tech., 42, 64–74, https://doi.org/10.1080/02786820701787944, 2008. a, b
Stopelli, E., Conen, F., Zimmermann, L., Alewell, C., and Morris, C. E.: Freezing nucleation apparatus puts new slant on study of biological ice nucleators in precipitation, Atmos. Meas. Tech., 7, 129–134, https://doi.org/10.5194/amt-7-129-2014, 2014. a
Stubenrauch, C. J., Rossow, W. B., Kinne, S., Ackerman, S., Cesana, G., Chepfer, H., Girolamo, L. D., Getzewich, B., Guignard, A., Heidinger, A., Maddux, B. C., Menzel, W. P., Minnis, P., Pearl, C., Platnick, S., Poulsen, C., Riedi, J., Sun-Mack, S., Walther, A., Winker, D., Zeng, S., and Zhao, G.: Assessment of global cloud datasets from satellites: Project and database initiated by the GEWEX radiation panel, B. Am. Meteorol. Soc., 94, 1031–1049, http://www.jstor.org/stable/26219557 (last access: 1 July 2023), 2013. a
Thomson, W.: On the Equilibrium of Vapour at a Curved Surface of Liquid, P. Roy. Soc. Edinb. A, 7, 63–68, 1872. a
Tomlinson, E. M. and Fukuta, N.: A New Horizontal Gradient, Continuous Flow, Ice Thermal Diffusion Chamber, J. Atmos. Ocean. Tech., 2, 448–467, https://doi.org/10.1175/1520-0426(1985)002<0448:ANHGCF>2.0.CO;2, 1985. a
Vali, G., DeMott, P. J., Möhler, O., and Whale, T. F.: Technical Note: A proposal for ice nucleation terminology, Atmos. Chem. Phys., 15, 10263–10270, https://doi.org/10.5194/acp-15-10263-2015, 2015. a, b, c
Welti, A., Lüönd, F., Stetzer, O., and Lohmann, U.: Influence of particle size on the ice nucleating ability of mineral dusts, Atmos. Chem. Phys., 9, 6705–6715, https://doi.org/10.5194/acp-9-6705-2009, 2009. a, b, c, d, e, f, g, h, i, j
Welti, A., Korhonen, K., Miettinen, P., Piedehierro, A. A., Viisanen, Y., Virtanen, A., and Laaksonen, A.: SPIN modification for low-temperature experiments, Atmos. Meas. Tech., 13, 7059–7067, https://doi.org/10.5194/amt-13-7059-2020, 2020. a, b, c, d, e, f, g, h