the Creative Commons Attribution 4.0 License.
the Creative Commons Attribution 4.0 License.
 | 01 Sep 2023
Mapping the performance of a versatile water-based condensation particle counter (vWCPC) with numerical simulation and experimental study
Weixing Hao
Susanne Hering
Steven Spielman
Beat Schmid
Jason Tomlinson
Accurate airborne aerosol instrumentation is required to determine the spatial distribution of ambient aerosol particles, particularly when dealing with the complex vertical profiles and horizontal variations of atmospheric aerosols. A versatile water-based condensation particle counter (vWCPC) has been developed to provide aerosol concentration measurements under various environments with the advantage of reducing the health and safety concerns associated with using butanol or other chemicals as the working fluid. However, the airborne deployment of vWCPCs is relatively limited due to the lack of characterization of vWCPC performance at reduced pressures. Given the complex combinations of operating parameters in vWCPCs, modeling studies have advantages in mapping vWCPC performance.
In this work, we thoroughly investigated the performance of a laminar-flow vWCPC using COMSOL Multiphysics® simulation coupled with MATLAB™. We compared it against a modified vWCPC (vWCPC model 3789, TSI, Shoreview, MN, USA). Our simulation determined the performance of particle activation and droplet growth in the vWCPC growth tube, including the supersaturation, (smallest size of particle that can be activated), (particle size activated with 50 % efficiency) profile, and final growth particle size Dd under wide operating temperatures, inlet pressures P (30–101 kPa), and growth tube geometry (diameter D and initiator length Lini). The effect of inlet pressure and conditioner temperature on vWCPC 3789 performance was also examined and compared with laboratory experiments. The COMSOL simulation result showed that increasing the temperature difference (ΔT) between conditioner temperature Tcon and initiator Tini will reduce and the cut-off size of the vWCPC. In addition, lowering the temperature midpoint ( increases the supersaturation and slightly decreases the Dp,kel. The droplet size at the end of the growth tube is not significantly dependent on raising or lowering the temperature midpoint but significantly decreases at reduced inlet pressure, which indirectly alters the vWCPC empirical cut-off size. Our study shows that the current simulated growth tube geometry (D=6.3 mm and Lini=30 mm) is an optimized choice for current vWCPC flow and temperature settings. The current simulation can more realistically represent the Dp,kel for 7 nm vWCPC and also achieved good agreement with the 2 nm setting. Using the new simulation approach, we provide an optimized operation setting for the 7 nm setting. This study will guide further vWCPC performance optimization for applications requiring precise particle detection and atmospheric aerosol monitoring.
- Article
(1389 KB) - Full-text XML
-
Supplement
(675 KB) - BibTeX
- EndNote


Aerosols, defined as any solid or liquid particles suspended in air, are one of the fundamental components of the atmosphere and have a significant impact on air quality, climate change, and human health (Seinfeld et al., 2016; Anderson et al., 2020; Lighty et al., 2000; Pöschl, 2005; Li et al., 2017; Gonzalez et al., 2021; Hao et al., 2020, 2021a; Kapiamba et al., 2022). However, accurate and comprehensive monitoring of aerosol particles is challenging because aerosol particle sizes and number concentrations vary widely both spatially and temporally (Davidson et al., 2005; Yu and Luo, 2009; Krudysz et al., 2009; Wang et al., 2018; Hilario et al., 2021). Airborne measurements and characterization, therefore, are often required to capture the vertical profiles and horizontal variability of atmospheric aerosols.
In understanding the variability of atmospheric aerosol and determining the size distribution and number concentration of aerosols, laminar-flow, butanol-based condensation particle counters (CPCs) used in conjunction with differential mobility analyzers (DMAs) can provide real-time measurements of airborne particles and are widely used by effectively exploiting the working principle of condensation growth (Hermann et al., 2007; Kangasluoma and Attoui, 2019; Mordas et al., 2008; Sem, 2002; Wiedensohlet et al., 1997; Ahn and Liu, 1990a, b). However, conventional butanol CPCs face difficulties in characterizing particles below 3 nm in size. In addition, health and safety risks, such as the odor, flammability, and toxicity of the butanol, are an issue for many deployments in offices, homes, aircraft, and other inhabited locations. These limitations have directly led to researchers designing advanced aerosol instruments that can be more widely used in both atmospheric environments and laboratory studies.
In 2005, Hering and Stolzenburg (2005) developed a continuous-flow, water-based laminar condensation particle counter (WCPC) (Hering et al., 2005; Hering and Stolzenburg, 2005), which uses distilled water as the working fluid to avoid the health and safety concerns. It was also found to have comparable performance to butanol-based CPCs in previous studies (Biswas et al., 2005; Franklin et al., 2010; Iida et al., 2008; Kupc et al., 2013; Liu et al., 2006; Mordas et al., 2008). A modified version of the WCPC featuring an additional new moderator section has been developed (Hering et al., 2014). With this new moderated approach, the initiator provides water vapor for particle activation, while the moderator provides distance and time for particle growth. This improved water CPC achieves the same peak supersaturation and similar droplet growth while reducing water vapor, particle loss, and side effects of heating the flow in the earlier version of the WCPC. Furthermore, a versatile WCPC was then developed that is capable of particle detection near 1 nm without using a filtered sheath flow. The operating temperatures can also be adjusted in accordance with the cut point desired (Hering et al., 2017).
Since water-based CPCs have comparable performance to butanol-based CPCs while also offering the advantage of avoiding health and safety risks, it is desirable to explore advanced water-based CPCs in a broader range of environmental and energy applications. To improve the detection performance of the vWCPC, we need to identify the effects of operational factors and geometry. However, the limited analysis of relevant temperature and geometric parameters in the vWCPC makes it challenging to control condensational growth conditions. In addition, the inlet pressure effect is another critical factor affecting the detection efficiency of vWCPCs. The potential of using vWCPCs for airborne deployment or other lower-pressure monitoring has not been fully explored. Mei et al. (2021) found that the counting efficiency of the vWCPC 3789 operated at the factory settings decreased with decreasing the operating pressure, particularly at operating pressures below 700 hPa. However, determining how to reduce the lower detection limit under various ambient pressures also needs to be investigated.
Due to the complex matrix of geometry, operating temperature, and inlet pressure parameters in vWCPCs, modeling studies are advantageous in determining and optimizing the detection efficiency of vWCPCs. The Graetz model was first used by Stolzenburg (1988) to examine the detection of ultrafine particles in CPCs. In recent years, COMSOL Multiphysics® has been widely used to simulate coupled heat, mass, and momentum transfer problems associated with complex geometries in CPCs. Moreover, COMSOL has advantages in interfacing with post-processing software such as MATLAB™. A series of parametric analyses for butanol CPCs were simulated using COMSOL to investigate the performance of particle activation and droplet growth (Hao et al., 2021b; Attoui, 2018; Kangasluoma et al., 2015; Barmpounis et al., 2018; Thomas et al., 2018). Our previous work (Hao et al., 2021b) first demonstrated that the COMSOL results, neglecting the temperature dependence of vapor thermodynamic properties and axial diffusion, agree with the Graetz solution used by Stolzenburg (1988). Considering temperature dependence of vapor thermodynamic properties and axial diffusion can generate more accurate results that can guide the optimization of CPC designs. Previous research using COMSOL to examine vWCPC performance has been limited. Bian et al. (2020) compared two-stage and three-stage operating temperature methods for growth tubes and parameters such as flow rate and temperature difference to obtain the ideal activation and final growth sizes. Mei et al. (2021) used COMSOL aiding to examine how inlet pressure affects particle activation in the vWCPCs. However, the lack of thorough and systematic examination of vWCPC performance using COMSOL leaves it unclear how well the vWCPC will perform in multiple complex research areas and applications, such as at reduced atmospheric pressure levels.
In this study, we thoroughly determined the saturation profile, activation efficiency, and droplet growth for varying airborne operations through numerical simulation of a laminar-flow vWCPC in COMSOL and experimental validation of a commercial vWCPC (TSI model 3789). By mapping vWCPC performance in the modeling, the effects of various operational factors, such as inlet pressures (30–101 kPa), growth tube diameter, initiator length, and temperature gradients on particle activation and droplet growth, were investigated. In addition, detailed modeling methods are outlined below. The detection efficiency was also examined in the experimental and COMSOL modeling work. The results of this study will guide further optimization of the performance of vWCPCs for accurate detection of particles and atmospheric aerosol measurement applications.
2.1 Numerical simulation
2.1.1 COMSOL setup
The finite-element COMSOL simulation software (COMSOL Multiphysics® 5.3a, COMSOL Inc, Stockholm, Sweden) can handle a variety of fields including, but not limited to, electromagnetics, fluid dynamics, heat transfer, chemical reactions, and structural mechanics. Here, a two-dimensional axisymmetric model is developed to simulate fluid flow in a cylindrical tube. The heat, momentum, and mass transfer equations are solved for incompressible parabolic flow. This COMSOL model follows the three-stage tube of the versatile water-based CPC (TSI Inc, Shoreview, MN, USA) described by Hering et al. (2017), which consists of a fully developed laminar-flow tube that can be separated into a cool-wall conditioner region, a warm-wall initiator region, and a cool-wall moderator region, where r is the radial coordinate of the tube diameter and z is the axial coordinate of the tube length (Fig. 1a). At the inlet of the conditioner tube, sampled aerosols are fed and saturated with water vapor before entering the initiator region. The manufacturer provides two default cut-off diameter settings: 2 and 7 nm configurations based on the characteristics introduced by Kangasluoma et al. (2017). This study used the 7 nm configuration as an example to demonstrate the simulation mapping effort. The methodology can also be used for other targeted cut-off sizes. The tube diameter (D) is 6.3 mm, the conditioner length (Lcon) is 73 mm, the initiator length (Lini) is 30 mm, and the moderator length (Lmod) is 73 mm. The default settings are (Table 1) the following: the conditioner temperature (Tcon) is 30 ∘C, the initiator temperature (Tini) is 59 ∘C, and the moderator temperature (Tmod) is 10 ∘C. The aerosol flow rate (Qv) is 0.3 L min−1. The relative humidity (RH) of inlet flow is set at 20 %, and water vapor is assumed to be saturated at the wall. The inlet pressure (P) is 101 kPa. To investigate how the vWCPC performance depends on these parameters, we simulate a wide range of values for mapping the vWCPC geometry, working temperature conditions, and inlet pressure, as discussed in Sect. 2.1.4 for the tasks in this study.
Table 1Parameters of the vWCPC for different simulation tasks. Note that the default settings of the vWCPC are the conditioner temperature (Tcon) of 30 ∘C, the initiator temperature (Tini) of 59 ∘C, and the moderator temperature (Tmod) of 10 ∘C. The aerosol flow rate (Qv) is 0.3 L min−1. The relative humidity (RH) of inlet flow is set at 20 %, and water vapor is assumed to be saturated at the wall. The inlet pressure (P) is 101 kPa (1 atm).
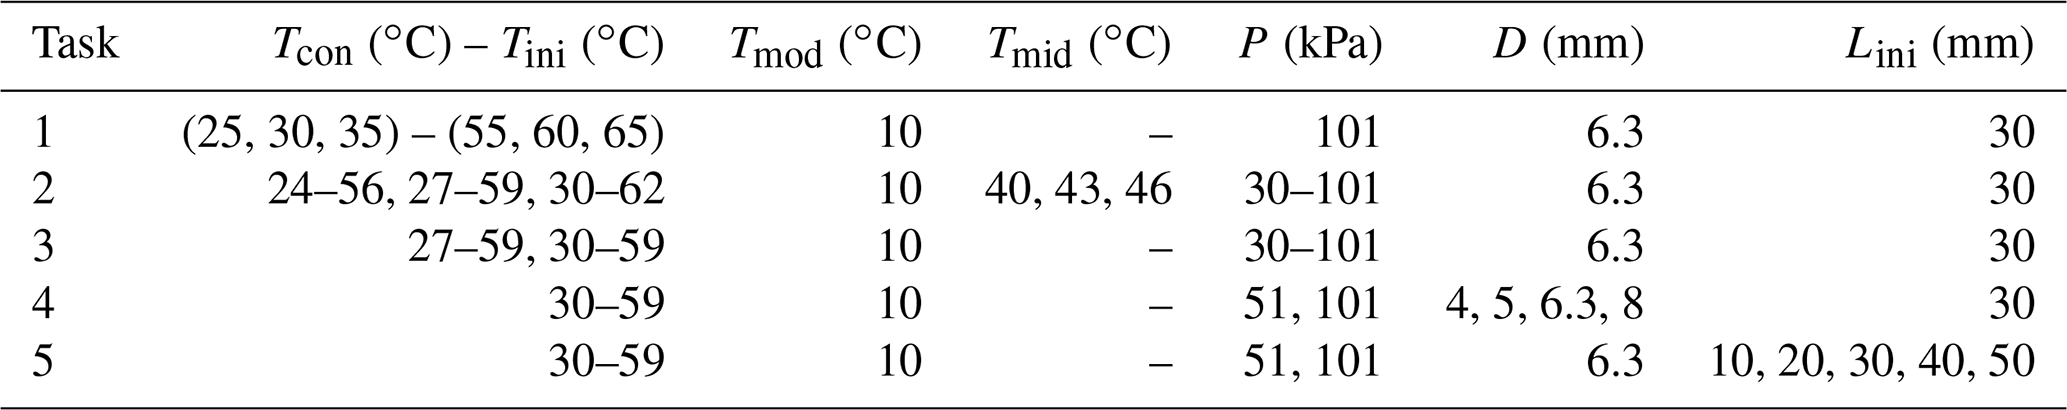
Figure 1Geometry of the vWCPC used in COMSOL simulation and the spatial distribution of the saturation ratio and Kelvin equivalent size under a default temperature Tcon, Tini, and Tmod of 30, 59, and 10 ∘C. (a) Geometry of the vWCPC used in COMSOL simulation, (b) spatial distribution of the saturation ratio (S, color contour plot), (c) spatial distribution of Kelvin equivalent size (Dp,kel, color contour plot), (d) spatial distribution of water vapor concentration (c, color contour plot), and (e) spatial distribution of temperature (T, color contour plot). Note that the color of Dp,kel in the conditioner region is blank because no particles are activated in this region.
In this COMSOL model, the coupled heat transfer and fluid flow are first solved by the conjugate heat transfer module, and then the mass transfer of water vapor is solved based on the obtained temperature and flow field. Lastly, the particles are introduced from the inlet of the vWCPC and are considered diluted species that follow the convective diffusion equation in the simulation, which is numerically solved to calculate the temperature, supersaturation, and water vapor concentration profiles (Fig. 1). Regarding the initial and boundary value settings, the inflow temperature is set to an ambient temperature of 25 ∘C, and wall temperature is set to the default factory settings described above and changed as the experimental conditions changed for mapping performance. The simulated temperature and concentration fields are then imported into MATLAB™ R2022b (The MathWorks, Inc., Natick, MA, USA) and interpolated at any given point in the r–z plane. COMSOL Multiphysics® 5.3a with MATLAB™ allows us to adjust geometry, modify physics settings, perform parametric studies, control solvers, and post-process the results.
2.1.2 Theory of particle activation
Particle activation is key to the evaluation of CPC performance. Particle activation within the vWCPC depends on the degree of supersaturation, namely the saturation ratio (S) of water vapor, which is the ratio of the partial pressure of water vapor (p) to the saturation vapor pressure of water vapor (ps) for the given flow temperature (T), calculated by
The spatial profile of S within the vWCPC allows us to calculate the Kelvin effect, the homogeneous nucleation, and further condensational particle growth, as discussed in Sect. 2.1.3. The Kelvin effect is dependent upon thermodynamic principles and described as the Kelvin equivalent size (Dp,kel), the minimum diameter of a particle that can be activated for condensation growth. It is determined by water surface tension (σ), water molecular volume (vm), the Boltzmann constant (k), temperature (T), and the saturation ratio (S) calculated at each location within the initiator,
The Kelvin equivalent size is inversely proportional to the distribution of saturation ratio, where the greater the saturation ratio, the smaller the size of the particles that can be activated. In other words, the smaller the particle, the higher the degree of supersaturation required to activate growth. When particle size (Dp) is above Dp,kel, the particle can be successfully activated and grown by water vapor condensation, while when Dp is below Dp,kel, the particles cannot be activated. Figure 1b–e show examples of saturation ratio, Kelvin equivalent size, water vapor concentration, and temperature profiles within the simulated geometry at the default temperature condition of Tcon=30 ∘C, Tini=59 ∘C, and Tmod=10 ∘C, respectively.
It is worth noting that Dp,kel varies at different locations of the initiator due to the spatial variation of temperature, surface tension and saturation ratio. We observed the potential particle activation in the moderator via simulation results. However, only the Kelvin equivalent size in the initiator was considered in this work. Although the particles were activated in the moderator, particle detection was unlikely due to droplet growth being the dominant water vapor sink in the initiator. Thus, in reality, the actual supersaturation in the moderator may be different, and the activation of smaller particles will be hindered by droplet growth (Hering et al., 2014; Hering et al., 2017). Note that the Dp,kel in the conditioner region is blank in color due to no particles being activated in this region (S≤1). Particles near the wall of the initiator, where there is a lower S, are more difficult to activate due to the larger Dp,kel. This difference can be explained by the water mass and heat diffusivity differences. As the colder, water-saturated flow passes through the growth tube, the mass transport of water vapor is faster than the heating of the flow from the wall because the mass diffusivity of water vapor is higher than the thermal diffusivity of air, producing a maximum supersaturation of water vapor at the centerline of the tube. As a result, the seed particles entering near the centerline of the growth tube are activated in the warmer initiator. One comparison of the saturation ratio and Kelvin equivalent size along the centerline (r=0) is shown in Fig. S1a and b. We observed the appearance of a double-peaked saturation ratio curve. Again, only the Kelvin equivalent size in the initiator was considered in this work due to insufficient water vapor and droplet growth in the moderator. Note that the solute effect is negligible under water-based condensation particle growth and is not included in the following simulation. As shown in Fig. S2, around 1 % variation was observed in the final droplet size by adding the solute effect into the droplet growth simulation.
The activation efficiency of particles with a size of Dp in the vWCPC is derived using an approach similar to our previous work (Hao et al., 2021b), which is calculated by the ratio of the number concentration of the activated particles over the total particle number concentration in the growth tube. The activation efficiency is calculated as
where w is the velocity along the axial direction, and N is the concentration of particles, both at the axial location of z = Zact. Ract is the maximum radius of the contour corresponding to is the particle concentration at the inlet of the conditioner. Qv is the flow rate through the vWCPC. An example of activation efficiency as a function of particle diameter Dp can be found in Fig. S1c. Note that the calculation of the activation efficiency in Eq. (3) does not consider the diffusion loss of the particles in the conditioner. Since this model does not have sheath flow that minimizes the diffusion losses and constrains the aerosols to the high-supersaturation region, the activation efficiency cannot reach 100 %. On the activation curve, there are two points of interest: minimum activated size, (the smallest size of particle that can be activated in the initiator), and 50 % cut-off size, (the size of a particle with 50 % activation efficiency extracted from the activation efficiency curve). is essential to the performance of CPCs because it determines the general particle size range in which the CPC can confidently measure. can be used as the representative of particle activation efficiency performance. Furthermore, note that negligible homogeneous nucleation occurs in the growth tube of the initiator and moderator under all tested conditions in this study, which means the total nucleation rate is equal to or less than one particle per second (1 s−1).
2.1.3 Theory of droplet growth
Once the particles are activated, their condensational growth along their trajectories in the initiator region was simulated by numerically solving two coupled differential equations in MATLAB™. First, the evolution of droplet diameter (Dp) can be estimated by (Seinfeld and Pandis, 2016; Wang et al., 2017)
where M and ρ represent the molecular weight and density of water, Dv′ represents the modified diffusivity of water vapor accounting for the non-continuum effect of the particles and is given by (where Dv is the diffusivity of water vapor), and αc is the mass accommodation coefficient of water assumed to be 1. Cd represents the equilibrium water concentration at the surface of the growth droplets and is given by , where Cs is saturation water concentration and Td is the droplet surface temperature, which is governed by
where cp, ρ, and Hvap are the heat capacity, density, and heat of vaporization of water. kg′ represents the modified thermal conductivity of air accounting for the non-continuum effects in heat transfer and is calculated as , where Mg, ρg, cp,g, and kg are the molecular weight, density, heat capacity, and thermal conductivity of air. αT is the thermal accommodation coefficient and was assumed to be 1 (Seinfeld and Pandis, 2016; Wang et al., 2017).
In the simulation of droplet growth, the Brownian motion of the particles inside the conditioner before activation is neglected. Since there is also no electric field inside the conditioner, we assume that the particles move axially along the vWCPC with a velocity of w. Therefore, Eqs. (5) and (6) can be converted to a function of axial location using , and the droplet size and droplet surface temperature at the end of the moderator ( can be calculated. To determine the final droplet growth size at the outlet of the moderator, the condensational growth of 8 nm particles as seed particles was studied along the centerline (r=0) of the growth tube in this work. An example of droplet growth size as a function of distance along the axis of the tube for the default temperature conditions of Tcon=30 ∘C, Tini=59 ∘C, and Tmod=10 ∘C can be found in Fig. S1d. Note that in this simulation, we do not consider the increase in the equilibrium vapor pressure due to warming of the flow from condensational heat release, which would further reduce the droplet growth.
2.1.4 Simulation plan
Table 1 summarizes the operating temperatures, inlet pressures, and geometric parameters for each simulation task characterizing the vWCPC in this study. In Task 1, we first conducted two matrix combinations of absolute conditioner and initiator operating temperatures, with an interval of 5 ∘C in each region, for a total of nine different combinations. Task 2 investigates how raising or lowering the temperature midpoints (Tmid), the average value between the conditioner temperature and initiator temperature , affects particle activation and droplet growth. In addition, different inlet pressures are also included when comparing different temperature midpoints. Task 3 examines the effect of inlet pressure at the default conditioner temperature of 30 ∘C and the customized conditioner temperature of 27 ∘C. Tasks 4 and 5 further test how the vWCPC geometry, including tube diameter D and initiator length Lini, affects the performance of the vWCPC. These simulations reveal optimal working conditions and effects for the influence of each parameter.
2.2 Experimental measurement
The modified vWCPC 3789 (TSI Inc, Shoreview, MN, USA) was tested in this study. Given that the standard commercially available vWCPC 3789 is not specifically designed for low-pressure applications, some modifications were made to the instrument for this study. First, the vWCPC 3789 was tested to ensure its vacuum-tightness, and the exhaust line was filtered and returned back to the make-up flow line after a flow buffer. Second, we added pressure transducers to the inlet and exhaust lines of the vWCPC 3789 to monitor the inline pressure variation. Note that the aerosol flow rate through the condenser tube and optical particle detector was 0.3 L min−1. When we operated with 0.6 L min−1 inlet aerosol flow, we blocked the make-up flow port. Details of operating flow, temperatures, and geometry are provided in Sect. 2.1.1. Further specifics can be found in our previous study (Mei et al., 2021).
Two methods were used to generate the test aerosol: an atomizer coupled with a furnace and a glowing wire generator (GWG). Ammonium sulfate (AS) has been commonly used for CPC characterization and was the tested material used in this study (Hering et al., 2014; Kangasluoma et al., 2017). It was dissolved into deionized water for aerosol generation using atomization techniques. To increase the aerosol number concentration for particles smaller than 30 nm, polydisperse AS aerosols were also passed through a tube furnace generator at the temperature of 500 ∘C and flow rate of 1.5 L min−1 (Lindberg/Blue, Thermal Scientific, TX, USA) to shift the size distribution to a smaller size. A lab-built GWG was also used to generate aerosol particles in size range between 2.5 and 16 nm. More details about the generator can be found in Attoui (2022). Using the low-pressure testing setup shown in Fig. 2, the counting efficiency of a vWCPC 3789 was measured between 51 and 91 kPa for AS particles of 3–20 nm (mobility diameter) and NiCr oxidants of 2.5–16 nm. The aerosol concentrations in this test were maintained in the range of 2×10⁴–4×104 cm−3. During the testing, the temperature variations in the conditioner and moderator were less than 0.5 ∘C, and the initiator temperature had a variation of 1 ∘C.
3.1 Comparisons of temperature-dependent particle activation and droplet growth performance
Selection of appropriate operating temperatures in CPCs is essential because the supersaturation is significantly temperature-dependent, which affects particle activation and further droplet growth. In addition, the temperature difference between different regions in CPCs is an important factor in controlling supersaturation. For this reason, the minimum activation size for butanol-based CPCs is significantly impacted by the temperature difference between the saturator and condenser as well as the raising or lowering of the temperature midpoints, as has been demonstrated by many previous studies (Hermann and Wiedensohler, 2001; Kangasluoma and Attoui, 2019; Barmpounis et al., 2018; Kuang et al., 2012). The results showed that in the butanol-based CPCs, the greater the temperature difference between the saturator and condenser, the higher the degree of supersaturation and the smaller that particle that could be activated.
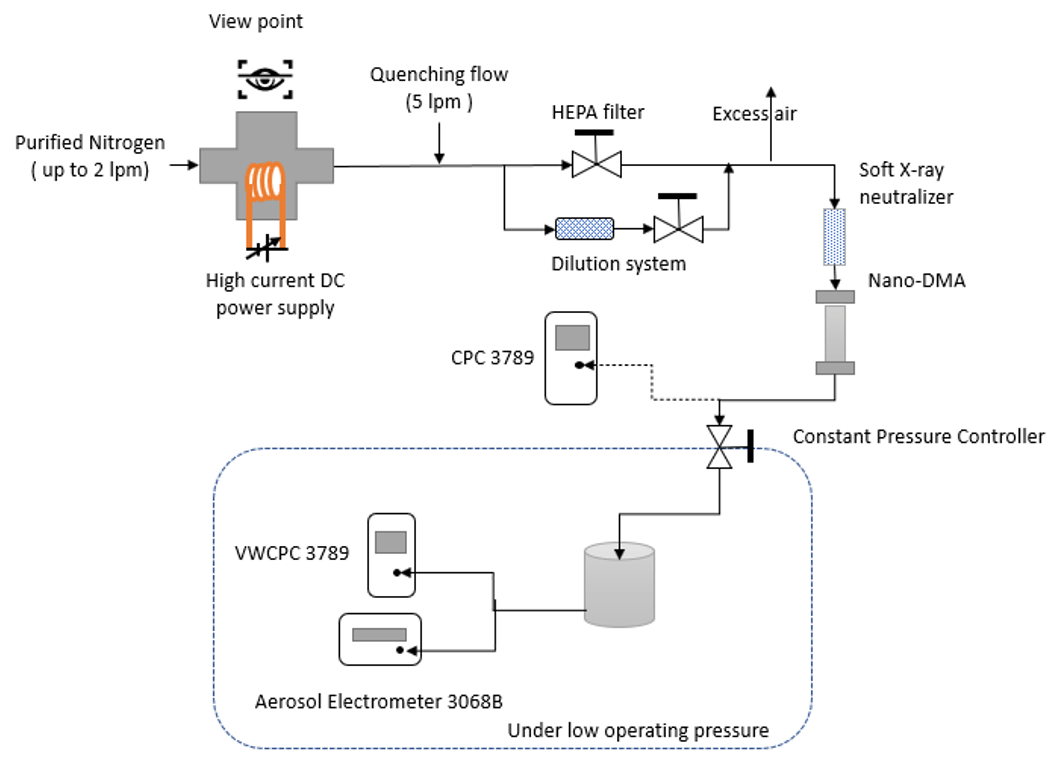
The numerical COMSOL model was used to compare operating-temperature-dependent particle activation and droplet growth performance in the vWCPC, including minimum activated size (, 50 % cut-off size (, and final particle size at the outlet of the moderator along the centerline (r=0) (Dd), as shown in Fig. 3. Previous studies confirmed that the centerline saturation rate is insensitive to the moderator wall temperature (Hering et al., 2014; Bian et al., 2020). Thus, this study investigated moderator temperature (Tmod) at the constant of 10 ∘C, conditioner temperature (Tcon) in the range of 25–35 ∘C, and initiator temperature (Tini) in the range of 55–65 ∘C. Note that conditions that can lead to a lower value and larger droplet growth size are favored for improving the performance of the vWCPC.
Figure 3Effect of conditioner (Tcon) and initiator temperature (Tini) on (a) minimum activated size , (b) 50 % cut-off size , and (c) final particle size at the outlet of the moderator along the centerline (r=0), Dd. The condensational growth of 15 nm particles was tested as seed particles.
Firstly, in order to compare the effect of the conditioner temperature Tcon, we varied Tcon from 25 to 35 ∘C while maintaining the same initiator temperature Tini and moderator temperature Tmod. The results show that increased significantly by 5.21, 3.32, and 2.27 nm at the initiator temperature Tini of 55, 60, and 65 ∘C, respectively, and increased significantly by 6.65, 4.16, and 2.75 nm at the initiator temperature Tini of 55, 60, and 65 ∘C, respectively. The final droplet size Dd decreased by approximately 1 µm at all the initiator temperatures Tini of 55, 60, and 65 ∘C. The lower conditioner temperature provided higher saturation ratios in the initiator and more water vapor for particle growth, which is also consistent with the previous growth tube simulation (Bian et al., 2020; Mei et al., 2021). Secondly, the initiator temperature Tini was increased from 55 to 65 ∘C while maintaining the same conditioner temperature Tcon and moderator temperature Tmod; was decreased by 1.90, 3.74, and 4.87 nm at the conditioner temperatures Tcon of 25, 30, and 35 ∘C, respectively; was decreased significantly by 2.32, 3.74, and 6.21 nm at the conditioner temperatures Tcon of 25, 30, and 35 ∘C, respectively; and Dd was increased by 2.9 µm at all the conditioner temperatures Tcon of 25, 30, and 35 ∘C.
By comparing all combinations, we can find that the activated size becomes smaller as the temperature difference between Tcon and Tini increases, indicating that the temperature differences between the conditioner and initiator dominate the particle activation. After comparing the temperature differences, we conclude that the higher the temperature between these two regions, the better the particle activation. However, in the actual operation of the CPC, one also needs to ensure that the self-nucleation in the growth tube is minimized (< 1 s−1) so that the CPC does not report false particle counting. The homogeneous nucleation rate is less than 10−8 s−1 at all tested conditions, meaning that the temperatures can be further adjusted to optimize particle activation and droplet growth. Moreover, Dd is the greatest, with a maximum size of 12.20 µm, at the temperature setting of 25–65–10 ∘C among all these temperature conditions. We also found that the effect of the initiator temperature on droplet growth was greater than that of the conditioner temperature. Thus, the following section examines the effect of temperature midpoint on the vWCPC performance.
3.2 Effect of temperature midpoint on particle activation and droplet growth performance
In addition to temperature difference, lowering the temperature midpoint was also found to cause higher supersaturation. However, there is limited research on how the performance of the vWCPC changes under various temperature midpoints and especially under different inlet pressures, which will be important for applications such as atmospheric airborne deployment and environmental monitoring at elevated locations. Here, we compared the particle activation and droplet growth performance for three different temperature midpoints (40, 43, and 46 ∘C of conditioner temperature (from 24 to 30 ∘C) and initiator temperature (56 to 62 ∘C) at a wide range of inlet pressures from 30 to 101 kPa, as shown in Fig. 4. The temperature difference ΔT between the conditioner and the initiator was kept constant at 32 ∘C. The moderator temperature remained constant at 10 ∘C in all simulations.
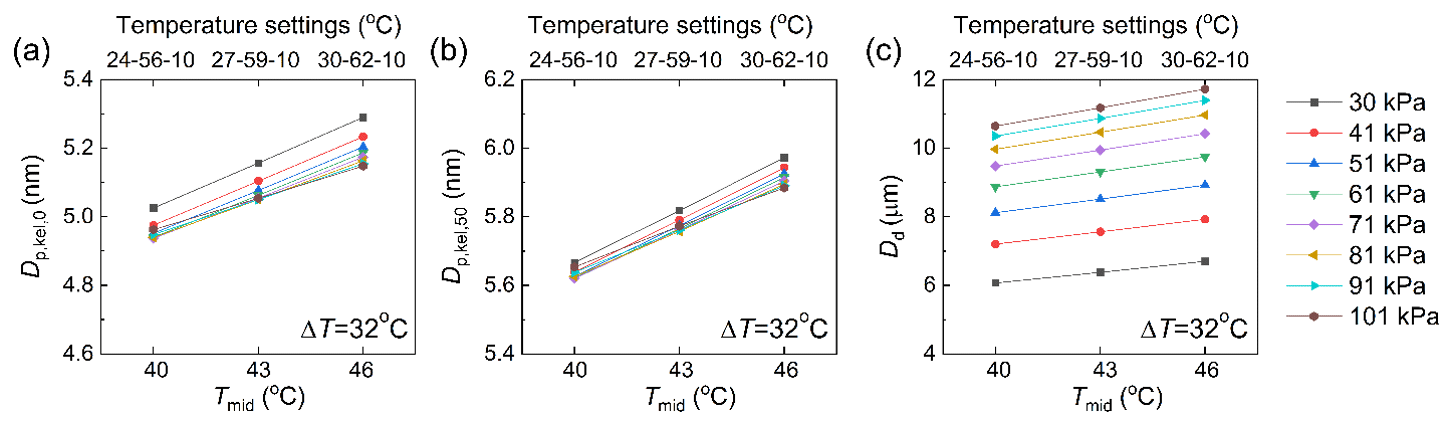
Figure 4Effect of temperature midpoints at 40, 43, and 46 ∘C at Tcon–Tini–Tmod of 24–56–10 ∘C, 27–59–10 ∘C, and 30–62–10 ∘C with a constant temperature difference of 32 ∘C on (a) minimum activated size , (b) 50 % cut-off size , and (c) final particle size at the outlet of the moderator along the centerline (r=0) Dd. The condensational growth of 8 nm particles was tested as seed particles.
Results show that the minimum activated size decreases from 5.15 to 4.96 nm, and the 50 % cut-off size decreases from 5.88 to 5.65 nm as the temperature midpoint decreases from 46 to 40 ∘C, as shown in Fig. 4a and b. Thus, a slight control of the minimum activation size can be achieved by lowering the temperature midpoint. Higher supersaturation can explain this slight decrease in the initiator, which also agrees with the previous growth tube WCPC simulation (Bian et al., 2020). On the other hand, a slight increase of 0.07, 0.1, and 0.14 nm occurs in , with a negligible change in by reducing the inlet pressure from 101 to 30 kPa under three temperature midpoints of 40, 43, and 46 ∘C. This slight increase is due to a low peak supersaturation caused by the decrease in inlet pressure. Since water vapor transport is faster than heat transport, the decrease in pressure affects the location of the peak supersaturation, whereas the degree of the supersaturation does not change significantly.
In Fig. 4c, we show that the droplet growth is not significantly dependent on raising or lowering the temperature midpoint. By lowering the temperature midpoint by 6 ∘C, Dd becomes smaller by approximately 14 %. When studying the effect of inlet pressure on Dd, unlike and , Dd decreases substantially from 101 to 30 kPa by approximately 45 %. Limited by the optical chamber design of the commercial vWCPC, the droplets smaller than 8 µm may not gain sufficient pulse signal to get counted. Thus, when operating under lower inlet pressure, the apparent cut-off size of the vWCPC may increase and needs to be further determined. The reduced pressure strongly affects the final droplet growth size, likely due to the faster water vapor and heat transport at reduced pressure. The thermal and mass diffusivity is inversely proportional to the pressure in the growth tube, resulting in insufficient time for droplet growth. In addition, we found that with the lower inlet pressure, the final droplet size was more notably reduced. For example, Dd decreased from 10.6 to 10.4 µm (by 0.2 µm) as pressure was reduced from 101 to 91 kPa, while Dd decreased from 7.2 to 6.1 µm (by 1.1 µm) as pressure was reduced from 41 to 30 kPa. The difference can be explained by the competition between heat and water vapor transport. The mass transport of water vapor is faster than the heat flow from the wall because the mass diffusivity of water vapor is higher than the thermal diffusivity of air. Therefore, by reducing the inlet pressure, water vapor transport becomes even faster than heat transfer due to the water vapor diffusivity and air thermal diffusivity being inversely proportional to the pressure, further shortening the time for particle growth at high supersaturation. This observation demonstrates for the first time how the final droplet size is affected by raising or lowering temperature midpoints at standard and various reduced inlet pressure conditions in the vWCPC.
3.3 Effect of inlet operation pressure on particle activation and droplet growth performance
With the advantages of safe, eco-friendly, and readily available distilled water as a working fluid in the vWCPC, applying the vWCPC in various inlet pressures will expand broader applications such as atmospheric airborne aerosol measurements. Here, we examined the effect of inlet pressure on minimum activated size , 50 % cut-off size , and final particle size at the outlet of the moderator along the centerline (r=0) Dd from 30 to 101 kPa for two different temperature settings: the conditioner, initiator, and moderator temperatures were 30, 59, and 10 ∘C and 27, 59, and 10 ∘C in Fig. 5.
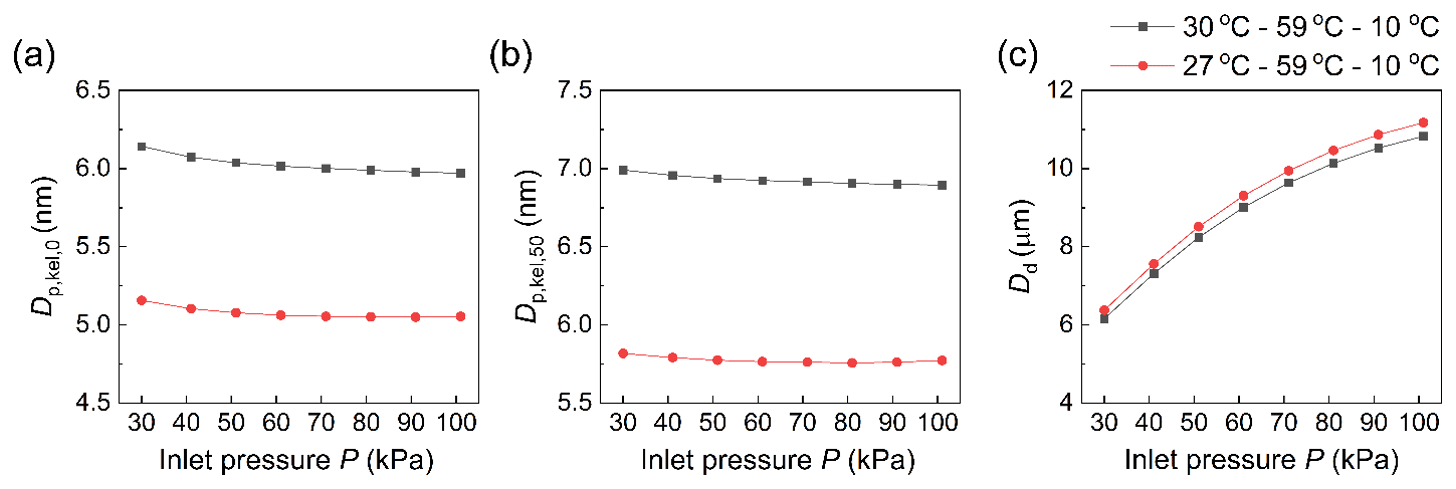
Figure 5Effect of inlet operation pressure at Tcon–Tini–Tmod of 27–59–10 ∘C and 30–59–10 ∘C on (a) minimum activated size , (b) 50 % cut-off size , and (c) final particle size at the outlet of the moderator along the centerline (r=0) Dd. The condensational growth of 8 nm particles was tested as seed particles.
Figure 5a and b show and as a function of inlet pressure; relatively greater (2 %–3 %) was observed at reduced inlet pressures at both conditioner temperatures of 27 and 30 ∘C. This increase is because the supersaturation value at reduced pressure is lower than the saturation profile under standard conditions. We also found that the saturation profile peaked earlier, closer to the entrance of the initiator, in the low-pressure condition. In addition, greater is observed at reduced inlet pressures due to the reduction of the saturation peak at both conditioner temperatures of 27 and 30 ∘C. Again, the difference at reduced inlet pressure can be explained by the competition from heat transfer and water vapor transport, as discussed in Sect. 3.2. For this reason, greater was observed at reduced inlet pressures. This reduction of saturation peaks is also associated with the growing droplet size decreasing with the decrease in the operating pressure. Again, lowering the conditioner temperature while maintaining the same temperature difference between the initiator and the moderator provided higher saturation ratios in the initiator over all pressure ranges.
Figure 5c shows the final droplet size as a function of inlet pressure. When the conditioner temperature is 27 or 30 ∘C, a lower final droplet size (∼40 % reduction in the droplet size) was observed at a reduced inlet pressure of 30 kPa, indicating that insufficient droplet growth happens at low-pressure conditions, which is consistent with the previous study that insufficient droplet growth becomes more significant under low-pressure operation (Mei et al., 2021).
Furthermore, in addition to showing results consistent with the previous study (Mei et al., 2021), our simulations enhance guidance for aircraft applications under extreme conditions, which can be achieved by simulating low atmospheric pressure at 30 kPa. As shown in Sect. 3.5, by comparing with experimental results, our simulations can provide more accurate estimates of particle activation and droplet growth to guide the vWCPC for low-pressure applications.
3.4 Effect of tube diameter and initiator length on particle activation and droplet growth performance
The geometry in CPCs also impacts the CPC activation performance and particle growth due to the changed supersaturation and temperature profile in the tube, as discussed in previous studies (Hao et al., 2021b; Hering et al., 2014). Here, we examined how the tube diameter D and the length of initiator Lini in the vWCPC may affect the minimum activated size , 50 % cut-off size , and final particle size at the outlet of the moderator along the centerline (r=0) Dd under default temperature Tcon, Tini, and Tmod of 30, 59, and 10 ∘C; standard inlet pressure; and reduced pressure of 51 kPa using the numerical COMSOL model. Again, one needs to note that conditions that can lead to a lower and value and larger droplet growth size are favored for improving the performance of the vWCPC.
We examined four values of D from 4 to 8 mm and five values of Lini from 10 to 50 mm, shown in Figs. 6 and 7, respectively. The results indicate that a smaller D can slightly decrease by approximately 0.03 nm, while there are no noticeable changes in at the standard pressure (Fig. 6a and b). By reducing the tube diameter, the flow speed in the tube increases under the same flow rate, reducing the residence time of the condensed water vapor. This reduction in residence time suppresses homogeneous nucleation in the initiator. Unlike our previous study on CPCs (Hao et al., 2021b), the homogeneous nucleation rate is minimal in the vWCPC and has no impact on the temperature difference compared to butanol-based CPCs. For this reason, this suppressed homogeneous nucleation has limited effects on and . However, the increase in the flow speed will significantly limit the time for droplet growth, as will be discussed later. At the reduced pressure of 51 kPa, a smaller D can slightly decrease by approximately 0.08 nm and cause a slight decrease of approximately 0.03 nm in (Fig. 6a and b). Overall, the reduction in pressure plays a more critical role in negatively impacting CPC performance for relatively large tube diameters. Note that buoyancy effects (Roberts and Nenes, 2005) may be critical for large temperature differences if the tube diameter is too large, which is not discussed in the study.
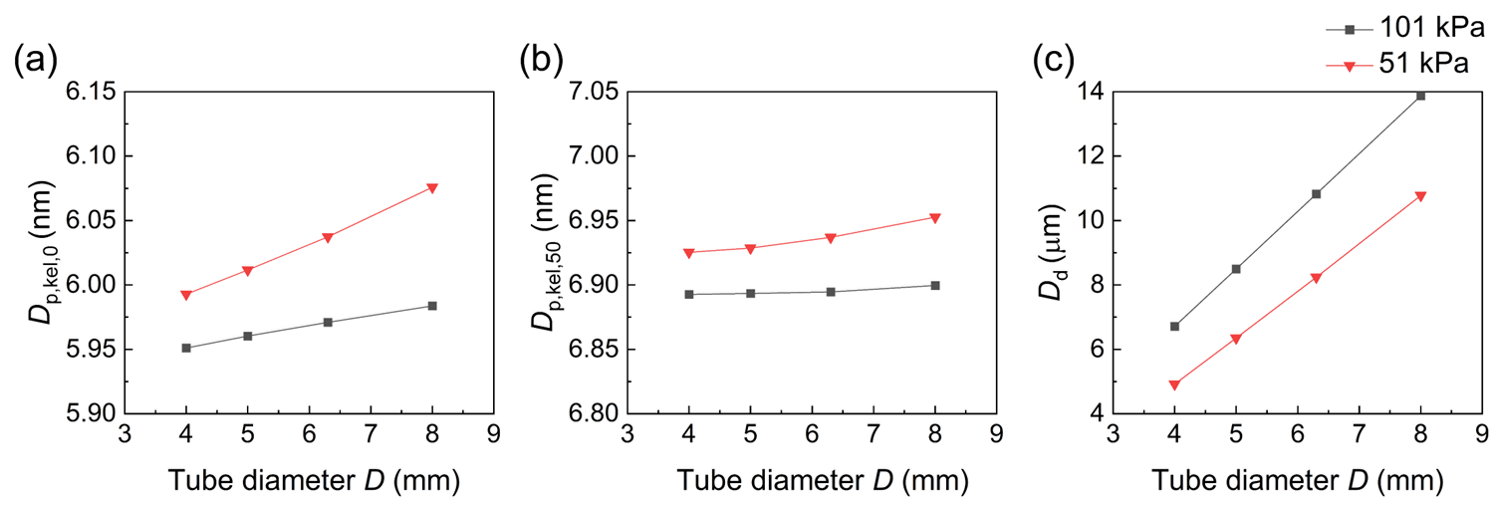
Figure 6Effect of tube diameter (D) at 51 and 101 kPa on (a) minimum activated size , (b) 50 % cut-off size , and (c) final particle size at the outlet of the moderator along the centerline (r=0) Dd. The condensational growth of 8 nm particles was tested as seed particles.
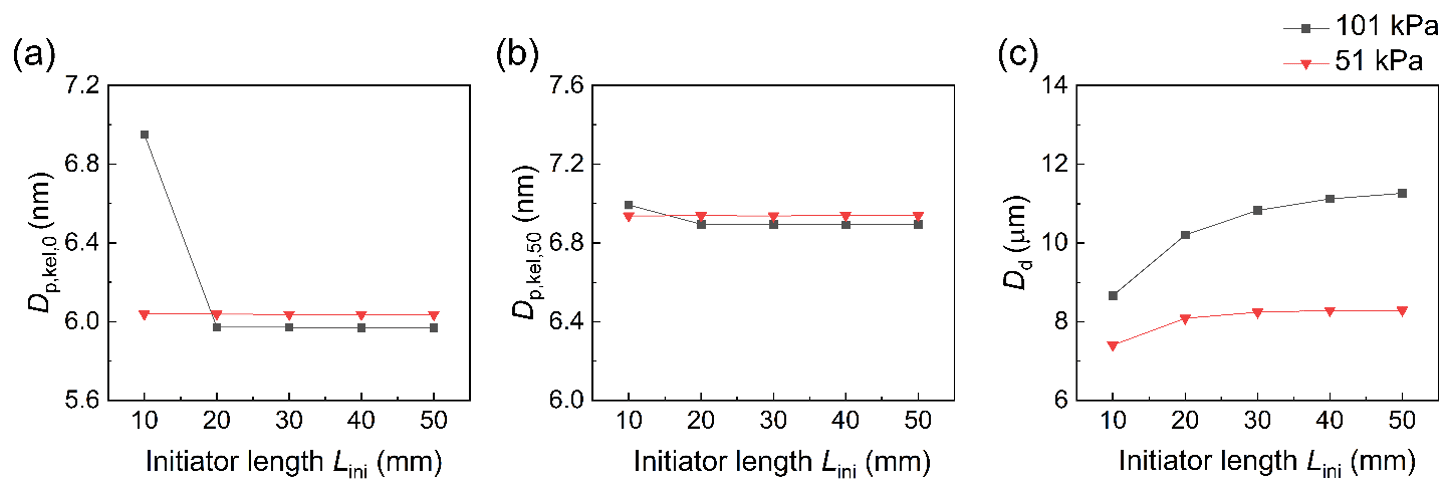
Figure 7Effect of initiator length (Lini) at 51 and 101 kPa on (a) minimum activated size , (b) 50 % cut-off size , and (c) final particle size at the outlet of the moderator along the centerline (r=0) Dd. The condensational growth of 8 nm particles was tested as seed particles.
On the other hand, we found that reducing Lini leads to limited effects on and , except for the shortest initiator length of 10 mm at the standard pressure (Fig. 7a and b). The effect of these relatively long initiator lengths is limited because the degree of supersaturation is determined by the absolute temperature of the tube flow. The temperature difference did not change in the standard pressure and reduced pressure, leaving both and unchanged. However, at the initiator length of 10 mm, and increase significantly due to insufficient water vapor diffusion before passing through the next moderator region, resulting in a lower peak supersaturation along the centerline than for longer initiators operating at the same temperature (Hering et al., 2014). At reduced pressure, and have no noticeable changes at all tested initiator lengths; however, this is due to the sufficient diffusion of water vapor, from which the water transport is faster than at the standard pressure. Again, if the initiator is longer, the difference in peak supersaturation will be negligible, while the peak temperature along the centerline and the amount of added water vapor will be higher. Thus, for relatively short initiators, such as 20 mm used in the simulation, one can provide all the necessary water vapor to create the same peak supersaturation as for the longer initiators. However, the droplet growth size will be smaller (Fig. 7c), mainly due to the shorter growth time discussed later.
With regard to the performance of particle growth, an increased D and an increased Lini are beneficial for improving the performance of particle growth in the vWCPC at both standard and reduced pressure (Figs. 6c and 7c). An increased D implies a decrease in the flow velocity through the high-saturation region, greatly increasing the time for particle growth and contributing to the sufficient growth of the particles. Figure 6c shows that the final droplet sizes increase significantly from 6.72 to 13.88 µm when D is increased from 4 to 8 mm at the standard pressure and increase from 4.92 to 10.78 µm at the reduced pressure of 51 kPa. The final droplet size is found to be 2–3 µm smaller than the standard pressure at the reduced pressure. Similarly, a longer Lini also leads to a larger droplet growth size. The final droplet size increases from 8.66 to 11.26 µm when Lini is increased from 10 to 50 mm at the standard pressure and from 7.40 to 8.29 µm at the reduced pressure of 51 kPa (Fig. 7c). This increase is likely due to the longer growth time of the longer initiator. Also, we found that the final droplet size increases much faster at shorter initiator lengths than at lengths above 20 mm, which tells us that the droplet size is more susceptible to the effects of initiator length below 20 mm. This difference also means that having a longer length does not further enhance the final size of the particle.
In addition to the performance of particle activation, it is crucial to evaluate the droplet growth performance of complex geometries in the vWCPC. The time that allows the activated particle to grow in the initiator and moderator is an important droplet growth kinetics assumption, representing the vWCPC performance of droplet growth. We use tg to represent allowed particle growth time, approximated with Eq. (7):
where L∗ indicates the length of the initiator and moderator beyond the point of activation. This equation can explain that the residence time is impacted more by the change in tube diameter than the initiator length. The allowed particle growth time as a function of final particle size at the outlet of the moderator along the centerline (r=0), Dd, is shown in Fig. S3. The longer the allowed particle growth time, the larger the droplet size. Based on this droplet growth time shown, the vWCPC geometries of D and Lini are not independent variables if we consider the droplet growth for further particle detection.
3.5 Experimental measurement validation of detection efficiency
Experimental validation is essential for simulation work in terms of the accuracy of the simulation model and the correctness of the underlying trends. Furthermore, validation and good agreement will provide well-guided approaches for future applications. Therefore, we compare the experimental and simulation results of the counting efficiency and detection efficiency of the vWCPC set in two default configurations (2 and 7 nm) at different conditioner and initiator temperature settings and different low-pressure conditions in Fig. 8.
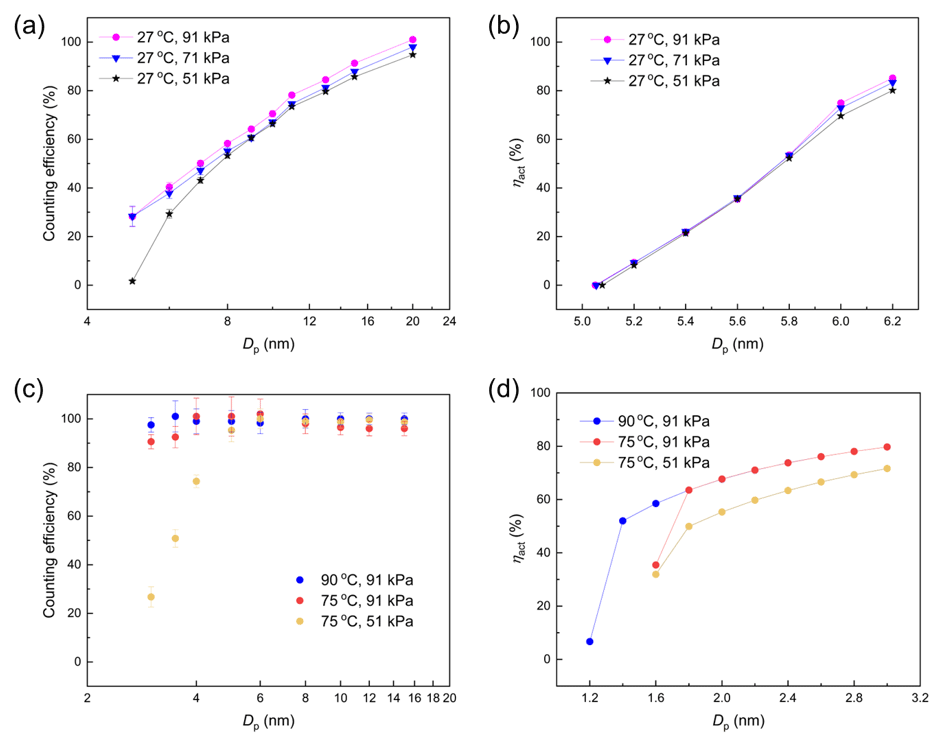
Figure 8The vWCPC operation validation: (a) the counting efficiency of experimental results as a function of particle size under the conditioner temperature of 27 ∘C and pressure of 91, 71, and 51 kPa for the 7 nm configuration; (b) the detection efficiency of simulation results as a function of particle size under the conditioner temperature of 27 ∘C and pressure of 91, 71, and 51 kPa for the 7 nm configuration; (c) the detection efficiency of experimental results as a function of particle size under initiator temperatures of 75 and 90 ∘C and pressure of 91 and 51 kPa for the 2 nm configuration; and (d) the detection efficiency of simulation results as a function of particle size under initiator temperatures of 75 and 90 ∘C and pressure of 91 and 51 kPa for the 2 nm configuration.
As the experimental results in a previous study (Mei et al., 2021) are shown in Fig. 8a, the counting efficiency of vWCPC 3789 varied with different working pressures (51, 71, and 91 kPa) when the conditioner temperature is 27 ∘C, the initiator temperature is 59 ∘C, and the moderator temperature is 10 ∘C. The y-axis error bar indicates the standard deviation of the counting efficiency averaged over ∼5 min of sampling time at a 1 Hz sampling rate. The results indicate that the counting efficiency slightly decreases with the decrease in the operating pressure of 51, 71, and 91 kPa, which shows the same trend in Fig. 8b. In addition, the cut-off sizes in both experimental and simulation results are in the range of 5–7 nm, which is also an acceptable range within error when compared to commercial vWCPC detection efficiency.
Figure 8c and d compare the counting efficiency and detection efficiency versus particle size from experimental and simulation results under initiator temperatures of 75 and 90 ∘C and pressure of 91 and 51 kPa for the 2 nm configuration. As expected, the detection efficiency of both experimental and simulated results is lower at the temperature Tcon–Tini–Tmod of 7–75–10 ∘C at a lower pressure (at 51 kPa). When the temperature Tcon–Tini–Tmod is 7–90–10 ∘C, higher detection efficiency is seen, and the effect of inlet pressure becomes insignificant. However, it is not feasible to maintain 90 ∘C when operating under lower pressure, such as 51 kPa. Thus, the default 2 nm setting in the vWCPC can only be operated near sea level. One should note that although we do not present many simulations for the 2 nm configuration, what we learned from the modeling results with the 7 nm setting will guide future simulations with the 2 nm setting.
By comparing with counting efficiency curves, the present simulations can more realistically represent Dp,kel for the 7 nm vWCPC, which also achieved good agreement with the 2 nm setting. Thus, from the merits of the results of this work, we can find that this work not only provides guidance for 7 nm, but this trend can also help guide researchers for other desired cut-off sizes.
This study evaluated the particle activation and droplet growth performance of a commercial versatile water CPC using COMSOL in combination with MATLAB™ data processing. In addition, validation experiments on the detection efficiency of the modified vWCPC (TSI 3789) agreed with the simulation work. Increasing the temperature difference between Tcon and Tini and lowering the temperature midpoint can enhance particle activation at both standard and reduced ambient pressure conditions. However, the lack of droplet growth becomes more significant under low-pressure operations, which might affect the apparent counting efficiency of the vWCPC due to the limited measurable size range of the optical chamber. Additionally, reducing the diameter of the growth tube slightly improved particle activation but significantly reduced the droplet growth, while increasing the initiator length had a limited effect on improving the performance of the vWCPC at both standard and reduced pressure.
This simulation realistically represents Dp,kel for the 7 nm vWCPC and shows that the current growth tube geometry is an optimized choice for aerosol measurements. This study will guide further vWCPC performance optimization for applications requiring precise particle detection and atmospheric aerosol monitoring. Furthermore, the developed simulation capability provides a vital tool for the aerosol community to understand the effects of temperature, pressure, and geometry on vWCPC behavior. The knowledge gained will guide the field deployment of vWCPCs on the ground level and airborne measurements. However, limitations of this modeling approach likely lie in the computational capacity and the difference from actual flow and temperature profile distribution in the growth tube (due to nonideal temperature control and system configuration). Thus, several future experimental studies will be carried out to investigate the performance of the vWCPC.
| c: molecular concentration of water vapor (mol m−3) | ||
| Cd: equilibrium water concentration at the surface of the | ||
| growth droplets (mol m−3) | ||
| Cs: saturation water concentration (mol m−3) | ||
| cp: heat capacity of water (J K−1 kg−1) | ||
| cp,g: heat capacity of air (J K−1 kg−1) | ||
| Dv: diffusivity of water vapor (m2 s−1) | ||
| Dv′: modified diffusivity of water vapor (m2 s−1) | ||
| D: diameter of the growth tube in the vWCPC (m) | ||
| Dp: particle size (m) | ||
| Dd: final growth droplet size in the vWCPC (m) | ||
| Dp,kel: size of particle that can be activated according to the | ||
| Kelvin equation (m) | ||
| : smallest size of particle that can be activated in the vWCPC (m) | ||
| : size of particle that has a 50 % activation efficiency (m) | ||
| Hvap: heat of vaporization of water (J kg−1) | ||
| k: Boltzmann constant, 1.38 × 10⁻²³ (J K−1) | ||
| kg: thermal conductivity of air (W m−1 K−1) | ||
| : modified thermal conductivity of air (W m−1 K−1) | ||
| Lcon: length of the conditioner (m) | ||
| Lini: length of the initiator (m) | ||
| Lmod: length of the moderator (m) | ||
| L∗: length of the initiator and moderator beyond the point of activation (m) | ||
| m: molecular mass of water (kg) | ||
| M: molecular weight of water (kg mol−1) | ||
| Mg: molecular weight of air (kg mol−1) | ||
| n: molecular concentration of water vapor (molec. m−3) | ||
| N: concentration of the particles at the axial location of | ||
| z=Zact (particles m−3) | ||
| N0: concentration of particles at the inlet of the conditioner (particles m−3) | ||
| p: partial pressure of water vapor (Pa) | ||
| ps: saturation vapor pressure of water vapor (Pa) | ||
| P: inlet pressure in vWCPC (Pa) | ||
| Qv: flow rate through the vWCPC (m3 s−1) | ||
| r: radial coordinate of the tube diameter of the vWCPC (m or as | ||
| otherwise explicitly designated) | ||
| R: gas constant (J mol−1 K−1) | ||
| Ract: maximum radius of the contour corresponding to (m) | ||
| S: saturation ratio (1) | ||
| t: allowed particle growth time (s) | ||
| T: flow temperature in the CPC (K) | ||
| Tcon: conditioner temperature (K) | ||
| Tini: initiator temperature (K) | ||
| Tmid: temperature midpoint corresponding to (K) | ||
| Tmod: moderator temperature (K) | ||
| Td: droplet surface temperature (K) | ||
| vm: molecular volume of water vapor (m3) | ||
| w: velocity along the axial direction in the vWCPC (m s−1) | ||
| z: axial coordinate of the tube length of the vWCPC (m or as otherwise | ||
| explicitly designated) | ||
| Zact: axial location corresponding to r=Ract (m) | ||
| αc: mass accommodation coefficient of water (1) | ||
| αT: thermal accommodation coefficient of air (1) | ||
| ηact: activation efficiency (1) | ||
| ρ: density of water (kg m−3) | ||
| ρg: density of air (kg m−3) | ||
| σ: surface tension of water (N m−1) | ||
| ΔT: temperature difference between conditioner temperature and | ||
| initiator temperature (K) |
The vWCPC data in the study are available upon request to Fan Mei (fan.mei@pnnl.gov).
The supplement related to this article is available online at: https://doi.org/10.5194/amt-16-3973-2023-supplement.
WH, FM, and YW designed the research. FM carried out the measurements. WH led the simulation and data analyses. WH led the writing, with significant input from FM and YW as well as further input from all other authors. SH, SS, BS, and JT provided suggestions on the revision.
Susanne Hering has a commercial interest in the success of the vWCPC instrument.
Publisher's note: Copernicus Publications remains neutral with regard to jurisdictional claims in published maps and institutional affiliations.
We would like to thank the Office of Biological and Environmental Research (OBER) of the U.S. Department of Energy (DOE) as part of the Atmospheric Radiation Measurement (ARM) and Atmospheric System Research (ASR) programs. We would also like to thank Battelle and the Pacific Northwest National Laboratory (PNNL).
This research has been supported by the DOE (contract no. DE-A06-76RLO 1830), and Weixing Hao and Yang Wang were partially supported by an NSF award (grant no. 2132655).
This paper was edited by Charles Brock and reviewed by Michel Attoui and one anonymous referee.
Ahn, K.-H. and Liu, B. Y.: Particle activation and droplet growth processes in condensation nucleus counter – I. Theoretical background, J. Aerosol Sci., 21, 249–261, https://doi.org/10.1016/0021-8502(90)90008-L, 1990a.
Ahn, K.-H. and Liu, B. Y.: Particle activation and droplet growth processes in condensation nucleus counter – II. Experimental study, J. Aerosol Sci., 21, 263–275, https://doi.org/10.1016/0021-8502(90)90009-M, 1990b.
Anderson, E. L., Turnham, P., Griffin, J. R., and Clarke, C. C.: Consideration of the aerosol transmission for COVID-19 and public health, Risk Anal., 40, 902–907, https://doi.org/10.1111/risa.13500, 2020.
Attoui, M.: Activation of sub 2 nm singly charged particles with butanol vapors in a boosted 3776 TSI CPC, J. Aerosol Sci., 126, 47–57, https://doi.org/10.1016/j.jaerosci.2018.08.005, 2018.
Attoui, M.: Mobility distributions of Sub 5 nm singly self-charged water soluble and non-soluble particles from a heated NiCr wire in clean dry air, Aerosol Sci. Technol., 56, 859–868, https://doi.org/10.1080/02786826.2022.2095892, 2022.
Barmpounis, K., Ranjithkumar, A., Schmidt-Ott, A., Attoui, M., and Biskos, G.: Enhancing the detection efficiency of condensation particle counters for sub-2 nm particles, J. Aerosol Sci., 117, 44–53, https://doi.org/10.1016/j.jaerosci.2017.12.005, 2018.
Bian, J., Gui, H., Xie, Z., Yu, T., Wei, X., Wang, W., and Liu, J.: Simulation of three-stage operating temperature for supersaturation water-based condensational growth tube, J. Environ. Sci., 90, 275–285, https://doi.org/10.1016/j.jes.2019.12.007, 2020.
Biswas, S., Fine, P. M., Geller, M. D., Hering, S. V., and Sioutas, C.: Performance evaluation of a recently developed water-based condensation particle counter, Aerosol Sci. Technol., 39, 419–427, https://doi.org/10.1080/027868290953173, 2005.
Davidson, C. I., Phalen, R. F., and Solomon, P. A.: Airborne particulate matter and human health: a review, Aerosol Sci. Technol., 39, 737–749, https://doi.org/10.1080/02786820500191348, 2005.
Franklin, L. M., Bika, A. S., Watts, W. F., and Kittelson, D. B.: Comparison of water and butanol based CPCs for examining diesel combustion aerosols, Aerosol Sci. Technol., 44, 629–638, https://doi.org/10.1080/02786826.2010.482112, 2010.
Gonzalez, A., Aboubakr, H. A., Brockgreitens, J., Hao, W., Wang, Y., Goyal, S. M., and Abbas, A.: Durable nanocomposite face masks with high particulate filtration and rapid inactivation of coronaviruses, Sci. Rep., 11, 24318, https://doi.org/10.1038/s41598-021-03771-1, 2021.
Hao, W., Parasch, A., Williams, S., Li, J., Ma, H., Burken, J., and Wang, Y.: Filtration performances of non-medical materials as candidates for manufacturing facemasks and respirators, Int. J. Hyg. Envir. Heal., 229, 113582, https://doi.org/10.1016/j.ijheh.2020.113582, 2020.
Hao, W., Xu, G., and Wang, Y.: Factors influencing the filtration performance of homemade face masks, J. Occup. Environ. Hyg., 18, 128–138, https://doi.org/10.1080/15459624.2020.1868482, 2021a.
Hao, W. X., Stolzenburg, M., Attoui, M., Zhang, J. S., and Wang, Y.: Optimizing the activation efficiency of sub-3 nm particles in a laminar flow condensation particle counter: Model simulation, J. Aerosol Sci., 158, 105841, https://doi.org/10.1016/j.jaerosci.2021.105841, 2021b.
Hering, S. V. and Stolzenburg, M. R.: A method for particle size amplification by water condensation in a laminar, thermally diffusive flow, Aerosol Sci. Tech., 39, 428–436, https://doi.org/10.1080/027868290953416, 2005.
Hering, S. V., Stolzenburg, M. R., Quant, F. R., Oberreit, D. R., and Keady, P. B.: A laminar-flow, water-based condensation particle counter (WCPC), Aerosol Sci. Tech., 39, 659–672, https://doi.org/10.1080/02786820500182123, 2005.
Hering, S. V., Spielman, S. R., and Lewis, G. S.: Moderated, water-based, condensational particle growth in a laminar flow, Aerosol Sci. Tech., 48, 401-408, https://doi.org/10.1080/02786826.2014.881460, 2014.
Hering, S. V., Lewis, G. S., Spielman, S. R., Eiguren-Fernandez, A., Kreisberg, N. M., Kuang, C., and Attoui, M.: Detection near 1-nm with a laminar-flow, water-based condensation particle counter, Aerosol Sci. Tech., 51, 354–362, https://doi.org/10.1080/02786826.2016.1262531, 2017.
Hermann, M. and Wiedensohler, A.: Counting efficiency of condensation particle counters at low-pressures with illustrative data from the upper troposphere, J. Aerosol Sci., 32, 975–991, https://doi.org/10.1016/S0021-8502(01)00037-4, 2001.
Hermann, M., Wehner, B., Bischof, O., Han, H.-S., Krinke, T., Liu, W., Zerrath, A., and Wiedensohler, A.: Particle counting efficiencies of new TSI condensation particle counters, J. Aerosol Sci., 38, 674–682, https://doi.org/10.1016/j.jaerosci.2007.05.001, 2007.
Hilario, M. R. A., Crosbie, E., Shook, M., Reid, J. S., Cambaliza, M. O. L., Simpas, J. B. B., Ziemba, L., DiGangi, J. P., Diskin, G. S., Nguyen, P., Turk, F. J., Winstead, E., Robinson, C. E., Wang, J., Zhang, J., Wang, Y., Yoon, S., Flynn, J., Alvarez, S. L., Behrangi, A., and Sorooshian, A.: Measurement report: Long-range transport patterns into the tropical northwest Pacific during the CAMP2Ex aircraft campaign: chemical composition, size distributions, and the impact of convection, Atmos. Chem. Phys., 21, 3777–3802, https://doi.org/10.5194/acp-21-3777-2021, 2021.
Iida, K., Stolzenburg, M. R., McMurry, P. H., Smith, J. N., Quant, F. R., Oberreit, D. R., Keady, P. B., Eiguren-Fernandez, A., Lewis, G. S., and Kreisberg, N. M.: An ultrafine, water-based condensation particle counter and its evaluation under field conditions, Aerosol Sci. Technol., 42, 862–871, https://doi.org/10.1080/02786820802339579, 2008.
Kangasluoma, J. and Attoui, M.: Review of sub-3 nm condensation particle counters, calibrations, and cluster generation methods, Aerosol Sci. Tech., 53, 1277–1310, https://doi.org/10.1080/02786826.2019.1654084, 2019.
Kangasluoma, J., Ahonen, L., Attoui, M., Vuollekoski, H., Kulmala, M., and Petäjä, T.: Sub-3 nm particle detection with commercial TSI 3772 and Airmodus A20 fine condensation particle counters, Aerosol Sci. Tech., 49, 674–681, https://doi.org/10.1080/02786826.2015.1058481, 2015.
Kangasluoma, J., Hering, S., Picard, D., Lewis, G., Enroth, J., Korhonen, F., Kulmala, M., Sellegri, K., Attoui, M., and Petäjä, T.: Characterization of three new condensation particle counters for sub-3 nm particle detection during the Helsinki CPC workshop: the ADI versatile water CPC, TSI 3777 nano enhancer and boosted TSI 3010, Atmos. Meas. Tech., 10, 2271–2281, https://doi.org/10.5194/amt-10-2271-2017, 2017.
Kapiamba, K. F., Hao, W., Owusu, S. Y., Liu, W., Huang, Y.-W., and Wang, Y.: Examining metal contents in primary and secondhand aerosols released by electronic cigarettes, Chem. Res. Toxicol., 35, 954–962, https://doi.org/10.1021/acs.chemrestox.1c00411, 2022.
Krudysz, M., Moore, K., Geller, M., Sioutas, C., and Froines, J.: Intra-community spatial variability of particulate matter size distributions in Southern California/Los Angeles, Atmos. Chem. Phys., 9, 1061–1075, https://doi.org/10.5194/acp-9-1061-2009, 2009.
Kuang, C., Chen, M., McMurry, P. H., and Wang, J.: Modification of laminar flow ultrafine condensation particle counters for the enhanced detection of 1 nm condensation nuclei, Aerosol Sci. Tech., 46, 309–315, https://doi.org/10.1080/02786826.2011.626815, 2012.
Kupc, A., Bischof, O., Tritscher, T., Beeston, M., Krinke, T., and Wagner, P. E.: Laboratory characterization of a new nano-water-based CPC 3788 and performance comparison to an ultrafine butanol-based CPC 3776, Aerosol Sci. Technol., 47, 183–191, https://doi.org/10.1080/02786826.2012.738317, 2013.
Li, Z., Guo, J., Ding, A., Liao, H., Liu, J., Sun, Y., Wang, T., Xue, H., Zhang, H., and Zhu, B.: Aerosol and boundary-layer interactions and impact on air quality, Nat. Sc. Rev., 4, 810–833, https://doi.org/10.1093/nsr/nwx117, 2017.
Lighty, J. S., Veranth, J. M., and Sarofim, A. F.: Combustion aerosols: factors governing their size and composition and implications to human health, J. Air Waste Manage., 50, 1565–1618, https://doi.org/10.1080/10473289.2000.10464197, 2000.
Liu, W., Kaufman, S. L., Osmondson, B. L., Sem, G. J., Quant, F. R., and Oberreit, D. R.: Water-based condensation particle counters for environmental monitoring of ultrafine particles, J. Air Waste Manage. Assoc., 56, 444–455, https://doi.org/10.1080/10473289.2006.10464520, 2006.
Mei, F., Spielman, S., Hering, S., Wang, J., Pekour, M. S., Lewis, G., Schmid, B., Tomlinson, J., and Havlicek, M.: Simulation-aided characterization of a versatile water-based condensation particle counter for atmospheric airborne research, Atmos. Meas. Tech., 14, 7329–7340, https://doi.org/10.5194/amt-14-7329-2021, 2021.
Mordas, G., Manninen, H., Petäjä, T., Aalto, P., Hämeri, K., and Kulmala, M.: On operation of the ultra-fine water-based CPC TSI 3786 and comparison with other TSI models (TSI 3776, TSI 3772, TSI 3025, TSI 3010, TSI 3007), Aerosol Sci. Tech., 42, 152–158, https://doi.org/10.1080/02786820701846252, 2008.
Pöschl, U.: Atmospheric aerosols: composition, transformation, climate and health effects, Angew. Chem. Int. Edit., 44, 7520–7540, https://doi.org/10.1002/anie.200501122, 2005.
Roberts, G. and Nenes, A.: A continuous-flow streamwise thermal-gradient CCN chamber for atmospheric measurements, Aerosol Sci. Tech., 39, 206–221, https://doi.org/10.1080/027868290913988, 2005.
Seinfeld, J. H. and Pandis, S. N.: Atmospheric chemistry and physics: from air pollution to climate change, John Wiley & Sons, 1152 pp., ISBN 978-1-118-94740-1, 2016.
Seinfeld, J. H., Bretherton, C., Carslaw, K. S., Coe, H., DeMott, P. J., Dunlea, E. J., Feingold, G., Ghan, S., Guenther, A. B., and Kahn, R.: Improving our fundamental understanding of the role of aerosol- cloud interactions in the climate system, P. Natl. Acad. Sci. USA, 113, 5781–5790, https://doi.org/10.1073/pnas.1514043113, 2016.
Sem, G. J.: Design and performance characteristics of three continuous-flow condensation particle counters: a summary, Atmos. Res., 62, 267–294, https://doi.org/10.1016/S0169-8095(02)00014-5, 2002.
Stolzenburg, M. R.: An ultrafine aerosol size distribution measuring system, Ph.D. Thesis, Department of Mechanical Engineering, University of Minnesota, Minneapolis, MN, USA, 1988.
Thomas, J. M., Chen, X., Maißer, A., and Hogan Jr, C. J.: Differential heat and mass transfer rate influences on the activation efficiency of laminar flow condensation particle counters, Int. J. Heat Mass Tran., 127, 740–750, https://doi.org/10.1016/j.ijheatmasstransfer.2018.07.002, 2018.
Wang, J., Pikridas, M., Spielman, S. R., and Pinterich, T.: A fast integrated mobility spectrometer for rapid measurement of sub-micrometer aerosol size distribution, Part I: Design and model evaluation, J. Aerosol Sci., 108, 44–55, https://doi.org/10.1016/j.jaerosci.2017.02.012, 2017.
Wang, Y., Pinterich, T., and Wang, J.: Rapid measurement of sub-micrometer aerosol size distribution using a fast integrated mobility spectrometer, J. Aerosol Sci., 121, 12–20, https://doi.org/10.1016/j.jaerosci.2018.03.006, 2018.
Wiedensohlet, A., Orsini, D., Covert, D., Coffmann, D., Cantrell, W., Havlicek, M., Brechtel, F., Russell, L., Weber, R., and Gras, J.: Intercomparison study of the size-dependent counting efficiency of 26 condensation particle counters, Aerosol Sci. Tech., 27, 224–242, https://doi.org/10.1080/02786829708965469, 1997.
Yu, F. and Luo, G.: Simulation of particle size distribution with a global aerosol model: contribution of nucleation to aerosol and CCN number concentrations, Atmos. Chem. Phys., 9, 7691–7710, https://doi.org/10.5194/acp-9-7691-2009, 2009.