the Creative Commons Attribution 4.0 License.
the Creative Commons Attribution 4.0 License.
 | 06 Sep 2023
Influence of electromagnetic interference on the evaluation of lidar-derived aerosol properties from Ny-Ålesund, Svalbard
Tim Poguntke
Christoph Ritter
Possible interference sources for our aerosol lidar setup with transient recorders have been assessed. This was done by two methods: a spectrum analysis of the lidar signals in order to detect radio-frequency interference and measurements of the electromagnetic interference caused by the laser power supply. We found disturbances in the analog channels of the transient recorders, presumably caused by aging effects of our older recorders. An easy method on how the signal-to-noise ratio can be improved retrospectively is presented. We also show that the usage of two-way radio at our location leads to a noticeable radio-frequency interference in the lidar profiles. Further, we present measurements of the electromagnetic interference caused by the laser power supply, which may lead to disturbances in the lidar profiles if the transient recorders are placed next to it.
- Article
(4226 KB) - Full-text XML
- BibTeX
- EndNote


Lidar (i.e., light detection and ranging) has been a mature technology for aerosol research for many years, and it has already been employed in dedicated networks like EARLINET (Pappalardo et al., 2014), AD-NET (Shimizu et al., 2016) and LALINET (Guerrero-Rascado et al., 2016). Hence, quality assurance and control will probably gain importance for long-term data recording. Freudenthaler et al. (2018) have already discussed many aspects in this regard. If the understanding of disturbances and their sources in lidar signals is improved, measurement equipment may be adapted, and existing data sets may be improved retrospectively.
In this work, we analyze the noise increase in lidar signals provoked by electromagnetic interference (EMI) and how this worsens the derivation of aerosol properties. We present a spectral analysis of lidar signals in order to detect radio-frequency (RF) interference that decreases the signal-to-noise ratio (SNR). We also present an easy approach on how frequency-selective interference can be suppressed in order to increase signal quality retrospectively if the frequencies of the interference are known. We also provide measurements of the electromagnetic radiation of the power supply for the laser in order to address the following questions:
- i.
Are our lidar signals corrupted by RF interference?
- ii.
Are there other possible EMI sources?
- iii.
Does the laser power supply affect the recorders?
However, de-noising techniques in lidar from a general point of view are outside the scope of this paper. Due to the strong dependence of SNR on altitude, such a noise filtering is commonly done by wavelet filtering (Zhou et al., 2013) or (Mao, 2012). Instead, we will show that EMI can be suppressed in the frequency domain if it appears at fixed frequencies.
This paper is organized in the following way: we introduce the lidar and the site in Sect. 2. Afterwards, interference detection and suppression is described as well as its effects on the lidar signal evaluation in Sect. 3. Further measurements in order to identify EMI sources are presented in Sect. 4.
The location of our Koldewey Aerosol Raman Lidar (KARL) is Ny-Ålesund, an international research site on Spitsbergen in the European Arctic at 78.9∘ N, 11.9∘ E. As the Norwegian Mapping Authority, Kartverket, runs radio telescopes for satellite tracking and geodetic research, Ny-Ålesund is a radio-silent village for frequencies in the range 2–32 GHz. Consequently, using Bluetooth devices, WiFi devices and radar units for airplane detection is prohibited. However, two-way radios and radio sondes in the megahertz (MHz) frequency range are used frequently and may cause RF interference.
KARL consists of a 70 cm mirror and a field of view of approx. 2 mrad, a 290/50 Quanta-Ray laser from Newport Spectra-Physics with slightly over 200 mJ per pulse and color at a repetition rate of 50 Hz. It transmits three colors simultaneously at wavelengths of 355, 532 and 1064 nm. For signal detection, a Hamamatsu photomultiplier (PMT), type H5573 5783-01 (https://www.hamamatsu.com, last access: 30 August 2023), is used together with a gating from Licel (see details at https://www.licel.com, last access: 30 August 2023). The transient recorders are also from Licel (TR 20) and run both in analog (AN) and photo-counting (PCNT) mode, sampling the signal with a sampling rate of 20 MHz. Additional lidar components are outside the scope of this paper, but a general description of KARL has been presented by Hoffmann (2011).
The weak inelastically Raman-shifted signals at 387 and 607 nm are sampled with 16 bit resolution, while the generally stronger elastic channels at 355, 532 and 1064 nm are sampled with 12 bit using old (approx. 20 years) transient recorders. In this work, we only dealt with the 532 nm channel (in parallel polarization), and the lidar profile evaluation has been done according to Klett (1985).
We evaluate AN signals using PCNT signals in two steps:
-
PCNT signals have been evaluated with a lidar ratio of LR = 42 sr and a boundary condition of
for altitudes in the interval 24 km < zref < 27 km in order to reduce the impact of an inappropriately chosen boundary condition in the lidar signals. Backscatter β and βRay are the total and molecular (volumetric) backscatter coefficient [].
-
The backscatter value retrieved from this PCNT channel is then used as a boundary condition for the AN signals, where the calibration factor changes to 1.19 compared to Eq. (1), as an average between 10.5–11.5 km. This boundary condition was applied to analyze the AN channel.
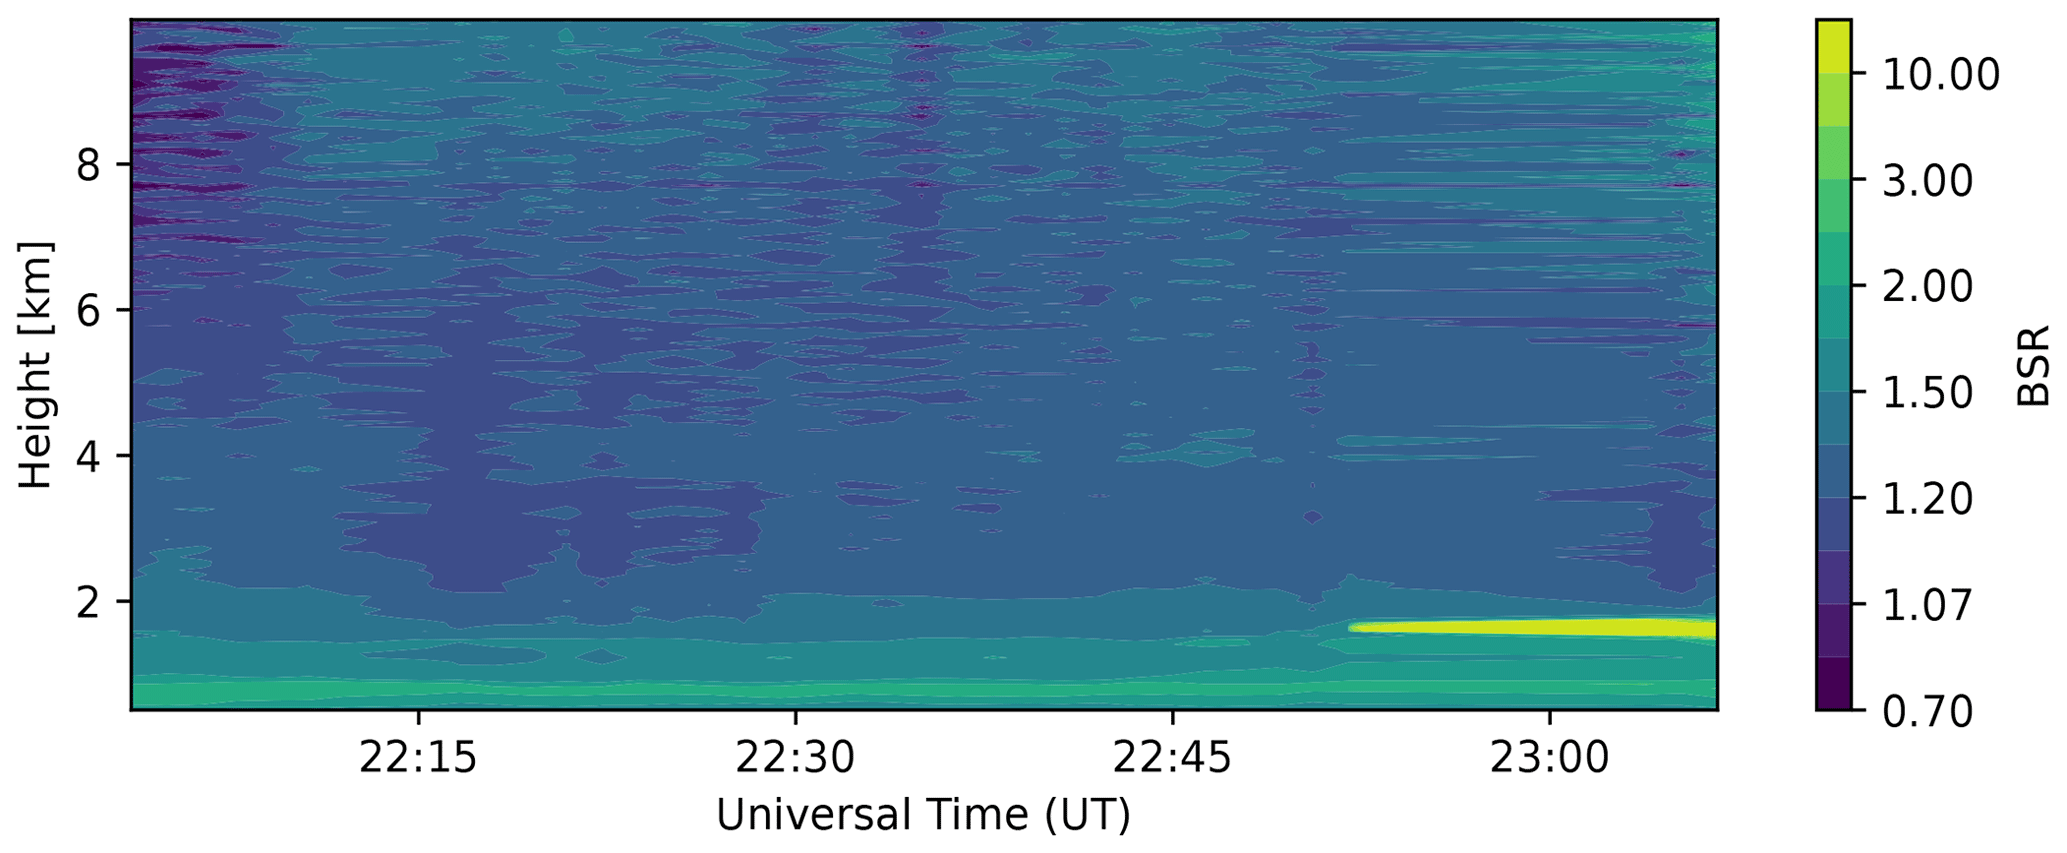
Figure 1Overview of lidar observation on 16 February 2023. Presented is the backscatter ratio at 532 nm from the analog recording.
The lidar observations were performed on 16 February 2023 between around 22:00 and 23:00 UT, and the data are evaluated with a height resolution of approx. 7.5 m and an update interval of approx. 90 s, as the profiles of 4094 laser shots are combined. Figure 1 provides an overview of the lidar observations in terms of the dimensionless backscatter ratio
of the 532 nm AN channel, which shows the enhancement of backscatter compared to a pure molecular atmosphere. The figure shows clear-sky conditions most of the time; a weak aerosol layer around 1 km altitude; and finally a low cloud, which caused the end of the measurement after 23:00 UT.
In order to identify RF interference in our setup that might disturb the lidar profiles, a Rohde & Schwarz Spectrum Rider FPH is used together with an Aaronia HyperLOG directional antenna (https://www.rohde-schwarz.com/de/produkte/messtechnik/handheld/rs-spectrum-rider-fph-handheld-spektrumanalysator_63493-147712.html, last access: 30 August 2023). Although the antenna is specified for higher-frequency band, the device delivers comprehensible (reliable and reproducible) results for frequencies around 100 MHz.
In this section, we analyze the lidar profiles in more detail with respect to disturbances and electromagnetic interference in order to evaluate the effects on the evaluation of aerosol properties. This was done since we constantly noticed an apparent and phase-constant distortion in the lidar profiles of the 532 nm AN channel. This distortion was omnipresent in this channel, independent of the number of laser shots written in each data file. For the following discussion, only one profile from 22:40 UT is selected as an example.
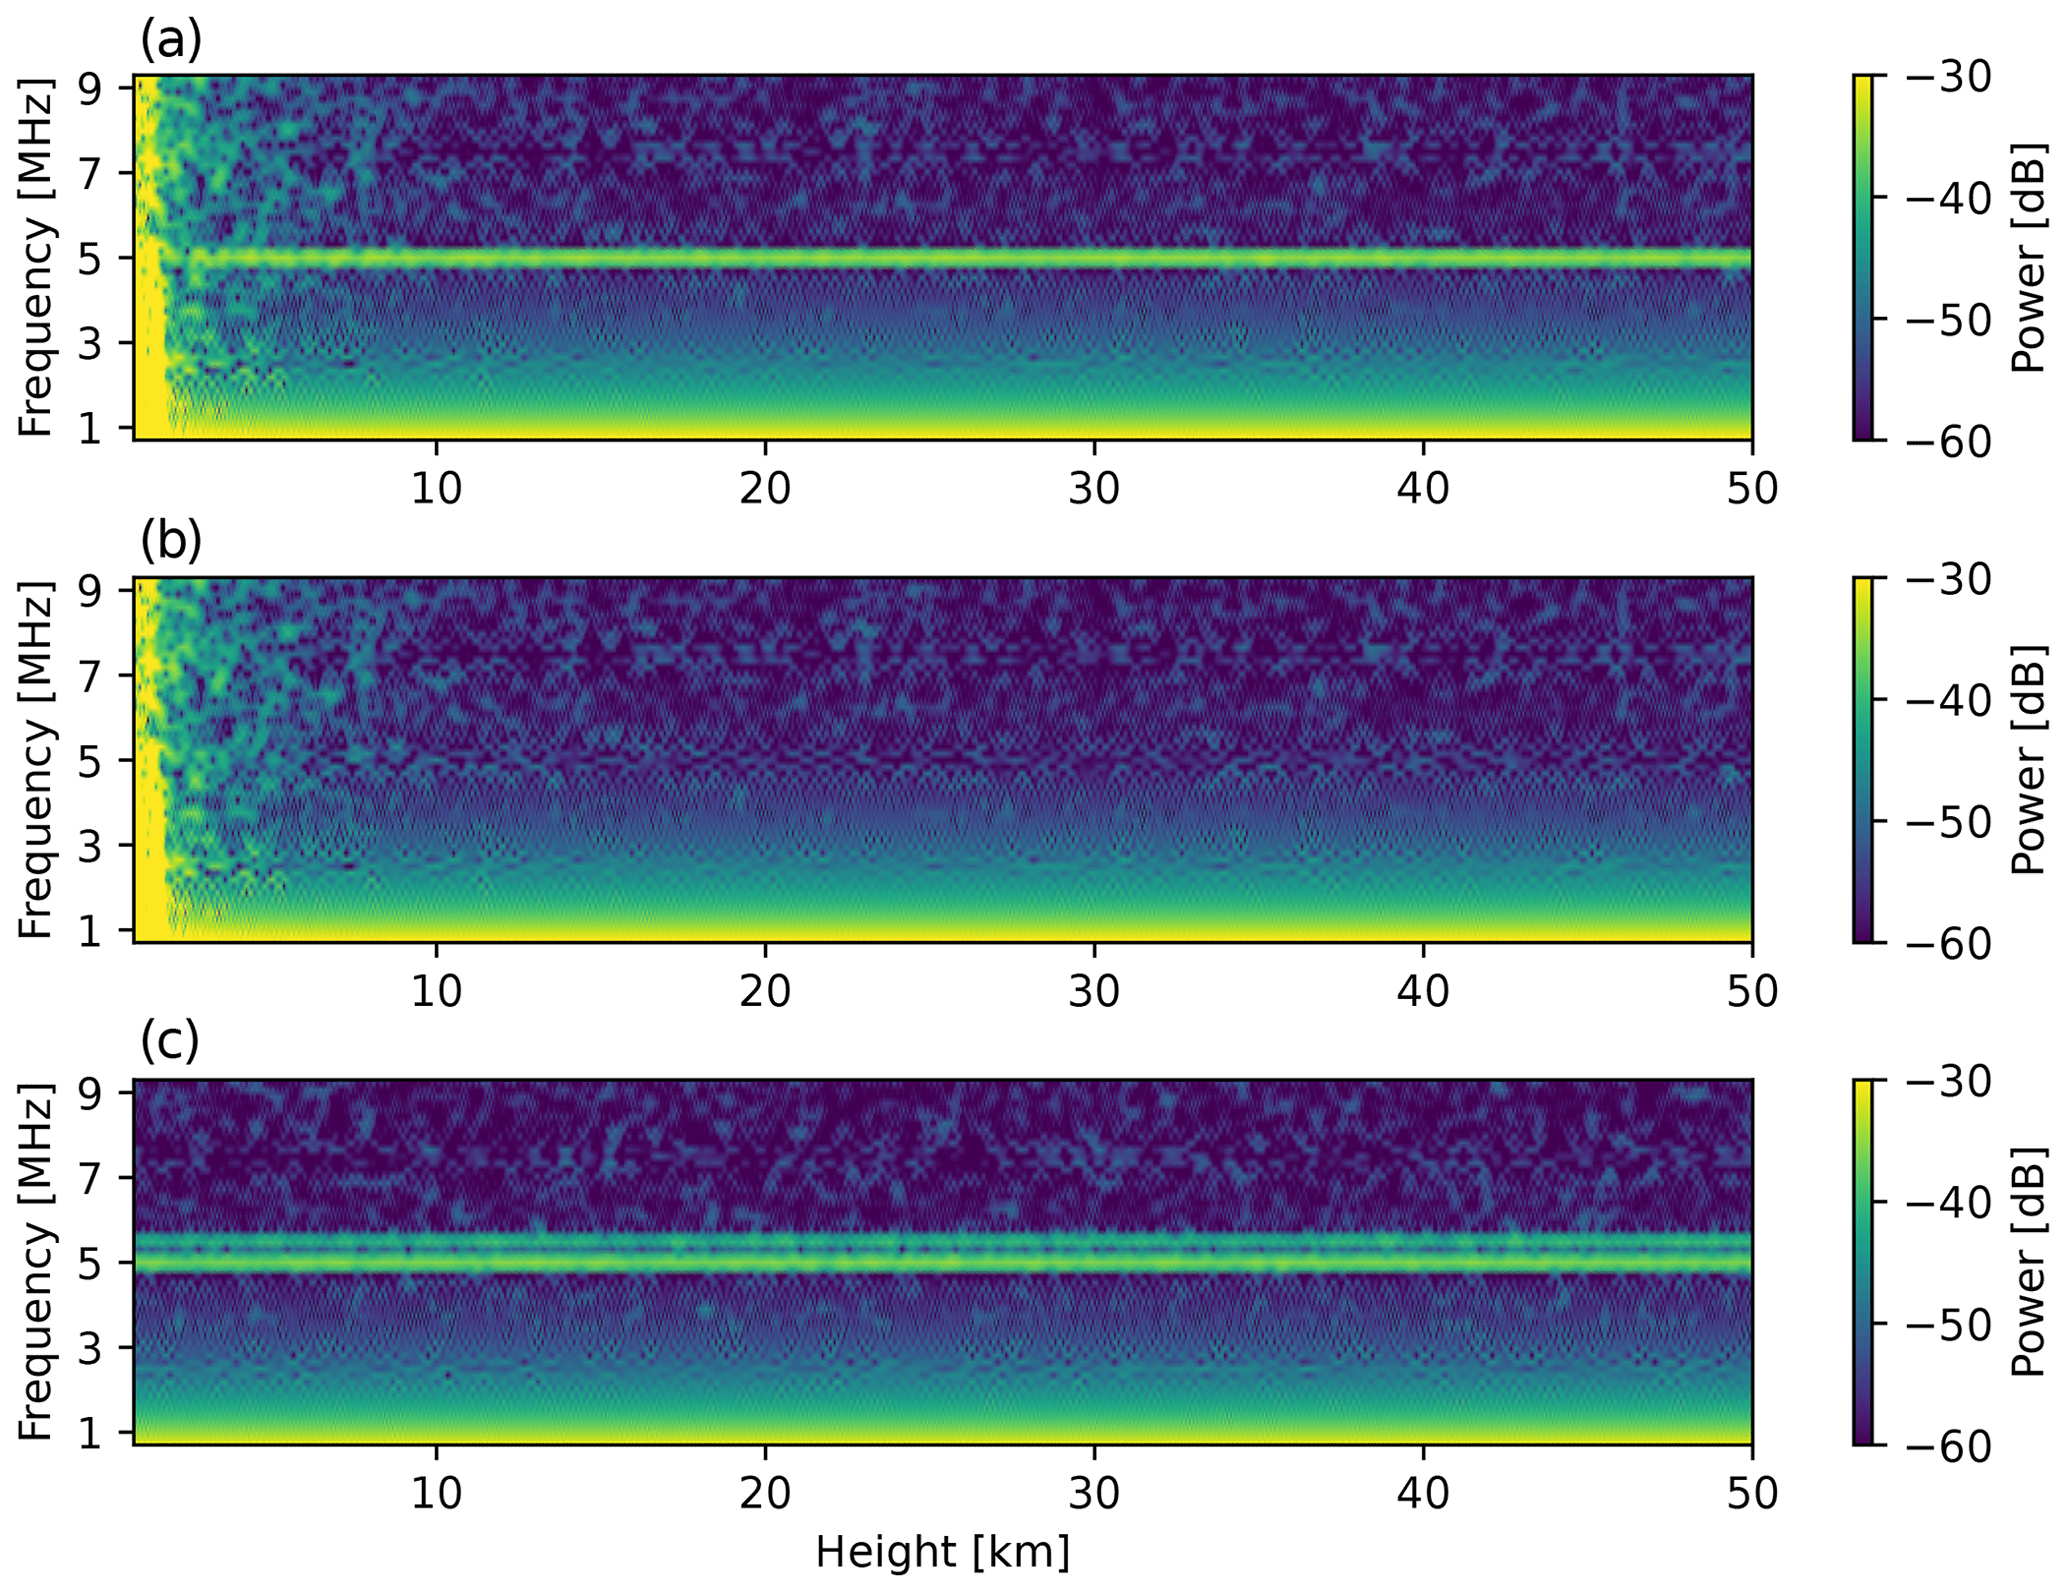
Figure 2Spectrograms of the 532 nm AN channel: (a) before and (b) after applying the interference suppression and (c) with additional RF interference caused by using two-way radios at a frequency of 154.5 MHz (recorded at another time step).
3.1 Detection and suppression of RF interference
In order to detect RF interference disturbing the lidar profile, spectrograms are computed and depicted in Fig. 2 for the 532 nm AN signal. For the duration of the recording of the whole lidar profile, an interference with a fixed frequency of 5 MHz can be observed in panel (a). As this disturbance occurred also when all devices but the transient recorders were switched off and the coaxial cables were disconnected, we assume that this RF interference may be caused by the transient recorders themselves. The interference is especially present in the older transient recorders, so it may occur due to aging effects of the transient recorders. In the PCNT signals, no corresponding RF interference can be observed.
Note that the signal is sampled at a sampling rate of 20 MHz, and the interference might actually occur at a frequency other than 5 MHz due to aliasing effects, which indicates that the anti-aliasing filters of the older transient recorders are somehow ineffective. While it is desirable to eliminate the interference source for future KARL measurements, e.g., by using newer transient recorders, it is also interesting to investigate how the signal quality of existing lidar profiles might be increased by suppressing these kinds of disturbances. This is especially important due to the fact that aerosol observations with KARL have to be comparable over a long time.
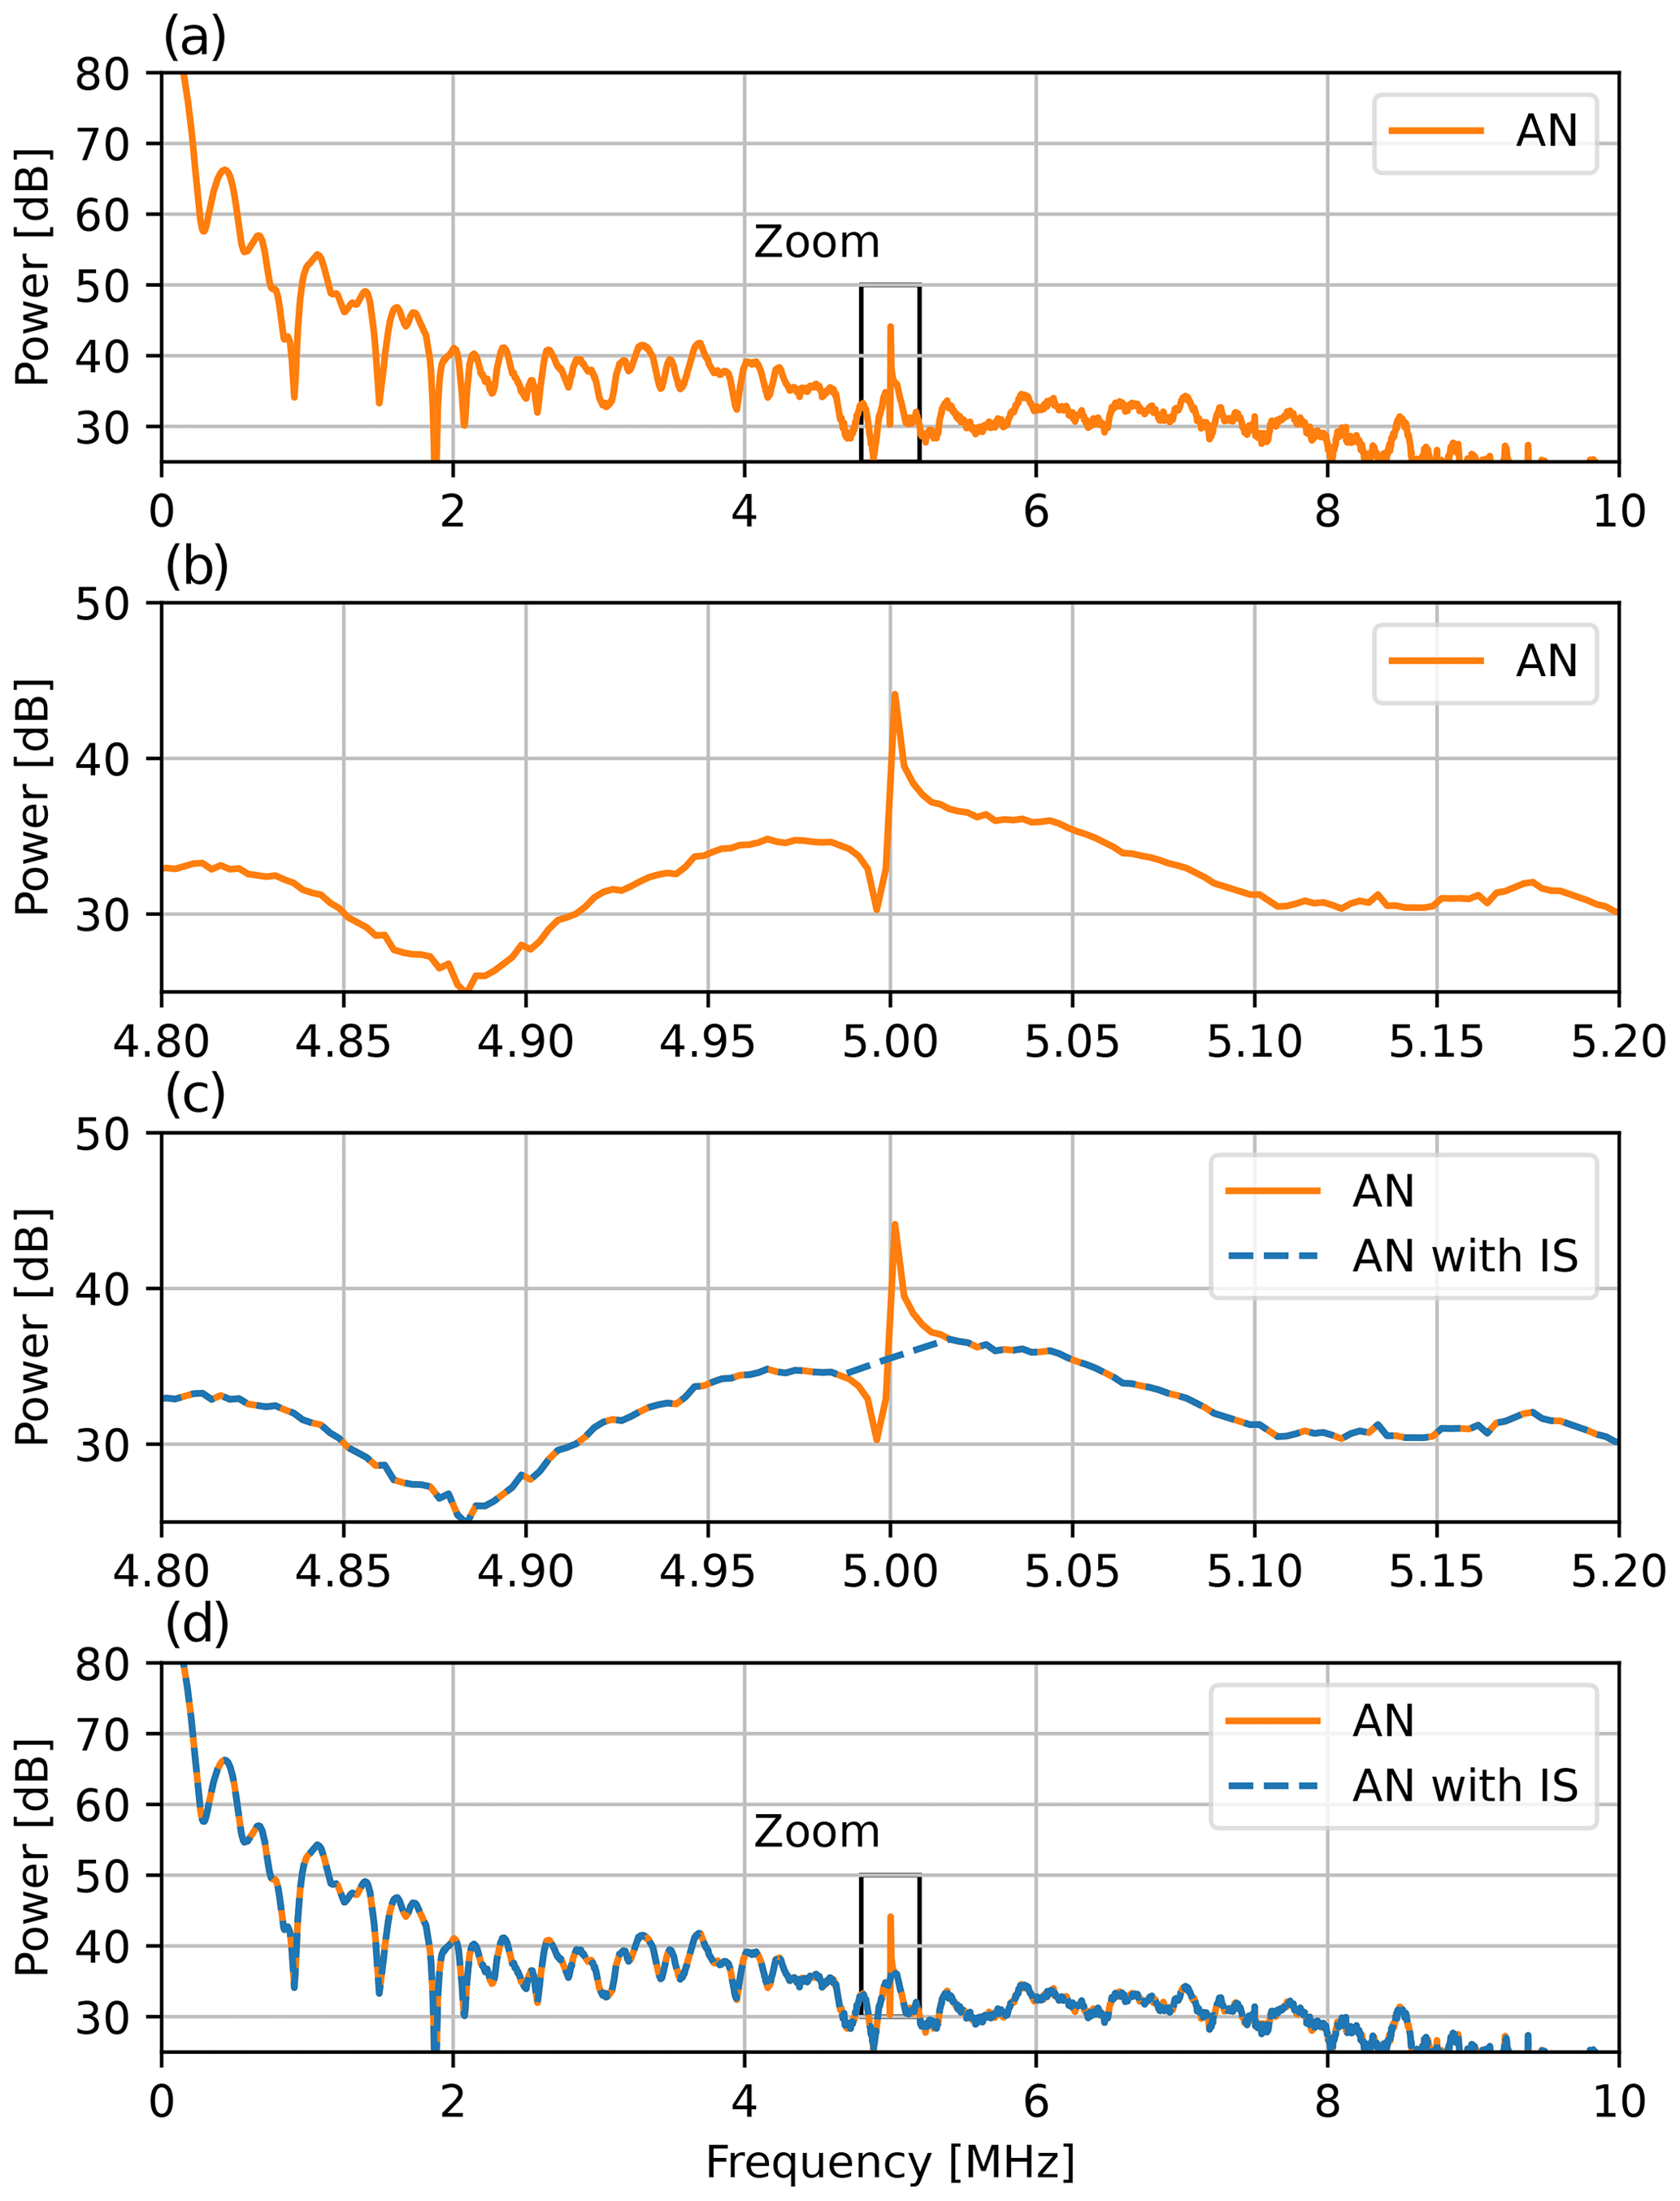
Figure 3Illustration of the interference suppression (IS) applied to the 532 nm AN channel: (a) spectrum with weak interference peak at 5 MHz, (b) weak interference peak, (c) with linear interpolation between two samples as an IS method and (d) the spectrum with IS.
In order to evaluate whether it is worth investigating methods on how to mitigate RF interference, an easy approach for suppressing the power of single frequencies is presented. As a first step, a discrete Fourier transform (DFT) is applied on the lidar profile in order to determine the occurring frequency components. This is illustrated in Fig. 3a and b. A relatively weak peak can be found at a frequency of 5 MHz, which is eliminated by cutting out 11 samples around the RF interference frequency and linearly interpolating the profile at the frequencies cut out. This procedure is illustrated in Fig. 3c and d.
When applying an inverse DFT to the lidar profile after interference suppression, the spectrogram can be computed again, and we expect the RF distortion to be much less visible; this is exactly what we observe in Fig. 2b. Consequently, the RF interference at 5 MHz is not visible anymore or at least significantly suppressed, and in the following, we show how the uncertainty of the evaluation is improved by suppressing this RF interference.
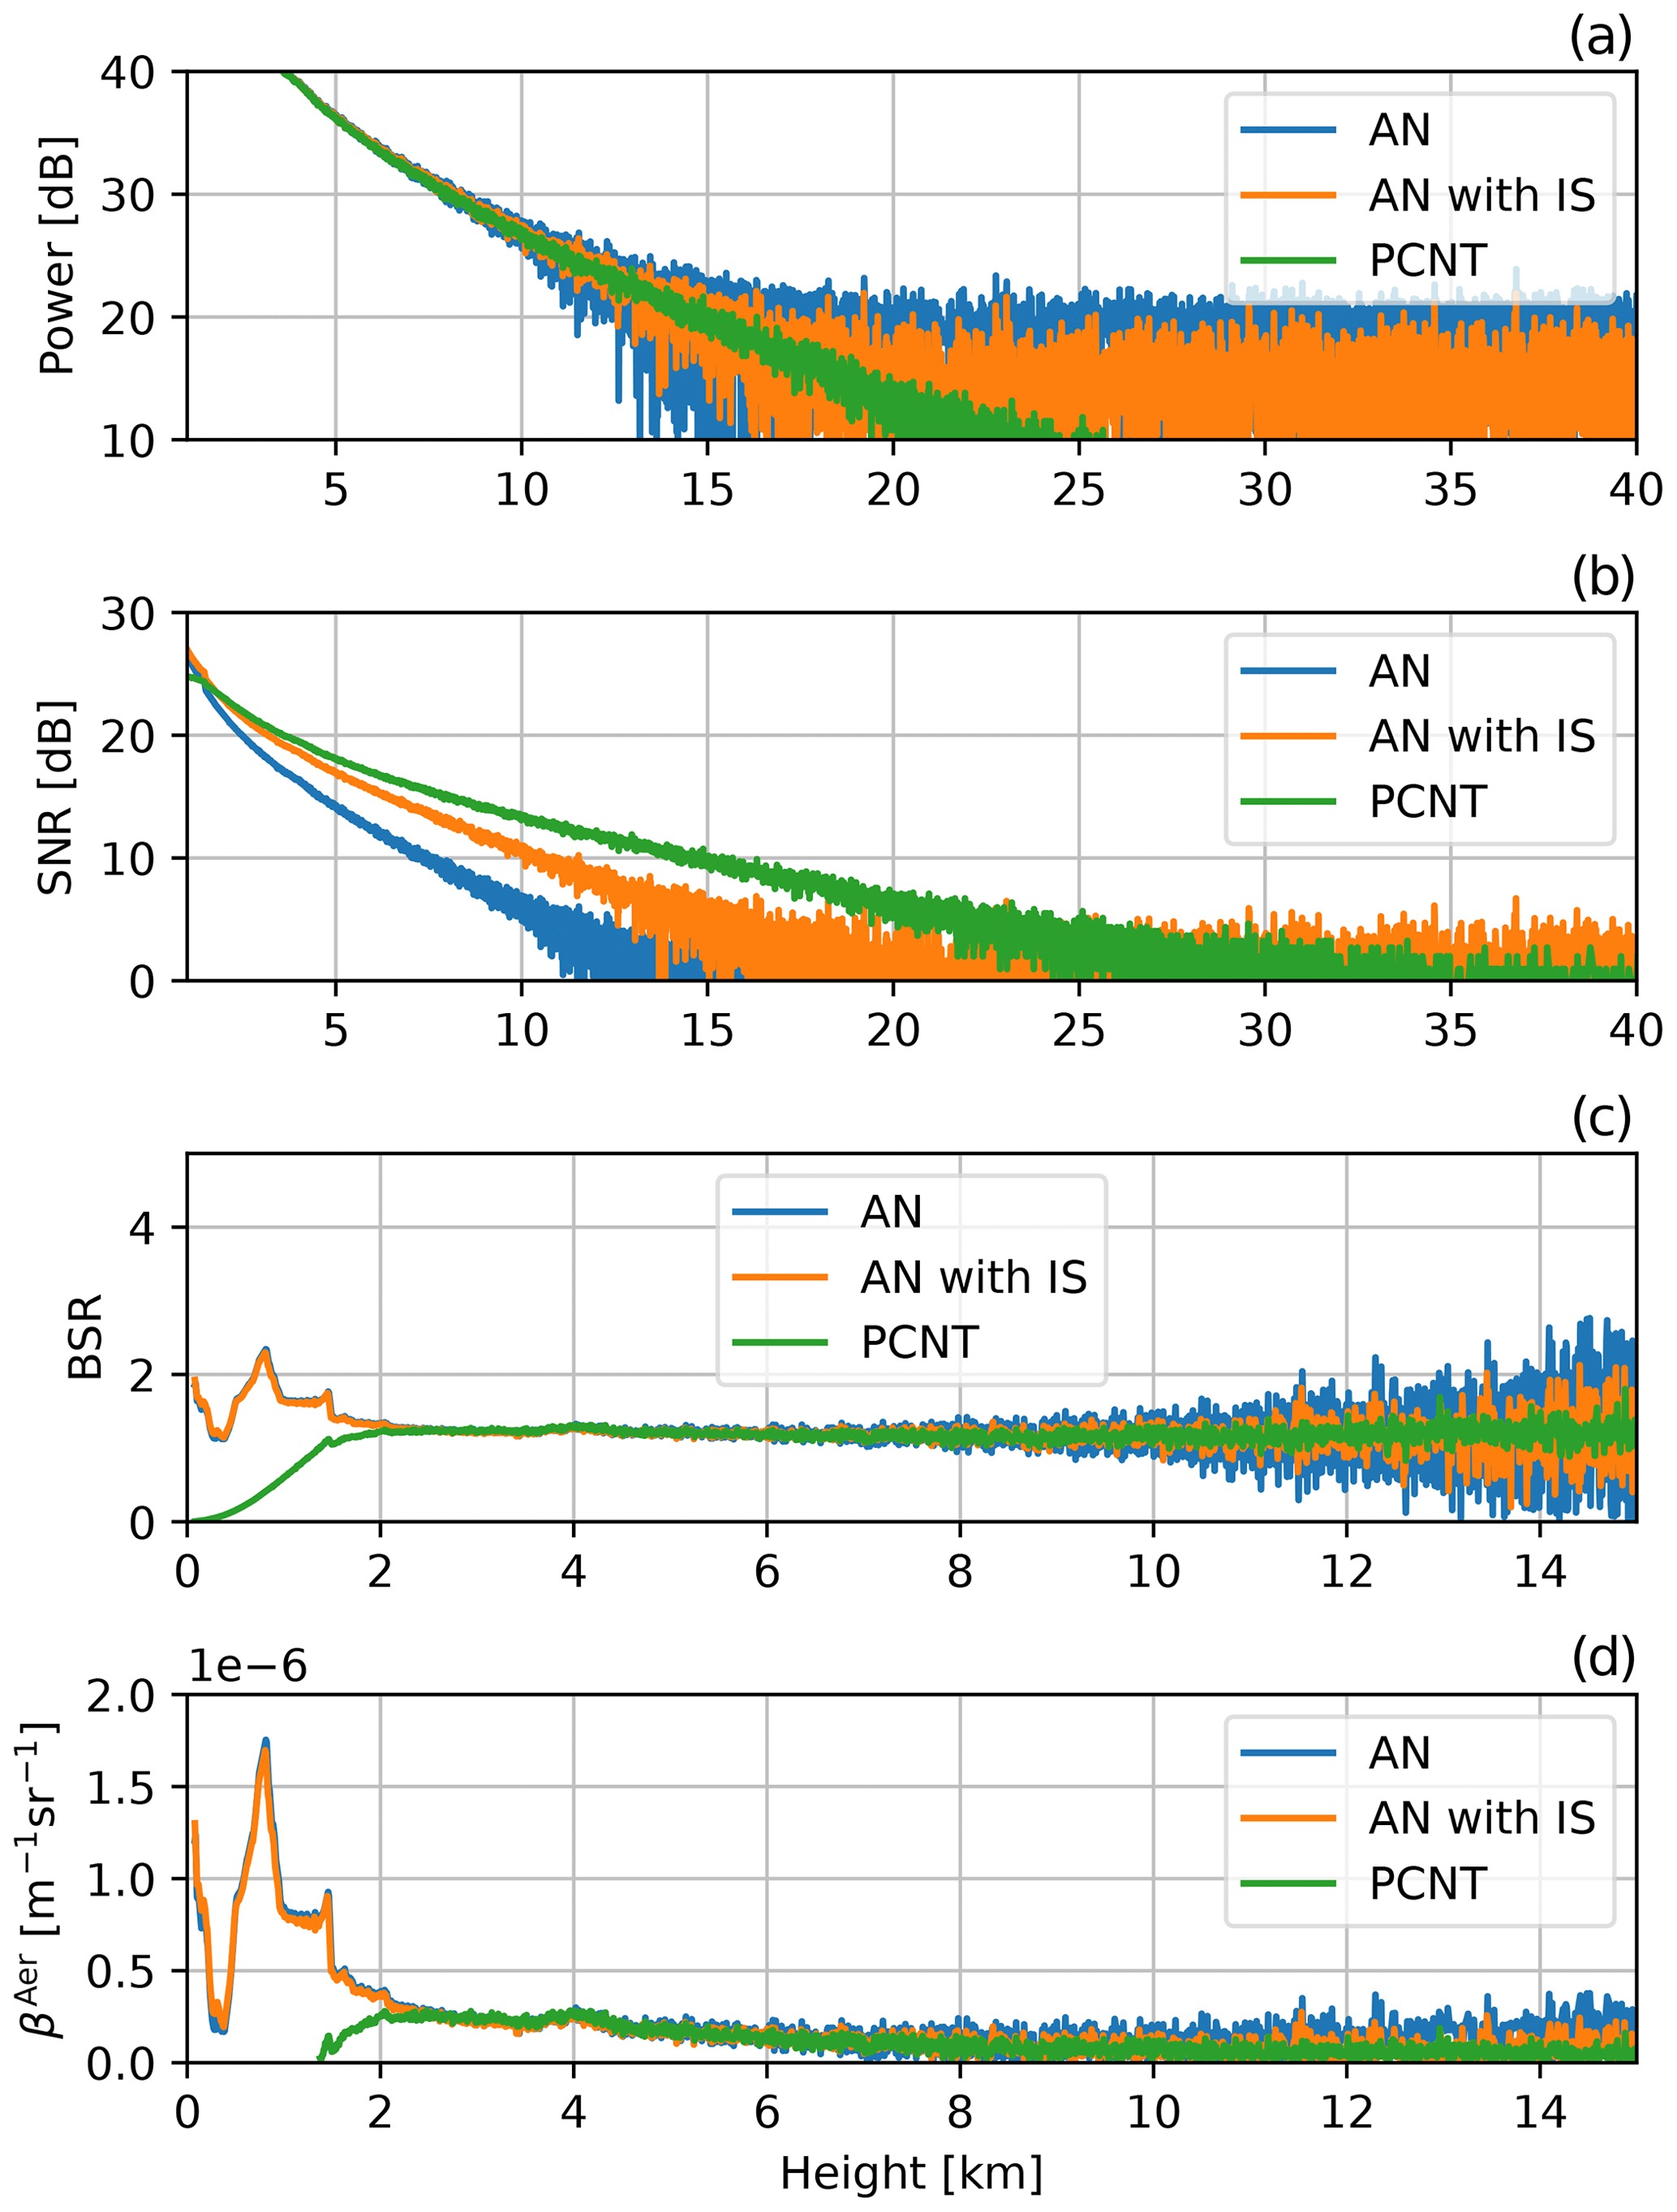
Figure 4Evaluation of the 532 nm channel with the AN signal with and without IS as well as the PCNT signal: (a) lidar profiles, (b) signal-to-noise ratio SNR, (c) backscatter ratio (BSR) and (d) aerosol backscatter coefficient (βAer).
3.2 Lidar profiles and evaluation
The lidar profiles and the corresponding evaluations are depicted in Fig. 4. Besides the (original) AN signal and the interference-suppressed AN signal, the PCNT signal is also shown for comparison. In panels a and b, it can be observed that the presented interference suppression method improves the signal quality, and hence the SNR, significantly. The SNR in heights between 10.5–11.5 km increases by more than a factor of 2, i.e., 3 dB. However, the SNR improvement becomes weaker for small altitudes.
For further evaluation, we define the uncertainty Δ to determine an aerosol backscatter coefficient as
where ΔβAer(zi) denotes the difference of the aerosol backscatter for consecutive height steps in the interval in which the AN signal was compared to the PCNT signal. The triangle brackets indicate the mean. This uncertainty Δ decreased from 1.56 × 10⁻⁷ to 7.1 × 10⁻⁸ (units: ) by the presented RF interference suppression . Although the PCNT signal has still a higher SNR and with Δ = 3.1 × 10⁻⁸ also a lower uncertainty, the AN signal improvements are useful when both channels are combined. Since in our case the RF interference manifests in a periodic disturbance of the lidar signal which can be background-corrected, it does not introduce a bias in the retrieval of aerosol properties. However, as Veselovskii et al. (2002) and Böckmann (2001) have pointed out, an inversion of microphysical aerosol properties from multiwavelength lidar requires an uncertainty of the optical coefficients of less than 10 %.
In Fig. 4c and d, the backscatter ratio (BSR) and the aerosol backscatter (βAer) are illustrated. The improvement by the presented RF interference suppression can be observed, especially for heights above 7.5 km. The low values of the PCNT signal below 2 km altitude are due to signal saturation.
When analyzing the lidar profiles, we also noticed other RF interference sources in our setup. Since two-way radios are used in Ny-Ålesund for communication purposes, we evaluated if these might be the reason for distortions in the lidar profiles occurring from time to time. Thus, we radioed continuously during a measurement, and the Rohde&Schwarz Spectrum Rider FPH confirmed that the radio channel was located at 154.5 MHz. The corresponding spectrogram of the lidar profile is depicted in Fig. 2c. It can be observed that there is an additional frequency at 5.5 MHz disturbing the lidar profile. This perfectly matches the two-way radio channel as this will occur at 5.5 MHz when sampling with 20 MHz due to aliasing.
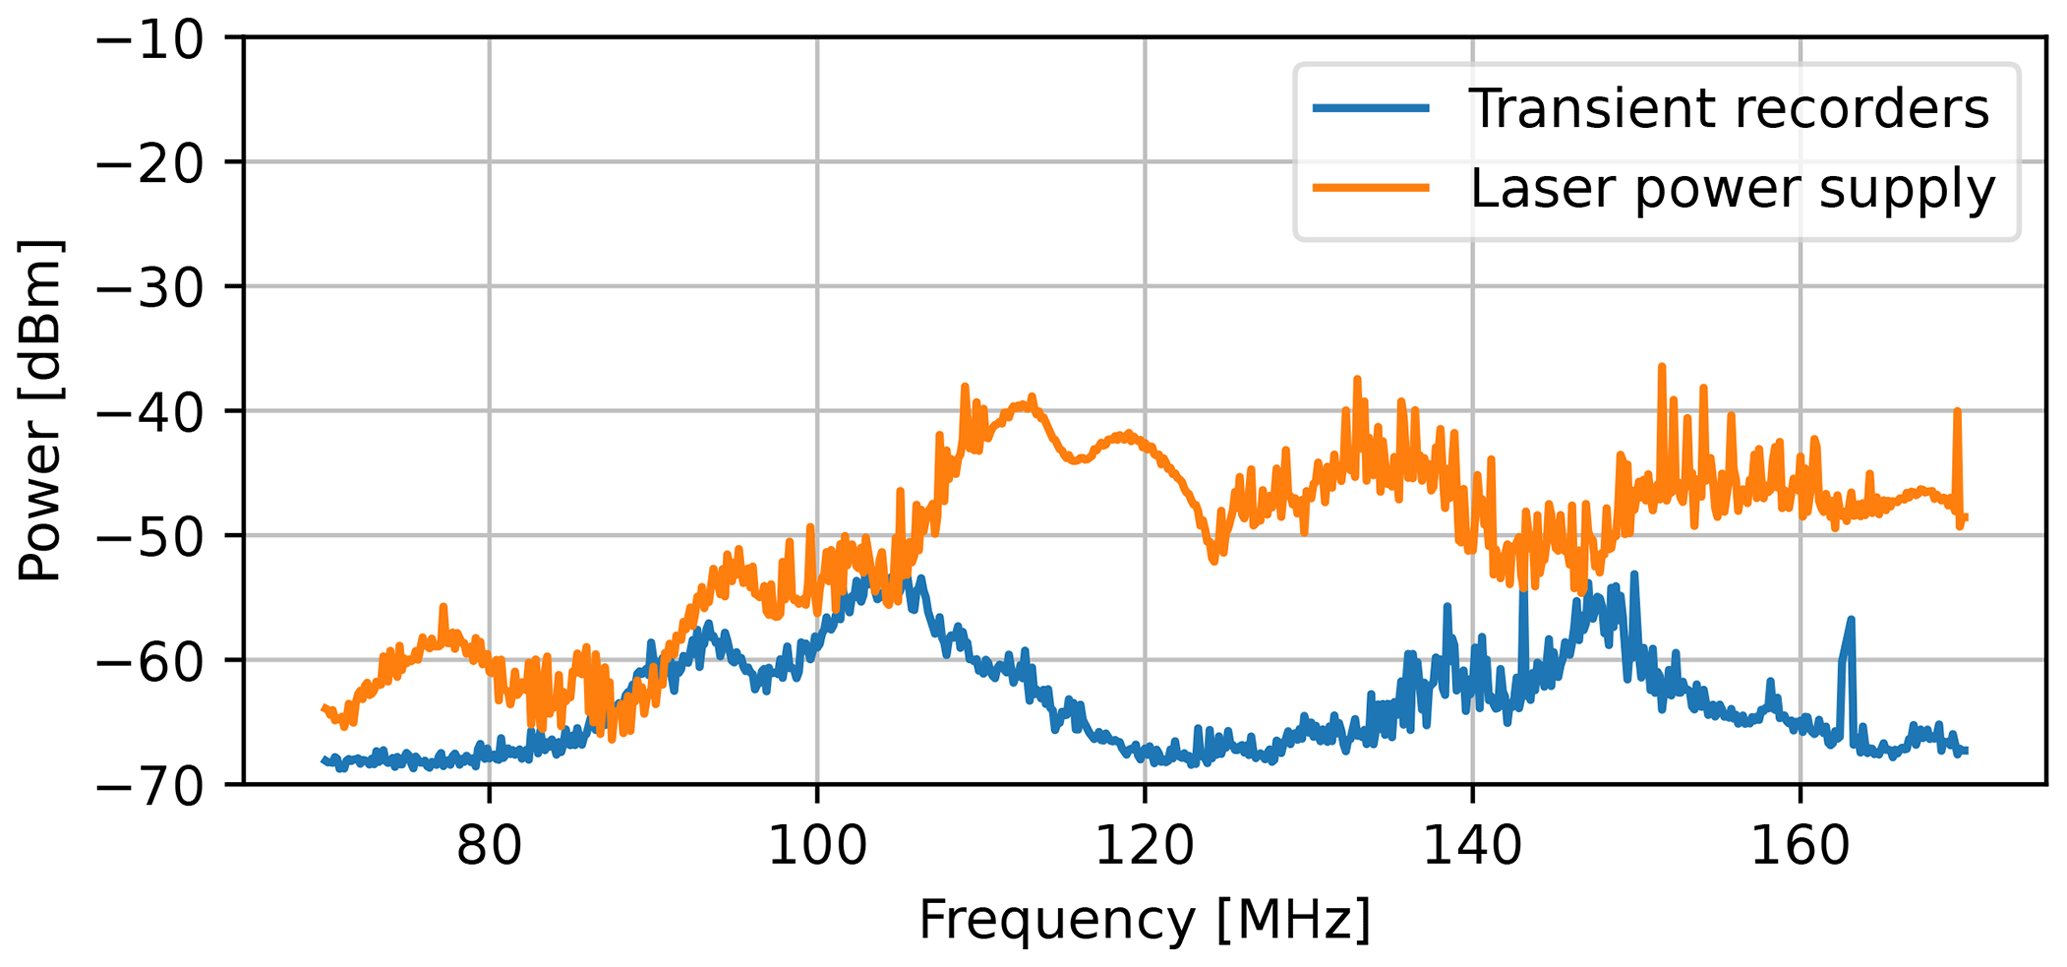
Figure 5Spectrum of EMI in the room housing the transient recorders and the room with the laser and its power supply.
Further, we measured the electromagnetic environment of the laser power supply and the transient recorders in order to evaluate if there might also be electromagnetic interference caused by the power supply. The measurements are illustrated in Fig. 5, and it can be seen that the RF power in the observation room is approx. 20 dB lower than inside the room with the laser power supply. For these measurements, the Spectrum Rider has been placed approx. 50 cm away from both the rack containing the transient recorders and the laser power unit, respectively. However, the precise distance turned out to be uncritical because the radiation did not show apparent gradients in each room. Nevertheless, if the transient recorders were to be placed directly next to the laser power supply, electromagnetic interference might occur due to laser operation. Fortunately, our setup in Ny-Ålesund has a separate observation room, and a clear impact of the laser unit on the transient recorders has not been found.
Although we would expect no RF interference to happen in a radio-silent area, it occurs in the lower-frequency range, especially for geometrically large lidar systems with long cables. In this paper, we presented how RF interference can be detected by applying spectral analysis to the lidar signals, and we also provided an easy method for interference suppression. We found out that even suppressing the relatively weak interference has positive effects on the lidar evaluation. Especially weak signals from higher altitudes in ground-based systems benefit from interference suppression. The frequency-selective interference occurred in the analog channel of the old transient recorders and could be suppressed using the presented method.
Finally we presented measurements indicating that placing the power supply of the laser next to the transient recorders may also lead to electromagnetic disturbances in the lidar profiles. In our case, the placement of the laser in a room separated from the transient recorders reduces the disturbances significantly. However, electromagnetic compatibility has to be taken into consideration in order to obtain high-quality data. Consequently, further work has to be done in order to make KARL more robust against external influences.
For a reliable retrieval of microphysical properties of aerosol from lidar data, backscatter and extinction coefficients must be recorded with less than 10 % uncertainty (Veselovskii et al., 2002; Böckmann, 2001). Hence, at least sporadic checks on the RF interference occurrence in analog signals are recommended. In the case that interference occurs with a fixed phase shift, a dark signal correction is preferred over a simple background correction. However, if the RF interference results from external sources appearing at fixed frequencies, it should be filtered out as described.
The lidar evaluation software is in MATLAB and can be obtained from the authors.
The data can be obtained from the authors.
This work was jointly performed by both authors, who also wrote the manuscript together.
The contact author has declared that neither of the authors has any competing interests.
Publisher's note: Copernicus Publications remains neutral with regard to jurisdictional claims in published maps and institutional affiliations.
The lidar was serviced at AWIPEV station, Ny-Ålesund, by Wilfried Ruhe, who also supported the measurements. Special thanks are expressed to Rubén Bolaño Gonzáles from Kartverket for lending the device for spectral measurements.
The article processing charges for this open-access publication were covered by the Alfred Wegener Institute, Helmholtz Centre for Polar and Marine Research (AWI).
This paper was edited by Alexander Kokhanovsky and reviewed by four anonymous referees.
Böckmann, C.: Hybrid regularization method for the ill-posed inversion of multiwavelength lidar data in the retrieval of aerosol size distributions, Appl. Optics, 40, 1329–1342, 2001. a, b
Freudenthaler, V., Linné, H., Chaikovski, A., Rabus, D., and Groß, S.: EARLINET lidar quality assurance tools, Atmos. Meas. Tech. Discuss. [preprint], https://doi.org/10.5194/amt-2017-395, in review, 2018. a
Guerrero-Rascado, J. L., Landulfo, E., Antuña, J. C., de Melo Jorge Barbosa, H., Barja, B., Álvaro Efrain Bastidas, Bedoya, A. E., da Costa, R. F., Estevan, R., Forno, R., Gouveia, D. A., Jiménez, C., Larroza, E. G., da Silva Lopes, F. J., Montilla-Rosero, E., de Arruda Moreira, G., Nakaema, W. M., Nisperuza, D., Alegria, D., Múnera, M., Otero, L., Papandrea, S., Pallota, J. V., Pawelko, E., Quel, E. J., Ristori, P., Rodrigues, P. F., Salvador, J., Sánchez, M. F., and Silva, A.: Latin American Lidar Network (LALINET) for aerosol research: Diagnosis on network instrumentation, J. Atmos. Sol.-Terr. Phys., 138–139, 112–120, https://doi.org/10.1016/j.jastp.2016.01.001, 2016. a
Hoffmann, A.: Comparative aerosol studies based on multi-wavelength Raman LIDAR at Ny-Ålesund, Spitsbergen, doctoralthesis, Universität Potsdam, 151 pp., 2011. a
Klett, J. D.: Lidar inversion with variable backscatter/extinction ratios, Appl. Optics, 24, 1638–1643, https://doi.org/10.1364/AO.24.001638, 1985. a
Mao, J.: Noise reduction for lidar returns using local threshold wavelet analysis, Opt. Quant. Electron., 43, 59–68, https://doi.org/10.1007/s11082-011-9503-6, 2012. a
Pappalardo, G., Amodeo, A., Apituley, A., Comeron, A., Freudenthaler, V., Linné, H., Ansmann, A., Bösenberg, J., D'Amico, G., Mattis, I., Mona, L., Wandinger, U., Amiridis, V., Alados-Arboledas, L., Nicolae, D., and Wiegner, M.: EARLINET: towards an advanced sustainable European aerosol lidar network, Atmos. Meas. Tech., 7, 2389–2409, https://doi.org/10.5194/amt-7-2389-2014, 2014. a
Shimizu, A., Nishizawa, T., Jin, Y., Kim, S.-W., Wang, Z., Batdorj, D., and Sugimoto, N.: Evolution of a lidar network for tropospheric aerosol detection in East Asia, Opti. Eng., 56, 031219, https://doi.org/10.1117/1.OE.56.3.031219, 2016. a
Veselovskii, I., Kolgotin, A., Griaznov, V., Müller, D., Wandinger, U., and Whiteman, D. N.: Inversion with regularization for the retrieval of tropospheric aerosol parameters from multiwavelength lidar sounding, Appl. Optics, 41, 3685–3699, https://doi.org/10.1364/AO.41.003685, 2002. a, b
Zhou, Z., Hua, D., Wang, Y., Yan, Q., Li, S., Li, Y., and Wang, H.: Improvement of the signal to noise ratio of Lidar echo signal based on wavelet de-noising technique, Opt. Laser. Eng., 51, 961–966, https://doi.org/10.1016/j.optlaseng.2013.02.011, 2013. a