the Creative Commons Attribution 4.0 License.
the Creative Commons Attribution 4.0 License.
 | 14 Sep 2023
Adjustment of 1 min rain gauge time series using co-located drop size distribution and wind speed measurements
Arianna Cauteruccio
Mattia Stagnaro
Luca G. Lanza
Pak-Wai Chan
A procedure to adjust rainfall intensity (RI) measurements to account for the wind-induced measurement bias of traditional catching-type gauges is proposed and demonstrated with an application to a suitable case study. The objective is to demonstrate that adjustment curves derived from numerical simulations and disdrometer measurements allow for a posteriori correction of rainfall time series based on the wind velocity measurements alone. To quantify the impact of wind on long-term records, 1 min RI measurements from a cylindrical tipping-bucket rain gauge installed at the Hong Kong Observatory are adjusted. Catch ratios derived from the instrument's aerodynamic behaviour under varying wind speed and drop size combinations are obtained by fitting computational fluid-dynamic simulation results already available in the literature. Co-located high-resolution wind speed measurements from a cup and vane sensor and drop size distribution measurements from an optical video disdrometer (the 2DVD or two-dimensional video disdrometer) are used to infer the collection efficiency of the gauge as a function of wind speed and RI alone and to adjust raw data from a 4-year dataset (2018–2021) of 1 min RI measurements. Due to the specific local climatology, where strong wind is often associated with intense precipitation, 80 % of the dataset adjustments are limited to 4 % of the observed RI values. This, however, results in a significant amount of available freshwater resources that would be missing from the calculated hydrological and water management budget of the region should the adjustments be neglected. This work raises the need to quantify the impact of the wind-induced bias at other sites where disdrometer data support a characterisation of the relationship between the drop size distribution and the measured RI. Depending on the local rain and wind climatology, the correction may account for a significant portion of the annual rainfall amount.
- Article
(3672 KB) - Full-text XML
- BibTeX
- EndNote


The measurement bias of atmospheric precipitation gauges due to environmental sources (including wind) is strongly linked to the microphysical characteristics of precipitation (see e.g. Thériault et al., 2012) and specifically to the phase, size, and fall velocity of individual hydrometeors. This link affects the efficiency of possible adjustments to the raw measured data since they would require the measurement of additional variables and, due to the large variability of the phenomenon even at short timescales, would need to be performed at a high temporal resolution.
Dedicated sensors, called disdrometers, are generally deployed to provide the particle size distribution (PSD) and fall velocity information (see e.g. Caracciolo et al., 2008). Among various applications, disdrometers can be used to improve the integral measurements of precipitation (cumulated depth and intensity) obtained from traditional gauges. Optical disdrometers (Lanza et al., 2021) are widely used to obtain suitable PSD and fall velocity measurements. The two-dimensional video disdrometer (2DVD), manufactured by the Johanneum Research Institute, has demonstrated high performance and is used in various scientific works (see Kruger and Krajewski, 2002). This specific optical sensor operates in the visible band of the light spectrum to capture images of each single falling particle that crosses the sensing volume and uses two orthogonal light sheets and two synchronised cameras to derive the 3D shape of individual hydrometeors.
In addition to the instrument geometry and the wind speed, the wind-induced bias of precipitation measurements obtained using catching-type gauges depends on the individual particle size and fall velocity (Leroux et al., 2021). Meickle (1819) and Jevons (1861) were the first authors to highlight the aerodynamic behaviour of precipitation measurement instruments. Evidence of the deviation of water drop trajectories close to the gauge collector due to the instrument bluff-body behaviour was initially provided by Warnik (1953) and was recently quantified by Cauteruccio et al. (2021a, b) using wind tunnel experiments, where various gauge geometries, including the cylindrical shape, were tested.
The wind-induced bias of precipitation measurements was extensively studied in the literature and quantified using field tests (Kochendorfer et al., 2017) and computational fluid-dynamic (CFD) simulations with associated particle tracking (see e.g. Něspor and Sevruk, 1999; Colli et al., 2016a, b). In the first case, the ratio between the precipitation measured by a gauge in operational conditions and the reference precipitation (obtained by properly shielding or installing the gauge) provides the so-called collection efficiency (CE), while in the second case, a numerical CE is calculated, starting from the catch ratios (CRs) of monodisperse precipitation, which is later weighted and integrated after assuming a suitable PSD (see e.g. Cauteruccio et al., 2021c). The catch ratio is defined as the ratio between the number of particles captured by the gauge collector in disturbed airflow conditions and the number of particles that would be captured if the gauge was “transparent” to the wind.
The role of the gauge outer geometry on the aerodynamic behaviour of the gauge was investigated by Colli et al. (2018) through simulations of four different geometries: cylindrical, chimney, and two different inverted conical shapes. The CFD velocity fields, obtained within a Reynolds-averaged Navier–Stokes (RANS) modelling approach, revealed that gauges with inverted conical shape have better aerodynamic behaviour than the chimney-shaped gauge, while the cylindrical gauge demonstrated an intermediate behaviour (see also Cauteruccio et al., 2021b). The cylindrical shape is typical of most tipping-bucket rain gauges that are employed operationally. Cauteruccio and Lanza (2020), based on the CFD velocity fields provided by Colli et al. (2018), obtained the catch ratios of a typical cylindrical gauge using the Lagrangian particle-tracking model already validated by Cauteruccio et al. (2021a) and provided sample CE curves as a function of wind speed and rainfall intensity by using the PSD measured by Caracciolo et al. (2008) at an Italian test site.
In this work, both field measurements and CFD simulation results are used to adjust liquid precipitation measurements obtained from a traditional catching-type gauge. The catch ratios provided by Cauteruccio and Lanza (2020) are expressed as a function of both wind speed and rainfall intensity so that the CE curves for any specific climatology can be derived based on the local drop size distribution (DSD) and co-located rainfall intensity (RI) and wind speed measurements. A suitable formulation for the CE of a cylindrical, tipping-bucket rain gauge located in the field test site of the Hong Kong Observatory (HKO) is derived based on a sample set of 1 min co-located RI, DSD, and wind speed measurements, starting from numerical simulation results published in Colli et al. (2018) and Cauteruccio and Lanza (2020). Adjustments are then applied to a 4-year dataset of 1 min rainfall intensity and wind speed measurements in the absence of contemporary DSD data, and the associated measurement bias is derived. The objective is to demonstrate that adjustment curves for the wind-induced bias can be derived using CFD results and disdrometer measurements and applied for a posteriori correction of rainfall time series based on the wind velocity measurements alone. Depending on the local rain and wind climatology, the correction may account for a significant portion of the annual rainfall amount.
The organisation of the paper is as follows: in the methodology section, the functional dependency of the catch ratio on the particle size and wind speed is derived, and disdrometer data from the investigated case study are analysed to obtain the DSD as a function of the measured rainfall intensity. In the results section, a sigmoidal function is used to fit the numerical CE as a function of wind speed and to adjust 1 min RI measurements along a period of 4 years with co-located wind speed measurements but in the absence of contemporary DSD data. In the conclusion section, results are discussed, and the feasibility and impact of the proposed methodology for the investigated case study and in other contexts are commented on.
The functional dependency of the catch ratio (CR) on the particle size (d) and wind speed (Uref) is first made explicit for a cylindrical rain gauge. This is used to adjust 1 min rainfall intensity measurements from a tipping-bucket rain gauge (the Shanghai Meteorological Instrument Factory – SMIF) installed at the HKO field test site (see Fig. 1). The 1 min DSD measurements from a co-located 2DVD for a sample of rainfall intensity events are classified as a function of RI to allow for the application of adjustments in the absence of contemporary DSD measurements. Then, 1 min rainfall intensity measurements from a 4-year time series (2018–2021) are adjusted, and the associated measurement bias is calculated based on co-located wind speed measurements alone (the wind sensor is positioned in R1E in Fig. 1a). A white arrow indicating the prevailing wind direction (about 100∘) is included in Fig. 1b; therefore, the wind mostly blows from the lower sensors to the taller sensors.
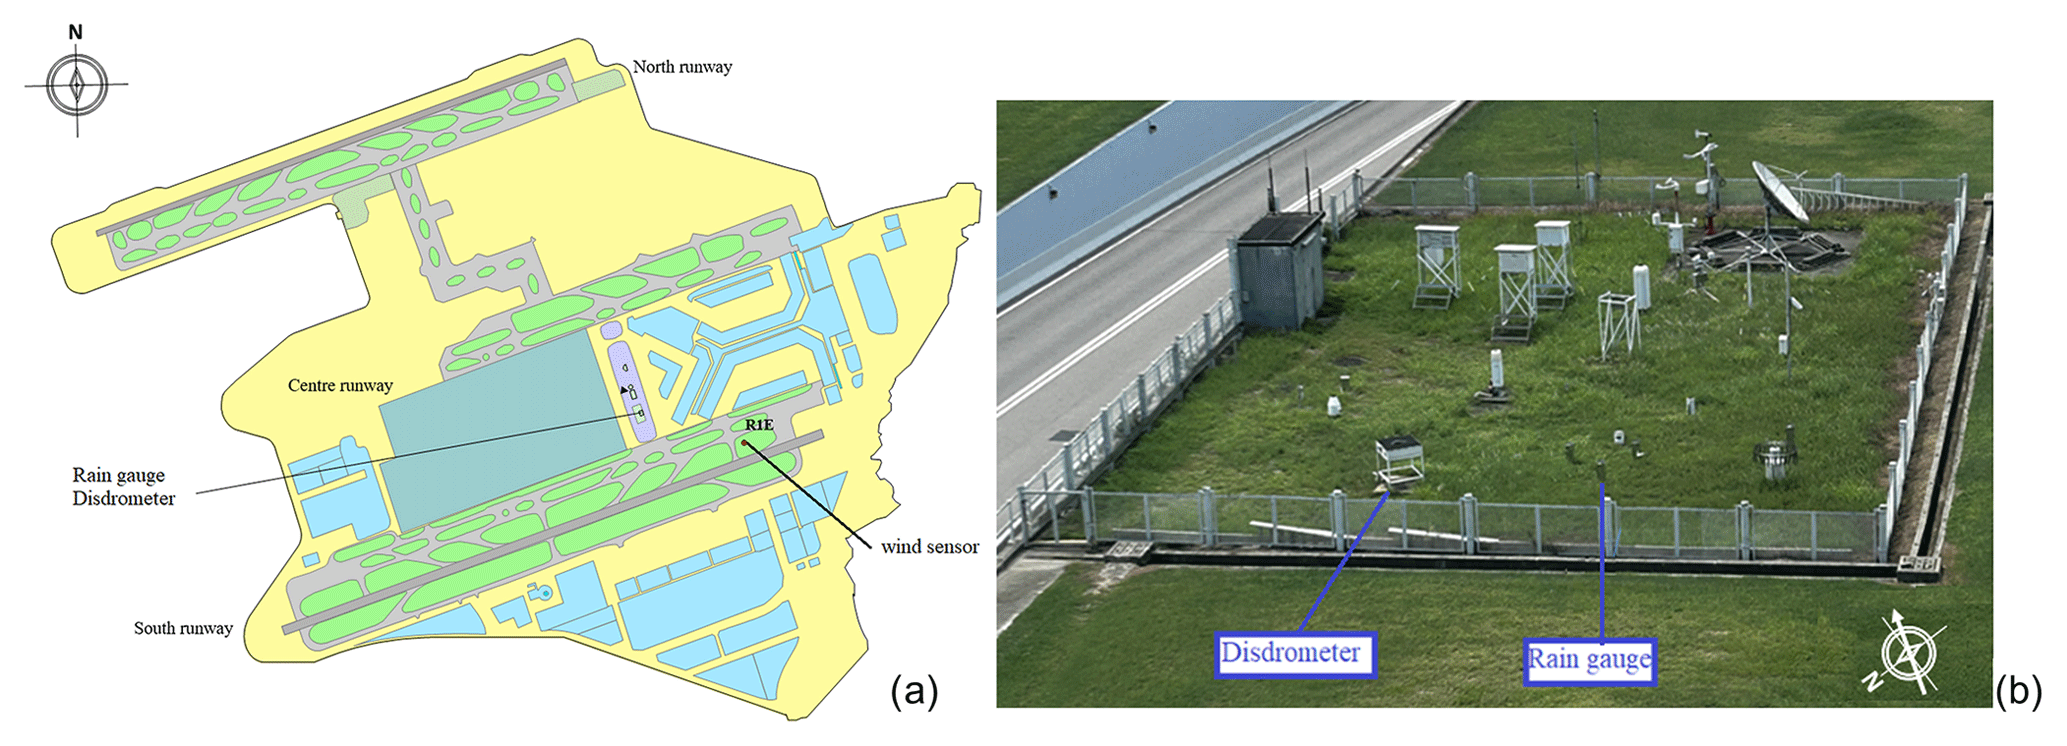
Figure 1(a) Location of the field test site within Hong Kong International Airport (R1E indicates the wind sensor) and (b) picture of the installed rain gauge and 2DVD within the field test site. The white arrow indicates the prevailing wind direction (about 100∘).
2.1 Field measurements
The DSD measurements are obtained from a 2DVD instrument (see Fig. 2a) installed at the HKO field test site, where the available anemometer and the tipping-bucket rain gauge are also installed. The high-quality cup and vane wind measurement sensor manufactured by Thies Clima has a resolution of 0.1 m s−1, while the rain gauge (see Fig. 2b) is manufactured by SMIF (model SL3-1A digital rain gauge) and has a collector diameter of 200 mm, a resolution of 0.1 mm, and a maximum measurable rate equal to 4 mm min−1. No filters were applied to the dataset except for selecting rainfall data at 1 min resolution with a minimum rainfall intensity threshold equal to 5 mm h−1.
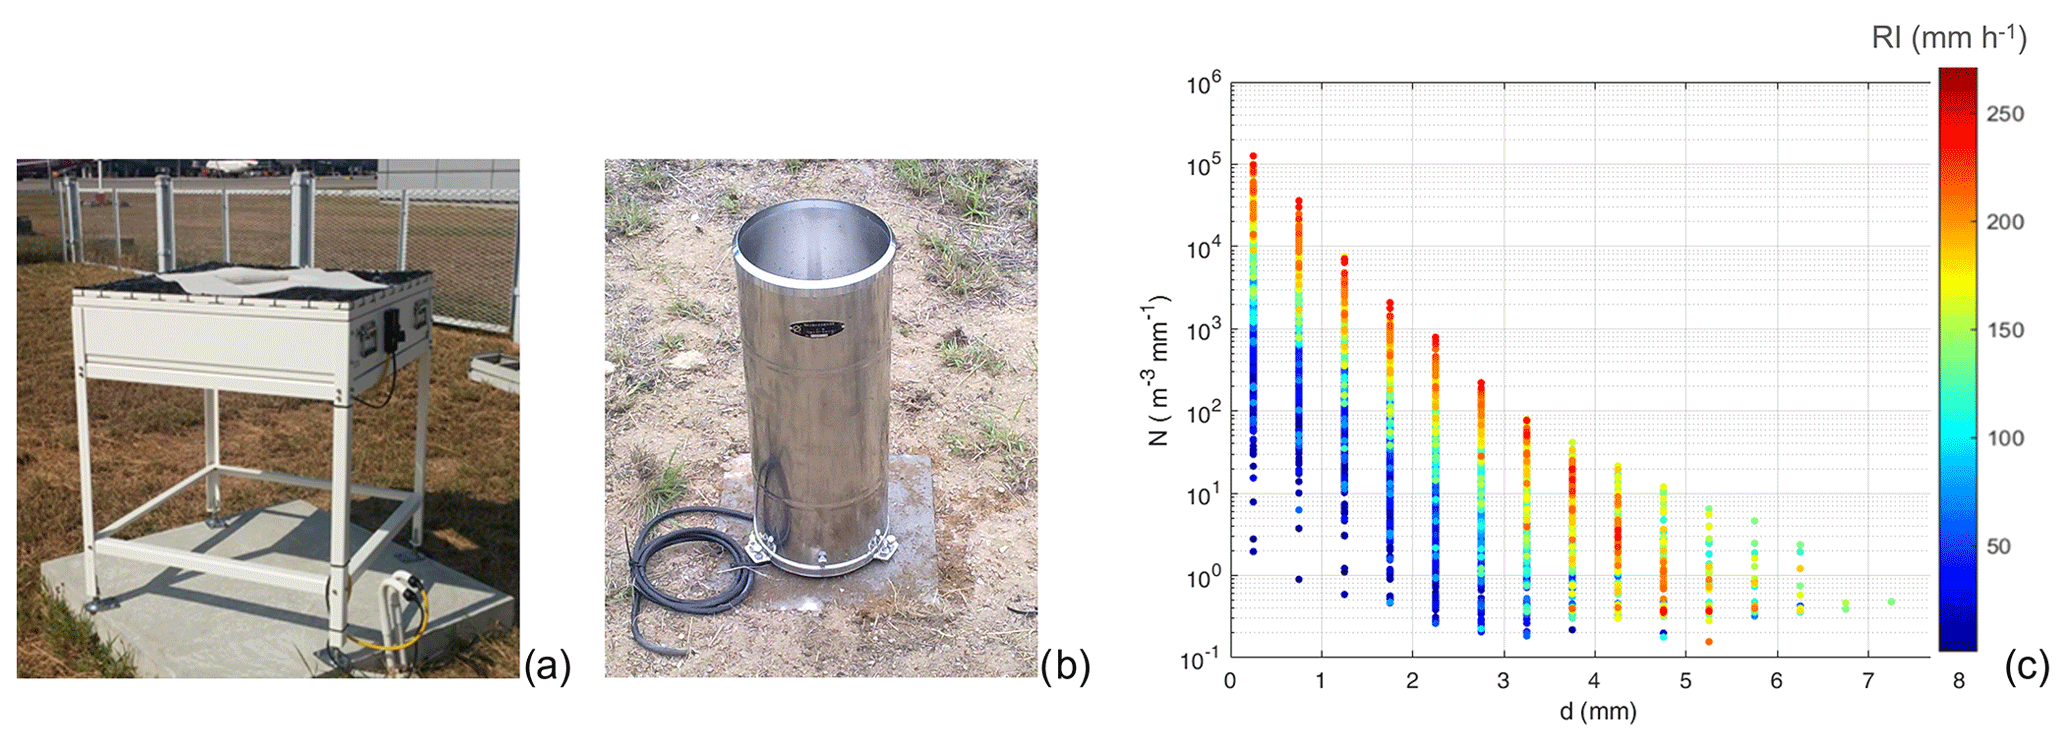
Figure 2(a) The 2DVD instrument installed at the HKO field test site, (b) the SMIF tipping-bucket rain gauge, and (c) DSD measurements colour coded (see the lateral colour bar) according to the rainfall intensity (RI) as measured by the 2DVD. N is the number of particles in a cubic metre of air per bin size, while d is the drop diameter.
Quality controlling of the data is performed by visual inspection, an out-of-range test, and a jump test. The wind sensor is periodically calibrated in the wind tunnel, while the bucket volume of the rain gauge is calibrated in the laboratory once a year. The 2DVD data are provided in the binary native form of the instrument, and the DSD information is retrieved using the official software provided by the Johanneum Research Institute.
Since rainfall measurements are provided at 1 min resolution, while the DSD and wind speed measurements are available every 10 s, DSD measurements are preliminarily aggregated at the 1 min resolution, and a moving average is applied to the wind measurements before sampling 1 min data. The available wind measurements are taken at the typical height of 10 m. Although this is not optimal for the correction of the wind-induced error, wind measurements at the gauge height are seldom available and would not be present in operational sites; therefore, we propose a methodology that is easily applied by operational users.
The DSD measurements are available for nine selected rainfall events during the years 2018–2020 for a total of about 5000 min of measurements. To allow for extrapolation of the DSD to events with no available disdrometer information, these data are classified here as a function of rainfall intensity (calculated from the 2DVD) and are fitted within each class using the typical inverse exponential form (Eq. 1) as proposed by Marshall and Palmer (1948):
with N0 and Λ being the scale and shape parameters, respectively.
The DSD parameters can be further categorised as a function of RI using a power law function in the following form:
where α and β are numerical best-fit coefficients.
The available 1 min DSD measurements are plotted in Fig. 2c, where dots are colour coded according to the RI measured by the 2DVD itself. Data are aggregated in classes with a diameter bin size equal to 0.5 mm and are expressed in terms of number of particles (N) per cubic metre (m3) of air per bin size. The best-fit coefficients α and β used in Eq. (2) are equal to 922.47 and 0.92 for the scale parameter N0 and 2.83 and −0.04 for the shape parameter Λ.
Wind speed and RI measurements from the installed cup and vane anemometer and cylindrical tipping-bucket rain gauge are available for a period of 4 years (2018–2021). In Fig. 3, the variability of the measured RI with wind speed is shown for the whole period using the boxplot representation. Boxes and whiskers encompass the central 50 % and 80 % of the RI values, respectively, while dots indicate the 5th and 95th percentiles of their non-parametric distribution. The mean and median values are depicted with the thick and thin horizontal lines, respectively. Wind speed classes are defined using a bin width equal to 1 m s−1. Wind speed values lower than 6 m s−1 occur during light precipitation events (white boxes below 15 mm h−1), while the mean value and the variability of RI increase with increasing wind speed, and the highest RI values occur for wind speeds between 10 and 12 m s−1 and at 17 m s−1. A low number of precipitation events are recorded in combination with a very strong wind speed.
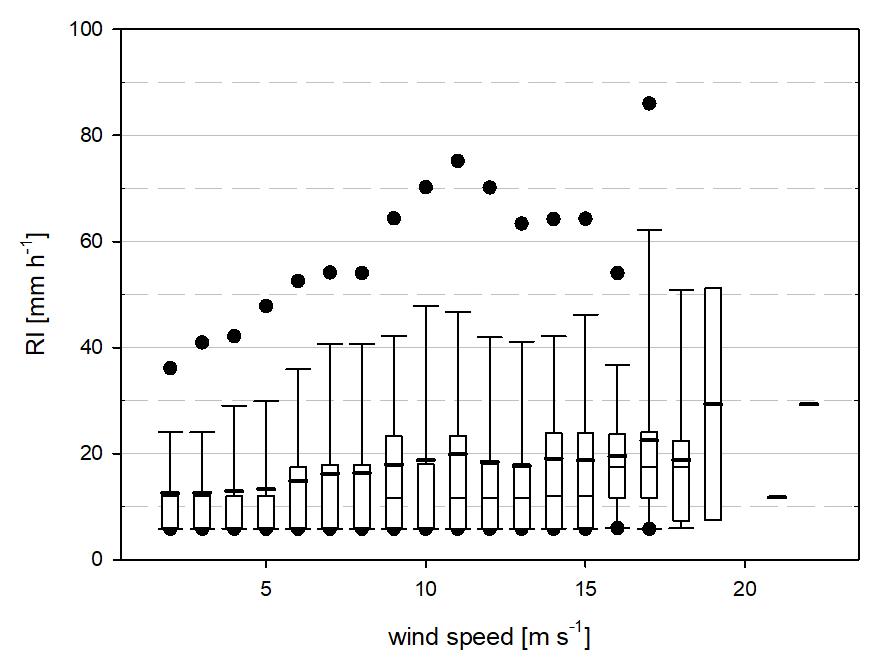
Figure 3Joint 1 min rainfall intensity (RI) and wind speed climatology at the HKO field test site for wind speed bins of 1 m s−1. Boxes and whiskers encompass the central 50 % and 80 % of the sample, respectively, while dots indicate the 5th and 95th percentiles of their non-parametric distribution. The mean and median values are depicted with the thick and thin horizontal lines, respectively.
2.2 Functional dependency of the CR on meteorological variables
The derivation of suitable CE curves for the adjustment of raw data obtained from a specific precipitation measurement instrument requires the knowledge of the CRs and the local DSD. Indeed, the DSD indicates – per each drop size (usually expressed in terms of equivolumetric drop diameter) – the number of drops occurring during a precipitation event, while CRs provide the number of such drops that are not collected by the instrument in the presence of wind. In this section, we preliminarily derive the functional dependence of the CR on the drop size and wind speed for a catching-type cylindrical rain gauge.
The CR values obtained from CFD simulations with embedded particle tracking for a drop diameter d from 0.25 to 8 mm and a wind speed Uref from 2 to 18 m s−1 (as already provided by Cauteruccio and Lanza, 2020) are here replicated in Fig. 4 with markers.
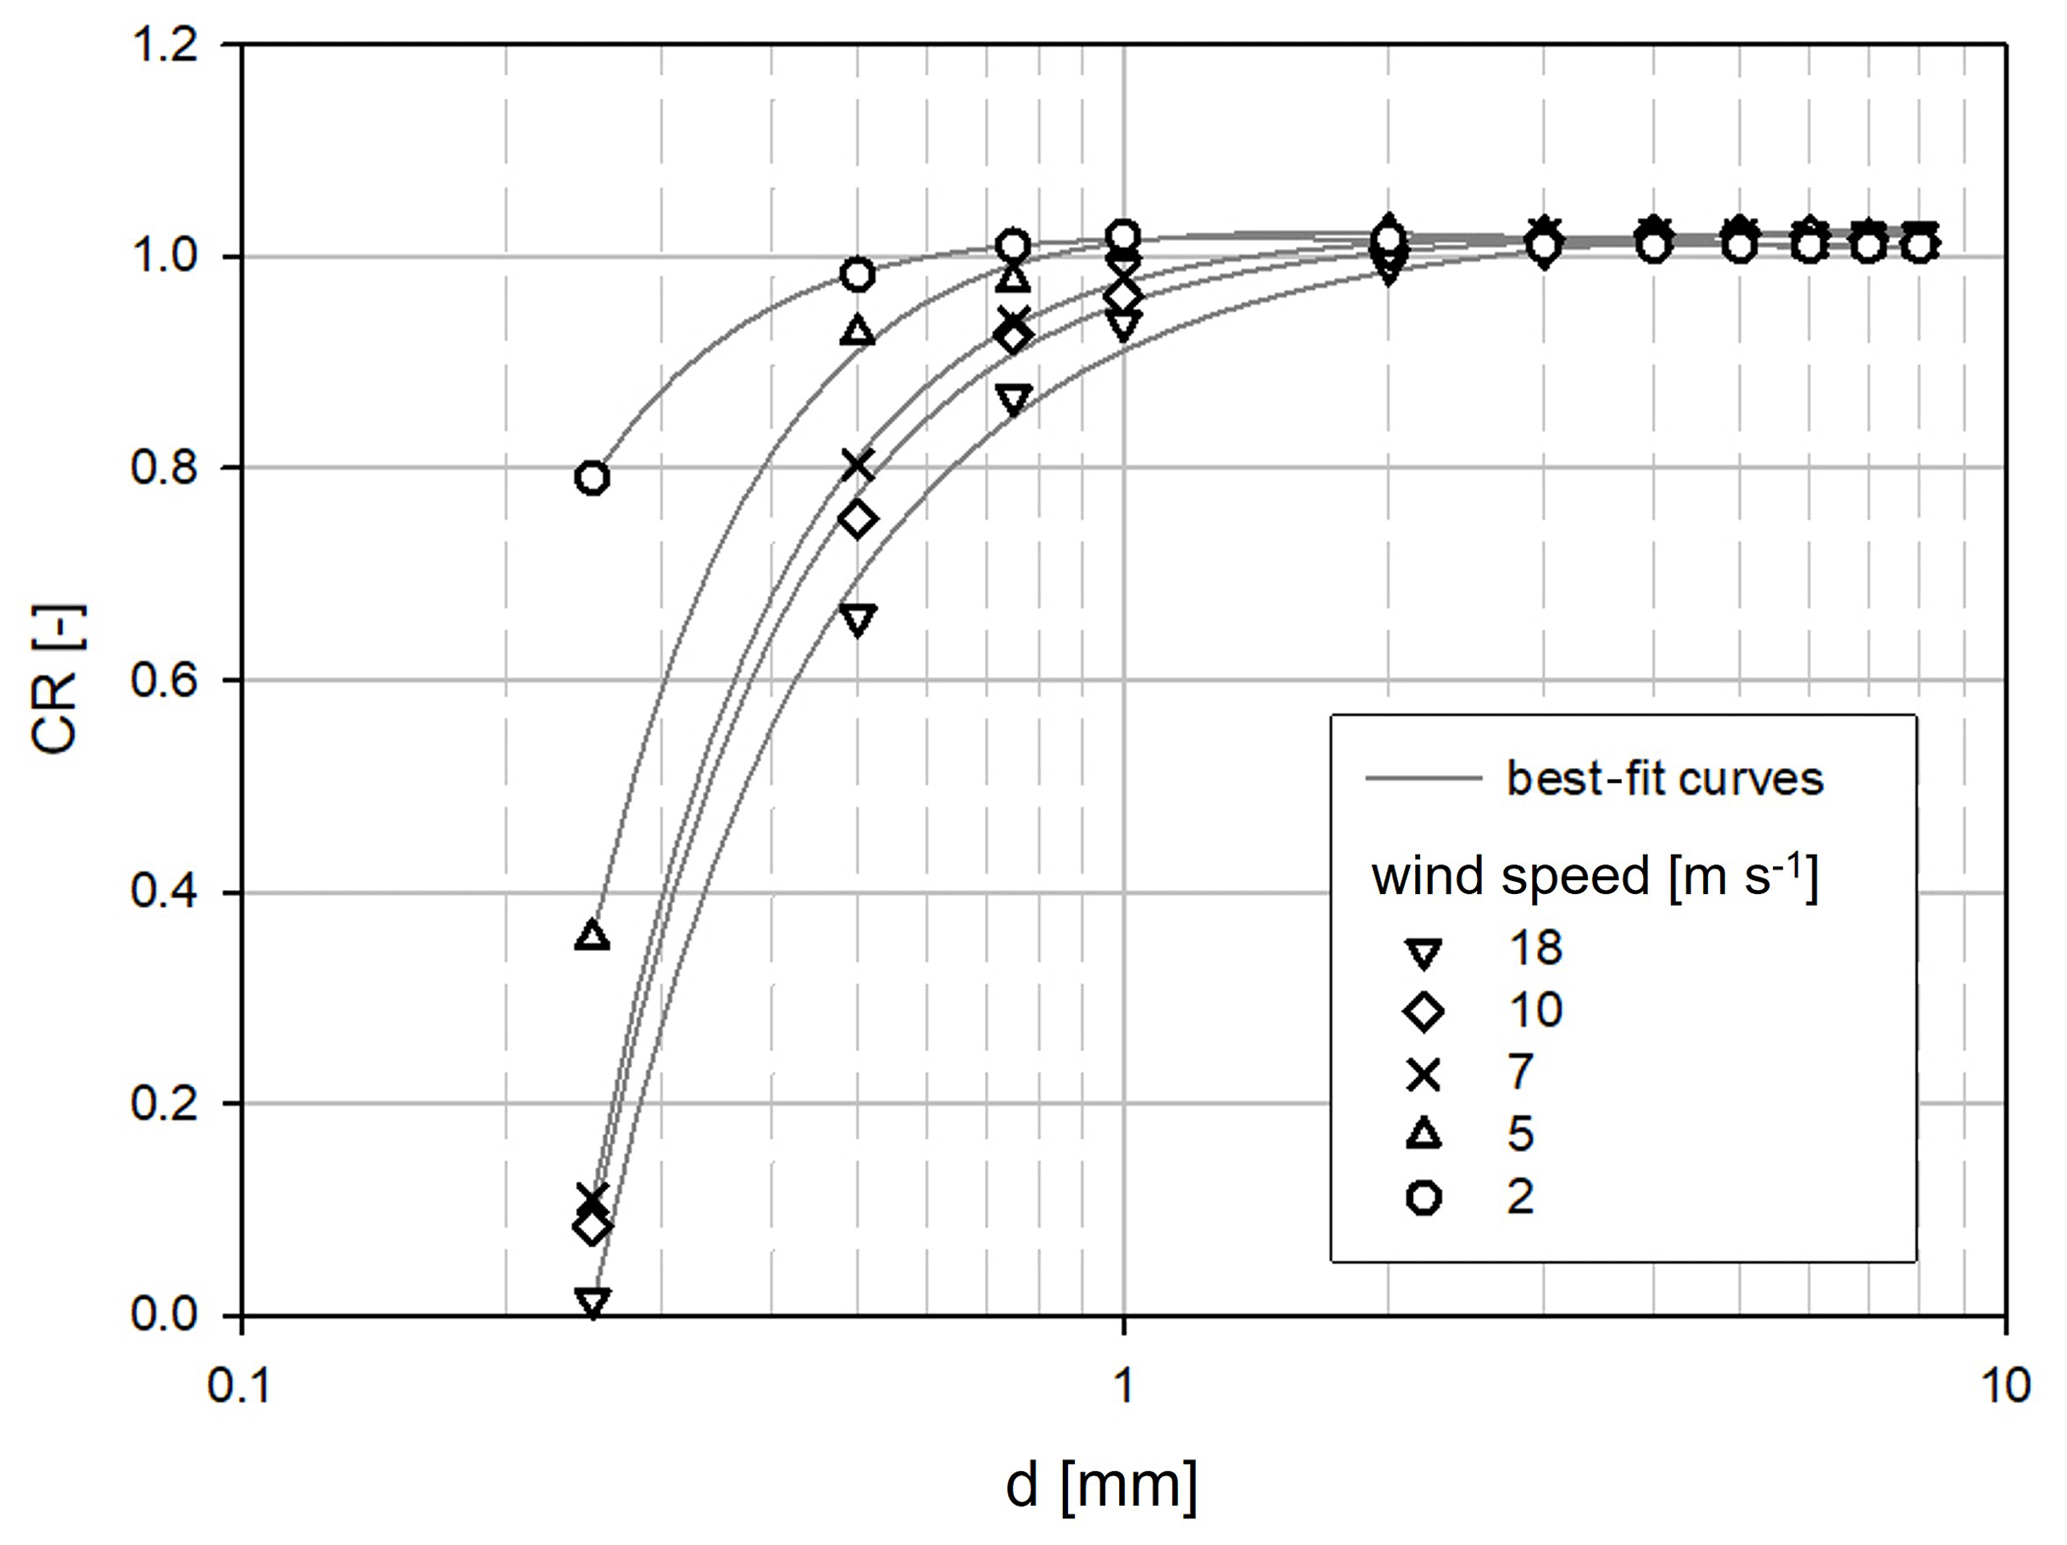
Figure 4Semi-logarithmic plot of the catch ratios (CRs) obtained from the CFD simulation by Cauteruccio and Lanza (2020) (indicated with markers) for a cylindrical gauge and the best-fit inverse polynomials for selected wind speed values (continuous lines) as a function of diameter (d).
The CR values collapse to unity when the drop diameter is above 2 mm since larger drops are quite insensitive to the aerodynamic behaviour of the instruments. Note, however, that for the case study later addressed in this work the percentage number and volumetric fractions of precipitation for the drop size range below 2 mm are about 99.7 % and 83.1 %, respectively, at an RI of 1 mm h−1, while they reduce to 98.9 % and 68.0 % at an RI of 275 mm h−1. The CR is therefore lower than unity for a relevant fraction of the liquid water content of the precipitation process.
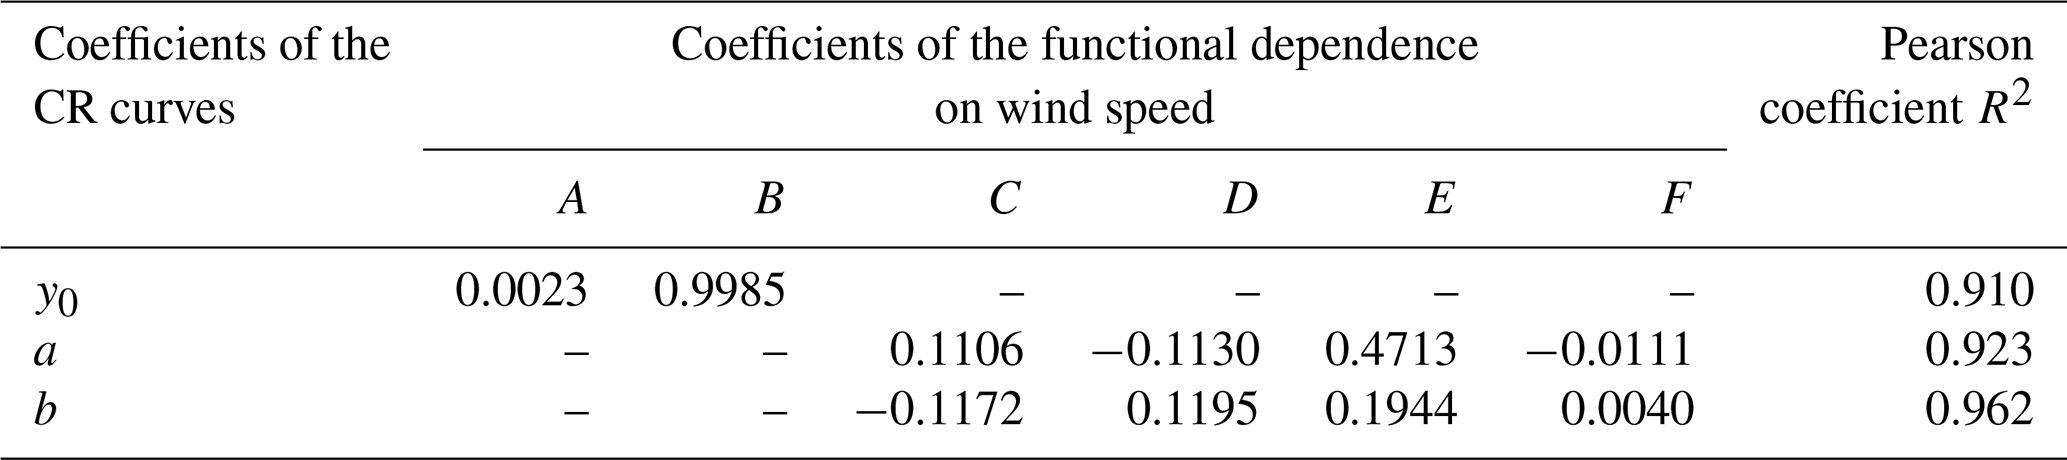
Here, to make the dependency on the drop diameter explicit, these results are fitted (with Pearson correlation coefficients between 0.997 and 1.0) using an inverse second-order polynomial (after imposing CR = 1 at Uref = 0) as follows:
where y0, a, and b are functions of the wind speed alone (curves are also included in Fig. 4). Specifically, y0 is a linear function of Uref, while a and b can be expressed using a combination of a linear and an exponential function of Uref in the following form:
The constants A–F are numerical best-fit coefficients. Their values are reported in Table 1 together with the associated Pearson coefficient for the linear, mixed linear, and exponential functions.
Table 1Numerical coefficients of the functional dependence of the CR curves on wind speed.
Note that this formulation is site independent since it is derived from numerical simulation results alone (by covering a wide range of wind speed and drop size values) and can be used for most cylindrical gauges employed worldwide, provided they have a similar outer shape to the one implemented in the simulation setup. On the contrary, the derivation of the CE curves requires knowledge of the DSD of precipitation events that occur under the specific climatology where rainfall measurements are taken (site-dependent information) and therefore the use of additional local measurements. In the next section, local measurements are used to derive the CE of the cylindrical gauge at the measurement site. Linking the DSD with the rainfall intensity is the method adopted here to derive the parameters of such a function when no disdrometers are available at the site for direct measurement. To ensure that the procedure proposed in this work can be exported to any measurement site where only a catching-type gauge is used (like most of the operational weather stations), we used the observed rainfall intensity as a surrogate for the DSD. In our study, however, direct DSD measurements are also available, although only for a limited period. Therefore, a relationship between the rainfall intensity and the DSD could be derived for use throughout the whole dataset.
The functional dependency of the CR derived in Eq. (3), with the associated coefficients expressed as a function of wind speed, is used in association with the exponential DSD, with parameters expressed as a function of RI (as obtained from the sample of selected rainfall periods), to numerically calculate the CE of the tipping-bucket rain gauge for use when no direct disdrometer measurements are available.
The calculation is performed for sampled RI values equal to 1, 3, 5, 10, 15, and 25–275 mm h−1 at increments of 25 mm h−1. A sigmoidal function is used to fit the numerical CE as a function of wind speed in the following form:
with ε0, m, x0, and n being the best-fit coefficients reflecting the dependency of the CE on RI.
A visual representation of the above exercise is reported in Fig. 5 for about 700 min of recorded precipitation with wind speeds higher than 2 m s−1, where each grey circle represents a 1 min numerical CE value. The size of each circle provides an indication of the associated RI value, with thin circles indicating light RI and exhibiting lower CE values at any wind speed than in the case of intense RI (large circles). Overlapped are the CE curves calculated for a few sample RI levels, including the maximum and minimum RI to enclose the entire range of measured data, and plotted over the whole wind speed range.
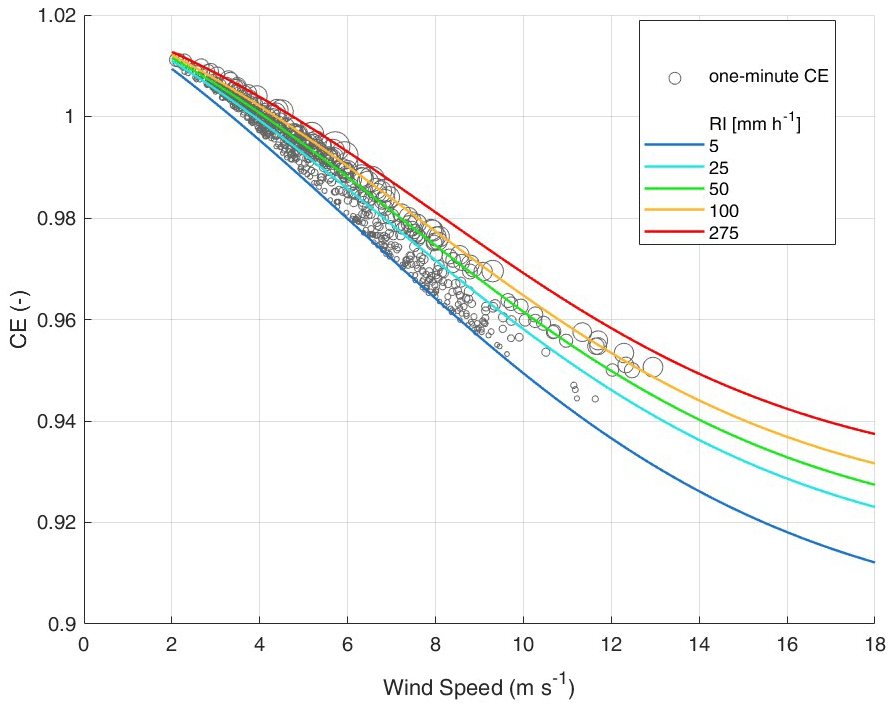
Figure 5Collection efficiency (CE) values (grey circles) as derived from 1 min DSD and wind speed measurements with overlapped CE curves (solid lines) at fixed rainfall intensity (RI) values and for the entire wind speed range. The size of each circle provides an indication of the magnitude of the associated RI value.
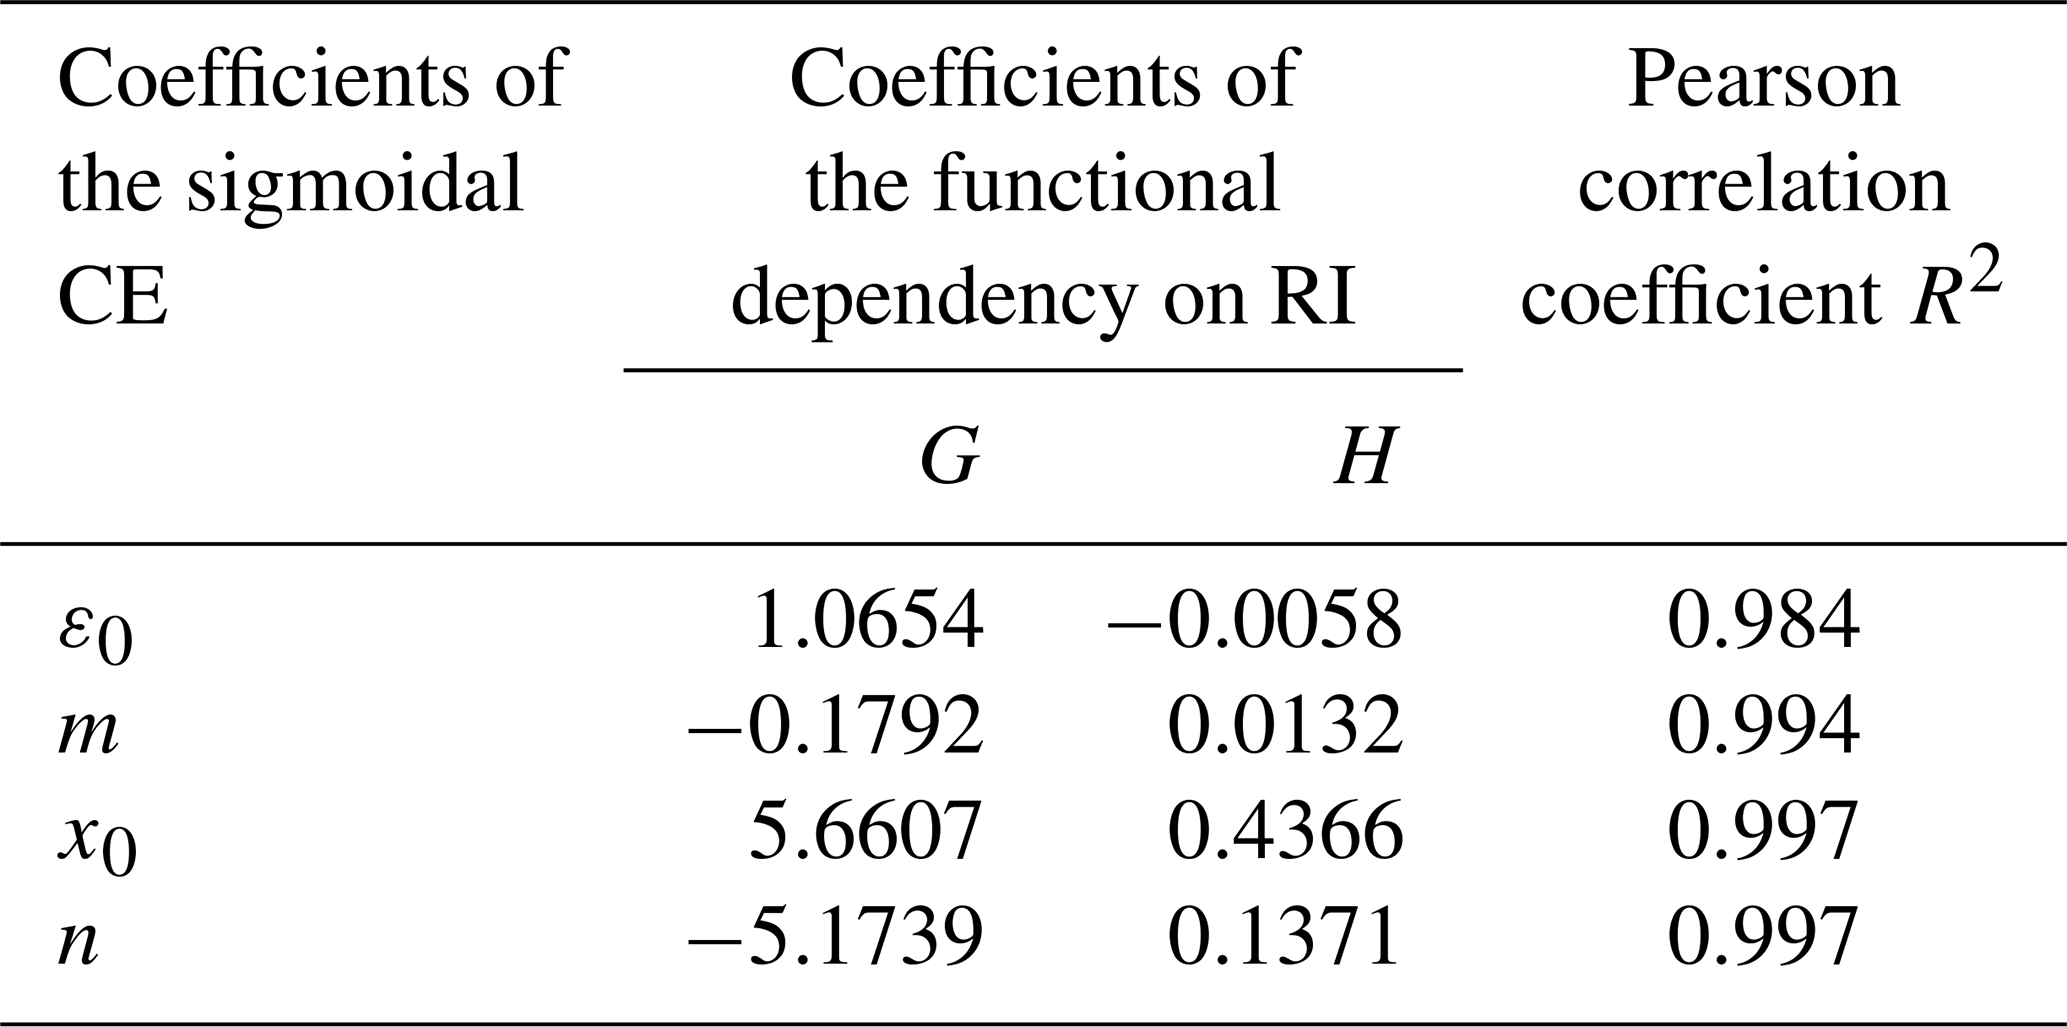
This functional dependency on RI can be described, for all sigmoidal coefficients, by a logarithmic function expressed as follows:
where f(RI) assumes the role of the functional dependency of the ε0, m, x0, and n coefficients. Numerical values of such parameters are reported in Table 2.
Table 2Numerical constants of the logarithmic functional dependency of the four coefficients of the sigmoidal CE curve on RI and the associated correlation coefficient (R2).
The best fit of the CE coefficients as a function of RI is shown in the panels of Fig. 6. An optimal trend with RI was observed since the Pearson coefficient (R2) assumes the minimum value equal to 0.984 in the case of ε0.
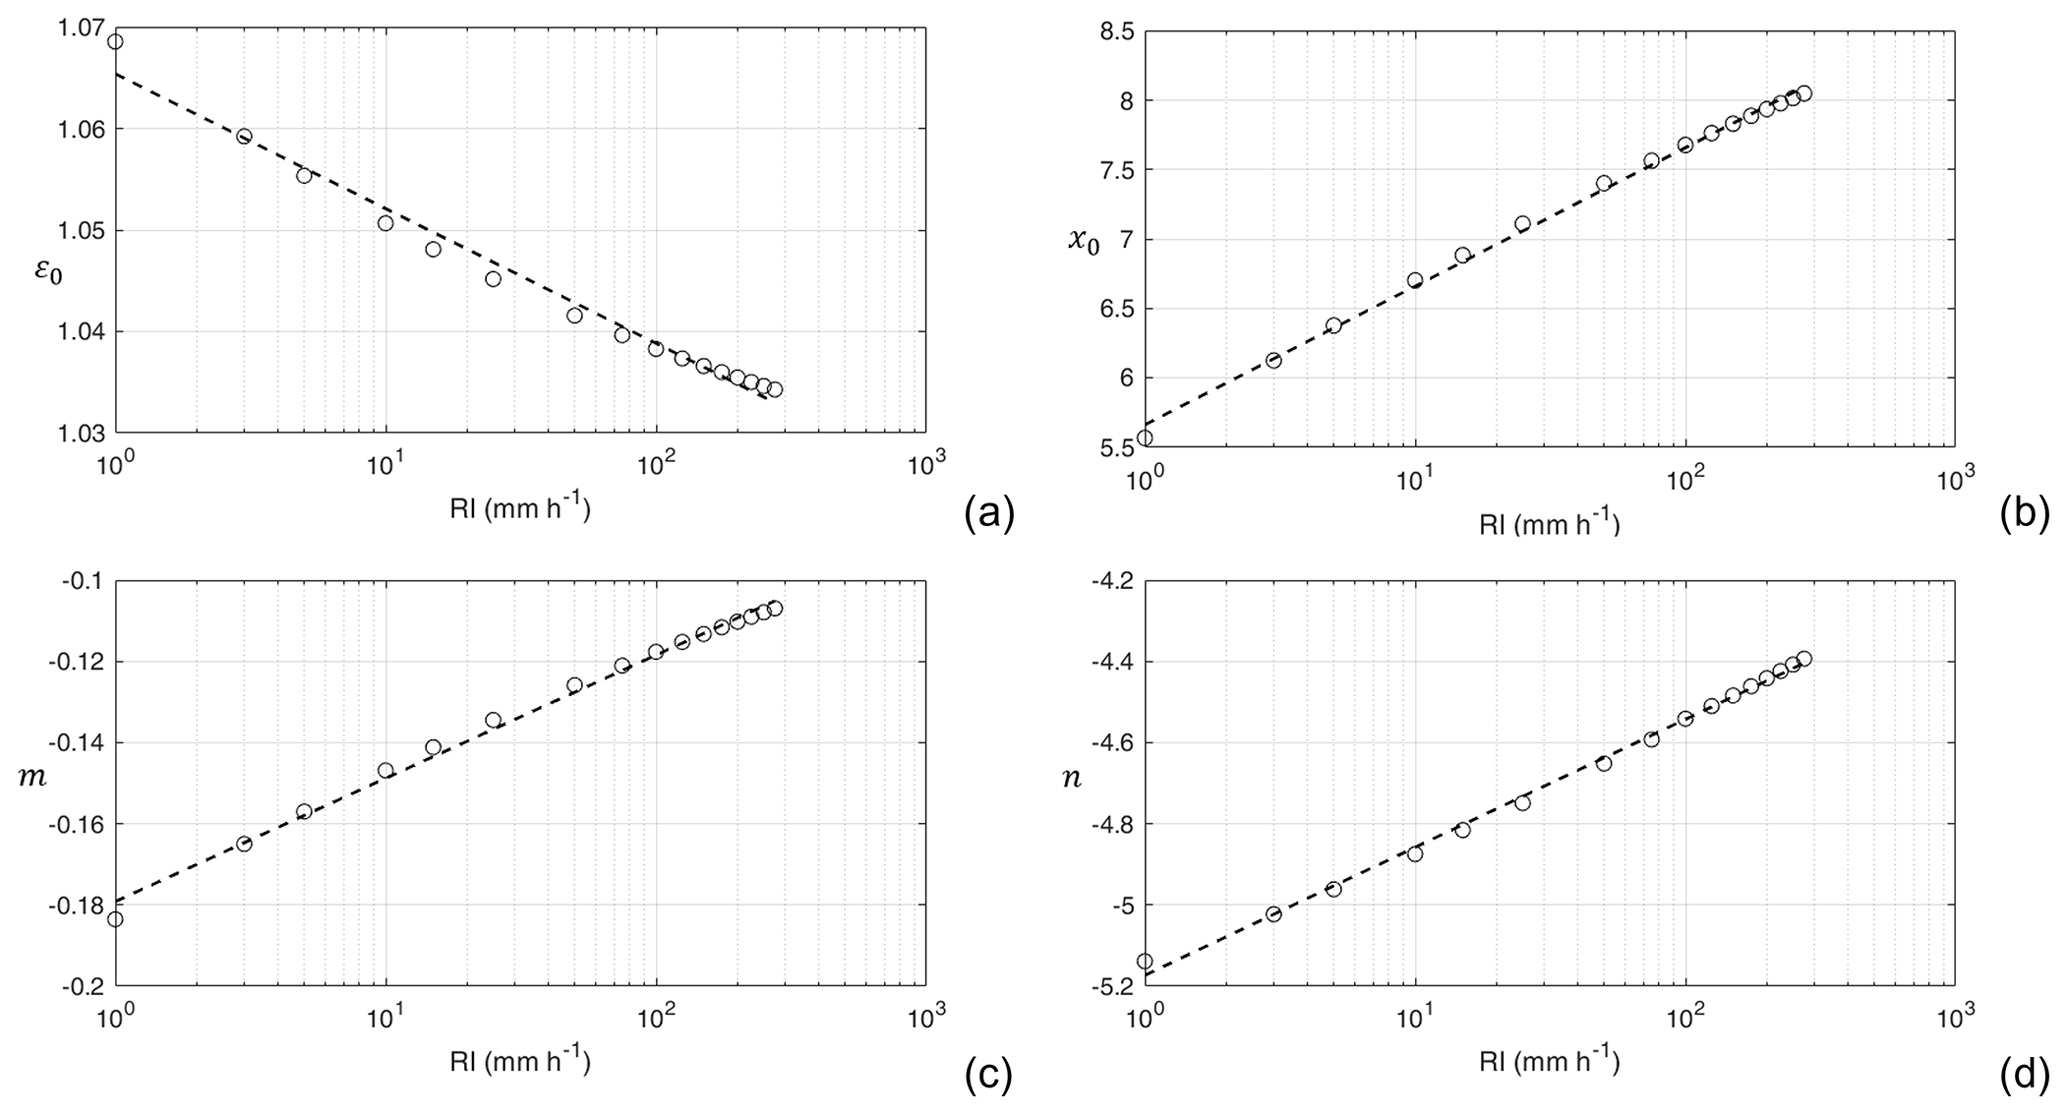
Figure 6Logarithmic best-fit functional dependency of the sigmoidal collection efficiency (CE) coefficients (ε0, x0, m, and n) – see Eq. (6) – on the rainfall intensity (RI).
The derived CE formulation is used to adjust 1 min RI measurements along a period of 4 years (2018–2021), with co-located wind speed measurements but in the absence of contemporary DSD data. Results of the adjustment for the whole period, expressed in terms of the applied CE, are visualised in Fig. 7 as a function of wind speed. The 1 min CE values (shown on the left-hand axis) are summarised in the form of boxplots. Results show that the predominant wind speeds are between 3 and 5 m s−1. The variability of the CE values for each wind speed class is coherent with the variability of the RI (illustrated in Fig. 3) and is not ascribable to the sample size.
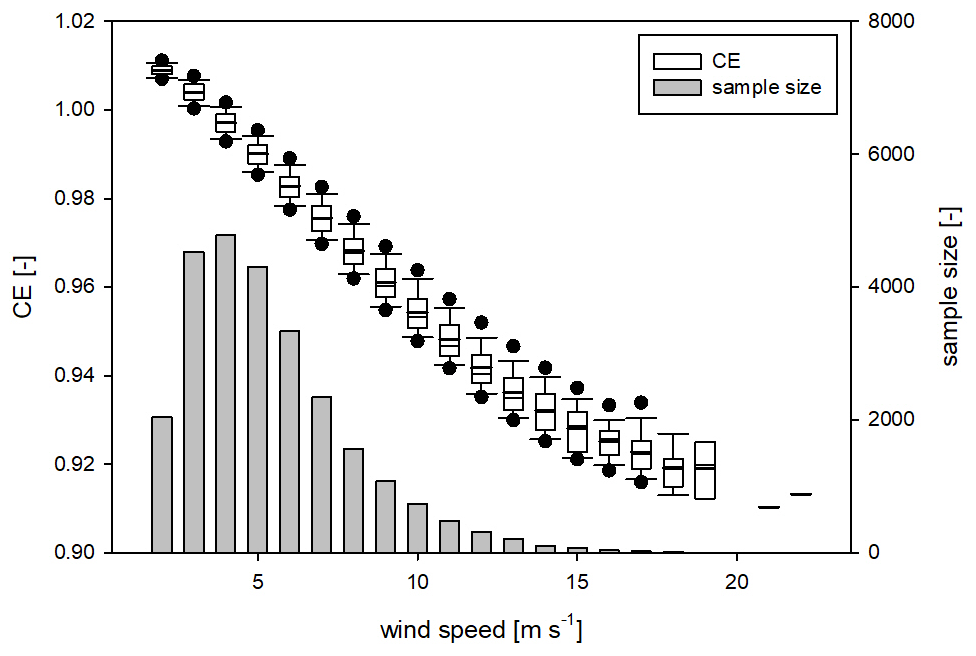
Figure 7The 1 min collection efficiency (CE) values (left-hand axis) for wind speed classes with a bin width equal to 1 m s−1. Boxes and whiskers encompass the central 50 % and 80 % of the dataset, respectively, while dots indicate the 5th and 95th percentiles of their non-parametric distribution. The mean and median values are depicted with the thick and thin horizontal lines, respectively. Grey bars indicate the sample size for each wind speed class (values on the right-hand axis).
For each minute, the complement to unity of the CE, i.e. the percentage relative bias, is also calculated in the following form:
where RImeas is the measured RI value, while RIcorr is the same variable after the adjustment.
In Fig. 8, the calculated relative bias (%) is visualised in the form of boxplots for the 4 investigated years individually and is compared with the associated non-parametric RI and wind speed distributions. Results reveal that most relative biases are lower than 3 %, whereas the maximum values reach about 10 %. The dependency of the relative bias on the wind speed is predominant since the occurrence of higher rainfall intensity values in 2020 and 2021 does not result in a reduction of the relative bias.
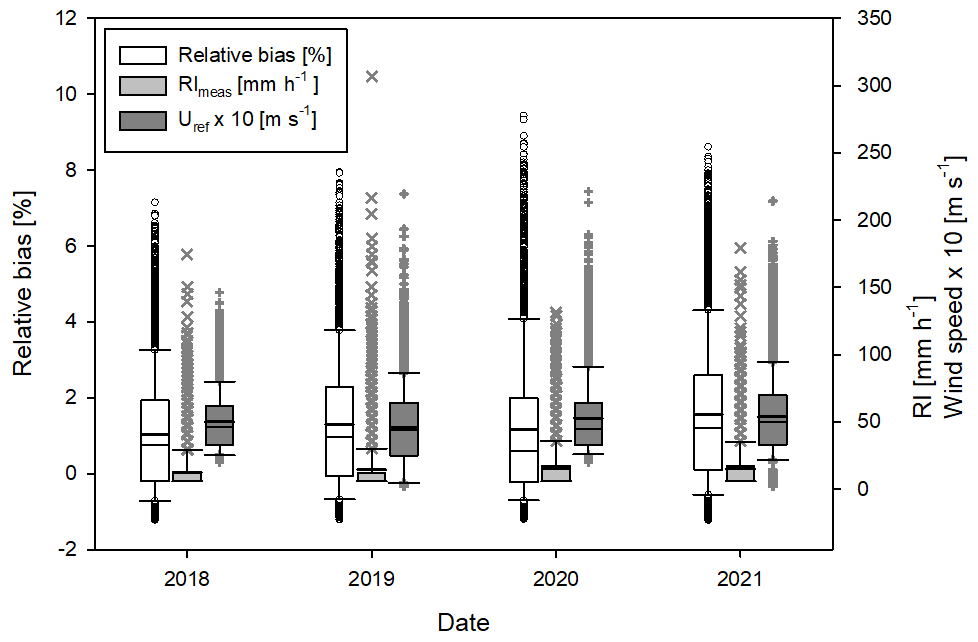
Figure 8Non-parametric distribution of the 1 min relative bias (%) (left-hand axis), measured rainfall intensity (RImeas), and wind speed (Uref) (right-hand axis) for the 4 investigated years individually. Boxes and whiskers encompass the central 50 % and 80 % of the dataset, respectively, while markers indicate values out of the 5th and 95th percentiles of their non-parametric distribution. The mean and median values are depicted with the thick and thin horizontal lines, respectively.
To overcome the wind-induced bias of traditional catching-type rain gauges, a suitable formulation of the CR as a function of the drop diameter (and the dependency of the coefficients of such a formulation on the wind speed) can be used to adjust precipitation intensity measurements from any specific instrument. Knowledge of the local DSD dependency on the RI, as obtained from a reference disdrometer, and high-resolution wind measurements are needed to derive dedicated CE functions that may be applied to adjust the raw measurements for any location and rain event characteristics. The proposed procedure is replicable in each site where contemporary rainfall intensity, wind speed, and DSD measurements are available, while the CE curves derived for the field test site of Hong Kong are applicable in all sites that have the same rainfall climatology (see e.g. Li et al., 2018; Shu et al., 2021).
Note that the reference disdrometer is subject to wind-induced biases itself, as demonstrated by Něspor et al. (2000) for a now outdated version of the 2DVD and by Chinchella et al. (2021) for the Thies Clima laser precipitation monitor (LPM) optical disdrometer. Further insights could therefore be achieved by obtaining bias-corrected DSD measurements, a topic which is not addressed in this paper. Once the wind-induced bias of DSD measurements from a 2DVD is quantified, corrected DSD measurements should be used to derive updated CE curves following the procedure proposed in the present work.
The mathematical formulation of the CR as a function of the drop diameter and the wind speed is obtained in this work by fitting numerical fluid-dynamic simulation results already available in the literature. The direct dependency of the sigmoidal form of the CE on the wind speed and the derived experimental relationship between its coefficients and RI streamline its practical application.
The use of the proposed method to apply corrections for the wind-induced bias of catching-type gauges is therefore straightforward and requires no further information than the measured rainfall intensity and the wind velocity (with no need to have a disdrometer operating at each measurement site). The described application to a 4-year dataset of co-located precipitation intensity and wind measurements at the resolution of 1 min demonstrates the feasibility of the proposed adjustment methodology.
Depending on the local rain and wind climatology, the correction may account for a significant portion of the annual rainfall amount. At the location chosen for the presented case study, due to the specific local climatology where strong wind is often associated with intense precipitation (dominated in volume by large drops with limited susceptibility to the aerodynamic behaviour of the instrument), in 80 % of the dataset adjustments are limited to 4 % of the observed RI values. This is equivalent to about 1.32 % of the measured yearly precipitation (totalling about 1550 mm). Although a small percentage, it sums up to 23×106 m3 of freshwater if computed over the 1100 km2 territory (land area only) of the Hong Kong special administrative region of the People's Republic of China. The adjustment therefore accounts for the storage capacity of the local Shek Pik reservoir, the third largest reservoir in terms of capacity within the Hong Kong water supply system. Such a significant amount of available freshwater resources would be missing from the calculated hydrological and water management budget of the region should the adjustments for the wind-induced bias of traditional precipitation measurements be neglected.
Adjustments calculated at other locations that have different precipitation and wind climatology compared to the presented case study may show different results, and further work is ongoing to compare the impact of the wind-induced bias in various sites where disdrometer data support a characterisation of the relationship between the DSD and RI.
The data used in this work are available on request from the corresponding author.
AC and LGL developed the methodology and conceptualisation. PWC selected and provided the data. AC and MS performed the investigation, data analysis, and visualisation. AC wrote the original draft of the paper. LGL reviewed and edited the paper and supervised the work. All the authors have read and agreed to the published version of the paper.
The contact author has declared that none of the authors has any competing interests.
Publisher's note: Copernicus Publications remains neutral with regard to jurisdictional claims in published maps and institutional affiliations.
This paper was edited by Wiebke Frey and reviewed by two anonymous referees.
Caracciolo, C., Porcù, F., and Prodi, F.: Precipitation classification at mid-latitudes in terms of drop size distribution parameters, Adv. Geosci., 16, 11–17, https://doi.org/10.5194/adgeo-16-11-2008, 2008.
Cauteruccio, A. and Lanza, L. G.: Parameterization of the collection efficiency of a cylindrical catching-type rain gauge based on rainfall intensity, Water, 12, 3431, https://doi.org/10.3390/w12123431, 2020.
Cauteruccio, A., Brambilla, E., Stagnaro, M., Lanza, L. G., and Rocchi, D.: Wind tunnel validation of a particle tracking model to evaluate the wind-induced bias of precipitation measurements, Water Resour. Res., 57, e2020WR028766, https://doi.org/10.1029/2020WR028766, 2021a.
Cauteruccio, A., Brambilla, E., Stagnaro, M., Lanza, L. G., and Rocchi, D.: Experimental evidence of the wind-induced bias of precipitation gauges using Particle Image Velocimetry and particle tracking in the wind tunnel. J. of Hydrol., 600, 126690. https://doi.org/10.1016/j.jhydrol.2021.126690, 2021b.
Cauteruccio, A., Chinchella, E., Stagnaro, M., and Lanza, L. G.: Snow particle collection efficiency and adjustment curves for the hotplate precipitation gauge, J. Hydrometeor., 22, 941–954, https://doi.org/10.1175/JHM-D-20-0149.1, 2021c.
Chinchella, E., Cauteruccio, A., Stagnaro, M., and Lanza, L. G.: Investigation of the wind-induced airflow pattern near the Thies LPM precipitation gauge, Sensors, 21, 4880, https://doi.org/10.3390/s21144880, 2021.
Colli, M., Lanza, L. G., Rasmussen, R., and Thériault, J. M.: The collection efficiency of shielded and unshielded precipitation gauges. Part I: CFD airflow modelling, J. Hydrometeor., 17, 231–243, https://doi.org/10.1175/JHM-D-15-0010.1, 2016a.
Colli, M., Lanza, L. G., Rasmussen, R., and Thériault, J. M.: The collection efficiency of unshielded precipitation gauges. Part II: Modeling particle trajectories, J. Hydrometeor., 17, 245–255, https://doi.org/10.1175/JHM-D-15-0011.1, 2016b.
Colli, M., Pollock, M., Stagnaro, M., Lanza, L. G., Dutton, M., and O'Connell, P. E.: A Computational Fluid-Dynamics assessment of the improved performance of aerodynamic raingauges, Water Resour. Res., 54, 779–796, https://doi.org/10.1002/2017WR020549, 2018.
Jevons, W. S.: On the deficiency of rain in an elevated raingauge, as caused by wind, The London, Edinburgh, and Dublin Philosophical Magazine and Journal of Science, 22, 421–433, 1861.
Kochendorfer, J., Rasmussen, R., Wolff, M., Baker, B., Hall, M. E., Meyers, T., Landolt, S., Jachcik, A., Isaksen, K., Brækkan, R., and Leeper, R.: The quantification and correction of wind-induced precipitation measurement errors, Hydrol. Earth Syst. Sci., 21, 1973–1989, https://doi.org/10.5194/hess-21-1973-2017, 2017.
Kruger, A. and Krajewski, W. F.: Two-dimensional video disdrometer: A description, J. Atmos. Ocean. Tech., 19, 602–617, https://doi.org/10.1175/1520-0426(2002)019<0602:TDVDAD>2.0.CO;2, 2002.
Lanza, L. G., Merlone, A., Cauteruccio, A., Chinchella, E., Stagnaro, M., Dobre, M., Garcia Izquierdo, M. C., Nielsen, J., Kjeldsen, H., Roulet, Y. A., Coppa, G., Musacchio, C., Bordianu, C., and Parrondo, M.: Calibration of non-catching precipitation measurement instruments: A review, Meteorol. Appl., 28, e2002, https://doi.org/10.1002/met.2002, 2021.
Leroux, N. R., Thériault, J. M., and Rasmussen, R.: Improvement of Snow gauge Collection Efficiency through a knowledge of Solid Precipitation Fall speed, J. Hydrometeor., 22, 997–1006, https://doi.org/10.1175/JHM-D-20-0147.1, 2021.
Li, X., Lau, N. C., and Lee, T. C.: An Observational Study of the Diurnal Variation of Precipitation over Hong Kong and the Underlying Processes, J. Appl. Meteorol. Clim., 57, 1385–1402, https://doi.org/10.1175/JAMC-D-17-0320.1, 2018.
Marshall, J. S. and Palmer, W. Mc K.: the distribution of raindrops with size, J. Meteorol., 5, 165–166, https://doi.org/10.1175/1520-0469(1948)005<0165:TDORWS>2.0.CO;2, 1948.
Meickle, H.: On the different quantities of rain collected in rain-gauges at different heights, Annals of Philosophy, 14, 312–313, 1819.
Něspor, V., Krajewski, W. F., and Kruger, A.: Wind-Induced Error of Raindrop Size Distribution Measurement Using a Two-Dimensional Video Disdrometer, J. Atmos. Ocean. Tech., 17, 1483–1492, https://doi.org/10.1175/1520-0426(2000)017<1483:WIEORS>2.0.CO;2, 2000.
Nešpor, V. and Sevruk, B.: Estimation of wind-induced error of rainfall gauge measurements using a numerical simulation, J. Atmos. Ocean. Tech., 16, 450–464, https://doi.org/10.1175/1520-0426(1999)016<0450:EOWIEO>2.0.CO;2, 1999.
Shu, Z., Chan, P. W., Li, Q., He, Y., and Yan, B.: Characterization of daily rainfall variability in Hong Kong: A nonlinear dynamic perspective, Int. J. Climatol., 41 (Suppl. 1), E2913–E2926, https://doi.org/10.1002/joc.6891, 2021.
Thériault, J. M., Rasmussen, R., Ikeda, K., and Landolt, S.: Dependence of snow gauge collection efficiency on snowflake characteristics, J. Appl. Meteorol. Clim., 51, 745–762, https://doi.org/10.1175/JAMC-D-11-0116.1, 2012.
Warnik, C. C.: Experiments with windshields for precipitation gages, Eos T. Am. Geophys. Un, 34, 379–388, https://doi.org/10.1029/TR034i003p00379, 1953.