the Creative Commons Attribution 4.0 License.
the Creative Commons Attribution 4.0 License.
 | 28 Sep 2023
Comment on “A universally applicable method of calculating confidence bands for ice nucleation spectra derived from droplet freezing experiments” by Fahy et al. (2022)
Gabor Vali
The analysis methods in Fahy et al. (2022) and their interpretation of experiments with water drops containing ice-nucleating particles raise some technical issues and prompt a discussion of the principles involved in the use of differential spectra.


Fahy et al. (2022, F22) delve into how best to derive ice nucleation spectra (spectra for short in the following) from drop-freezing experiments. Among other issues, alternative data processing methods are discussed, and a new method is presented for the calculation of confidence intervals. As the author of the paper that first introduced these spectra (Vali, 1971), I appreciate this development of the methods of analyses of the spectra. The results derived in F22 will undoubtedly prompt further advances in the understanding of freezing nucleation.
The purpose of this article is to show the difference in perspectives between that taken in F22 and that forming the basis of Vali (2071, 2019) for representing the results of freezing nucleation experiments. The impact of the data processing recommended in F22 is examined.
Helpful clarifications of the reasoning employed in F22 are given in Fahy and Sullivan (2023) and are incorporated into the discussion that follows. An even more detailed examination of minor points is in Vali (2023).
The point of departure in F22 consists of three elements: (1) k(T) should depict the underlying function representative of the activity of the ice-nucleating particles (INPs) studied, (2) given experimental results approximate that function, and (3) k(T) is continuous across the temperature range of the measurements. The first element arises from the desire to characterize INPs in a way that permits rigorous comparisons between experiments with different substances and different conditions. The second point is a direct consequence of limited sample sizes in any experiment, although that limitation is rapidly decreasing with progress in instrumentation and observational techniques. The main justifications for (3) is that experiments only sample from a probability distribution of potential nucleation temperatures for each INP and that nucleating sites can be active over a range of temperatures. To facilitate the discussion, this probability density function is designated as Psite(T).
The first point listed above is the perspective that differentiates the work in F22 from the perspective represented by analyses in Vali (1971, 2019) and many other earlier publications where the focus is on making k(T) the representation of the observed freezing temperatures in as concise a form as possible. What distinguishes these two perspectives is when and how analysis and interpretation of observations enter. With k(T) viewed as a representation of empirical data, interpretations follow data analysis with considerations of experimental uncertainties and other relevant knowledge. With the spectra viewed as depictions of the underlying function describing the activity of a sample, the data analysis combines measurement results with independent knowledge (assumption) of the random effects that affect sites and which are incorporated in Psite.
The section to follow discusses the issue of data representation with fixed or variable bin widths in temperature. Then, Psite is discussed in Sect. 4, and the question of continuity in k(T) is examined in Sect. 5.
Basically, the spectra represent the results of counting freezing events that occur at different temperatures as a sample is cooled gradually from above 0 ∘C until all sample drops are frozen or the cooing is stopped. For data representation purposes, the spectra equations can be viewed as summaries of the observations. Freezing temperatures of the drops are distinct events, and the differential spectra represent that discreteness as best as the data and sample size allow. Freezing events are precise temperature values (apart from instrumental errors). The temperature at which a given site initiates freezing is taken to be the characteristic temperature Tc of the active site. Further considerations (Sect. 4) extend this definition to a single realization from a distribution of temperatures about the characteristic temperature, but with a single experiment, the observed temperature is the best estimate available for Tc.
The differential spectrum is defined in Vali (1971) as
where N(T) is the number of drops not frozen1 at T, and dN is the number of drops freezing within the temperature interval dT as the sample is cooled past T. The dimension of k(T) is (cm−3 ∘C−1) or X=V. The use of differentials for dN and dT underscores the intention that k(T) reflects nucleation activity observed at T. This is an ideal that has to be abandoned for any finite sample size (total number of drops), so for practical use one has
with the interval within which the activity is observed expanded to ΔN and ΔT. The point is that the purpose of the differential spectrum is to focus on activity at specific temperatures. The choice of the magnitude of ΔT is driven by a consideration of the interplay between wanting to avoid too many intervals with no freezing events, the greater uncertainty that results from smaller ΔN and the desire for higher temperature resolution. In most of the literature the range of ΔT values is 0.2 to 1.0 ∘C, and it is kept constant throughout the range of freezing temperatures observed in an experiment.
More discussion about the choice of temperature interval is given in Sect. 4 of Vali (2019). In F22, to facilitate the application of a continuous function for k(T), variable bin widths are used. The interval width ΔT, for adjacent freezing events Ti, Tj and Tk, is determined as
for cases when one freezing event is observed at each temperature Ti, Tj and Tk. If more that one event is associated with these temperatures then weighing factors are assigned according to the number of events for the temperature. This latter case arises from limitations in the resolution of the temperature-measuring instrument of the data recording system. Such limitations constitute inherent binning of the data.
The use of the variable bin width resulting from Eq. (3) has two consequences. It can produce point-to-point jumps in k(T) (noise in a sense) (Petters, 2023), which are subsequently smoothed. More importantly, this method creates a value for k(Tj) that is dependent on its neighboring events Ti and Tk. This is undesirable if the intention is to have k(T) represent observed activity directly.
The effect arising with the use of variable bin widths can be elaborated on with the help of an example. A somewhat extreme case is chosen. Figure 1 shows a segment of the differential spectrum k(T) which is shown in its totality in Fig. 4 in Vali (2019). The blue squares indicate the spectrum with ΔT=0.3 ∘C. The heavy vertical bars in red show the same data with intervals chosen as in Eq. (3). For purposes of illustration, six events of the original data between −12.92 and −14.94 ∘C were removed, and the spectra were recalculated. The bar diagram shows the new values with ΔT=0.3 ∘C and the dark gray circles with Eq. (3). While the bar diagram and the blue squares remain in agreement, the two dark gray points on either side of the gap in freezing events show a large decrease. These are indicated by vertical arrows. The magnitude of the decrease is near a factor of 4 in both cases. The same lowering of data points near gaps in the spectrum with variable ΔT can be seen, albeit to lesser degrees, at temperatures near −16, −11.4 and −10.7 ∘C.
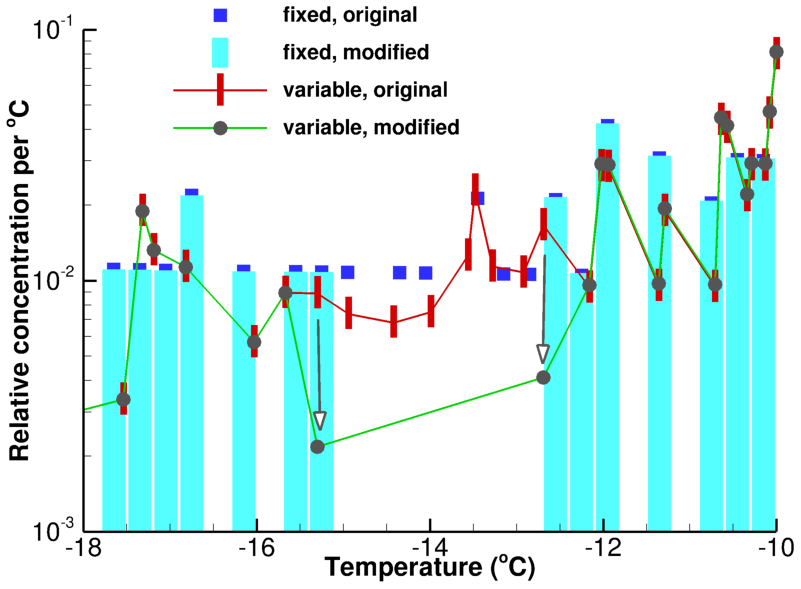
Figure 1A segment of the differential spectrum k(T) processed in four different ways. See the text for details.
The alteration of k(T) due to changes in neighboring freezing events is undesirable for concise data representation. Even though the effect is minor for data with freezing events closely spaced, there is a reasonable objection to the use of variable ΔT on the basis of principle. The fixed ΔT approach treats all data points equally across the range of observations.
All in all, the recommendation made in Vali (2019) for the use of fixed ΔT is repeated here with respect to concise data representation.
In the foregoing section, observed temperatures are taken as the best estimates of Tc, but it is also pointed out that random effects always make any observed freezing event vary with respect to the Tc value that would result from looking for the mode of a large number of repetitions. Those repetitions would lead to a distribution of a freezing event, designated as Psite. For historical reasons it may be worth noting that this distribution was defined by Vali and Stansbury (1966) as a nucleation rate P1(T,Tc) where Tc is the characteristic temperature associated with the site. The Psite distribution would be the observed frequency of freezing events resulting from the nucleation rate P1(T,Tc) per unit time.
Briefly, the fundamental reason for a degree of random variation in nucleation temperature on a site is the chaotic fluctuation of water molecules as they form and exit ice embryos. Theoretical estimates for the resulting Psite (for heterogeneous nucleation) are not reliable because of the unknown properties of sites. A direct attempt to obtain a quantitative estimate of Psite is given in Vali (2008, V08) along with the limitations of the validity of that estimate. In V08, Psite is assumed to be a Gaussian function with standard deviations of 0.2 and 0.42 ∘C for two different samples. From this, it was concluded that as a rough estimate observed freezing temperatures approximate Tc within about 1 ∘C. Other sources estimate this range to be larger.
For the analyses of F22, the specific form of Psite is not of importance, but the expected width of the function is. The overview presented here serves as the background to the discussion in the next section.
Considering an observed nucleation event in a drop as a sample drawn from the distribution Psite is fundamental in F22, and it is the basis for assuming k(T) to be a continuous function. In Sect. 3.1 of F22 it is argued that given INPs and sites have site nucleation rates that can yield freezing events over the “entire continuous temperature range”. The Gaussian form for Psite in V08 aids this argument. This is correct in the abstract, but the magnitude of that function is highly centered. Furthermore, as pointed out in Sect. 4, the form of Psite is not well known. The Gaussian in V08 was a convenient way to try to match prediction with observation. Future work may show a different result for Psite.
Focusing just on the spread of freezing temperatures resulting from Psite, in V08 a much narrower spread is postulated, while F22 takes the spread to be quite broad. This contrast is a sign of incomplete knowledge. Since an exact value is not needed for the analyses of F22, the focus here on uncertainty about Psite can be viewed as an alert for recognizing what elements are incorporated in the results given in F22. For the majority of cases, there will be no important consequences. In cases where there are large temperature gaps in the observed freezing temperatures of a set of drops, neglecting a Psite of narrow spread would lead to over-interpretation of the data in that gap using the variable bin widths and assuming continuity.
The use of fixed bin intervals does not exclude that k(T) be derived as a continuous algebraic function by smoothing and a curve fitting step. Whether an a priori assumption of continuity and the methods of F22 or the post hoc fitting of a function is preferred will vary with the objectives and styles of analysis.
F22 also make use of k(T) derived by differentiation of the cumulative spectrum K(T). If K(T) is a smoothed function or an algebraic fit then the effect of Psite is included, and hence the situation is as already discussed. If K(T) is formed by a summation of k(T) over discrete bins, the same considerations apply regarding the appropriateness of fixed or variable intervals as for k(T) (Sect. 3).
This article differentiates between wanting the differential spectrum to be a concise representation of data and wanting it to serve as a model that also takes into account random variability in nucleation temperatures. Examination of the differences that arise from the two perspectives led to looking more closely at what is known and what can be assumed about heterogeneous ice nucleation. In particular, the application of variable bin intervals in data processing was scrutinized and was shown to have disadvantages for data presentation but was useful for the analyses in F22.
This article, and the open discussion associated with it (Fahy and Sullivan, 2023; Petters, 2023; Vali, 2023) may be helpful to researchers using differential spectra to gain a clear understanding of the principles involved.
The routines used for producing Fig. 1 were written in IDL. The code is available from the author on request.
The data used here originate from work presented in Polen et al. (2018, https://doi.org/10.5194/amt-11-5315-2018). Data from one experiment were provided to the author by Ryan C. Sullivan. They are listed in Table 1 of Vali (2019, https://doi.org/10.5194/amt-12-1219-2019) and are archived under https://doi.org/10.15786/y5xr-pw35 (Vali, 2021).
The author has declared that there are no competing interests.
Publisher’s note: Copernicus Publications remains neutral with regard to jurisdictional claims in published maps and institutional affiliations.
This article benefitted greatly from the review process. The reviewer comments led to broadening the scope of the article and increased the depth of the conclusions. All the reviewers are thanked, with special acknowledgements for the contributions by Markus Petters, William D. Fahy and Ryan Sullivan.
This paper was edited by Mingjin Tang and reviewed by Ryan Sullivan, Markus Petters, and one anonymous referee.
Fahy, W. D. and Sullivan, R. C.: Referee Comment 3, Response to Comment on amt-2023-138, https://doi.org/10.5194/amt-2023-138-RC3, 2023
Fahy, W. D., Shalizi, C. R., and Sullivan, R. C.: A universally applicable method of calculating confidence bands for ice nucleation spectra derived from droplet freezing experiments, Atmos. Meas. Tech., 15, 6819–6836, https://doi.org/10.5194/amt-15-6819-2022, 2022.
Petters, M.: Referee Comment 2, Comment on amt-2023-138, https://doi.org/10.5194/amt-2023-138-RC2, 2023.
Polen, M., Brubaker, T., Somers, J., and Sullivan, R. C.: Cleaning up our water: reducing interferences from nonhomogeneous freezing of “pure” water in droplet freezing assays of ice-nucleating particles, Atmos. Meas. Tech., 11, 5315–5334, https://doi.org/10.5194/amt-11-5315-2018, 2018.
Vali, G.: Quantitative Evaluation of Experimental Results an the Heterogeneous Freezing Nucleation of Supercooled Liquids, J. Atmos. Sci., 28, 402–409, https://doi.org/10.1175/1520-0469(1971)028<0402:QEOERA>2.0.CO;2, 1971.
Vali, G.: Repeatability and randomness in heterogeneous freezing nucleation, Atmos. Chem. Phys., 8, 5017–5031, https://doi.org/10.5194/acp-8-5017-2008, 2008.
Vali, G.: Revisiting the differential freezing nucleus spectra derived from drop-freezing experiments: methods of calculation, applications, and confidence limits, Atmos. Meas. Tech., 12, 1219–1231, https://doi.org/10.5194/amt-12-1219-2019, 2019.
Vali, G.: Data used in the publication “Revisiting the differential freezing nucleus spectra derived from drop freezing experiments; methods of calculation, applications and confidence limits”, University of Wyoming [data set], https://doi.org/10.15786/y5xr-pw35, 2021.
Vali, G.: Author Comment 3, Reply on RC3, https://doi.org/10.5194/amt-2023-138-AC3, 2023.
Vali, G. and Stansbury, E. J.: Time dependent characteristics of the heterogeneous nucleation of ice, Can. J. Phys., 44, 477–502, https://doi.org/10.1139/p66-044, 1966.
F22 has an error in Sect. 2, defining N as the number already frozen.