the Creative Commons Attribution 4.0 License.
the Creative Commons Attribution 4.0 License.
 | 05 Oct 2023
Comparison of temperature-dependent calibration methods of an instrument to measure OH and HO2 radicals using laser-induced fluorescence spectroscopy
Frank A. F. Winiberg
William J. Warman
Charlotte A. Brumby
Graham Boustead
Iustinian G. Bejan
Thomas H. Speak
Dwayne E. Heard
Daniel Stone
Laser-induced fluorescence (LIF) spectroscopy has been widely applied to fieldwork measurements of OH radicals and HO2, following conversion to OH, over a wide variety of conditions, on different platforms and in simulation chambers. Conventional calibration of HOx (OH + HO2) instruments has mainly relied on a single method, generating known concentrations of HOx from H2O vapour photolysis in a flow of zero air impinging just outside the sample inlet (. [HOx], where is the observed signal and is the calibration factor). The fluorescence assay by gaseous expansion (FAGE) apparatus designed for HOx measurements in the Highly Instrumented Reactor for Atmospheric Chemistry (HIRAC) at the University of Leeds has been used to examine the sensitivity of FAGE to external gas temperatures (266–348 K).
The conventional calibration methods give the temperature dependence of COH (relative to the value at 293 K) of (0.0059±0.0015) K−1 and of (0.014±0.013) K−1. Errors are 2σ. COH was also determined by observing the decay of hydrocarbons (typically cyclohexane) caused by OH reactions giving COH (again, relative to the value at 293 K) of (0.0038±0.0007) K−1. Additionally, was determined based on the second-order kinetics of HO2 recombination with the temperature dependence of , relative to 293 K being (0.0064±0.0034) K−1.
The temperature dependence of depends on the HOx number density, quenching, the relative population of the probed OH rotational level and HOx transmission from the inlet to the detection axis. The first three terms can be calculated and, in combination with the measured values of , show that HOx transmission increases with temperature. Comparisons with other instruments and the implications of this work are discussed.
- Article
(1006 KB) - Full-text XML
-
Supplement
(1348 KB) - BibTeX
- EndNote


The hydroxyl radical (OH) plays a key role in our atmosphere, oxidising a broad range of species. OH is the main daytime oxidant in the troposphere and the main sink for methane, a potent greenhouse gas. The OH radical is linked to the HO2 radical through the oxidation of most other non-methane hydrocarbons (NMHCs) and CO in the troposphere and, through reaction with NO2, in the upper troposphere/lower stratosphere. Due to the high reactivity of OH (lifetime ∼1 s even in clean air), these radicals undergo minimal transport, and local concentrations depend only on the in situ chemistry. Measurements of HOx concentrations, in conjunction with measurements of their sources and sinks, are a sensitive test of chemical models. Accurate measurement of [HOx] is therefore paramount, not only for field measurements (Stone et al., 2012; Heard and Pilling, 2003; Gligorovski et al., 2015), but also for atmospheric simulation chambers where instruments have been deployed (Karl et al., 2004; Glowacki et al., 2007).
Sensitive detection techniques with high temporal resolution are required for HOx detection, and techniques have been reviewed in Stone et al. (2012) and Wang et al. (2021). Fluorescence assay by gaseous expansion (FAGE) (e.g. Hard et al., 1984) is the most common method used for both field and chamber studies. Here, the sample is expanded to low pressures, and OH is detected by resonance fluorescence at ∼308 nm. The low pressures are required to temporally separate fluorescence from the excitation laser pulse. HO2 is converted to OH by reaction with NO and is detected in a separate cell. Both techniques require calibration which is conventionally based on the generation of OH and HO2 from water vapour photolysis at 185 nm at atmospheric temperature and pressure.
Recent studies have demonstrated potential interferences for measurements of both OH and HO2 radicals using the FAGE technique, with the magnitude dependent upon instrument design (Mao et al., 2012; Novelli et al., 2014, 2017; Fuchs et al., 2011, 2016; Whalley et al., 2013; Fittschen et al., 2019). Considerable effort has been made to minimise, understand and mitigate any interference, with many groups now fitting an external OH scavenger injector to measure OH concentrations using an alternative background signal, OHCHEM, alongside the conventional method of measuring OH using a background signal determined by tuning the laser wavelength off-resonant to the transition, OHWAVE (Woodward-Massey et al., 2020; Novelli et al., 2014; Mao et al., 2012). Intercomparison campaigns (e.g. Schlosser et al., 2009; Onel et al., 2017a) in the controlled environment of an atmospheric chamber are useful to identify systematic errors in different approaches, but if both methods require calibration, the accuracy of the measurements is still compromised by uncertainties in the calibration methods.
In an earlier paper (Winiberg et al., 2015), accurate calibration of a FAGE instrument over a range of external inlet pressures (440–1000 mbar) was performed in the Leeds Highly Instrumented Reactor for Atmospheric Chemistry (HIRAC) (Glowacki et al., 2007)) chamber. The instrument sensitivity to OH and HO2 agreed well for the conventional water vapour calibration method (where the external pressure is always 1 bar, and external pressure effects were simulated by altering the pressure in the FAGE detection cell) and alternative methods based on the temporal decay of a hydrocarbon (for OH) or the temporal decay of HO2 via its second-order self-reaction (for HO2) over an external pressure range of 300–1000 mbar. For OH, the calibration factor, COH (where . [HOx] and is the FAGE signal), increased by 17 %, and for HO2 a slightly greater increase in of 32 % was determined as the pressure increased from 350 to 1000 mbar. There was good agreement between the absolute values and their pressure dependence for both calibration methods. Such comparisons are particularly relevant to aircraft operation where external pressures will vary considerably during the flight or for evacuable chambers such as the Leeds HIRAC chamber which can operate from 50–1000 mbar. Marno et al. (2020) have also developed the All Pressure Altitude-based Calibrator of HOx Experimentation (APACHE) to allow calibration of their FAGE instrument HydrOxyl Radical measurement Unit based on fluorescence Spectroscopy (HORUS) as a function of pressure but not temperature.
Little is known about the effect of gas temperature at the inlet on instrument sensitivity for laser-induced fluorescence (LIF) instruments, despite field instruments being used at temperature extremes, from day to night and from deserts to the polar regions, as well as in aircraft, where temperatures change rapidly with altitude. Additionally, ambient conditions influence not only the inlet temperature, but also the whole apparatus. For example in the FAGE system associated with HIRAC, based on a design for aircraft use (Commane et al., 2010), the whole inlet tube (∼30 cm) is located inside the HIRAC chamber, and so wall loss rates of HOx in the inlet tube will be influenced by the temperature of the HIRAC chamber. The long inlet is required either to locate the pinhole outside of the aircraft for the airborne instrument or to allow sampling across the diameter of the HIRAC chamber. To date, the only study investigating the effect of inlet temperature on instrument sensitivity to HOx radicals has been performed by Regelin et al. (2013), who reported a minor positive dependence of the OH sensitivity (COH) as a function of decreasing inlet temperature for the HORUS instrument (possibly due to a cooling effect on the instrumentation). There was a more marked decrease in the instrument sensitivity to HO2 with decreasing temperature, most probably due to enhanced wall losses at lower temperatures.
In this paper, instrument sensitivity as a function of external inlet temperature has been determined for the HIRAC FAGE instrument for both OH and HO2, using the water vapour photolysis calibration method in an external flow tube (termed “conventional method”) and alternative calibration methods using chemical reactions in the HIRAC chamber (Winiberg et al., 2015) at varying temperatures. Alternative OH calibrations used the inferred [OH] from the measured decay of a hydrocarbon (HC), typically cyclohexane, reacting with OH (Reaction R1) (termed “HC decay method”). The rate of loss of HC is then given by Eq. (1).
In Eq. (1), kbi is the well-established literature value for the bimolecular rate coefficient between OH and the monitored hydrocarbon, and can be measured from the HC time series so that [OH] is the only unknown parameter and can be calculated and compared with the [OH] predicted via the conventional calibration method.
HO2 was also calibrated by monitoring the HO2 kinetic decay during the recombination following generation by HCHO photolysis in the presence of O2 (termed “HO2 self-reaction method”).
The time dependence of the [HO2] in the second-order decay depends on the initial concentration of HO2 allowing for calibration.
2.1 The HIRAC chamber
The alternative calibration methods of monitoring hydrocarbon or HO2 decays were conducted in HIRAC using very similar methods and conditions as described in Winiberg et al. (2015). HIRAC is a stainless steel chamber with a total volume of 2.25 m3 and can operate over a wide range of pressures (50–1000 mbar) and temperatures (227–343 K). Multiple access ports are available to connect an array of instrumentation and monitoring equipment (pressure gauges, thermocouples etc.). The chamber has previously been described in detail in Glowacki et al. (2007), Malkin et al. (2010) and Bejan et al. (2018). More recently a temperature control system was installed to further enhance the capabilities of the HIRAC chamber (Sect. 2.1.1). Details on the temperature characteristics of HIRAC can be found in Sect. S1 of the Supplement.
The photolysis lamps, housed in eight quartz tubes mounted radially inside the reactive volume, were used to initiate photochemistry. The lamps were interchangeable depending on the target molecules; lamps, with primary emissions centred at 254 and 310 nm (GE Optica, GE55T8/HO and Philips, TL40W/12 RS, respectively), were used for the alternative OH and HO2 calibration methods, respectively (Sect. 3.2 and 3.3). The housings were flushed with dry N2 (∼ 3 slm per housing) to help regulate the temperature and remove photolabile species and water, which could condense or freeze around the lamps at lower temperatures. A photolysis-lamp-induced chamber temperature increase of ∼ 2–5 K was seen over the course of a typical experiment (< 40 min), but this variation was reduced if the chamber was temperature controlled. Temperatures were monitored using a series of K-type thermocouples that were inside the lamp housings (one per lamp) and that were distributed around the inside of the chamber. Thermocouples were placed strategically to allow the temperature to be measured close to the chamber walls, inlets and flanges as well as in the chamber.
2.1.1 Temperature control system
During manufacture, square cross-section steel tubing (volume ∼ 50 L) was welded directly to the outer skin of HIRAC, allowing a cooling/heating liquid to flow around the chamber, controlling the temperature inside. The square tubing enabled the temperature control liquid to transfer heat more efficiently to the chamber by offering a larger contact surface area compared to cylindrical tubing. A Huber thermostat unit (model 690W) was used to circulate ∼ 60 L of thermofluid (Huber DW-Therm, 183–473 K) around the chamber. Further details are given in the Supplement (Sect. S1).
HIRAC was able to sustain a steady temperature (±2 K) across the chamber at any temperature between 227 and 343 K, and example temperature profiles are given in the Supplement. A negligible temperature gradient (<0.5 K; see Fig. S2) was observed across the central portion of the chamber, in both the horizontal and vertical axes. Close to the walls of the chamber, however, a change of ∼ 1 K was observed. The flanges around the HIRAC chamber were insulated with ∼ 40 mm of neoprene; however there was no direct temperature control of the flanges or access ports, which was likely responsible for the change in temperature at the large 600 mm access flanges.
2.1.2 HOx instrumentation
The OH and HO2 radicals were detected using a FAGE instrument based in the HIRAC chamber with a 5 kHz pulse repetition frequency (PRF) laser light source, as described in Winiberg et al. (2015, 2016) and Glowacki et al. (2007). Air was sampled at ∼6 slm through a 1.0 mm diameter pinhole nozzle and was passed down the inlet (length 280 mm, 50 mm diameter) into the OH detection axis maintained at low pressure (typically ∼ 3.85 mbar) using a high-capacity rotary-backed root blower pumping system (Leybold, Trivac D40B and Ruvac WAU 251). The long inlet was used to draw a sample away from the chamber walls where radical losses increase (a maximum of 15 % decrease at <10 mm from the chamber wall) and to probe any radical gradients occurring due to spatially inhomogeneous production (Winiberg et al., 2015). The FAGE instrument was coupled to the HIRAC chamber using ISO-K 160 flanges, ensuring the pinhole is kept >200 mm from the chamber walls.
Concentrations of HO2 were measured simultaneously in a second detection axis ∼ 300 mm downstream of the OH detection axis. High-purity NO (BOC, N2.5 nitric oxide) was added ∼ 20 mm before the HO2 detection axis into the centre of the FAGE cell in the direction of gas flow through 1/8′′ stainless steel tubing at a rate of 5 sccm (Brooks 5850S) converting HO2 to OH. Conversion of some types of RO2 radicals (in particular β-hydroxyperoxy radicals) to OH upon reaction with NO has been reported in other FAGE instruments (Whalley et al., 2013; Fuchs et al., 2011). However, during the alternative HO2 calibrations (based on HCHO photolysis) presented here, no β-hydroxyperoxy radicals were generated; hence any interference was assumed to be negligible.
A JDSU Nd:YAG pumped Sirah Cobra Stretch system (PRF = 5 kHz) was used to generate the frequency-doubled ∼ 308 nm (307.99 nm to excite the Q1(2) rotational state) light for the fluorescence of OH radicals. Light was directed from the output of the laser and focussed into fibre optic cables (10 m, Oz Optics) which were then attached directly to the FAGE cell arms via collimators (Oz Optics). Fluctuations in laser power were accounted for using a linear response UV-sensitive photodiode (UDT-555UV, Laser Components UK) at the exit arm of the OH and HO2 detection axes to normalise the LIF signal. The laser system provided between 5–7 and 2–3 mW of 308 nm light to the OH and HO2 detection axes, respectively.
The OH fluorescence was collected orthogonal to the gas flow onto electronically gated channeltron photomultiplier tubes (CPMs; PerkinElmer, C943P) via a series of imaging lenses and a narrow bandpass filter (Barr Associates, 308.8±5.0 nm). A spherical concave back reflector was positioned underneath the cell, opposite the detection optics, to optimise light collection onto the CPM. To avoid detector saturation, the CPM was gated (i.e. switched off) for the duration of the laser pulse using a modified gating unit based on the original design by Creasey et al. (1997a). Signals from the CPM were analysed using PC-based photon-counting cards (Becker and Hickl, PMS-400A).
2.1.3 Other instrumentation
As with the previously published work (Winiberg et al., 2015), a chemiluminescence NOx analyser (TEC 42C, limit of detection = 50 pptv at 60 s averaging) was used to determine that levels of NOx (NO + NO2) in the HIRAC chamber were typically below the detection limit of the apparatus.
Most of the OH calibration experiments using the hydrocarbon decay method were performed monitoring HC decays using a chemical ionisation time-of-flight mass spectrometer (Kore custom build) operating with N ionisation. Gas was sampled from HIRAC via ∼ 7 m of 1/8′′ Teflon tubing with the inlet being located close (within 70 cm) to the FAGE inlet. The majority of the experiments were carried out with cyclohexane as the HC (monitored at ), although other compounds were used. The mass spectrometer signal was calibrated by introducing known HC concentrations into HIRAC. An example of the resulting calibration plot can be found in the Supplement (Sect. S2, Fig. S3).
2.2 General chamber preparation
Calibration experiments were conducted at 1000 mbar in an ultra-high-purity (UHP) 1:4 synthetic air mix of O2 (BOC, zero-grade, >99.999 %) and N2 (BOC, zero-grade, >99.998 %) to match the range of pressures from the water vapour calibration method (Sect. 3.1). Thorough mixing of reaction mixtures within HIRAC was achieved in ≤70 s by four circulation fans mounted in pairs at each end of the chamber. The chamber was evacuated to ∼ 0.05 mbar for ∼ 60–120 min following each experiment using the rotary-backed root blower pump to ensure removal of all reactants/products. The combined sampling rate of ∼ 9 slm from the chamber required a counter flow of synthetic air to maintain the desired pressure and resulted in a first-order dilution term of (4.5±0.2) × 10−5 s−1. The dilution flow was regulated using two Brooks mass flow controllers (N2 and O2), and the dilution was taken into account in all analyses.
2.3 Chemical reagents
Known concentrations of precursors (except H2O2) and reagents were introduced to the chamber in the vapour phase through a 0.97 L stainless steel delivery vessel. Hydrogen peroxide (50 wt % solution, Merck, used as supplied) was directly injected via a syringe. Multiple injections could be made in each run to ensure a wide range of [OH] was covered.
For the hydrocarbon-based OH calibration method, cyclohexane (99 %, Fisher Scientific), methylcyclohexane (> 99.9 %, Sigma Aldrich) and heptane (99 %, Fisher Scientific) were purified using freeze–pump–thaw cycles before being introduced into the HIRAC chamber.
For the second-order HO2 calibration method, formaldehyde (HCHO) was produced in the gas phase by gently heating paraformaldehyde (99.9 %, Sigma Aldrich) into the evacuated delivery vessel. This method was sufficient for producing the 2–3 ppmv concentrations of HCHO in the HIRAC chamber that were required.
3.1 Flow tube/water photolysis calibration method
The flow tube calibration method relies on the photolysis of H2O vapour at 184.9 nm in a fast flow (40 slm) of synthetic air. A mercury pen-ray lamp (LOT-Oriel, Hg–Ar) was used as the photolysis source, placed at the end of a square cross-section flow tube ( mm). Air was humidified by passing a fraction of the bulk air flow through a bubbler containing deionised water. The [H2O] was measured using a dew-point hygrometer (CR-4, Buck Research Instrument) prior to the flow tube, and the resulting OH and HO2 concentrations from photolysis can be calculated from Eq. (E2):
where is the known absorption cross-section of H2O vapour at 184.9 nm ((7.22±0.22) cm2 molecule−1 (Cantrell et al., 1997; Creasey et al., 2000; Hofzumahaus et al., 1997)), ΦOH ( = 1) is the photodissociation quantum yield of OH and HO2 (Fuchs et al., 2011), F184.9 nm is the photon flux of 184.9 nm light, and Δt is the exposure time of the air to the Hg lamp output. The exposure time of the air to the 184.9 nm light, Δt, was calculated as a function of the known velocity of the air and the cross-section of the photolysis region. The product F184.9 nm ×Δt was determined for lamp supply currents between 0.2 and 3.0 mA using the N2O actinometry method described in detail in a number of publications (Edwards et al., 2003; Heard and Pilling, 2003; Faloona et al., 2004; Whalley et al., 2007; Glowacki et al., 2007).
The gas output from the flow tube was directed towards the FAGE sampling inlet, where the overfill of the FAGE sample volume from the flow tube stopped the impingement of ambient air. A range of HOx concentrations (108–1010 molecule cm−3) were produced by changing the mercury lamp photon flux whilst keeping a constant [H2O] (typically 2000–3000 ppmv). The average calculated [HOx] values are compared to their concurrent signals observed during the same time period, the linear regression of which gives the instrument sensitivity to . A typical calibration plot is shown in Fig. 1. Potential systematic errors in the flow tube calibration method have been discussed previously (Winiberg et al. 2015) and are summarised for the current instrument in Table 4 and discussed further in the Supplement, Sect. S3, which also contains a schematic of the flow tube calibration apparatus (Fig. S4).
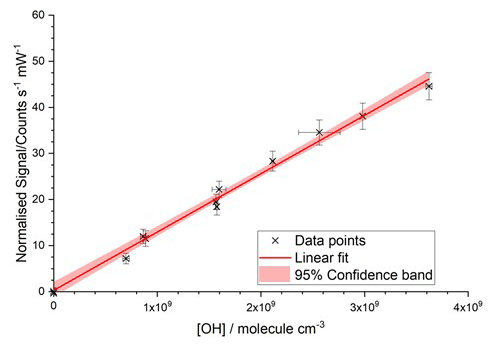
Figure 1Typical room temperature calibration plot from the conventional water photolysis flow tube method. The total flow rate was 40 slm, with [H2O] = 1600 ppmv; the laser power was 9.65 mW; and the OH cell was at a pressure of 2.6 Torr. The gradient was (1.266±0.034) counts s−1 mW−1 cm3 molecule−1, and the intercept was 0.28±0.74 counts s−1 mW−1. Errors are 2σ.
Calibration for external inlet temperature
The FAGE inlet was wrapped with 1/4′′ copper tubing (∼ 5 cm between coils) and was covered in two layers of aluminium foil to aid thermal contact. A final layer of 10 mm thick neoprene was added to the outside of the foil to aid insulation. The Huber temperature control unit was used to flow DW-Therm thermofluid through the tubing to vary the temperature of the inlet. Temperatures were monitored externally using three K-type thermocouples – two positioned on the inlet and one on the conical pinhole nozzle during the calibration procedure (see Fig. 2a).
Calibrations were conducted at five external inlet temperatures from 263–343 K, representative of the operating temperature range for the HIRAC chamber. During the bulk of the experiments, gases from the flow tube calibration source were maintained at room temperature. However, an additional range of calibration experiments were performed with flow tube gas maintained to within ±5 K of the measured external inlet temperature. This effect was achieved by passing the humidified bulk flow through a 2 m long coil of 1/4′′ copper tubing held at the desired set point using a thermostat-controlled water bath (Thermo Fisher Science). The [H2O]vap was determined just before the calibration flow tube, with the temperature monitored both before and at the exit of the flow tube. Short gas lines were used between the water bath and the flow tube, which was covered in a thin layer of neoprene to insulate and reduce temperature gradients.
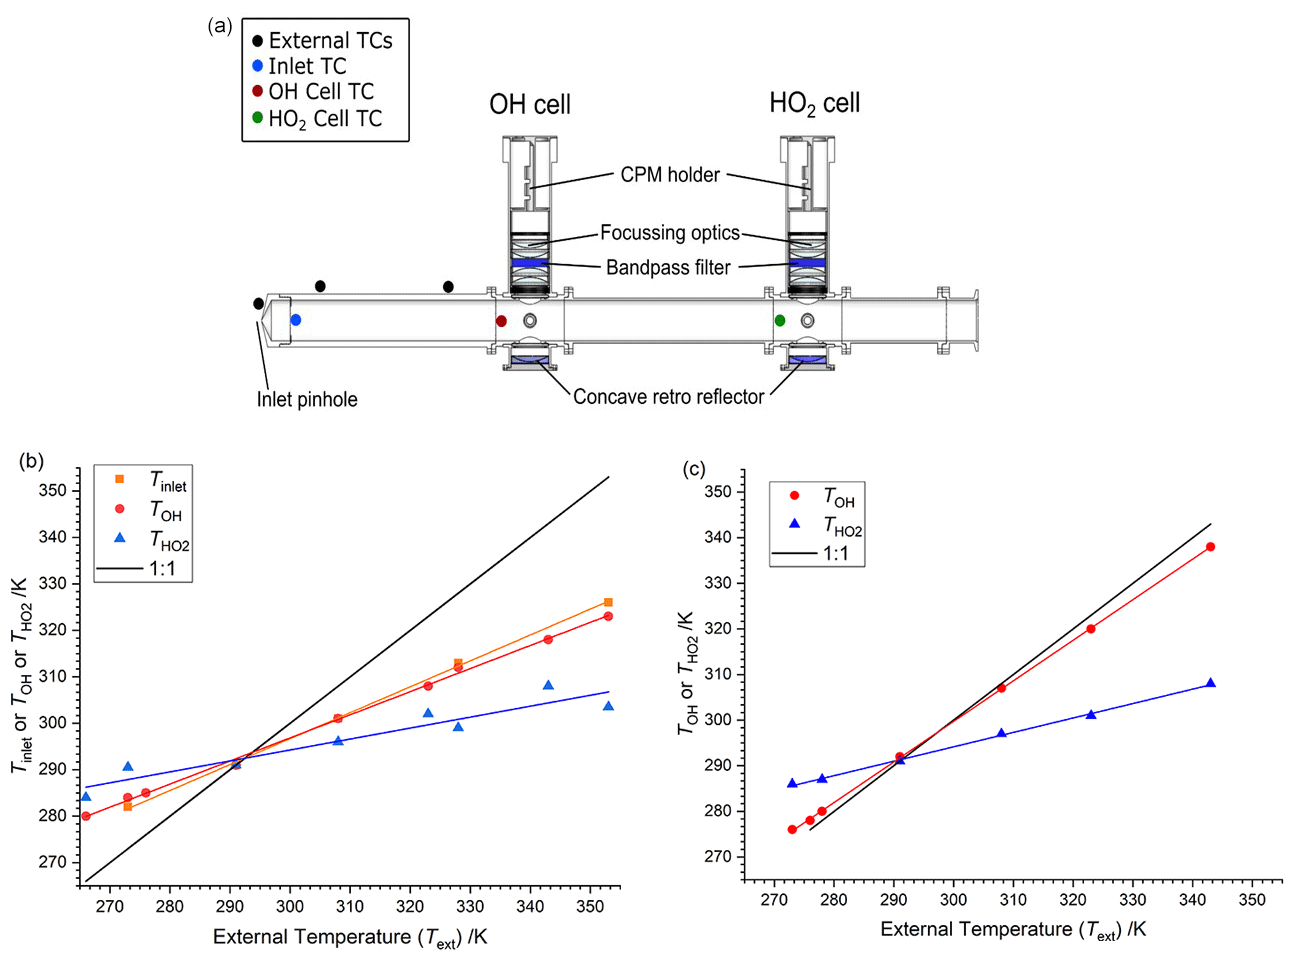
Figure 2(a) Schematic of FAGE cell showing locations of thermocouples. (b) Internal cell temperatures (TOH or and inlet temperatures (Tinlet) plotted as a function of the external temperature (Text) when sampling air at 293 K from the calibration flow tube. Slope Tinlet is 0.558±0.010, slope TOH is 0.497±0.008 and slope is 0.236±0.033. (c) Internal temperatures as a function of the external temperature when sampling temperature-controlled air from the calibration flow tube. Slope TOH is 0.890±0.004; slope is 0.316±0.007 (sampling from the HIRAC chamber gave lines with essentially the same gradients).
Prior to the calibration, the internal cell temperatures were measured using three K-type thermocouples positioned in the centre of the gas flow inside the inlet (just after the inlet pinhole) and OH and HO2 fluorescence cells, details of which are discussed in the results section (Sect. 4.1.1). The thermocouples were inserted into the cell using a 1/4′′ compression fitting port with a seal; this allowed the cell to be operated at normal operating pressure during the temperature profile measurements. Thermocouples were held in place temporarily using electrical tape, and calibrations were not performed with the thermocouples in place.
3.2 Hydrocarbon decay method
The majority of the hydrocarbon decay OH measurements were made with cyclohexane as the monitored hydrocarbon (HC) (monitored via the peak) and hydrogen peroxide photolysis at 254 nm as the OH source.
The principle of the hydrocarbon decay method is outlined in the Introduction; the rate of loss of the HC by OH is given by Eq. (1). The rate coefficient for cyclohexane, c-C6H12, has received much attention in the literature over the 273–343 K temperature range used in this study, and so we use the IUPAC-recommended rate expression (Atkinson et al., 2006):
The calculated [OH] from the hydrocarbon decay can be compared to the corresponding FAGE signal, corrected for the difference in [H2O] used in the calibration and that present in the HIRAC chamber, to determine the COH. In practice, the total HC decay is a combination of reaction with OH and other first-order loss processes, primarily dilution (as sampled gas is replenished with air). Therefore,
where k1st represents the rate coefficient for the sum of all non-OH first-order loss processes (e.g. heterogeneous loss and dilution). Gradients were obtained from analysis within the Origin software package. A second-order polynomial was fitted to 10–40 points (with the separation of each point being 10 s); the number of points depending on the rate of change of the [HC] and the data points were smoothed via the method of Savitzky and Golay (1964).
k1st was determined from the HC decays in the absence of OH (either with no lamps on or with no OH precursor present). For each injection of HC (typical initial concentration of 3–5×10¹³ molecule cm−3) there were multiple H2O2 injections (∼ 1 mL). FAGE measurements were typically averaged over 30 s (30 data points, with each data point corresponding to accumulated signal over ∼ 1 s) to counteract the noise arising in fluorescence counts. During rapid changes in the observed signal, for example immediately after initial photolysis of hydrogen peroxide in the chamber (see Fig. 3a), a reduced averaging period was used. The HIRAC FAGE system shows a slight sensitivity to water vapour concentrations due to quenching (Winiberg, 2014). Minor corrections (< 5 %) were made to account for the different water vapour concentrations in the two calibration methods.
Figure 3a shows a typical time series of OH with the black line giving the [OH] derived from the mass spectrometer measurements and the brown line giving [OH] derived from the FAGE signal and converted to [OH] using the conventional flow tube water vapour photolysis calibration at 293 K. Figure 3b shows the resulting scatterplot. The slope of the scatterplot gives the correction to be applied to C293 K from the conventional calibration to match the [OH] derived from the mass spectrometric measurements.
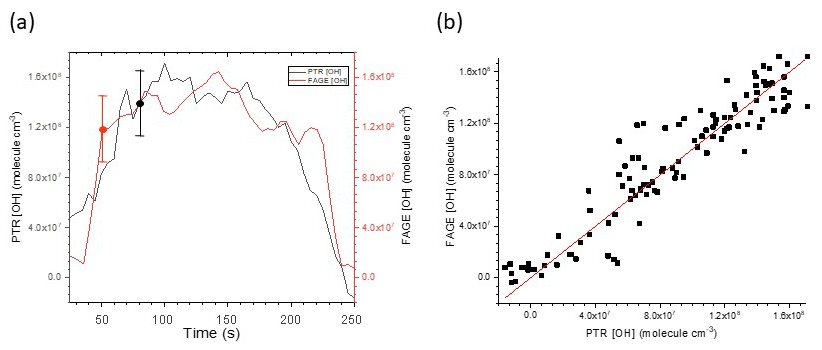
Figure 3(a) Time series of [OH] derived from FAGE measurements and from mass spectrometric measurements of cyclohexane removal recorded following H2O2 photolysis at 293 K and 1000 mbar air. The error bars shown represent absolute uncertainties in the calibration methods; see Table 4. (b) Resultant scatterplot where the gradient 0.998±0.016 (2σ) gives Crel for the FAGE apparatus at 293 K for this experiment. The average gradient at 293 K is 1.034±0.0068 from five experiments.
3.3 Calibration of HO2 detection via HO2 recombination kinetics
The HCHO photolysis/HO2 recombination kinetic method of HO2 cell calibration was used as described in Winiberg et al. (2015). Formaldehyde was introduced into a flow of nitrogen into the chamber (containing synthetic air at 1000 mbar) at concentrations of molecule cm−3. The chamber was irradiated (lamps: Philips TL40W/12 RS), resulting in an almost instantaneous HO2 signal (Reactions R2–R4). Once a steady-state HO2 concentration was achieved, the photolysis lamps were turned off, and the decay of HO2 was monitored by FAGE for ∼120 s (Fig. 4). The decay of HO2 was primarily controlled by the self-reaction (R5), but there was a small first-order contribution from loss to the walls (Reaction R6). The measurement of HO2 decays was repeated up to six times before the laser wavelength was scanned to the offline position.
The chamber mixing fans were used for the first three calibration decays, representative of a typical experimental homogeneous gas mixture. The second series of three calibration decays was conducted without the mixing fans to probe the HO2 recombination and wall loss kinetics in the absence of effective mixing.
When the fans are on, the loss of HO2 was characterised by bimolecular self-reactions and a first-order wall loss parameter. The solution to this mixed order decay is given by
where ( and ( are the HO2 signal at time t, and t= 0, respectively; ( is the instrument sensitivity; is the HO2 recombination rate coefficient; and kloss represents the wall loss parameter. Both kloss and were determined by data fitting the decay using equation (E5) with a Levenberg–Marquardt non-linear least-squares algorithm, fixing the initial signal and . The first ∼ 100 s of data was used, ensuring analysis after an almost complete decay of . Figure 4 shows an example of a typical decay and the resulting fit to Eq. (E5).
For the experimental temperature range (275–345 K), has values between (2.00–2.85) × 10−12 cm3 molecule−1 s−1 according to the recommendation given by IUPAC (2007). The chamber was operated under dry conditions (<10 ppmv [H2O]vap), and so the enhancement of by formation of a pre-reactive complex with H2O was ignored for these analyses. The wall loss rate, kloss, was dependent on daily chamber conditions and was therefore determined as part of the fitting procedure along with , typically between 0.032–0.073 s−1 with an uncertainty of ±10 % (2σ). Without the fans, the value of kloss was reduced, but agreement between the HO2 calibration methods was comparable (within 10 %). As HIRAC is generally operated with fans on, we have only reported these data. Wall loss typically contributes 10 %–50 % of the initial decay but is well defined in the fitting procedure. As with OH detection, minor corrections have been made for the slightly different sensitivities of the system under the different water concentrations of the two calibration methods (Winiberg, 2014).
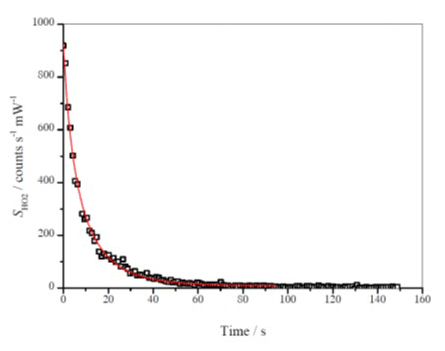
Figure 4Typical HO2 decay recorded at 293 K and 1000 mbar air. The red line is the fit to the data from Eq. (E5) giving = (4.17±1.66) counts cm3 molecule−1 mW−1 s−1.
4.1 Conventional calibration method
4.1.1 Temperature profiles in the FAGE instrument
Temperatures within the FAGE instrument as a function of external temperatures are shown in Fig. 2b and c and are tabulated in Table 1. For Fig. 2b and the first part of Table 1, the temperatures were recorded with FAGE sampling air at 293 K from the calibration flow tube as the FAGE inlet was cooled or heated. Temperatures became closer to ambient (293 K) from the inlet (Tinlet) to the OH observation cell (TOH) and finally to the HO2 observation cell (. In Fig. 2c and the second part of Table 1, the sampled air (either from the calibration flow tube or from HIRAC) matched the external temperature of the inlet tube. For these experiments, there was no thermocouple located inside the inlet to give Tinlet. The temperature in the OH cell was very close to the external temperature of the sampled air. The transmission process through the FAGE inlet following sampling through the pinhole should be similar to when FAGE is in HIRAC; however, even with the temperature-controlled air in the wand calibration, it is still difficult to determine the actual temperature and conditions at the pinhole itself.
The gap between the OH and HO2 cells means that the sampled air was closer to ambient room temperatures when reaching the HO2 cell. HO2 was predominantly exposed to a temperature environment similar to that for OH as it passed through the inlet, which may influence wall loss rates. The variation in TOH and relative to room temperature under different calibration regimes means that care has to be taken in comparing values, as a number of processes within FAGE are temperature dependent. Nevertheless, the different calibration methods do yield important insights into the processes in the FAGE apparatus.
Table 1Temperatures in the FAGE instrument with (a) constant-temperature (293 K) calibration gas and (b) with calibration gas at the external temperature.
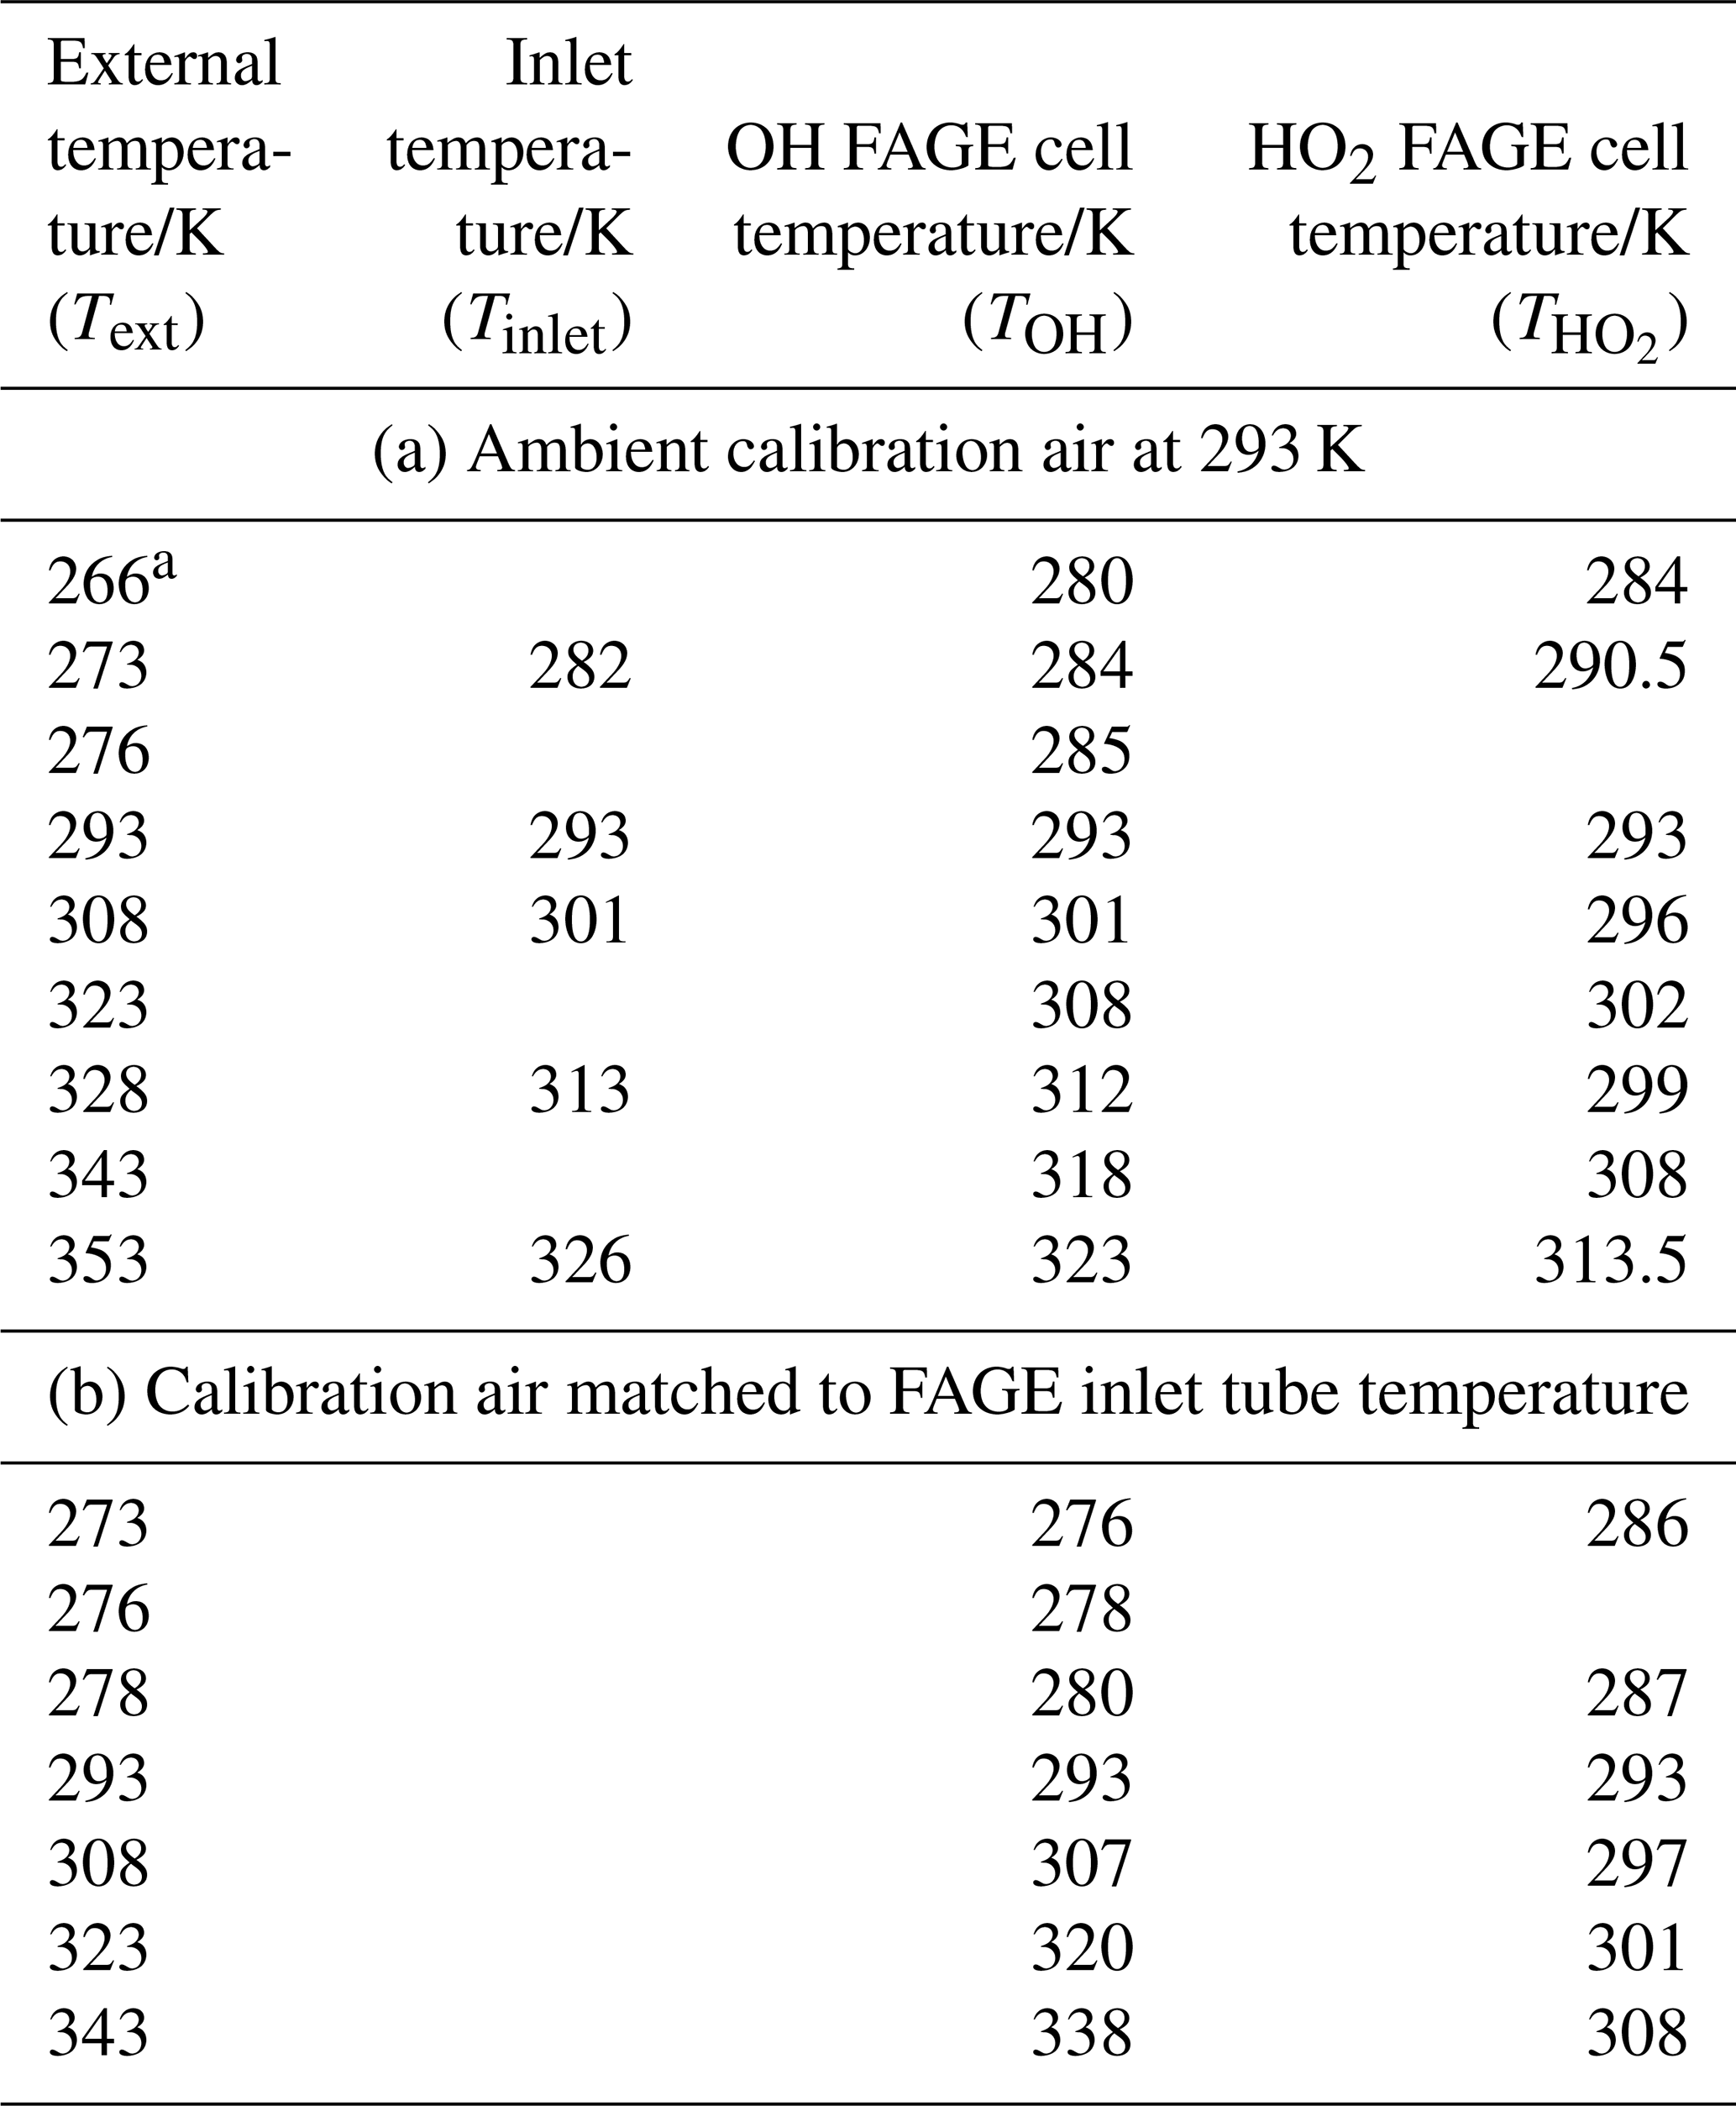
a All temperature measurements have an uncertainty of ±0.5 K.
Figure 2b and c show the linear relationship between the internally measured temperature at the pinhole, OH cell and HO2 cell. For Fig. 2b, the linear regression of the data gives ratios of 0.556±0.002, 0.510±0.002 and 0.195±0.002 for the inlet thermocouple (close to the pinhole), OH cell and HO2 cell. The temperature in the OH cell is controlled by the external temperature. In contrast, in field instruments which have a very different design and where OH is probed very close to the pinhole, there is a significant cooling effect due to the expansion (Creasey et al., 1997b). This is lost in the HIRAC FAGE due to the long inlet prior to probing the OH.
4.1.2 Temperature-dependent flow tube calibration with air at 293 K
Figure 5 displays the relative COH and for the HIRAC FAGE instrument as a function of external temperature between 266–343 K, with the data points listed in the top half of Table 2. In these experiments the FAGE inlet was cooled or warmed to give the external temperature (Text). The air from the calibration flow tube was at a constant 293 K, and therefore the temperature in the observation cells (OH or HO2) varied compared to the inlet air. This method of investigating the temperature dependence of therefore operates under different conditions from the subsequent methods (Sects. 4.1.3 and 4.2). Data for are presented relative to the calibration factor at room temperature (293 K).
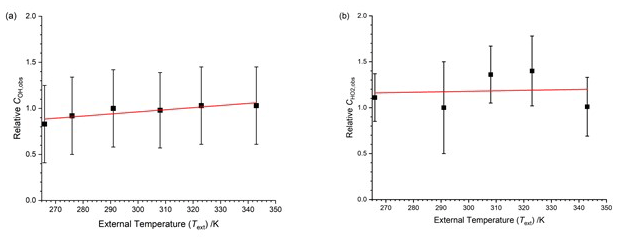
Figure 5Temperature dependence of the calibration factors ( as a function of the external temperature with HOx being delivered from the calibration flow tube at a constant temperature. The solid lines are a weighted fit to the data. (a) COH,obs, with the slope being (0.0023±0.0007) K−1. (b) , with the slope being (0.0005±0.0031) K−1. Errors are 2σ.
COH,obs shows a positive temperature dependence (0.0023±0.0007 K−1); for , the data appear to be more scattered, and no systematic trend is observable. The overall temperature dependence of both HOx calibration factors is small compared to the overall uncertainty in the calibration (40 %); the relative calibration factor for OH changes by about 20 % from 266–343 K. However, the error bars in Fig. 5 represent the total error in the calibration, much of which will be temperature independent. A full discussion on the temperature dependence of the calibration factors is presented in Sect. 4.3.
Table 2Instrument sensitivity to OH, COH, HO2 and , determined using the conventional water vapour calibration method.
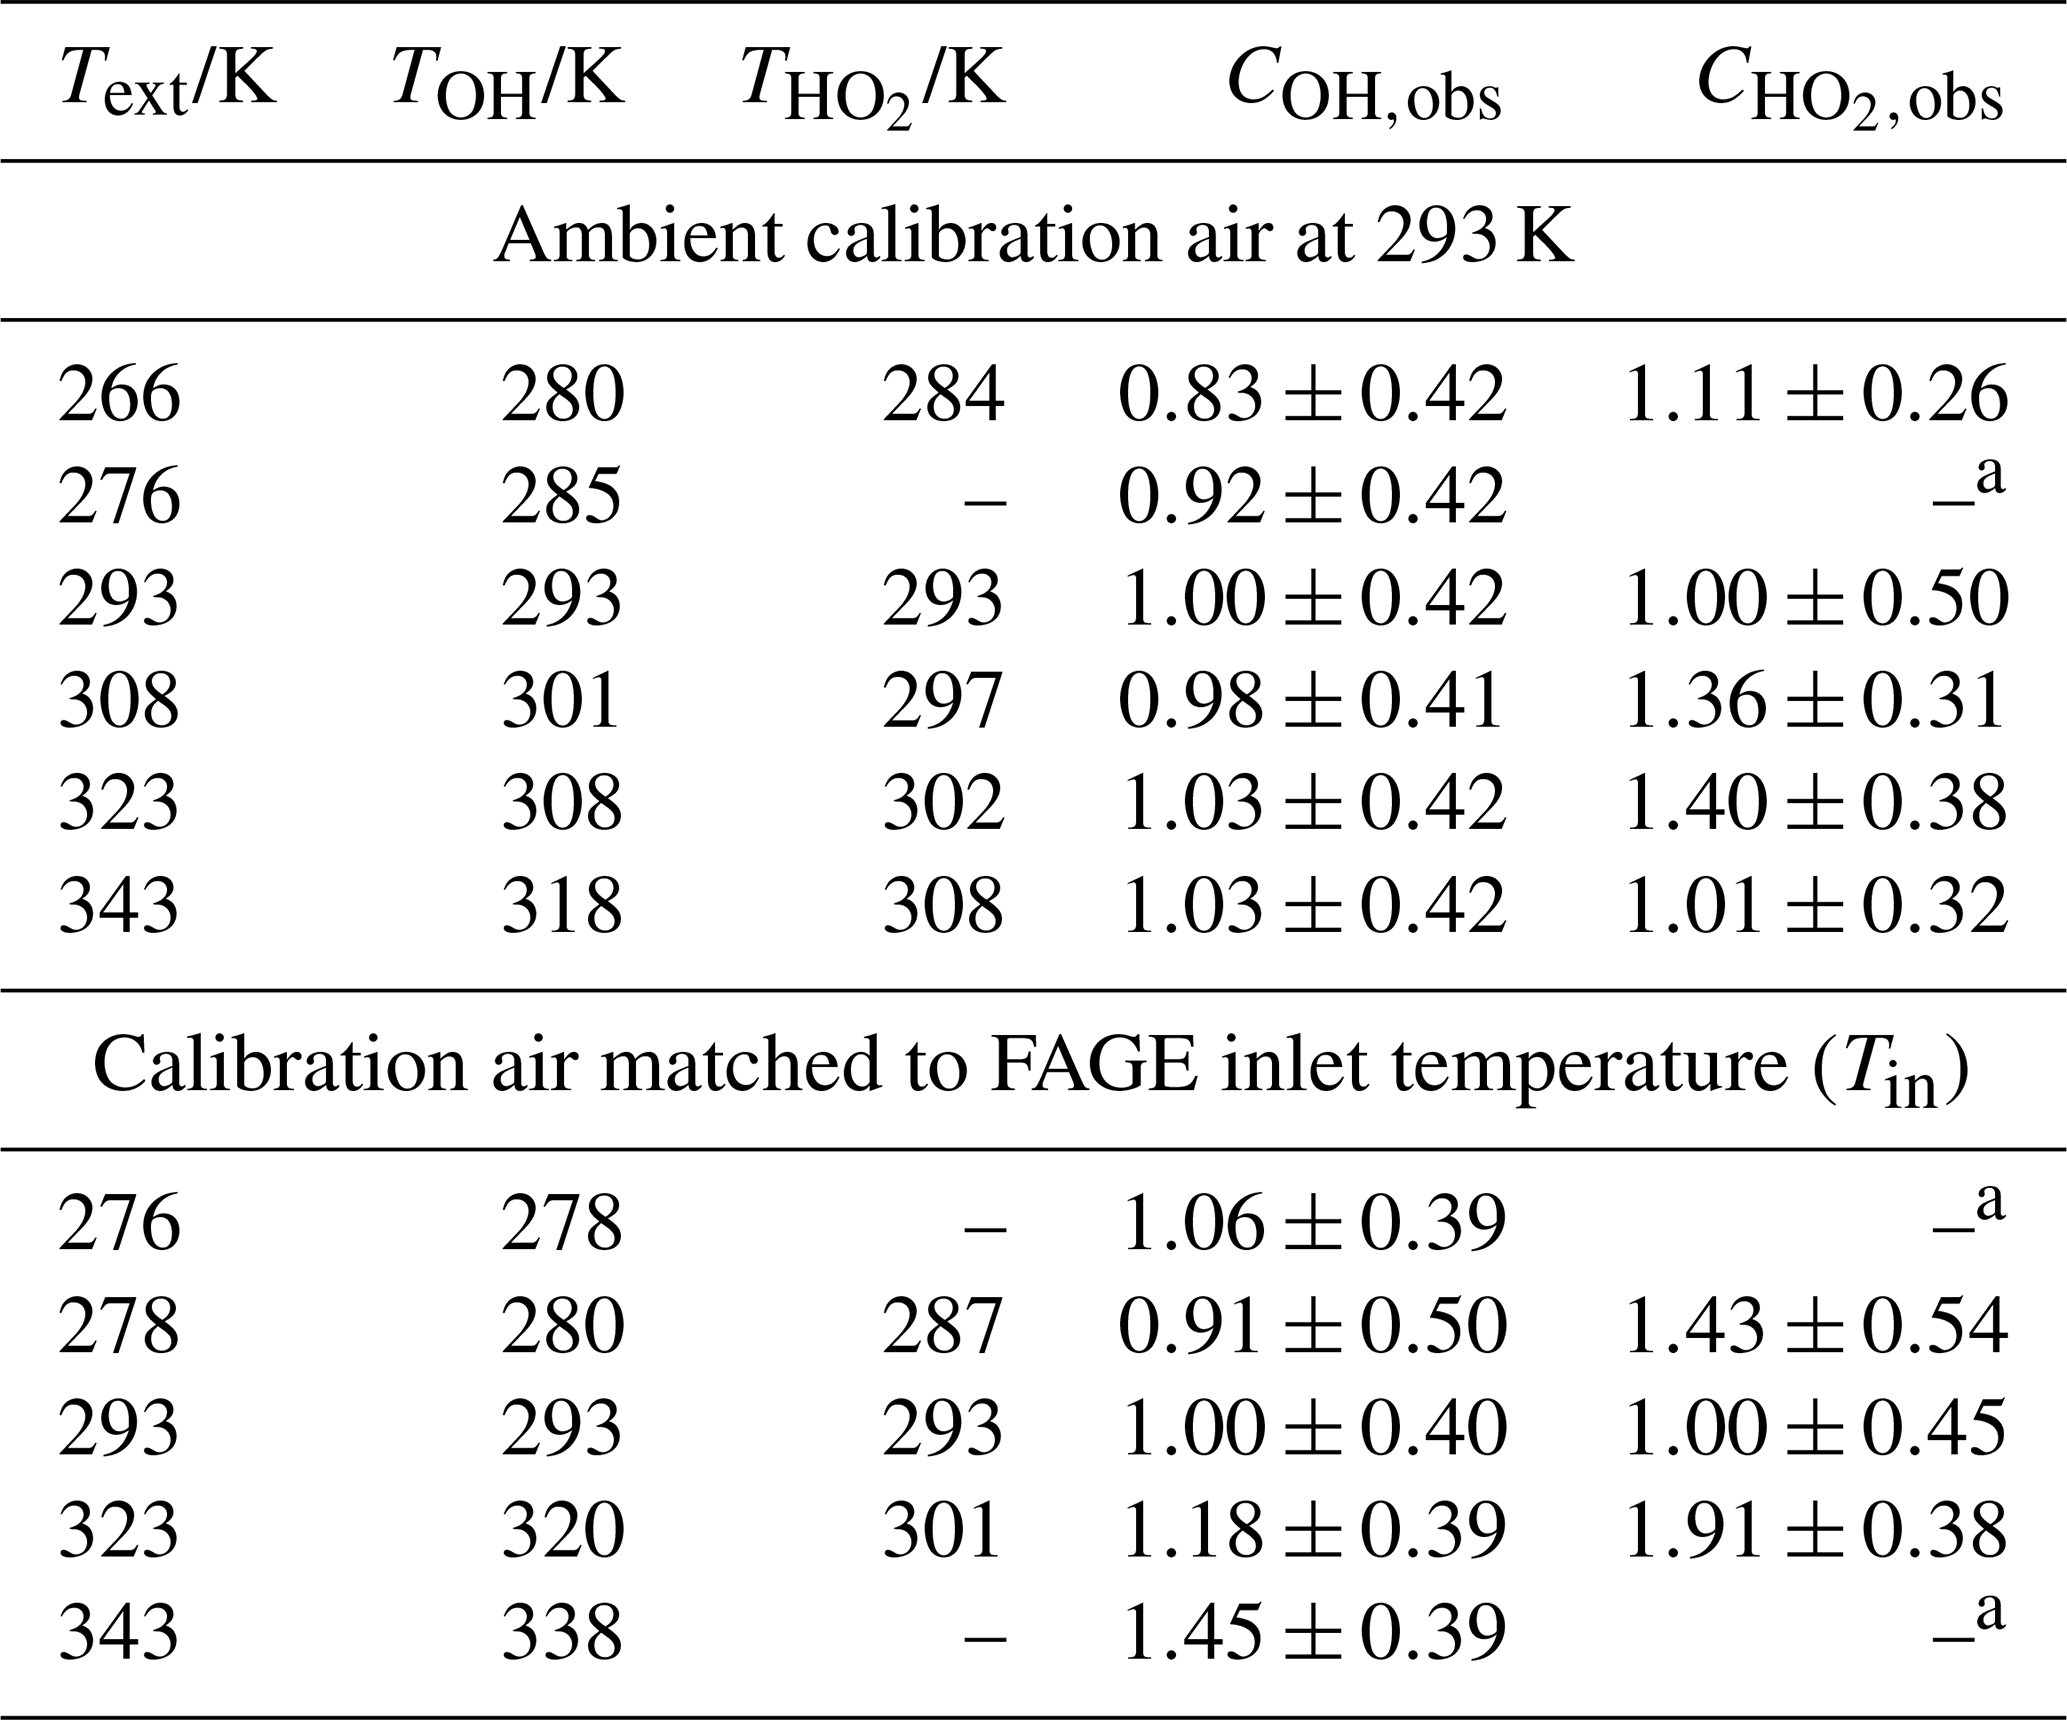
The internal temperatures (±0.5 K) for the OH and HO2 fluorescence cells are represented by TOH and , respectively. a The determination of was precluded by a malfunctioning NO mass flow controller.
4.1.3 Temperature-dependent flow tube calibration with air at varying inlet temperatures
A similar procedure to Sect. 4.1.2 was carried out, but in this case, the air flowing into the calibration flow tube had been cooled/heated to match the external temperature of the FAGE inlet. This method will give conditions that are more closely matched to those when the FAGE instrument is located in the HIRAC chamber, where the FAGE inlet is at the same temperature as the gas being sampled from HIRAC. The water vapour concentration was measured at a fixed temperature in the dew-point hydrometer, and therefore the [HOx] emitted from the wand needed to be corrected for the change in [H2O] and additionally for the change in Δt in Eq. (E2).
In this calibration arrangement the temperature of the OH cell (TOH) was virtually identical to the external temperature (Text). The HO2 FAGE cell was closer to ambient room temperature. The temperature dependence of relative to 293 K is shown in Fig. 6. The calibrations were taken at different times from those in Sect. 4.1.2, but the absolute factors at 293 K were in good agreement, within 5 %. For OH, the slope of Fig. 6a is again positive. For HO2 (Fig. 6b) there are only three datum points, and they are somewhat scattered.
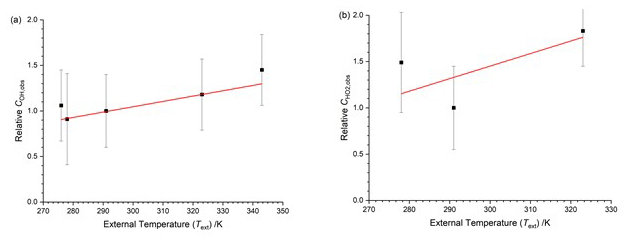
Figure 6Temperature dependence of the calibration factors ( as a function of the external temperature with HOx being delivered from the calibration flow tube at the external temperature. The solid lines are a weighted fit to the data. (a) COH,obs, with the slope being (0.0059±0.0015) K−1. (b) , with the slope being (0.014±0.013) K−1.
Table 3Temperature dependence of COH,obs determined via the hydrocarbon decay method.
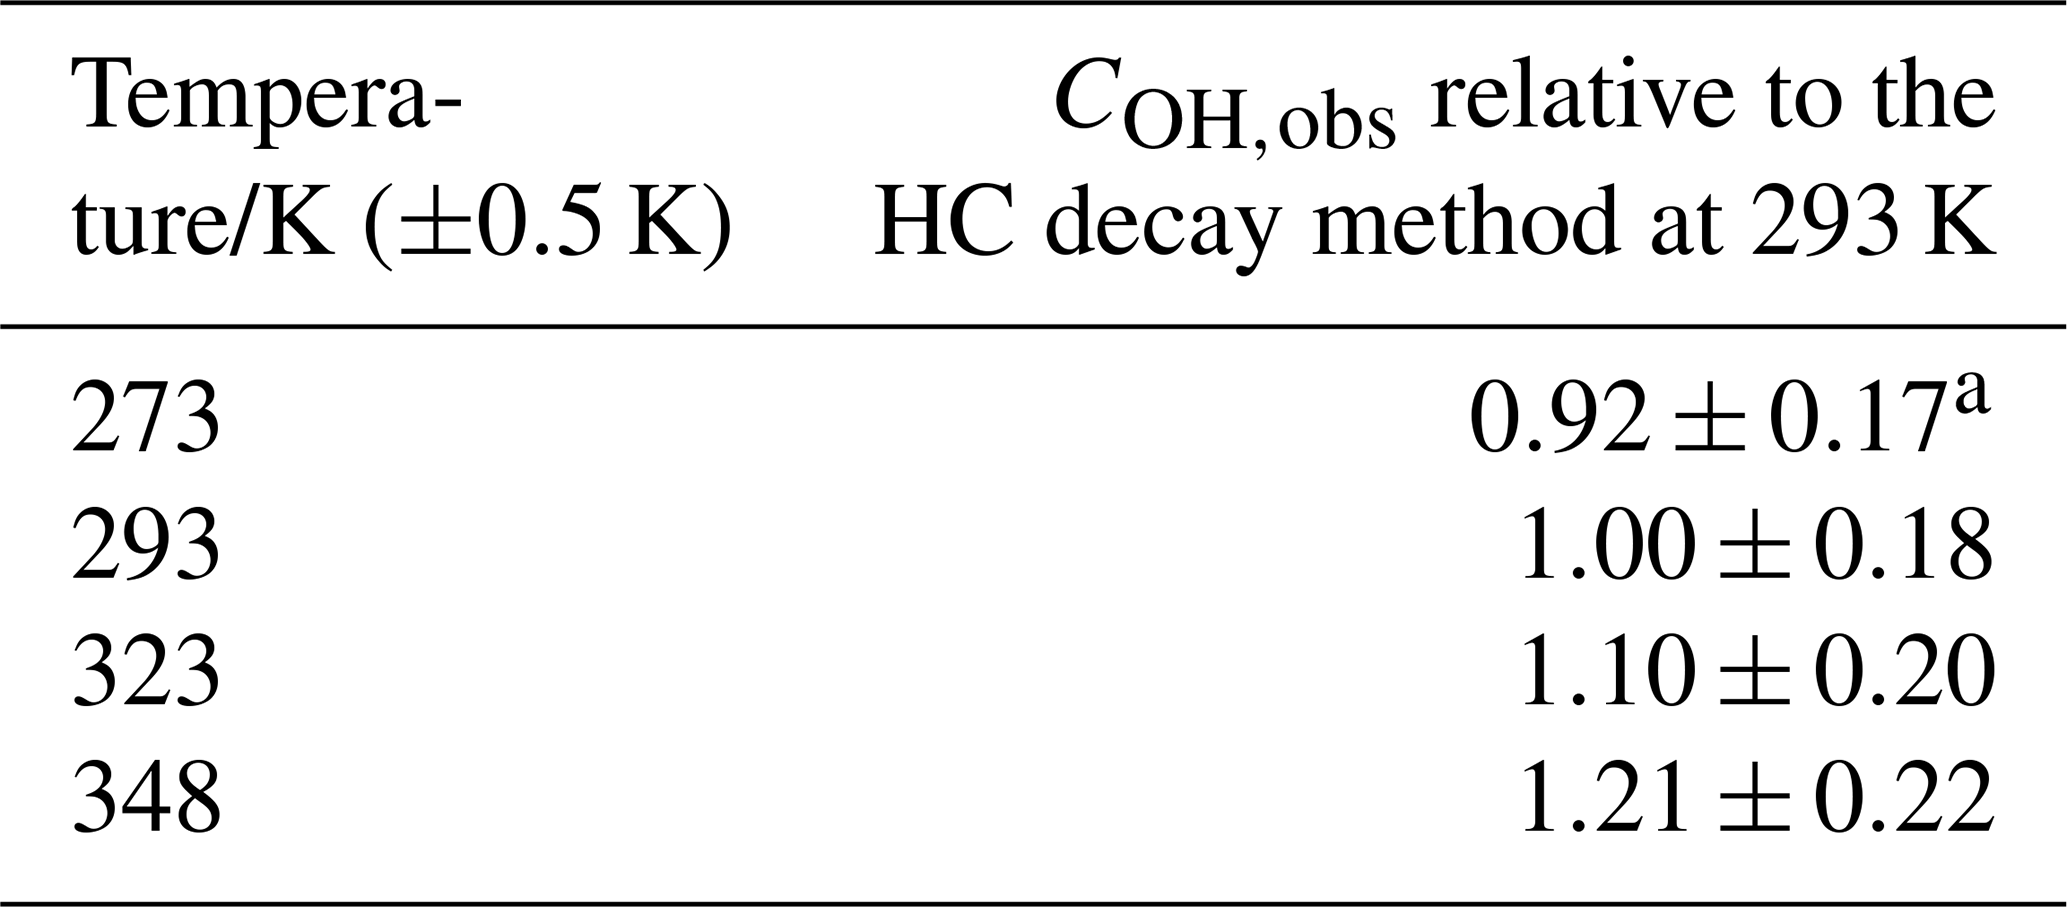
a Errors represent the total uncertainty in COH; see Table 4.
4.2 Alternative calibration methods
4.2.1 Hydrocarbon decay calibration of OH sensitivity
The ratio of the conventional water vapour flow tube calibration to the HC decay method derived from scatterplots such as Fig. 3 at 293 K was 1.034±0.068, where the errors are the statistical errors in the gradient of the scatterplots at the 2σ level. The two methods are therefore in excellent agreement as has been observed in our previous study conducted solely at room temperature (Winiberg et al., 2015, 1.19±0.26). The increased number of data points available for the HC analysis using chemical ionization mass spectrometry monitoring increases the precision of this work compared to our earlier studies where [HC] was measured at much lower time resolution by FTIR or gas chromatography.
A potential source of error in the HC decay method is quantifying the removal of the HC by non-OH sources. The effects of dilution and wall loss can be accounted for by suitable blank experiments; however, it is harder to account for any other chemically induced removal by photolytically generated radicals other than OH in such blank experiments. The hydrocarbons chosen for this analysis are simple alkanes with well-established chemistry that should minimise such possibilities, i.e., very slow reactions with any photolytically generated O3 or NO3. In addition, when both cyclohexane (CH) and heptane (HEP) were used as the HC, the gradient of the resulting relative rate plot (ln([HEP]0/[HEP]t) vs ln([CH]0/[CH]t), with the slope being 0.923±0.010) was in good agreement with the ratio of the literature rate coefficients for OH reactions ( at 298 K (Atkinson, 2003)). This confirms that OH was the dominant route for chemical removal (see Supplement, Sect. S4). A key assumption of the hydrocarbon decay calibration method is that the OH is chemically removed by OH.
Displayed in Table 3 is the instrument sensitivity to OH radicals, COH,obs, measured between 273 and 348 K at 1000 mbar HIRAC chamber pressure using the hydrocarbon decay method, and Fig. 7a shows these data as a function of the HIRAC temperature. An increase in COH is observed. As with the experiments carried out in Sect. 4.1.2, the temperature of the OH cell (TOH) is very close to that of the gas being sampled at the inlet.
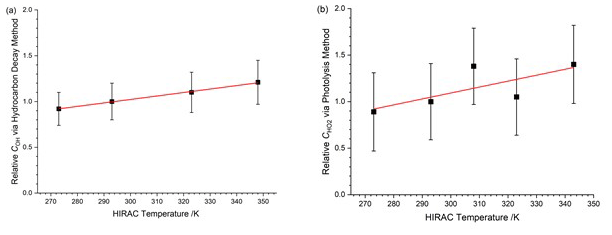
Figure 7Temperature dependence of relative to values at 293 K. The solid lines are a weighted fit to the data. (a) Relative COH,obs from the HC decay method. The slope is (0.0038±0.0007) K−1. (b) Relative from the HCHO photolysis method. The slope is (0.0064±0.0034) K−1. Errors are 2σ.
Table 4The systematic uncertainties in the various parameters that determine the accuracy in the OH and HO2 calibration factors for the conventional and alternative calibration methods.
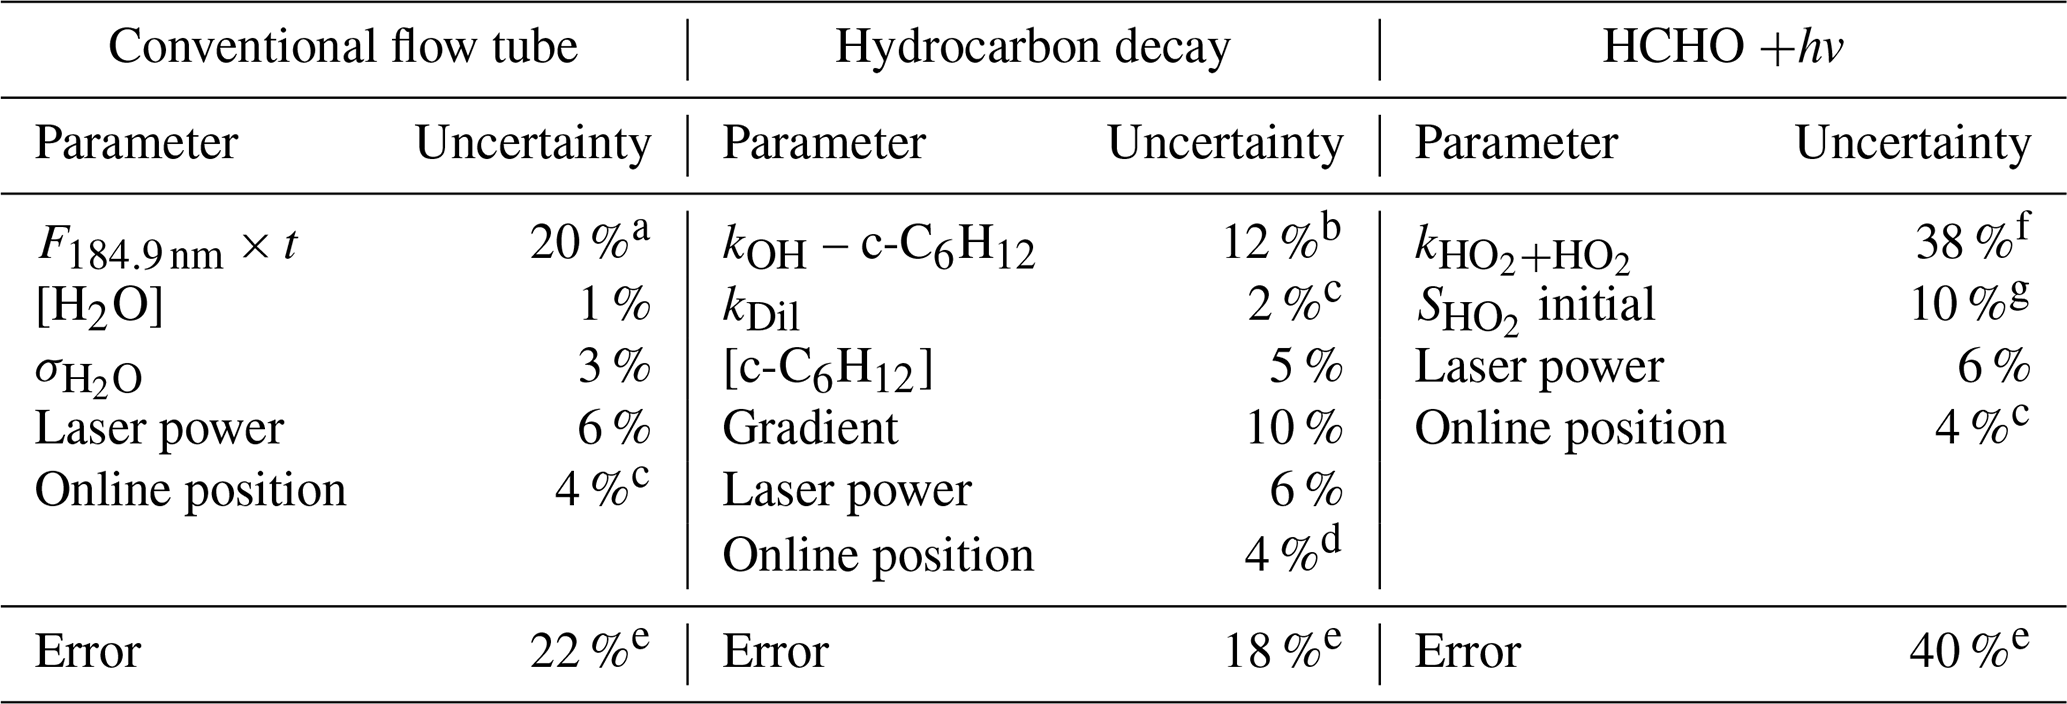
a Where the error is statistical, it is reported at the 1σ level. b Error estimated from a literature review. Five recent determinations (NIST Kinetics) of the 298 K rate coefficient give ∼ 5% spread, with additional uncertainty added to account for temperature dependence. c Dilution determined from flow controller measurements. d The online position error is the approximate error in the maximum line intensity that is achieved when positioning the laser wavelength at the centre of the OH transition. e Total accuracy is taken as the sum in quadrature of the individual uncertainties. f Error in rate coefficient from the IUPAC evaluation. g Uncertainties in the fitting parameters.
Table 4 summarises the errors associated with the alternative calibration methods. For the hydrocarbon decay method, the major uncertainties are in the rate coefficient of the hydrocarbon (∼ 12 % for OH + cyclohexane), determination of cyclohexane concentration (5 %) and the gradient of the cyclohexane decay (10 %). Other uncertainties are drifts in the laser power (∼ 6 %, determined from monitoring a photodiode) and wavelength position (∼ 4 %).
4.2.2 Calibration via HO2 recombination kinetics
Displayed in Table 5 is the instrument sensitivity to HO2, , determined using the alternative calibration method between 273 and 343 K at 1000 mbar chamber pressure. Figure 7b shows as a function of temperature relative to the instrument sensitivity at 293 K. Each measurement point represents the weighted average of at least five experimental data sets, and the error bars represent the total uncertainty in the instrument sensitivity to ±2σ. As with the hydrocarbon decay method, the overall uncertainty is calculated as the sum in a quadrature of fit precision, similar to the decay and the systematic uncertainties listed in Table 4. The largest uncertainty was in the HO2 self-reaction rate coefficient, dependent on the temperature used (38 %). The slope of the linear fit to the values is (0.0064±0.0034) K−1. The absolute agreement between the conventional and HCHO photolysis methods at 293 K is good with (3.38±1.08) counts cm3 molecule−1 mW−1 s−1 and = (3.69±1.48) counts cm3 molecule−1 mW−1 s−1.
Table 5Instrument sensitivity to HO2, , determined using the HCHO photolysis method over the 273–343 K external inlet temperature range.
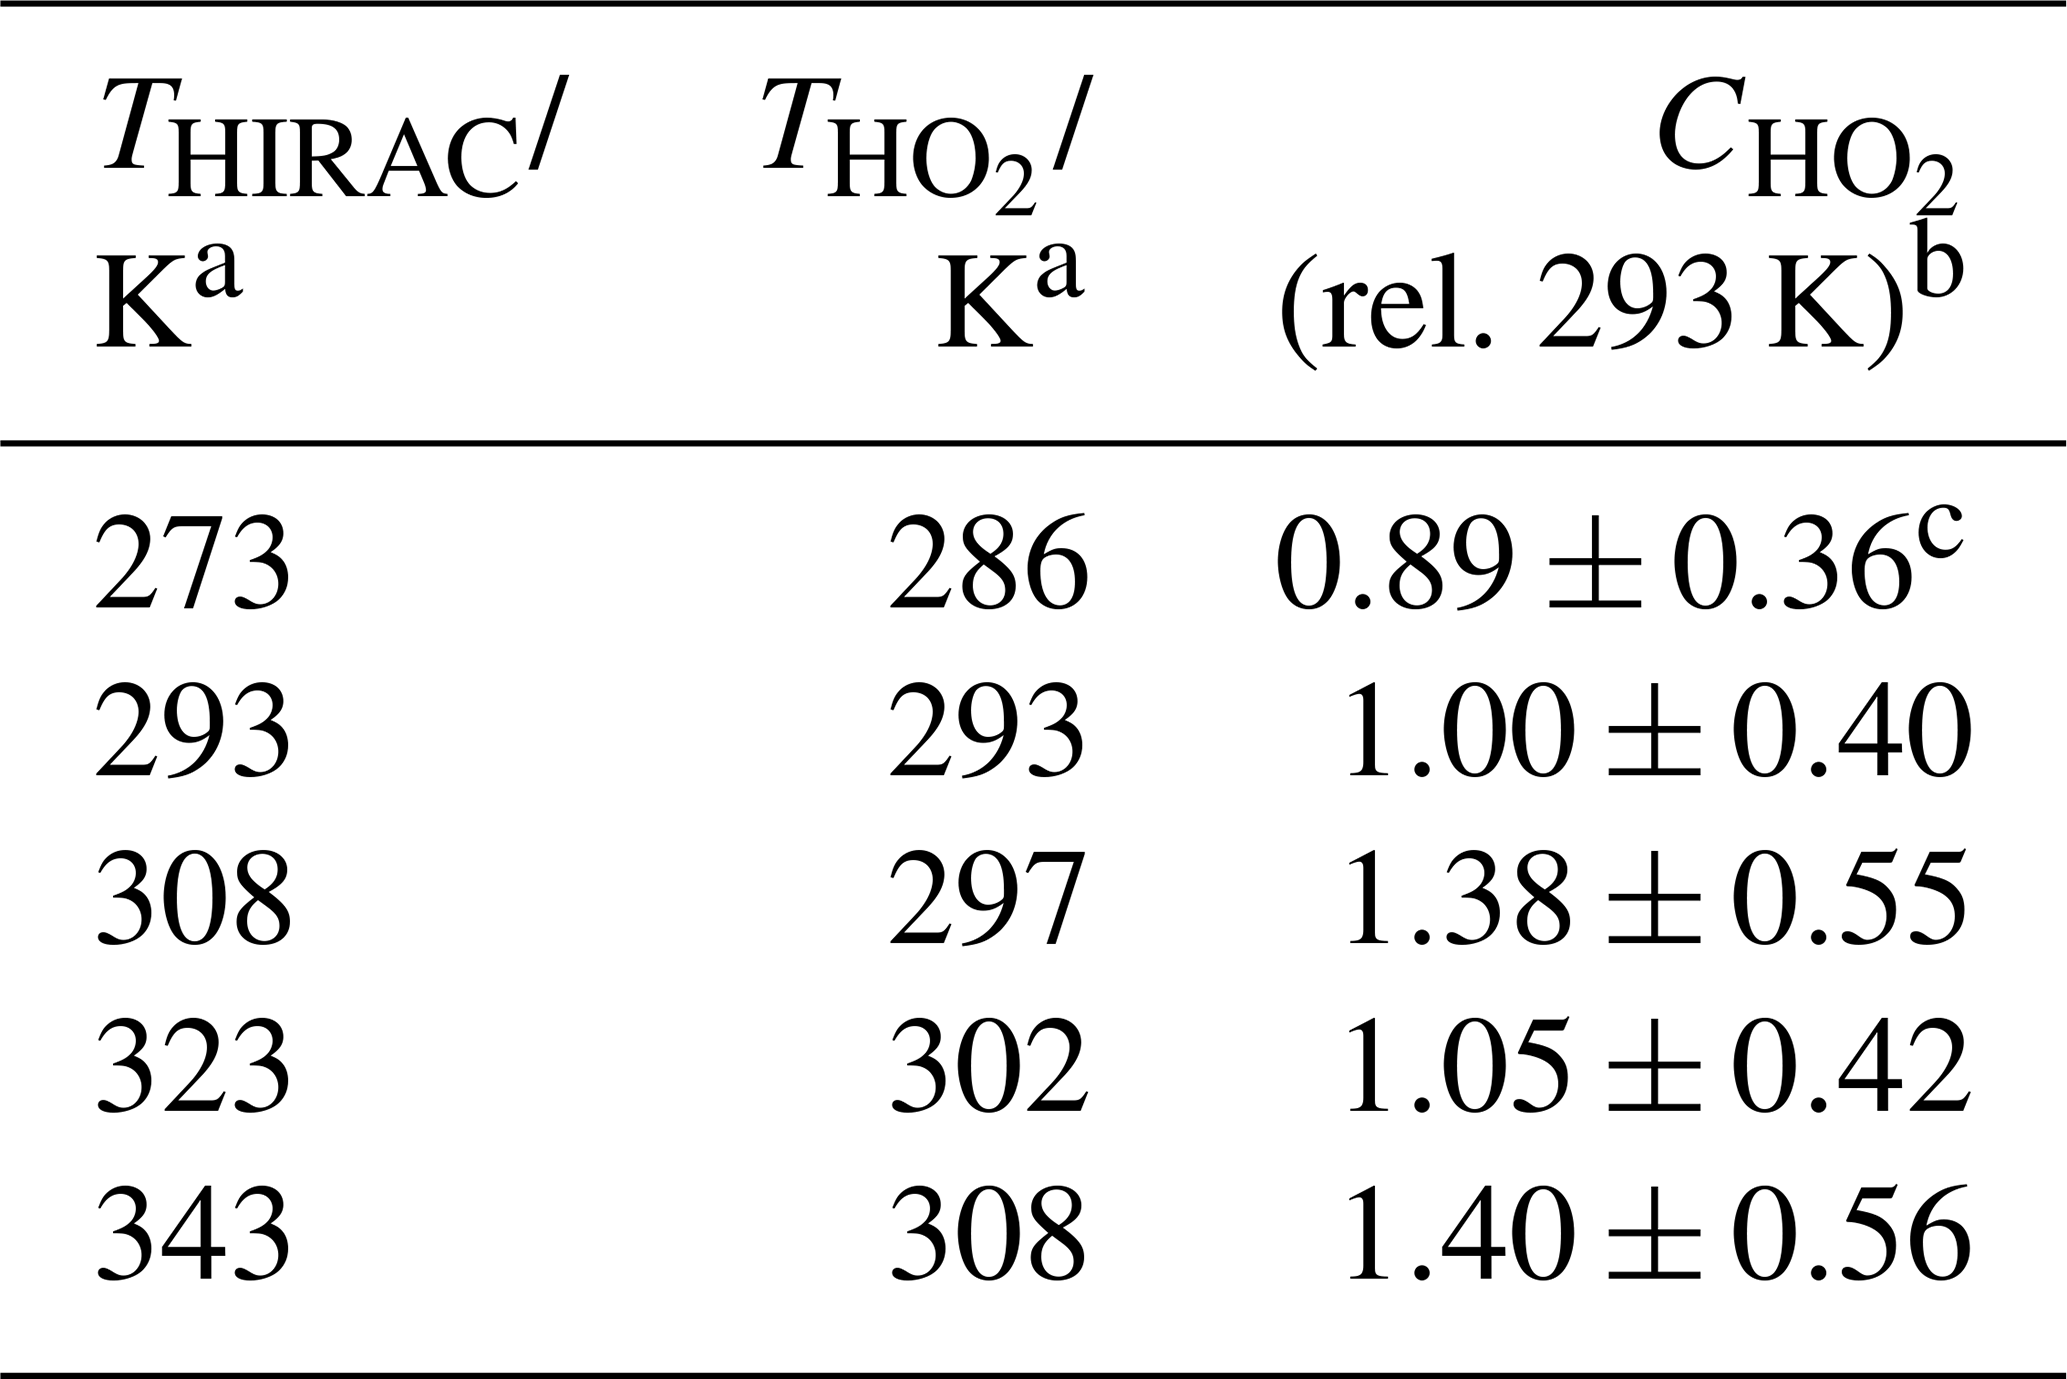
a Error in temperature ±0.5 K. b Values are relative to of (3.69±1.48) counts cm3 molecule−1 mW−1 s−1. c Each represents the weighted average of at least five individual determinations. All experiments were conducted in a 1000 mbar synthetic air mixture.
4.3 Discussion of calibration methods and temperature dependence
4.3.1 Comparison of calibration methods
For room temperature, there is excellent agreement between the wand calibration and that for OH based on hydrocarbon decays ([OH]wand:[OH]HC=1.00:0.97), for HO2 based on HCHO photolysis and the kinetics of the HO2 recombination reaction ([HO2]wand:[HO2]kinetics=1.00:1.09). This is consistent with our earlier study (Winiberg et al., 2015) and has also been confirmed in an intercomparison in the HIRAC chamber of the FAGE and NIR–CRDS (near-infrared cavity ring-down spectroscopy) for HO2 (Onel et al., 2017a) and CH3O2 (Onel et al., 2020, 2017b).
For the hydrocarbon decay method there are several advantages compared to the conventional wand calibration:
-
The [OH] is much closer to the conditions typically used in a chamber experiment (106–108 molecule cm−3), whereas the lowest [OH] used in the wand calibration performed here is typically 108 molecule cm−3. Ideally one should calibrate over the same range as used in an experiment.
-
This work has shown that there is a temperature dependence on the calibration factors. Calibrating via the hydrocarbon decay method provides identical conditions (temperature and pressure) to that of a real experiment in the HIRAC chamber. Temperature variation can be simulated using the conventional wand device, but this introduces additional uncertainty.
-
Conventional calibrations always take place with a significant water concentration, whereas the water concentration in the hydrocarbon decay can be set at any value.
-
Calibration can be achieved without removing the FAGE apparatus from the HIRAC chamber, decreasing the time taken for calibration.
There are some disadvantages too. The calibration for OH is strongly dependent on the accuracy of the HC rate coefficient. It is therefore important to use a hydrocarbon with a well-characterised rate coefficient; realistically, even the best-characterised rate coefficient is likely to have an uncertainly of 5 %–10 %. Several HCs can be used to give multiple independent determinations of [OH]HC, but this may increase the complexity of the analysis (e.g. coincident mass spectral peaks or overlapping FTIR spectra) and reduce the absolute concentration of OH. Determination of [OH]HC also relies on an accurate and precise determination of the concentration gradient and the [HC] at that time. Chemical ionization mass spectrometry measurements provide a near-continuous output, but if the [HC] is measured using systems with lower sampling rates (e.g. FTIR or gas chromatography), there can be a significant loss in precision of the gradient measurement.
Many of the advantages and disadvantages of the hydrocarbon decay method also apply to the HO2 kinetic method for HO2 calibration. The rate coefficient for HO2 recombination has a higher degree of uncertainty than many OH + hydrocarbon rate coefficients and is dependent on the amount of water present. In the HIRAC chamber the humidity can be kept very low, but that may not be possible in all chambers; in these circumstances the humidity would need to be measured, and the rate coefficient would need to be adjusted.
All calibration methods are subject to systematic uncertainties, the magnitude of which may vary with conditions, and therefore it is sensible to use a range of calibration methods.
4.3.2 Temperature dependence of
Table 6 compares the relative observed calibration factors for the three different calibration methods. In all cases, a positive temperature dependence is observed, but for , only the alternative calibration method displays a statistically significant positive slope.
The factors can be broken down into temperature-independent components (laser power, solid angle of fluorescence collection, detector efficiency etc.) and temperature-dependent terms. Four temperature-dependent terms are relevant for : the number density of OH in the cell, the quenching efficiency of the fluorescence, the population of the probed quantum state of OH, and the transmission efficiency through the pinhole and inlet tube (Creasey et al., 1997b). The first three terms can be calculated and are hence accounted for. Any residual temperature dependence of should then relate to the transmission coefficient through the apparatus.
HOx number density. The calculated [HOx] delivered to the FAGE apparatus depends on the temperature of the HOx source, either the wand (operating at a fixed T=293 K (Method 1) or at Text (Method 2)) or the HIRAC chamber. If the temperatures of the HOx cells are different from this temperature, then there will be a change in the number density of HOx, over and above that caused by the pressure changes between the HOx source (1 bar) and the HOx cell (typically 3.6 mbar). As the temperatures of the HOx cells have been measured, it is straightforward to correct for the different number densities in the observation cells and the resulting contribution to the temperature dependence of as summarised in Tables S2–S4.
Quenching. As shown in Faloona et al. (2004), the quenching parameter, Q(T), is defined by integrating the OH fluorescence decay over the defined sample time or gated region. The quenching rate coefficients for N2, O2 and H2O have been shown to be dependent on temperature (Copeland and Crosley, 1986, and Bailey et al., 1997, for N2 and O2, respectively, and Bailey et al., 1999, for H2O). The total decay intensity is defined by [OH(A2Σ+, )]0 exp(−Γt), where Γ, the total OH lifetime, is defined approximately as the sum total of the radiative lifetime for OH, γ, and the non-radiative lifetime due to quenching by the aforementioned bath gases. Bailey et al. (1997) have calculated the impact of temperature on quenching, accounting for both the change in the quenching rate coefficients and the change in the number density of the quenchers. Both the rate coefficient for quenching and the quencher number density decrease with increasing temperature, and hence quenching decreases overall with increasing temperature (summarised in Table S5), enhancing the fluorescence quantum yield.
Rotational population. The rotational population of the probed state in the Q1(2) transition will vary with temperature. The Q1(2) is the transition giving the largest signal between 280–340 K, the limits of TOH explored in the study. Relative to ambient temperature, the rotational population probed by Q1(2) increases by 3.5 % at 280 K and decreases by 9.0 % at the highest TOH of 340 K (Table S6).
It is therefore possible to calculate the expected variation in for the different calibration methods dependent on the OH number density, quenching and rotational population; these can be compared with the observed variation in summarised in Table 6. Full details on the temperature dependences of the above components, which vary slightly with the calibration method used, are presented in Sect. S5 of the Supplement.
The difference between the observed and the calculated due to the above parameters is attributed to increased transmission of HOx through the pinhole and inlet tube and is given in Table 6. The HOx transmission to the fluorescence region will depend on the magnitude of the heterogeneous loss of radicals to the walls of the FAGE inlet. The wall loss process is a combination of diffusion and uptake at the wall, and the actual temperature dependence will depend on the radicals, conditions and wall composition (Howard, 1979).
For the OH calibrations, there is an increase in OH transmission with temperature across all three calibration methods, consistent with a decrease in OH loss to the walls which has been observed in previous flow tube studies. The OH wall loss rate in the inlet tube is usually approximated to a first-order process with a rate coefficient, kw, and decreasing values of kw with temperature have been reported for flow tube studies of OH reactions (Howard, 1979); for example Brown et al. (1990) report kw decreasing from 35 s−1 at 227 K to 5 s−1 at room temperature.
For HO2 measurements, there is potentially a further temperature-dependent component, the conversion of HO2 into OH via Reaction (R7):
The rate coefficient for this reaction has a negative temperature dependence, and the increased number density of NO would further enhance the rate of the reaction at lower temperatures. The experiments reported in this work operated with excess NO such that the small variations in the rate of reaction over the range of (284–313 K) will not alter the conversion of HO2 to OH. However, if one were working at lower HO2 conversions to mitigate against RO2 to OH conversion (Whalley et al., 2013), then variations in the conversion efficiency could change as a function of temperature.
Temperature-dependent HO2 calibrations based on the conventional wand method give significant scatter, but a positive increase in HO2 transmission is observed for the alternative calibration method based on HO2 kinetics, the magnitude of which is similar to that for OH, albeit with significant error bars. In general, HO2 and RO2 radicals exhibit lower wall loss rate coefficients, but in our FAGE system, HO2 molecules have to travel further to reach the titration region where reaction occurs with NO to convert HO2 to OH. Therefore, there is also potential for OH loss from the titration point to the second detection cell.
Table 6Summary of the temperature dependence of with different calibration methods.
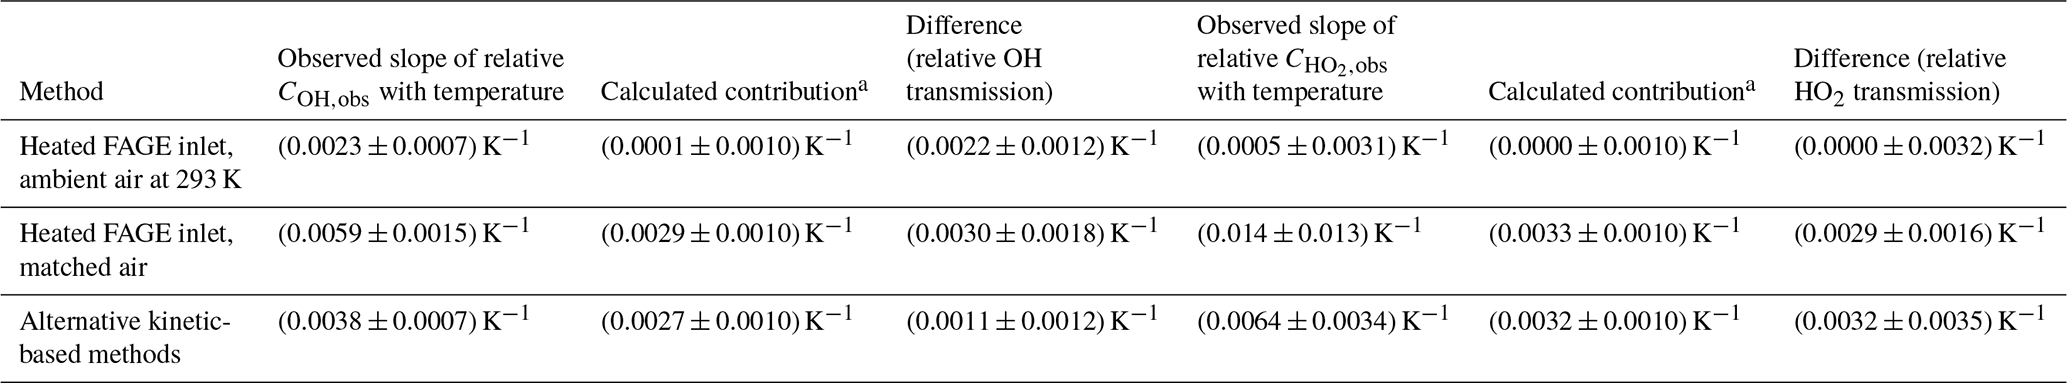
a Contribution from the change in the number density, quenching and relative rotation population in the probed state.
4.3.3 Comparison with other instruments
The temperature dependence of the calibration factors will be strongly dependent on the design of the FAGE apparatus. Our instrument was designed with a long (∼ 1 m) inlet such that we can probe across the diameter of the HIRAC chamber to check for radial distributions of radicals (Malkin et al., 2010). Hence, we would expect HOx transmission to play a significant role in the temperature dependence of the calibration factor which is observed. Any similarly designed instrument would have a contribution from HOx transmission, the magnitude of which would depend on inlet length/residence time and construction material. Heating the inlet should reduce transmission losses. The aircraft-based instrument, from the Jülich research group, uses a PID-controlled heater to maintain their FAGE inlet at ∼ 300 K, mitigating any possible temperature effects. They also have an in-field calibration system, which has shown negligible deviation from the expected behaviour at 300 K, based on the sample gas altitude temperature (Marno et al., 2020).
Regelin et al. (2013) reported a similar temperature dependence study of COH and to the current flow tube study with the aircraft-based HORUS instrument. Cooling lines were wound around the inlet to simulate the measured temperature profile, and ambient air was sampled from a calibration flow tube. In contrast to our slight increase in COH with temperature in the flow tube experiment, Regelin et al. (2013) observed a slight negative dependence of the OH signal. Regelin et al. (2013) reported that their calculations have shown that the sample forms a jet between the pinhole and the OH cell such that there is insignificant interaction with the walls, and therefore transmission will not be a problem.
In contrast, a significant decrease (50 %) in the HO2 signal, , was observed as the temperature was decreased from ∼ 295 to ∼ 262 K (the slope being 0.017 K−1 normalised to , i.e. the same qualitative behaviour as we observed, approximately a factor of 2 greater than that measured in our work, based on HO2 recombination kinetics. Beyond the OH cell in the HORUS experiment, the jet breaks up, and Regelin et al. (2013) suggest that temperature-dependent wall losses are responsible for the change in . Quantitative comparisons cannot be made due to the differences in construction. The observed temperature dependence of COH and for the HORUS and HIRAC experiments emphasises the importance of performing calibrations for each instrument under conditions as close as possible to those used in measurements.
The effect of the temperature of the incoming sample on the sensitivity of the HIRAC FAGE instrument to OH and HO2 has been investigated between 266 and 348 K using a combination of the conventional water vapour photolysis/flow tube method (Faloona et al., 2004) and alternative calibration methods based on hydrocarbon decays for OH and the HO2 self-reaction for HO2. In all cases, a positive increase in sensitivity was observed (Table 6), although with large error bars in the case of HO2 with conventional calibration.
The temperature dependence of the calibration factor can be broken down into four components. Variations in three parameters, number density, quenching and rotational population of the probed level, can be accounted for if the temperature and pressure in the LIF cells are monitored. The difference between the observed and calculated temperature dependence for the above parameters has been attributed to HOx transmission from the pinhole to the relevant detection chamber.
The temperature dependence of will depend on the design and construction materials of the FAGE apparatus. It is therefore difficult to utilise the results of this study to predict results in other systems. However, for any systems with significant sampling inlet residence times, such as the HIRAC FAGE described in this work, increased HOx transmission with increasing temperature should be expected. Therefore, maintaining the inlet at a relatively high temperature should improve sensitivity in low-temperature applications.
The in situ calibration methods (hydrocarbon decay and HO2 recombination kinetics) offer important advantages in that the FAGE apparatus is calibrated under the physical conditions and [HOx] that more closely correspond to real experiments. All calibration methods are subject to significant uncertainty; however, the origins of these uncertainties are different, and hence good agreement between calibration methods should provide confidence that significant systematic errors are not present.
Any raw data are available either in the Supplement or via contacting Paul Seakins.
The HIRAC temperature profiles, calibrations, further discussions on calibration uncertainties, the relative rate plots to confirm OH as the key species in hydrocarbon removal and further discussion on the temperature dependence of the FAGE signal can be found in the Supplement. The supplement related to this article is available online at: https://doi.org/10.5194/amt-16-4375-2023-supplement.
FAFW and IGB led the initial work on OH temperature dependence, performing all experiments with external calibration. WJW, THS and GB completed the experiments with HC decays in HIRAC. CAB and IGB completed experiments on HO2 temperature dependence. PWS, DEH and DS planned and supervised the experiments and wrote the paper with contributions from all co-authors.
At least one of the (co-)authors is a member of the editorial board of Atmospheric Measurement Techniques. The peer-review process was guided by an independent editor, and the authors also have no other competing interests to declare.
Publisher’s note: Copernicus Publications remains neutral with regard to jurisdictional claims in published maps and institutional affiliations.
This work has been supported by NERC studentships provided to Frank A. F. Winiberg and William J. Warman. Charlotte A. Brumby was sponsored by a studentship from EPSRC. Graham Boustead was supported by NERC grant NE/S010246/1, Iustinian G. Bejan by the Marie Curie Fellowship LAMUNIO (no. 302342) and Thomas H. Speak by the EU-funded EUROCHAMP2020 project.
This paper was edited by Anna Novelli and reviewed by two anonymous referees.
Atkinson, R.: Kinetics of the gas-phase reactions of OH radicals with alkanes and cycloalkanes, Atmos. Chem. Phys., 3, 2233–2307, https://doi.org/10.5194/acp-3-2233-2003, 2003.
Atkinson, R., Baulch, D. L., Cox, R. A., Crowley, J. N., Hampson, R. F., Hynes, R. G., Jenkin, M. E., Rossi, M. J., Troe, J., and IUPAC Subcommittee: Evaluated kinetic and photochemical data for atmospheric chemistry: Volume II – gas phase reactions of organic species, Atmos. Chem. Phys., 6, 3625–4055, https://doi.org/10.5194/acp-6-3625-2006, 2006.
Bailey, A. E., Heard, D. E., Paul, P. H., and Pilling, M. J.: Collisional Quenching of OH by N2, O2 and CO2, Journal of the Chemical Society, Faraday Trans., 93, 2915–2920, 1997.
Bailey, A. E., Heard, D. E., Henderson, D. A., and Paul, P. H.: Collisional quenching of OH(A2Σ+, 0) by H2O between 211 and 294 K and the development of a unified model for quenching, Chem. Phys. Lett., 302, 132–138, 1999.
Bejan, I. G., Winiberg, F. A. F., Mortimer, N., Medeiros, D. J., Brumby, C. A., Orr, S. C., Kelly, J., and Seakins, P. W.: Gas-phase rate coefficients for a series of alkyl cyclohexanes with OH radicals and Cl atoms, Int. J. Chem. Kinet., 50, 544–555, https://doi.org/10.1002/kin.21179, 2018.
Brown, A. C., Canosamas, C. E., Parr, A. D., and Wayne, R. P.: Laboratory studies of some halogenated ethanes and ethers – measurements of rates of reaction with OH and of infrared-absorption cross-sections, Atmos. Environ. A, 24, 2499–2511, https://doi.org/10.1016/0960-1686(90)90341-j, 1990.
Cantrell, C. A., Tyndall, G., and Zimmer, A.: Absorption cross sections for water vapour from 183 to 193 nm, Geophys. Res. Lett., 24, 2195–2198, 1997.
Commane, R., Floquet, C. F. A., Ingham, T., Stone, D., Evans, M. J., and Heard, D. E.: Observations of OH and HO2 radicals over West Africa, Atmos. Chem. Phys., 10, 8783–8801, https://doi.org/10.5194/acp-10-8783-2010, 2010.
Copeland, R. A. and Crosley, D.: Temperature dependent electronic quenching of OH A2Σ, v'=0 between 230 and 310 K, J. Chem. Phys., 84, 3099–3105, 1986.
Creasey, D. J., Halford-Maw, P. A., Heard, D. E., Pilling, M. J., and Whitaker, B. J.: Implementation and initial deployment of a field instrument for measurement of OH and HO2 in the troposphere by laser-induced fluorescence, J. Chem. Soc.-Faraday Trans., 93, 2907–2913, 1997a.
Creasey, D. J., Heard, D. E., Pilling, M. J., Whitaker, B. J., Berzins, M., and Fairlie, R.: Visualisation of a supersonic free-jet expansion using laser-induced fluorescence spectroscopy: Application to the measurement of rate constants at ultralow temperatures, Appl. Phys. B, 65, 375–391, https://doi.org/10.1007/s003400050285, 1997b.
Creasey, D. J., Heard, D. E., and Lee, J. D.: Absorption cross-section measurements of water vapour and oxygen at 185 nm. Implications for the calibration of field instruments to measure OH, HO2 and RO2 radicals, Geophys. Res. Lett., 27, 1651–1654, https://doi.org/10.1029/1999gl011014, 2000.
Edwards, G. D., Cantrell, C., Stephens, S., Hill, B., Goyea, O., Shetter, R., Mauldin, R. L., Kosciuch, E., Tanner, D., and Eisele, F.: Chemical Ionization Mass Spectrometer Instrument for the Measurement of Tropospheric HO2 and RO2, Anal. Chem., 75, 5317–5327, 2003.
Faloona, I. C., Tan, D., Lesher, R. L., Hazen, N. L., Frame, C. L., Simpas, J. B., Harder, H., Martinez, M., Di Carlo, P., Ren, X. R., and Brune, W. H.: A laser-induced fluorescence instrument for detecting tropospheric OH and HO2: Characteristics and calibration, J. Atmos. Chem., 47, 139–167, https://doi.org/10.1023/B:JOCH.0000021036.53185.0e, 2004.
Fittschen, C., Al Ajami, M., Batut, S., Ferracci, V., Archer-Nicholls, S., Archibald, A. T., and Schoemaecker, C.: ROOOH: a missing piece of the puzzle for OH measurements in low-NO environments?, Atmos. Chem. Phys., 19, 349–362, https://doi.org/10.5194/acp-19-349-2019, 2019.
Fuchs, H., Bohn, B., Hofzumahaus, A., Holland, F., Lu, K. D., Nehr, S., Rohrer, F., and Wahner, A.: Detection of HO2 by laser-induced fluorescence: calibration and interferences from RO2 radicals, Atmos. Meas. Tech., 4, 1209–1225, https://doi.org/10.5194/amt-4-1209-2011, 2011.
Fuchs, H., Tan, Z., Hofzumahaus, A., Broch, S., Dorn, H.-P., Holland, F., Künstler, C., Gomm, S., Rohrer, F., Schrade, S., Tillmann, R., and Wahner, A.: Investigation of potential interferences in the detection of atmospheric ROx radicals by laser-induced fluorescence under dark conditions, Atmos. Meas. Tech., 9, 1431–1447, https://doi.org/10.5194/amt-9-1431-2016, 2016.
Gligorovski, S., Strekowski, R., Barbati, S., and Vione, D.: Environmental Implications of Hydroxyl Radicals (center dot OH), Chem. Rev., 115, 13051–13092, https://doi.org/10.1021/cr500310b, 2015.
Glowacki, D. R., Goddard, A., Hemavibool, K., Malkin, T. L., Commane, R., Anderson, F., Bloss, W. J., Heard, D. E., Ingham, T., Pilling, M. J., and Seakins, P. W.: Design of and initial results from a Highly Instrumented Reactor for Atmospheric Chemistry (HIRAC), Atmos. Chem. Phys., 7, 5371–5390, https://doi.org/10.5194/acp-7-5371-2007, 2007.
Hard, T. M., Obrien, R. J., Chan, C. Y., and Mehrabzadeh, A. A.: Tropospheric free-radical determination by FAGE, Environ. Sci. Technol., 18, 768–777, https://doi.org/10.1021/es00128a009, 1984.
Heard, D. E. and Pilling, M. J.: Measurement of OH and HO2 in the troposphere, Chem. Rev., 103, 5163–5198, 2003.
Hofzumahaus, A., Brauers, T., Aschmutat, U., Brandenburger, U., Dorn, H. P., Hausmann, M., Hessling, M., Holland, F., PlassDulmer, C., Sedlacek, M., Weber, M., and Ehhalt, D. H.: The measurement of tropospheric OH radicals by laser-induced fluorescence spectroscopy during the POPCORN field campaign and Intercomparison of tropospheric OH radical measurements by multiple folded long-path laser absorption and laser induced fluorescence – Reply, Geophys. Res. Lett., 24, 3039–3040, https://doi.org/10.1029/97gl02947, 1997.
Howard, C. J.: Kinetic measurements using flow tubes, J. Phys. Chem., 83, 3–9, https://doi.org/10.1021/j100464a001, 1979.
IUPAC: Evaluated Kinetic Data: Task Group on Atmospheric Chemical Kinetic Data Evaluation, https://iupac-aeris.ipsl.fr/ (last access: 28 May 2023), 2007.
Karl, M., Brauers, T., Dorn, H. P., Holland, F., Komenda, M., Poppe, D., Rohrer, F., Rupp, L., Schaub, A., and Wahner, A.: Kinetic Study of the OH-isoprene and O3-isoprene reaction in the atmosphere simulation chamber, SAPHIR, Geophys. Res. Lett., 31, L05117, https://doi.org/10.1029/2003gl019189, 2004.
Malkin, T. L., Goddard, A., Heard, D. E., and Seakins, P. W.: Measurements of OH and HO2 yields from the gas phase ozonolysis of isoprene, Atmos. Chem. Phys., 10, 1441–1459, https://doi.org/10.5194/acp-10-1441-2010, 2010.
Mao, J., Ren, X., Zhang, L., Van Duin, D. M., Cohen, R. C., Park, J.-H., Goldstein, A. H., Paulot, F., Beaver, M. R., Crounse, J. D., Wennberg, P. O., DiGangi, J. P., Henry, S. B., Keutsch, F. N., Park, C., Schade, G. W., Wolfe, G. M., Thornton, J. A., and Brune, W. H.: Insights into hydroxyl measurements and atmospheric oxidation in a California forest, Atmos. Chem. Phys., 12, 8009–8020, https://doi.org/10.5194/acp-12-8009-2012, 2012.
Marno, D., Ernest, C., Hens, K., Javed, U., Klimach, T., Martinez, M., Rudolf, M., Lelieveld, J., and Harder, H.: Calibration of an airborne HOx instrument using the All Pressure Altitude-based Calibrator for HOx Experimentation (APACHE), Atmos. Meas. Tech., 13, 2711–2731, https://doi.org/10.5194/amt-13-2711-2020, 2020.
Novelli, A., Hens, K., Tatum Ernest, C., Kubistin, D., Regelin, E., Elste, T., Plass-Dülmer, C., Martinez, M., Lelieveld, J., and Harder, H.: Characterisation of an inlet pre-injector laser-induced fluorescence instrument for the measurement of atmospheric hydroxyl radicals, Atmos. Meas. Tech., 7, 3413–3430, https://doi.org/10.5194/amt-7-3413-2014, 2014.
Novelli, A., Hens, K., Tatum Ernest, C., Martinez, M., Nölscher, A. C., Sinha, V., Paasonen, P., Petäjä, T., Sipilä, M., Elste, T., Plass-Dülmer, C., Phillips, G. J., Kubistin, D., Williams, J., Vereecken, L., Lelieveld, J., and Harder, H.: Estimating the atmospheric concentration of Criegee intermediates and their possible interference in a FAGE-LIF instrument, Atmos. Chem. Phys., 17, 7807–7826, https://doi.org/10.5194/acp-17-7807-2017, 2017.
Onel, L., Brennan, A., Gianella, M., Ronnie, G., Lawry Aguila, A., Hancock, G., Whalley, L., Seakins, P. W., Ritchie, G. A. D., and Heard, D. E.: An intercomparison of HO2 measurements by fluorescence assay by gas expansion and cavity ring-down spectroscopy within HIRAC (Highly Instrumented Reactor for Atmospheric Chemistry), Atmos. Meas. Tech., 10, 4877–4894, https://doi.org/10.5194/amt-10-4877-2017, 2017a.
Onel, L., Brennan, A., Seakins, P. W., Whalley, L., and Heard, D. E.: A new method for atmospheric detection of the CH3O2 radical, Atmos. Meas. Tech., 10, 3985–4000, https://doi.org/10.5194/amt-10-3985-2017, 2017b.
Onel, L., Brennan, A., Gianella, M., Hooper, J., Ng, N., Hancock, G., Whalley, L., Seakins, P. W., Ritchie, G. A. D., and Heard, D. E.: An intercomparison of CH3O2 measurements by fluorescence assay by gas expansion and cavity ring-down spectroscopy within HIRAC (Highly Instrumented Reactor for Atmospheric Chemistry), Atmos. Meas. Tech., 13, 2441–2456, https://doi.org/10.5194/amt-13-2441-2020, 2020.
Regelin, E., Harder, H., Martinez, M., Kubistin, D., Tatum Ernest, C., Bozem, H., Klippel, T., Hosaynali-Beygi, Z., Fischer, H., Sander, R., Jöckel, P., Königstedt, R., and Lelieveld, J.: HOx measurements in the summertime upper troposphere over Europe: a comparison of observations to a box model and a 3-D model, Atmos. Chem. Phys., 13, 10703–10720, https://doi.org/10.5194/acp-13-10703-2013, 2013.
Savitzky, A. and Golay, M. J. E.: Smoothing and Differentiation of Data by Simplified Least Squares Procedures, Anal. Chem., 36, 1627–1639, https://doi.org/10.1021/ac60214a047, 1964.
Schlosser, E., Brauers, T., Dorn, H.-P., Fuchs, H., Häseler, R., Hofzumahaus, A., Holland, F., Wahner, A., Kanaya, Y., Kajii, Y., Miyamoto, K., Nishida, S., Watanabe, K., Yoshino, A., Kubistin, D., Martinez, M., Rudolf, M., Harder, H., Berresheim, H., Elste, T., Plass-Dülmer, C., Stange, G., and Schurath, U.: Technical Note: Formal blind intercomparison of OH measurements: results from the international campaign HOxComp, Atmos. Chem. Phys., 9, 7923–7948, https://doi.org/10.5194/acp-9-7923-2009, 2009.
Stone, D., Whalley, L. K., and Heard, D. E.: Tropospheric OH and HO2 radicals: field measurements and model comparisons, Chem. Soc. Rev., 41, 6348–6404, https://doi.org/10.1039/c2cs35140d, 2012.
Wang, G. Y., Iradukunda, Y., Shi, G. F., Sanga, P., Niu, X. L., and Wu, Z. J.: Hydroxyl, hydroperoxyl free radicals determination methods in atmosphere and troposphere, J. Environ. Sci., 99, 324–335, https://doi.org/10.1016/j.jes.2020.06.038, 2021.
Whalley, L. K., Furneaux, K. L., Gravestock, T. J., Atkinson, H. M., Bale, C. S. E., Ingham, T., Bloss, W. J., and Heard, D. E.: Detection of iodine monoxide radicals in the marine boundary layer using laser induced fluorescence spectroscopy, J. Atmos. Chem., 58, 19–39, 2007.
Whalley, L. K., Blitz, M. A., Desservettaz, M., Seakins, P. W., and Heard, D. E.: Reporting the sensitivity of laser-induced fluorescence instruments used for HO2 detection to an interference from RO2 radicals and introducing a novel approach that enables HO2 and certain RO2 types to be selectively measured, Atmos. Meas. Tech., 6, 3425–3440, https://doi.org/10.5194/amt-6-3425-2013, 2013.
Winiberg, F. A. F.: Characterisation of FAGE apparatus for HOx detection and application in an environmental chamber, PhD, School of Chemistry, University of Leeds, Leeds, 232 pp., 2014.
Winiberg, F. A. F., Smith, S. C., Bejan, I., Brumby, C. A., Ingham, T., Malkin, T. L., Orr, S. C., Heard, D. E., and Seakins, P. W.: Pressure-dependent calibration of the OH and HO2 channels of a FAGE HOx instrument using the Highly Instrumented Reactor for Atmospheric Chemistry (HIRAC), Atmos. Meas. Tech., 8, 523–540, https://doi.org/10.5194/amt-8-523-2015, 2015.
Winiberg, F. A. F., Dillon, T. J., Orr, S. C., Groß, C. B. M., Bejan, I., Brumby, C. A., Evans, M. J., Smith, S. C., Heard, D. E., and Seakins, P. W.: Direct measurements of OH and other product yields from the HO2 + CH3C(O)O2 reaction, Atmos. Chem. Phys., 16, 4023–4042, https://doi.org/10.5194/acp-16-4023-2016, 2016.
Woodward-Massey, R., Slater, E. J., Alen, J., Ingham, T., Cryer, D. R., Stimpson, L. M., Ye, C., Seakins, P. W., Whalley, L. K., and Heard, D. E.: Implementation of a chemical background method for atmospheric OH measurements by laser-induced fluorescence: characterisation and observations from the UK and China, Atmos. Meas. Tech., 13, 3119–3146, https://doi.org/10.5194/amt-13-3119-2020, 2020.