the Creative Commons Attribution 4.0 License.
the Creative Commons Attribution 4.0 License.
 | 09 Oct 2023
Pressure-dependent performance of two CEN-specified condensation particle counters
Paulus S. Bauer
Dorian Spät
Martina Eisenhut
Andreas Gattringer
Bernadett Weinzierl
One of the most important parameters to quantify an aerosol is the particle number concentration. Condensation particle counters (CPCs) are commonly used to measure the aerosol number concentration in the nanometer size range. To compare the data from different measurement stations and campaigns, it is important to harmonize the instrument specifications, which is why the CEN/TS 16976:2016 technical specification was introduced for CPCs. Therein, the parameters of the CEN CPC are specified for standard pressure and temperature. However, CEN CPCs are used in various surroundings, on high mountains or on airplanes, where they are exposed to low-pressure conditions. Here, we present the pressure-dependent performance (including the concentration linearity and counting efficiency) of two different models of CEN CPCs, the Grimm 5410 CEN and the TSI 3772 CEN. We found that their performance at 1000 and 750 hPa was in accordance with the CEN technical specifications. Below 500 hPa, the performance decreased for both CPC models, but the decrease was different for the two models. To gain insight into the performance of the two CPC models, we performed a simulation study. This study included simulations of the saturation profiles and calculations of internal particle losses within the CPCs. The simulations reproduced the overall performance decrease with decreasing pressure and reveal that the internal structure of the CPC has a significant influence on the performance. We anticipate our publication to provide a deeper understanding of the counting efficiency of CPCs and their pressure dependence. Our findings might be a starting point for new standards that include the pressure-dependent performance, or they could help in designing new CPCs.
- Article
(2595 KB) - Full-text XML
-
Supplement
(884 KB) - BibTeX
- EndNote


Atmospheric aerosol substantially influences human health (Oberdörster et al., 2005; WHO, 2016) and our climate (e.g., IPCC, 2021, 2013). Therefore, it is constantly monitored either by ground-based measurement stations (such as Aerosol, Clouds and Trace Gases Research Infrastructure (ACTRIS) and Global Atmosphere Watch (GAW); Asmi et al., 2013; Rose et al., 2021) or by aircraft measurements (IAGOS, the ATOM mission, A-LIFE, and many other ones; Bundke et al., 2015; Williamson et al., 2018; Brock et al., 2019; Kupc et al., 2018; Weinzierl et al., 2017; Thompson et al., 2022; Schöberl et al., 2023). The particle number concentration is an important parameter for quantifying the abundance of these short-lived atmospheric components. Condensation particle counters (CPCs) are commonly used to assess the number concentration directly in the nanometer size range. CPCs are operated under various environmental conditions including measurements at alpine monitoring stations, e.g., Sonnblick Observatory (SBO; Rose et al., 2021) or the Himalayas (Bianchi et al., 2020), and in aircraft (Bundke et al., 2015; Williamson et al., 2018; Brock et al., 2019; Kupc et al., 2018). Due to the decreased ambient pressure at these altitudes, the instruments' performance might change. Since more than 30 years the pressure-dependent performance of CPCs is evaluated in numerous studies (e.g., Hermann and Wiedensohler, 2001; Zhang and Liu, 1991, 1990; Schröder and Ström, 1997; Heintzenberg and Ogren, 1985; Noone and Hansson, 1990; Dreiling and Jaenicke, 1988; Cofer et al., 1998). Most of these studies have used butanol-based CPCs, but there are also studies with different working fluids (e.g., Hermann et al., 2005; Bezantakos and Biskos, 2021; Mei et al., 2021; Weigel et al., 2009) or with different analysis and correction methods (e.g., Takegawa and Sakurai, 2011; Seifert et al., 2004; Saros et al., 1996) to account for performance differences with varying pressure.
However, these studies evaluated mostly one CPC type with individual performances. To compare and evaluate the data from different monitoring stations and measurement campaigns, it is important to harmonize the instrument specifications. The CEN/TS 16976:2016 technical specification (CEN/TS 16976, 2016, published in 2016 and currently valid but changes expected with the next revision) defines the CPC specifications at standard pressure and temperature (details in Sect. 1.2). It is therefore possible to directly compare the performance of different CEN CPC models at ambient conditions but also under varying pressure conditions. Thus, the presented study aims at assessing the pressure-dependent performance of two models of CEN-CPCs, namely the Grimm 5410 CEN (in the following referred to as Grimm CPC) and the TSI 3772 CEN (in the following referred to as TSI CPC) (details on the CPCs in Sect. 1.2).
1.1 The counting efficiency of condensation particle counters
Condensation particle counters represent one of the oldest measurement techniques in aerosol science, and various different types of CPCs have been developed (McMurry, 2000). In this study we focused on continuous-flow thermal-diffusion-type CPCs with an alcohol-based working fluid (McMurry, 2000). This means that the aerosol is continuously sampled by a CPC, consisting of a saturator, a condenser, and a detection unit. For alcohol-based CPCs, the saturator is operated at a higher temperature compared to the condenser, since the thermal diffusion rate (heat transfer) in air is higher than the diffusion rate of the (relatively large) alcohol molecules (Iida et al., 2009; McMurry, 2000; Hering and Stolzenburg, 2005). In the warm saturator, the working fluid is vaporized and saturates the aerosol. Afterwards the aerosol enters the cold condenser where supersaturation is generated by thermal and vapor diffusion due to the rapid temperature change. Depending on the supersaturation, particle size, and chemical composition, particles are activated by heterogeneous nucleation. By subsequent condensational growth, the activated particles grow to sizes large enough to be optically counted (e.g., with a laser) in the detector unit.
One important parameter to quantify the performance of a CPC is the counting efficiency ηCPC as a function of the particle size dp. According to Stolzenburg and McMurry (1991), the CPC counting efficiency can be decomposed into
where ηs is the sampling efficiency, ηa the activation efficiency, and ηd the detector efficiency inside the CPC. The sampling efficiency ηs is determined by the sampling and transport losses inside the CPC. The activation efficiency ηa accounts for the fraction of particles that are activated by heterogeneous nucleation in the condenser. Here it should be pointed out that the activation efficiency does not only depend on particle size but also on the interactions between the particle and the vapor, e.g., solubility and wettability (Kupc et al., 2013). These chemical-dependent variables are not considered in this study but are discussed in other publications (e.g., Wlasits et al., 2020; Giechaskiel et al., 2011; Köhler, 1936). The detector efficiency ηd comprises all activated particles that grow to droplets large enough to be measured by the optical detection system. In the original publication by Stolzenburg and McMurry (1991) the “detector efficiency ηd” is named “detection efficiency”; however we renamed it to avoid confusion with the term detection efficiency, which is sometimes used synonymously for the counting efficiency ηCPC. In general, these three different efficiencies inside the CPC cannot be measured individually but can only be evaluated theoretically using simulations.
The experimental approach to measure the counting efficiency is to generate a monodisperse aerosol with a defined particle size dp (conventionally using a differential mobility analyzer, DMA; multiple charged particles have to be taken into account). For different particle sizes, the detected concentration of the CPC, NCPC, is then compared to the concentration of a reference instrument NREF (conventionally a Faraday cup electrometer, FCE):
The measured concentrations (NCPC and NREF) also contain the transport efficiencies to the instruments and the size distribution of the aerosol (i.a. DMA transfer function), which must be considered for the exact counting efficiency (details in Stolzenburg and McMurry, 1991). Several measures were taken to minimize these effects described in the Methods section. As a result, the experimental counting efficiency is calculated as stated in Eq. (2) in this study.
The counting efficiency curve η(dp) has a very specific form with an increasing slope and a plateau region going from the small to the large particle sizes (see Fig. 3 for an example). It can be described by three important parameters, which are the plateau counting efficiency ηplat, the cut-off diameter dp,50, and the onset diameter dp,0. Going from the largest sizes to the smallest, the plateau counting efficiency µm) is the counting efficiency at large particle sizes (at least much larger than the cut-off diameter dp,50; see next parameter) and is ideally ηplat=100 % for the CEN-specified ambient conditions (see Sect. 1.2). The cut-off diameter dp,50 is the diameter where the counting efficiency reaches 50 %, %. The cut-off diameter is conventionally seen as the lower detection limit of the measurement range of a CPC. The third parameter is the onset diameter dp,0, which is the diameter of the smallest particles that are detected by the CPC, %. Since the onset diameter cannot be obtained directly with these types of measurements, simulations or a fit function are utilized. The fit function including these three parameters is (Tuch et al., 2016; Stolzenburg and McMurry, 1991; ISO27891, 2015)
It should be pointed out that the fitted cut-off diameter dp,50fit ( %) is only equal to the previously defined cut-off diameter dp,50 if the plateau counting efficiency is ηplat=100 %. The fitted cut-off diameter dp,50fit is shifted to lower diameters compared to the cut-off diameter dp,50 if the plateau counting efficiency ηplat is lower than 100 %.
To describe the increasing slope of the counting efficiency curve η(dp), we introduce the edge steepness parameter ε. Ideally the steepness is the derivative of the counting efficiency curve in the slope region. We approximate this derivative with the difference quotient between the onset and the cut-off diameter. We therefore define the edge steepness parameter as
where dp,0 is the onset diameter derived from the fit, and dp,50 is the cut-off diameter. In principle, the edged steepness could be calculated with the fitted cut-off diameter dp,50fit. However, dp,50fit depends on the plateau counting efficiency ηplat, which is why we will not use dp,50fit for the edge steepness in this publication. In general, the edge steepness ε represents the percentual increase in the counting efficiency per nanometer of particle size between 0 % and 50 %, and thus a steeper slope will give a larger edge steepness ε.
1.2 CEN 16976:2016 technical specification
The CEN/TS 16976:2016 technical specification, entitled “Determination of the particle number concentration of atmospheric aerosol”, was published in 2016. It covers a variety of related topics, ranging from the sampling inlet system to the specifications of the counting devices, which in this case is a CPC. Some specifications are based on ISO27891:2015 (“Aerosol particle number concentration – Calibration of condensation particle counters”), published in 2015. CEN/TS 16976 will become a European standard in the near future, and some parameters (e.g., the cut-off diameter dp,50 or pressure calibration) might change. However, when the publication was written, CEN/TS 16976:2016 was still valid, and the most relevant specifications for the presented study are summarized in the following paragraphs.
The CPC has to be a full-flow CPC, which means that there is no internal dilution of the aerosol flow inside the CPC. The volumetric flow rate should only deviate by 5 % from the nominal volumetric flow rate. The working fluid has to be n-butanol. Silver nanoparticles generated by the evaporation–condensation method (Scheibel and Porstendörfer, 1983) have to be used for the verification of the counting efficiency. The particle concentration should be between 3000 and 10 000 cm−3. However, it is not clearly specified if that concentration is determined using the CPC or the reference instrument and which carrier gas should be used (air or N2). The linearity of the concentration of the CPC in the plateau region has to be measured at one fixed particle diameter between 30 and 50 nm by varying the concentration. The linearity (and hence the plateau counting efficiency ηplat) has to be 1 ± 5 %. The cut-off diameter has to be determined by a fit, Eq. (3), and dp,50fit should be 7 ± 0.7 nm. Since the plateau counting efficiency should be nearly 1, the fitted dp,50fit is almost equal to the cut-off dp,50. However, for some of the following measurements, at low pressure the plateau is lower than 1, and thus both cut-off diameter parameters (dp,50 and dp,50fit) have to be considered.
In addition to the cut-off diameter, the diameter corresponding to a counting efficiency of 90 % dp,90 should be below 14 nm. The measurements of the counting efficiency should be done at two different temperatures (15 and 30 ∘C) and at two different pressures, one higher than 900 hPa and one 200 hPa lower compared to an unknown reference. At this point, the technical specification is vague as it lacks a reference for the lower-pressure measurement and does not contain specifications for a setup capable of creating these low-pressure conditions.
The standard temperature T0 = 296.15 K, the standard pressure p0 = 1013.25 hPa, the equations for the mean free path λair(T,p), the dynamic viscosity μ(T), and the Cunningham correction factor Cc(dp,λair) are specified in CEN/TS 16976 and can be found in Wiedensohler et al. (2012).
CEN-specified condensation particle counters
We tested two different models of CEN-specified CPCs: the Grimm 5410 CEN and the TSI 3772 CEN. Here the characteristics of both CPC models are presented in alphabetical order. The parameters of the two CPCs are presented in Table 1. Both CPC models are specified as full-flow CPCs with n-butanol as the working fluid, and they require an external vacuum pump.
Table 1Flow rates and temperatures of the Grimm 5410 CEN CPC and the TSI 3772 CEN CPC. The butanol saturation vapor pressures for the saturator and condenser are important for the simulations. They are calculated for the corresponding temperatures.
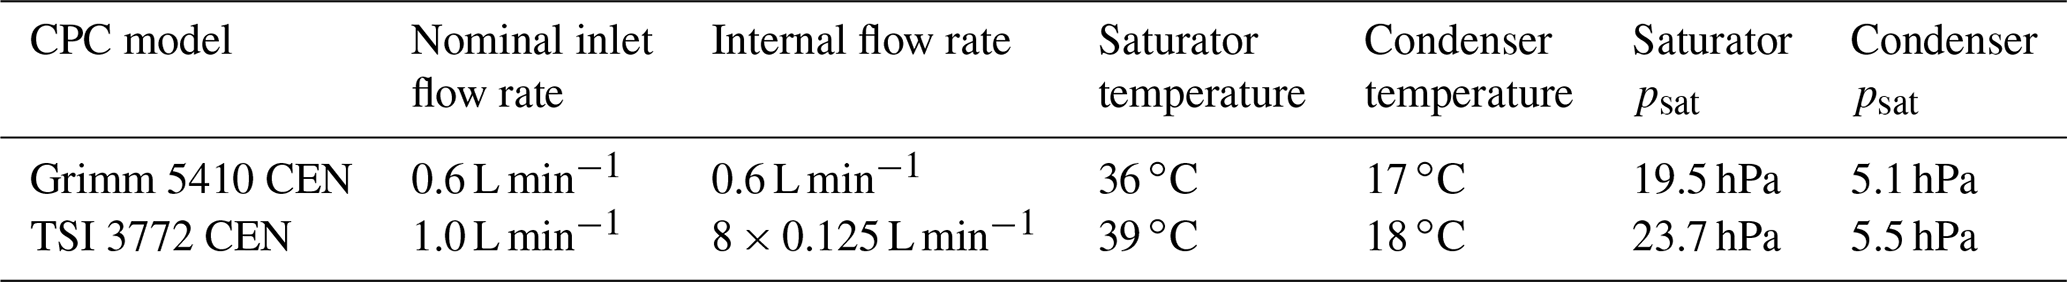
The Grimm 5410 CEN has a nominal flow rate of 0.6 L min−1 controlled by a temperature-stabilized critical orifice. The saturator temperature is Tsat = 36 ∘C, and the condenser temperature is Tcon = 17 ∘C. The Grimm saturator has a displacer rod in the center, which must be considered to be an annular tube in simulations and particle loss calculations. Single-particle counting is possible up to 105 cm−3 with internal coincidence correction for the Grimm CPC (Manual Grimm 5410; Grimm, 2020).
The TSI 3772 CEN has a nominal flow rate of 1 L min−1 controlled by a critical orifice. The flow is internally split up into eight pathways, each with a flow rate of 0.125 L min−1 for the condenser and saturator part (Kangasluoma et al., 2014). The saturator temperature is Tsat = 39 ∘C, and the condenser temperature is Tcon = 18 ∘C. Single-particle counting is possible up to 5 × 104 cm−3 with live-time coincidence correction for the TSI CPC (Manual TSI 3772 CEN; TSI, 2016).
2.1 Experimental setup
Figure 1 shows a schematic of the setup that we used to characterize the performance of the CEN CPCs under low-pressure conditions. According to the CEN/TS 16976:2016, silver nanoparticles were generated via the evaporation–condensation method (Scheibel and Porstendörfer, 1983). Silver was heated between 940 and 1050 ∘C in a tube furnace and subsequently cooled with a Liebig water cooler (15 ∘C). A dilution flow was added to adjust the number concentration and size distribution of the nanoparticles. The furnace flow and the dilution flow were operated with laboratory-pressurized air. Each flow was equipped with a needle valve, a silica-gel dryer, a HEPA filter, and a mass flow meter (TSI 4140) for precise flow control. The relative humidity of the air supply was kept below 10 %.
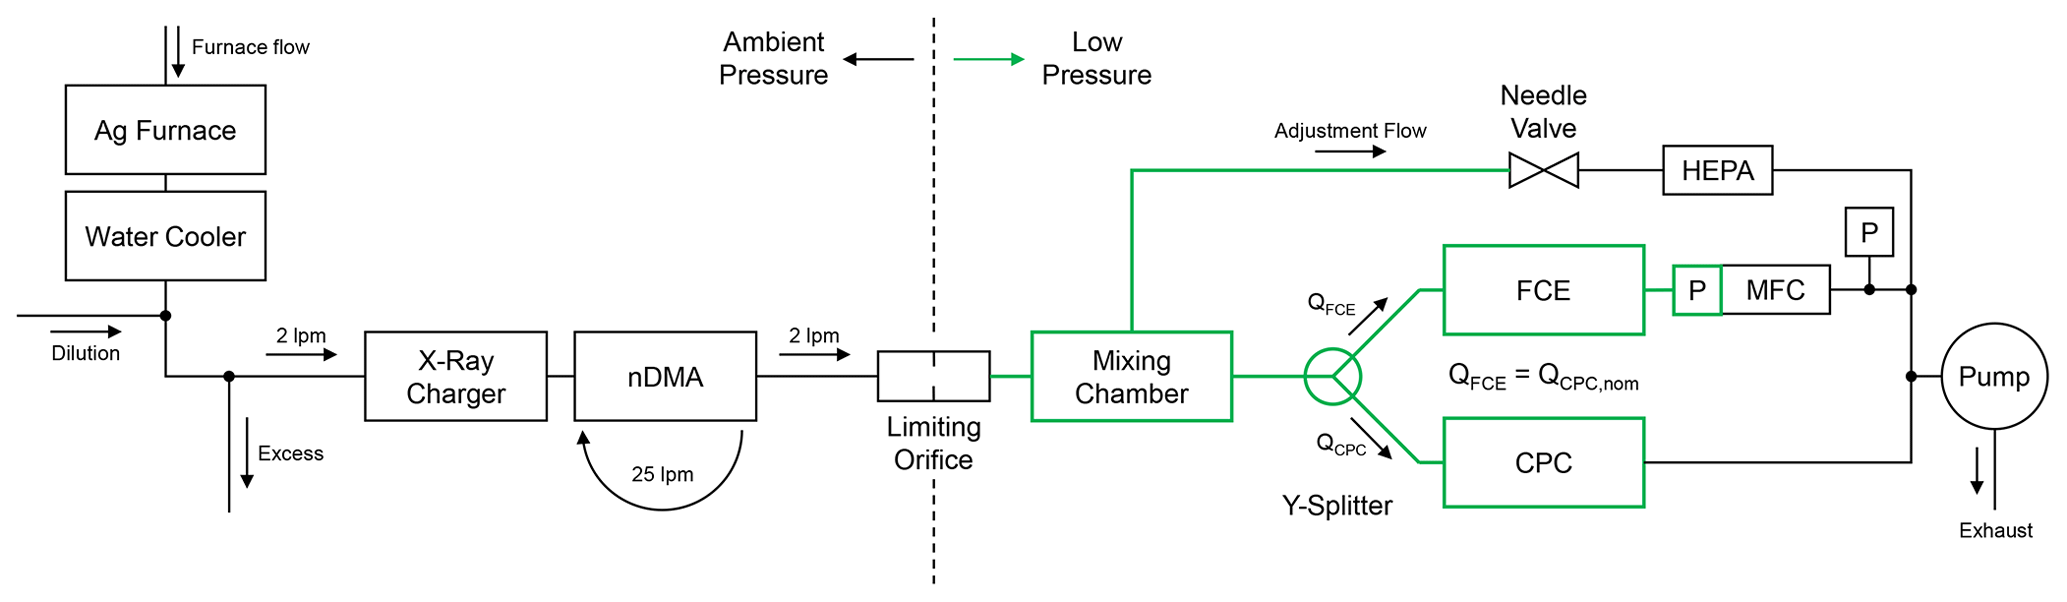
Figure 1Schematic setup to measure the counting efficiencies of CEN CPCs under low-pressure conditions. The green part indicates where the relevant pressure conditions are. The limiting orifice was replaced by a stainless-steel tube during ambient pressure measurements. If the pressure ratio at the limiting orifice was smaller than 0.528, the limiting orifice acted as a critical orifice with a constant flow rate of 2.1 L min−1. The flow rate of the FCE (QFCE) was controlled by a mass flow controller (MFC) which was set to the same volumetric flow rate as the nominal flow rate of the investigated CPC (QCPC,nom). The MFC pressure sensor (P at MFC) was used as a reference for the different pressure settings (in the green part). A separate pressure gauge (P) measured the pressure in front of the pump.
The particles were selected corresponding to their electrical mobility with a classification system consisting of a soft X-ray charger (TSI 3087) and a custom-made Vienna-type differential mobility analyzer (DMA; presented in Winkler et al., 2008b, and Wlasits et al., 2020, referred to as a nano-DMA). A positive voltage was applied to select negatively charged particles with an equivalent mobility diameter ranging from 4 to 30 nm. A sheath air flow of 25 L min−1 was generated with a closed-loop flow system, including HEPA filters, a silica-gel dryer, a critical orifice, and a pump. The flow through the classification system (often referred to as Qa, the aerosol flow, or Qs, the sample flow) was determined by the flow of the sampling system (mostly the flow through the limiting orifice). The resolution of the DMA defined by the flow ratio (Flagan, 1999) was therefore nearly constant at 1 : 10 for all measurements. Diffusional broadening inside the DMA was not considered as the relevant mobility diameters were above 5 nm (Wlasits et al., 2020). Multiple charged particles were considered as described in the “Experimental procedure”, Sect. 2.2.
For low-pressure measurements, particles must either be size-selected (mobility-selected) in the low-pressure region (Hermann and Wiedensohler, 2001), or the monodisperse particles must be transferred into the low-pressure region via a valve (Zhang and Liu, 1991) or an orifice (Takegawa and Sakurai, 2011). We tested the valve and the orifice system, both resulting in similar counting efficiencies (not shown in this publication). However, the setup with the orifice similar to Takegawa and Sakurai (2011) yielded higher particle concentrations and better control regarding concentration and pressure; hence we used this setup. We did not see any charging artifacts in either system (see discussion in Hermann and Wiedensohler, 2001, and Takegawa and Sakurai, 2011). The green part in Fig. 1 indicates where the relevant pressure conditions are. For measurements at ambient pressure, the critical orifice was replaced by a stainless-steel pipe and the sampling flow was adjusted to 2.0 ± 0.1 L min−1. At our measurement location in Vienna, the average ambient pressure was 996 ± 15 hPa during our measurement period, which is why we label all ambient pressure stages as 1000 hPa. At the 750 hPa pressure stage (after the orifice), we measured a flow rate of 1.9 ± 0.1 L min−1 (in front of the orifice). For the pressure stages at 500 hPa and below, a critical pressure ratio (pressure after and before the orifice) (Wiggert et al., 2016; Rathakrishnan, 2017) was sustained, ensuring a stable flow of 2.1 L min−1.
After the orifice, an aluminum mixing chamber assured that the aerosol was relaxed and well mixed before the splitter. The “adjustment flow”, which exits the mixing chamber halfway, controls the pressure stages. The stainless steel Y splitter guaranteed equal splitting of the aerosol flow for the detection instruments, which was verified by swapping the instruments from one outlet to the other. From the DMA to the Y splitter, every part and connection consisted of metal, and the instrumentation was attached with conductive tubing of equal length to reduce electrostatic deposition and ensure similar transport losses for all instruments.
As a reference instrument we used a Faraday cup electrometer (FCE) from TAPCON (Winkler et al., 2008b, a). The volumetric flow rate of the FCE was set to the nominal flow rate of the CPC (QGrimm = 0.6 L min−1, QTSI = 1 L min−1) using an Alicat mass flow controller (MC series). The pressure sensor (precision ±0.1 %) of the mass flow controller was also used as a reference instrument for our pressure stages (green part in Fig. 1). A pressure gauge [P] (Jumo Delos SI, precision ±0.35 %) measured the pressure before the Agilent pump, which was max. 50 hPa. This assured that the flow of the CPC's critical orifice stayed choked (; Wiggert et al., 2016; Rathakrishnan, 2017) for all pressure stages down to 150 hPa. With the Jumo pressure gauge, we also verified the pressure stability at various points between the limiting orifice and the instrumentation, which was consistent with the pressure reading of the mass flow controller.
2.2 Experimental procedure
Before we started with the counting efficiency measurements, we analyzed the size distribution of the silver nanoparticles by operating the DMA in scanning mode. We adjusted the temperatures and flows of the furnace to produce a minimum particle concentration of 2000 cm−3 and a maximum of 20 000 cm−3 measured by the FCE in the mobility size range between 4 and 30 nm. CEN/TS 16976:2016 restricts the maximum particle concentration to 10 000 cm−3; however it is not clearly specified whether this maximum concentration applies to the CPC or the FCE. Furthermore, both CPCs are built to measure particle concentrations of up to 50 000 cm−3 (TSI 3772 CEN) or even beyond (Grimm 5410 CEN), when coincidence correction is switched on. Both CPC models come with an internal coincidence correction (e.g., “live-time correction” for TSI 3772 CEN), which is why we chose the corrected concentration output of the CPCs (NCPC) for our data analysis.
To avoid multiply charged particles, the size distribution was adjusted so that the mode of the distribution was lower than 30 nm and the concentration at 30 nm was on the lower end (slightly above 2000 cm−3). For the linear response and concentration comparison between CPC and FCE, CEN/TS 16976:2016 recommends mobility particle sizes of 40 ± 10 nm. We used 30 nm particles selected from the right flank of the size distribution, where they can be considered to be singly charged particles (Tuch et al., 2016; Wiedensohler, 1988).
The experimental procedure for the counting efficiency measurements was automated and always started with a 2 min zero measurement (0 V at the DMA) to set the reference for the FCE and check the zero counts of the CPC. Then we alternately set 0 V for 1 min and the voltage for the desired mobility diameters for 2 min at the DMA. The data (about 10 to 20 s) before and after each voltage transition were removed before taking the average because of spikes in the concentration when the voltage was ramped up or down (Takegawa and Sakurai, 2011). For the FCE, we took the mean of the zero measurements before and after the 2 min interval and subtracted the result from the mean of the 2 min interval to correct for the FCE background. The uncertainties resulting from this procedure were analyzed with Gaussian error propagation. To account for day-to-day variations, we started each measurement day with a counting efficiency measurement at ambient pressure (labeled as 1000 hPa) and checked that it was consistent with previous measurements with instruments of the same type. In addition, we checked the flow rate of the sheath air flow (in and out of the DMA) and the flow before and after the DMA each time the flow or the pressure level was changed.
For the low-pressure measurements, the butanol supply of the CPCs was removed, and the auto-fill mode was switched off to avoid pressure leakage or flooding of the CPC. The stability of the counting efficiency without butanol supply was checked for both CPC models by monitoring the efficiency of 30 nm particles over a long period of several hours, similar to Takegawa and Sakurai (2011). Even for the lowest pressure settings where butanol diffusion and hence butanol losses are the largest, we were able to measure more than 6 h without any change in the counting efficiency. Despite these results, we filled up the CPCs with butanol after each counting efficiency measurement routine under low pressure to assure equal conditions for each measurement.
2.3 Simulation methods
A simulation of the CPC is needed to investigate the individual efficiencies from Eq. (1) leading to the total counting efficiency measured experimentally. There are many publications simulating the condenser or the whole CPC to investigate these efficiencies (e.g., Stolzenburg and McMurry, 1991; Zhang and Liu, 1990; Hering and Stolzenburg, 2005; Giechaskiel et al., 2011; Reinisch et al., 2019). The heart of these simulations is the equations for heat and mass transfer to calculate the temperature and vapor pressure profiles inside the CPC. The temperature profiles from a tube, where the wall temperature makes a sudden step change similar to in a CPC, has been known in literature since the end of the 19th century as the Graetz–Nusselt problem (Eckert and Drake, 1972; Bird et al., 2002). The solution to the Graetz–Nusselt problem is often used as a reference for the simulations (e.g., Giechaskiel et al., 2011; Reinisch et al., 2019).
For our simulations we have made several assumptions: the problem is cylindrical symmetric, so we consider only the axial (z) and radial (r) direction. We normalized the axial and radial distance with the radius of the tube Rt. The flow is incompressible and laminar and has a fully developed parabolic flow profile ), where is the average velocity of the flow and Q the volumetric flow rate (m3 s−1). We do not consider any diffusion in axial direction nor coupling effects between mass and thermal diffusion, nor effects from Stefan flow (Stolzenburg and McMurry, 1991). Heat and mass transfer onto the growing droplets is negligible (Zhang and Liu, 1990), and particle–particle interactions are neglected (Stolzenburg and McMurry, 1991). Thus, the results from the simulation are most accurate for monodisperse aerosol with a low particle concentration to neglect vapor depletion effects.
With these assumptions, the equations for heat and mass transfer can be reduced to
where Pe is the Péclet number, and ψ is a placeholder variable that could either be the temperature T or the partial vapor pressure pv for the heat and mass transfer equations, respectively. The derivation of Eq. (5) can be found in the Supplement or partly in Bird et al. (2002). To solve this partial differential equation, we used the FEniCS computer platform (Alnæs et al., 2015).
The physical properties of the gas, the butanol vapor, and the operating parameters of the CPC are incorporated into the Péclet number. The Péclet number Pe is a dimensionless number comparing the advective and the diffusive transport rate. For thermal processes, the Péclet number PeT can be decomposed into the dimensionless Reynolds Re and Prandtl number Pr:
where ν (m2 s−1) is the kinematic viscosity (), μ (Pa s) the dynamic viscosity, ρ the density of the gas (kg m−3), α (m2 s−1) the thermal diffusivity (), kT (W m−1 K−1) the thermal conductivity, and cp (J kg−1 K−1) the specific heat capacity at constant pressure. For the partial vapor pressure, the Péclet number Pe can be decomposed into the dimensionless Reynolds Re and Schmidt number Sc:
where Dv (m2 s−1) is the (binary) diffusion constant of the vapor in air. In Zhang and Liu (1990), it is shown that the Prandtl number Pr and the Schmidt number Sc only depend on temperature and not on pressure. However, the Reynolds number can be written as
where Re0, Q0, and p0 are the Reynolds number, the volumetric flow rate, and the pressure at standard operation conditions. This implies that either a reduction of the pressure by some factor or a reduction of the volumetric flow rate by the same factor results in the same heat and mass transfer equations (Zhang and Liu, 1990). We will only focus on the pressure dependence in this publication.
To solve the partial differential equation (Eq. 5), several boundary conditions are necessary. In most CPC simulation studies (e.g., Zhang and Liu, 1990; Hering and Stolzenburg, 2005; Giechaskiel et al., 2011), only the condenser of the CPC is simulated. However, we included the insulator between the saturator and condenser in our simulations similar to Reinisch et al. (2019), which is of importance especially for the low-pressure cases. In the insulator, the wall temperature Twall is linearly decreasing from the saturator temperature Tsat to the condenser temperature Tcon. In the condenser the wall temperature Twall is constant at the condenser temperature Tcon. The partial vapor at the wall pwall=psat(Twall) is set to the saturation vapor pressure at wall temperature. The incoming aerosol has the temperature of the saturator Tsat and is considered to be fully saturated with butanol vapor (Reinisch et al., 2019). This is especially true for the low-pressure case because the molecular diffusion is enhanced if the pressure is reduced, and hence the aerosol gets saturated more easily. The vapor pressure of the incoming aerosol pv=psat(Tsat) is set to the saturation vapor pressure at saturator temperature.
With the resulting temperature T and partial vapor pressure pv profiles, we calculated the saturation ratio profiles, , where psat(T) is the saturation vapor pressure at temperature T. Each point of the saturation ratio profile S and temperature profile T can be linked to an equilibrium diameter DK,eq via Kelvin theory:
where σs, Mw, and ρl are the surface tension, the molecular weight, and the density of the condensing fluid (in our case liquid butanol); R is the universal gas constant; and T is the absolute temperature (Winkler and Wagner, 2022). This so-called Kelvin diameter represents the minimal particle size that gets activated in the conditions present around the particle.
To calculate the activation efficiency ηa from the simulations, we discretized the profiles into axial Kax and radial Krad bins. Then the Kelvin diameter was calculated for each bin. For each particle size dp and for each radial bin (with the normalized radius ), we determined if and where (in axial direction) the particle gets first activated. With this information, we calculated the concentration of activated particles Nact(dp,ri) for each particle size and radial bin, which we compared to the incoming number concentration Nin(dp,ri). We then computed the activation efficiency ηa with (Giechaskiel et al., 2011; Reinisch et al., 2019)
Here the factor ) accounts for the flow profile and the factor for the increase in the bin size and hence particle number concentration for each bin with the radial position (Reinisch et al., 2019).
To investigate the total counting efficiency of Eq. (1), we examined the sampling efficiency ηs, which includes the particle losses from the inlet of the CPC to its condenser. For the size range below 100 nm we only considered diffusional losses, and therefore we implemented Eqs. (21) and (22) from von der Weiden et al. (2009) for cylindrical tubes. For the particle losses in the annular saturator of the Grimm CPC, we used the formula from Talebizadehsardari et al. (2020). The detector efficiency ηd includes the growth of the particles to optical sizes, which we have analyzed with a growth model (in the Supplement). To conclude, all activated particles can be considered optically detectable due to the rapid growth (details in Hering and Stolzenburg, 2005; Giechaskiel et al., 2011). Neither losses in the focusing region nor in the optic section of the CPC were studied in this publication, and thus we set the detector efficiency ηd=1.
3.1 Experimental results
We analyzed four identically constructed Grimm 5410 CEN CPCs and two identically constructed TSI 3772 CEN CPCs. We conducted measurements at the pressure levels of 1000, 750, 500, 375 (only TSI CPCs), 250, and 150 hPa (only Grimm CPCs). In the first set of experiments, we analyzed the linearity of the CPCs compared to the reference FCE, shown in Fig. 2. In a second set of experiments, the size-dependent counting efficiency curves for different pressure stages are shown in Fig. 3. The results of the fits performed in Figs. 2 and 3 are reported in Table 2. For clarity, Figs. 2 and 3 and Table 2 are presented without error bars or uncertainties, but detailed figures and tables with the necessary information are available in the Supplement.
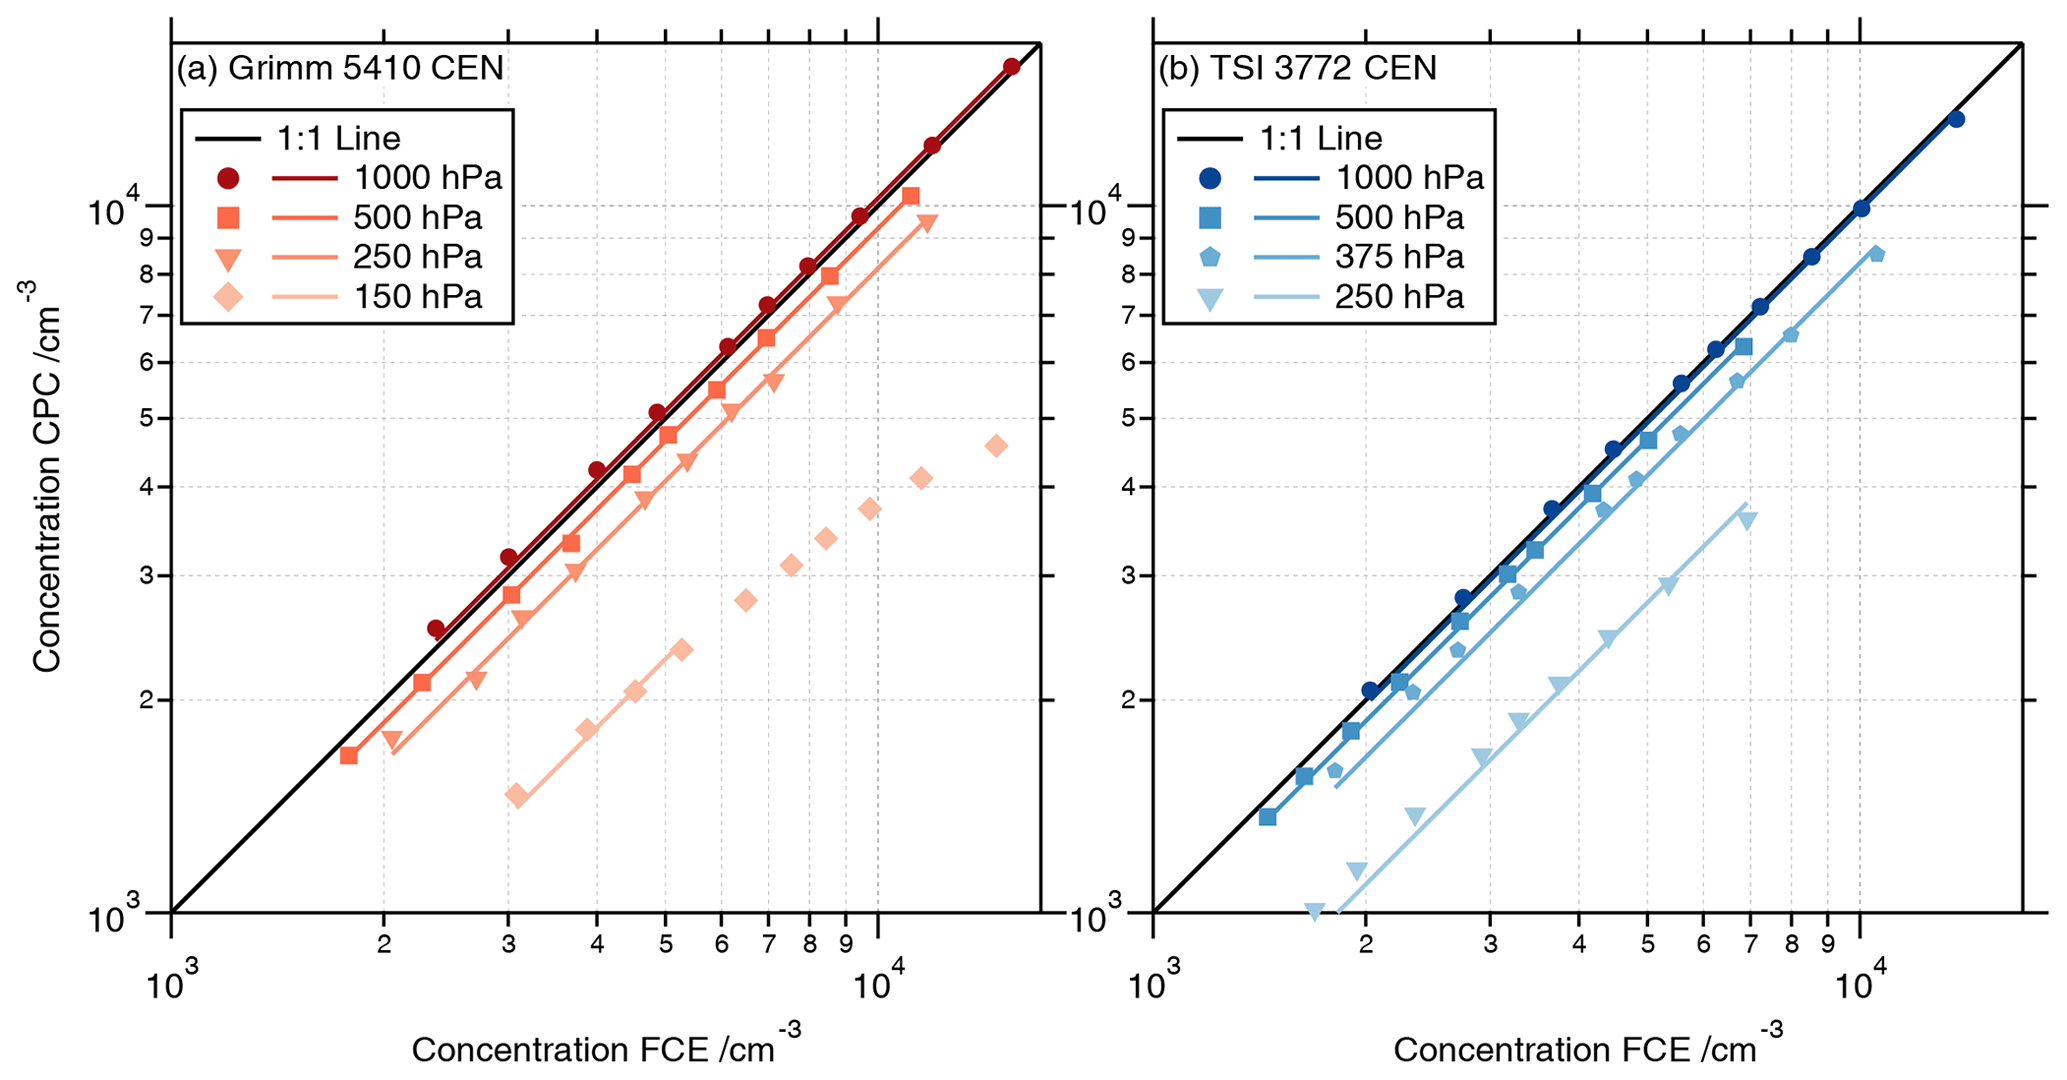
Figure 2Linearity analysis of the CPC concentration (a: Grimm 5410 CEN and b: TSI 3772 CEN) compared to the FCE reference concentration for 30 nm particles. The solid black line represents the ideal 1 : 1 line. The symbols represent the measurements at different pressure stages, and the corresponding lines are linear fits through the origin (fit results in CPC FCE column in Table 2). The 750 hPa results lie very close to the 1000 hPa results for both CPC models and are not shown here for clarity. The Grimm CPC (a) showed some non-linear response at 150 hPa, and only data with FCE concentrations below 6000 cm−3 were considered for the linear fit.
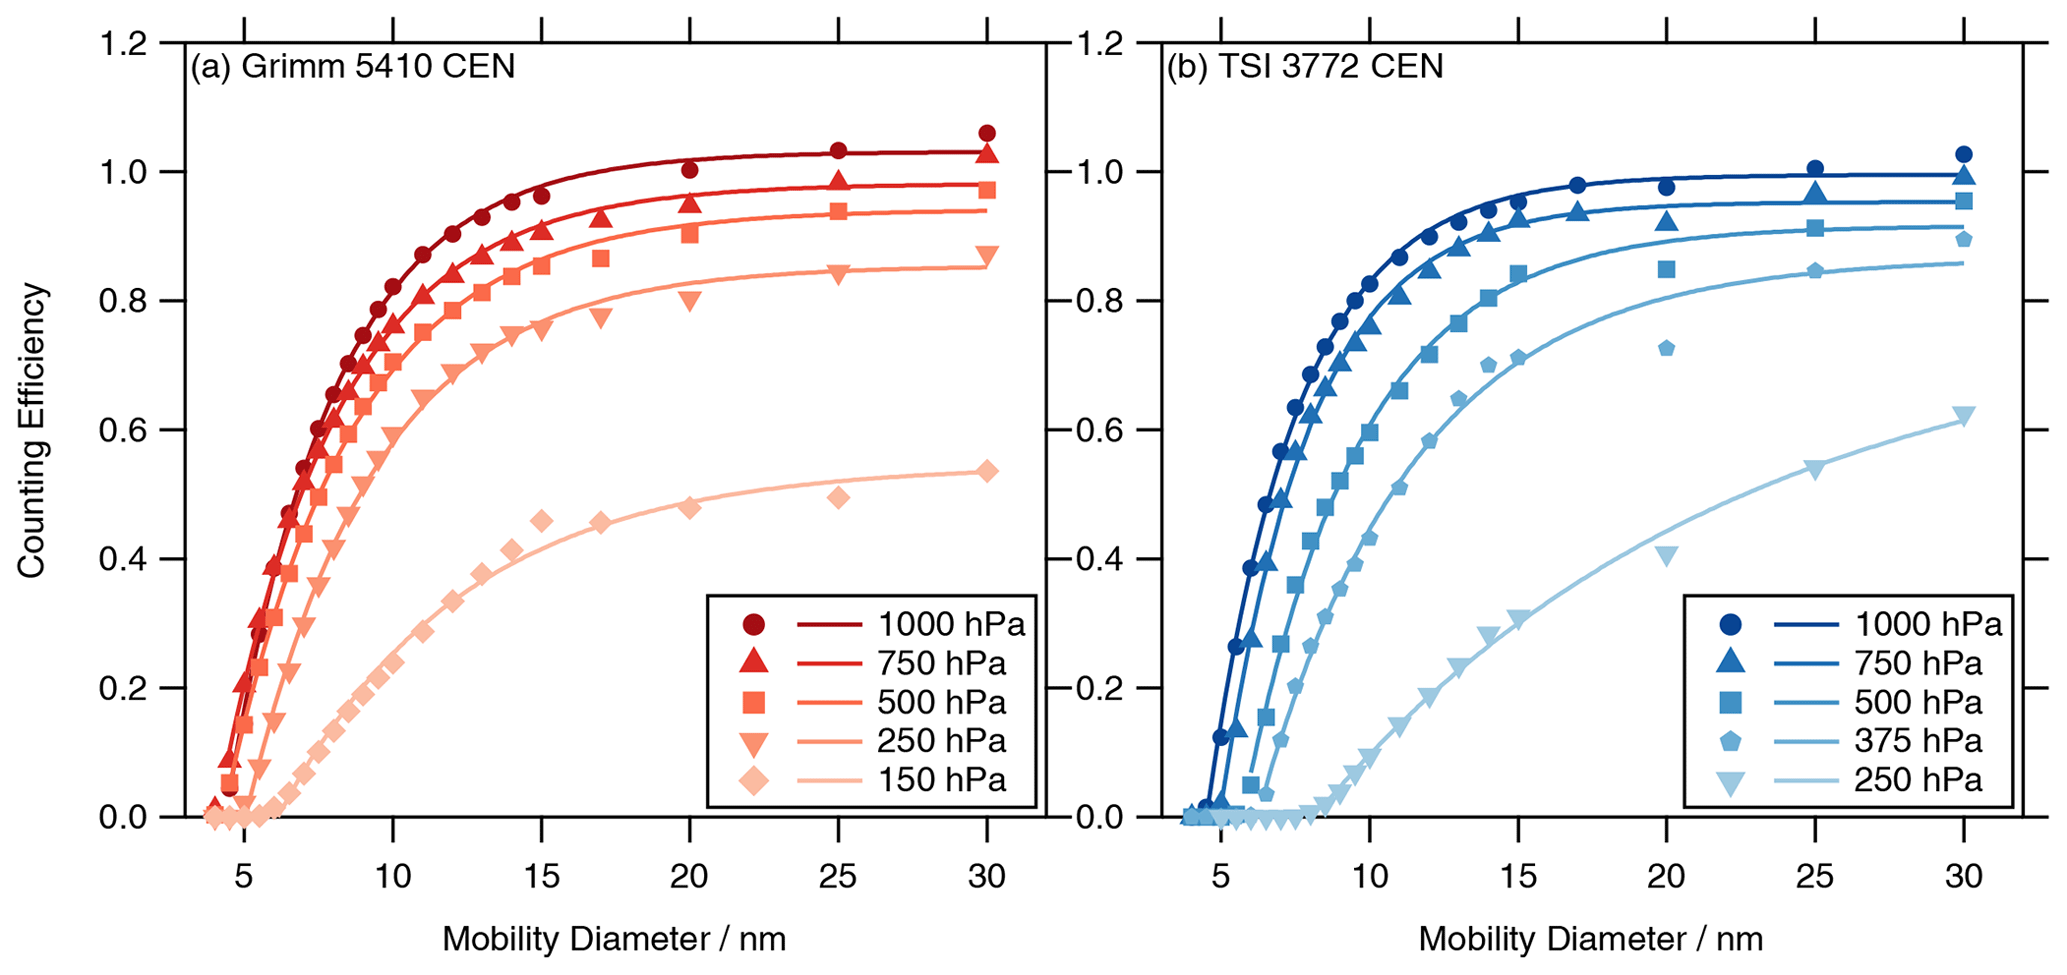
Figure 3Counting efficiency curves (a: Grimm 5410 CEN and b: TSI 3772 CEN) as a function of the mobility diameter. The counting efficiency was measured with four Grimm CPCs and two TSI CPCs. The markers represent the average over the ensemble of each CPC model. The fit is defined by Eq. (3), and the parameters are reported in Table 2.
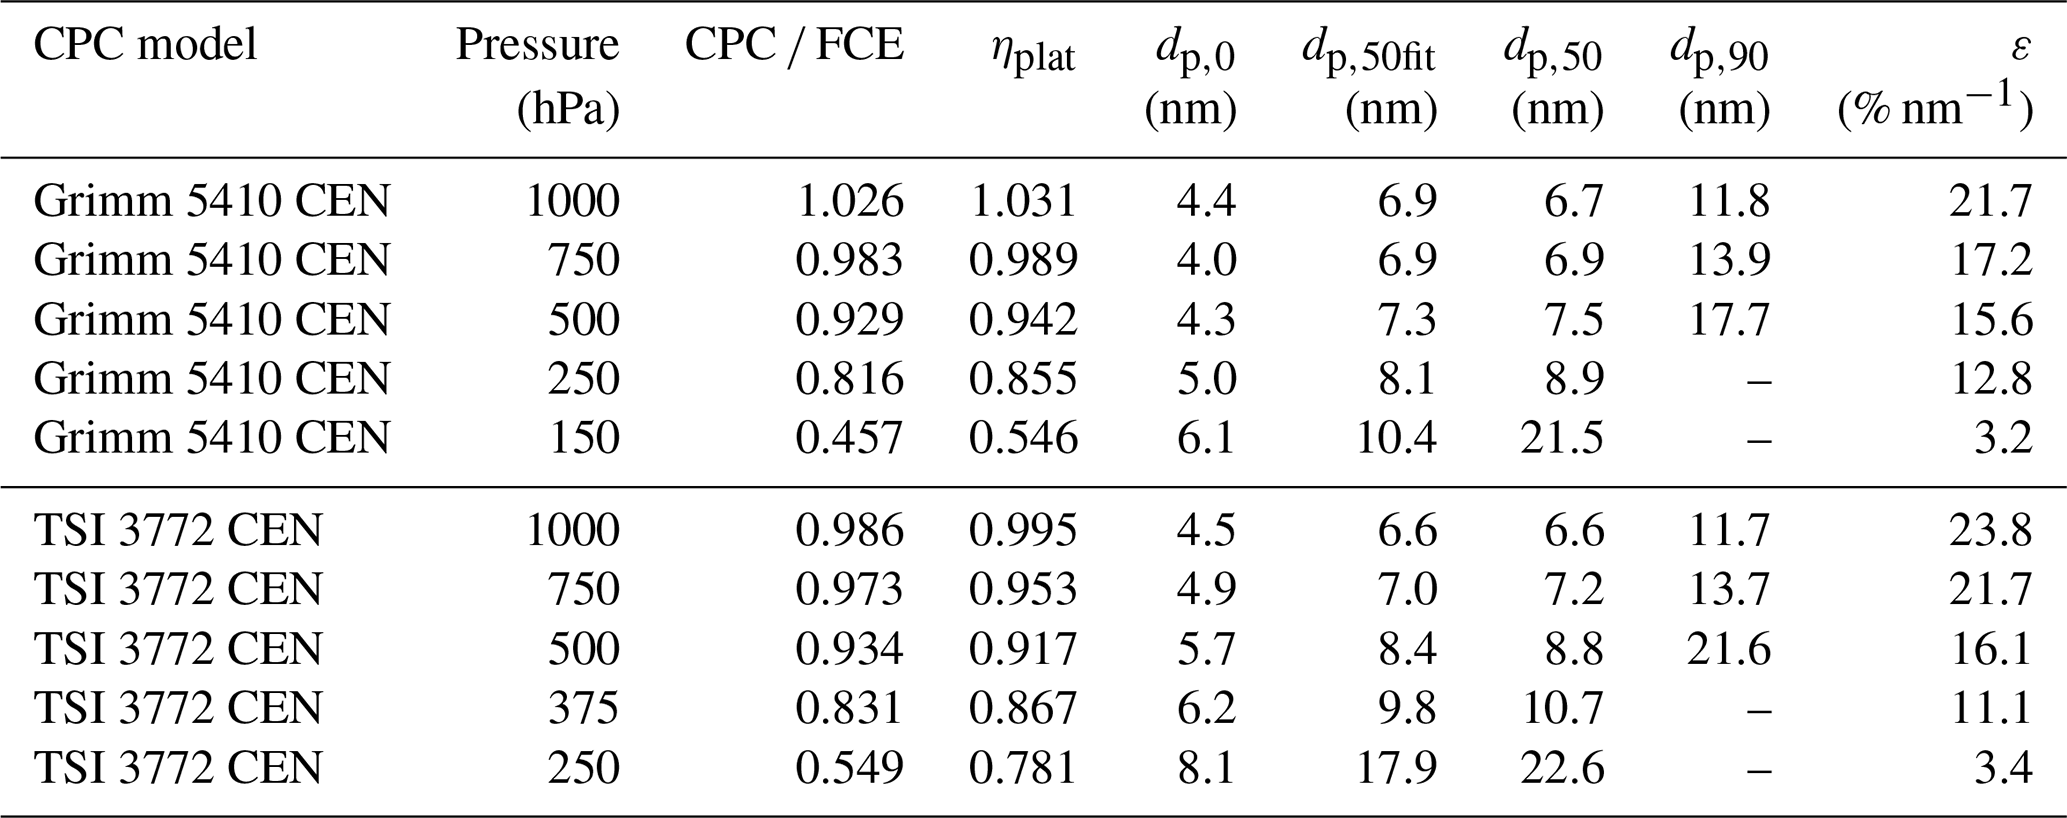
Table 2Results of the fits from Figs. 2 and 3 for the different CPC models and pressure stages. The CPC FCE column is the result of a linear fit through the origin of Fig. 2 comparing the concentration of the CPC to the FCE. The ηplat, dp,0, and dp,50fit columns represent the fitting parameters of the counting efficiency (Eq. 3) of Fig. 3. The parameters dp,50 and dp,90 were calculated from the fitted counting efficiency parameters. The edge steepness ε was calculated with Eq. (4). A table with the uncertainties of the fits is presented in the Supplement.
The linear response of the CPC is very important for the later counting efficiency measurements. We analyzed the linearity at 30 nm for one CPC of each CPC model. In Fig. 2 the concentration of the CPCs (with coincidence correction switched on) is compared to the reference concentration of the FCE for the different pressure stages in a log–log plot. The results of the linear fit through the origin are reported in the CPC FCE column in Table 2. For clarity the 750 hPa points and fits are not shown in Fig. 2 but are plotted in the Supplement.
At 1000 and 750 hPa, the linearity of both CPC models is in agreement with the CEN specifications (1 ± 5 %; see Sect. 1.2). At 500 and 250 hPa, the response of both CPC models was still linear but below 1. This linear behavior (below 2 × 104 cm−3) prompted us to utilize the coincidence-corrected concentration of the CPCs for the counting efficiency measurements. Interestingly, at 500 hPa, the linear fit results for both CPC models are around 93 %, whereas at 250 hPa, the Grimm CPC is still above 80 % and the TSI CPC is around 55 %. Therefore, we have added the 375 hPa pressure stage for the TSI CPC and the 150 hPa for the Grimm CPC to investigate this drop in plateau counting efficiency. Since the Grimm CPC showed some non-linear behavior at 150 hPa for particle concentrations above 6000 cm−3, we only considered FCE concentrations below 6000 cm−3 for the linear fit.
The size-dependent counting efficiency measurements were conducted for four Grimm CPCs and two TSI CPCs at different pressure stages, except for 150 hPa, which was only measured for three different Grimm CPCs. The resulting counting efficiency curves were very consistent between the different CPCs of each CPC model (see Supplement). Thus, we averaged the counting efficiency measurements for each CPC model, which is shown in Fig. 3. The counting efficiency curves were fitted with Eq. (3). The resulting parameters ηplat, dp,0, and dp,50fit are reported in Table 2, along with the subsequently obtained parameters dp,50 and dp,90 (see Sect. 1.1). The edge steepness ε calculated with Eq. (4) was added to quantify the slope of the counting efficiency curves. A higher value of the edge steepness ε represents a steeper slope.
The results from the linearity fit of Fig. 2 (CPC FCE in Table 2) and the results of ηplat from the counting efficiency fit of Fig. 3 (ηplat in Table 2) represent a measure of the plateau counting efficiency. Both representations of the plateau counting efficiency agree to each other within 5 % for pressures down to 250 hPa for the Grimm CPCs and down to 375 hPa for the TSI CPCs. This is notable since the plateau counting efficiency is determined in two different ways, with different fitting functions and procedures. In addition, the linearity of Fig. 2 is only measured with one CPC, whereas the data of Fig. 3 are the average of an ensemble of CPCs. Below the mentioned pressure stages, the plateau counting efficiencies (CPC FCE, ηplat) of both CPC models show a bigger difference, which originates from various effects including the non-linear behavior of the CPCs, the averaging, and the flat shape (large edge steepness ε) of the counting efficiency fit in Fig. 3, which shifts ηplat to higher values. In general, there is a big change in the counting efficiency curves and fit parameters (see Fig. 3 and Table 2) from the respective second-lowest pressure stage (250 hPa for the Grimm CPCs and 375 hPa for the TSI CPCs) to the lowest pressure stage (150 hPa for the Grimm CPCs and 250 hPa for the TSI CPCs) for both CPC models.
Both CPC models show a similar trend regarding the pressure dependence of the counting efficiency, which is comparable to Takegawa and Sakurai (2011) and Zhang and Liu (1990). For decreasing pressure, the plateau counting efficiency ηplat is decreasing, the cut-off diameter (dp,50fit and dp,50) is increasing, and the edge steepness ε is decreasing (the curves are getting flatter). For 1000 and 750 hPa, the Grimm CPCs and the TSI CPCs are in agreement with the CEN technical specifications (see Sect. 1.2). At 500 hPa and below, the Grimm CPCs generally have a higher plateau counting efficiency and a lower cut-off diameter than the TSI CPCs. A further difference between the CPC models is the pressure dependence of the onset diameter dp,0. For the Grimm CPCs the onset diameter changes only marginally with pressure, which is why the curves in Fig. 3 seem to emerge from one point. For the TSI CPCs the onset diameter is increasing with decreasing pressure, which is why the curves look more separated. To investigate this difference in behavior between both CEN CPC models we conducted simulations, which are presented in the next section.
3.2 Numerical results
We simulated the temperature and the vapor pressure profile for the insulator and condenser of both CPC models as described in Sect. 2.3. From the results we calculated the saturation ratio S, depicted as contour plots in Fig. 4 for 1000 and 250 hPa. The corresponding centerline profiles (at r=0) of the saturation ratio S, the saturation vapor pressure, and the partial vapor pressure for 1000 and 250 hPa are displayed in Fig. 5. The simulations were performed for all pressure stages of the experimental results (Sect. 3.1), but for clarity only the profiles for 1000 and 250 hPa are provided. In all plots, the x axis represents the normalized length (see Sect. 2.3). To visualize the different lengths of the CPC model's insulator and condenser the x axes are set to the same scale. The length of the insulator is indicated either with a vertical dashed line (Fig. 4) or with a gray shaded part (Fig. 5). The black 7 nm line in Fig. 4 encloses the area where the supersaturation is sufficient to activate at least 7 nm particles (Eq. 9). The black 7 nm line corresponds to the desired cut-off diameter dp,50 = 7 nm of the CEN specification (see Sect. 1.2).
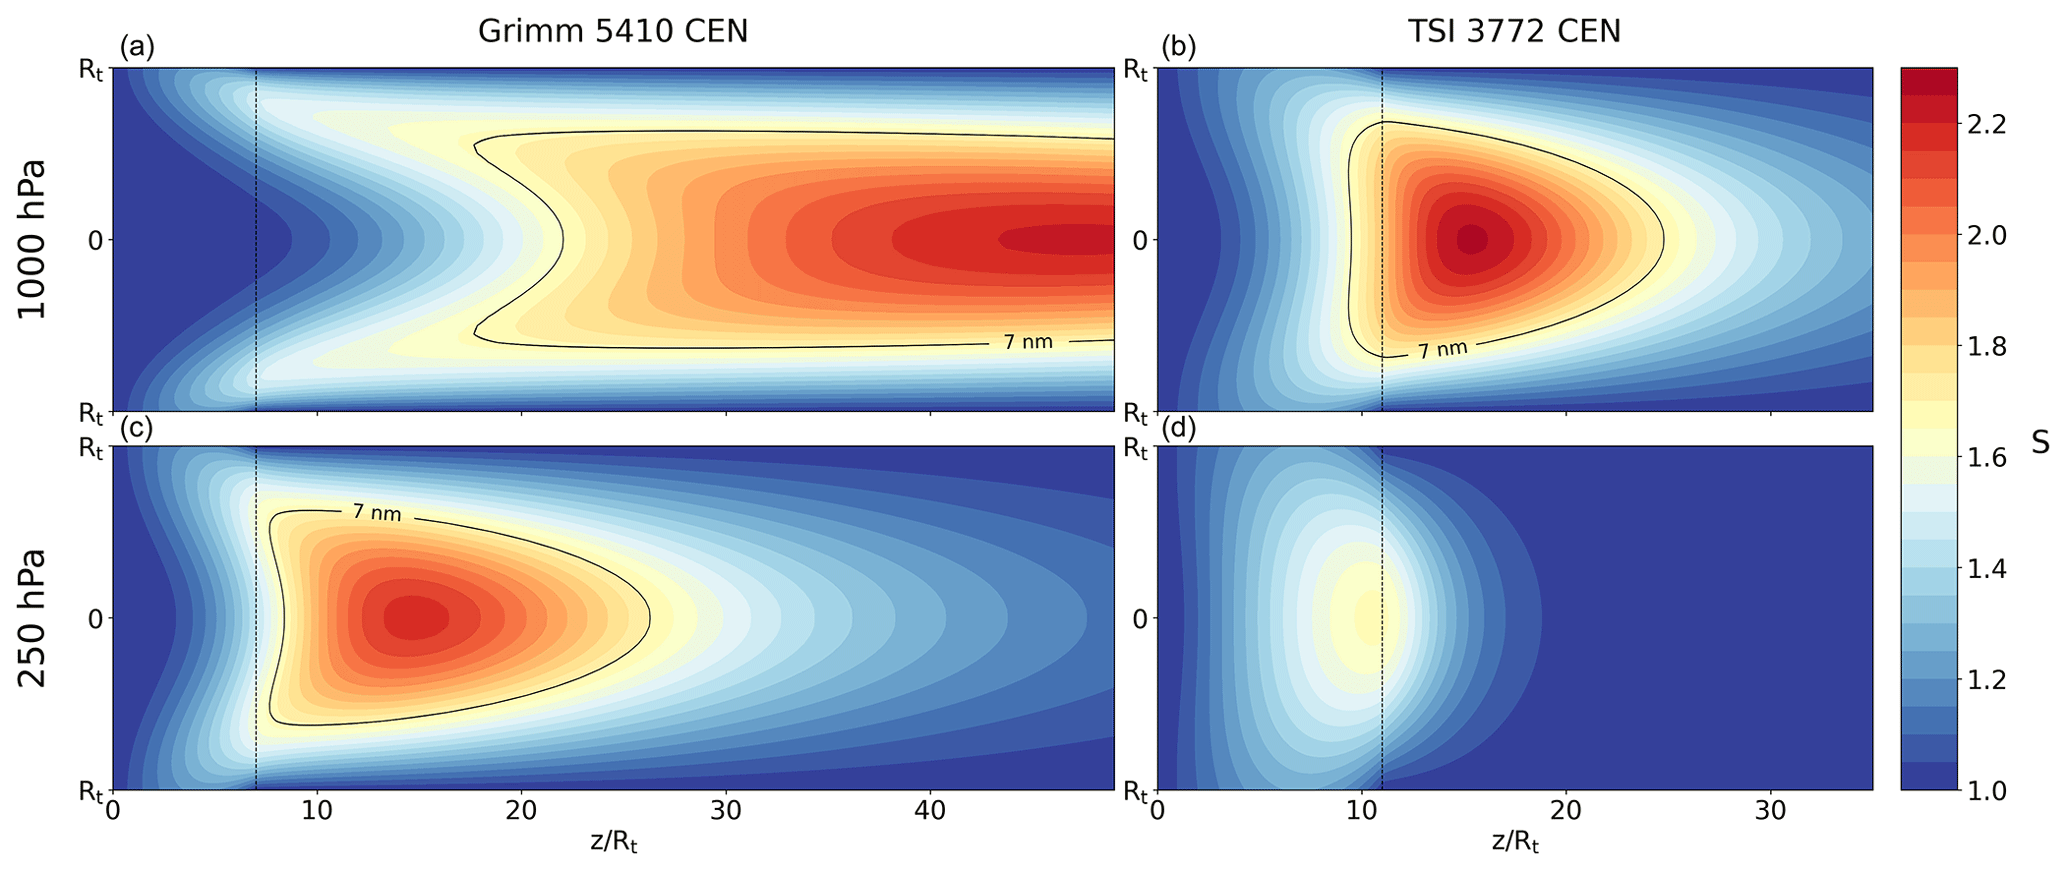
Figure 4Simulated saturation ratio S of the CPC's insulator and condenser. Panels (a) and (c) show the results for the Grimm 5410 CEN CPC and panels (b) and (d) for the TSI 3772 CEN CPC. Panels (a) and (b) represent the 1000 hPa case and panels (c) and (d) the 250 hPa one. The x axis represents the normalized length and is set to the same scale for both CPC models. The length of the insulator is marked with a vertical dashed line. The black 7 nm line encloses the area where the supersaturation is sufficient to activate particles with a Kelvin diameter of at least 7 nm (Eq. 9). The centerline profiles (at r = 0) of the saturation ratio and the corresponding vapor pressures are presented in Fig. 5.
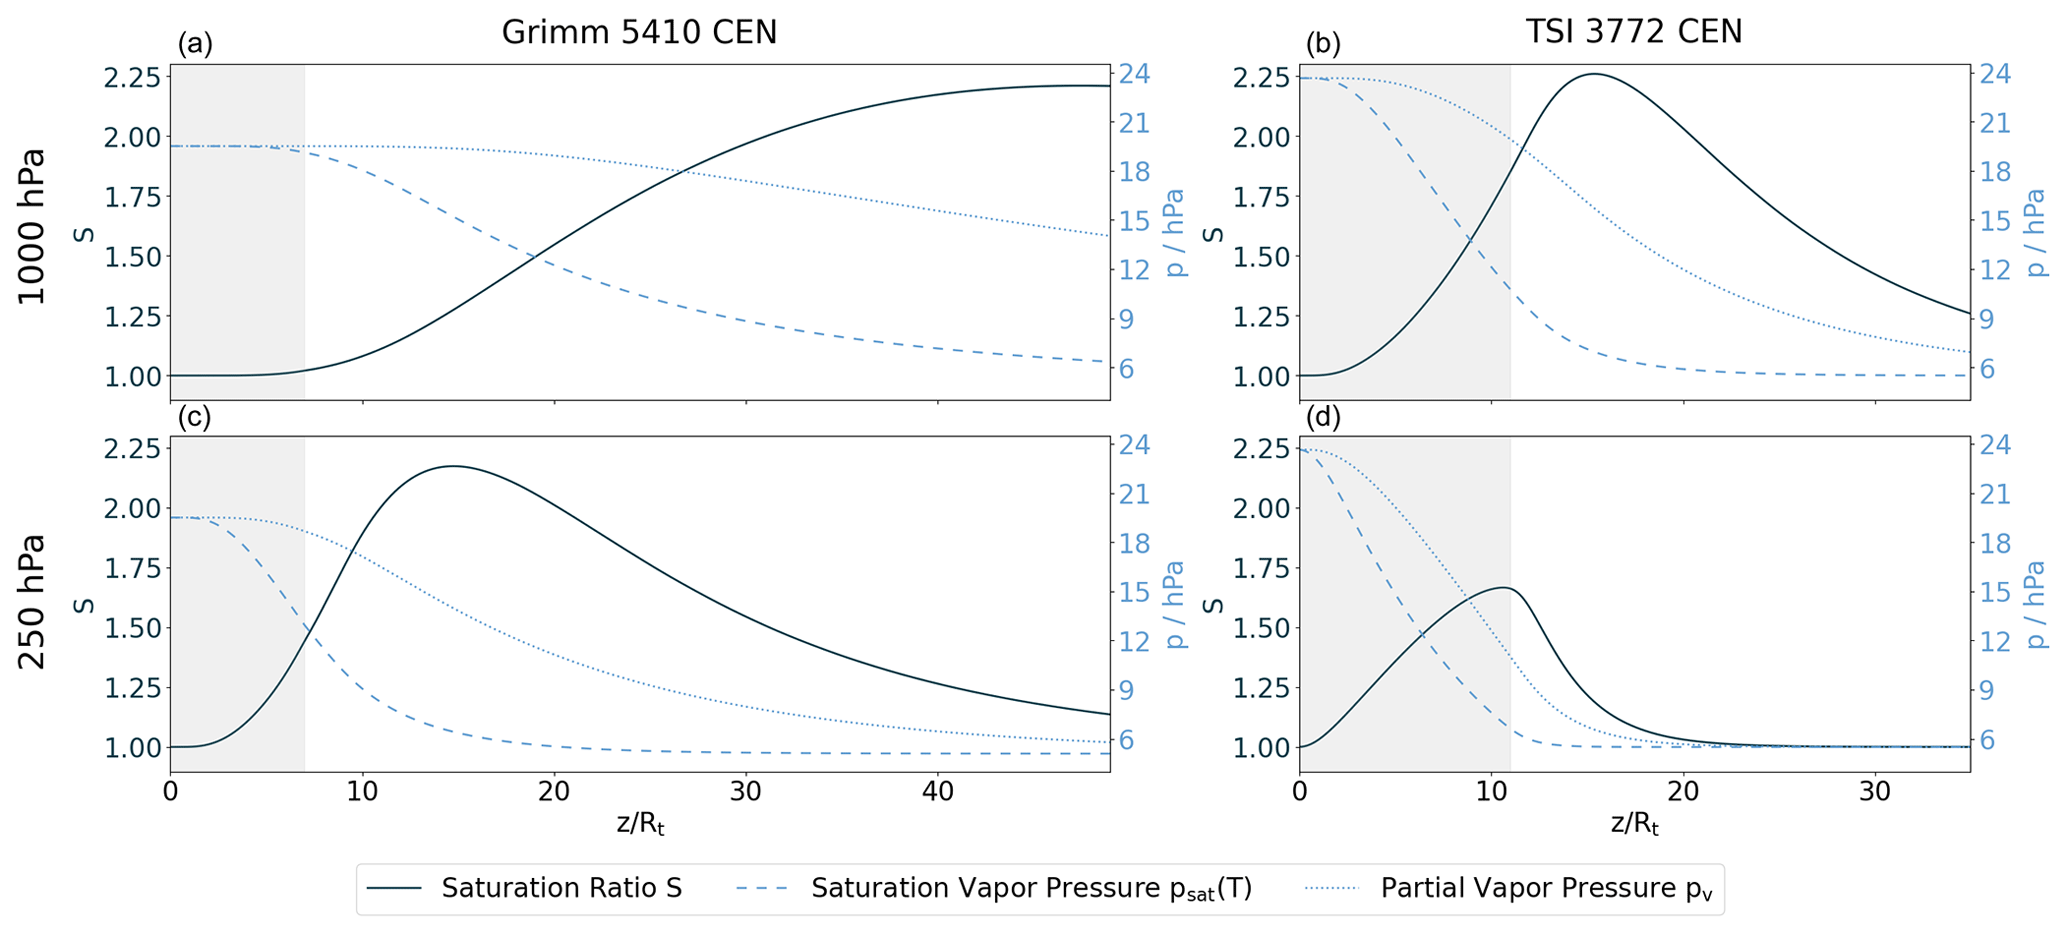
Figure 5Centerline profiles of the saturation ratio S, the saturation vapor pressure, and the partial vapor pressure of butanol resulting from the CPC's insulator and condenser simulations (see Fig. 4). Panels (a) and (c) show the results for the Grimm 5410 CEN CPC and panels (b) and (d) for the TSI 3772 CEN CPC. Panels (a) and (b) represent the 1000 hPa case and panels (c) and (d) the 250 hPa one. The x axis represents the normalized length and is set to the same scale for both CPC models. The insulator part is shaded in gray. The y axis of the saturation ratio S is on the left side and for the vapor pressures on the right side.
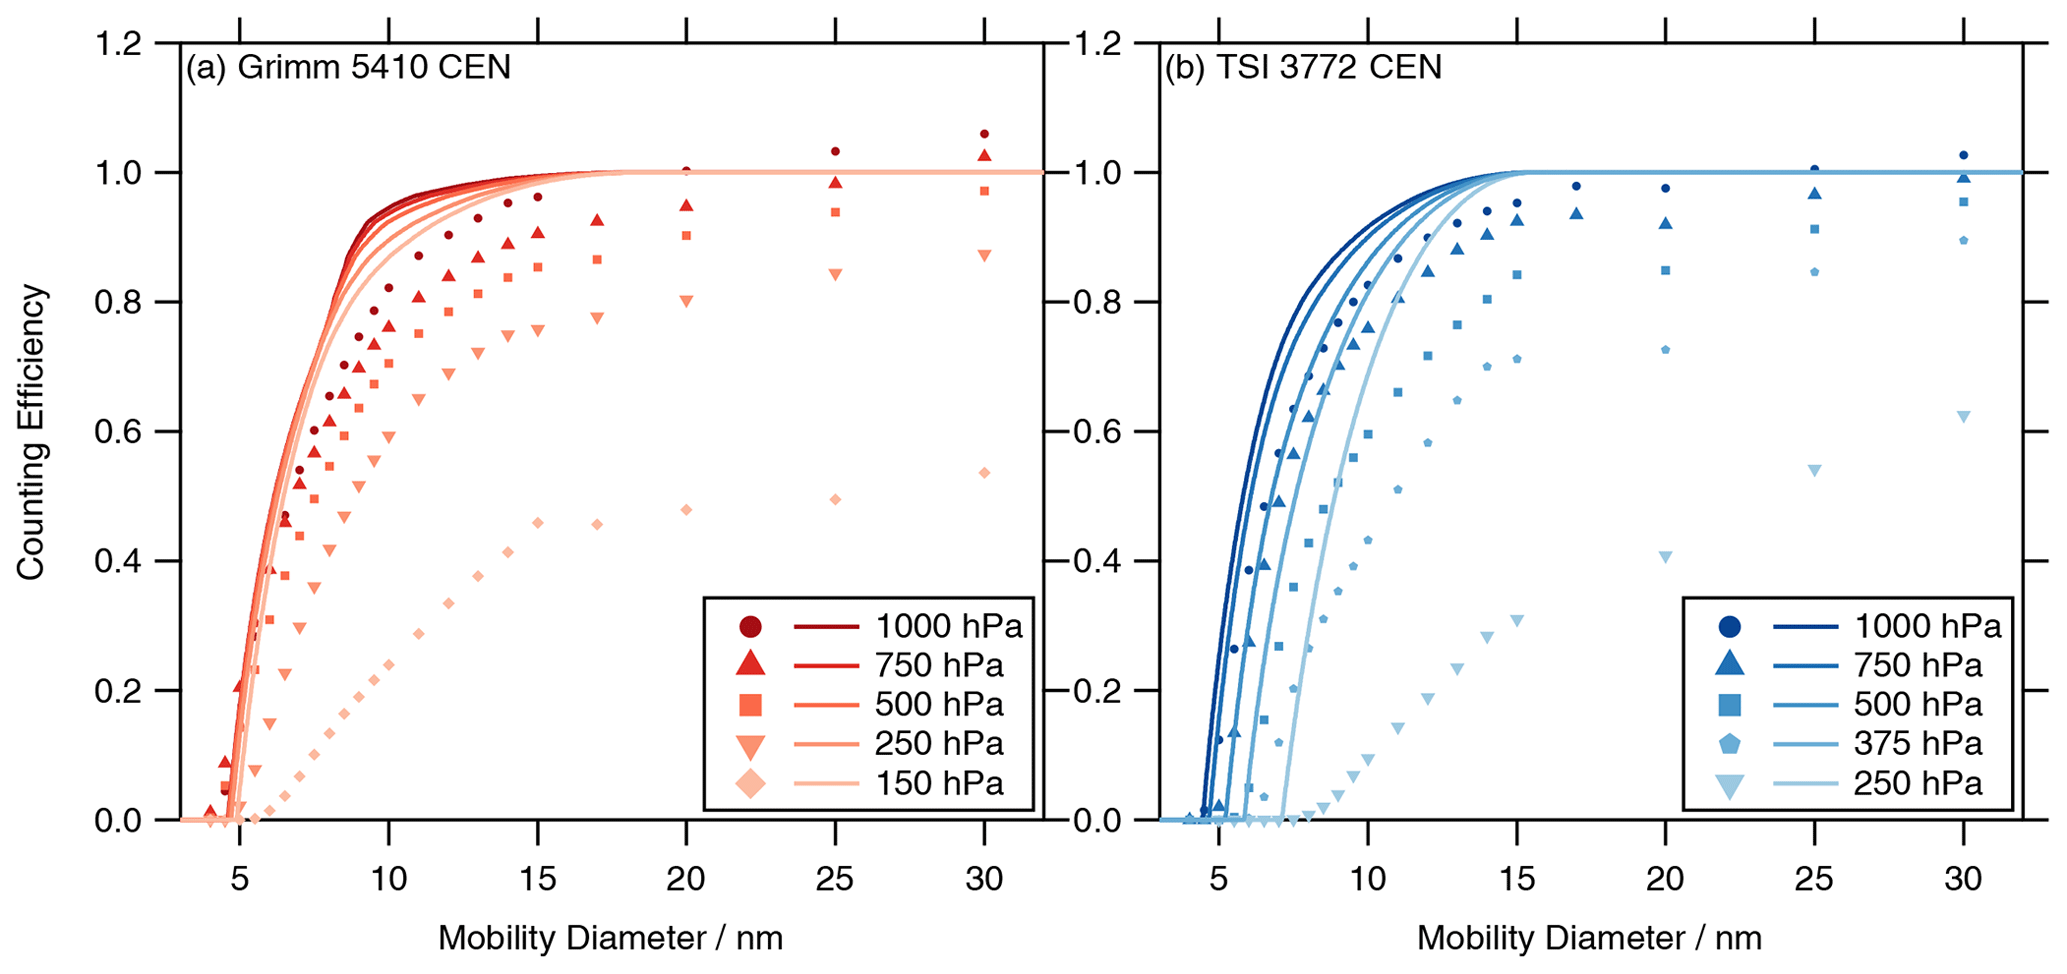
Figure 6Activation efficiency ηa curves (lines) (a: Grimm 5410 CEN and b: TSI 3772 CEN) calculated from the simulations (Fig. 4) for the different pressure stages. The markers are for reference and represent the results of the measured counting efficiencies (Fig. 3).
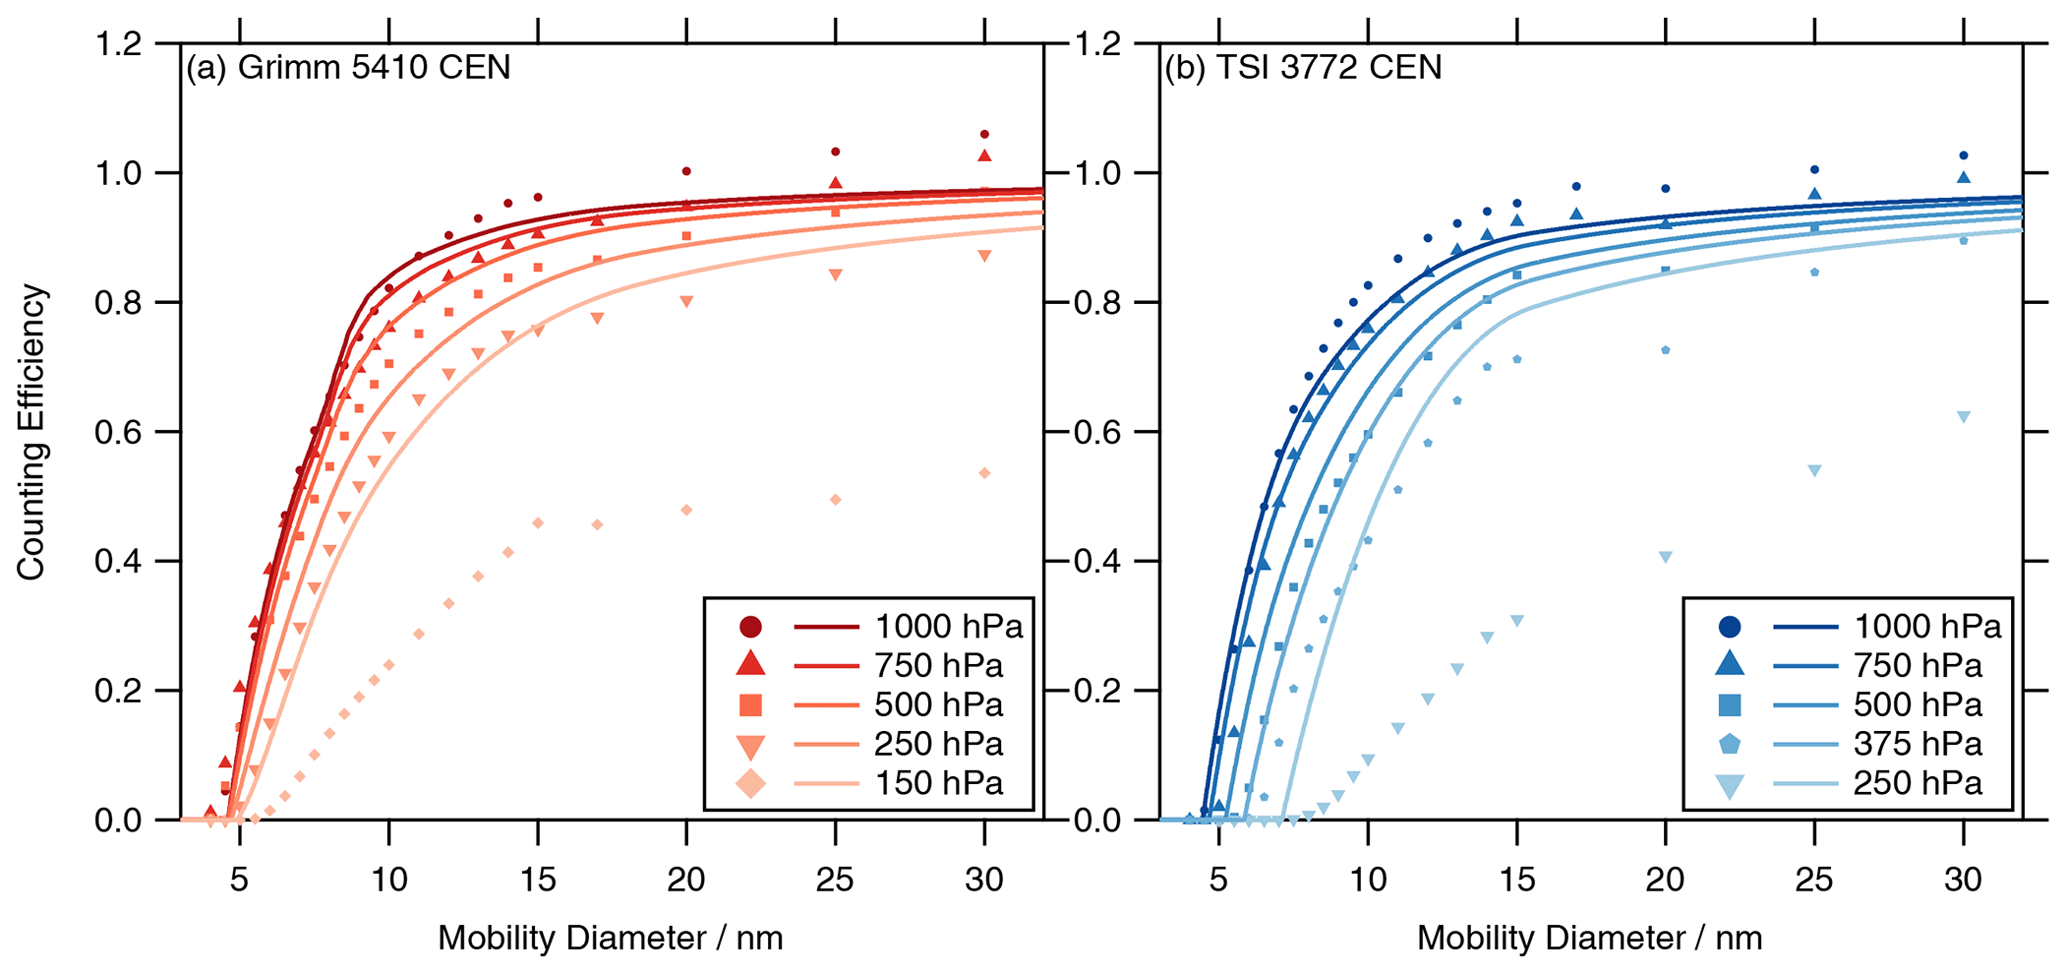
Figure 7Numerically calculated counting efficiencies (lines, a: Grimm 5410 CEN and b: TSI 3772 CEN) including the activation efficiency ηa (Fig. 6) and the sampling efficiency ηs for the different pressure stages. The markers are for reference and represent the results of the measured counting efficiencies (Fig. 3). The plateau counting efficiency and the other parameters are listed in Table 3.
Table 3Parameters of the numerically calculated counting efficiencies of Fig. 7 for the different CPC models and pressure stages. The counting efficiency computed at dp = 30 nm is presented in the η(30 nm) column. The various diameters (dp,0, dp,50, and dp,90) were evaluated at the indicated counting efficiency values. The edge steepness ε was calculated with Eq. (4).
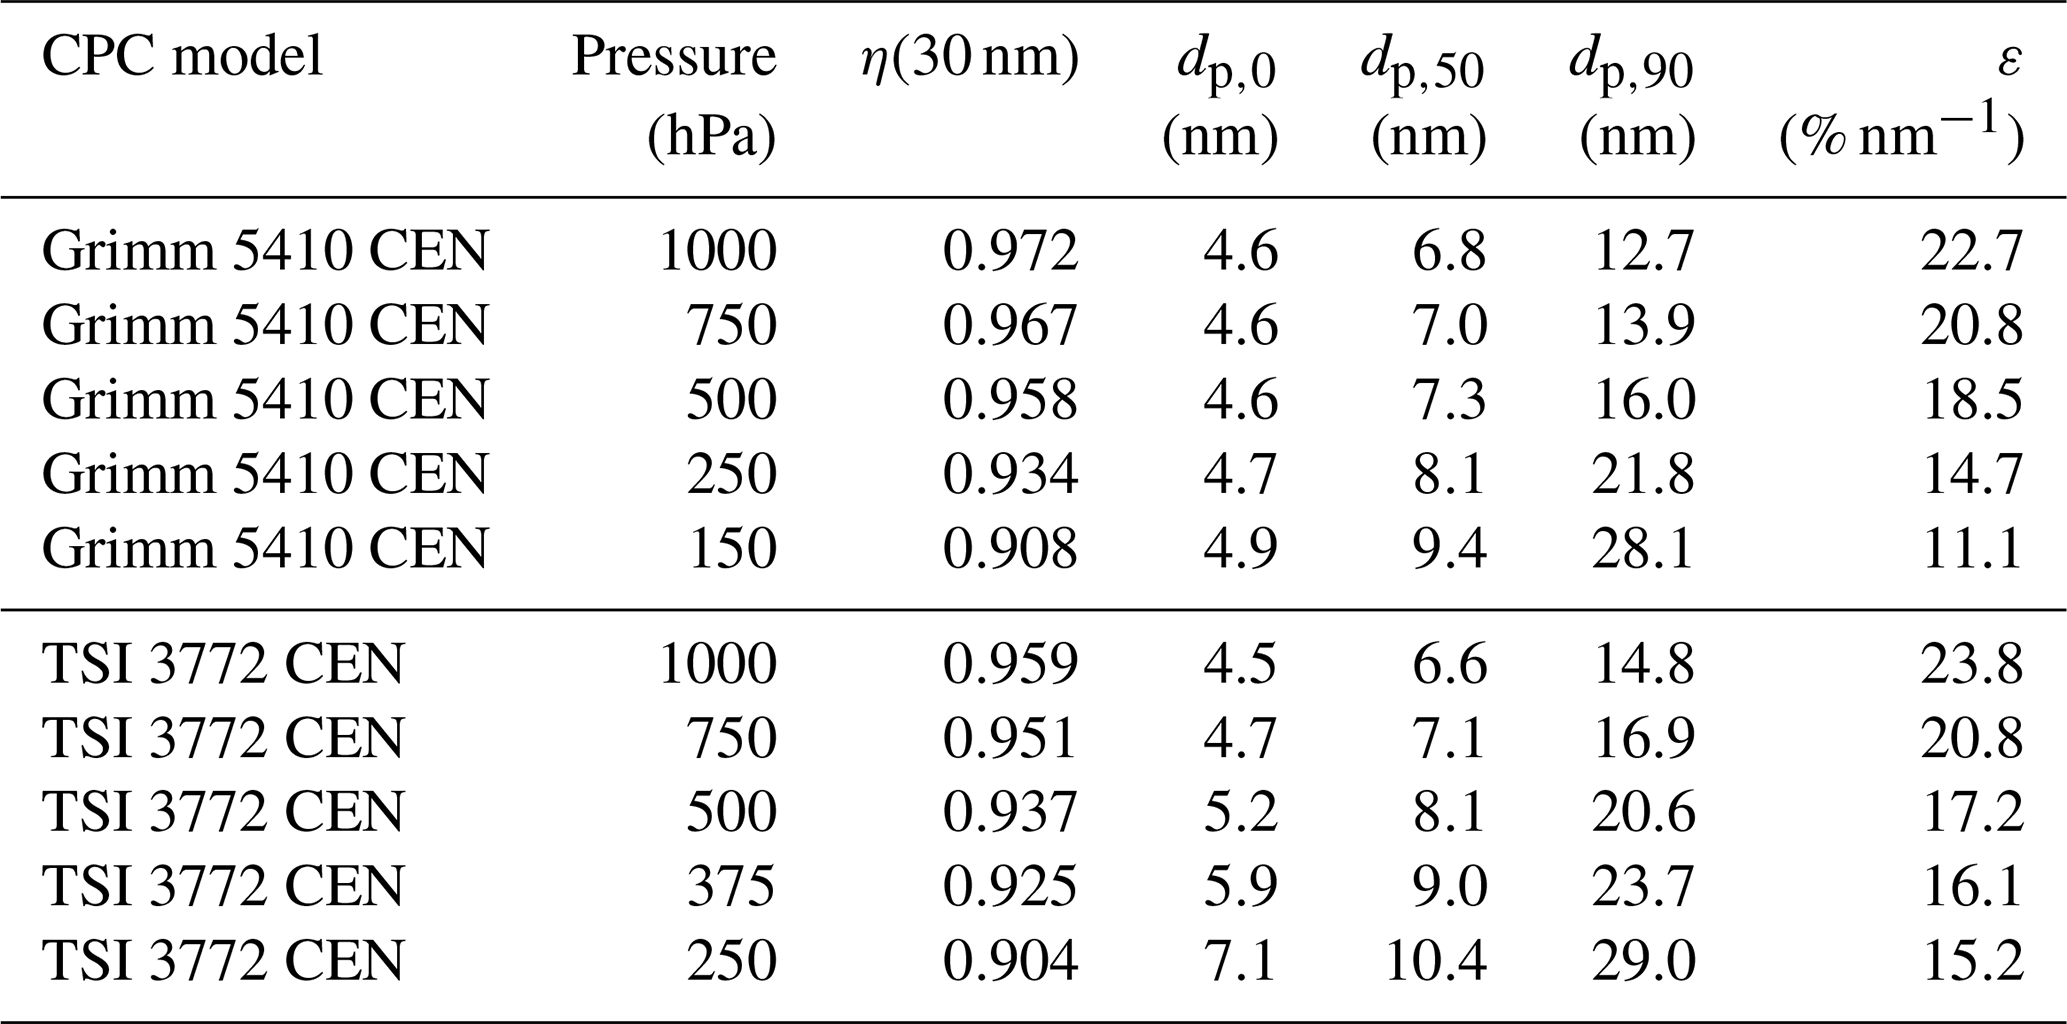
From the simulated saturation ratio profiles, we calculated the activation efficiency ηa (Eq. 10 in Sect. 2.3) for the different pressure stages shown in Fig. 6. Combined with the sampling efficiency ηs, which includes the particle losses of the inlet and saturator of the CPC, we obtain the numerically calculated counting efficiencies presented in Fig. 7. In both figures the measured counting efficiencies of Fig. 3 were added as a reference. Table 3 presents the parameters evaluated from the numerically calculated counting efficiency (Fig. 7), the counting efficiency at dp=30 nm (η(30 nm)), and the other parameters specified in Sect. 1.1 (onset dp,0, cut-off dp,50, 90 % diameter dp,90, and edge steepness ε).
The profiles (Figs. 4 and 5) and the corresponding parameters give insights into the behavior of the different CPC models. One of the most distinct differences between the two CPC models is the relative lengths of the insulator and condenser. The Grimm CPC has a shorter insulator and a longer condenser than the TSI CPC relative to the tube radius. But, the TSI CPC has a lower flow rate in this section of the instrument (see Table 1), which has to be considered for the saturation profile S (see Eq. 8 in Sect. 2.3). First, we compare the saturation profiles of both CPC models at 1000 hPa. One important characteristic is the point with the highest (super) saturation ratio Smax, which is relevant for the smallest particles that get activated (see Kelvin equation (Eq. 9)) classified by the onset diameter dp,0. For the Grimm CPC, Smax is located almost at the end of the condenser, whereas for the TSI CPC, it is close to the entrance of the condenser. For the TSI CPC, the saturation profile (especially the black 7 nm line) and vapor pressure profile reach significantly into the insulator. This demonstrates the importance of including the insulator in simulations, as stated in Reinisch et al. (2019).
At 250 hPa the saturation profile and Smax of both CPC models are shifted to the left (towards the entrance). This is in good agreement with theoretical considerations of Eq. (8) in Sect. 2.3. For the Grimm CPC, Smax is almost as high as at 1000 hPa, which only results in a small shift of the onset diameter (see Figs. 6 and 7). For the TSI CPC at 250 hPa the saturation profile is substantially different compared to the 1000 hPa. It is moved into the insulator part, and Smax is even lower than required for activating 7 nm particles (no black 7 nm line). Thus, the onset diameter of the TSI CPC is beyond 7 nm at 250 hPa. The onset diameter shift also explains why the activation efficiency curves ηa in Fig. 6 nearly fall onto each other for the Grimm CPC, and for the TSI CPC the curves and onset diameters are shifted for each pressure stage.
In Fig. 6, for all pressure stages the calculated activation efficiency ηa reaches 100 % at some particle diameter. The required supersaturation to activate a particle is decreasing exponentially with increasing Kelvin diameter (Eq. 9). In the simulations, for particles with a certain diameter (and larger), this supersaturation is reached for each path in the saturator. Thus, the calculated activation efficiency ηa cannot solely reflect the decreasing plateau counting efficiency ηplat with decreasing pressure. Additionally, the edge steepness ε of the calculated activation efficiency ηa stays almost the same for all pressure stages. Combined with the sampling efficiency ηs (Fig. 7), which takes the particle losses inside the inlet and saturator of the CPC into account, some of the decreasing plateau counting efficiency as well as some of the decreasing edge steepness ε (curves get flatter) can be explained. For the Grimm CPC, the onset diameter is also slightly shifted by the particle losses. Comparing the parameters of the simulations (Table 3) with those of the measurements (Table 2), the onset diameters dp,0 and the cut-off dp,50 for the TSI CPC are mostly within 0.5 nm. In general, the calculated counting efficiency () captures the pressure-dependent behavior of both CPC models quite well, except for the strong decline of the plateau counting efficiency ηplat at the lowest pressure stage.
For the pressure-dependent shift of the plateau counting efficiency ηplat, other factors should also be considered. The losses inside the reference instrument, the FCE, influence the results of the measurements, but they are not included in the simulations (this can best be seen by the difference of ηplat (Table 2) and η(30 nm) (Table 3) at 1000 hPa). Another important factor for ηplat might be the losses during growth of activated particles and the losses inside the optics, which are summarized in the detector efficiency ηd. This detector efficiency ηd also includes the focusing of the particles into the optics, which was partly investigated by Takegawa and Sakurai (2011). Further research with measurements and (more advanced) simulations is needed to evaluate the pressure dependence of the detector efficiency ηd, which is beyond the scope of this publication.
In this study, we evaluated the pressure-dependent performance of two CEN/TS 16976:2016-specified CPC models, the Grimm 5410 CEN and the TSI 3772 CEN. The performance of four Grimm CPCs and two TSI CPCs was analyzed at 1000, 750, 500, and 250 hPa. Additionally, we added measurements at 375 hPa for the TSI CPCs and at 150 hPa for the Grimm CPCs. In general, we found a similar trend for the pressure-dependent performance to that shown in other publications (e.g., Takegawa and Sakurai, 2011; Zhang and Liu, 1991; Bezantakos and Biskos, 2021; Mei et al., 2021): with decreasing pressure, the plateau counting efficiency ηplat is decreasing, the cut-off diameter dp,50 is increasing, and the edge steepness ε is decreasing. At 1000 and 750 hPa, both CPC models fulfill the CEN/TS 16976:2016 criteria. Below 500 hPa, the pressure-dependent performance differs between the two CPC models; the Grimm CPCs have a higher plateau counting efficiency ηplat and a lower cut-off diameter dp,50 than the TSI CPCs. The onset diameter dp,0 stays almost constant for the Grimm CPCs.
To gain more insights into the different performance of the two CPC models, we conducted a simulation study. We simulated the temperature and vapor pressure profile inside the insulator and condenser of both CPC models. From this we calculated the activation efficiency ηa and combined it with the sampling efficiency ηs, which includes the diffusional losses inside the CPC. The simulation results capture the overall pressure dependence of the experimental results. The simulations reveal that for the TSI CPCs, the onset diameter dp,0, and hence the counting efficiency curves, shifts due to the reduction of the saturation ratio, whereas for the Grimm CPCs, it mainly shifts because of diffusional losses. In addition, the decrease in the edge steepness ε with decreasing pressure can only be explained by including the sampling efficiency ηs. We have not included the detector efficiency ηd in our numerical study due to its complexity. To fully understand the pressure dependence of the counting efficiency, it is necessary to investigate the detector efficiency ηd further, which is beyond the scope of this study.
There are several approaches to eliminating the pressure dependence of CPCs by changing the design (e.g., Williamson et al., 2018; Wilson et al., 1983) or the working fluid (e.g., Hermann et al., 2005; Williamson et al., 2018) of the CPC or by altering the saturator and condenser temperatures (e.g., Hermann and Wiedensohler, 2001; Bezantakos and Biskos, 2021). Another approach to compensate for the pressure-dependent effects might be to utilize the implications of Eq. (8). If the volumetric flow inside the CPCs is increased by the same factor as the pressure is reduced, the temperature and vapor pressure profile inside the insulator and condenser should stay the same. This would result in an activation efficiency ηa independent of the pressure (Zhang and Liu, 1991). However, the focusing of the particles into the laser beam and the optical counting is affected by the change in the volumetric flow rate. Therefore, the varying flow rate approach is not straightforward, but it might be interesting for further investigations.
For harmonizing the data from high-alpine measurement stations (ACTRIS, etc.) or aircraft measurements, it might be of interest to include specifications on the pressure-dependent performance of CPCs in a new standard. Here our approach to separate the different efficiencies and the results of our measurements could help to correct for the pressure-dependent effects. Our findings might also be helpful for designing new CPCs.
| Symbol | Parameter |
| ηCPC | CPC counting efficiency |
| ηs, ηa, ηd | Sampling, activation, and detector efficiency |
| Measured counting efficiency | |
| ηplat | Plateau counting efficiency |
| dp,50 | Cut-off diameter |
| dp,0 | Onset diameter |
| dp,50fit | Fitted cut-off diameter |
| ε | Edge steepness parameter |
| T, Tsat, Tcon, Twall | Temperatures, saturator, condenser, and wall temperature |
| Q, Qa, Qs | Flow, aerosol flow, and sample flow |
| z, r, z′, r′ | Axial z and radial r direction inside a tube; normalized axial and radial direction |
| Rt | Radius of the tube (either condenser, insulation, or saturator tube radius) |
| pv, psat | Partial and saturation vapor pressure |
| S | Saturation ratio |
| Pe, Re, Pr, Sc | Péclet, Reynolds, Prandtl, and Schmidt number (dimensionless) |
| DK,eq | Equilibrium Kelvin diameter |
Code is available at https://www.doi.org/10.25365/phaidra.430 (Spät and Bauer, 2023).
Data are available at https://www.doi.org/10.25365/phaidra.427 (Bauer et al., 2023).
The supplement related to this article is available online at: https://doi.org/10.5194/amt-16-4445-2023-supplement.
PSB and BW designed and supervised the study. PSB, DS, and ME prepared the experiment, tested the experimental setup, and performed the measurements. The experimental results are partly presented in the master's thesis of ME. AG developed the computer code and supporting algorithms for the instrumentation. PSB and DS analyzed the data with support from ME. DS performed the simulations with supervision and contributions from PSB. The interpretation of the results of the simulations is the outcome of numerous discussions among PSB, DS, and all co-authors. PSB wrote the manuscript with revisions from DS and BW. All co-authors read and commented on the manuscript.
The contact author has declared that none of the authors has any competing interests.
Publisher’s note: Copernicus Publications remains neutral with regard to jurisdictional claims in published maps and institutional affiliations.
The authors acknowledge the great support during our measurement campaign from Gerhard Steiner (Grimm), Sebastian Schmitt (TSI), and Torsten Tritscher (TSI). The authors thank Tristan Reinisch (AVL DiTEST) for the discussion on the simulations of CPCs. Many thanks are given to Peter Wlasits and Paul Winkler (both University of Vienna) for the great discussions and their support and help with the instrumentation.
This project has received funding from the European Research Council (ERC) under the European Union's Horizon 2020 Research and Innovation framework program under grant agreement no. 640458 (A-LIFE) and the ESA project A-CARE (ESA contract no. 4000125810/18/NL/CT/gp).
The CPCs were purchased under the University of Vienna's investment program (IP734013) and through further support by the University of Vienna.
Open-access funding was provided by the University of Vienna.
This paper was edited by Joachim Curtius and reviewed by Alfred Wiedensohler and one anonymous referee.
Alnæs, M., Blechta, J., Hake, J., Johansson, A., Kehlet, B., Logg, A., Richardson, C., Ring, J., Rognes, M. E., and Wells, G. N.: The FEniCS Project Version 1.5, Archive of Numerical Software, 3, https://doi.org/10.11588/ANS.2015.100.20553, 2015.
Asmi, A., Collaud Coen, M., Ogren, J. A., Andrews, E., Sheridan, P., Jefferson, A., Weingartner, E., Baltensperger, U., Bukowiecki, N., Lihavainen, H., Kivekäs, N., Asmi, E., Aalto, P. P., Kulmala, M., Wiedensohler, A., Birmili, W., Hamed, A., O'Dowd, C., G Jennings, S., Weller, R., Flentje, H., Fjaeraa, A. M., Fiebig, M., Myhre, C. L., Hallar, A. G., Swietlicki, E., Kristensson, A., and Laj, P.: Aerosol decadal trends – Part 2: In-situ aerosol particle number concentrations at GAW and ACTRIS stations, Atmos. Chem. Phys., 13, 895–916, https://doi.org/10.5194/acp-13-895-2013, 2013.
Bauer, P., Spät, D., Eisenhut, M., Gattringer, A., and Weinzierl, B.: Data of Pressure-dependent performance of two CEN-specified condensation particle counters, Universtiät Wien [data set], https://doi.org/10.25365/phaidra.427, 2023.
Bezantakos, S. and Biskos, G.: Temperature and pressure effects on the performance of the portable TSI 3007 condensation particle counter: Implications on ground and aerial observations, J. Aerosol Sci., 159, 105877, https://doi.org/10.1016/j.jaerosci.2021.105877, 2021.
Bianchi, F., Junninen, H., Bigi, A., Sinclair, V. A., Dada, L., Hoyle, C. R., Zha, Q., Yao, L., Ahonen, L. R., Bonasoni, P., Mazon, S. B., Hutterli, M., Laj, P., Lehtipalo, K., Kangasluoma, J., Kerminen, V.-M., Kontkanen, J., Marinoni, A., Mirme, S., Molteni, U., Petäjä, T., Riva, M., Rose, C., Sellegri, K., Yan, C., Worsnop, D. R., Kulmala, M., Baltensperger, U., and Dommen, J.: Biogenic particles formed in the Himalaya as an important source of free tropospheric aerosols, Nat. Geosci., 14, 4–9, https://doi.org/10.1038/s41561-020-00661-5, 2020.
Bird, R. B., Stewart, W. E., and Lightfoot, E. N.: Transport phenomena, J. Wiley, New York, ISBN 0-471-41077-2, 2002.
Brock, C. A., Williamson, C., Kupc, A., Froyd, K. D., Erdesz, F., Wagner, N., Richardson, M., Schwarz, J. P., Gao, R.-S., Katich, J. M., Campuzano-Jost, P., Nault, B. A., Schroder, J. C., Jimenez, J. L., Weinzierl, B., Dollner, M., Bui, T., and Murphy, D. M.: Aerosol size distributions during the Atmospheric Tomography Mission (ATom): methods, uncertainties, and data products, Atmos. Meas. Tech., 12, 3081–3099, https://doi.org/10.5194/amt-12-3081-2019, 2019.
Bundke, U., Berg, M., Houben, N., Ibrahim, A., Fiebig, M., Tettich, F., Klaus, C., Franke, H., and Petzold, A.: The IAGOS-CORE aerosol package: instrument design, operation and performance for continuous measurement aboard in-service aircraft, Tellus B, 67, 28339, https://doi.org/10.3402/tellusb.v67.28339, 2015.
CEN/TS 16976: Determination of the particle number concentration of atmospheric aerosol, Beuth Verlag, https://doi.org/10.31030/2408169, 2016.
Cofer, W. R., Anderson, B. E., Winstead, E. L., and Bagwell, D. R.: Calibration and demonstration of a condensation nuclei counting system for airborne measurements of aircraft exhausted particles, Atmos. Environ., 32, 169–177, https://doi.org/10.1016/S1352-2310(97)00318-X, 1998.
Dreiling, V. and Jaenicke, R.: Aircraft measurement with condensation nuclei counter and optical particle counter, J. Aerosol Sci., 19, 1045–1050, https://doi.org/10.1016/0021-8502(88)90097-3, 1988.
Eckert, E. R. G. and Drake, R. M.: Analysis of heat and mass transfer, McGraw-Hill, New York, ISBN 9780070852006, 1972.
Flagan, R. C.: On Differential Mobility Analyzer Resolution, Aerosol Sci. Tech., 30, 556–570, https://doi.org/10.1080/027868299304417, 1999.
Giechaskiel, B., Wang, X., Gilliland, D., and Drossinos, Y.: The effect of particle chemical composition on the activation probability in n-butanol condensation particle counters, J. Aerosol Sci., 42, 20–37, https://doi.org/10.1016/j.jaerosci.2010.10.006, 2011.
Grimm: Model 5410 Basic condensation particle counter Manual Rev 1.2, DURAG GROUP, 2020.
Heintzenberg, J. and Ogren, J. A.: On the operation of the TSI-3020 condensation nuclei counter at altitudes up to 10 km, Atmos. Environ., 19, 1385–1387, https://doi.org/10.1016/0004-6981(85)90268-9, 1985.
Hering, S. V. and Stolzenburg, M. R.: A Method for Particle Size Amplification by Water Condensation in a Laminar, Thermally Diffusive Flow, Aerosol Sci. Tech., 39, 428–436, https://doi.org/10.1080/027868290953416, 2005.
Hermann, M. and Wiedensohler, A.: Counting efficiency of condensation particle counters at low-pressures with illustrative data from the upper troposphere, J. Aerosol Sci., 32, 975–991, https://doi.org/10.1016/s0021-8502(01)00037-4, 2001.
Hermann, M., Adler, S., Caldow, R., Stratmann, F., and Wiedensohler, A.: Pressure-dependent efficiency of a condensation particle counter operated with FC-43 as working fluid, J. Aerosol Sci., 36, 1322–1337, https://doi.org/10.1016/j.jaerosci.2005.03.002, 2005.
Iida, K., Stolzenburg, M. R., and McMurry, P. H.: Effect of Working Fluid on Sub-2 nm Particle Detection with a Laminar Flow Ultrafine Condensation Particle Counter, Aerosol Sci. Tech., 43, 81–96, https://doi.org/10.1080/02786820802488194, 2009.
IPCC: Climate Change 2013: The Physical Science Basis, Contribution of Working Group I to the Fifth Assessment Report of the Intergovernmental Panel on Climate Change, edited by: Core Writing Team, Pachauri, R. K., and Meyer, L. A., Cambridge University Press, Cambridge, United Kingdom and New York, NY, USA, https://doi.org/10.1017/CBO9781107415324, 2013.
IPCC: Climate Change 2021: The Physical Science Basis, Contribution of Working Group I to the Sixth Assessment Report of the Intergovernmental Panel on Climate Change, edited by: Masson-Delmotte, V., Zhai, P., Pirani, A., Connors, S. L., Péan, C., Berger, S., Caud, N., Chen, Y., Goldfarb, L., Gomis, M. I., Huang, M., Leitzell, K., Lonnoy, E., Matthews, J. B. R., Maycock, T. K., Waterfield, T., Yelekçi, O., Yu, R., and Zhou, B., Cambridge University Press, Cambridge, United Kingdom and New York, NY, USA, https://doi.org/10.1017/9781009157896, 2021.
ISO27891: Aerosol particle number concentration – Calibration of condensation particle counters, International Organization for Standardization, https://www.iso.org/obp/ui/#iso:std:iso:27891:ed-1:v1:en (last access: 14 August 2023), 2015.
Kangasluoma, J., Kuang, C., Wimmer, D., Rissanen, M. P., Lehtipalo, K., Ehn, M., Worsnop, D. R., Wang, J., Kulmala, M., and Petäjä, T.: Sub-3 nm particle size and composition dependent response of a nano-CPC battery, Atmos. Meas. Tech., 7, 689–700, https://doi.org/10.5194/amt-7-689-2014, 2014.
Köhler, H.: The nucleus in and the growth of hygroscopic droplets, T. Faraday Soc., 32, 1152–1161, https://doi.org/10.1039/TF9363201152, 1936.
Kupc, A., Winkler, P. M., Vrtala, A., and Wagner, P.: Unusual Temperature Dependence of Heterogeneous Nucleation of Water Vapor on Ag Particles, Aerosol. Sci. Tech., 47, i–iv, https://doi.org/10.1080/02786826.2013.810330, 2013.
Kupc, A., Williamson, C., Wagner, N. L., Richardson, M., and Brock, C. A.: Modification, calibration, and performance of the Ultra-High Sensitivity Aerosol Spectrometer for particle size distribution and volatility measurements during the Atmospheric Tomography Mission (ATom) airborne campaign, Atmos. Meas. Tech., 11, 369–383, https://doi.org/10.5194/amt-11-369-2018, 2018.
McMurry, P. H.: The History of Condensation Nucleus Counters, Aerosol. Sci. Tech., 33, 297–322, https://doi.org/10.1080/02786820050121512, 2000.
Mei, F., Spielman, S., Hering, S., Wang, J., Pekour, M. S., Lewis, G., Schmid, B., Tomlinson, J., and Havlicek, M.: Simulation-aided characterization of a versatile water-based condensation particle counter for atmospheric airborne research, Atmos. Meas. Tech., 14, 7329–7340, https://doi.org/10.5194/amt-14-7329-2021, 2021.
Noone, K. J. and Hansson, H.-C.: Calibration of the TSI 3760 Condensation Nucleus Counter for Nonstandard Operating Conditions, Aerosol Sci. Tech., 13, 478–485, https://doi.org/10.1080/02786829008959462, 1990.
Oberdörster, G., Oberdörster, E., and Oberdörster, J.: Nanotoxicology: An Emerging Discipline Evolving from Studies of Ultrafine Particles, Environ. Health Persp., 113, 823–839, https://doi.org/10.1289/ehp.7339, 2005.
Rathakrishnan, E.: Instrumentation, Measurements, and Experiments in Fluids, 2nd edn., CRC Press, https://doi.org/10.1201/9781315365619, 2017.
Reinisch, T., Radl, S., Bergmann, A., Schriefl, M., and Kraft, M.: Effect of model details on the predicted saturation profiles in condensation particle counters, Adv. Powder Technol., 30, 1625–1633, https://doi.org/10.1016/j.apt.2019.05.011, 2019.
Rose, C., Collaud Coen, M., Andrews, E., Lin, Y., Bossert, I., Lund Myhre, C., Tuch, T., Wiedensohler, A., Fiebig, M., Aalto, P., Alastuey, A., Alonso-Blanco, E., Andrade, M., Artíñano, B., Arsov, T., Baltensperger, U., Bastian, S., Bath, O., Beukes, J. P., Brem, B. T., Bukowiecki, N., Casquero-Vera, J. A., Conil, S., Eleftheriadis, K., Favez, O., Flentje, H., Gini, M. I., Gómez-Moreno, F. J., Gysel-Beer, M., Hallar, A. G., Kalapov, I., Kalivitis, N., Kasper-Giebl, A., Keywood, M., Kim, J. E., Kim, S.-W., Kristensson, A., Kulmala, M., Lihavainen, H., Lin, N.-H., Lyamani, H., Marinoni, A., Martins Dos Santos, S., Mayol-Bracero, O. L., Meinhardt, F., Merkel, M., Metzger, J.-M., Mihalopoulos, N., Ondracek, J., Pandolfi, M., Pérez, N., Petäjä, T., Petit, J.-E., Picard, D., Pichon, J.-M., Pont, V., Putaud, J.-P., Reisen, F., Sellegri, K., Sharma, S., Schauer, G., Sheridan, P., Sherman, J. P., Schwerin, A., Sohmer, R., Sorribas, M., Sun, J., Tulet, P., Vakkari, V., van Zyl, P. G., Velarde, F., Villani, P., Vratolis, S., Wagner, Z., Wang, S.-H., Weinhold, K., Weller, R., Yela, M., Zdimal, V., and Laj, P.: Seasonality of the particle number concentration and size distribution: a global analysis retrieved from the network of Global Atmosphere Watch (GAW) near-surface observatories, Atmos. Chem. Phys., 21, 17185–17223, https://doi.org/10.5194/acp-21-17185-2021, 2021.
Saros, M. T., Weber, R. J., Marti, J. J., and McMurry, P. H.: Ultrafine Aerosol Measurement Using a Condensation Nucleus Counter with Pulse Height Analysis, Aerosol Sci. Tech., 25, 200–213, https://doi.org/10.1080/02786829608965391, 1996.
Scheibel, H. G. and Porstendörfer, J.: Generation of monodisperse Ag- and NaCl-aerosols with particle diameters between 2 and 300 nm, J. Aerosol Sci., 14, 113–126, https://doi.org/10.1016/0021-8502(83)90035-6, 1983.
Schöberl, M., Dollner, M., Gasteiger, J., Seibert, P., Tipka, A., and Weinzierl, B.: Characterization of the airborne aerosol inlet and transport system used during the A-LIFE aircraft field experiment, EGUsphere [preprint], https://doi.org/10.5194/egusphere-2023-439, 2023.
Schröder, F. and Ström, J.: Aircraft measurements of sub micrometer aerosol particles (> 7 nm) in the midlatitude free troposphere and tropopause region, Atmos. Res., 44, 333–356, https://doi.org/10.1016/S0169-8095(96)00034-8, 1997.
Seifert, M., Tiede, R., Schnaiter, M., Linke, C., Möhler, O., Schurath, U., and Ström, J.: Operation and performance of a differential mobility particle sizer and a TSI 3010 condensation particle counter at stratospheric temperatures and pressures, J. Aerosol Sci., 35, 981–993, https://doi.org/10.1016/j.jaerosci.2004.03.002, 2004.
Spät, D. and Bauer, P.: Simulation code of Pressure-dependent performance of two CEN-specified condensation particle counters, Universtiät Wien [code], https://doi.org/10.25365/phaidra.430, 2023.
Stolzenburg, M. R. and McMurry, P. H.: An Ultrafine Aerosol Condensation Nucleus Counter, Aerosol Sci. Tech., 14, 48–65, https://doi.org/10.1080/02786829108959470, 1991.
Takegawa, N. and Sakurai, H.: Laboratory Evaluation of a TSI Condensation Particle Counter (Model 3771) Under Airborne Measurement Conditions, Aerosol Sci. Tech., 45, 272–283, https://doi.org/10.1080/02786826.2010.532839, 2011.
Talebizadehsardari, P., Rahimzadeh, H., Ahmadi, G., Inthavong, K., Keshtkar, M. M., and Moghimi, M. A.: Nano-particle deposition in laminar annular pipe flows, Adv. Powder Technol., 31, 3134–3143, https://doi.org/10.1016/j.apt.2020.06.005, 2020.
Thompson, C. R., Wofsy, S. C., Prather, M. J., Newman, P. A., Hanisco, T. F., Ryerson, T. B., Fahey, D. W., Apel, E. C., Brock, C. A., Brune, W. H., Froyd, K., Katich, J. M., Nicely, J. M., Peischl, J., Ray, E., Veres, P. R., Wang, S., Allen, H. M., Asher, E., Bian, H., Blake, D., Bourgeois, I., Budney, J., Bui, T. P., Butler, A., Campuzano-Jost, P., Chang, C., Chin, M., Commane, R., Correa, G., Crounse, J. D., Daube, B., Dibb, J. E., DiGangi, J. P., Diskin, G. S., Dollner, M., Elkins, J. W., Fiore, A. M., Flynn, C. M., Guo, H., Hall, S. R., Hannun, R. A., Hills, A., Hintsa, E. J., Hodzic, A., Hornbrook, R. S., Huey, L. G., Jimenez, J. L., Keeling, R. F., Kim, M. J., Kupc, A., Lacey, F., Lait, L. R., Lamarque, J.-F., Liu, J., McKain, K., Meinardi, S., Miller, D. O., Montzka, S. A., Moore, F. L., Morgan, E. J., Murphy, D. M., Murray, L. T., Nault, B. A., Neuman, J. A., Nguyen, L., Gonzalez, Y., Rollins, A., Rosenlof, K., Sargent, M., Schill, G., Schwarz, J. P., Clair, J. M. S., Steenrod, S. D., Stephens, B. B., Strahan, S. E., Strode, S. A., Sweeney, C., Thames, A. B., Ullmann, K., Wagner, N., Weber, R., Weinzierl, B., Wennberg, P. O., Williamson, C. J., Wolfe, G. M., and Zeng, L.: The NASA Atmospheric Tomography (ATom) Mission: Imaging the Chemistry of the Global Atmosphere, B. Am. Meteorol. Soc., 103, E761–E790, https://doi.org/10.1175/BAMS-D-20-0315.1, 2022.
TSI: Condensation Particle Counter Model 3772-CEN Operation and Service Manual, Revision A, TSI Incorporated, 2016.
Tuch, T., Weinhold, K., Merkel, M., Nowak, A., Klein, T., Quincey, P., Stolzenburg, M., and Wiedensohler, A.: Dependence of CPC cut-off diameter on particle morphology and other factors, Aerosol Sci. Tech., 50, 331–338, https://doi.org/10.1080/02786826.2016.1152351, 2016.
von der Weiden, S.-L., Drewnick, F., and Borrmann, S.: Particle Loss Calculator – a new software tool for the assessment of the performance of aerosol inlet systems, Atmos. Meas. Tech., 2, 479–494, https://doi.org/10.5194/amt-2-479-2009, 2009.
Weigel, R., Hermann, M., Curtius, J., Voigt, C., Walter, S., Böttger, T., Lepukhov, B., Belyaev, G., and Borrmann, S.: Experimental characterization of the COndensation PArticle counting System for high altitude aircraft-borne application, Atmos. Meas. Tech., 2, 243–258, https://doi.org/10.5194/amt-2-243-2009, 2009.
Weinzierl, B., Ansmann, A., Prospero, J. M., Althausen, D., Benker, N., Chouza, F., Dollner, M., Farrell, D., Fomba, W. K., Freudenthaler, V., Gasteiger, J., Groß, S., Haarig, M., Heinold, B., Kandler, K., Kristensen, T. B., Mayol-Bracero, O. L., Müller, T., Reitebuch, O., Sauer, D., Schäfler, A., Schepanski, K., Spanu, A., Tegen, I., Toledano, C., and Walser, A.: The Saharan Aerosol Long-Range Transport and Aerosol–Cloud-Interaction Experiment: Overview and Selected Highlights, B. Am. Meteorol. Soc., 98, 1427–1451, https://doi.org/10.1175/BAMS-D-15-00142.1, 2017.
WHO: Ambient air pollution: a global assessment of exposure and burden of disease, World Health Organization (WHO), http://www.who.int/iris/handle/10665/250141 (last access: 14 August 2023), 2016.
Wiedensohler, A.: An approximation of the bipolar charge distribution for particles in the submicron size range, J. Aerosol Sci., 19, 387–389, https://doi.org/10.1016/0021-8502(88)90278-9, 1988.
Wiedensohler, A., Birmili, W., Nowak, A., Sonntag, A., Weinhold, K., Merkel, M., Wehner, B., Tuch, T., Pfeifer, S., Fiebig, M., Fjäraa, A. M., Asmi, E., Sellegri, K., Depuy, R., Venzac, H., Villani, P., Laj, P., Aalto, P., Ogren, J. A., Swietlicki, E., Williams, P., Roldin, P., Quincey, P., Hüglin, C., Fierz-Schmidhauser, R., Gysel, M., Weingartner, E., Riccobono, F., Santos, S., Grüning, C., Faloon, K., Beddows, D., Harrison, R., Monahan, C., Jennings, S. G., O'Dowd, C. D., Marinoni, A., Horn, H.-G., Keck, L., Jiang, J., Scheckman, J., McMurry, P. H., Deng, Z., Zhao, C. S., Moerman, M., Henzing, B., de Leeuw, G., Löschau, G., and Bastian, S.: Mobility particle size spectrometers: harmonization of technical standards and data structure to facilitate high quality long-term observations of atmospheric particle number size distributions, Atmos. Meas. Tech., 5, 657–685, https://doi.org/10.5194/amt-5-657-2012, 2012.
Wiggert, D. C., Ramadan, B. H., and Potter, M. C.: Mechanics of Fluids, Si Edition, Cengage Learning, ISBN 978-1305637610, 2016.
Williamson, C., Kupc, A., Wilson, J., Gesler, D. W., Reeves, J. M., Erdesz, F., McLaughlin, R., and Brock, C. A.: Fast time response measurements of particle size distributions in the 3–60 nm size range with the nucleation mode aerosol size spectrometer, Atmos. Meas. Tech., 11, 3491–3509, https://doi.org/10.5194/amt-11-3491-2018, 2018.
Wilson, J. C., Hyun, J. H., and Blackshear, E. D.: The function and response of an improved stratospheric condensation nucleus counter, J. Geophys. Res.-Oceans, 88, 6781–6785, https://doi.org/10.1029/JC088iC11p06781, 1983.
Winkler, P. M. and Wagner, P. E.: Characterization techniques for heterogeneous nucleation from the gas phase, J. Aerosol Sci., 159, 105875, https://doi.org/10.1016/j.jaerosci.2021.105875, 2022.
Winkler, P. M., Vrtala, A., and Wagner, P. E.: Condensation particle counting below 2 nm seed particle diameter and the transition from heterogeneous to homogeneous nucleation, Atmos. Res., 90, 125–131, https://doi.org/10.1016/j.atmosres.2008.01.001, 2008a.
Winkler, P. M., Steiner, G., Vrtala, A., Vehkamäki, H., Noppel, M., Lehtinen, K. E. J., Reischl, G. P., Wagner, P. E., and Kulmala, M.: Heterogeneous Nucleation Experiments Bridging the Scale from Molecular Ion Clusters to Nanoparticles, Science, 319, 1374–1377, https://doi.org/10.1126/science.1149034, 2008b.
Wlasits, P. J., Stolzenburg, D., Tauber, C., Brilke, S., Schmitt, S. H., Winkler, P. M., and Wimmer, D.: Counting on chemistry: laboratory evaluation of seed-material-dependent detection efficiencies of ultrafine condensation particle counters, Atmos. Meas. Tech., 13, 3787–3798, https://doi.org/10.5194/amt-13-3787-2020, 2020.
Zhang, Z. and Liu, B. Y. H.: Performance of TSI 3760 Condensation Nuclei Counter at Reduced Pressures and Flow Rates, Aerosol Sci. Tech., 15, 228–238, https://doi.org/10.1080/02786829108959530, 1991.
Zhang, Z. Q. and Liu, B. Y. H.: Dependence of the Performance of TSI 3020 Condensation Nucleus Counter on Pressure, Flow Rate, and Temperature, Aerosol Sci. Tech., 13, 493–504, https://doi.org/10.1080/02786829008959464, 1990.
- Abstract
- Introduction
- Methods
- Results and discussion
- Conclusion
- Appendix A: List of symbols – most important symbols in order of occurrence
- Code availability
- Data availability
- Author contributions
- Competing interests
- Disclaimer
- Acknowledgements
- Financial support
- Review statement
- References
- Supplement