the Creative Commons Attribution 4.0 License.
the Creative Commons Attribution 4.0 License.
 | 11 Oct 2023
Vicarious calibration of the Tropospheric Monitoring Instrument (TROPOMI) short-wave infrared (SWIR) module over the Railroad Valley Playa
Tim J. Rotmans
Richard M. van Hees
Carol Bruegge
Dejian Fu
Ruud Hoogeveen
Thomas J. Pongetti
Robert Rosenberg
Ilse Aben
The short-wave infrared (SWIR) module of the Tropospheric Monitoring Instrument (TROPOMI) on board the ESA's Sentinel-5 precursor (S5p) satellite has been very stable during its 5 years in orbit. Calibration was performed on the ground, complemented by measurements during in-flight instrument commissioning. The radiometric response and general performance of the SWIR module are monitored by on-board calibration sources. We show that after 5 years in orbit, TROPOMI-SWIR has continued to show excellent performance with degradation of at most 0.1 % in transmission and having lost less than 0.3 % of the detector pixels. Independent validation of the instrument calibration, via vicarious calibration, can be done through comparisons with ground-based reflectance data. In this work, ground measurements at the Railroad Valley Playa, a valley in central Nevada that is often used as a reference for satellite measurements, are used to perform vicarious calibration of the TROPOMI-SWIR measurements. This is done using dedicated measurement campaigns as well as automated reflectance measurements within the RADCALNET programme. As such, TROPOMI-SWIR is an excellent test case to explore the methodology of vicarious calibration applied to infrared spectroscopy. Using methodology developed for the vicarious calibration of the OCO-2 and GOSAT missions, the absolute radiometry of TROPOMI-SWIR performance is independently verified to be stable down to ∼ 6 %–10 % using the Railroad Valley when both the absolute and relative radiometric calibrations are applied. Differences with the on-board calibration originate from the bidirectional reflection distribution function (BRDF) effects of the desert surface, the large variety in viewing angles, and the different sizes of footprints of the TROPOMI pixels. Vicarious calibration is shown to be an additional valuable tool in validating radiance-level performances of infrared instruments such as TROPOMI-SWIR in the field of atmospheric composition. It remains clear that for instruments of similar design and resolution to TROPOMI-SWIR, on-board calibration sources will continue to provide superior results due to the limitations of the vicarious calibration method.
- Article
(5133 KB) - Full-text XML
- BibTeX
- EndNote


The Tropospheric Monitoring Instrument (TROPOMI1) was launched on 13 October 2017 as the sole instrument on board the Sentinel-5 precursor (S5p) mission. S5p is part of the Copernicus programme headed by the European Commission in partnership with the European Space Agency (ESA). TROPOMI is the first Copernicus instrument aimed at monitoring the chemical composition of Earth's atmosphere over time (for an overview of the instrument design and performance, including the immersed grating, see, for example, Veefkind et al., 2012; Hoogeveen et al., 2013; van Amerongen et al., 2017; Kleipool et al., 2018; van Kempen et al., 2019; and Ludewig et al., 2020) The instrument consists of two modules: the UVN module, covering ultraviolet (UV), visible (VIS), and near-infrared (NIR) wavelengths, and the short-wave infrared (SWIR) module,2 which contains an immersed grating3 (van Amerongen et al., 2017) and a HgCdTe detector4 measuring the short-wave infrared wavelengths between 2305 and 2385 nm. The SWIR module was specifically designed to measure the dry air columns of carbon monoxide (CO) and methane (CH4). With its swath width of ∼ 2600 km, TROPOMI provides daily global coverage. The detector has 1000 columns in the spectral dimension and 256 rows in the spatial dimension, of which about 975 columns and 217 rows are illuminated. For the SWIR module, this results in an across-track resolution of 7 km at the nadir and a spectral resolution of 0.25 nm. The along-track resolution is set by the total integration time per frame. This resolution was 7 km at the start of the mission but was adjusted to 5 km just over 1 year into nominal operations.
Earth-observing sensors such as TROPOMI are meticulously calibrated before launch to relate their radiometric response to the International System of Units (SI units). After launch, most instruments, including TROPOMI, rely on on-board calibration (OBC) systems. OBC systems typically include lamps and/or other calibration targets physically within the spacecraft. For TROPOMI-SWIR, a white light source, a dedicated LED, a set of five monochromatic diode lasers, and a cold black surface are available. In addition, TROPOMI can measure the solar irradiance. To ensure the reliability of the data products, monitoring of the performance and radiometric response of the SWIR instrument through the OBC is required. Moreover, the applicability of calibration data used in processing the raw instrument data to spectral radiances and irradiances needs to be kept up to date to ensure radiometric accuracy in the presence of expected response changes.
After the first year of nominal operations, the TROPOMI SWIR module was shown to be very stable, with few changes to the calibration in comparison to the on-ground results (van Kempen et al., 2019; Ludewig et al., 2020). Instrument monitoring is available online5 and affirms the continuing excellent performance of the TROPOMI-SWIR module up to the current date of writing.
Validation of the instrument calibration and monitoring from the OBC is, in general, a challenge. For space-based sensors, historically it has been more typical to compare the final data products (i.e. column densities of CH4 and/or CO in the case of TROPOMI-SWIR) to ground-based measurements. However, differences reveal very little about the calibration of individual instruments. Independent validation of the instrument calibration can be performed through routine measurement of pseudo-invariant calibration sites (PICSs), cross-calibration with other instruments, and/or a vicarious calibration from sites with dedicated instrumentation. The first method, radiance measurements of PICSs, can relatively accurately monitor instrument degradation (i.e. the relative radiometric calibration) but provides relatively poor results regarding absolute radiometry. For TROPOMI-SWIR this was done using desert sites in the Sahara, Saudi Arabia, and Namibia (van Kempen et al., 2021). The other two methods rely on external measurements, from either complementary space-based sensors (i.e. cross-calibration) or (dedicated) ground-based measurements (i.e. vicarious calibration6).
An often-used site for vicarious calibration is the Railroad Valley (RRV) Playa in Nevada, USA (latitude: 38.475∘; longitude: −115.69∘). Due to its size (approximately circular with a 12 km diameter) and flat, relatively homogeneous surface, RRV is a relatively ideal test site to perform vicarious calibration of the TROPOMI-SWIR module. It also has a unique combination of surface conditions, a high number of cloud-free days, and accessibility. The site is equipped with permanent monitoring instrumentation such as that of the RADCALNET network (the RADiometric CALibration NETwork; see Bouvet et al., 2019) or the JPL (Joint Propulsion Laboratory) LED (light emitting diode). In addition, dedicated measurement campaigns (e.g. Bruegge et al., 2019a) have been carried out for the OCO-2, OCO-3, and GOSAT missions (e.g. Kuze et al., 2014; Bruegge et al., 2021). Although similar sites in Nevada, such as the Ivanpah Playa and Rogers Dry Lake, have been explored by other studies, these sites are often smaller and thus not suitable for atmospheric sounders with relatively large footprints, such as TROPOMI, NASA's OCO-2 and OCO-3, and/or the GOSAT and GOSAT-2 missions of the Japan Aerospace Exploration Agency (JAXA). Worldwide, other sites of sufficient size exist, but these are often not homogeneous due to human activity or can be inaccessible due to their remote location, geopolitical circumstances, and/or environmental conditions.
In this paper, we present the current performance of the TROPOMI-SWIR module after 5 years in flight and show vicarious calibration of the module using the RRV Playa. Section 2 shows the TROPOMI data and their performance, as monitored by the OBC. Section 3 in turn presents the other data used for vicarious calibration. In Sect. 4 we discuss the necessary correction and processing steps. Section 5 gives the results of the comparison of TROPOMI-SWIR radiance data with the vicarious calibration reference datasets. Results are first discussed in a broader context in Sect. 6 and in turn summarized in the conclusions in Sect. 7.
The SWIR (short-wave infrared) module of the TROPOMI instrument has a wavelength coverage between 2305 and 2385 nm. Atmospheric transmission in the TROPOMI-SWIR module wavelength range is dominated by strong absorption features of water vapour (H2O) and methane (CH4). In addition, features of both deuterated water (HDO) and carbon monoxide (CO) can be identified. Only a very limited wavelength range can be considered to be line-free. For this work, continuum radiance (i.e. a section of the spectrum with no molecular absorption features deeper than 1 %) refers to a wavelength range of 2313 to 2313.3 nm.
The SWIR module has a spectral resolution of approximately 0.25 nm and performs soundings at spatial resolutions of up to 7 km × 5.5 km (originally 7 km × 7 km) at nadir. A change in the integration time of the scientific operating mode was implemented in August 2019, effectively changing the spatial resolution in the along-track direction from 7 to 5.5 km. The high-inclination (98.7∘), near-polar, sun-synchronous orbit has an orbital cycle of 227 orbits (≈ 16 d) and an ascending node equatorial crossing time at 13:30 mean local solar time above nadir. The wide swath of 2600 km allows TROPOMI to provide daily global coverage of Earth's radiance for latitudes outside ±7∘ of the Equator. Within the equatorial latitudes, daily coverage is at least 95 %.
TROPOMI radiance measurements of any geographical location show significant variations from day to day due to the large swath. As the swath is nearly symmetric around a nadir-viewing geometry, both eastern and western viewing directions are possible; viewing zenith angles have a range from 0 to 66∘. In effect, the spatial footprint in the across-track direction is a function of the viewing or instrument zenith angle (i.e. the angular distance from the nadir pixel). This dependency is shown in Fig. 1. The wide swath impacts the crossing times over RRV in local time, which can vary by ±0.8 h, depending on the location of the measurement in the swath.
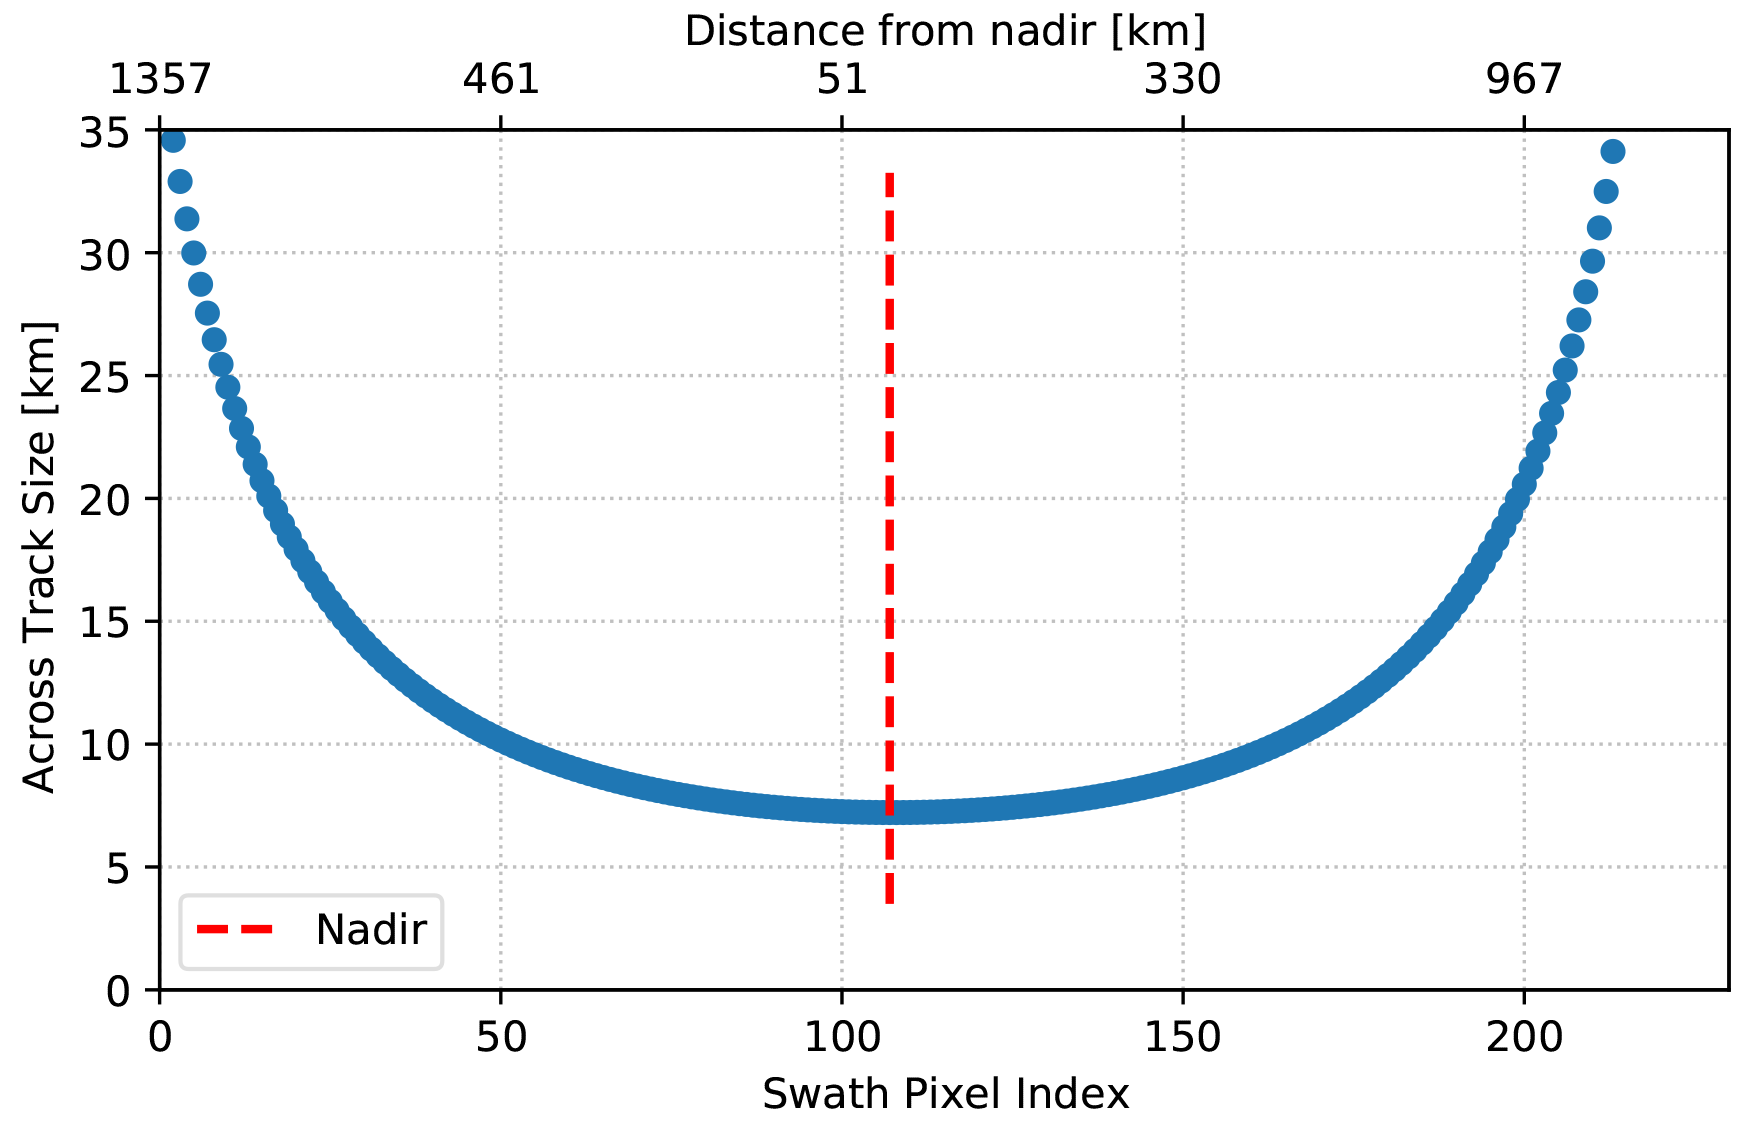
Figure 1Spatial resolution in the across-track direction as a function of swath pixel index and distance from nadir.
Figure 2 shows examples of five different spatial soundings over the central location in RRV. Both the on-ground area's size and orientation vary. Larger pixels include significant portions of the surrounding mountainous area, and the orientations of the pixels shift depending on an eastern or western viewing angle. In total, 227 distinct combinations of TROPOMI pixel orientations and shapes cover the central location of RRV.
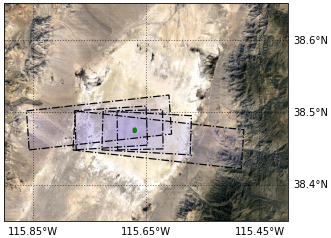
Figure 2TROPOMI pixel shapes over RRV covering the central reference location (green ellipse). The Google Tile image (adapted from © Google Maps 2019) is shown as the background.
In addition to the radiance measurements, TROPOMI-SWIR measures the solar irradiance at regular intervals (i.e. every three–five orbits). This is used not just for the retrieval of the TROPOMI products but also for calibration purposes (Kleipool et al., 2018; van Kempen et al., 2019; Ludewig et al., 2020).
The instrument calibration of TROPOMI, derived from pre-flight, on-ground measurements, commissioning data, and monitoring data, is described in a set of papers led by the Expert Support Laboratory for the Level-1 processor of the TROPOMI Mission Performance Center (van Hees et al., 2018; Tol et al., 2018; Kleipool et al., 2018; van Kempen et al., 2019; Ludewig et al., 2020). The current instrument stability of the SWIR module, for which independent validation was done in van Kempen et al. (2021), can be found in the SRON online monitoring system.7
2.1 Dark flux
The median of the dark flux of the detector is a representation of the overall performance of the detector. If the hardware in this part of the instrument degrades (e.g. electronics, amplifiers) this will be seen in an increase in the median of dark current of the quarter million pixels. Dark flux is derived by background measurements taken during the night side of the S5P orbit with the folding mirror mechanism (FMM) closed.
Figure 3 shows the median dark flux, relative to the dark flux measured at the reference orbit taken at the start of nominal operations (orbit 2756). At this time the median dark flux was 3776 (van Kempen et al., 2019). Each point uses successful background measurements over 15 consecutive orbits. At the change in along-track spatial resolution in August 2019, attained by reducing the exposure times of radiance measurements, the exposure times of the radiance background measurements were also changed to match the new configuration. This caused a small jump in the derived dark flux of 0.3 %, mainly due to the absence of measurements at exposure times longer than 844 ms. Figure 3 shows little to no change in the overall dark flux of the detector except a very slow (0.1 %) reduction in dark flux.
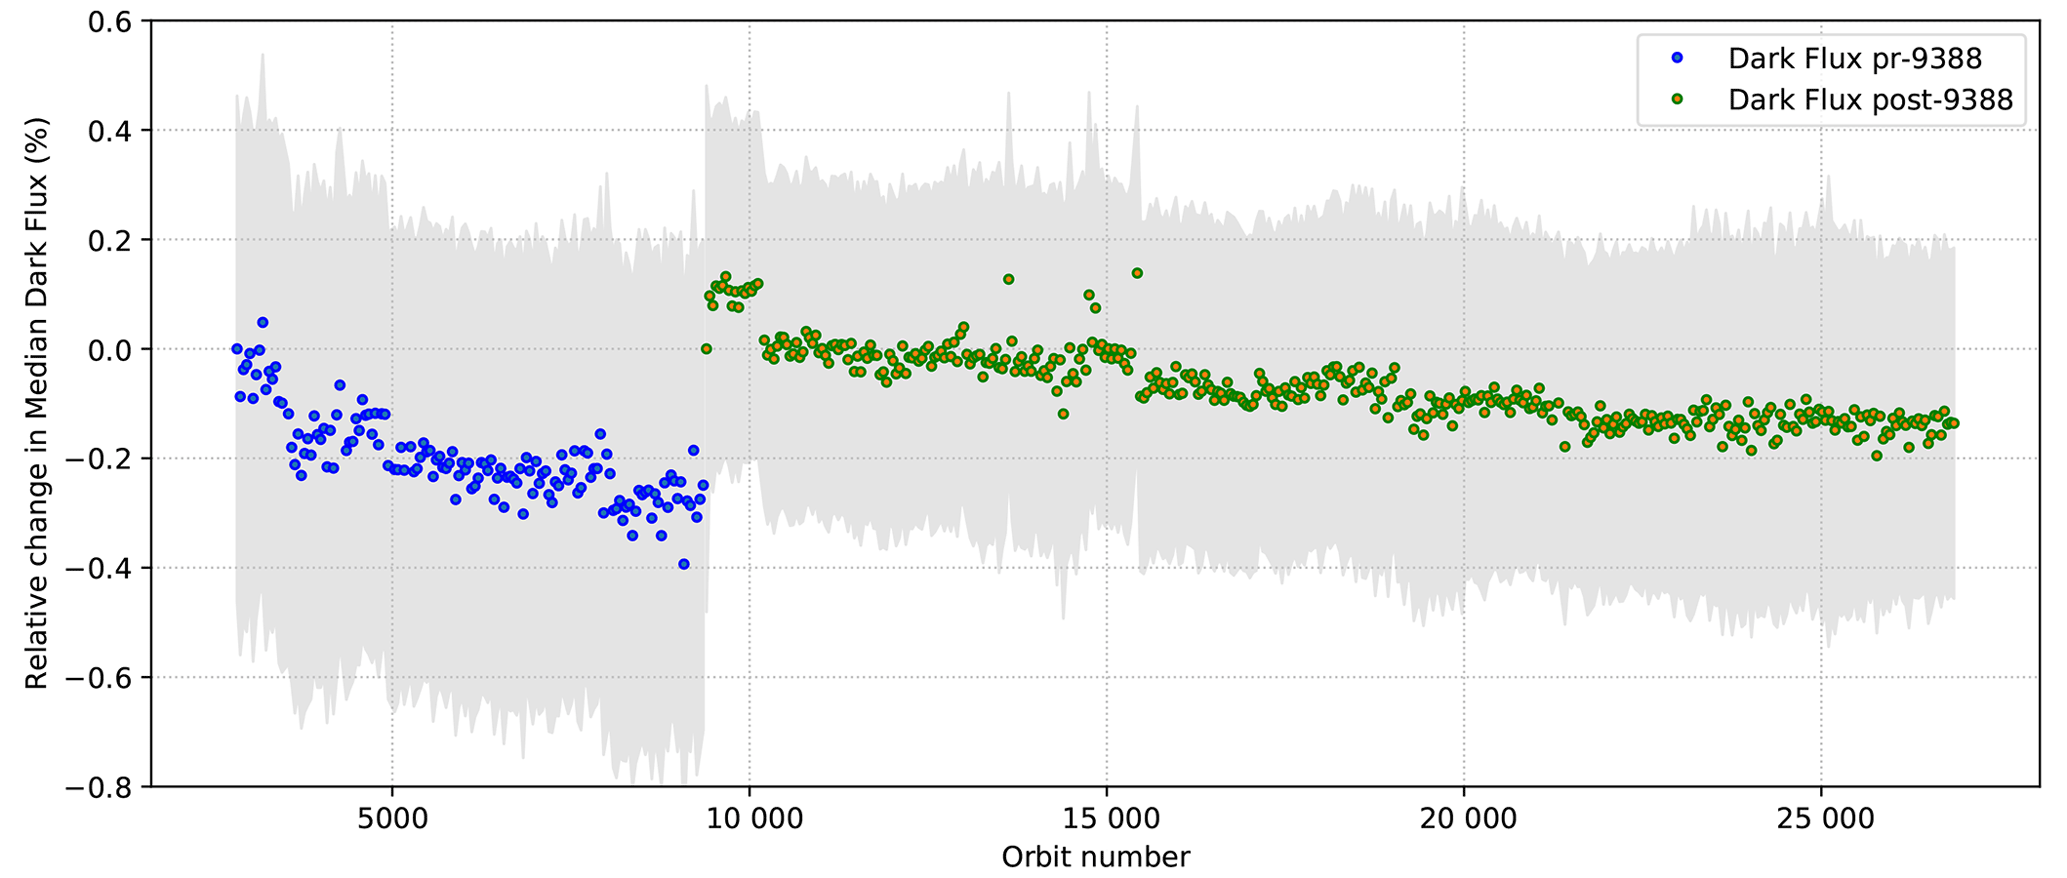
Figure 3Long-term stability of the detector median of the dark flux generated by the TROPOMI-SWIR module normalized at the start of nominal operations (April 2018). Orbit number 25000 occurred during November 2022. The grey colour indicates the uncertainty, derived from the biweight spread over the detector.
2.2 Detector pixel degradation
In flight, the detector of the TROPOMI-SWIR is continuously exposed to the vacuum environment of its orbit. Although still partially shielded from deep space, cosmic rays do hit the detector regularly, in particular during crossings of the South Atlantic Anomaly and the polar regions. The quality of individual pixels is monitored through a pixel's operability (response to light), dark current, noise, and noise variation responses. The results of these tests are obtained from dedicated calibration measurements taken during the night side of the orbit. Pixel quality is expressed as a number between 0 (completely unresponsive) and 1 (perfect) (van Kempen et al., 2019). Three categories are used: good pixels, with a value of quality above 0.8; bad pixels, with a value of quality between 0.1 and 0.8; and worst pixels, with a value of quality below 0.1. Completely unresponsive pixels (i.e. a value of 0.0) are included in the worst-pixel category.
Figure 4 presents the number of pixels in the bad and worst categories since the start of nominal operations. Although the number of pixels with bad or worst performance has been steadily rising, the total number of pixels in these categories remains negligible: an increase of 0.4 % from 0.85 % to 1.25 % over the total detector over 5 years in orbit. The change in key calibration data applied during orbit 19358 reveals a small effect on the up-to-then linear rise in bad and worst pixels. The bulk (i.e. > 90 %) of the pixels that change category do so due to a change in their noise properties. Only a handful of pixels appear to have become non-responsive since the start of nominal operations.
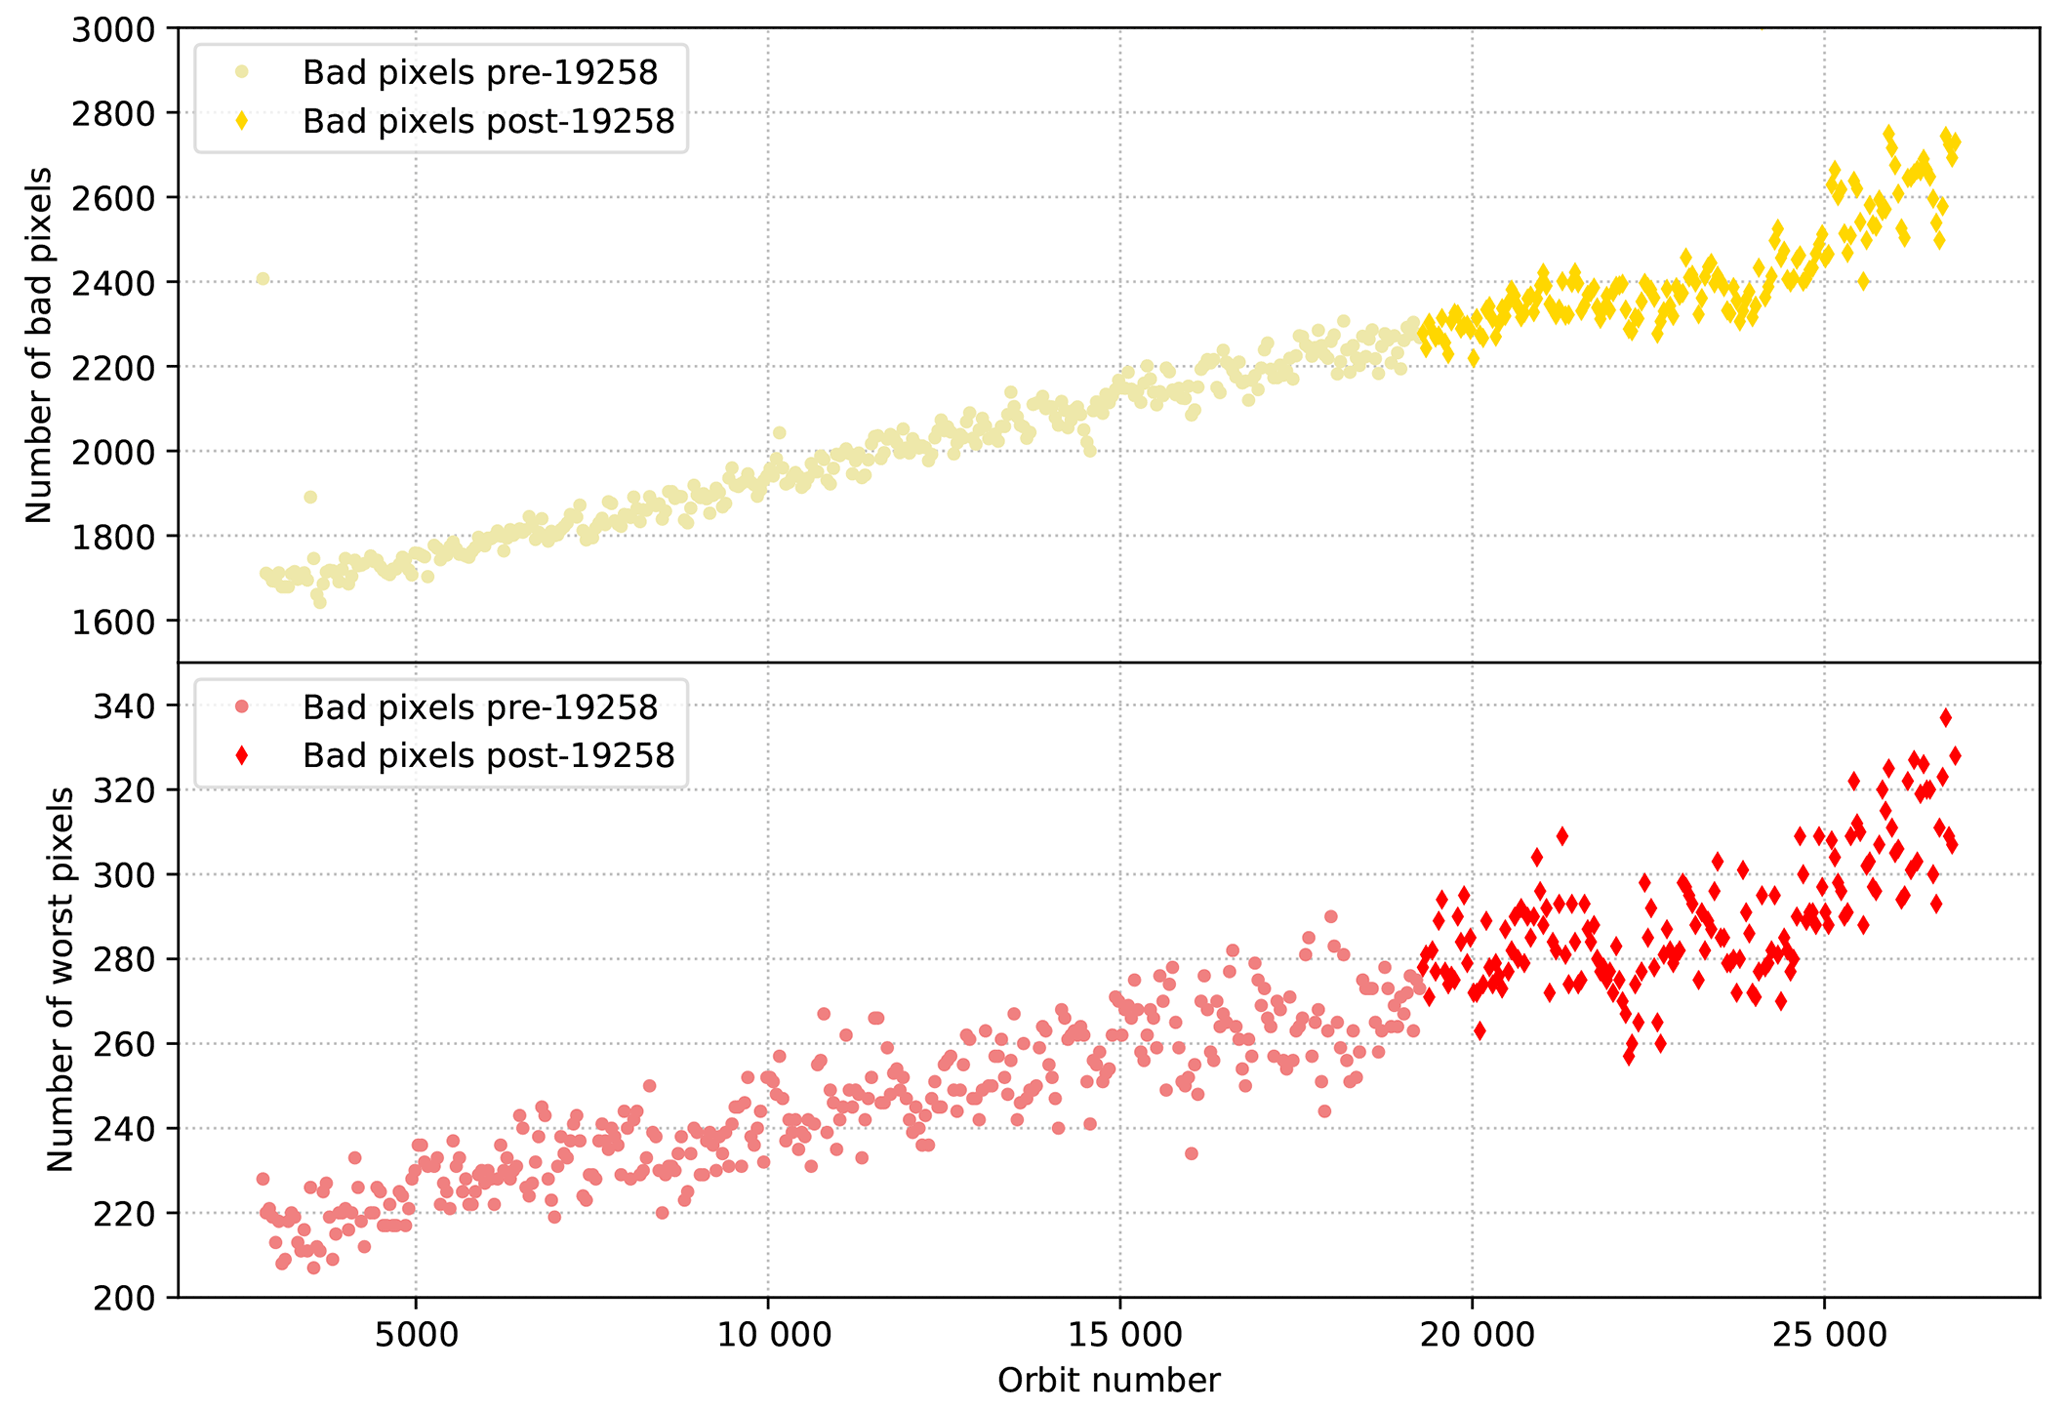
Figure 4Number of detector pixels identified as bad (0.1 < quality < 0.8) and worst (quality < 0.1) over the illuminated part of the detector from the start of nominal operations (28 April 2018) to the current day. Orbit number 25000 occurred during November 2022. The update of key calibration data during orbit 19358 is indicated with different symbols.
We note that a large (between 80 % and 90 %) fraction of pixels in either the bad or worst category recover to a good performance within a typical timescale of a few weeks to 2 months. This, combined with the random nature of cosmic ray impacts, is the main origin of the variation seen from orbit to orbit in the pixel degradation and number of bad and worst pixels. The origin of this behaviour is partly understood but beyond the scope of this paper.
2.3 Transmission stability
Figure 5 shows the normalized transmission of the solar irradiances from the start of nominal operations on 28 April 2018 up to 18 December 2022. The calibration algorithms and key calibration data were updated in July 2021 in orbit 19258. These changes are accounted for. The fitted trend of the data of the main diffuser shows a slow variation with an increase of 0.15 % within the first 2 years and a gradual decline to a value 0.1 % below the initial value since. This variation is hypothesized to be located in the optical path, as evidenced by the reproduction using the back-up diffuser. This stability is corroborated by the data from the on-board white light source (WLS), which shows that the trend seen in both irradiance data streams (< 0.15 %) is consistent with the observed variation and uncertainty in WLS measurements (0.35 %). Uncertainties are given using the biweight spread to remove outliers from the full array. The uncertainties in the numbers given above are small, with individual measurements of the solar irradiance providing uncertainties of 0.03 %. The uncertainty in individual measurements appears to increase as a function of time. On the WLS, uncertainties in individual measurements are also of this order, although the variance from measurement to measurement is larger. Inspection of individual frames reveals that this uncertainty is dominated by the variations and uncertainties in the WLS output signal.
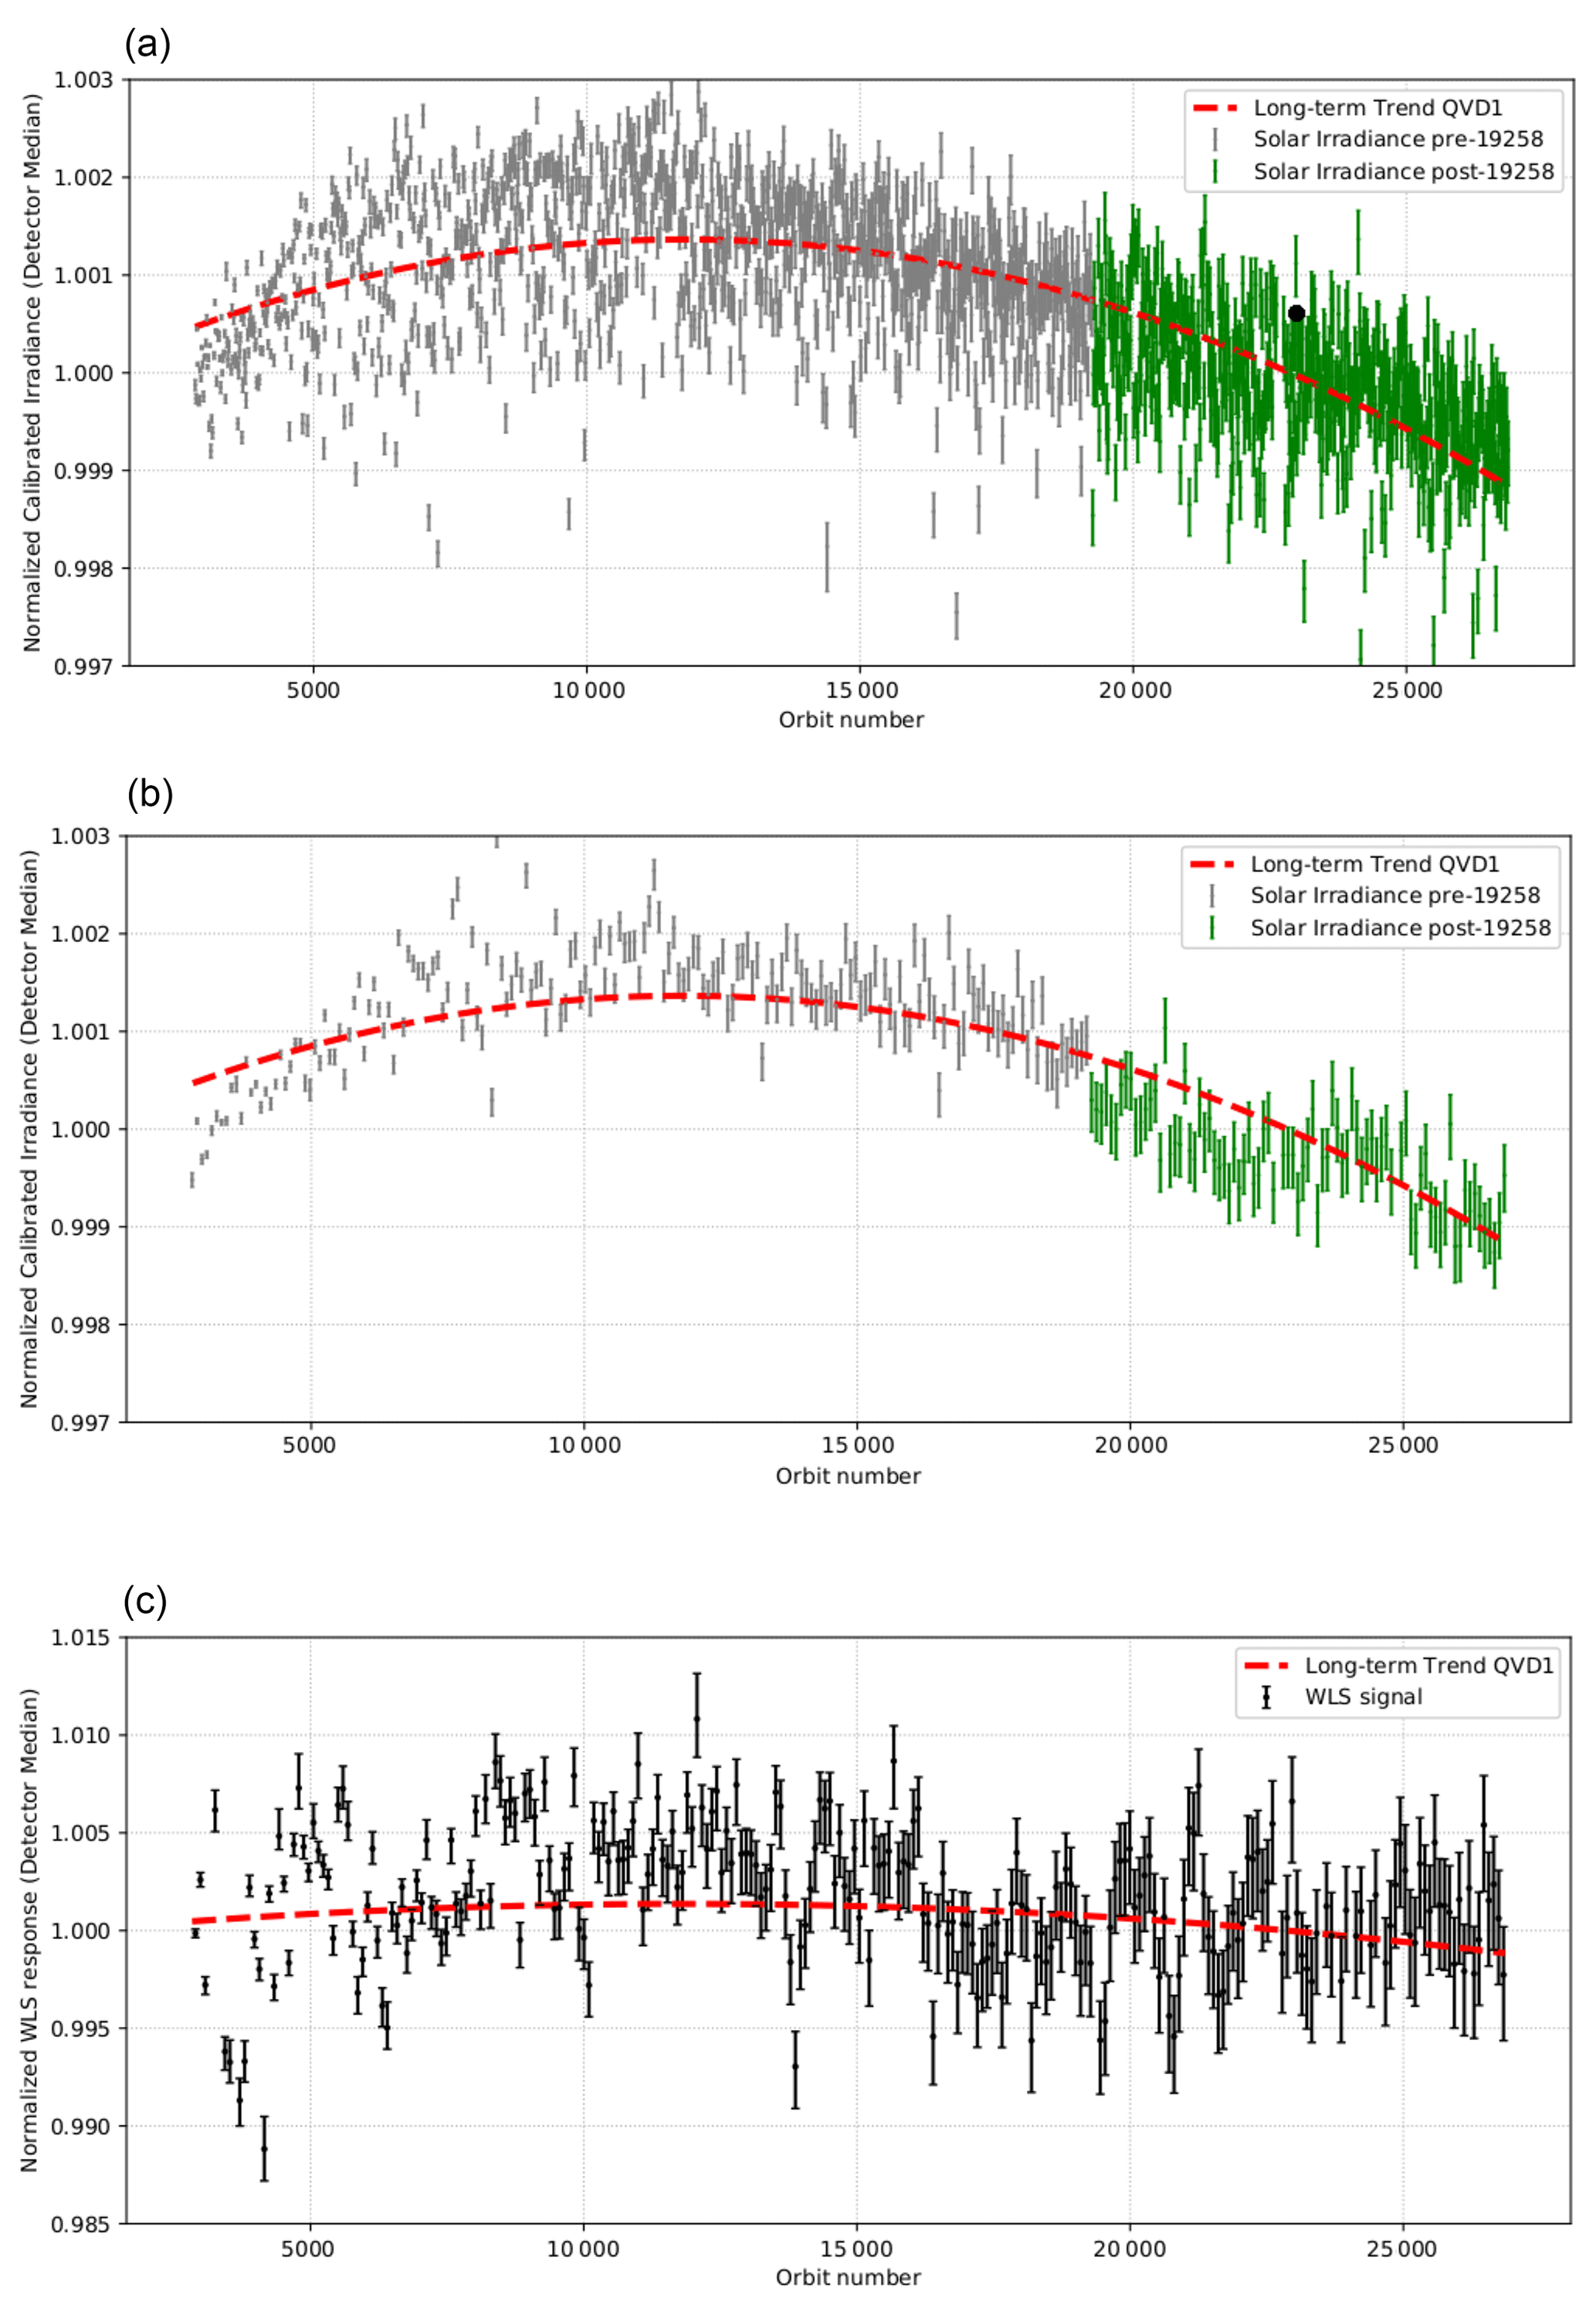
Figure 5Long-term stability of the TROPOMI-SWIR module shown by the detector median of the normalized solar irradiance using the main diffuser (a), back-up diffuser (b), and white light source (c). The change in key calibration data for the irradiance is represented in the data before (grey) and after (green) orbit 19258. The red line shows the long-term trends of solar irradiance in all three plots. Orbit number 25000 corresponds to November 2022.
2.4 Conclusions on stability of TROPOMI-SWIR
The main conclusion that can be drawn from the results here is that an extremely stable (i.e. ∼ 0.1 % transmission change and loss of 0.4 % of pixels over 5 years) performance of the TROPOMI-SWIR module is seen. TROPOMI-SWIR is thus well suited to explore the methodology of vicarious calibration as applied to similar IR spectroscopic sounders. The performance of TROPOMI-SWIR presented here is much better than the limits typically seen for vicarious calibration (Kuze et al., 2014; Bruegge et al., 2019a).
The scale of the degradation found in the sections above is vastly smaller than the typical accuracies achievable using vicarious calibration in studies for sensors comparable to TROPOMI, such as OCO-2 and GOSAT (Kuze et al., 2014; Bruegge et al., 2019b). The scale is also significantly smaller than the limits found for TROPOMI-SWIR instrument degradation by monitoring PICSs in the Sahara (van Kempen et al., 2021).
To perform the vicarious calibration, two types of measurements from RRV were used. The first are data extracted from automated instruments within RADCALNET, as described in Sect. 3.1. The second set of measurements consist of ground measurements from dedicated campaigns, as described in Sect. 3.2. In addition to the reference data, three ancillary datasets were used to derive various necessary corrections, presented in Sect. 3.3. The full method is discussed in Sect. 4.
3.1 RADCALNET
The Radiometric Calibration Network (RADCALNET) provides zenith-view bottom-of-atmosphere (BoA) and top-of-atmosphere (ToA) reflectance data during daytime at 30 min intervals covering wavelengths from 400 to 2500 nm. This is done from five test sites, including RRV (Bouvet et al., 2019). The ToA reflectances are calculated from ground-based zenith-view reflectance measurements using MODTRAN (Berk et al., 2014). Data are publicly available through the RADCALNET website.8 The RADCALNET dataset for RRV is used as a reference for the observed TROPOMI continuum signal. RADCALNET is an automated instrument suite which can provide data at 10 min intervals near the TROPOMI overpasses. Compared to the TROPOMI data, RADCALNET data are limited in their spectral resolution (Bruegge et al., 2021). The hyperspectral data cube has a resolution of 10 nm, approximately 40 times wider than the TROPOMI-SWIR module. In addition, the response of a single spectral bin is triangular. For more on the RADCALNET dataset, we refer the reader to either Bouvet et al. (2019) or the user guide on the RADCALNET website.
3.2 RRV campaigns
Dedicated measurement campaigns were held at the RRV site to perform vicarious calibration for the OCO-2, OCO-3, and GOSAT and GOSAT-2 atmospheric sensors (e.g. Kuze et al., 2014; Bruegge et al., 2019b, a). The field measurements of the surface reflectance of the site are done by an ASD (analytical spectral device) field spectrometer (currently produced by Malvern Panalytical) over an area of 500 m × 500 m. These are done as close in time as possible to the overpass times of the OCO and GOSAT instruments. Both are close to the 13:30 mean crossing time (local time) of TROPOMI at nadir. The methodology for the field measurements is described in Sect. IV-A in Bruegge et al. (2019b). The data collection includes the meteorological data from a resident weather station, operated by the LSpec network of JPL. Aerosol optical depth (AOD) is retrieved from instruments in the Aerosol Robotic Network (AERONET). Note however that the longest wavelength of this photometer is 1020 nm, significantly outside of the wavelength range of TROPOMI.
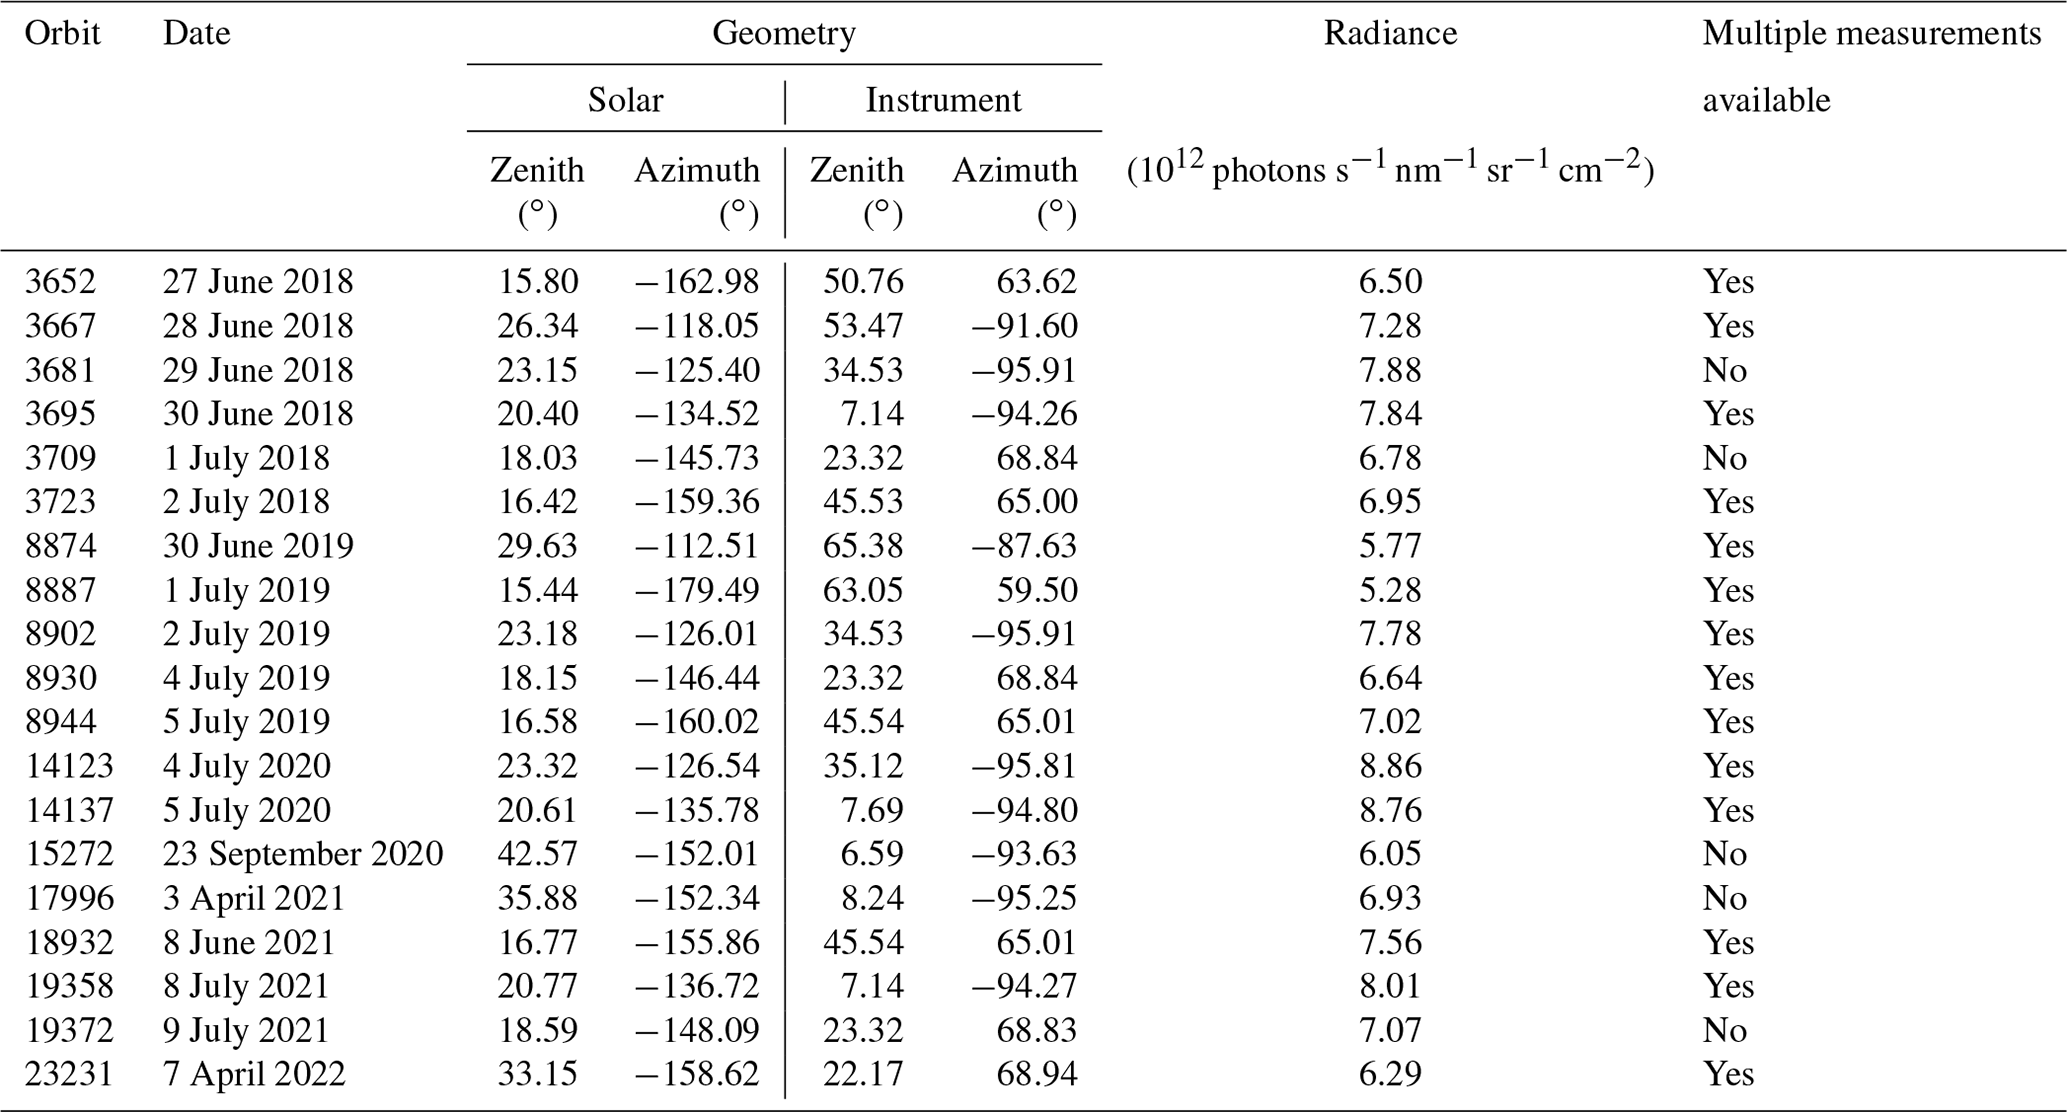
Table 1 lists the TROPOMI orbits coinciding with dedicated ground campaigns. Some days have multiple measurement points. Table 1 provides the TROPOMI orbit number, date, and geometrical parameters, as well as the observed continuum radiance, measured at 2313 nm. The latter shows that the measured radiance is not constant, varying from day to day. This variation is dominated by the varying solar and viewing angles, represented by the bidirectional reflection distribution function (BRDF) of the non-Lambertian desert surface.
Table 1Overview of TROPOMI orbits coinciding with dedicated ground campaigns. The associated geometry of the solar and instrument zenith and azimuth angles is given. In addition, the TROPOMI-SWIR continuum radiance at 2313 nm is provided.
3.3 Ancillary data
All data taken during ground campaigns need to be corrected for the non-Lambertian nature of the RRV desert surface. Several methods are discussed in Sect. 4, for which independent data are needed. These are either the MODIS (Moderate Resolution Imaging Spectroradiometer) and VIIRS (Visible Infrared Imaging Radiometer Suite) BRDF data products (Sect. 3.3.1 and Sect. 3.3.2) or the MISR-derived mRPV9 values, presented in Sect. 3.3.3. The MODIS and VIIRS data products (MCD43A1 and VNP43MA1) use a kernel-driven, semi-empirical BRDF model, utilizing RossThick-LiSparse-Reciprocal kernel functions for characterizing isotropic (fiso), volume (fvol), and surface (fgeo) scattering (Ross, 1981; Li and Strahler, 1992; Wanner et al., 1995; Lucht et al., 2000; Schaaf et al., 2002, 2011). These in turn provide BRDF factors for arbitrary viewing and solar angles. The MISR data product is given as variables of the modified Rahman–Pinte–Verstraete (mRPV) model (Rahman et al., 1993b, a).
3.3.1 MODIS
MODIS (Justice et al., 1998) consists of two instruments mounted on the AQUA and TERRA satellites. The two instruments view the complete surface of the Earth every 1 to 2 d under multiple angles, simultaneously acquiring data in several spectral bands. The closest band to the TROPOMI-SWIR wavelength range is Band 7 at 2.1 µm. BRDF products provide scattering values fiso, fvol, and fgeo, which are used to derive the BRDF at 16 d intervals. This is publicly available with the designation MCD43A1 (see, for example, Schaaf et al., 2011). The MODIS spatial resolution is significantly higher than TROPOMI, with the MCD43A1 product provided at a resolution of 500 m × 500 m. The product is of higher resolution than the VIIRS product described in Sect. 3.3.2. Because of their high albedo at SWIR wavelengths, desert surfaces often saturate MODIS detectors and/or are flagged as fully or potentially cloudy. MODIS data thus cannot be fully reliable. The data are provided in a sinusoidal coordinate system with the RRV Playa included in the (h,v) = (8,5) grid tile.
3.3.2 VIIRS
The VIIRS instrument on the Suomi NPP (National Polar Partnership) satellite (Justice et al., 2013) was launched in 2011. It provides a BRDF product over land. The VIIRS BRDF product (VNP43MA1) provides data at 1 km resolution at daily intervals using observations over a total of 16 d (Schaaf et al., 2019). It is weighted to the ninth day. The VNP43 product is designed as a continuation of the MODIS product (Liu et al., 2017) and uses the same coordinate system as MODIS. Band M11 between 2.23 and 2.28 µm, which is located close to the TROPOMI band, was used. Contrary to MODIS, the VIIRS instrument is much less affected by saturation and/or false cloud flagging at these wavelengths.
3.3.3 MISR
Data from the Multi-Angle Imaging Spectroradiometer (MISR) (e.g. Diner et al., 2002; Bruegge et al., 2002) can be used to derive BRDF parameters at a time resolution of 15 d (Bruegge et al., 2002, 2019a). MISR consists of nine sensors that observe at angles ranging from 70.5∘ in the forward to 70.5∘ in the backward direction from the local vertical. MISR has four spectral bands at 446, 557, 672, and 862 nm and a surface BRF (bidirectional reflectance function) product with which ToA radiances are corrected for atmospheric effects. The high reflectivity of RRV and the potential presence of clouds cause the number of data points used as input to derive the values to be irregular. The surface reflectances from MISR are fitted to the mRPV model described below. The values for the free parameters in the mRPV models were found to be suitable (Bruegge et al., 2019a). The data are freely available in product MIL2ASLS.003 through the atmospheric science data website of NASA.10
To compare data from these three sources (TROPOMI, RadCalNet, dedicated campaigns), several correction steps are required using the ancillary data (VIIRS, MODIS, MISR). Corrections are grouped into three categories.
-
The first category is a correction due to scattering and absorption by aerosol and molecules along the light path through the Earth's atmosphere towards TROPOMI. This is corrected using radiative transfer calculations, which include the optical depth (i.e. the AOD). These are discussed in Sect. 4.1
-
The second category covers corrections due to surface properties influencing the reflection on the RRV surface. These are carried out through a normalization factor of the BRDF. For RRV the surface is assumed to be a homogeneous flat desert area within the full areas covered by individual TROPOMI-SWIR pixels. As such, the BRDF depends on the solar illumination angles (θsol, ϕsol) and instrument viewing angles (θi, ϕi), given in polar coordinates at the overpass time with the polar coordinates corresponding to a nadir view at θ=0. The convention for ϕsol is anticlockwise. This is presented in Sect. 4.2
-
The third category of corrections consists of corrections relating to coverage. These are related to time differences between respective soundings and associated ground measurements, spatial averaging over RRV, and/or different spectral coverages. This is discussed in Sect. 4.3.
4.1 Radiative transfer
4.1.1 RADCALNET top-of-atmosphere radiative transfer
The RADCALNET product provides a top-of-atmosphere (ToA) product, for which the reflectance value is given with the atmospheric effects included. This is done using the MODTRAN V5.3 radiative transfer code, with the method and output data described in Sect. 3.3 and 3.4 of Bouvet et al. (2019). The data used a representation of the continuum values in the TROPOMI band. A continuum radiance for the RADCALNET data are derived by multiplying the ToA reflectance by the observed TROPOMI-SWIR solar irradiance at 2313 nm.
4.1.2 RemoteC
The radiative transfer is calculated to obtain simulated spectra from reflectances measured on the ground. These simulated spectra are compared to the observed TROPOMI spectra. The radiative transfer is carried out with the RemoteC code. RemoteC is the retrieval code used for the operational methane product of TROPOMI (Hasekamp and Butz, 2008; Butz et al., 2009, 2011; Hu et al., 2018). For these retrievals, a solar model (Hu et al., 2016) is adopted in addition to a set of standard settings, such as the location and altitude of RRV, the number of atmospheric layers, the aerosol optical depth (see below), and the input values of cross-sections of relevant chemical compounds (water, carbon monoxide, and methane). For the initial column densities, the original input estimates are used instead of derived TROPOMI abundances. This was done specifically to avoid introducing instrument systematics of the TROPOMI instrument. For more on RemoteC and its usage, we refer the reader to Hu et al. (2016).
4.1.3 Aerosol optical depth
The aerosol optical depth (AOD) shows daily variations and needs to be corrected for in the radiative transfer. It is available through both the RADCALNET dataset and the RRV ground measurement campaigns. AOD has a dependency on wavelength expressed through the Ångström exponent α (Ångström, 1927; Kaskaoutis et al., 2007); values at infrared wavelengths are typically very low (< 0.05). An assumption was made that the AOD at 2.3 µm is similar to or lower than the AOD at 1 µm, which is a value obtained from ground measurements using AERONET. Simulations with an extrapolated linear drop off from 1 to 2.3 µm showed differences less than 1 % in the continuum radiance results.
4.2 BRDF normalization
BRDF normalizations are done to correct for effects introduced by the viewing angles (θi, ϕi) of the instrument. Solar illumination after the reflection on the desert surface to angles θ and ϕ is expressed as signal S.
with 0,0 representing the nadir direction; Snorm(0,0) the amount of light scattered towards nadir; and nBRDF(θi,ϕi) the normalization factor. Several methods can be used to derive nBRDF. Two are considered here:
-
Factors derived from an mRPV model (Sect. 4.2.1) are used. These utilize results extracted from the data from the MISR measurements.
-
Satellite measurements of the BRDF itself are used to derive the nBRDF factor. The results from BRDF products of both MODIS (Sect. 3.3.1) and VIIRS (Sect. 3.3.2) are considered.
4.2.1 mRPV
The modified Rahman–Pinte–Verstraete (mRPV) model (Rahman et al., 1993a, b) has been used to provide model estimates of a wide variety of surfaces. The model is physics-based and includes a description of a hotspot. The latter, originating from the radiation transmission through the porous material, was found to be required to accurately describe the increased amounts of observed backward scattering. The mRPV model has been applied to a variety of soil and vegetation surfaces, including RRV (e.g. Bruegge et al., 2019a). The model can mathematically be expressed as
where
and
In this model, solar and viewing angles θsol, ϕsol, θi, and ϕi are used in combination with free parameters r0, k, and b. The factor h relates to the hotspot.
The nBRDF factor itself is derived by dividing by , with ϕi=0. For this nadir view, Eqs. (2) to (6) reduce to
with
i.e. the sole angular parameter being the solar zenith angle θsol.
Bruegge et al. (2019a) explored the validity of this method as applied to the RRV site, making comparisons with the results of various ground-based measurement campaigns and satellite measurements. This included derivations for the values of r0, k, and b. It was concluded that these appear to vary by a few percent in both time and exact location within the RRV Playa. The wavelength dependency of these parameters (i.e. the similarity of data at short and long wavelengths) appears to be smaller than typical measurement errors (see, for example, Fig. 7 in Bruegge et al., 2019a).
Figure 6 shows these values for the central RRV location. Although only the central square kilometre is used, it is assumed that the values are valid (i.e. continuous and similar) for the entire RRV Playa. This shows that most variations in these values are time variations presumably due to the changes in the surface.
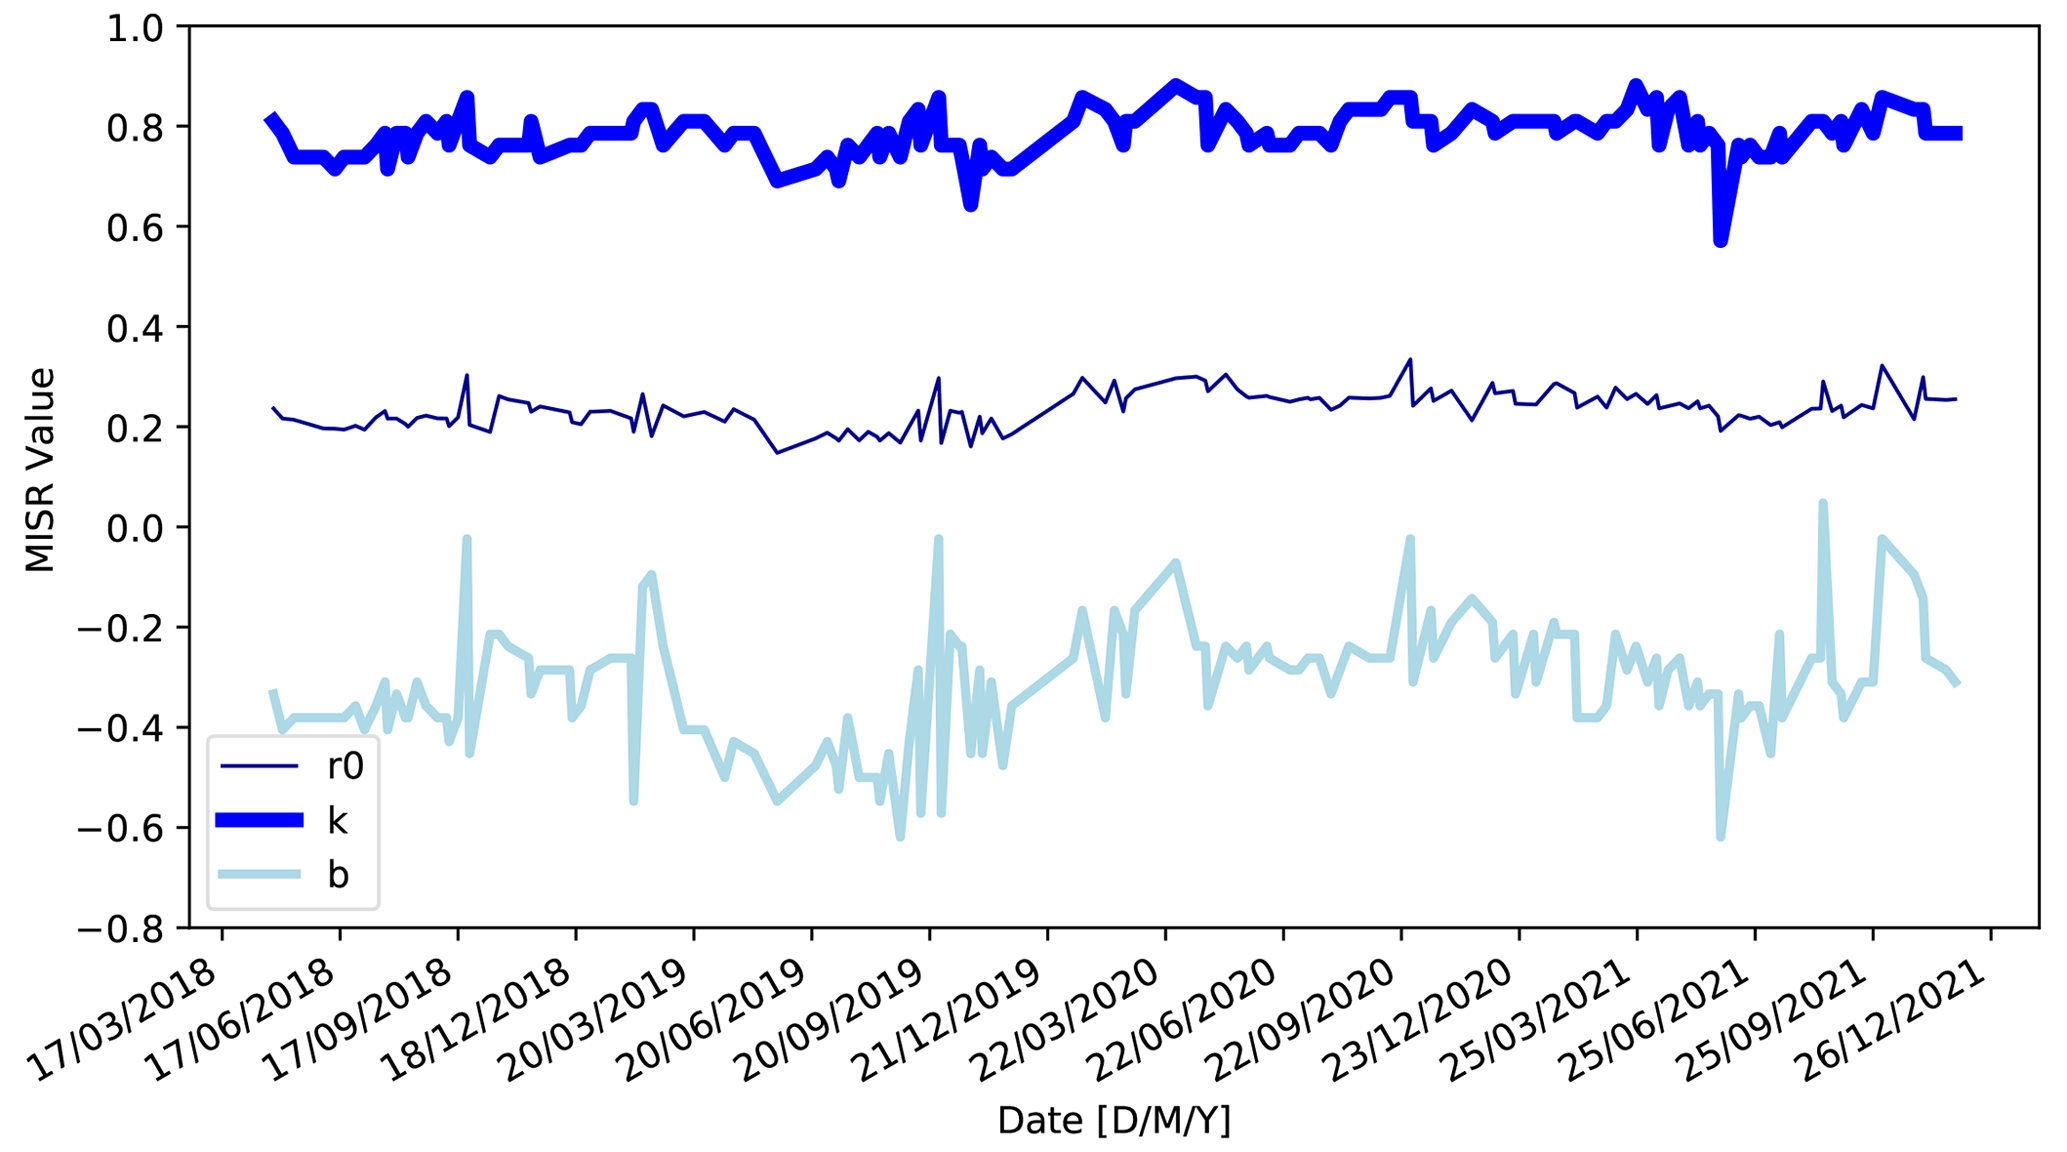
Figure 6MISR values for free parameters in the mRPV model (r0, k, and b) above RRV as a function of date.
4.2.2 BRDF products
The normalization factor can also be derived directly from albedo products from MODIS and VIIRS with the nBRDF factor expressed as
Here, BRDFinstrument is derived from the scattering parameters of the products of VIIRS and MODIS, i.e. the isotropic (fiso), volume (fvol), and surface (fgeo) weighting parameters. These are associated with a RossThick-LiSparse-Reciprocal BRDF model. The M7 (MODIS, 2.105 to 2.155 µm) and M11 (VIIRS, 2.23 to 2.28 µm) bands were chosen for their proximity to the TROPOMI-SWIR band. Potential differences in wavelength of these products are assumed to be small. The obtain the proper values at the TROPOMI geometries, BRDFs are calculated by the forward model. For the calculation, we refer to the user guides of these products.11
4.3 Coverage corrections
4.3.1 Spatial averaging
Most data are available at much higher spatial resolutions (∼ 1 km2 or smaller) than the TROPOMI pixels, which themselves vary in size. As such, the following assumptions need to be made to ensure a relatively fair comparison.
-
The RRV Playa is homogeneous in its surface properties as measured from the location of the ground measurements.
-
If available and included in the inner 5 km × 5 km area of the TROPOMI pixel around the reference point of the RRV area, a median of data points will be used. This applies to the MODIS and VIIRS data.
-
More extreme instrument zenith angles of TROPOMI should be excluded. These pixels include large areas outside of the RRV Playa. The limit is set to a 20 km pixel size in the across-track direction (see Fig. 1). This is equivalent to a viewing angle not greater than 60∘.
The uncertainties introduced by these assumptions likely dominate the final comparison. From previous comparisons of similar sounders such as OCO-2 and GOSAT (Kuze et al., 2014; Bruegge et al., 2019b, a), the uncertainty is expected to be in the range of 5 %–10 %.
4.3.2 Time differences and solar angle
Assuming a homogeneity of a flat desert surface, variations in local overpass time are secondary variations and take the form of a function of solar zenith angle. These are not accounted for in the individual nBRDF corrections, which assume measurements are taken coincidentally. These variations need to be corrected when comparing measurements at different times. The variation in the TROPOMI early-afternoon overpass can itself span almost 90 min in local time. Effectively this is a variation of up to 45 min in the RADCALNET data and up to 75 min with the RRV ground campaigns. It is assumed that a dependency on time is in effect a dependency on the solar zenith angle.
A time correction function can be derived using the RADCALNET data. With its year-round coverage every 30 min during the daytime, one can sample the full range of solar zenith angles and compare the bottom-of-atmosphere results. Averaged BoA reflectances, which are not affected by molecular absorption, between 2310 and 2370 nm are compared to the measured solar zenith angle (SZA) in bins of 10 nm. Due to the lack of atmospheric absorption, these measurements are more reliable than the top-of-atmosphere values used in the comparison with TROPOMI radiances. Figure 7 shows the fitted dependency using both a second-order polynomial fit and a cosine fit. Erroneous data are removed by flagging all values above 0.28 and below 0.20. The cosine fit was found to provide the lowest residuals. The function parameters are 0.276 for the amplitude and 725 as the effective period expressed in solar zenith angle. We assume an uncertainty of 10 % in these values. A time correction factor is subsequently derived by calculating the ratio of this cosine function at the two measured solar zenith angles. The correction is smaller than the nBRDF correction but can at times be the cause of differences of a few percent, due to the range of time differences (up to 1.5 h) between different TROPOMI measurements that can cover the RRV site.
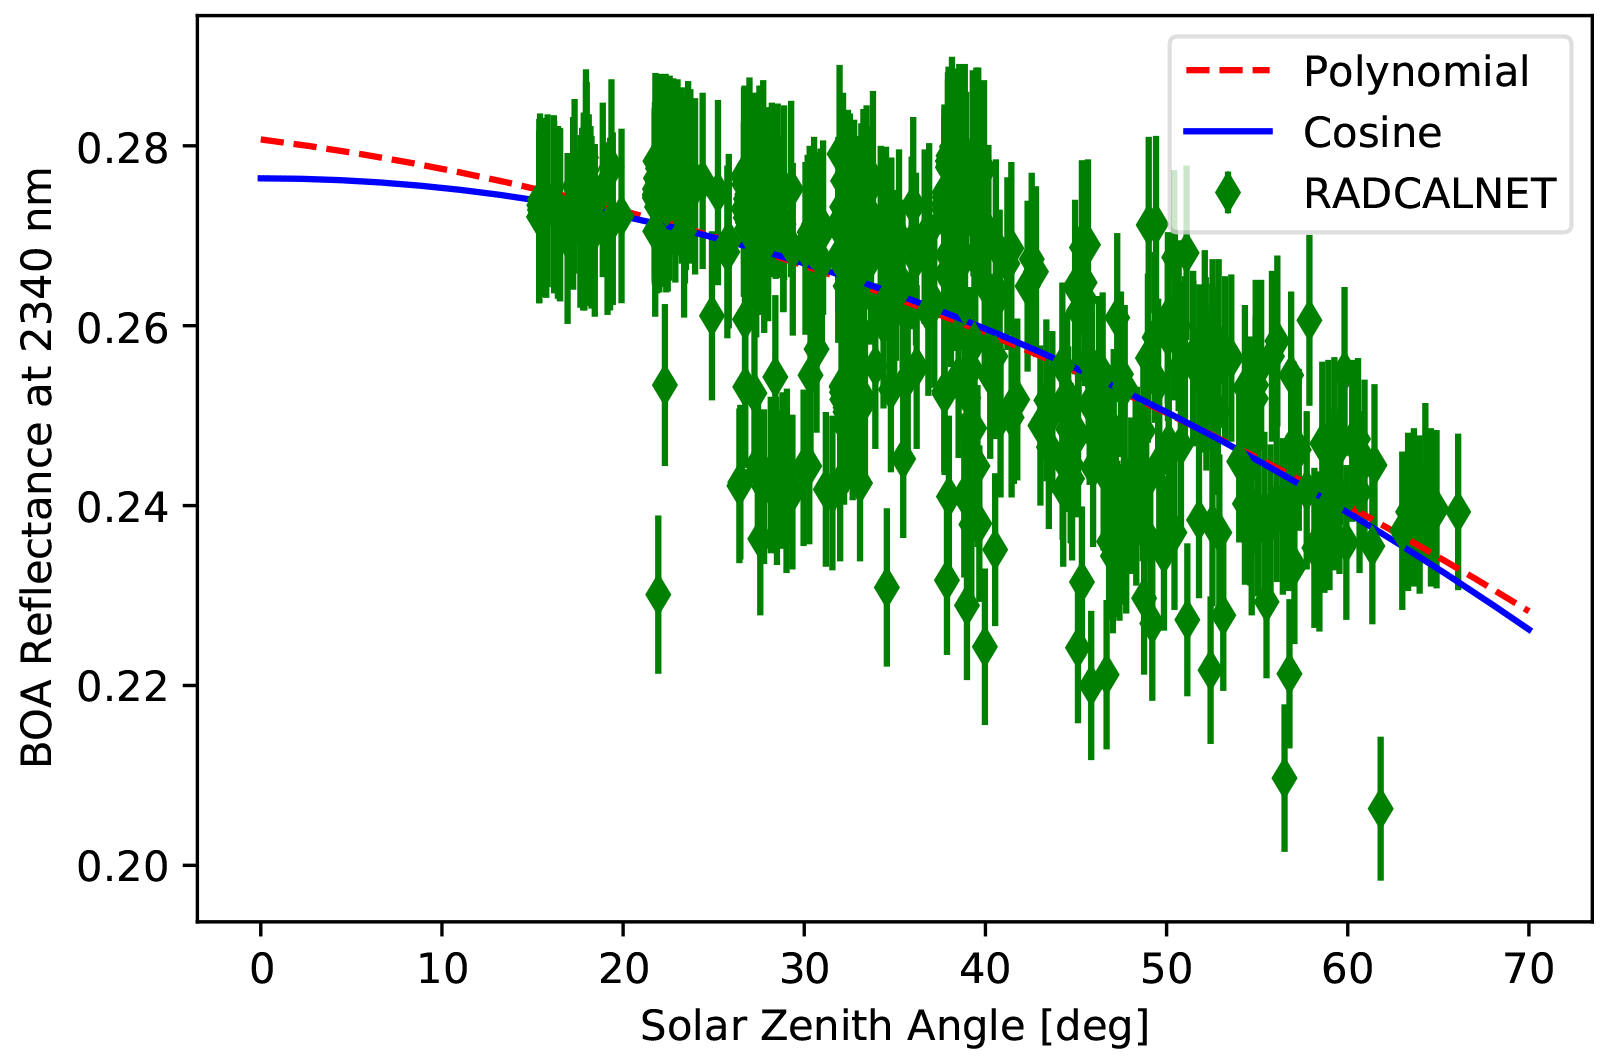
Figure 7Solar zenith angle difference (i.e. time difference) correction using BoA RADCALNET data.
4.4 Spectral coverages and resolutions
The spectral coverage of the various instruments differs from that of TROPOMI and must be considered before applying corrections.
4.4.1 RADCALNET
RADCALNET data are published at intervals of 10 nm, with a triangle-shaped instrument spectral response with a half-width of 10 nm. This significant difference as compared to the TROPOMI ISRF (instrumental spectral response function) of approximately 0.25 nm, needs to be accounted for. Near the reference continuum wavelength of 2313 nm, several atmospheric features are present that are included in the RADCALNET point of 2310 nm due to the instrument spectral response. These are caused by the absorption of water and methane and range in scale from about 2 % to almost 80 % of the ToA signal. See Fig. 8 for a comparison between the TROPOMI-SWIR spectrum and the BoA and ToA responses of the RADCALNET data using the average of cloud-free days in June and July 2018. For comparison, the half-base width of the triangular response is shown as a dashed line.
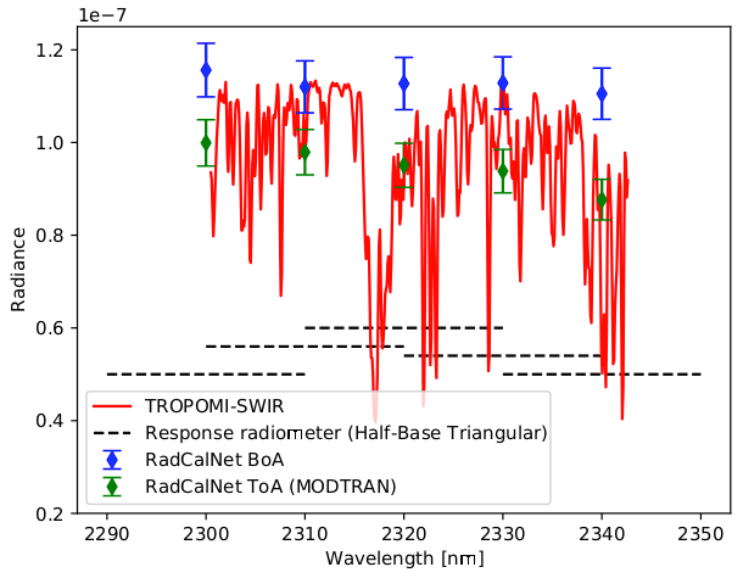
Figure 8Comparison between ToA and BoA data of RADCALNET data with a TROPOMI-SWIR nadir spectrum.
Using near-nadir (±3∘) overpass views of TROPOMI above RRV, one can quantify the amount of relative absorption in the RADCALNET signal at 2310 nm compared to the TROPOMI continuum value at 2313 nm. By definition, the nBRDF correction factor approaches unity at such small viewing angles. Differences must originate from the broad RADCALNET spectral response function to water and methane. This value will also change due to the varying amount of water and to a lesser extent methane in the atmosphere but can be approximated by taking an average over all such incidences where the TROPOMI overpass is through nadir. This average is found to be 24.7±1.2 %. As such a spectral correction multiplication factor of 1.247 will be applied to compare the MODTRAN ToA values of RADCALNET to the observed 2313 continuum value of TROPOMI-SWIR.
Interpolation of the RADCALNET data down to 1 nm has been performed using its reflectance values (e.g. Bruegge et al., 2021). This strategy was not adopted for the potential uncertainty as compared to the reference field data (see, for example, Fig. 2 of Bruegge et al., 2021, and references therein).
4.4.2 Ground campaigns
The ground campaign data are given as reflectances. Radiances are derived by carrying out the radiative transfer as described in Sect. 4.1.2. We refer to Bruegge et al. (2019a) for a description of how these data were obtained and derived. The spectral resolution is much better, approaching the TROPOMI-SWIR module resolution. No additional correction was implemented.
4.4.3 Data from ancillary space sensors
The three space sensors used to derive correction factors use various spectral windows. A precise description of the spectral windows and/or retrieval methodologies can be found in the various user guides. Molecular absorption is avoided in the selection of the spectral window and/or accounted for in the retrieval of the BRDF. Figure 7 of Bruegge et al. (2019a) reveals the wavelength dependency of the nBRDF factor itself to be minimal. This result was obtained by examining various viewing angles at both visible and infrared wavelengths. These results do include the large viewing angles (> 40∘) not typically found in other atmospheric sensing sounders besides TROPOMI. Bruegge et al. (2019a) imply that the angle dependency of the correction using the mRPV model and MISR data can be considered to be wavelength-independent. Thus, we opted to use results from the closest bands to the TROPOMI-SWIR band but ignore any differences in wavelength. For MISR the 866 nm results are used, while for VIIRS and MODIS the M11 (2.2 µm) and M7 (2.1 µm) bands provided the data closest in wavelength coverage to TROPOMI. Any uncertainty from this assumption is assumed to be minor (less, or even much less, than 1 %).
5.1 BRDF correction
The most significant correction that needs to be carried out to compare TROPOMI-SWIR radiances with equivalent values derived from ground-based measurements is the correction for the non-Lambertian surface, i.e. the BRDF correction, nBRDF. Two methods, using three distinct datasets, are discussed in Sect. 4. Before we inspect the results, it is useful to inspect the differences between the corrections. Table 2 lists the correction factor for each method (i.e. mRPV, MODIS, and VIIRS) for the orbital parameters given in Table 1 as well as the instrument zenith angle. Figure 9 presents the same set of derived correction factors as a function of instrument viewing angle. The difference between the two methods using the BRDF products of MODIS and VIIRS appears to be superficial. Different spatial coverage and data filtering in the two BRDF products were found to be the origin of differences in these methods. However, there are significant differences between the two BRDF products and the theoretical mRPV model. At larger zenith angles (> 40∘) the mRPV model and the results from the VIIRS/MODIS method start to significantly deviate, from both an eastern and western viewing point. The source of this deviation must be either the data quality of the VIIRS and/or MODIS data for more extreme angles or the accuracy of the mRPV model. The data are inconclusive. Given the physical viewing angles of the BRDF products (e.g. the most extreme angle for MODIS is ±49.5∘), BRDF data for MODIS and VIIRS are extrapolated at these angles. MISR does extend to these extreme angles (70.5∘). We also note that the MODIS and VIIRS data show significantly more scatter than the mRPV model for orbits with similar viewing angles in different periods. Near a zenith of zero (i.e. when the TROPOMI overpass is close to the nadir; this is best seen in the western view at +8∘ viewing zenith angle, VZA), the factors are in agreement. Differences in BRDF were explored for RRV in Bruegge et al. (2019a), and we refer the reader there for more information.
Table 2BRDF normalization factors derived using the mRPV model and the MODIS and VIIRS BRDF product for the orbits in Table 1. The TROPOMI-SWIR viewing zenith angle is given as a reference. A positive zenith angle corresponds to a western viewpoint.
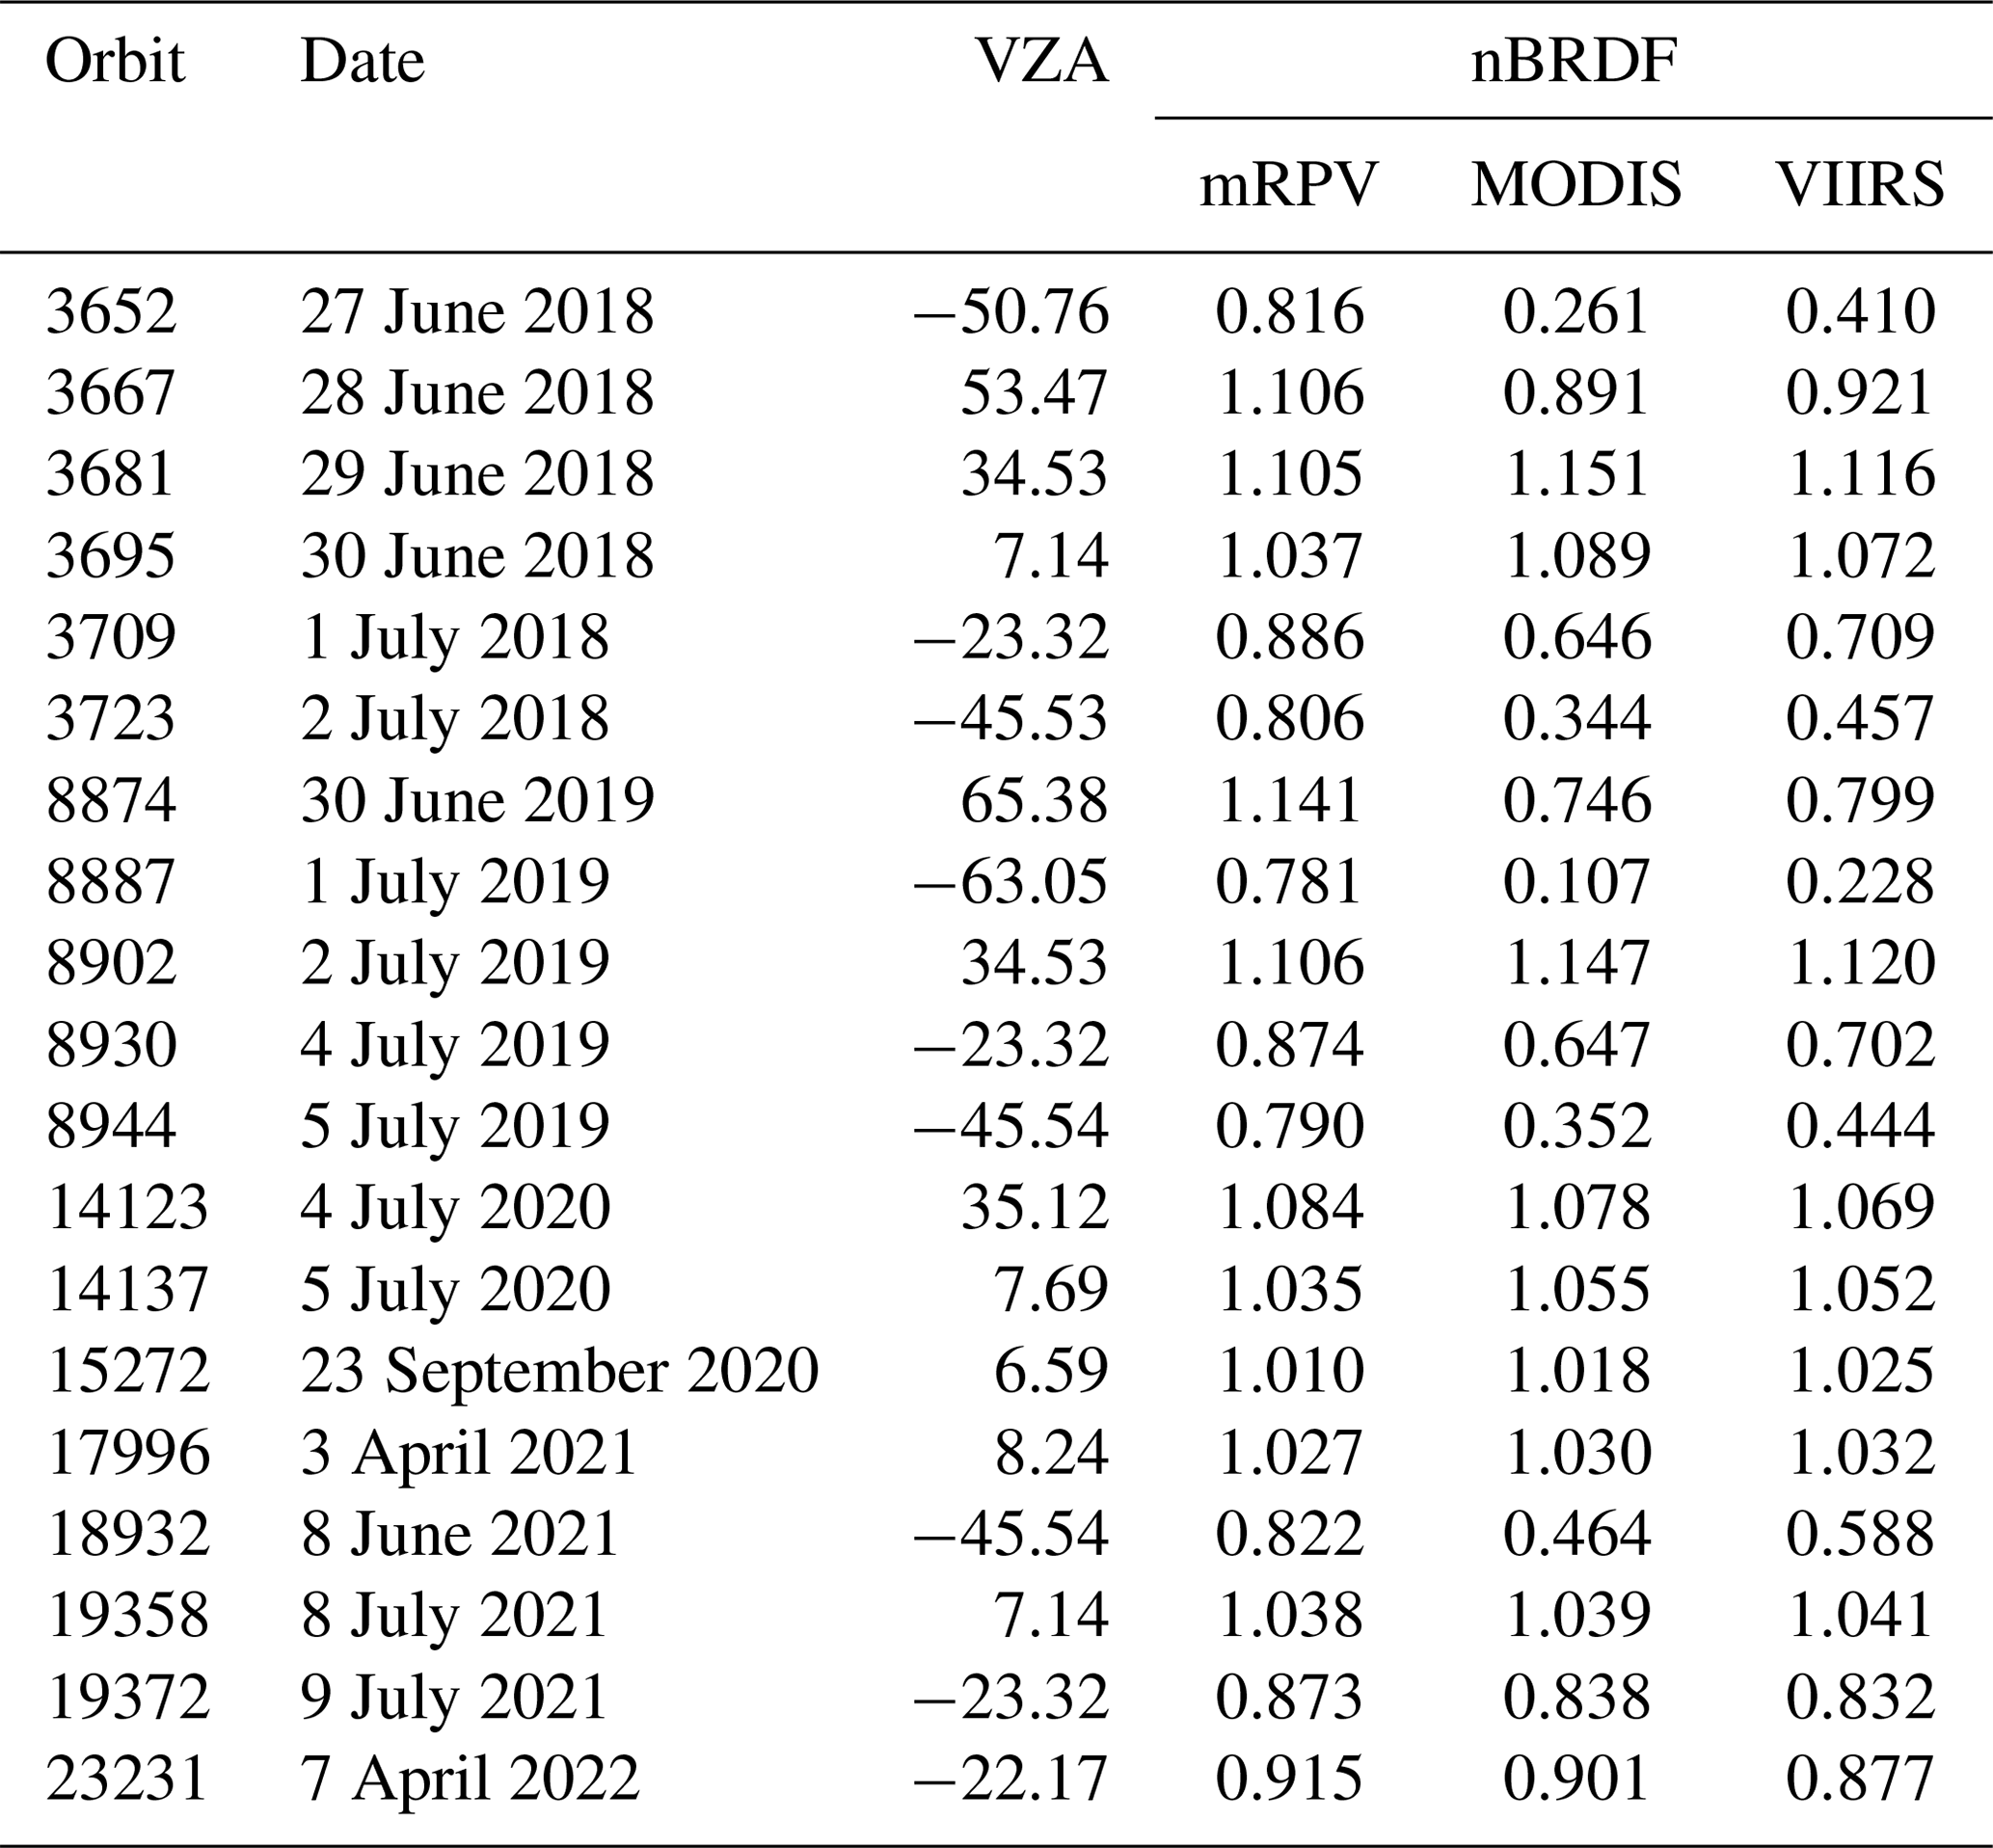
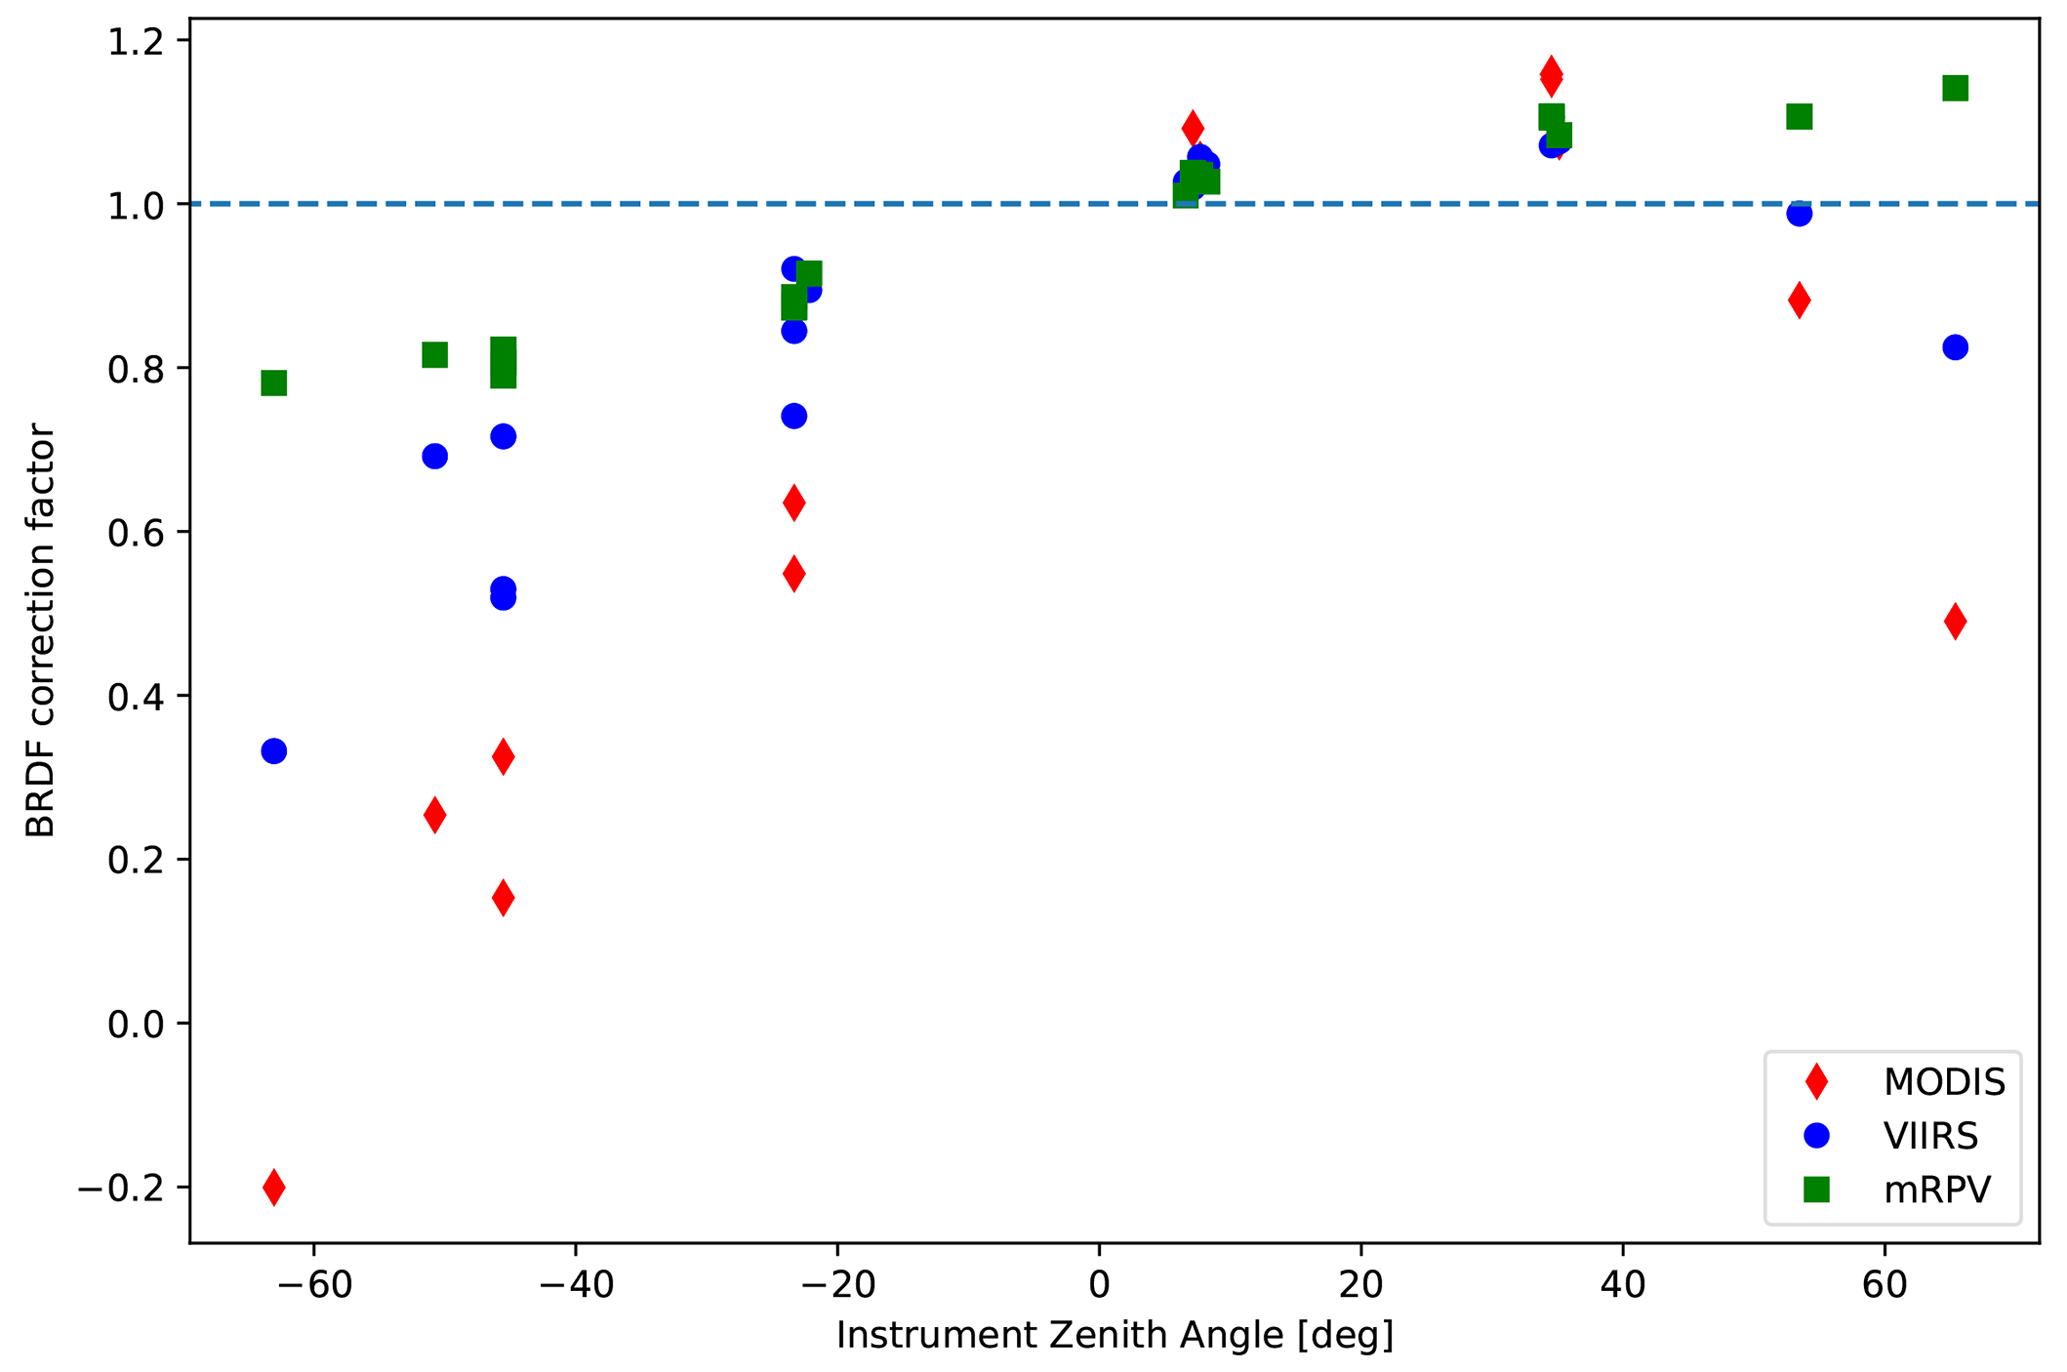
Figure 9Comparison between the nBRDF factors derived from MODIS data (red diamond), VIIRS data (blue circle), and mRPV models (green squares) for the sample, plotted as a function of the instrument zenith angle. With the solar azimuth in the west during the TROPOMI midday overpass, the positive instrument zenith angles coincide with a western azimuth angle of TROPOMI-SWIR.
5.2 TROPOMI-SWIR vs. RADCALNET
Figure 10 shows the continuum radiances of TROPOMI-SWIR and the RADCALNET measurements for two scenarios. In each scenario, we correct the TROPOMI-SWIR radiance to a nadir view, assuming the desert surface of RRV to be a Lambertian reflector (top), as well as assuming the desert surface to be an mRPV model with parameters measured by the MISR data (bottom). Correction using either MODIS or VIIRS was found to be very poor due to the lack of coincidental coverages. In addition to the BRDF correction, the correction for the time difference between the TROPOMI-SWIR overpass and the closest RADCALNET data point is applied. For both figures, the relative residual is given in green. The limit for cloud cover is extracted from the VIIRS cloud cover product included in the TROPOMI-SWIR methane product and is set at 0.9. Although this limit appears to be uncharacteristically high, it was discovered that at SWIR wavelengths, the cloud cover algorithm for TROPOMI may be inaccurate over bright desert surfaces such as those found at RRV. The algorithm often erroneously identifies the high albedo as partly or fully cloudy. Although overcast conditions are easily identified, partly cloudy conditions are known to be particularly difficult to discern. This filter is combined with RADCALNET. These data show fill values for (too-)cloudy conditions. For simplicity, it can be assumed that valid RADCALNET values correspond to relatively clear conditions.
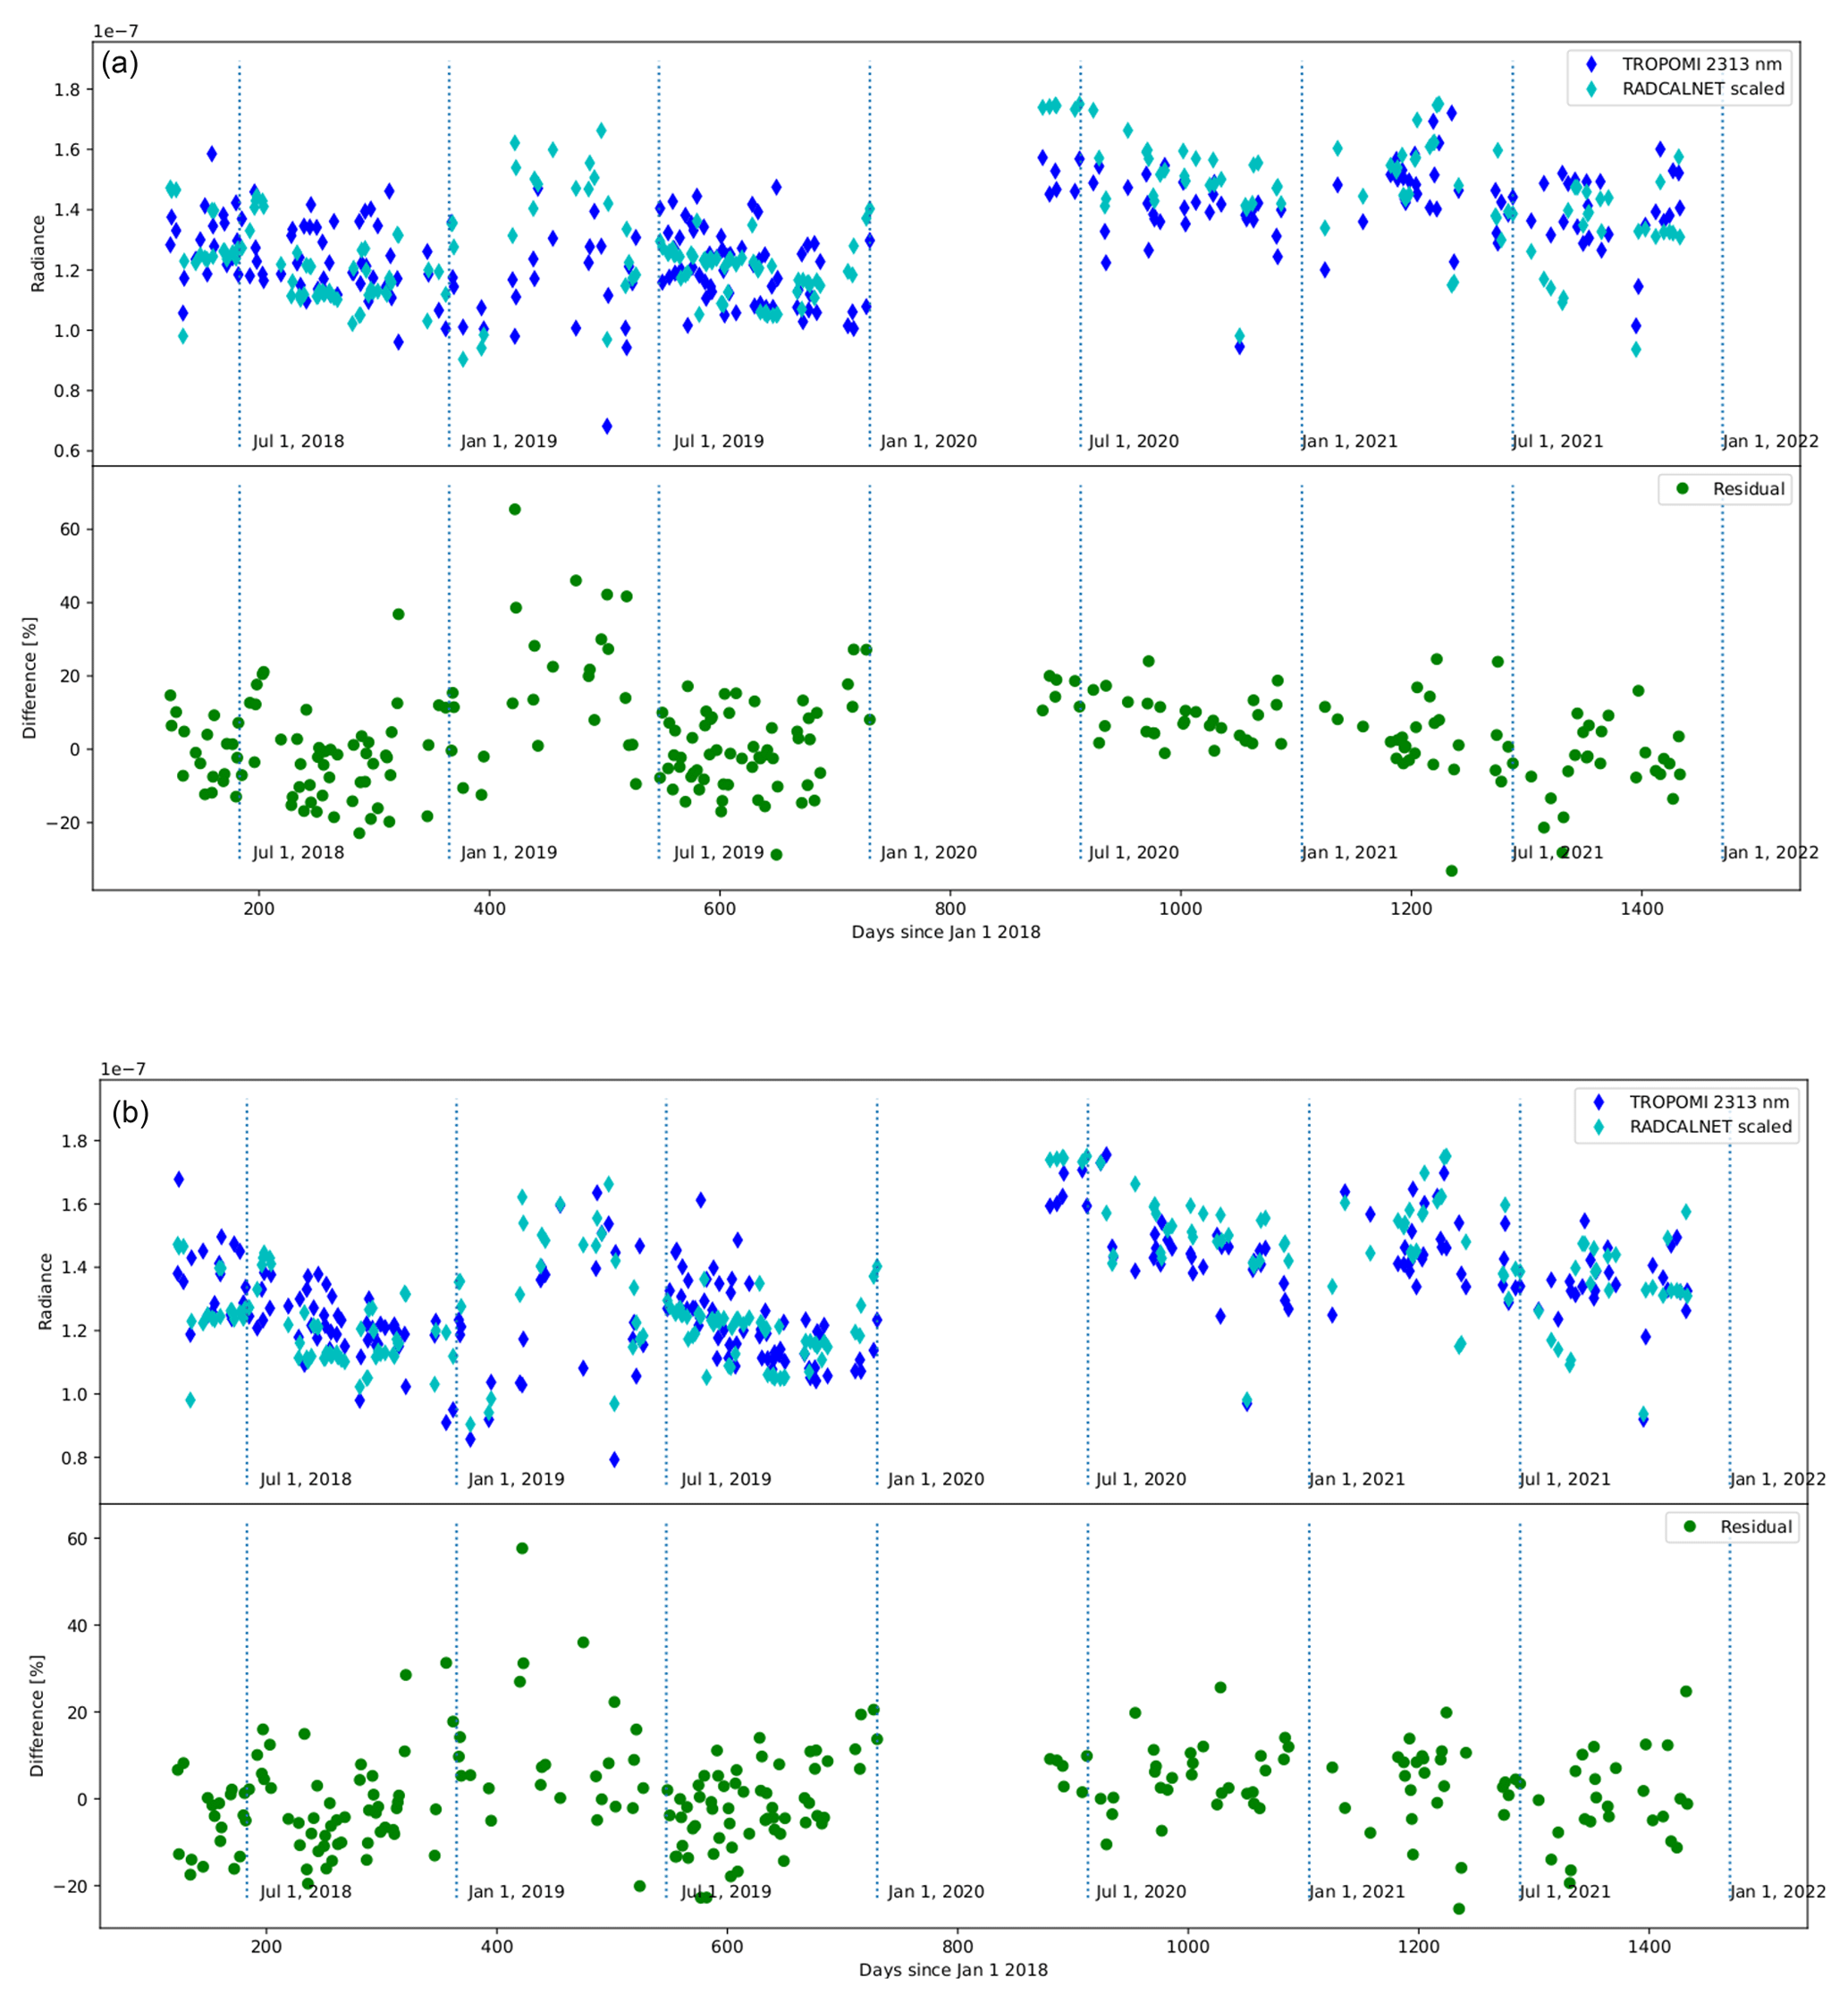
Figure 10Comparison between radiance at 2.3 µm between RadCalNet (cyan) and TROPOMI-SWIR (blue). Assumptions of a Lambertian surface are shown in the top row (a) and an mRPV model in the bottom row (b).
Several conclusions can be drawn from the trends seen in Fig. 10. First, the day-to-day conformity is relatively poor, with clear differences of up to 20 % being fairly typical. There is significant scatter in this conformity. Yearly trends (e.g. a slow reduction in radiance from mid-July to January and an increase towards early spring) are seen in both datasets. Structural trends in the residuals are seen for the Lambertian model, but not the mRPV model. This can be seen in the trends in the residual, which show a time dependency, for example, the slopes during the second half of 2020 and first half of 2021. The mRPV model improves the comparison between the RADCALNET data and the TROPOMI-SWIR data. The median of the absolute difference is 9.97 % assuming a Lambertian surface, while this number is reduced to 8.09 % when an mRPV model is used. As expected, neither comparison shows an increasing or decreasing residual over time, which would be indicative of instrument degradation. It must thus be assumed that the mRPV model is a slightly better representation of the desert surface. However, it must also be assumed that the comparison between RADCALNET and TROPOMI, albeit continuous and simplistic, has severe limitations, which are discussed in Sect. 6.
5.3 TROPOMI-SWIR vs. dedicated campaigns
The dedicated ground campaigns are of much higher data quality than that of RADCALNET (for information on data acquisition, see Bruegge et al., 2019a). The large drawback of using ground campaign data is the coverage. Although TROPOMI has daily global coverage, data are limited to a few dedicated days due to the resources necessary to obtain these detailed measurements. For this vicarious calibration, all corrections detailed in Sect. 4 are applied. Figure 11 shows examples of the comparisons of individual TROPOMI spectra with three spectra simulated from the measured reflectances. The top row shows TROPOMI-SWIR results in red and simulated spectra in blue. The bottom row shows the difference ratios, where a 1:1 ratio is given as a red line, and a 5th-percentile-difference (both positive and negative) ratio is shown as dashed blue lines. As expected, the largest deviations within every single comparison are found within deeper methane and water absorption features. This originates from inaccuracies in the radiative transfer modelling of atmospheric chemical compounds using MIPREP (multi-instrument preprocessor) column densities.
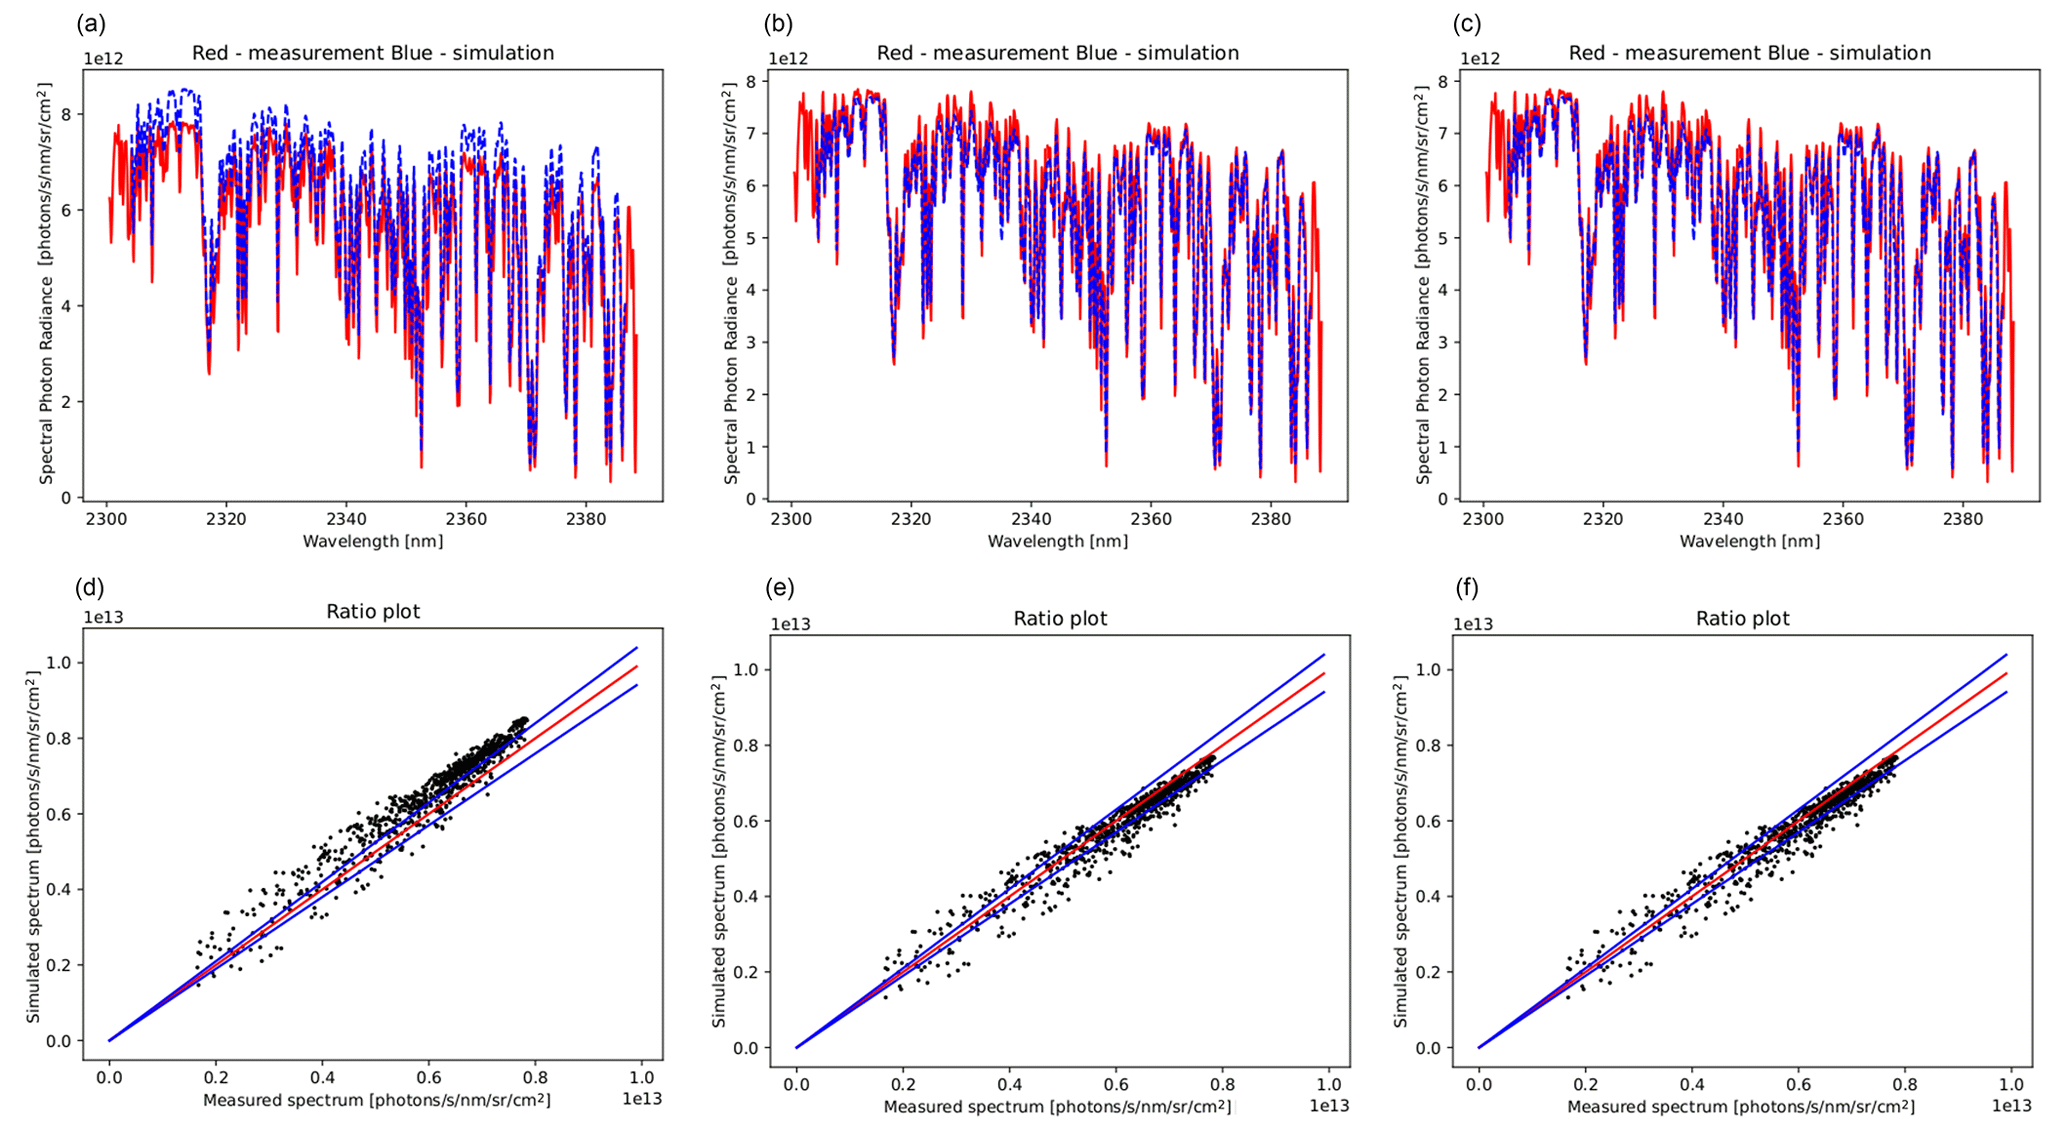
Figure 11(a–c) Comparison between spectra of TROPOMI-SWIR result of orbit 8902 between observation (red) and simulation (blue). The correction applied is the mRPV model (a), MODIS data (b), and VIIRS data (c). (d–f) Plots comparing the radiances of the simulated and observed radiances (black dots) and the 1:1 ratio (red line) and the 5th-percentile deviations (blue lines) for reference.
Quantification of the comparison (i.e. finding systematic differences) is obtained by fitting the ratio distributions in the bottom row of Fig. 11 with a “constrained” linear relation. For this relation, the intercept is constrained to 0.0 (i.e. no signal in the observed spectrum equals no simulated signal) instead of using it as a free parameter. In addition, the data range used for fitting is limited to the top 25 % of the TROPOMI-SWIR measured radiance values. This is done to avoid the inaccuracies found in the deep absorption features. This fitted slope is a quantification of the accuracy of the simulation: a value of 1 equals the best representation. This constrained linear fit was found to be the most robust as a quantification of the vicarious calibration. Several other fits and/or comparisons were explored (e.g. averaging of the full spectrum, non-linear fits, continuum-only comparison, usage of non-zero intercepts) but were found to be much less robust. Derived ratios for individual orbits are given in Table 3. Ratios are presented for each ground measurement. The ratio is also derived for all three correction methods. Figure 12 gives the derived slopes of the ratios as a function of time (Fig. 12a–c) and absolute instrument zenith angle (Fig. 12d–f) of TROPOMI during overpass for all three methods (mRPV, Fig. 12a and d; MODIS, Fig. 12b and e; VIIRS, Fig. 12c and f).
Table 3Results from the ratio analysis between the TROPOMI and simulated spectra. Values shown with F are omitted from the figures in Fig. 12 and are thought to be large deviations due to data quality.
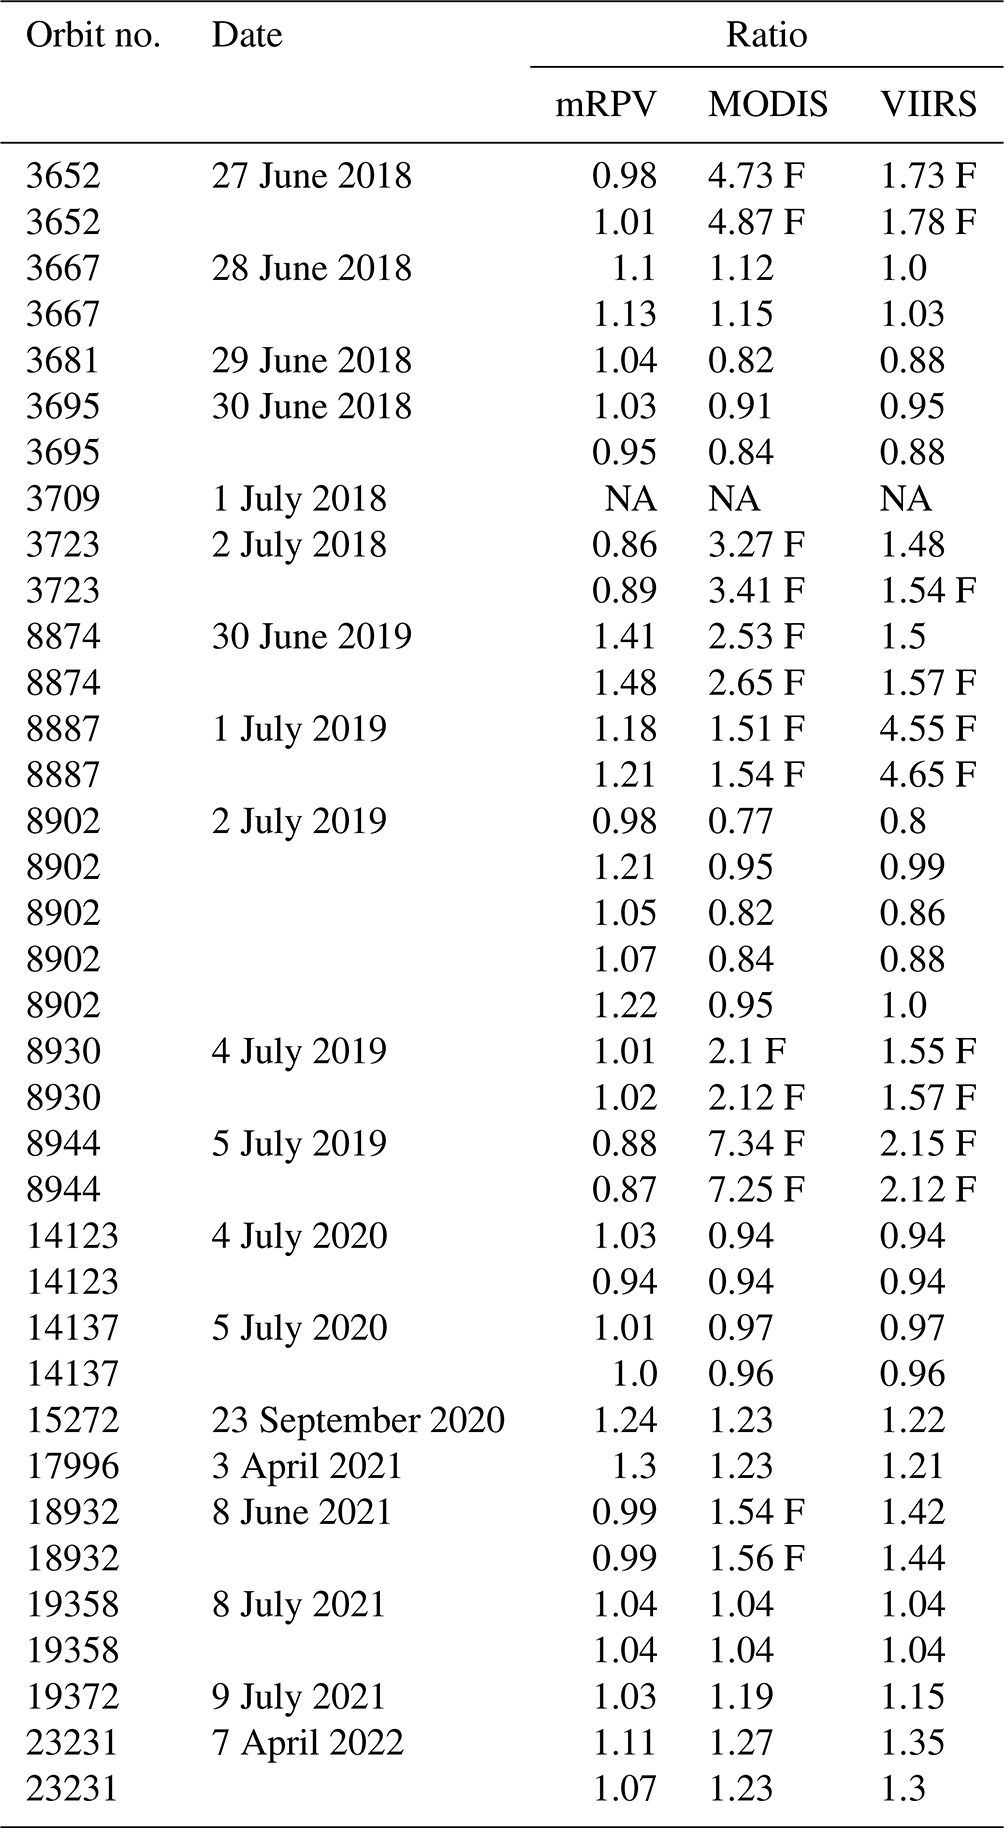
NA: not available.
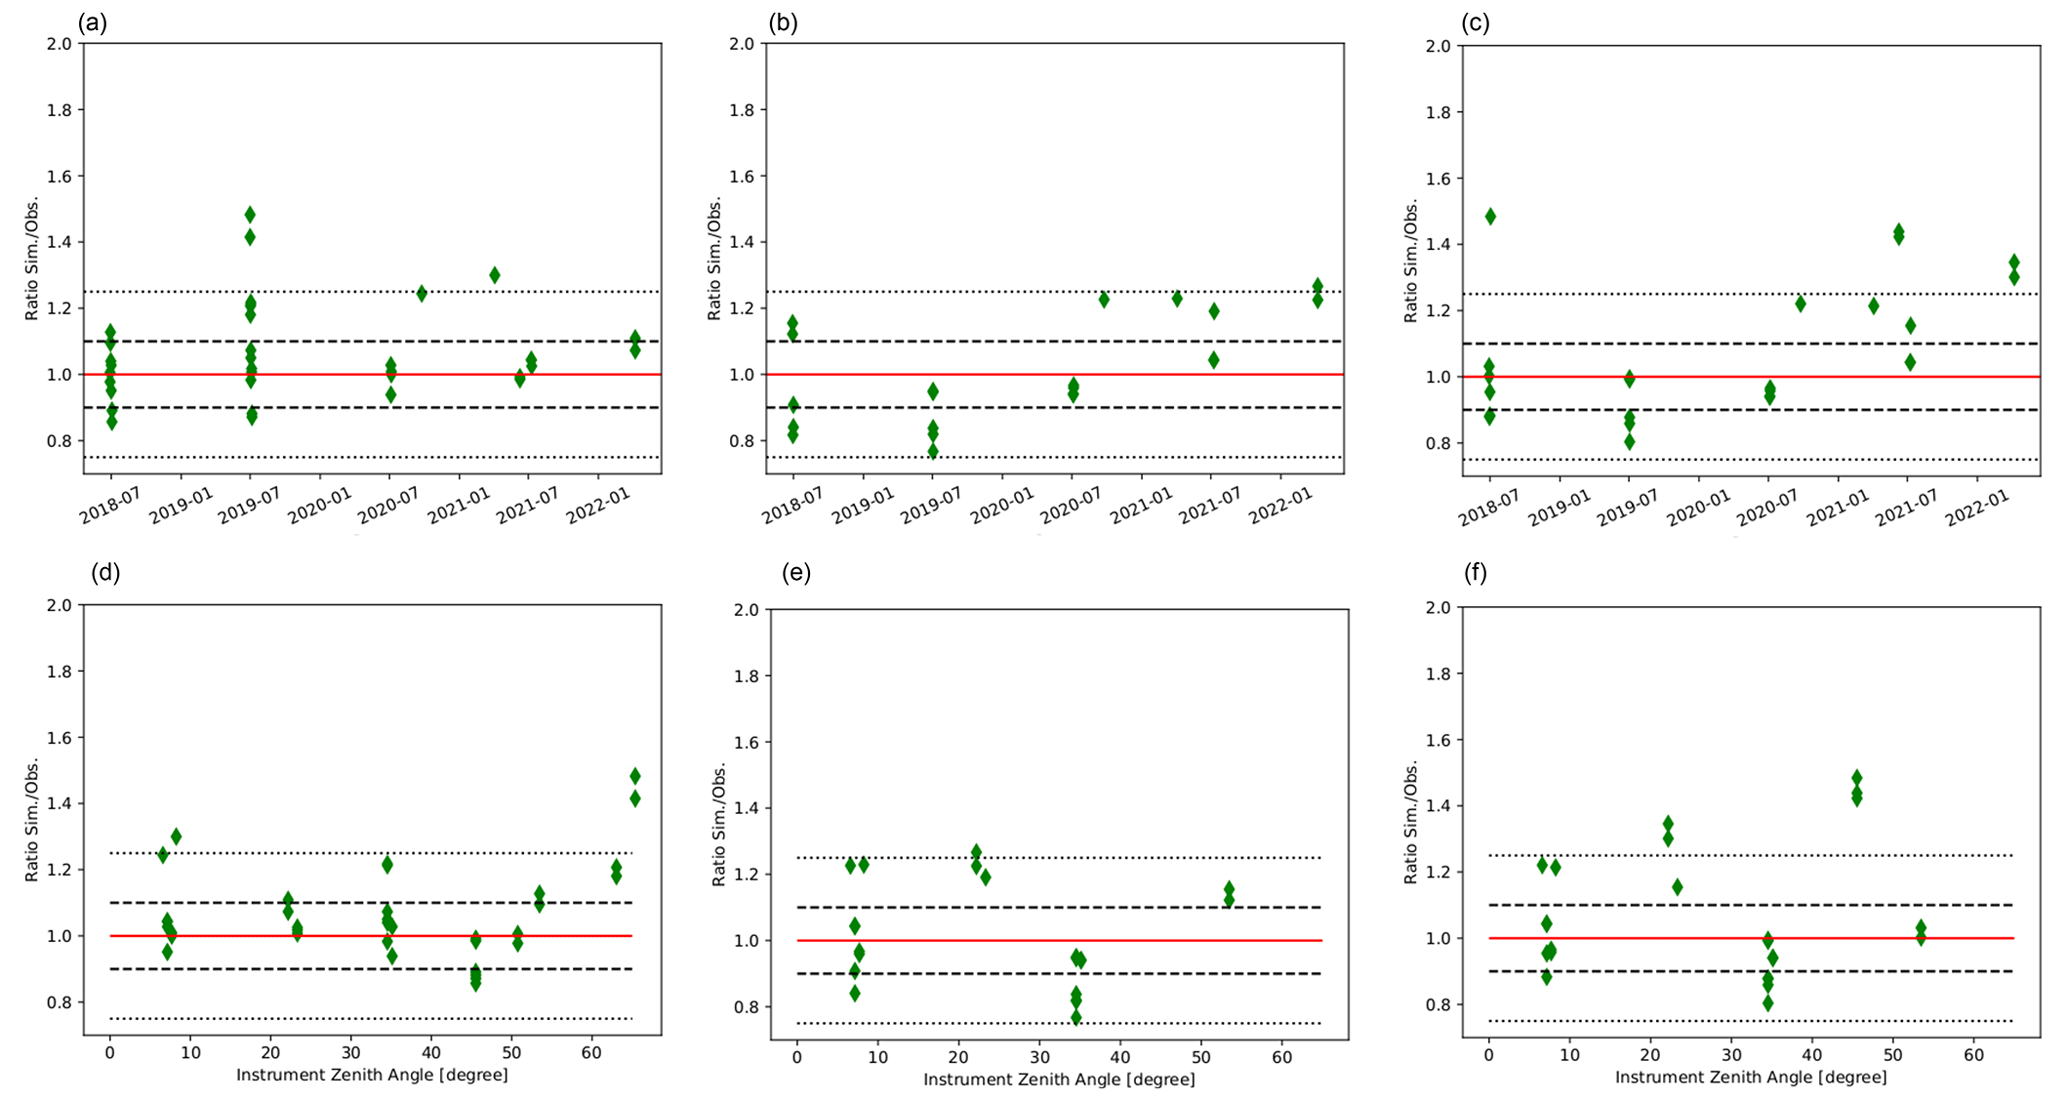
Figure 12Ratio fits of the mRPV (a, d), MODIS (b, e), and VIIRS (c, f) correction methods as a function of time (a–c) and instrument zenith angle (d–f). Ratios above 1.5 have been omitted for clarity. Such results are found in Table 3. In total 14 MODIS values and 10 VIIRS values are not plotted.
Ratios above 1.5 have been omitted from the plots in Fig. 12 and are indicated with “F” in Table 3. These do not occur for the mRPV model, but they occur 14 times for MODIS and 10 times for VIIRS. All dates on which VIIRS ratios are large also show large MODIS ratios. For example, orbit 8944 produces ratios over 2 (VIIRS) or even 7 (MODIS), while the mRPV is just 20 % lower than the TROPOMI radiances. Orbit 3709 could not be simulated using RemoteC. The origin of these deviations using the VIIRS and MODIS corrections is unknown, but we hypothesize that it does not have a singular origin. It appears to be a correlation with data taken at large angles, where the inclusion of non-RRV surfaces in the TROPOMI pixel is a factor. In these cases, larger values are seen in all three ratios. Examples are orbit 8874 or even 15272. In instances where the data for the mRPV model are in good agreement, deviations are thought to be caused by the data coverage and/or quality of MODIS and/or VIIRS BRDF products. Examples are orbit 8944 and 18932. Large differences between MODIS and VIIRS themselves indicate data quality limitations in the BRDF product. Due to its age and problems with bright desert surfaces, it is assumed that this disproportionally affects MODIS.
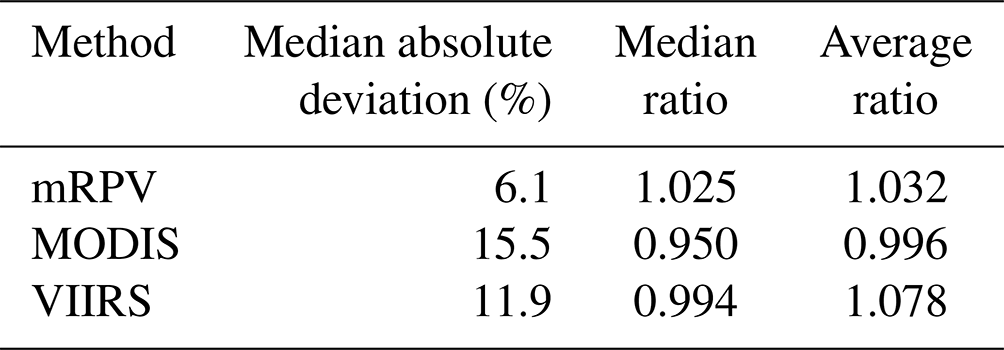
Table 4 gives the median ratio, average ratio, and median of the absolute deviation. These show that the mRPV model appears to be significantly better fitted for the median absolute deviation: 6.1 % for the mRPV model, as opposed to 11.9 % and 15.5 % for the VIIRS and MODIS comparisons, respectively. But the median and average ratios slightly favour the MODIS and VIIRS. We should note that the more extreme ratios are not included. If these are included, both the median and average ratios for the MODIS and VIIRS methods rise significantly. Inspection of the values does show that the mRPV model has a slight bias towards a positive ratio (i.e. overestimating the radiance derived from the ground measurements). Due to the presence of a significant number of extreme outliers and a significantly higher median of the absolute deviation seen for both MODIS and VIIRS, we conclude that the mRPV model provides a better calibration than the MODIS and VIIRS models. Similar to the results using RADCALNET measurements, the values derived with these methods are an order of magnitude larger than those found with the internal calibration units, presented in Sect. 2.
Table 4Ratio of the comparisons over the sample between TROPOMI radiances and the RRV ground campaigns. These do not include instances labelled F in Table 3.
6.1 Degradation constraints from vicarious calibration
The lack of systematics in the residuals of the mRPV model in the RADCALNET comparison (see Fig. 10) places an upper limit on the degradation of TROPOMI-SWIR of 8 %. When using a Lambertian assumption, the comparison clearly shows systematic trends, while the upper limit is 10 %. The comparison in Fig. 10 between the mRPV model and a Lambertian assumption thus reveals that correction for the non-Lambertian effects is a necessary ingredient.
All results presented above constrain the degradation of the instrument performance over the 5 years in orbit. However, the limits that were found (i.e. 8 % for RADCALNET, 6 % for mRPV, 11.9 % for VIIRS, 15.5 % for MODIS) are an order of magnitude larger or more than the constraints found using the solar irradiance measurements using both on-board diffusers (0.15 %). Even limits derived from the WLS measurements (0.5 %) cannot be observed using the vicarious calibration methods.
These results thus strongly corroborate conclusions made in earlier works on IR atmospheric spectroscopic sounders (for TROPOMI, van Kempen et al., 2021; for OCO-2, Bruegge et al., 2019b; for GOSAT, Kuze et al., 2014). Instrument monitoring and calibration are much more accurate using internal calibration sources than using vicarious calibration sources.
6.2 Limits on the vicarious calibration methodology
The important conclusions of this work are not the derived upper limits of the degradation of the instrument found in the vicarious calibration methods but rather the limits of applicability of this method to push-broom-type SWIR sounders for atmospheric composition. At first sight, it appears that vicarious calibration is a severely limiting method. Numerous corrections are required to account for the many uncertainties in this comparison, each introducing new uncertainties. The achieved accuracy can at best be considered acceptable but can be used to find severe deviations in instrument performance. However, many of these limits are strongly influenced by parameters from the available hardware of this generation of instruments. The following parameters and/or assumptions all affect accurate vicarious calibration using RRV for TROPOMI-SWIR:
-
the size of TROPOMI-SWIR pixels
-
the varying size and orientation and thus the varying coverage of TROPOMI pixels
-
the time difference between different datasets
-
the non-Lambertian nature of the RRV desert surface and its variation on long timescales (i.e. the BRDF correction and its variation on the timescale of months; see, for example, the MISR results)
-
the amount and accuracy of cloud filtering.
From this, we conclude that the assumption of homogeneity of the desert surface across RRV (i.e. the reflectance within a TROPOMI pixel) introduces significant uncertainty and thus limitations in the vicarious calibration when using RRV as a reference site. The data from RADCALNET, which represent the reflectance only at a single point, is particularly heavily affected.
Cloud filtering
One of the most uncertain aspects in the analysis is the accuracy of the cloud filter. The cloud filter in the TROPOMI methane product is too strict and/or has interpreted reflectances of desert surface as partially cloudy when no clouds are present. Two assumptions were made. First, data availability of the RADCALNET indicates relatively cloud-free soundings. Second, all data taken during dedicated campaigns are taken on completely cloud-free days. In particular the first assumption may cause additional spread in the comparison between TROPOMI-SWIR and RADCALNET. Although a measurement for RADCALNET may be cloud-free in its nadir, clouds may exist over other areas of RRV and/or its vicinity (i.e. outside of the RADCALNET field of view but inside the TROPOMI pixel.). The latter is applicable for larger TROPOMI pixels. Due to the difference in albedo between a cloud and the RRV surface, TROPOMI-SWIR radiance may be different from that estimated from the RADCALNET. The scope of influence is unknown but assumed small. If large cloud cover existed, it would also cover the RADCALNET, and no value would be available.
Something similar may affect the dedicated ground campaigns, although the impact of clouds is likely less due to human elements in the data acquisition (i.e. no data acquisition is done during cloudy days). Strict and accurate cloud filtering is of vital importance for a higher confidence in the vicarious calibration, in particular that of RADCALNET.
6.3 Implications for TROPOMI
For TROPOMI-SWIR, vicarious calibration cannot be improved upon from the RRV analysis presented in this work. The main reason for this is that the pixel size of TROPOMI-SWIR is relatively large compared to the physical size of RRV. Even at nadir, this is 7 km×5.5 km. But an equally significant influence, and one more unique to TROPOMI-SWIR as opposed to OCO-2, OCO-3, GOSAT, and GOSAT-2, is the variation in pixel size and the accompanying orientation, as seen in Fig. 2. To achieve daily near-global coverage, TROPOMI-SWIR has 227 unique and distinct pixel sizes and coverages over RRV. The assumption that the complete area within all of these TROPOMI-SWIR coverages is homogeneous and represented by ground and/or BRDF measurements near (in the case of ground measurements) or at (in the case of RADCALNET) the central location introduces large uncertainties. However, even if the BRDF could be reliably measured (i.e. instantaneous) across the full area of the RRV, the gains would likely still be marginal. Measurements at larger viewing angles, i.e. where the TROPOMI pixel size is located at the edge of the swath and has grown to 20–25 km in the across-track direction, are not a good representation of the ground measurements.
Limiting the analysis to nadir views and usage of the mRPV model (i.e. the most favourable conditions) could provide stronger constraints. Five orbits have overpasses with viewing zenith angles less than 10∘, although none share a common orientation. Two of the comparisons (for orbit 15272 and 17996) show ratios with values above 1.2. The other three have ratios close to unity. Interestingly, the two large deviations are measurements taken around the winter of 2020/2021 and show almost perfect agreement between MODIS, VIIRS, and the mRPV model, a property not shared between many of the other overpasses. As such, data on nadir views remain inconclusive.
For TROPOMI-SWIR, ground measurements with the data quality as obtained for RRV but using a significantly larger homogeneous site (e.g. the Sahara sites as used in Bacour et al., 2019, and van Kempen et al., 2021) would likely provide an improvement to the results. However, due to its capability to produce daily global coverage and thus its varying pixel size and orientation over reference sites, TROPOMI-SWIR will keep facing unique challenges that equivalent sensors such as GOSAT, GOSAT-2, OCO-2, and OCO-3 do not face. In addition, large viewing angles are poorly represented by MODIS and VIIRS BRDF products. Although the mRPV model appears to provide an improvement, this method still has limitations. Despite the limitations found in our analysis, we realize that the RRV remains one of the easiest accessible and most well-maintained sites on the planet to provide ground-based measurements from which validation of radiance can be done. Larger invariant sites face numerous geopolitical and natural challenges.
6.4 Suggestions for other sounders
Conclusions from the discussion above contain important recommendations for future missions on vicarious calibration. The most important is the size of a pixel, its orientation, and the zenith angle at which a reference site such as RRV is viewed. Multiple consistent measurements using a small (i.e. 1 km × 1 km) field of view at a small (< 10∘) zenith angle with identical orientations are expected to severely limit the uncertainties and/or variations seen in the analysis of this work. The assumption of homogeneity would be much more applicable than TROPOMI-SWIR. Such measurements would also have a small (i.e. < 3 %) BRDF correction factor. More importantly, this factor would vary less from measurement to measurement when using the correction derived using the mRPV model. Although some variations are expected, as seen from the MISR data, small variations will make stronger constraints possible. Whether or not such constraints also arise from the usage of the VIIRS BRDF cannot be derived from our data, but the expectation is that such data products are more representative of the physical location than of TROPOMI-SWIR.
The conclusions of this work can be summarized as follows.
-
The TROPOMI-SWIR module is still very stable after 5 years in orbit, as evidenced by the trend monitoring of the solar irradiance and white light source. This corroborates and extends the conclusions of van Kempen et al. (2019), Ludewig et al. (2020), and van Kempen et al. (2021). Currently, the degradation is quantified to a 0.15 % loss in transmission and a 0.3 % loss in the number of usable detector pixels.
-
The vicarious calibration methodology validates the results from the internal calibration unit. However, the calibration unit provides far superior results. Vicarious calibration limits are more than an order of magnitude larger (4 %–10 %) than the limits derived from on-board calibration sources (0.15 %, with an uncertainty smaller than 0.05 %).
-
As such, the decision to use a calibrator unit for TROPOMI-SWIR module monitoring has proven to be very prudent.
-
The comparison between the RADCALNET data provides an upper limit of ∼ 8 % to the amount of instrument degradation. The method does show that non-Lambertian corrections are necessary, as evidenced by the systematics in the residuals of the two models.
-
The RRV ground calibration campaigns provide an independent method to verify the stability of the TROPOMI-SWIR module, although the accuracy is relatively poor (∼ 6 % to 10 %) compared to the result from internal calibration sources. We explored three correction methods using (i) an mRPV model, (ii) a BRDF model using MODIS data, and (iii) a BRDF model using VIIRS data. The mRPV method produces superior results. In particular measurements at large (> 50∘) viewing angles are poorly represented by VIIRS and MODIS data.
-
Vicarious calibration of TROPOMI is severely limited by the relatively large pixel size and varying pixel orientation concerning the RRV location. However, the method is one of the few that can truly independently verify instrument stability at the radiance level. Similarly, RRV provides one of the few sites on the planet with sufficient ground measurements to perform vicarious calibration.
-
Many of the limitations found in this work for TROPOMI-SWIR are expected to be strongly reduced for instruments with smaller pixel sizes using uniform orientations with soundings close to the nadir.
The radiance of Sentinel-5p TROPOMI-SWIR is publicly available at the Pre-Operations Science Hub. RADCALNET is publicly available (log-in required) at https://www.radcalnet.org (Committee on Earth Observation Satellites, 2023); see also Bouvet et al. (2019, https://doi.org/10.3390/rs11202401).
TAvK and TJR carried out the analysis, and TAvK wrote the manuscript. RMvH is responsible for the monitoring system used for the TROPOMI monitoring. CB, RR, TJP, and DF supplied the data taken at RRV in the dedicated campaigns. RH and IA proofread the final document.
At least one of the (co-)authors is a member of the editorial board of Atmospheric Measurement Techniques. The peer-review process was guided by an independent editor, and the authors also have no other competing interests to declare.
Publisher's note: Copernicus Publications remains neutral with regard to jurisdictional claims in published maps and institutional affiliations.
This paper contains Copernicus Sentinel data. We would like to thank the hard work of the people who contributed to the data acquisition at Railroad Valley, particularly Mark Helm- linger, Linley Kroll, and Fumie Kataoka.
The research of Tim A. van Kempen is funded by the TROPOMI national programme from the Netherlands Space Office (NSO). This work was supported by the Earthnet Data Assessment Pilot (EDAP) subcontract TPZVUK/AG/19/02305.
This paper was edited by Andrew Sayer and reviewed by Athina Argyrouli and one anonymous referee.
Ångström, A.: On the Unit of Radiation Used in Meteorological Treatises on Actinometry, Mon. Weather Rev., 55, 364, https://doi.org/10.1175/1520-0493(1927)55<364a:OTUORU>2.0.CO;2, 1927. a
Bacour, C., Briottet, X., Bréon, F.-M., Viallefont-Robinet, F., and Bouvet, M.: Revisiting Pseudo Invariant Calibration Sites (PICS) Over Sand Deserts for Vicarious Calibration of Optical Imagers at 20 km and 100 km Scales, Remote Sens.-Basel, 11, 1166, https://doi.org/10.3390/rs11101166, 2019. a
Berk, A., Conforti, P., Kennett, R., Perkins, T., Hawes, F., and van den Bosch, J.: MODTRAN6: a major upgrade of the MODTRAN radiative transfer code, in: Algorithms and Technologies for Multispectral, Hyperspectral, and Ultraspectral Imagery XX, edited by: Velez-Reyes, M. and Kruse, F. A., International Society for Optics and Photonics, SPIE, 9088, 113–119, https://doi.org/10.1117/12.2050433, 2014. a
Bouvet, M., Thome, K., Berthelot, B., Bialek, A., Czapla-Myers, J., Fox, N. P., Goryl, P., Henry, P., Ma, L., Marcq, S., Meygret, A., Wenny, B. N., and Woolliams, E. R.: RadCalNet: A Radiometric Calibration Network for Earth Observing Imagers Operating in the Visible to Shortwave Infrared Spectral Range, Remote Sens.-Basel, 11, 2401, https://doi.org/10.3390/rs11202401, 2019. a, b, c, d, e
Bruegge, C. J., Chrien, N. L., Ando, R. R., Diner, D. J., Abdou, W. A., Helmlinger, M. C., Pilorz, S. H., and Thome, K. J.: Early validation of the Multi-angle Imaging SpectroRadiometer (MISR) radiometric scale, IEEE T. Geosci. Remote, 40, 1477–1492, https://doi.org/10.1109/TGRS.2002.801583, 2002. a, b
Bruegge, C. J., Coburn, C., Elmes, A., Helmlinger, M. C., Kataoka, F., Kuester, M. , Kuze, A., Ochoa, T., Schaaf, C., Shiomi, K., and Schwandner, F. M.: Bi-Directional Reflectance Factor Determination of the Railroad Valley Playa, Remote Sens.-Basel, 11, 2601, https://doi.org/10.3390/rs11222601, 2019a. a, b, c, d, e, f, g, h, i, j, k, l, m, n
Bruegge, C. J., Crisp, D., Helmlinger, M. C., Kataoka, F., Kuze, A., Lee, R. A., McDuffie, J. L., Rosenberg, R. A., Schwand ner, F. M., Shiomi, K., and Yu, S.: Vicarious Calibration of Orbiting Carbon Observatory-2, IEEE T. Geosci. Remote, 57, 5135–5145, https://doi.org/10.1109/TGRS.2019.2897068, 2019b. a, b, c, d, e
Bruegge, C. J., Arnold, G. T., Czapla-Myers, J., Dominguez, R., Helmlinger, M. C., Thompson, D. R., Van den Bosch, J., and Wenny, B. N.: Vicarious Calibration of eMAS, AirMSPI, and AVIRIS Sensors During FIREX-AQ, IEEE T. Geosci. Remote, 59, 10286–10297, https://doi.org/10.1109/TGRS.2021.3066997, 2021. a, b, c, d
Butz, A., Hasekamp, O. P., Frankenberg, C., and Aben, I.: Retrievals of atmospheric CO2 from simulated space-borne measurements of backscattered near-infrared sunlight: accounting for aerosol effects, Adaptive Optics, 48, 3322, https://doi.org/10.1364/AO.48.003322, 2009. a
Butz, A., Guerlet, S., Hasekamp, O., Schepers, D., Galli, A., Aben, I., Frankenberg, C., Hartmann, J. M., Tran, H., Kuze, A., Keppel-Aleks, G., Toon, G., Wunch, D., Wennberg, P., Deutscher, N., Griffith, D., Macatangay, R., Messerschmidt, J., Notholt, J., and Warneke, T.: Toward accurate CO2 and CH4 observations from GOSAT, Geophys. Res. Lett., 38, L14812, https://doi.org/10.1029/2011GL047888, 2011. a
Committee on Earth Observation Satellites: Radiometric Calibration Network (RadCalNet) portal, https://www.radcalnet.org, last access: 21 September 2023. a
Diner, D. J., Beckert, J. C., Bothwell, G. W., and Rodriguez, J. I.: Performance of the MISR instrument during its first 20 months in Earth orbit, IEEE T. Geosci. Remote, 40, 1449–1466, https://doi.org/10.1109/TGRS.2002.801584, 2002. a
Hasekamp, O. P. and Butz, A.: Efficient calculation of intensity and polarization spectra in vertically inhomogeneous scattering and absorbing atmospheres, J. Geophys. Res.-Atmos., 113, D20309, https://doi.org/10.1029/2008JD010379, 2008. a
Hoogeveen, R. W. M., Voors, R., Robbins, M. S., Tol, P. J. J., and Ivanov, T. I.: Characterization results of the TROPOMI Short Wave InfraRed detector, in: Sensors, Systems, and Next-Generation Satellites XVII, edited by: Meynart, R., Neeck, S. P., and Shimoda, H., International Society for Optics and Photonics, SPIE, 8889, 247–255, https://doi.org/10.1117/12.2028759, 2013. a
Hu, H., Hasekamp, O., Butz, A., Galli, A., Landgraf, J., Aan de Brugh, J., Borsdorff, T., Scheepmaker, R., and Aben, I.: The operational methane retrieval algorithm for TROPOMI, Atmos. Meas. Tech., 9, 5423–5440, https://doi.org/10.5194/amt-9-5423-2016, 2016. a, b
Hu, H., Landgraf, J., Detmers, R., Borsdorff, T., Aan de Brugh, J., Aben, I., Butz, A., and Hasekamp, O.: Toward Global Mapping of Methane With TROPOMI: First Results and Intersatellite Comparison to GOSAT, Geophys. Res. Lett., 45, 3682–3689, https://doi.org/10.1002/2018GL077259, 2018. a
Justice, C., Vermote, E., Townshend, J., Defries, R., Roy, D., Hall, D., Salomonson, V., Privette, J., Riggs, G., Strahler, A., Lucht, W., Myneni, R., Knyazikhin, Y., Running, S., Nemani, R., Wan, Z., Huete, A., van Leeuwen, W., Wolfe, R., Giglio, L., Muller, J., Lewis, P., and Barnsley, M.: The Moderate Resolution Imaging Spectroradiometer (MODIS): land remote sensing for global change research, IEEE T. Geosci. Remote, 36, 1228–1249, https://doi.org/10.1109/36.701075, 1998. a
Justice, C. O., Román, M. O., Csiszar, I., Vermote, E. F., Wolfe, R. E., Hook, S. J., Friedl, M., Wang, Z., Schaaf, C. B., Miura, T., Tschudi, M., Riggs, G., Hall, D. K., Lyapustin, A. I., Devadiga, S., Davidson, C., and Masuoka, E. J.: Land and cryosphere products from Suomi NPP VIIRS: Overview and status, J. Geophys. Res.-Atmos., 118, 9753–9765, https://doi.org/10.1002/jgrd.50771, 2013. a
Kaskaoutis, D. G., Kambezidis, H. D., Hatzianastassiou, N., Kosmopoulos, P. G., and Badarinath, K. V. S.: Aerosol climatology: dependence of the Angstrom exponent on wavelength over four AERONET sites, Atmos. Chem. Phys. Discuss., 7, 7347–7397, https://doi.org/10.5194/acpd-7-7347-2007, 2007. a
Kleipool, Q., Ludewig, A., Babić, L., Bartstra, R., Braak, R., Dierssen, W., Dewitte, P.-J., Kenter, P., Landzaat, R., Leloux, J., Loots, E., Meijering, P., van der Plas, E., Rozemeijer, N., Schepers, D., Schiavini, D., Smeets, J., Vacanti, G., Vonk, F., and Veefkind, P.: Pre-launch calibration results of the TROPOMI payload on-board the Sentinel-5 Precursor satellite, Atmos. Meas. Tech., 11, 6439–6479, https://doi.org/10.5194/amt-11-6439-2018, 2018. a, b, c
Kuze, A., Taylor, T. E., Kataoka, F., Bruegge, C. J., Crisp, D., Harada, M., Helmlinger, M., Inoue, M., Kawakami, S., Kikuchi, N., Mitomi, Y., Murooka, J., Naitoh, M., O'Brien, D. M., O'Dell, C. W., Ohyama, H., Pollock, H., Schwandner, F. M., Shiomi, K., Suto, H., Takeda, T., Tanaka, T., Urabe, T., Yokota, T., and Yoshida, Y.: Long-Term Vicarious Calibration of GOSAT Short-Wave Sensors: Techniques for Error Reduction and New Estimates of Radiometric Degradation Factors, IEEE T. Geosci. Remote, 52, 3991–4004, https://doi.org/10.1109/TGRS.2013.2278696, 2014. a, b, c, d, e, f
Li, X. and Strahler, A. H.: Geometric-optical bidirectional reflectance modeling of the discrete crown vegetation canopy: effect of crown shape and mutual shadowing, IEEE T. Geosci. Remote, 30, 276–292, https://doi.org/10.1109/36.134078, 1992. a
Liu, Y., Wang, Z., Sun, Q., Erb, A. M., Li, Z., Schaaf, C. B., Zhang, X., Román, M. O., Scott, R. L., Zhang, Q., Novick, K. A., Syndonia Bret-Harte, M., Petroy, S., and SanClements, M.: Evaluation of the VIIRS BRDF, Albedo and NBAR products suite and an assessment of continuity with the long term MODIS record, Remote Sens. Environ., 201, 256–274, https://doi.org/10.1016/j.rse.2017.09.020, 2017. a
Lucht, W., Schaaf, C. B., and Strahler, A. H.: An algorithm for the retrieval of albedo from space using semiempirical BRDF models, IEEE T. Geosci. Remote, 38, 977–998, https://doi.org/10.1109/36.841980, 2000. a
Ludewig, A., Kleipool, Q., Bartstra, R., Landzaat, R., Leloux, J., Loots, E., Meijering, P., van der Plas, E., Rozemeijer, N., Vonk, F., and Veefkind, P.: In-flight calibration results of the TROPOMI payload on board the Sentinel-5 Precursor satellite, Atmos. Meas. Tech., 13, 3561–3580, https://doi.org/10.5194/amt-13-3561-2020, 2020. a, b, c, d, e
Rahman, H., Pinty, B., and Verstraete, M. M.: Coupled surface atmosphere reflectance (CSAR) model: 2. Semiempirical surface model usable with NOAA advanced very high resolution radiometer data, J. Geophys. Res., 98, 20,791–20,801, https://doi.org/10.1029/93JD02072, 1993a. a, b, c
Rahman, H., Verstraete, M. M., and Pinty, B.: Coupled surface-atmosphere reflectance (CSAR) model: 1. Model description and inversion on synthetic data, J. Geophys. Res., 98, 20,779–20,789, https://doi.org/10.1029/93JD02071, 1993b. a, b, c
Ross, J.: The radiation regime and architecture of plant stands, in: Tasks for vegetation sciences 3, Spinger Dordrecht, Dordrecht the Netherlands, https://doi.org/10.1007/978-94-009-8647-3, 1981. a
Schaaf, C., Wang, Z., Zhang, X., and Strahler, A.: VIIRS/NPP DNB BRDF/Albedo Model Parameters Daily L3 Global 1km SIN Grid V001, NASA EOSDIS Land Processes Distributed Active Archive Center [data set], https://doi.org/10.5067/VIIRS/VNP43DNBA1.001, 2019. a
Schaaf, C. B., Gao, F., Strahler, A. H., Lucht, W., Li, X., Tsang, T., Strugnell, N. C., Zhang, X., Jin, Y., Muller, J.-P., Lewis, P., Barnsley, M., Hobson, P., Disney, M., Roberts, G., Dunderdale, M., Doll, C., d'Entremont, R. P., Hu, B., Liang, S., Privette, J. L., and Roy, D.: First operational BRDF, albedo nadir reflectance products from MODIS, Remote Sens. Environ., 83, 135–148, https://doi.org/10.1016/S0034-4257(02)00091-3, 2002. a
Schaaf, C. B., Liu, J., Gao, F., and Strahler, A. H.: Aqua and Terra MODIS Albedo and Reflectance Anisotropy Products, in: Land Remote Sensing and Global Environmental Change: NASA's Earth Observing System and the Science of ASTER and MODIS, Remote Sensing and Digital Image Processing, edited by: Ramachandran, B., Justice, C. O., and Abrams, M. J., Springer, New York, NY, 11, p. 549, https://doi.org/10.1007/978-1-4419-6749-7_24, 2011. a, b
Tol, P. J. J., van Kempen, T. A., van Hees, R. M., Krijger, M., Cadot, S., Snel, R., Persijn, S. T., Aben, I., and Hoogeveen, R. W. M.: Characterization and correction of stray light in TROPOMI-SWIR, Atmos. Meas. Tech., 11, 4493–4507, https://doi.org/10.5194/amt-11-4493-2018, 2018. a
van Amerongen, A., Krol, H., Grèzes-Besset, C., Coppens, T., Bhatti, I., Lobb, D., Hardenbol, B., and Hoogeveen, R.: State of the art in silicon immersed gratings for space, in: International Conference on Space Optics – ICSO 2012, edited by: Cugny, B., Armandillo, E., and Karafolas, N., International Society for Optics and Photonics, SPIE, 10564, 713–719, https://doi.org/10.1117/12.2309092, 2017. a, b
van Hees, R. M., Tol, P. J. J., Cadot, S., Krijger, M., Persijn, S. T., van Kempen, T. A., Snel, R., Aben, I., and Hoogeveen, Ruud W. M.: Determination of the TROPOMI-SWIR instrument spectral response function, Atmos. Meas. Tech., 11, 3917–3933, https://doi.org/10.5194/amt-11-3917-2018, 2018. a
van Kempen, T. A., van Hees, R. M., Tol, P. J. J., Aben, I., and Hoogeveen, R. W. M.: In-flight calibration and monitoring of the Tropospheric Monitoring Instrument (TROPOMI) short-wave infrared (SWIR) module, Atmos. Meas. Tech., 12, 6827–6844, https://doi.org/10.5194/amt-12-6827-2019, 2019. a, b, c, d, e, f, g
van Kempen, T. A., Oggionni, F., and van Hees, R. M.: Monitoring the Tropospheric Monitoring Instrument (TROPOMI) short-wave infrared (SWIR) module instrument stability using desert sites, Atmos. Meas. Tech., 14, 6711–6722, https://doi.org/10.5194/amt-14-6711-2021, 2021. a, b, c, d, e, f
Veefkind, J. P., Aben, I., McMullan, K., Förster, H., de Vries, J., Otter, G., Claas, J., Eskes, H. J., de Haan, J. F., Kleipool, Q., van Weele, M., Hasekamp, O., Hoogeveen, R., Landgraf, J., Snel, R., Tol, P., Ingmann, P., Voors, R., Kruizinga, B., Vink, R., Visser, H., and Levelt, P. F.: TROPOMI on the ESA Sentinel-5 Precursor: A GMES mission for global observations of the atmospheric composition for climate, air quality and ozone layer applications, Remote Sens. Environ., 120, 70–83, https://doi.org/10.1016/j.rse.2011.09.027, 2012. a
Wanner, W., Li, X., and Strahler, A. H.: On the derivation of kernels for kernel-driven models of bidirectional reflectance, J. Geophys. Res.-Atmos., 100, 21077–21089, https://doi.org/10.1029/95JD02371, 1995. a
TROPOMI is a collaboration between Airbus Defence and Space Netherlands, KNMI (Koninklijke Nederlands Meteorologisch Instituut), SRON Netherlands Institute for Space Research, and TNO (Toegepast Natuurwetenschappelijk Onderzoek), on behalf of the NSO (Netherlands Space Office) and ESA (European Space Agency). Airbus Defence and Space Netherlands is the main contractor for the design, building, and testing of the instrument. KNMI and SRON are the principal investigator institutes for the instrument. TROPOMI is funded by the following ministries of the Dutch government: the Ministry of Economic Affairs; the Ministry of Education, Culture and Science; and the Ministry of Infrastructure and the Environment.
Developed by Surry Satellite Technology Ltd, United Kingdom.
Developed by SRON.
Developed by Sofradir, France.
http://mps.tropomi.eu (last access: 21 September 2023) and http://www.sron.nl/tropomi-swir-monitoring (last access: 21 September 2023).
Even though the method as used in this work would be better described as a verification, the term vicarious calibration is used throughout this work to remain consistent with the existing literature on this topic.
See https://www.radcalnet.org/ (last access: 21 April 2023).
The abbreviation mRPV refers to the modified Rahman–Pinte–Verstraete model; see Rahman et al. (1993b, a).
https://asdc.larc.nasa.gov (last access: 21 September 2023).
https://www.umb.edu/spectralmass/ (last access: 21 September 2023).