the Creative Commons Attribution 4.0 License.
the Creative Commons Attribution 4.0 License.
 | 12 Oct 2023
Linear polarization signatures of atmospheric dust with the SolPol direct-sun polarimeter
Panagiotis I. Raptis
Alexandra Tsekeri
Vassilis Amiridis
Stelios Kazadzis
Zbigniew Ulanowski
Vassilis Charmandaris
Konstantinos Tassis
William Martin
Dust particles in lofted atmospheric layers may present a preferential orientation, which could be detected from the resulting dichroic extinction of the transmitted sunlight. The first indications were provided relatively recently on atmospheric dust layers using passive polarimetry, when astronomical starlight observations of known polarization were found to exhibit an excess in linear polarization, during desert dust events that reached the observational site. We revisit the previous observational methodology by targeting dichroic extinction of transmitted sunlight through extensive atmospheric dust layers utilizing a direct-sun polarimeter, which is capable to continuously monitor the polarization of elevated aerosol layers. In this study, we present the unique observations from the Solar Polarimeter (SolPol) for different periods within 2 years, when the instrument was installed in the remote monitoring station of PANGEA – the PANhellenic GEophysical observatory of Antikythera – in Greece. SolPol records polarization, providing all four Stokes parameters, at a default wavelength band centred at 550 nm with a detection limit of 10−7.
We, overall, report on detected increasing trends of linear polarization, reaching up to 700 parts per million, when the instrument is targeting away from its zenith and direct sunlight propagates through dust concentrations over the observatory. This distinct behaviour is absent on measurements we acquire on days with lack of dust particle concentrations and in general of low aerosol content. Moreover, we investigate the dependence of the degree of linear polarization on the layers' optical depth under various dust loads and solar zenith angles and attempt to interpret these observations as an indication of dust particles being preferentially aligned in the Earth's atmosphere.
- Article
(12276 KB) - Full-text XML
-
Supplement
(3387 KB) - BibTeX
- EndNote


Mineral dust constitutes one of the most abundant atmospheric aerosols in terms of dry mass (Tegen et al., 1997) and, thus, plays a significant role to the radiative forcing of the global climate (Miller and Tegen, 1998; Miller et al., 2014) being the dominant source of aerosol forcing downwind of major dust sources, such as the Sahara (Li et al., 1996; Saidou Chaibou et al., 2020). In atmospheric transport models, dust particles are mainly assumed to be spherical, which causes an overestimation of their gravitational settling speed leading, though, to a substantial underestimation of the coarse-mode size distribution in the Earth's atmosphere (Adebiyi et al., 2023; Adebiyi and Kok, 2020). Furthermore, limitations using realistic irregular shapes for dust particles or their possible orientation to the analytical computation of the aerodynamic drag force in the gravitational settling schemes, usually leads to the assumption of randomly oriented particles or their volume equivalent spherical counterparts (Mallios et al., 2020). Although non-sphericity has been addressed previously (e.g. Ginoux, 2003), only recent studies attempt to quantify its effect over larger particle sizes and take into account either particle orientation or asphericity to dust gravitational settling (Drakaki et al., 2022; Huang et al., 2021; Mallios et al., 2021). Similarly, in both active and passive remote sensing aerosol retrievals, particle shape is an important factor for modelling the scattering properties of dust particles (e.g. Dubovik et al., 2006; Gasteiger et al., 2011; Saito and Yang, 2021, and references therein).
Incoming solar radiation is considered unpolarized before it enters the Earth's atmosphere. Throughout its propagation in the atmosphere its polarization changes, through the absorption and scattering interactions with various atmospheric components including aerosol particles, water droplets, ice crystals and molecules. The transmitted (direct) sunlight is always unpolarized, except when it propagates through oriented particles in the atmosphere. Since dust grains are asymmetric and tend to be elongated, they preferentially scatter light polarized along their long axis. In this case, the extinction of the light polarization components is different (i.e. dichroic extinction) and the transmitted sunlight becomes polarized. Interpreting linear polarization measurements in the direct direction (i.e. measurements taken when the observer looks directly towards the sun) can be challenging due to the overwhelming intensity of sunlight and secondary sources of linear polarization in the observational line of sight. All-sky polarization patterns can serve as a background reference tool to aid in the interpretation of direct polarization measurements, as the direct direction is a subset of the former (Guan et al., 2018; Pan et al., 2023). Recent studies that compare radiative transfer simulations for aerosol media of well-defined optical properties with all-sky observations, show that the degree of linear polarization (DOLP) is impacted, and in fact decreases, by the increasing optical depth of desert dust particles (assumed spherical) even in the forward scattered direction (Li et al., 2023). However, the interpretation of diffuse polarization measurements in terms of particle alignment is highly ambiguous, because multiple causes contribute to sky polarization. Hence it is much harder to derive information on particle alignment from sky, as opposed to direct-sun polarization measurements.
The dichroic extinction of transmitted starlight through oriented dust particles is a well-documented phenomenon in the case of the interstellar medium, where dust particles are preferentially aligned along the galactic magnetic field lines. Dichroism measurements provide information on the magnetic field orientation, which is the dominant alignment mechanism for these sub-micrometre particles (Andersson et al., 2015; Dasgupta Ajou, 1983; Kolokolova and Nagdimunov, 2014; Lazarian, 2007; Siebenmorgen et al., 2014; Skalidis and Tassis, 2020). Concerning the much larger atmospheric dust particles, the geomagnetic field is considered a weak alignment mechanism for particles moving in the Earth's atmosphere, since multiple processes such as the bombardment of gas particles, the imposed aerodynamic and electrical torques (Mallios et al., 2021; Ulanowski et al., 2007, and references therein), and turbulence (e.g. Klett, 1995) compete (or counter-balance) for the most dominant atmospheric particle alignment mechanism. Based on a similar optical approach, though, atmospheric dust may provide distinct linear polarization (LP) signatures, as vertically oriented particles can lead to dichroic extinction of the transmitted sunlight. This was indicated for starlight observations during nighttime, which included predominantly horizontally polarized light during a Saharan dust episode in La Palma (Bailey et al., 2008; Ulanowski et al., 2007). Also in the same study, modelling of the forward scattering matrix through T-matrix calculations was employed and showed that excess polarization for spheroidal particles of a specific composition and orientation is to be expected for particle sizes larger than 3 µm. However, the discussed measurements refer to column-integrated values that are not capable of determining the vertical distribution of the phenomenon throughout the dust layer. The latter was addressed by a novel polarization lidar for detecting dust orientation, nicknamed WALL-E, which is expected to provide valuable information for monitoring the phenomenon of dust polarization in the Earth's atmosphere (Tsekeri et al., 2021).
In order to provide the theoretical feasibility of orientation, a potential mechanism that is capable of aligning the lofted dust particles, is the large scale atmospheric electric field that acts on charged dust particles through coupled electrical and aerodynamic torque interactions (Mallios et al., 2021; Ulanowski et al., 2007). For charged dust particles, the polarity of particle charge and the direction of the electric field influence particle motion and, therefore, the aerodynamic torque. Depending on its strength, the total electric field within the dust layer can (a) counteract the gravitational settling of large particles and (b) cause a preferential orientation of the non-spherical particles along the vertical direction. Mallios et al. (2021) stipulated that aerodynamic torque, caused by the misalignment between the centre of pressure and centre of gravity on a spheroid dust particle, tends to rotate it horizontally, while the electrical torque, caused by the misalignment of the electrical dipole moment and the electric field direction due to the asymmetry between the spheroid axes, tends to rotate the particle vertically. Particles of sizes less than 1 µm are always randomly oriented due to the Brownian motion being dominant, while particles in the range of 1–100 µm can become vertically oriented for sufficiently large electric field strengths (Mallios et al., 2021). Although, enhanced electric field strengths attributed to charge separation within the elevated dust layers have been observed by both ground-based methods (Daskalopoulou et al., 2021a) and vertical profiling of the layer electrical properties (Daskalopoulou et al., 2021b; Nicoll et al., 2011), up till now, these studies display that the measured electric field strength may not be sufficient to overcome the threshold value that would orient particles vertically. This hints that other factors, such as strong updraughts, can highly contribute to the phenomenon leaving the exact mechanisms of dust orientation a matter of intense discussion.
In the present work, we consider the recent gap in literature concerning the effect of oriented dust on direct-sun polarimetric measurements and are motivated by previous observations of starlight dichroic extinction due to oriented dust (Bailey et al., 2008; Ulanowski et al., 2007), in order to provide consistent monitoring of dust orientation in the Earth's atmosphere. The capabilities of direct-sun polarimetric measurements are discussed in Kemp et al. (1987) and Kemp and Barbour (1981), setting the detection threshold as low as sensitivities of the order of 10−7, for perturbations to the polarization of forward scattered light. In order to investigate the above, we employ the direct-sun solar polarimeter (SolPol) and report on signatures of dust particle orientation within the atmospheric column for two consecutive years of operation. SolPol is a passive ground-based polarimeter that has been developed at the University of Hertfordshire. It was initially implemented as a laboratory experimental configuration in order to acquire both linear and circular polarization signatures of scattered light from biological materials and cyanobacteria, to demonstrate the detection capabilities of potential life presence on exoplanetary atmospheres (Martin et al., 2010, 2016). It was, after that, kindly conferred to the Remote sensing of Aerosols, Clouds and Trace gases (ReACT) team of the National Observatory of Athens for operation purposes that exceeded its indoor capabilities, as it was installed in the remote PANhellenic GEophysical observatory of Antikythera (PANGEA), under the framework of the D-TECT European Research Council project. As we aimed at monitoring potential orientation signatures on-demand in elevated dust layers, the instrument was housed in an astronomical dome for protection and was operational during seasonal periods of intense dust circulation over the station area. During the overall period of operation in PANGEA, we conducted multiple test measurements with the new instrument setup to configure the best possible sequence and achieve accurate polarization measurements. We, also, determined the atmospheric conditions under which SolPol's detection limits were strained and characterized the individual steps for the instrument's basic principle of operation. Detailed information concerning the technical characteristics of the instrument are beyond the scope of this study and are subsequently provided in the form of an instrument manual and test measurements documentation in the Supplement.
In Sect. 2 of the paper, we present a comprehensive description of the instrument design, the side components that comprise the configuration and delineate the basic principles of operation focusing on measuring the Stokes parameters of the transmitted light. In Sect. 3, we describe the process of acquiring quality-assured data with SolPol and the followed methodology for each measurement sequence regardless of the ambient conditions. Section 4 comprises the core observations section where we present the total acquired dataset for the selected 2-year operation and compare between days affected by elevated dust layers and days without. Then, in Sect. 5 we discuss the dependence of the derived orientation trends on crucial parameters such as the sun's position and the aerosol optical depth (AOD) so as to verify that the excess in LP is attributed to preferentially oriented dust particles within the examined layers. Detailed calculations for the methodologies and technical descriptions presented in the paper are provided in the Supplement, as well as, in Appendix A.
2.1 Design
The design of the SolPol instrument is quite robust and follows that of its astronomical counterpart and predecessor, PlanetPol (Bailey et al., 2008; Hough et al., 2006). Figure 1 illustrates the polarimeter individual parts, spanning from the head to the instrument support and data acquisition peripherals. A more detailed representation can be found in the SolPol manual/document under the Supplement of this paper. The instrument's principal operation is heavily based on a Hinds Instruments photoelastic modulator (PEM) head (Fig. 1), as most astronomical spectropolarimeters, due to the PEM high sensitivity to polarization fraction of the order of 10−6 (Hough et al., 2006; Kemp and Barbour, 1981; Povel, 1995). The PEM is comprised of a birefringent crystal that is mechanically strained at a principal resonant frequency (ω) of 47 kHz and induces a sinusoidal phase (modulation) retardation of 0.382×λ to the input signal, where λ is the incoming light wavelength. By exploiting the fundamental vibration along the PEM crystal optical axis different polarization states are refracted in different directions, enabling the full Stokes parameters quantification with a single rotation of the PEM by 45∘ (Kemp and Barbour, 1981, and references therein).
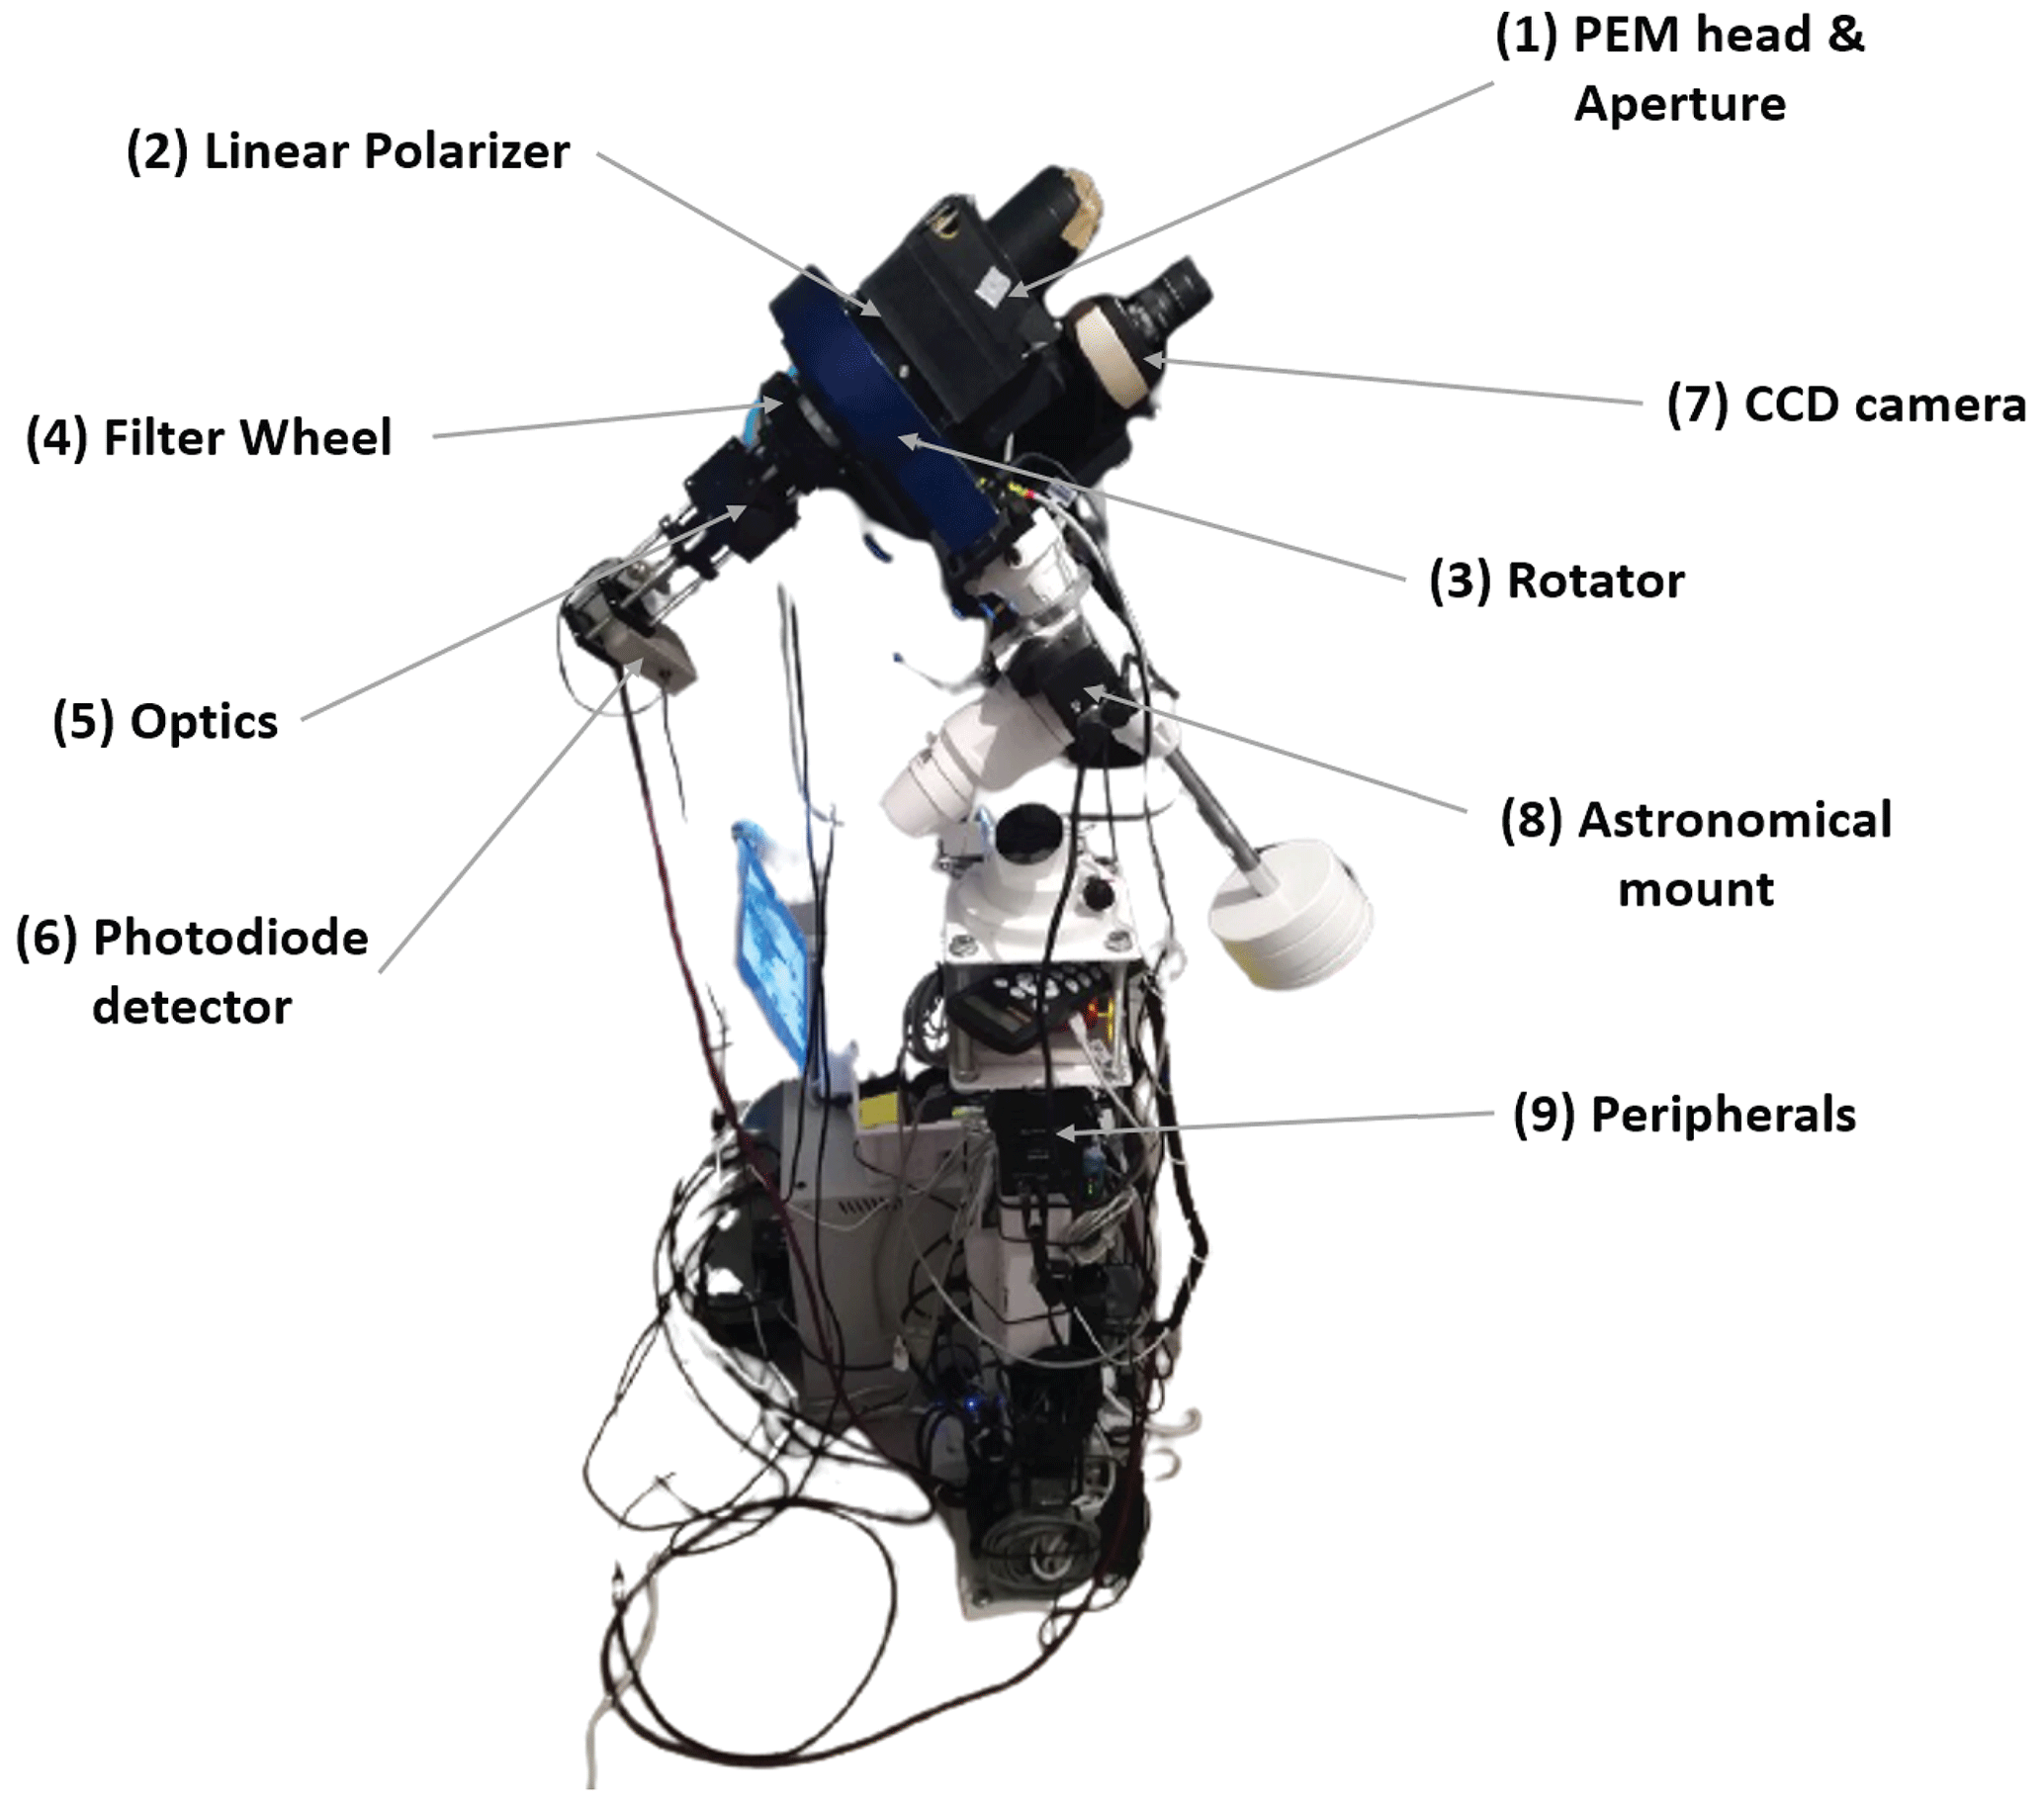
Figure 1The SolPol direct-sun solar polarimeter comprising of (1) the photoelastic modulator head (PEM) with the appropriate aperture, (2) the linear polarizer, (3) the assembly Pyxis Rotator, (4) the rotating filter wheel with the 550 nm centred narrowband filter, (5) the system optics consisting of a Galilean telescope, (6) the 1 cm silicon photodiode detector. The instrument is mounted on (8), which is an EQ3 SynScan astronomical mount and completed by (9) the essential peripherals for the assembly operation, rotation and signal modulation. SolPol is operated in a 3 m astronomical dome installed at the PANGEA observatory in Antikythera, Greece.
The polarimeter has a default limiting field-of-view (FOV) aperture of 5.5 mm diameter with a possibility of employing different iris sizes. The default aperture exactly encompasses the solar disc with an apparent angular diameter of 0.5∘, provided that sun-tracking is stable throughout the measurement. This is ensured in our case before every observational sequence. As seen in the electronics schematic (Appendix A, Fig. A1), there are no optical elements before the PEM, which is directly followed by a rotatable linear polarizer with its passing axis aligned to the PEM long axis per manufacturing. Both the polarizer and PEM head can be rotated as a whole, through a Pyxis commercial rotator, and their position is controlled from a LabVIEW virtual instrument program, which also controls the recording of data from the detector.
Neutral density (ND) filters are employed next, on the filter wheel (Fig. 1), containing six RGB broad band ND filters with measured transmission curves and three 40 nm narrow band interference filters at 400, 550, and 700 nm centre wavelengths. The polarimeter capabilities are tuned at 550 nm monochromatic operation for the present study. The ND filter wheel is followed by a simple Galilean telescope configuration, labelled as “Optics” in Fig. 1, which collects and focuses the signal levels at the 1 cm silicon photodiode detector. The detector uses a transimpedance amplifier to generate the signal voltage. A 12-bit analogue-to-digital converter (ADC) records the diode output signal and an SR830 Lock-in amplifier (labelled as “Peripherals”) records the first (1ω) and second harmonic (2ω) AC de-modulation signals that are the outcome of the operation of the PEM. Lastly, SolPol continuously tracks the sun through a lightweight EQ3 SynScan astronomical mount. An external CCD camera, also on the mount, assists with the visual alignment of the instrument. By way of clarification, we will refer to components (1)–(7) as the “assembly” for the remainder of this paper in order to better describe the required SolPol movement for the acquisition of the complete Stokes vector [IQUV]T (e.g. Hansen and Travis, 1974).
SolPol is a non-imaging polarimeter, hence its calibration technique varies from most known imaging polarimeters (Povel, 1995). In principle, the linear polarizer and the PEM are carefully mechanically aligned by careful nulling of the signal, with respect to the polarizer rotation positions, from an arbitrarily polarized source. This sets the signal-to-noise ratio for the minimum detectable polarization. Current instrument configuration has the capabilities of detecting a minimum of the order of 10−7. If the field of view with respect to the solar disc was asymmetrical, offset, (i.e. the alignment is not optimum) then the measured polarizations are expected to increase since the measurements will also include polarized diffuse sunlight. This makes stable closed loop sun tracking a pre-requite for the minimization of measurement errors.
2.2 Principles of operation
SolPol measures the polarization fractions of linear polarization (expressed by the Q and U Stokes parameters) and circular polarization (V Stokes parameter) from the whole solar disc and the entirety of the atmospheric column, depending on its limiting field-of-view aperture and the choice of mounting telescope. The measurements of the degree of linear and circular polarization (i.e. and , respectively, e.g. general expression from Hansen and Travis, 1974) have an absolute accuracy of 1 % and precision of 1 part per million (ppm, 10−6) in polarization terms. The first observing sequence is performed with the assembly at the rest position (0∘) and the rotating of the linear polarizer in steps of 90∘. The corresponding relative positions of the PEM and linear polarizer for the assembly rotation is shown in Fig. 2. For a complete polarizer rotation (360∘) we acquire measurements for 4 min. The specific sequence provides measurements of three of the four Stokes parameters. This is followed by the second observing sequence, performed after the rotation of the entire assembly, about the PEM crystal optical axis, over 45∘. This observing sequence provides measurements of the fourth Stokes parameter (V), and measurements for the removal of the biases and residual polarizations due to high frequency strain of the PEM for another 4 min.
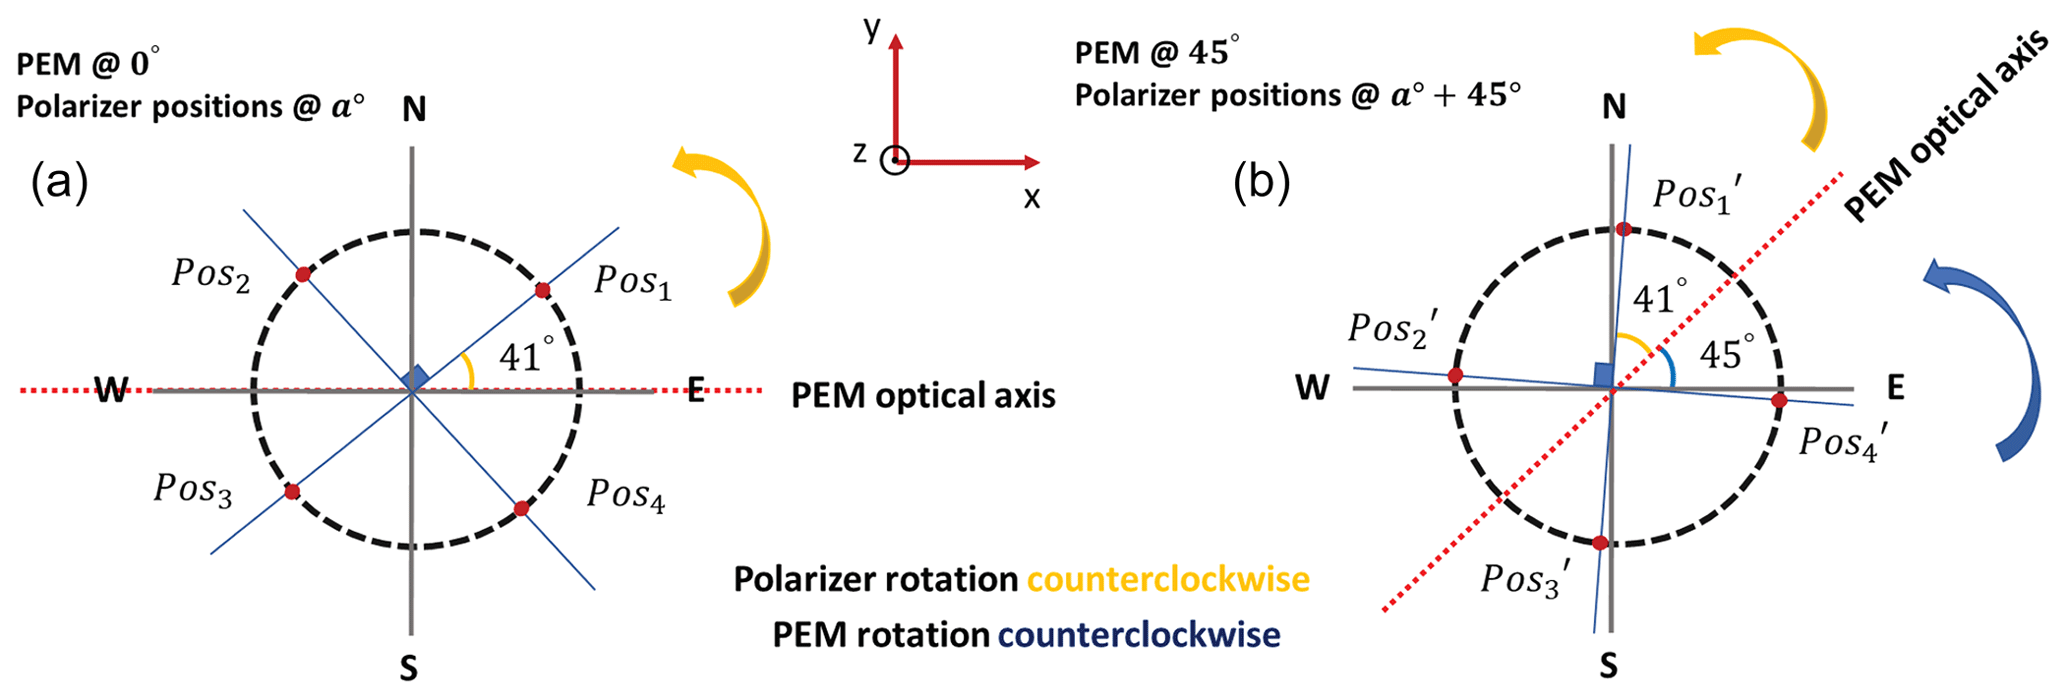
Figure 2SolPol assembly positioning as seen from the incoming sunlight reference frame. (a) The initial sequence begins with the PEM and linear polarizer at the rest position of 0∘, then the polarizer rotates by 90∘ starting from 41∘ (Pos1), to 131∘ (Pos2), 221∘ (Pos3) and 311∘ (Pos4) counter-clockwise. A complete polarizer rotation with the PEM at 0∘ provides measurements of the U Stokes parameter. (b) Assembly rotation by 45∘ and subsequent similar rotation of the polarizer by 90∘ intervals from Pos to Pos. This configuration provides measurements of the Q Stokes parameter.
Therefore, each full measurement cycle has a duration of 8 min in total and is comprised of two distinct sets: (i) solar irradiance measurements on four positions of the linear polarizer at 41, 131, 221 and 311∘ with the assembly being at 0∘, this configuration provides measurements of the I, U and V Stokes parameters and (ii) measurements for the same relative positions of the linear polarizer, but the whole assembly is being rotated by 45∘ which provides measurements of the I, Q and V Stokes parameters (Fig. 2). Measuring I and V twice provides information for the removal of biases and residual polarization in the measurements.
The Stokes vector of light that reaches the PM can be expressed using the Mueller formulation (e.g. Van de Hulst, 1957), considering as reference coordinate system the one of the incoming sunlight, as in Eq. (1):
where I=[IQUV]T is the Stokes vector of the input light polarization state, is the output polarization state with the assembly at 0∘,
is the Mueller matrix of the linear polarizer at each position angle and
is the Mueller matrix of the PEM that induces an input sinusoidal retardation of δ(t)=Asin ωt, for A: the peak modulation amplitude and ω: the modulation frequency.
When the whole assembly is rotated by 45∘, the reference coordinate system is rotated by the same angle, hence is the Stokes vector of the output light for this rotational scheme. The incoming sunlight at each position, appears to be rotated by an angle of −45∘ and is calculated through the rotation matrix as (as in Freudenthaler, 2016, Sect. 5.1.7; Martin et al., 2010; Supplement/SolPol manual, Eq. 8).
Table 1Measurements of the Stokes parameters, from DC and AC measurements as a function of the modulation frequency, linear polarizer position angle and assembly rotation.
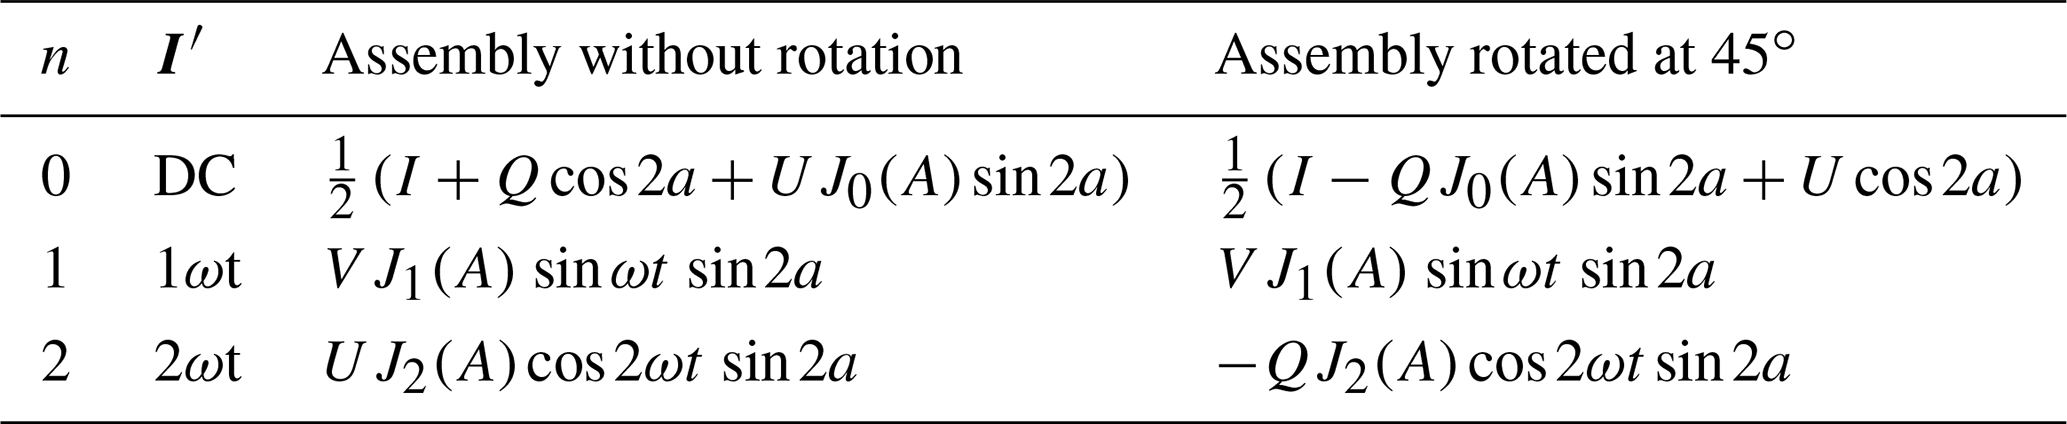
We utilize a Bessel function expansion of the retardation δ and derive the measurements of the Stokes parameters of the incoming sunlight, at detector level, as a function of the linear polarizer angles and the assembly rotation (Table 1). The Jn(A) are the n-order Bessel functions, and, for the specific PEM, the modulation amplitude is fixed at A = 2.4048 so that J0(A)=0, which makes the Q- and U-dependent DC terms equal to zero. Third-order and above harmonic frequency terms are considered negligible, O (n > 2) → 0. We, then, sum over the four linear polarizer orientations per each assembly position, in order to eliminate the cos 2a-dependent terms on the I derivation shown in Table 1, while the marginal sin 2a residuals on the other Stokes parameters are also accounted for in the data processing chain.
As discussed in Bailey et al. (2008) and Ulanowski et al. (2007), in the case of aligned particles in the atmosphere, DOLP is expected to increase over larger solar zenith angles (SZAs) since the direct sunlight travels through a larger air mass, and the effect of the dichroic extinction increases. With the increase of the SZA, the particle alignment angle changes with respect to the direction of observation, which is expected to influence the dichroic extinction and the measured linear polarization.
3.1 Data acquisition
SolPol has been primarily installed at the PANhellenic GEophysical observatory of Antikythera (PANGEA) on the remote island of Antikythera (35.861∘ N, 23.310∘ E; 193 m a.s.l. – above sea level) since September 2018. The island covers an area of just 20.43 km2 and is devoid of heavy human activity, which makes it an ideal background observatory for the eastern Mediterranean. The station location is carefully selected, as the island is placed at a “crossroad” of different aerosol air masses (Lelieveld et al., 2002), with NNE winds being prominent between August and February, while in spring and early summer the western airflows largely favour dust transport from the Sahara. The prevailing meteorological conditions are representative of the broader region with warm and dry days in the summer, while colder and wetter days are typical during the winter. Weather limitations and increased salinity due to the coastal site effect led to housing the SolPol in a specifically built motorized astronomical dome that offered protection from various extreme weather conditions and where it could be mounted to the EQ3 tracker for on-demand direct-sun observations.
The datasets presented in this study were acquired from May 2020 to June 2021, under various atmospheric conditions and aerosol loads, specifically targeting days with dust outbreaks and days that are representative of the local background conditions. Even a small cloud coverage can highly influence the transmitted light polarization state on optical wavelengths due to multiple scattering from cloud droplets or due to dichroic extinction from aligned ice crystals, in the case of cirrus clouds, that can lead to polarization effects in the forward direction (Baran, 2004; Bohren, 1987; Emde et al., 2004; Ulanowski et al., 2006). Accordingly, the affected SolPol measurements are screened, and in cases of prolonged transient clouds over the station the instrument was shut down. All the measurements are always direct sun.
3.2 Processing chain
The raw data acquisition comprises a set of five similar measurements over each polarizer angular position per PEM rotation, with each measurement associated with auxiliary information such as the polarizer specific angle, the PEM position, measurement time in UTC, the voltage outputs in the ADC, and the two channels of the lock-in amplifier. In order to optimize data handling, we perform an initial data reduction to each measurement sequence by selecting the fifth measurement set for the same linear polarizer positions.
The DC signal amplitude returned from the PM detector is simultaneously recorded by the ADC in volts (Appendix A Fig. A1) and gives the magnitude of the total irradiance I (Eq. 4) as seen in Table 1. By turning the linear polarizer at specific positions, we acquire the amplitude and phase of the rms (root mean square) AC modulated signals as outputs of the lock-in amplifier respective channels, and each is directly proportional to the magnitude of Q and U for even ωt (Eqs. 5 and 6) and to the magnitude of V for odd ωt (Eq. 7). However, the two signals are processed through separate electronic channels on the amplifier, inducing a different proportionality factor for linear and circular polarization that depends on the modulation frequency and which is considered in data processing. Therefore, the recorded voltages from which we derive the Stokes parameters are
where J1(A)=0.5192 and J2(A)=0.4317 are the first- and second-order Bessel functions for A = 2.4048.
For data smoothing, we impose the Chauvenet criterion on each daily dataset with a 120 min duration, which is the maximum consecutive measurement duration of SolPol, and detect outliers to the Stokes parameters due to instrument misalignment and persisting perturbations to the measurements caused by passing low clouds. The criterion is applied once with the relation below:
for a deviation of , where is the mean output of Q, U, or DOLP from the processing algorithm; Si is the ith output for i=0, …; and N is the total number of computed triplets for each 2 h subset. Lastly, erfc(x) is the complementary error function1, and s is the unbiased sample variance2.
3.3 PollyXT lidar measurements
For the comprehensive characterization of the vertical distribution of aerosol optical properties, we exploit the profiling capabilities of the co-located PollyXT Raman polarization lidar (Engelmann et al., 2016) of the National Observatory of Athens (NOA), as part of the European Aerosol Research Lidar Network (EARLINET – https://polly.tropos.de/calendar/location/38?&individual_page=2020, last access: 16 December 2022). This multi-wavelength system is equipped with three elastic channels at 355, 532, and 1064 nm; two vibrational Raman channels at 387 and 607 nm; two channels for the detection of the cross-polarized backscattered signal at 355 and 532 nm; and one water vapour channel at 407 nm. The basic lidar quantity used is the volume linear depolarization ratio (VLDR, δv) at 532 nm. VLDR (%) is the ratio of the cross-polarized to the co-polarized backscattered signal (Freudenthaler et al., 2009), where cross-polarized and co-polarized are defined with respect to the plane of polarization of the emitted laser pulses. VLDR values are influenced by both atmospheric particles and molecules, with high δv values being indicative of irregularly shaped particles (i.e. atmospheric dust). Typical δv values for Saharan dust are in the range of 20 % to 30 % at 532 nm (Haarig et al., 2017; Veselovskii et al., 2016, 2020). The 2020 and 2021 dust events reaching Antikythera, presented herein, are characterized by generally large concentrations of airborne dust particles from the middle of the day onwards with δv exceeding 15 %, followed by dust settling towards the ground at late afternoon. The dust layers are mostly detached and homogeneous with some vertical mixing with non-depolarizing marine particles occurring within the marine boundary layer (MBL).
3.4 Ancillary aerosol information
The AOD was monitored by the CIMEL sun photometer, part of the NASA Aerosol Robotic Network (AERONET – https://aeronet.gsfc.nasa.gov/, last access: 12 December 2022), which was also installed in PANGEA along with PollyXT and SolPol. For all the cases examined in this paper, mean AOD values were used and varied from 0.047 to 0.502 at 500 nm. Moreover, near-surface wind speed measurements presented here were obtained from a co-located Davis Vantage Pro2 weather station at an altitude of 198 m a.s.l.
3.5 Mean dark bias correction
For the majority of the cases, bias readings (e.g. PM detector temperature-dependent offsets) provided by dark signal measurements are interspersed between all sequences for the quantification of biases on the measured DC signal. Detailed dark tests carried out with SolPol can be found in the “Dark/Tests” document in the Supplement of this paper. Bias readings are not treated as regular polarization measurements, but instead the dark flux is solely exploited as an absolute value. The mean dark DC flux, Imean,dark, is 1 order of magnitude lower than the total intensity measurements I for the cases that it maximizes, while there are cases that it becomes less than 2 orders of magnitude. The days that lack such measurements are treated instead with the mean dark flux of all the days during which dark measurements were acquired. In order to acquire representative background conditions over the station, we selected a “clean day” with small non-depolarizing aerosol concentrations and layer homogeneity, no clouds, and a relatively smooth near-surface wind profile. During relatively calm sea surface conditions, specular reflection phenomena intensify and could potentially contaminate the direct-sun measurements with linearly polarized reflected light of the same magnitude as the expected dichroic extinction from the dust particles. We do not observe such a behaviour with SolPol, although the observational site is in close proximity to the wavy sea surface (about 1.5 km in optical path towards the eastern direction). This can be explained as the established viewing geometry, which is confined by low elevation and rapidly increasing SZA, does not enclose Brewster angle reflections within the instrument field of view (FOV).
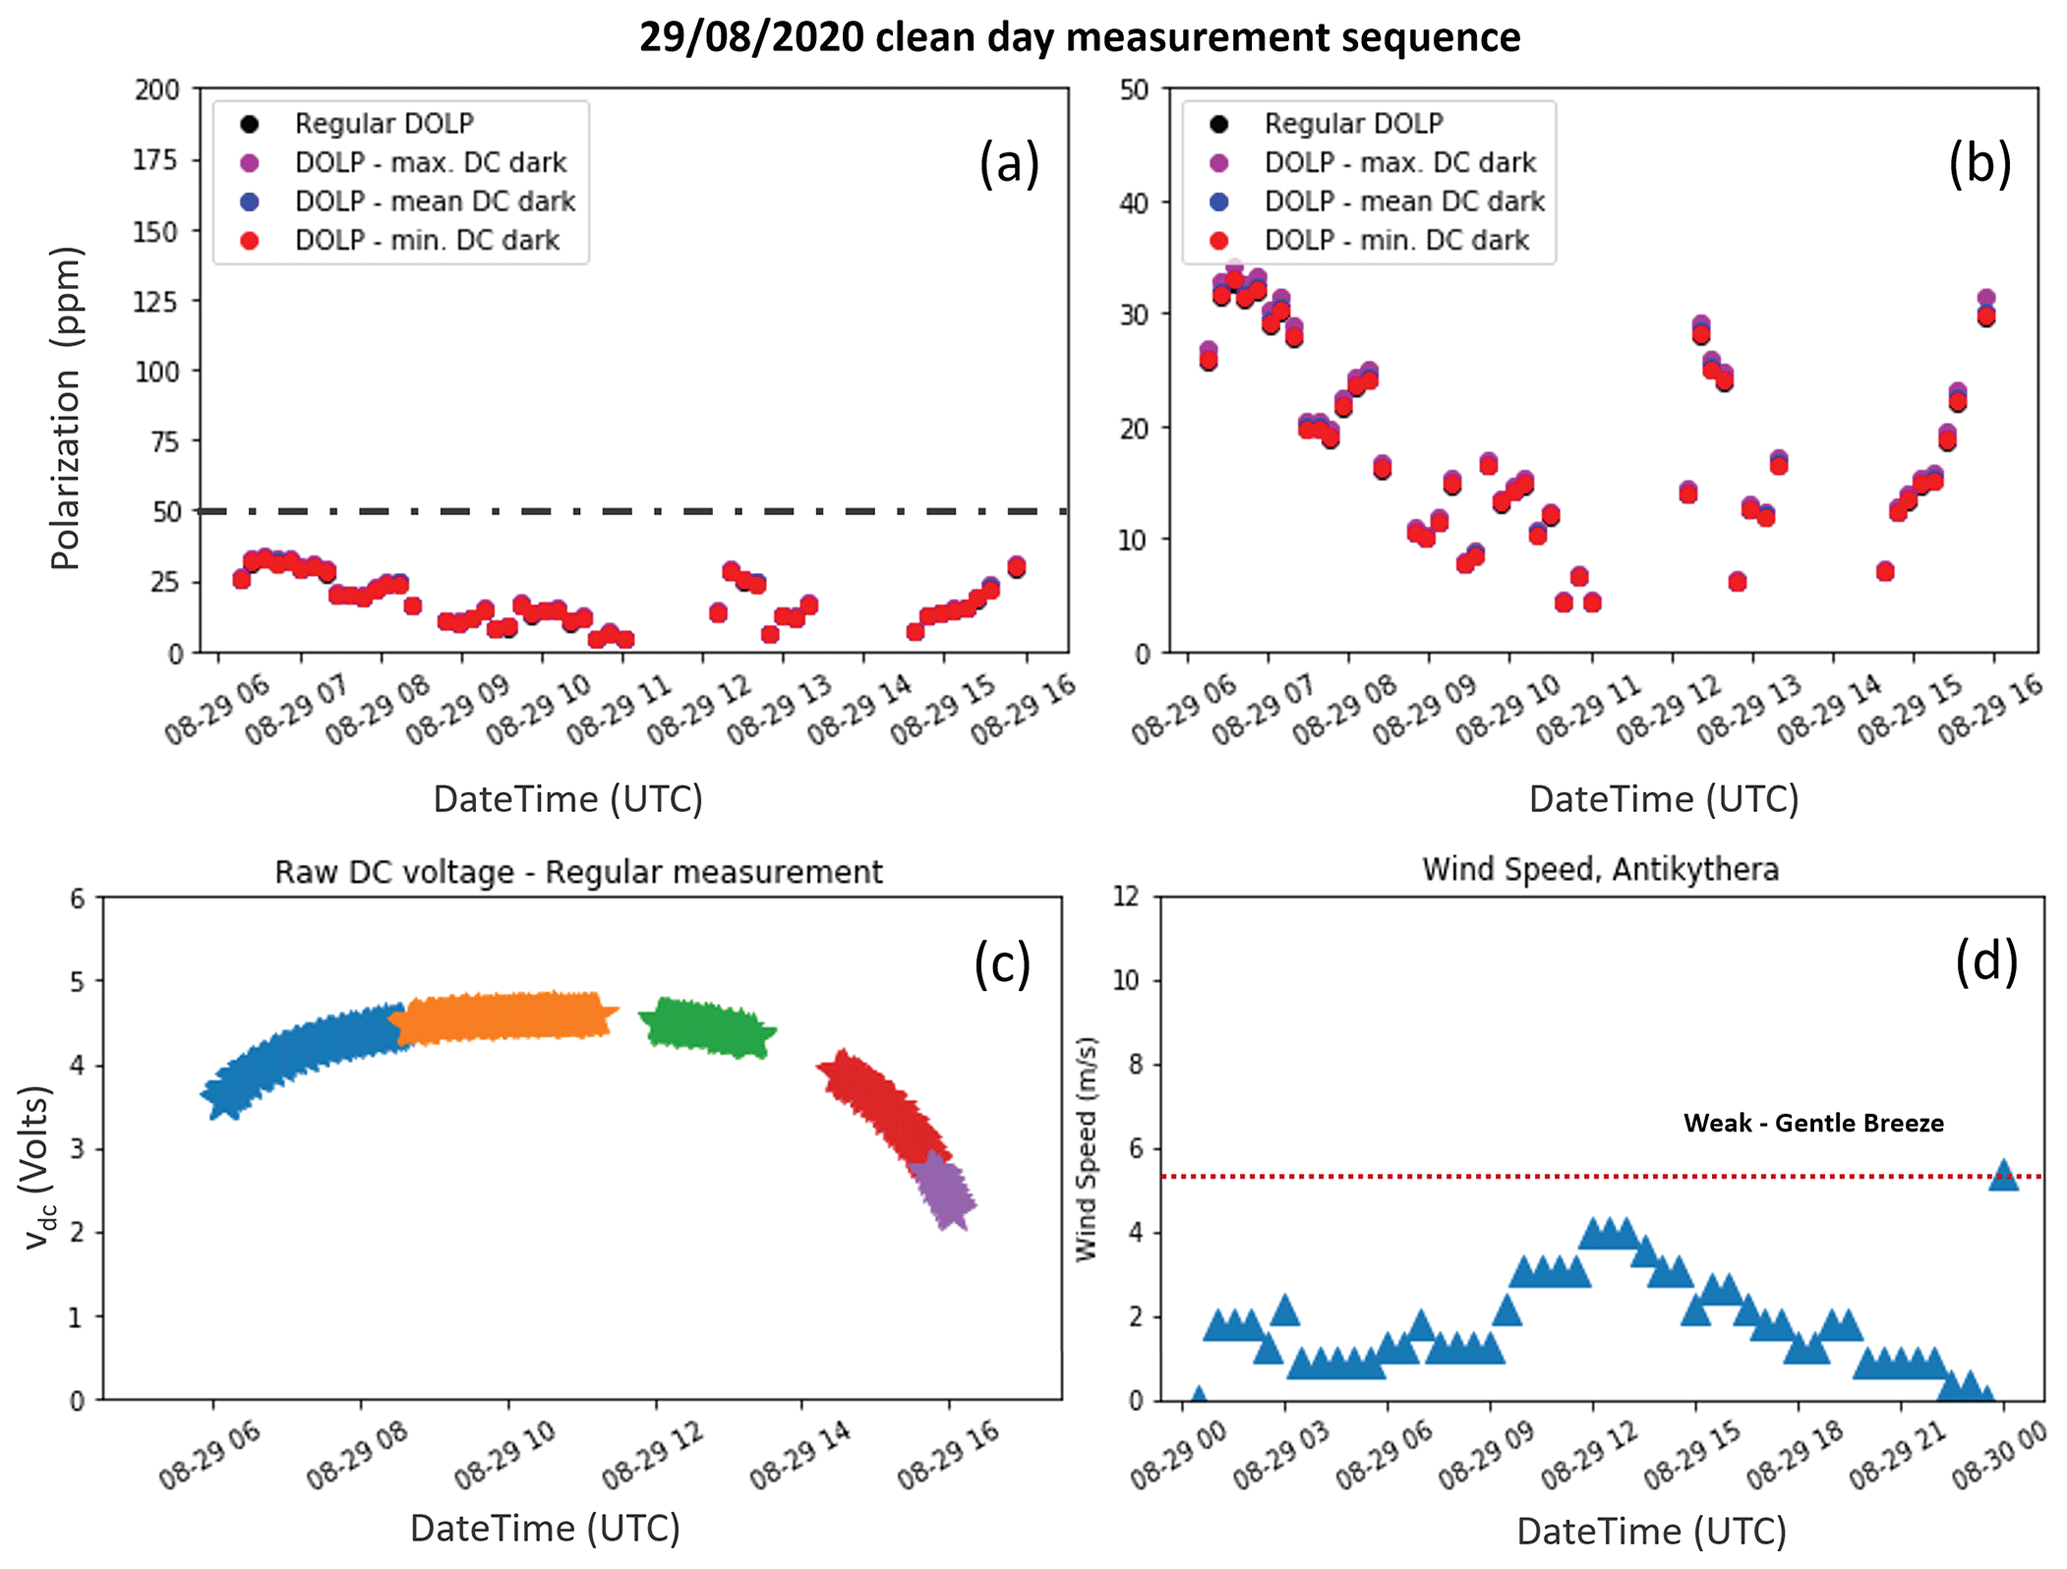
Figure 3SolPol measurement on 29 August 2020, spanning from 06:00 to 16:00 UTC at the PANGEA observatory, Antikythera. The day is labelled as “clean day” due to the very low aerosol content; 0 % cloud cover and the acquired measurements consist of a “background reference measurement” for the instrument. (a) The degree of linear polarization (DOLP) plotted in parts per million (ppm) for four different test cases: calculated without subtracting the dark DC voltage for the specific day (black dots), by subtracting the maximum value (purple dots), average (blue dots), and minimum (red dots) values of the dark DC voltage output. The dash-dotted grey line signifies the instrument noise level at 50 ppm. (b) A zoomed representation of (a). (c) The total incoming sunlight intensity, vDC in volts as recorded by the lock-in amplifier. Different colours signify the corresponding measurement subsets within the day. (d) The recorded wind speed in m s−1 for 30 min averages on the specific day. During the SolPol measurements generally low winds were blowing over the station.
In Fig. 3, we examine the change in the DOLP calculations, for a specific case study, to the subtraction from I of one of the three following parameters: (i) the minimum recorded dark intensity for the specific day, Imin,dark; (ii) the average dark intensity, Imean,dark; and (iii) the maximum value of the recorded dark intensity, Imax,dark, as a way to constrain the sensitivity of DOLP to the dark current variability. Figure 3a shows the four values derived for DOLP and their variability within the day, considering different values for the dark intensity. The measurement spans from 06:00 to 17:00 UTC, and DOLP is plotted in parts per million, reaching maximum values of ∼ 35 ppm for every case, as seen in the zoomed representation of the measurement (Fig. 3b). The relative difference between the methods is below 0.1 %, which is considered negligible, and subsequently we keep the subtraction of Imean,dark for the remainder of our processing chain. The polarimeter line of sight is unobscured during the observing sequence, as depicted in the typical and unperturbed behaviour of the measured irradiance (Fig. 3c). Different colours signify the corresponding measurement subsets within the day, and the recorded wind speeds for 30 min averages do not exceed 4 m s−1 (Fig. 3d). For the same bias correction methodology under a dust-affected day, Fig. A2 and Table A1 of the Appendix A showcase the similarities with the clean-day case and the measured dark DC fluxes.
In this section, we present the observational dataset of SolPol acquired in 2020 and 2021, when the instrument was installed at the PANGEA observatory in Antikythera, focusing on linear polarization measurements. SolPol's behaviour during this period is consistent with previous operations when tested in indoor conditions. Generally, observations were initiated just after sunrise and terminated before sunset when the sun disc started to be shadowed by nearby topography. Before each deployment, the instrument general condition was thoroughly checked in terms of instrument alignment, tracking accuracy, power supply level consistency, and the optimal communication between peripherals and the assembly control units to ensure minimum mishaps or potential disconnections of the assembly rotator.
Circular polarization (CP) by scattering at aerosols, cloud droplets, and ice crystals is several orders of magnitude smaller than linear polarization, while scattering by the molecular atmosphere is expected to not cause any circular polarization (e.g. Emde et al., 2017). This is similar to what is observed by SolPol in the forward-scattering direction, where CP is 1–2 orders of magnitude less than LP under dust presence and near-zero for background days. A thorough review by Gassó and Knobelspiesse (2022) on circular polarization by atmospheric constituents proposes that circular dichroism from aligned atmospheric dust particles could produce CP features, but its magnitude has not been defined yet. Since the phenomenon is expected to be borderline detectable with the discussed polarimeter configurations, in interstellar dust degrees of LP and CP by aligned grains becoming comparable (Kolokolova and Nagdimunov, 2014), we choose to focus on linear dichroism observations and attempt to reproduce the findings of Bailey et al. (2008). For that reason, the Stokes V parameter observations and analysis with SolPol are not discussed here, but we aim to further process these data in future studies.
4.1 Polarization measurements
Figure 4 consists of a collection of all the recorded days within this time frame, where measurement set durations within the day varied between consecutive 16 min sequences to the maximum 2 h retrievals. We subplot the (black dots), (purple dots), and DOLP (blue dots) parameters again in parts per million with time of the day in UTC, for cases of both lofted dust layers reaching the station and cases with background/clean conditions.
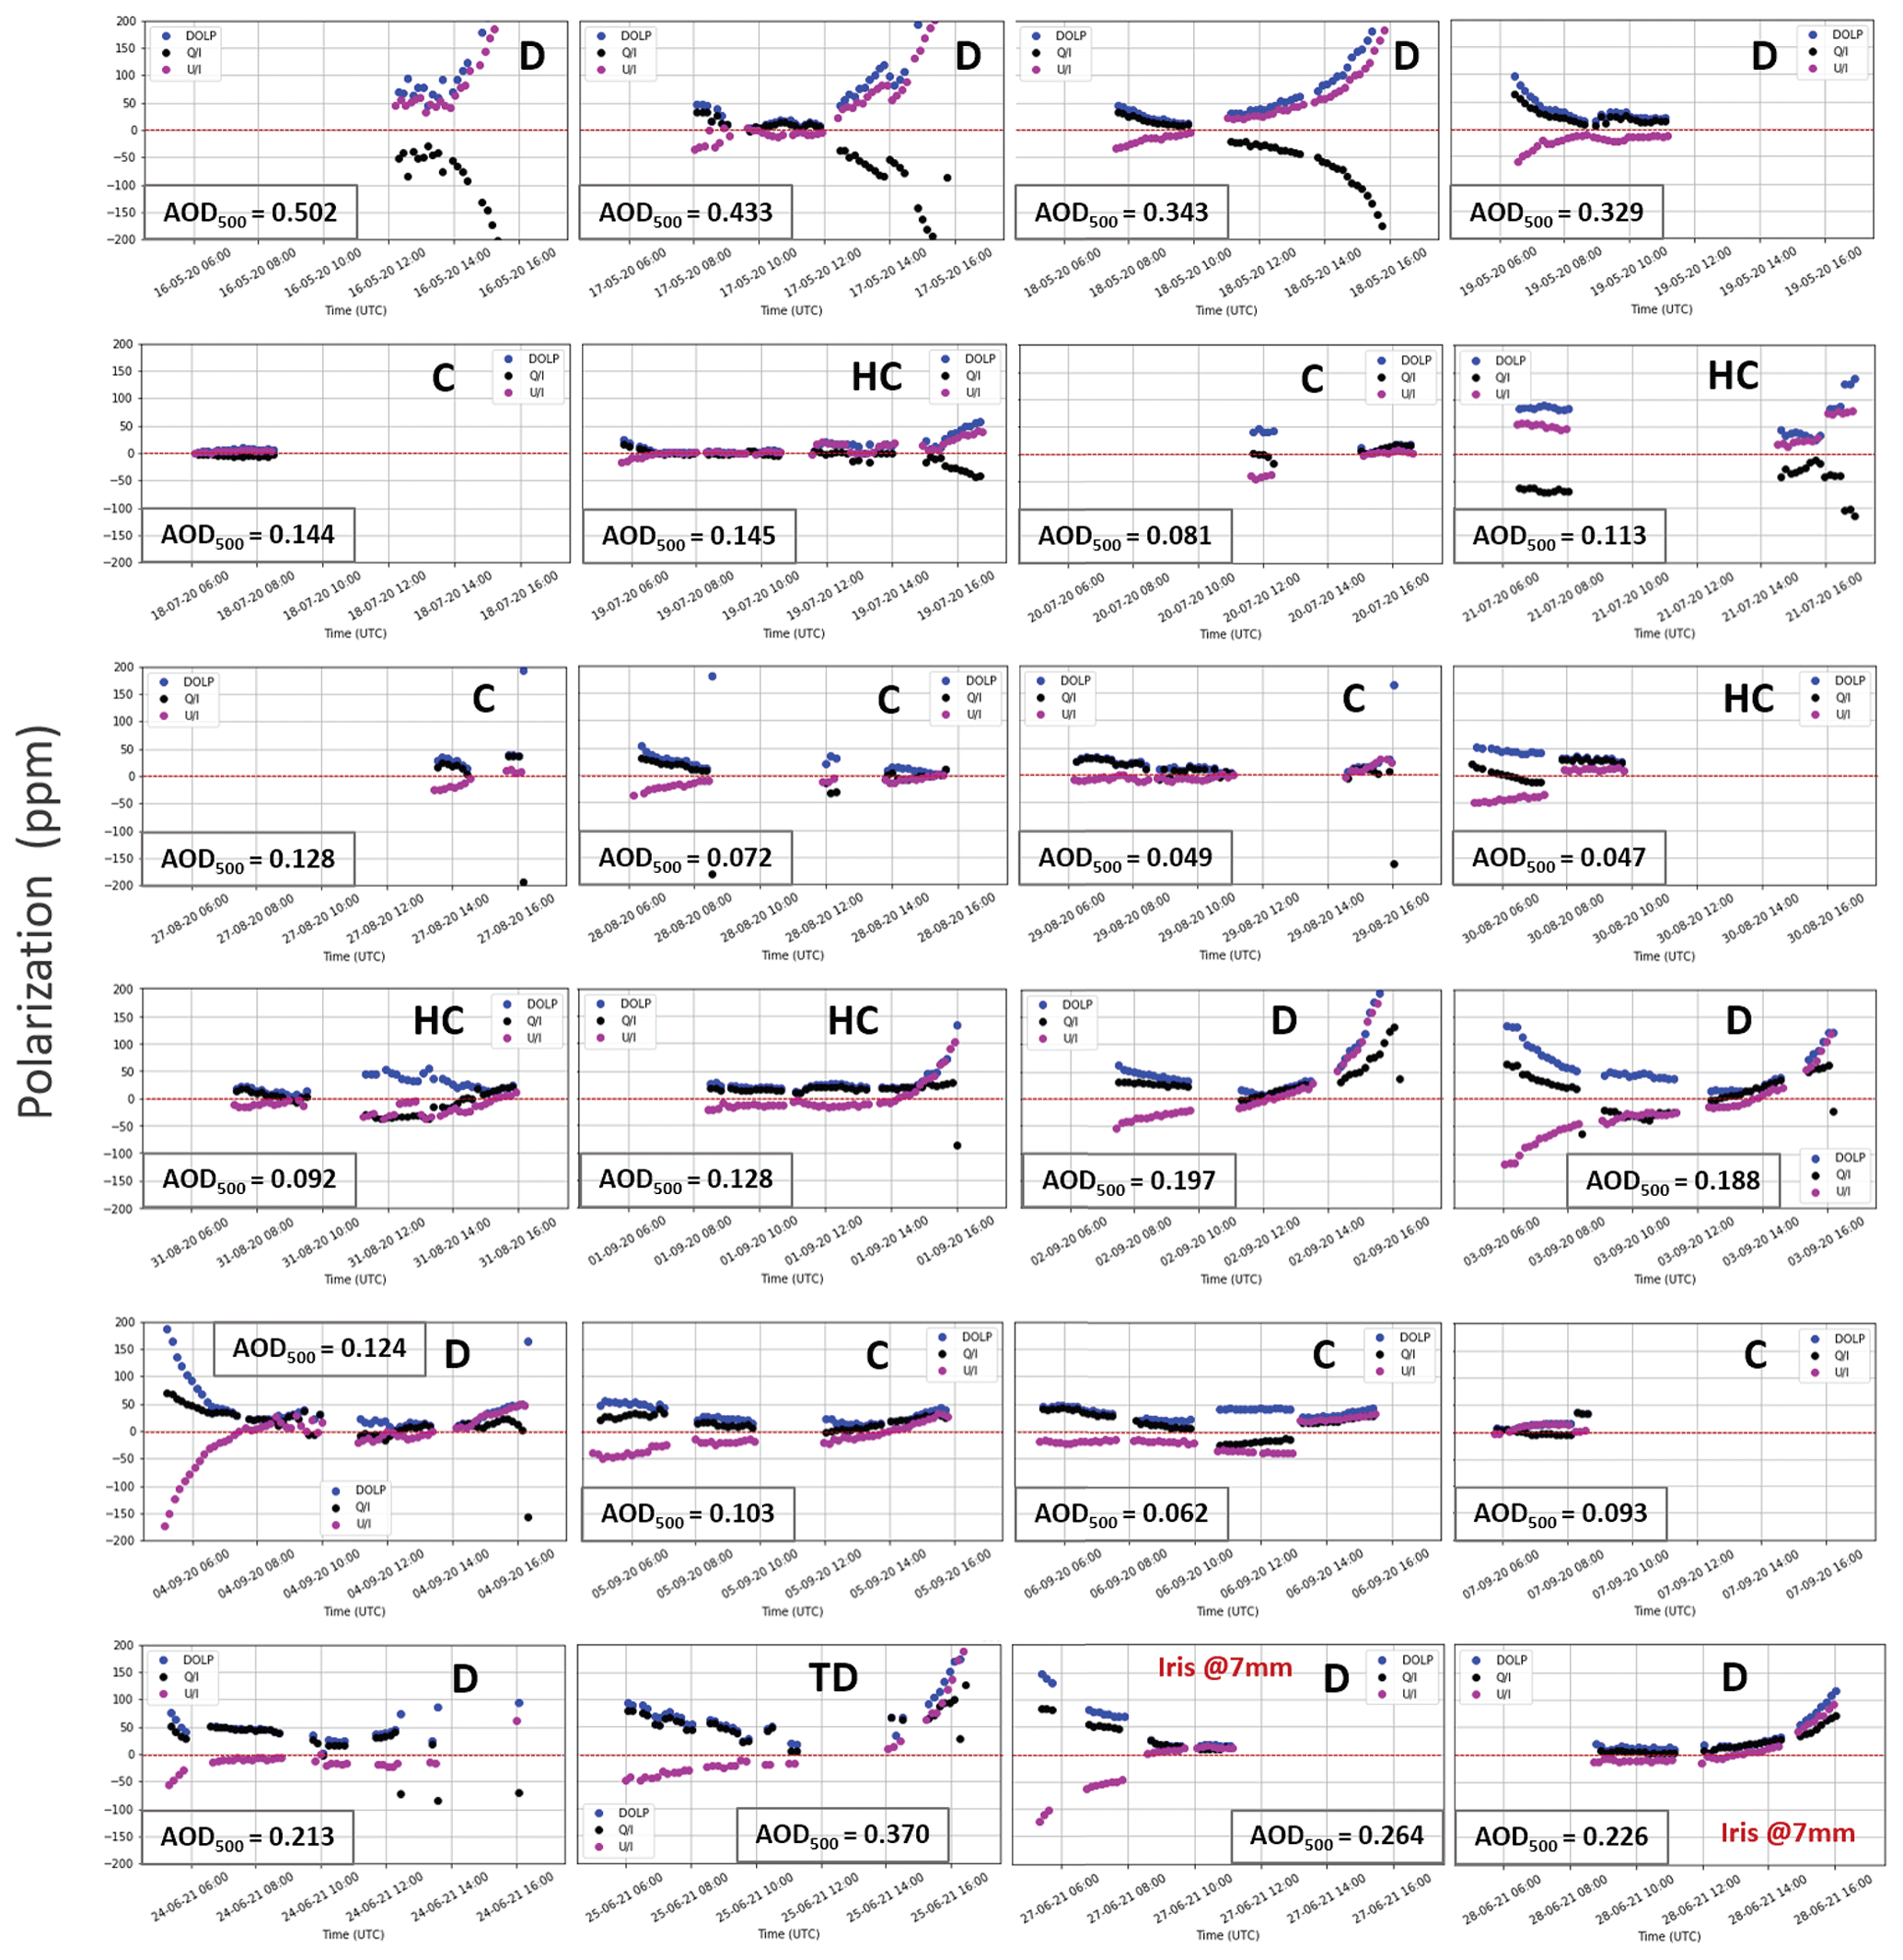
Figure 4Complete SolPol linear polarization measurements acquired between May 2020 to June 2021 at the PANGEA observatory, Antikythera. Each daily observation consists of the normalized (black dots), (purple dots), and DOLP (blue dots) in parts per million with time, while labels D (dust-driven days with various loads), C (clean days with low aerosol content), HC (half-clean days where dust outbreaks occurred at some point within the day), and TD (a dedicated test day with alternating iris sizes). Mean AOD level 1.5 values are provided for each day by AERONET (https://aeronet.gsfc.nasa.gov/). DOLP values during clean (C) days determine the instrument noise level for the polarization measurements, while during dust events (D) the DOLP values peak early in the morning and in the afternoon, reaching polarization values of more than 200 ppm per case.
We label the days as dust-driven (D) days with various dust loads, clean days (C) that are mostly characterized by concentrations of marine particles within the MBL but lack dust particle presence, and half-clean (HC) days where dust presence becomes prominent sometime within the day and potentially mixes within the MBL. This classification is inferred from the PollyXT VLDR values for each day (not presented here for all the cases for brevity reasons but can be publicly accessed in the Polly-NET website https://polly.tropos.de/, last access: 16 December 2022) and the AOD values by AERONET. We also include a dedicated test day (TD) with diffuse light testing for various SolPol aperture sizes (Sect. 5.3) and two consecutive half-day retrievals with a relatively high dust load for which a larger aperture was used.
4.1.1 Reference days
Focusing on DOLP behaviour for clean days, the measured polarization values span from 0.5 × 10⁻⁶ usually at local noon when linear polarization of transmitted sunlight is expected to minimize in near zenith viewing angles up to 50 × 10−6 in large solar zenith angles (i.e. early in the day or in the afternoon). Minimum linear polarization values for these days are consistent with early observations of polarization from the whole sun at the same spectral region as SolPol, noted in the work of Kemp et al. (1987) using a similar polarimeter apparatus. Moreover, the maximum values indicate the maximum bias consisting of pure Rayleigh scattering events, by the molecular atmosphere at low altitudes, within the SolPol FOV, and the total instrumental errors that can add to the light polarization state. A statistical analysis of all the clean-day results is discussed in detail in Sect. 5.1 and determines the exact reference instrumental bias.
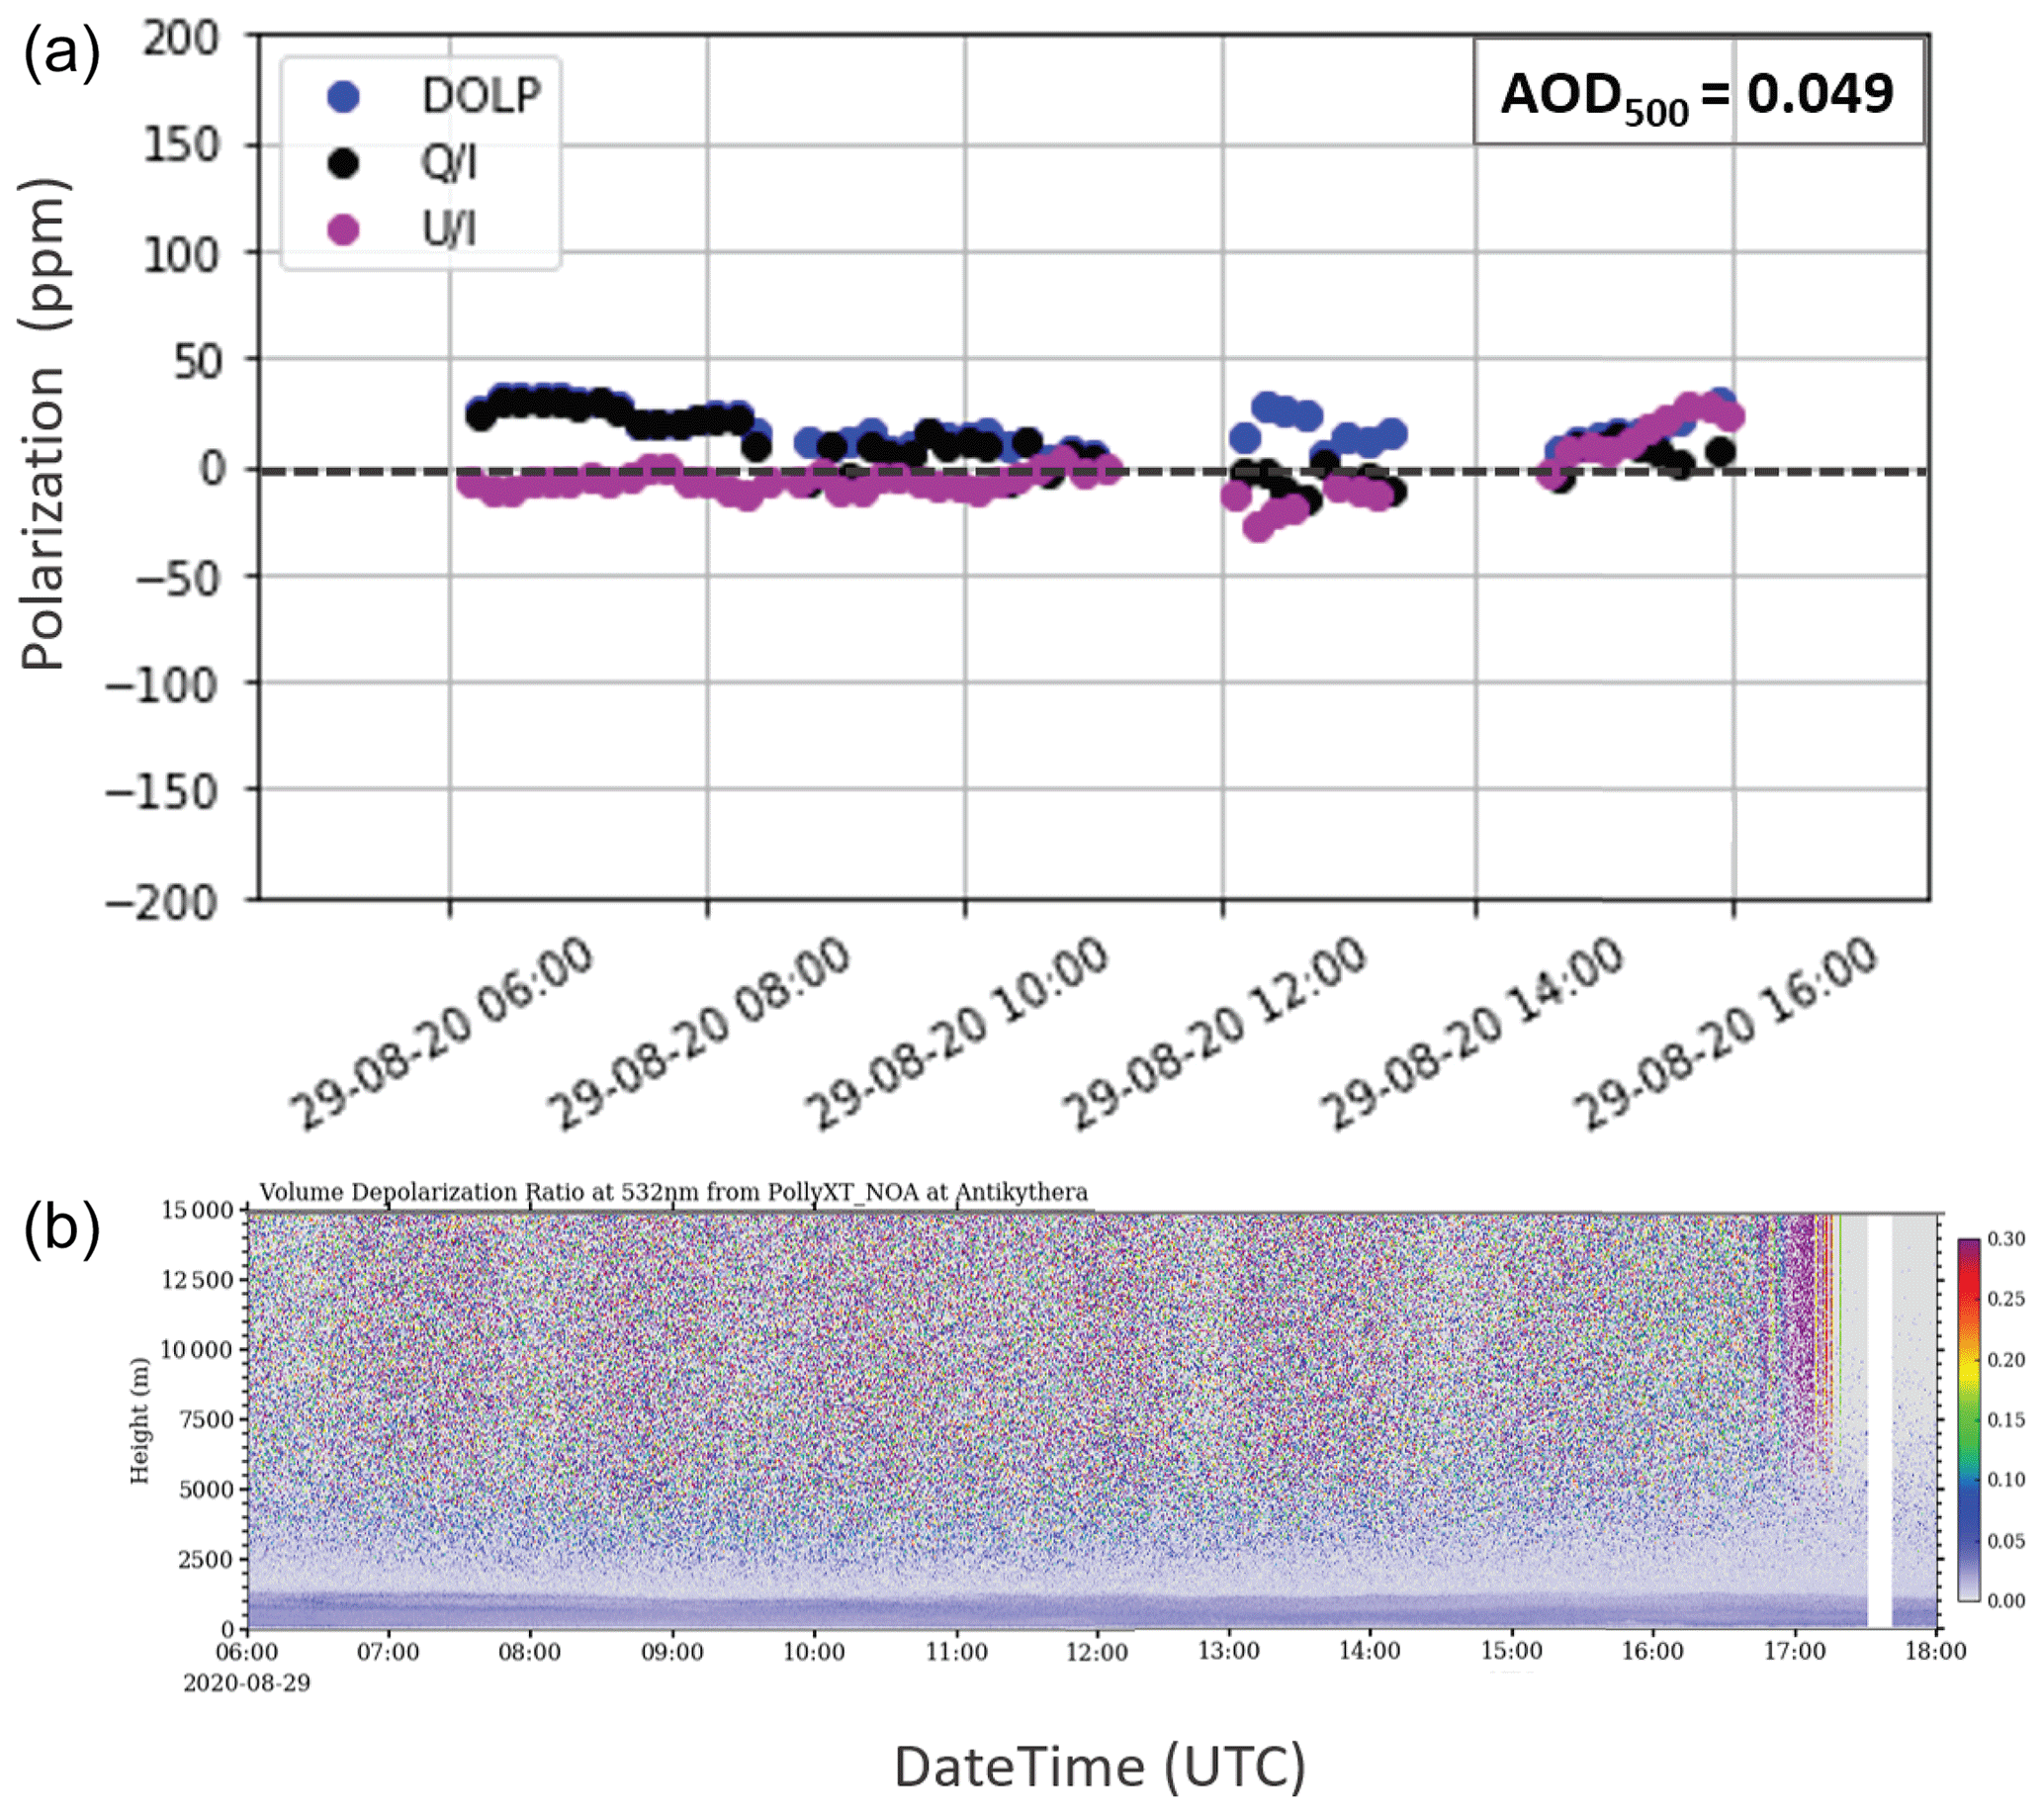
Figure 5(a) Daily progression of linear polarization (in ppm) for the measurements on 29 August 2020, at the PANGEA observatory in Antikythera, expressed through the normalized (black dots) and (purple dots) Stokes parameters and DOLP (blue dots). All values do not exceed the 50 ppm threshold regardless of the instrument viewing angle. (b) Time–height plot of the volume linear depolarization ratio (δv) at 532 nm with altitude, as retrieved from the PollyXT lidar at PANGEA for the same day. Low δv values denote that there is low concentration of depolarizing particles for the total duration of the SolPol measurement.
A typical measurement for a clean-day behaviour is provided for the 29 August 2020 case study, which was chosen above for the bias correction comparison and is delineated in Fig. 5. The top panel presents the daily progression of the linear polarization parameters in parts per million expressed through the (black dots) and (purple dots) Stokes parameters and DOLP (blue dots). Measured linear polarization does not exceed the 50 ppm threshold regardless of the instrument viewing angle from the zenith. The average daily AOD has a low value of 0.049 in 500 nm, while the SolPol retrieval is compared to the time–height plot of the VLDR at 532 nm, as retrieved from the PollyXT lidar. Low δv values (< 5 %), shown in blue tones, denote that there is a generally low concentration of non-depolarizing particles within the MBL for the total duration of the SolPol measurement. Thus there is no indication of desert dust presence.
4.1.2 Days with dust events
Under dust-driven days, the dissimilarity becomes apparent. The most interesting feature with the presence of dust particles is the large polarization values towards the morning and evening of each measurement day. Linear polarization values reach up to 700 ppm in extreme cases. Such values are exhibited during heavily dust-affected days, e.g. from the 16 to 18 May 2020, where we recorded the largest dust optical depth values for the specific period of observation (Fig. 4). The increasing trend of the DOLP values with time (usually after 14:00 UTC) is mirrored in early morning measurements as the instrument monitors the atmospheric column with a decreasing SZA. The specific trend is also in line with the reported observations in La Palma by Ulanowski et al. (2007), which were later demonstrated in detail by Bailey et al. (2008), that showed a fractional linear polarization increase with increasing SZA during dust events and that polarization exhibited changes for different days roughly in proportion to the change in dust optical depth. This could potentially indicate that preferentially – vertically or horizontally – aligned dust particles might be present in the observed layers and cause the strong dichroic extinction of sunlight transmitted through the layer. Figure 4 illustrates the collective and quantitative behaviour of the observed days for up to 200 ppm so that the clean-day trends are also discernible in comparison, while the exact polarization values are discussed in the following sections where we group all the above observations with respect to the solar zenith angle.
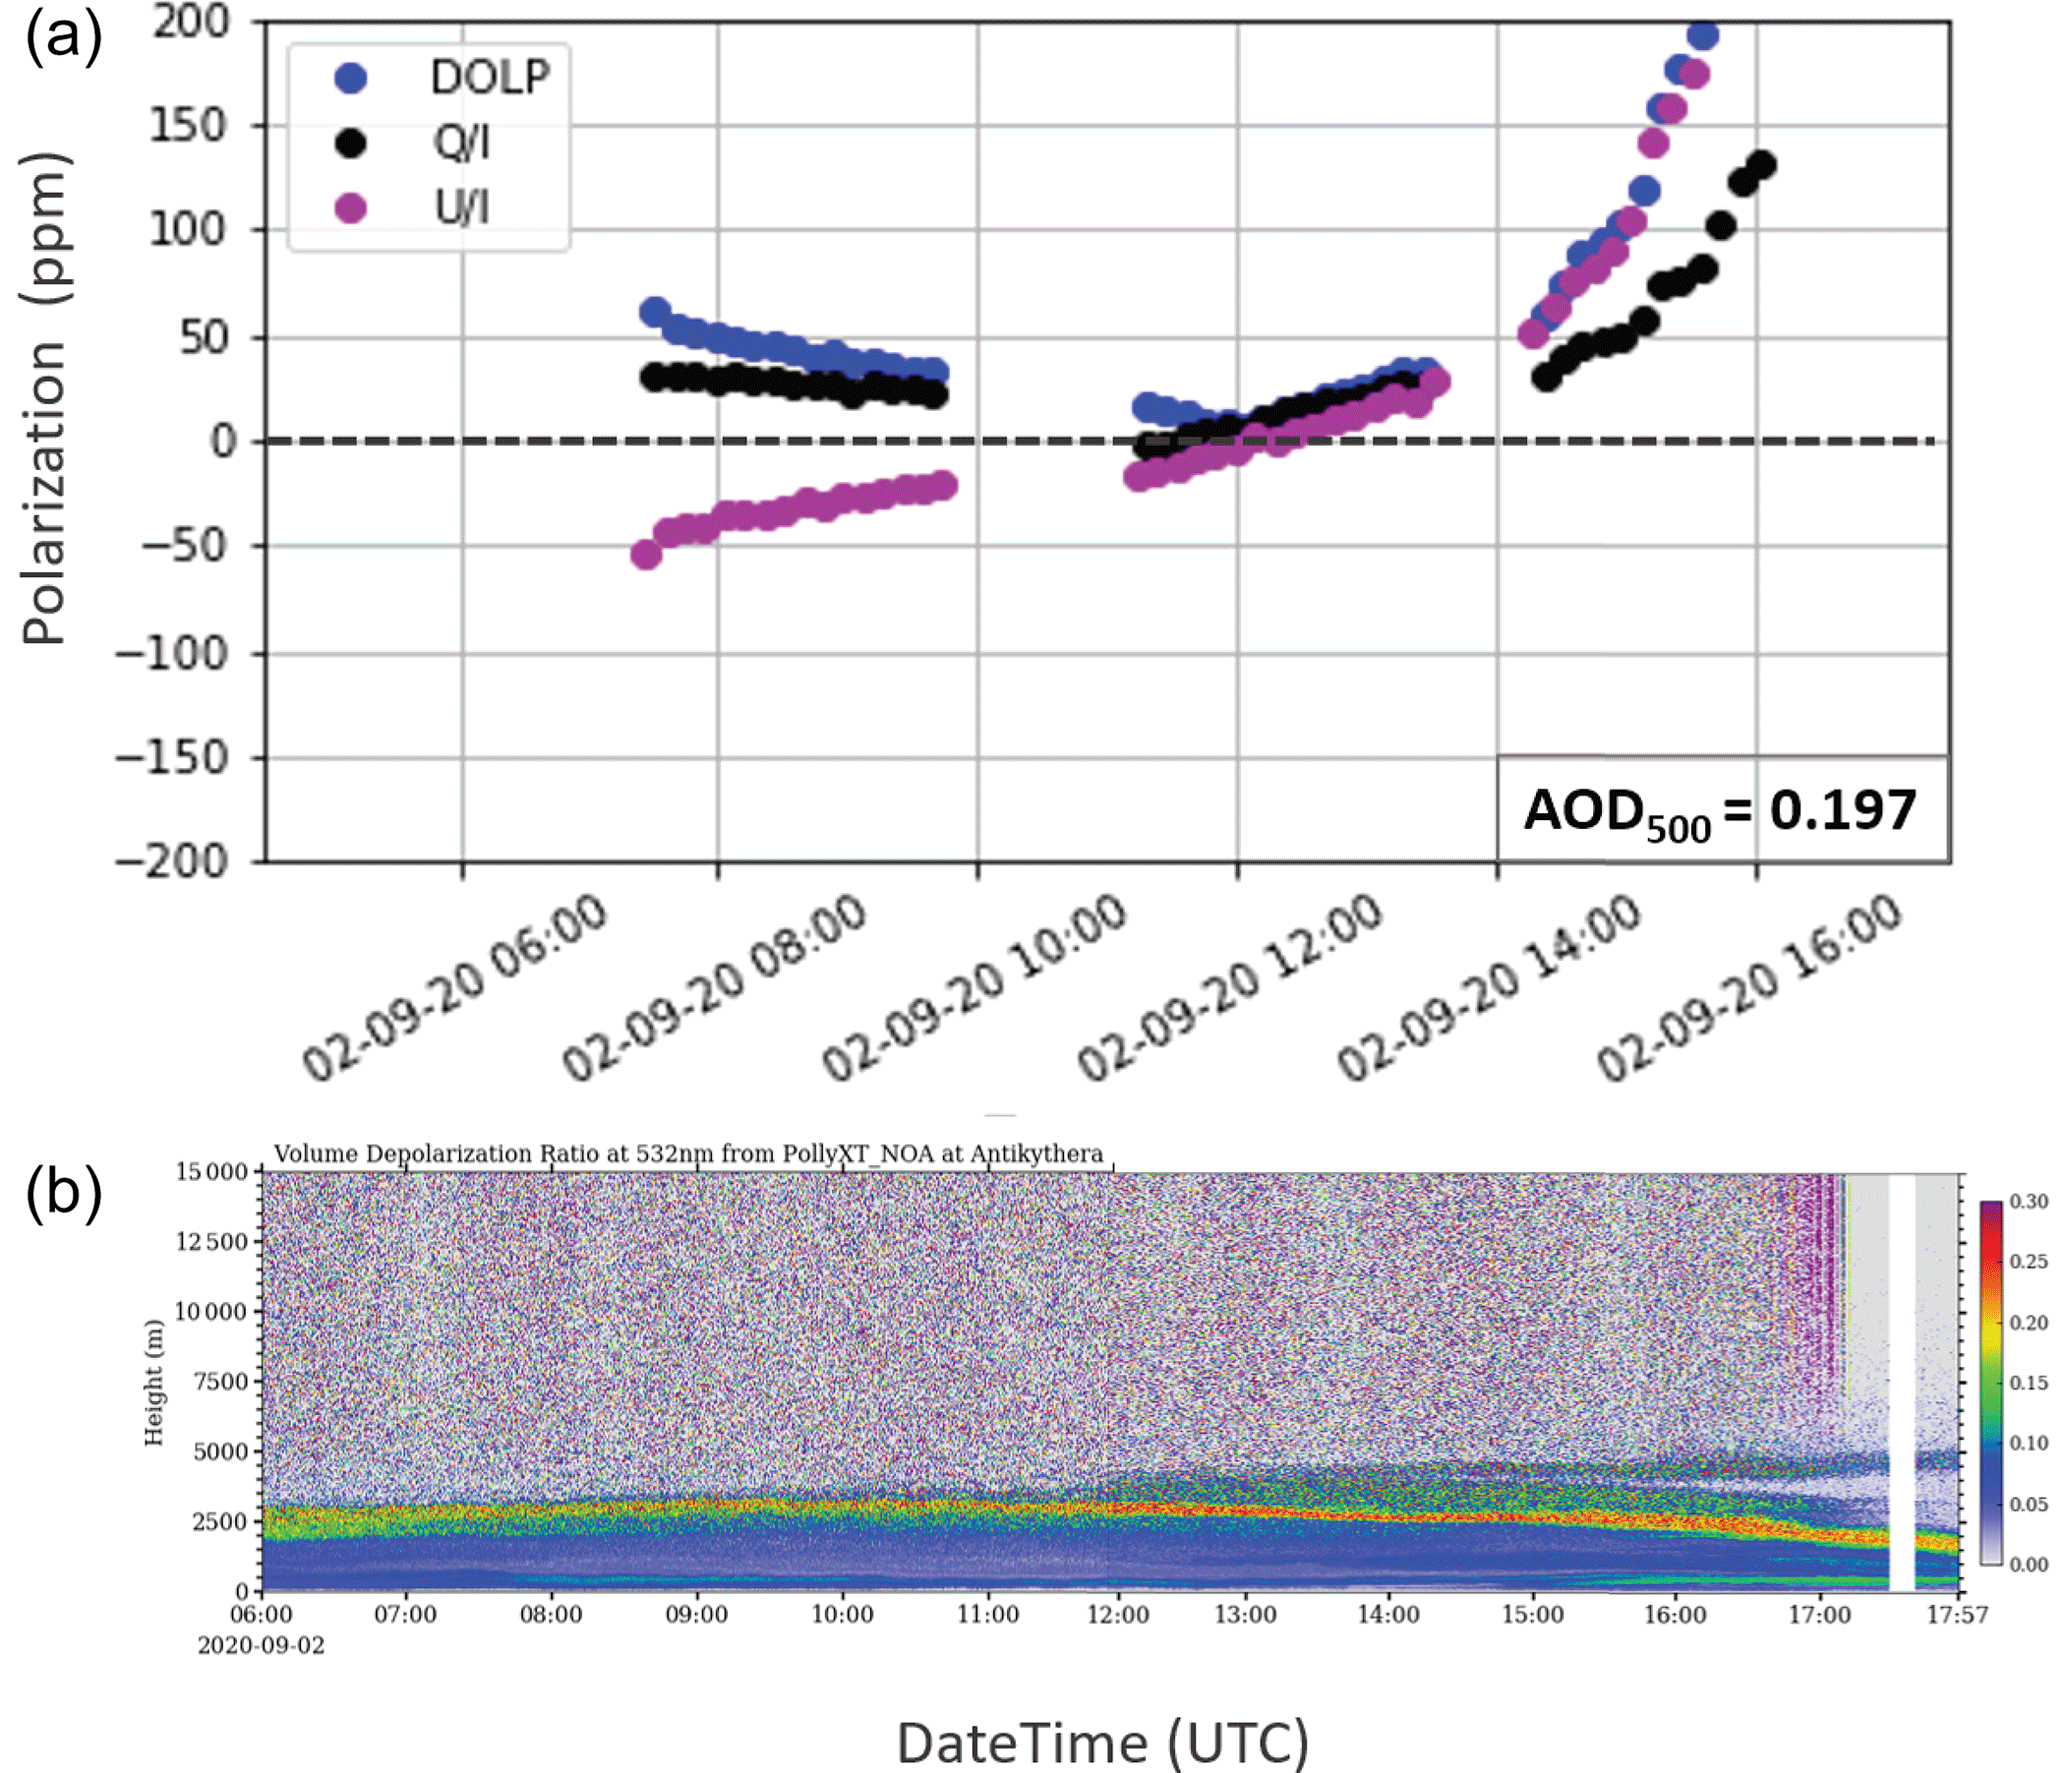
Figure 6(a) Daily progression of linear polarization (in ppm) for the measurements on 2 September 2020, at the PANGEA observatory in Antikythera, expressed through the normalized (black dots) and (purple dots) Stokes parameters and DOLP (blue dots). The increase in linear polarization is exhibited before 08:00 and after 14:00 UTC, when the instrument viewing angle increases significantly with respect to the zenith. (b) Time–height plot of the volume linear depolarization ratio (δv) at 532 nm, as retrieved from the PollyXT lidar at PANGEA for the same day. High δv values (> 15 %) are indicative of dust particle presence, and larger concentrations of dust are denoted with dark orange hues.
To better describe these high values of the dichroic extinction of sunlight passing through dust layer(s), a dust-affected case study on 2 September 2020 is also highlighted (Fig. 6). During the specific day, a transient dust layer originating from the Western Sahara travelled towards the station and was monitored reaching the PollyXT lidar system already 1 d before, at altitudes between 2.5 and 5 km. The dust layer continued progressing through the day with some downward mixing of settling dust particles within the MBL occurring between 04:00 and 06:00 UTC, but then the layer detached and the larger concentrations, denoted with red tones in the VLDR quicklooks (> 20 %–25 %), accumulated between 2 and 3 km, creating a thin layer that persisted within the day. It is also observed that the near-ground dust concentration is very low, with the very thin layer created below 500 m after about 15:00 UTC, being potentially a mixture of dust particles and particles of marine origin with δv values around 15 % (at this height range lidar overlap issues may be present). The day had zero cloud cover, and a nominal irradiance curve was recorded by the SolPol detector (Fig. A2). As presented in the polarization graph (Fig. 6, top panel), the degree of linear polarization shows a decreasing trend from early morning as the day progresses towards local noon. Although the measurement sequence started a bit later than the previously presented clean-day sequence, the trend is clear. The DOLP values are low, ∼ 2 ppm near zenith, and reach up to 400 ppm when the observed increasing trend maximizes at the end of the sequence just before 16:00 UTC. The excess in linear polarization above the 50 ppm threshold (inferred from the reference day) becomes prominent for this case.
In this section, the basic factors that can influence the linear polarization behaviour and produce the excess polarization trend are discussed. We, firstly, analyse the dependence of DOLP on the SZA and determine the instrumental noise level based on our reference days. Secondly, we illustrate the evolution of DOLP with respect to the increasing optical depth and air mass. We further attempt a linear regression between DOLP and high AOD values, while lastly the effect of incident diffuse light, over SolPol's aperture, on the polarization trend is discussed for a dedicated test measurement day.
5.1 DOLP dependence on SZA
As the SZA increases, particles that are preferentially aligned with respect to the vertical axis present themselves in the frame of reference of the instrument as being more strongly aligned. Moreover, the air mass increases; hence the slant optical thickness and therefore dichroic extinction (which is an extensive scattering property – it grows with the number of scattering particles) also increase. Consequently, it is expected that at near-zenith angles, particles that are aligned with their long axis vertically will not influence the polarization and result in near-zero values. Conversely, strong polarization is expected for large SZAs, similarly to what was previously reported (Bailey et al., 2008). In Fig. 7, we present an analysis of DOLP measurements (in ppm) as a function of the solar zenith angle in degrees, for the cases of the selected clean/reference days (Fig. 7a) and under the observed dust events (Fig. 7b). A total of 8 d per category were used, while days labelled as half-days, the test day, and 2 d with larger irises were excluded. LP in clean days does not exceed the strict 50 ppm limit that was discussed for the single case of Sect. 4.1.1, regardless of the SZA. This is clearly depicted in the zoomed representation (Fig. 7c) that modifies the instrument noise threshold (shaded area) accordingly, given that the dataset is statistically significant and that clean days are interspersed between the recorded dust events.
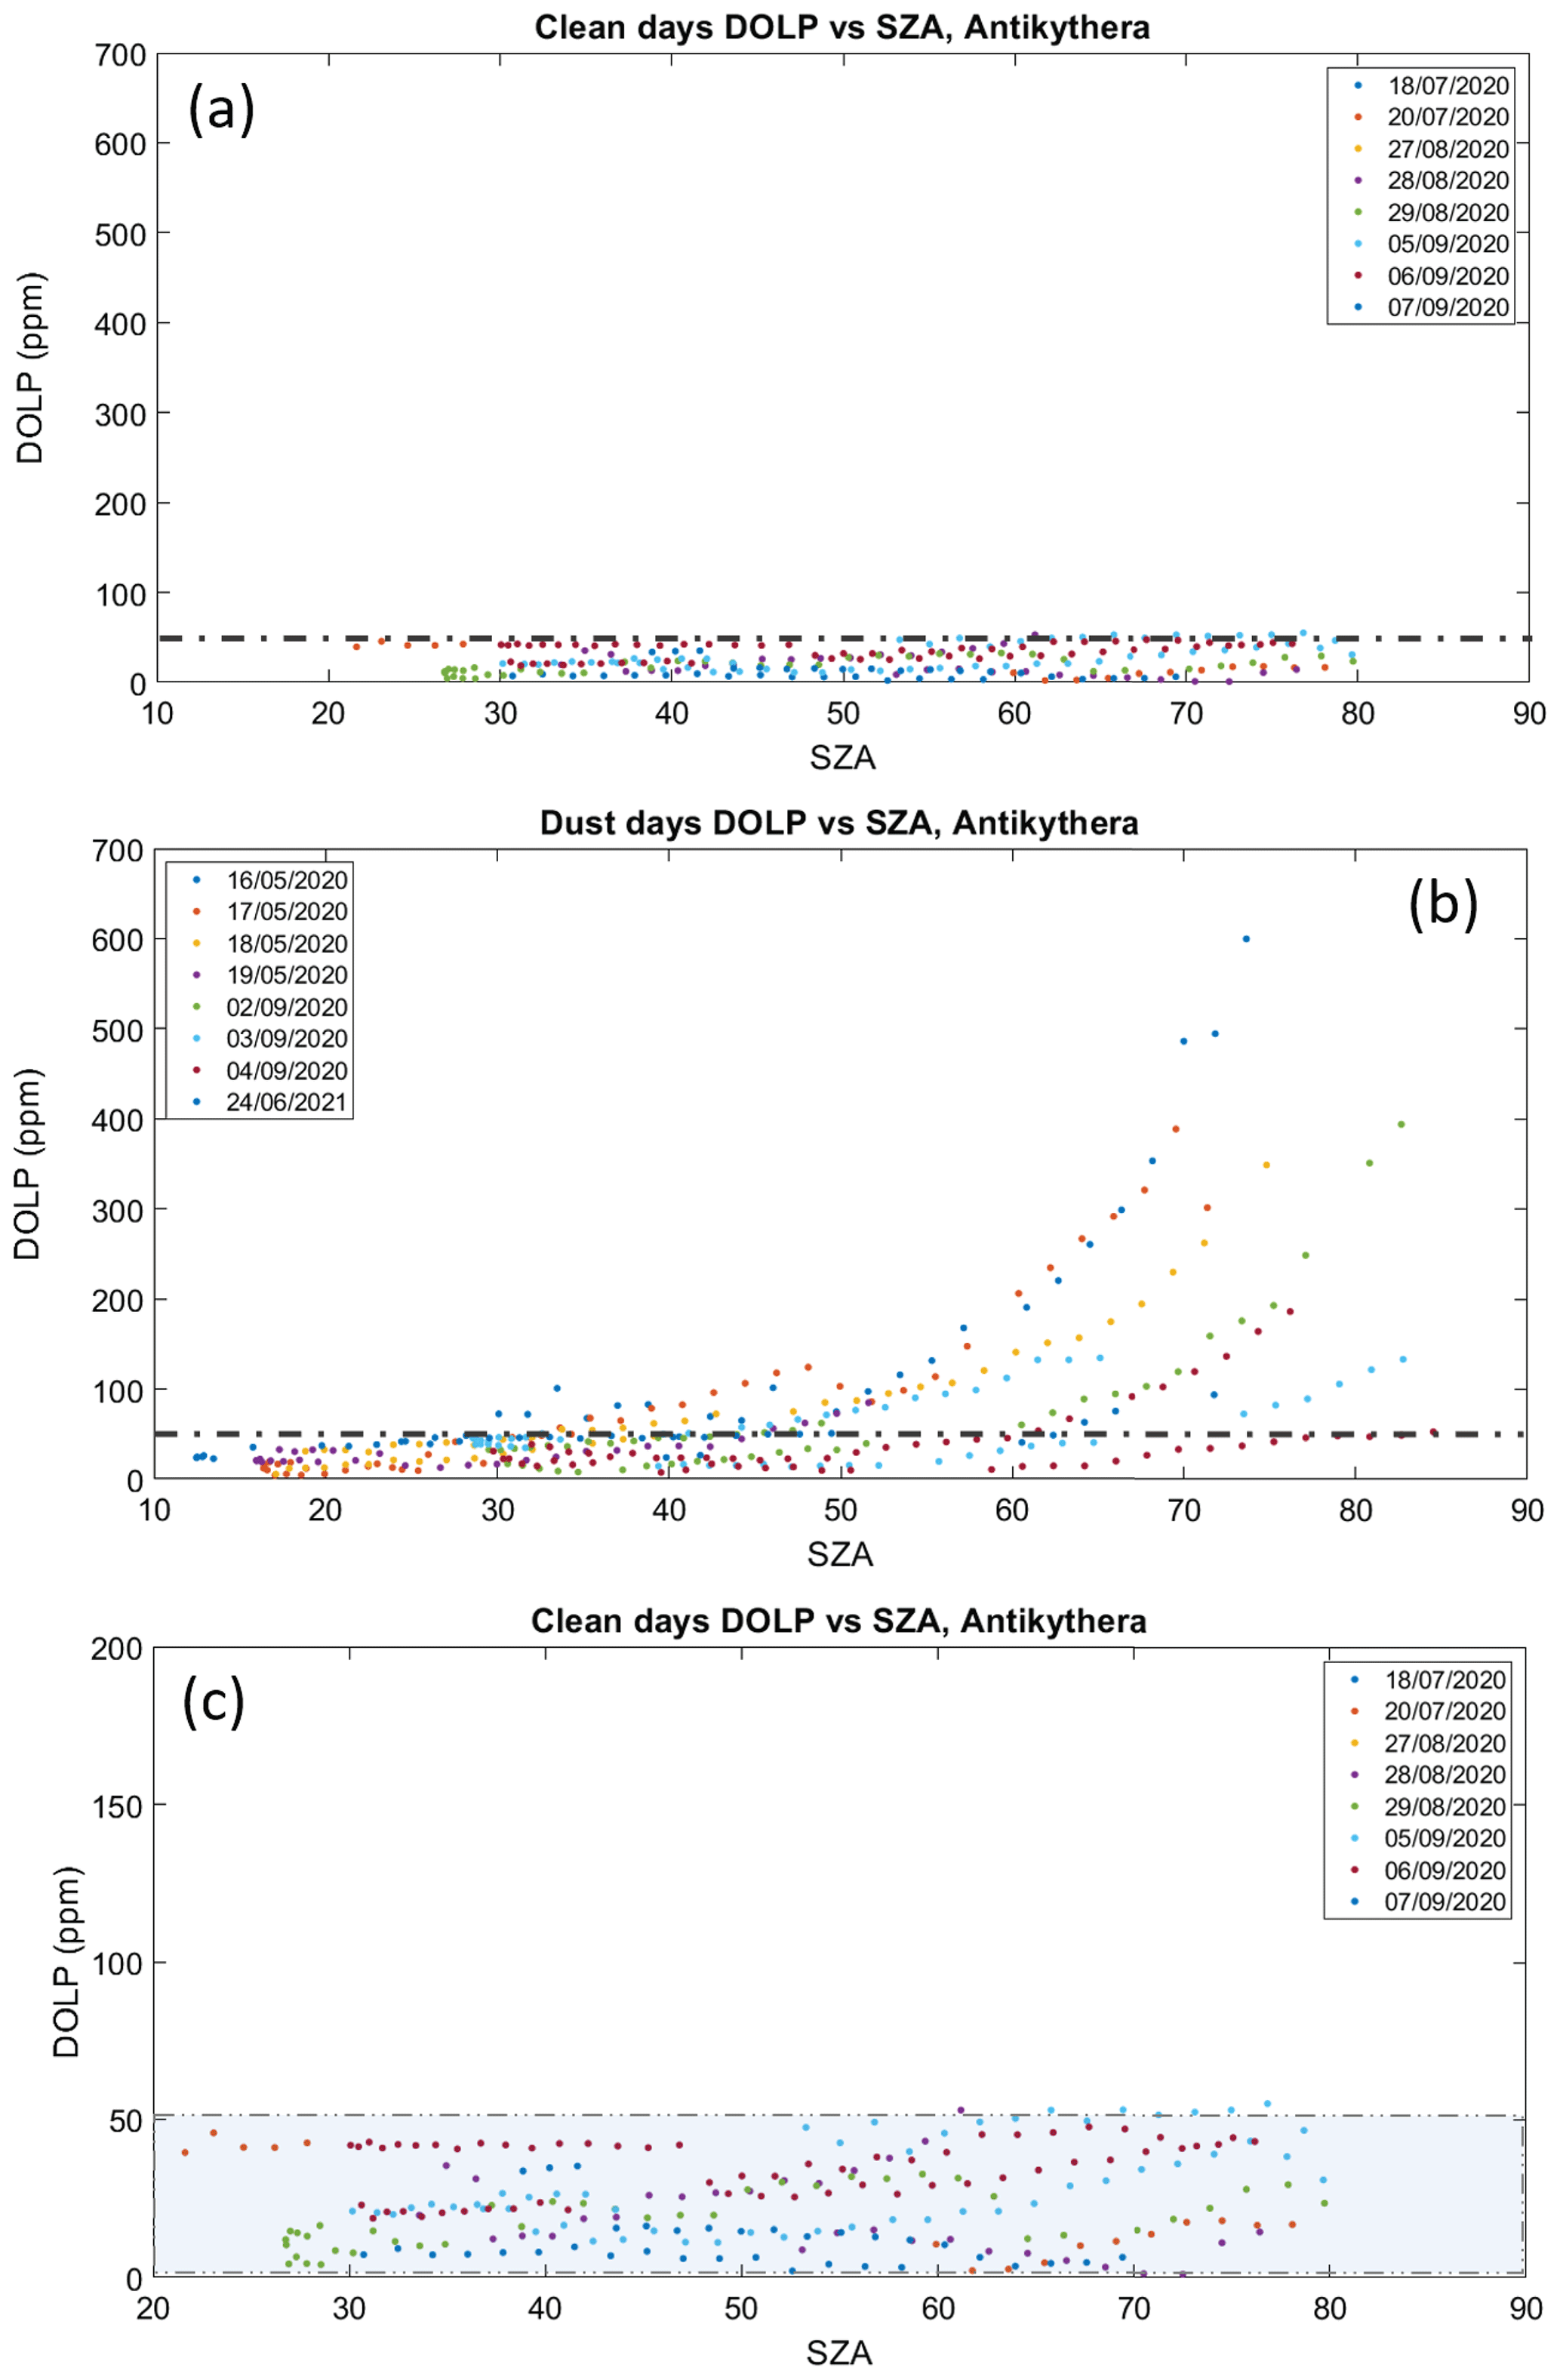
Figure 7Analysis of the DOLP retrievals with the solar zenith angle (SZA, in degrees) for the labelled (a) clean days (C), (b) days with dust events (D), and (c) a zoomed representation of (a) with the instrument noise threshold (shaded) as deduced by the clean days. The excess in linear polarization (> 50 ppm) becomes apparent for large SZAs (> 50∘) when dust particle concentrations persist within the day.
Figure 7b illustrates that LP increases with solar zenith angle under dust-driven days, a trend that starts at about 30∘ and is obvious mainly after 50∘ SZA, with a maximum value of ∼ 7 × 10⁻⁴ being observed at 74∘, which is over 1 order of magnitude larger than the noise level. Moreover, the polarization curve changes from day to day roughly in proportion to the change in the dust optical depth. This becomes more apparent for large SZAs when dust particle concentrations persist within the day. The segregation between reference days and dust-driven days, along with the distinct behaviour of DOLP with increasing SZA, is consistent with the findings from stellar polarimetry (Bailey et al., 2008; Ulanowski et al., 2007), although these studies are targeted on longer wavelengths and potential Rayleigh contamination may vary our results towards probing particle orientation.
5.1.1 Biases
The observed DOLP variation from clean-to-clean day (Fig. 7c) represents the induced instrumental error under individual measurements, as the differences would be predominantly attributed to the temporal variability of the molecular atmosphere and the dependence of direct solar irradiance on the recorded AOD (e.g. Gueymard, 2012). The threshold value of 50 ppm is also orders of magnitude larger than other systematic errors in linear polarization caused, for example, by a slight misalignment of the PEM surface with the incoming light axis. According to Kemp and Barbour (1981) this is of the order of 10−7 for misalignment angles of 0.1∘, which is way beyond any thermal crystal expansion effects or external mechanical stresses to the PEM head in the installation site. Tracking offsets that gradually result to slight angular deviations cause the targeting of larger off-disc areas and can be a factor that contributes to the characterized instrument bias, as linear polarization increases near the solar limb (e.g. Stenflo, 2005). Although we performed a test for identifying the effect of diffuse light in the recorded linear polarization signal through incremental alterations of the aperture size (see Sect. 5.3), sky-scanning tests with a few degrees offset (on steps of 0.5∘) on the four cardinal orientations were heavily limited by the PM detection capabilities and were not conclusive.
5.1.2 Polarization angle
Information on particle alignment can be extracted from the polarization angle χ (electric vector polarization angle, EVPA). EVPA is the angle between the plane of light polarization and the plane of reference, i.e. the perpendicular plane to the optical axis interpreted by the PEM photoelastic crystal. The formula for the calculation of the EVPA is described in the Appendix (Eq. A1), and Fig. A3 shows the SolPol viewing geometry with respect to the SZA and the calculated EVPAs, as the polarization angles that correspond to measurements of DOLP that are larger than the characterized noise threshold of 50 ppm, which are essentially the observed dust cases. In order to have significant linear polarization and assuming that the particle is elongated, then the particle long axis should be perpendicular to the major axis of the polarization ellipse (Bailey et al., 2008), shown in Fig. A3a, as the parallel polarization component is predominantly scattered by the particle while the perpendicular one is transmitted by the particle. The dust cases, here, present a distribution of EVPAs, centred mainly at the values of ∼ 20, 70, and 150∘ regardless of the increasing SZA (Fig. A3). This points towards the particles being oriented at specific angles such that preferentially vertically aligned particles correspond to ∼ 110∘ (EVPA 20∘ ± 90∘) mean orientation angle and particles that are preferentially horizontally aligned at mean angles of ∼ 160∘ (EVPA 70∘ ± 90∘). The observed linear polarization increase at large zenith angles implies that particles adopt both preferential orientations, considering the temporal variation of the dust layers for our observational dataset. Moreover, the increasing trend can be expected to be steeper for vertical particle orientation, because the transition from the zenith (either no dominant orientation or polarization) towards the horizon is stronger for vertical orientation as opposed to horizontal orientation. At horizon level, vertical alignment appears total, while horizontal alignment is only partial due to the fact that particles are still randomly oriented in the horizontal plane.
By the EVPAs considered in this study (Fig. A3b), particles tend to mostly adopt the horizontal alignment, which is in accordance with previous particle orientation studies stating that the hydrodynamic forces dominate the alignment, as opposed to the electrical forces, and tend to orient the particle horizontally as it falls within the atmosphere (e.g. Mallios et al., 2021, 2022, and references therein). Nonetheless more synergistic studies on particle dynamics that will take into account the full particle scattering matrix, e.g. through the WALL-E lidar observations (Tsekeri et al., 2021), and microphysical parameters, such as the particle size distribution, particle charge, and asphericity, will be conducted in order to verify our findings and potentially explain the dominant mechanism that could reproduce such an orientation signature.
5.2 DOLP dependence on AOD
In this section, we examine the correlation of the observed excess polarization with the optical thickness of the dust layer. We expect the correlation because dichroic polarization is an extensive property of the particles; hence, its strength increases with the number of particles present in the incoming light path. As shown in the Fig. 8 comparison, the DOLP measurements are given for different aerosol optical depth values with respect to the SZA (Fig. 8a) – or the air mass (i.e. ) – respectively (Fig. 8b) – for all the acquired cases except the half-clean days and the dedicated test day. We are using the daily average AOD values per full day of SolPol measurements; in the case of days with sparse polarization measurements (either in the morning or afternoon), we derive the mean AOD for the time period that is closer to the measurements. Star markers denote the dust cases (D), circle markers are used to distinguish the clean days (C), and the colour scale refers to various AOD ranges. The maximum recorded AOD for the duration of our measurements in PANGEA observatory was 0.5 at 550 nm, which is large for the characteristic transport conditions of eastern Mediterranean but relatively small compared to the massive transported loads that are monitored on near dust sources.
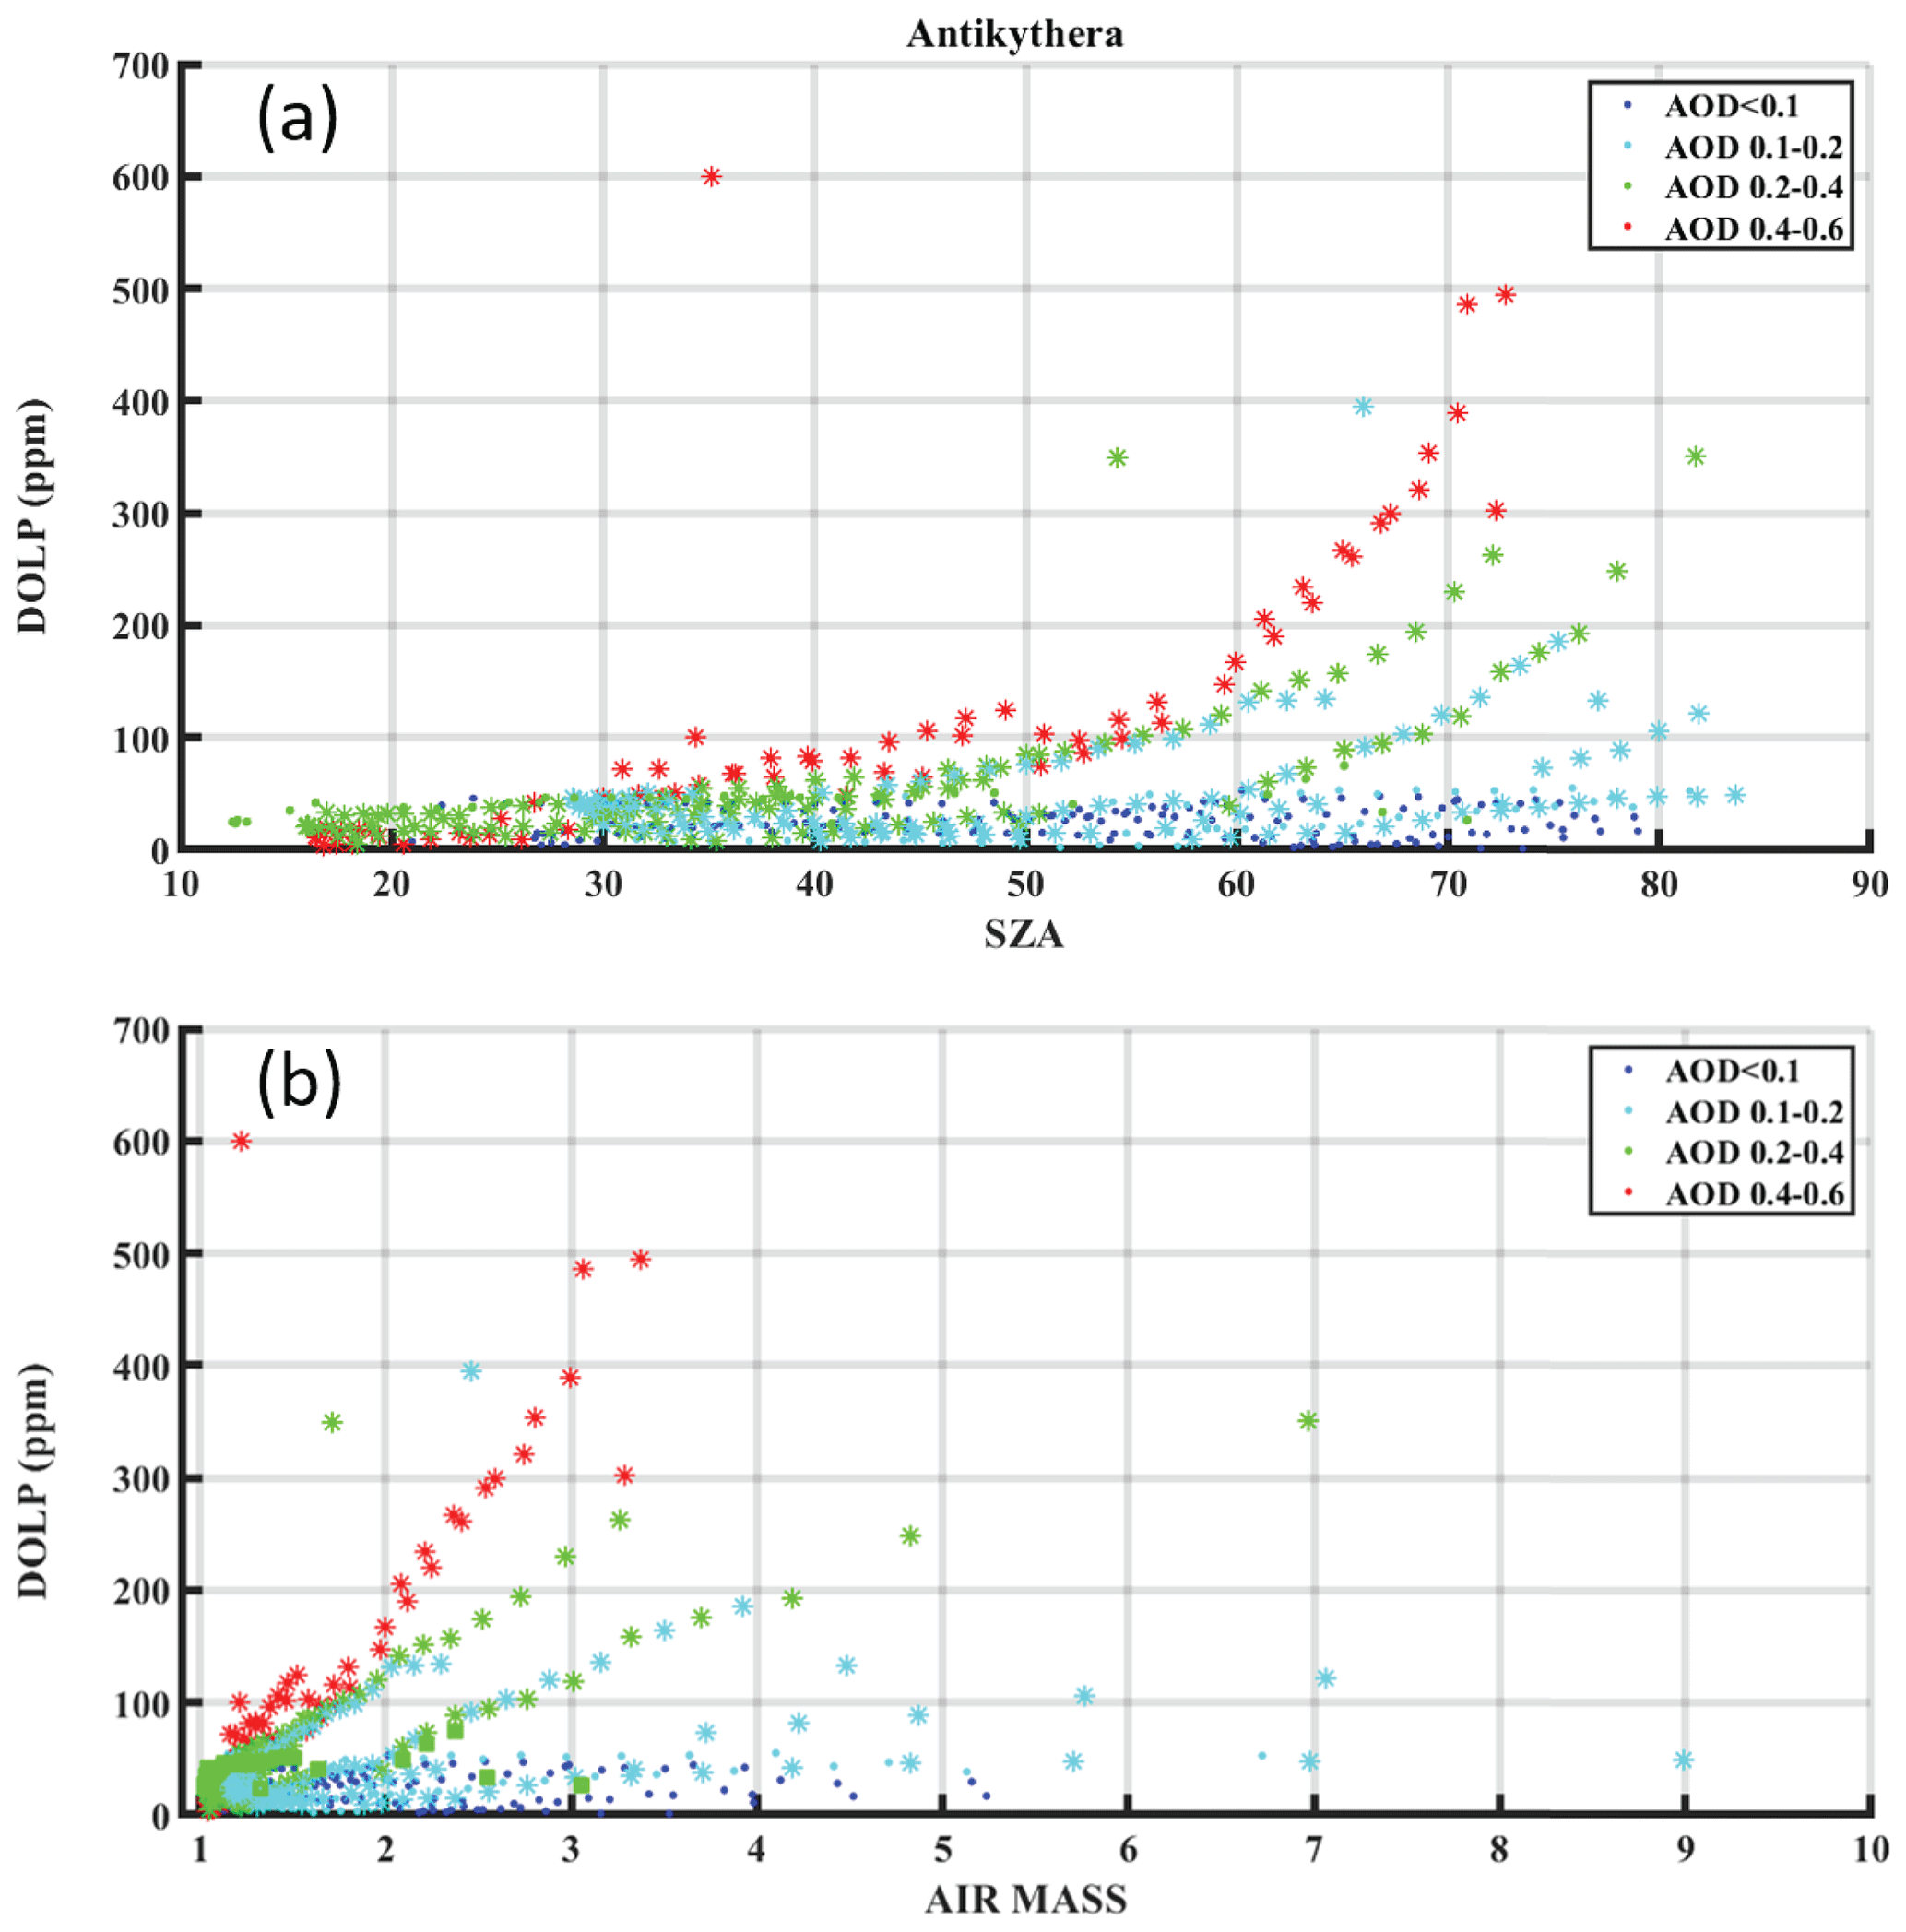
Figure 8(a) DOLP as a function of the AOD with respect to the SZA, for the all the SolPol measurements in 2020 and 2021, at the PANGEA observatory. Star markers denote dust days (D), circle markers denote clean days (C), and the colour scale refers to different AOD ranges. For small AOD values (< 0.1), the linear polarization values are within the clean-day threshold, while for AODs between 0.1–0.2, the DOLP values begin to exhibit the increasing trend with increasing SZAs, due to the potentially small concentration of preferentially oriented particles along the instrument line of sight. Significant linear polarization values are observed for all the dust days and the trend intensifies further for AODs towards the range between 0.4–0.6. (b) DOLP as a function of the air mass for the same AOD ranges. A linear correlation is observed between DOLP and the air mass for AOD values above 0.1, for the dust cases. For larger AODs, the DOLP values surpass the noise threshold for even smaller air masses.
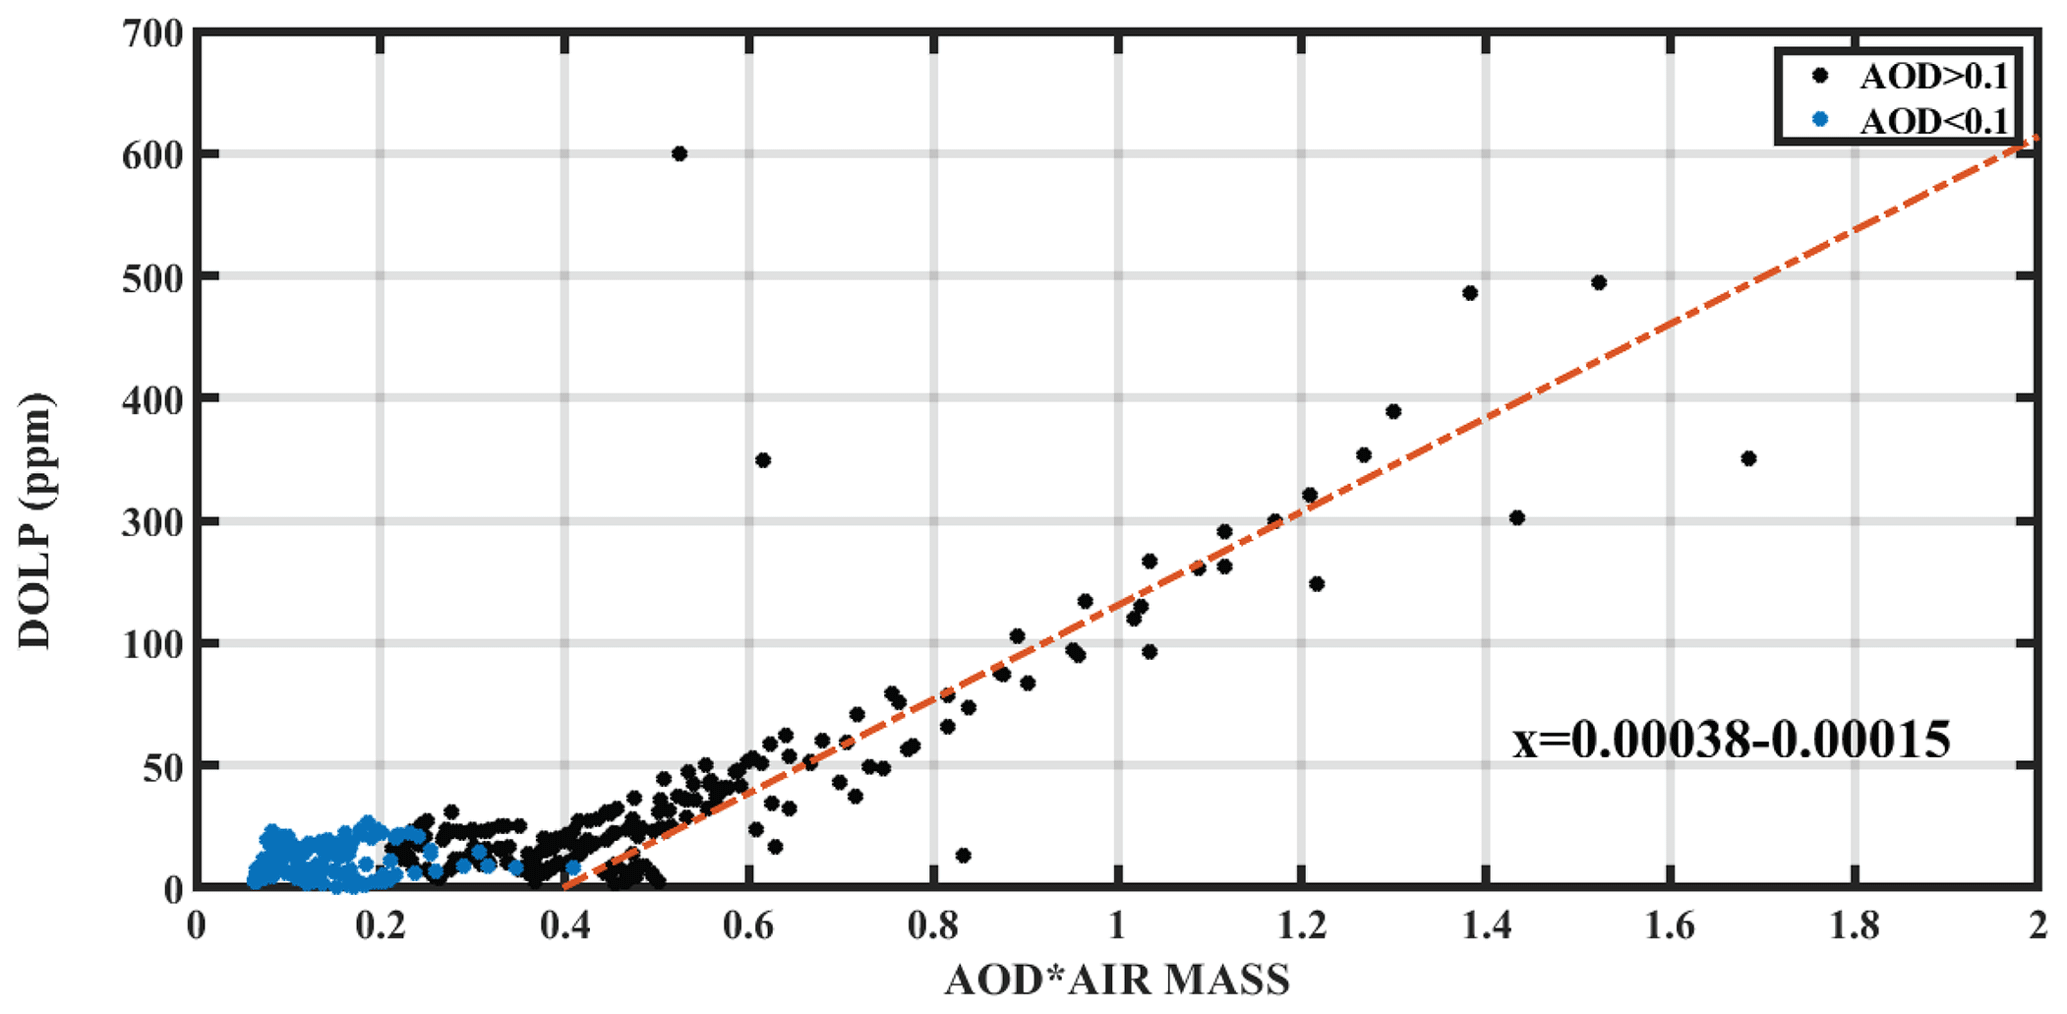
Figure 9Scatterplot of DOLP as a function of the slant AOD, for the SolPol measurements in Antikythera. The linearity observed on AODs over 0.1 corresponds to DOLP signatures from dust days only.
We expect that for small AOD values (< 0.1) the linear polarization values will be within the noise threshold as derived from the clean-day behaviour, as is the case here; since there are no observed dust events with such small loads, no increasing trends are exhibited (dark blue circles). As the optical depth increases, we observe upward trends in linear polarization for specific SZA values, mainly above 40∘, intensifying in proportion to the AOD, with the highest values of DOLP recorded under heavier dust loads. This indicates that, as expected, dichroic extinction is enhanced due to the presence of a larger concentration of preferentially oriented dust particles for fixed viewing angles and, consequently, for constant air mass, as seen in the linear relation of Fig. 8b. Furthermore, the observed LP is linearly proportional to the air mass, which could be attributed to aligned particle viewing geometry for fixed AODs (since in the instrument frame of reference particles become more aligned for increasing SZA), the number of aligned particles along the line of sight, or both (Fig. 8b). This linear dependence is seen more clearly when we inspect the correlation between DOLP and the AOD corrected with air mass (slant optical depth) in Fig. 9. The dependence exhibits a threshold at AOD values of 0.1, higher values corresponding solely to the presence of dust. As we move to larger dust loads this trend contains cases of increasing linear polarization values even for smaller air masses. The correlation strength could be further tested in future studies with dust loads close to one, as particle orientation could affect the geometric formalism for the derivation of the AOD.
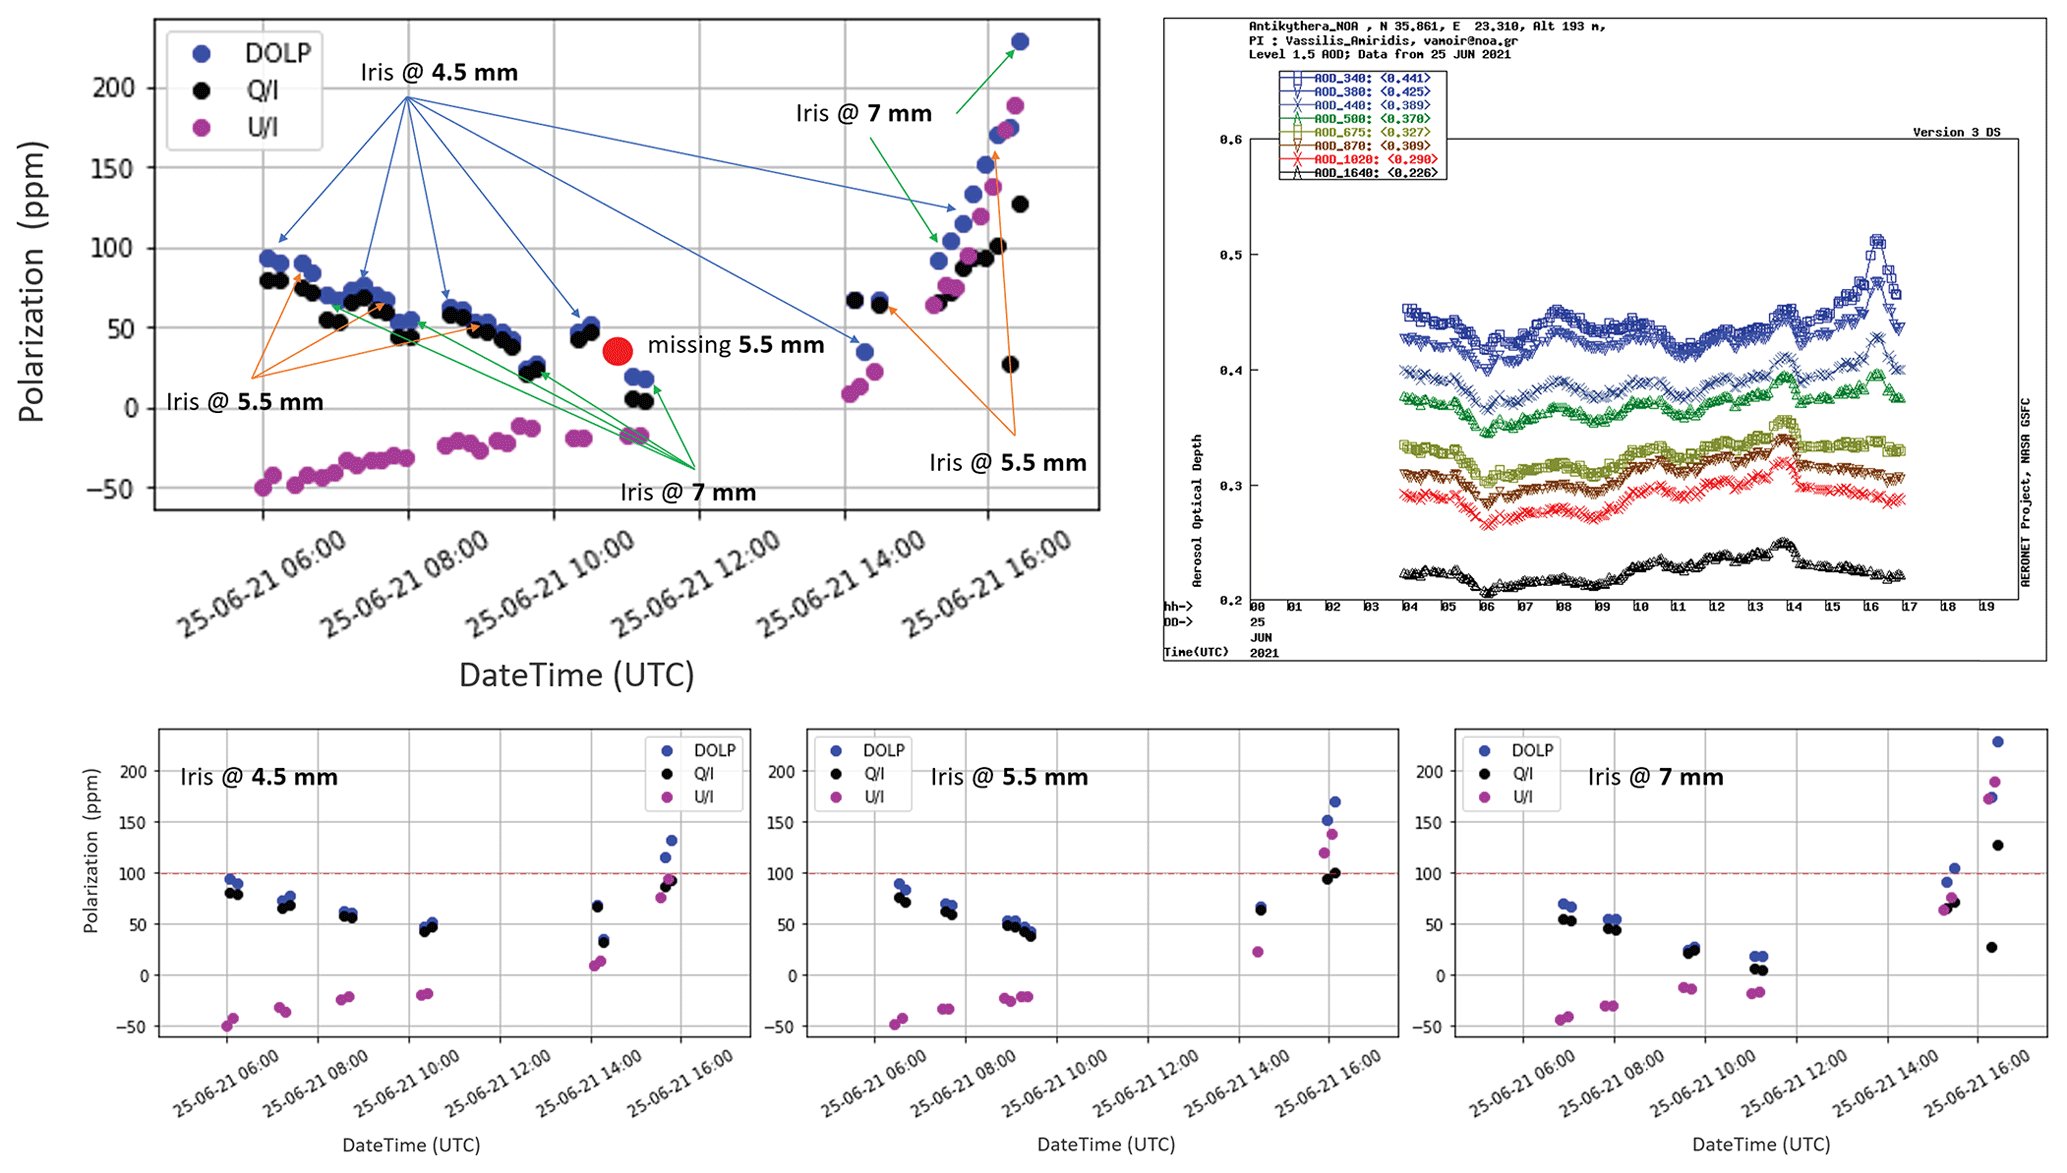
Figure 10Alternating iris size tests for the quantification of diffuse light contribution to the linear polarization observations under the 25 June 2021 dust layer, with an AOD of 0.370 at 500 nm. Top panels present the normalized Q and U Stokes parameters and DOLP, and the different colour arrows denote the respective iris size for each measurement set, along with the AOD progression within the day from AERONET.
We should also note though that the increase of DOLP values with AOD may as well indicate contamination of diffuse light (and corresponding polarization properties) in our direct-sun measurements. Thus, it may as well be that we do not measure (only or at all) dichroic extinction, but linear polarization of the diffuse light, with the contamination being stronger for larger AODs. For this purpose we have performed a test for the influence of the diffuse light in our measurements (Sect. 5.3), and as a future step we plan to perform a more complete test, by acquiring observations of high-AOD pollution cases, where we know that the particles are spherical and thus produce no dichroic extinction.
5.3 Diffuse light contribution
In order to check whether there is a significant contribution to the linear polarization signal attributed to the incoming diffuse light in the polarimeter, we have performed a full day of tests with alternating iris sizes, under a dust event in June 2021 that reached the PANGEA station (Supplement, SolPol manual). When increasing the aperture size, we increase the measured diffuse light, and subsequently the expected contribution to the observed linear polarization will become prominent on the larger iris sizes. During 25 June 2021 measurements, large dust concentrations were present within the day with a homogeneous layer at altitudes up to 5 km, and the optical depth measured by the CIMEL sun photometer was relatively stable with a mean value of 0.370 at 500 nm. The test procedure comprised alternating iris sizes from small (at 4.5 mm), regular (at 5.5 mm, i.e. the one used for regular SolPol measurements), to large (at 7 mm) through 16 min measuring intervals so as to ensure that ambient conditions are relatively stable and polarization does not change significantly with the instrument viewing angle (Fig. 10). The 4.5 mm iris was chosen with respect to a threshold voltage signal to the detector of 1.2 V at large zenith angles. The measuring sequence is consistent with tight observational intervals up until local noon, but then data become sparse due to SolPol peripheral communication failures. All the dark measurements were performed after each triplet with a closed lid, closed dome and a normally tracking mount.
We focus on the early morning to noon measurements, when AOD is relatively constant, and compare the first 7 mm measurement to the following (second individual) 4.5 mm measurement. As seen in Fig. 10, the measured DOLP (black dots) follows a generally decreasing trend from early morning to noon and a generally increasing trend from noon to afternoon, due to the decreasing and increasing SZA, respectively. This behaviour is disrupted when we change the size of the iris for consecutive measurements until noon. When the iris size changes from 7 to 4.5 mm on morning to noon measurements, DOLP increases from larger iris to the smaller iris, while we would expect the opposite to happen in the case of strong contribution from the diffuse light to the linearly polarized light received by the detector. This proves that by increasing the aperture size, DOLP is less than what was initially expected; thus diffuse light does not contribute to the polarization trend. Therefore, the measured linear polarization can be attributed solely to the transmitted sunlight dichroic extinction rather than a diffuse contribution.
We report on extensive linear polarization measurements with a direct-sun polarimeter, the SolPol, and detect signatures of dichroic extinction of sunlight in cases of transient dust layers above the PANGEA observatory, on the island of Antikythera, Greece. This phenomenon could be attributed to potentially preferentially aligned dust particles within the instrument line of sight towards the sun, a concept that reproduces earlier measurements of excess linear polarization of starlight through observations of astronomical sources with known polarization signatures (Bailey et al., 2008; Ulanowski et al., 2007). The similar behaviour, found here, is expressed as a steep increase to the measured DOLP when the sun is far from its zenith position and when significant dust particle load is present in the atmosphere. The increasing trend is not found under conditions that are characteristic of the background aerosol concentrations in the area. We describe the characterization of the instrument capabilities and quantify the measurement bias from the background reference and through dedicated testing days. In addition, we monitor the excess polarization over various dust loads where the linear polarization feature is persistent and extract the dependence on the AOD. We find that as the AOD increases, the linear polarization values become larger overall and, therefore, the increasing trend intensifies for viewing angles closer to the horizon, which is again consistent with the previously highlighted work.
Out of the total 24 d of SolPol observations, pronounced increases of DOLP up to 700 ppm only in the (lidar characterized) dust days have been observed as a function of the AOD (sun photometer measured) and of the air mass. Investigating the polarization angle for most of these days, horizontally and vertically oriented particles can explain both the DOLP increase with solar zenith angle and also the EVPA levels. However, it would require more measurements with well characterized aerosol optical properties to try to generalize on the capabilities of ground-based polarimeters to accurately estimate dust particle orientation. Further work is intended to test the SolPol response on aerosol layers that are not likely to exhibit particle orientation due to the shape of the particles, such as in pollution or smoke layers, and are expected to not affect the polarization of direct light. The anticipated vertically resolved measurements of the novel WALL-E polarization lidar, jointly with the SolPol orientation signatures, can provide strong proof of the existence of oriented aerosol particles in the atmospheric column and elucidate the nature of the alignment process. Our observations have multiple implications for the parameterization of natural dust in aerosol models and for radiative transfer calculations, as particle orientation affects scattering properties. More complementary studies are encouraged as they can pave the way for new aerosol remote sensing developments.
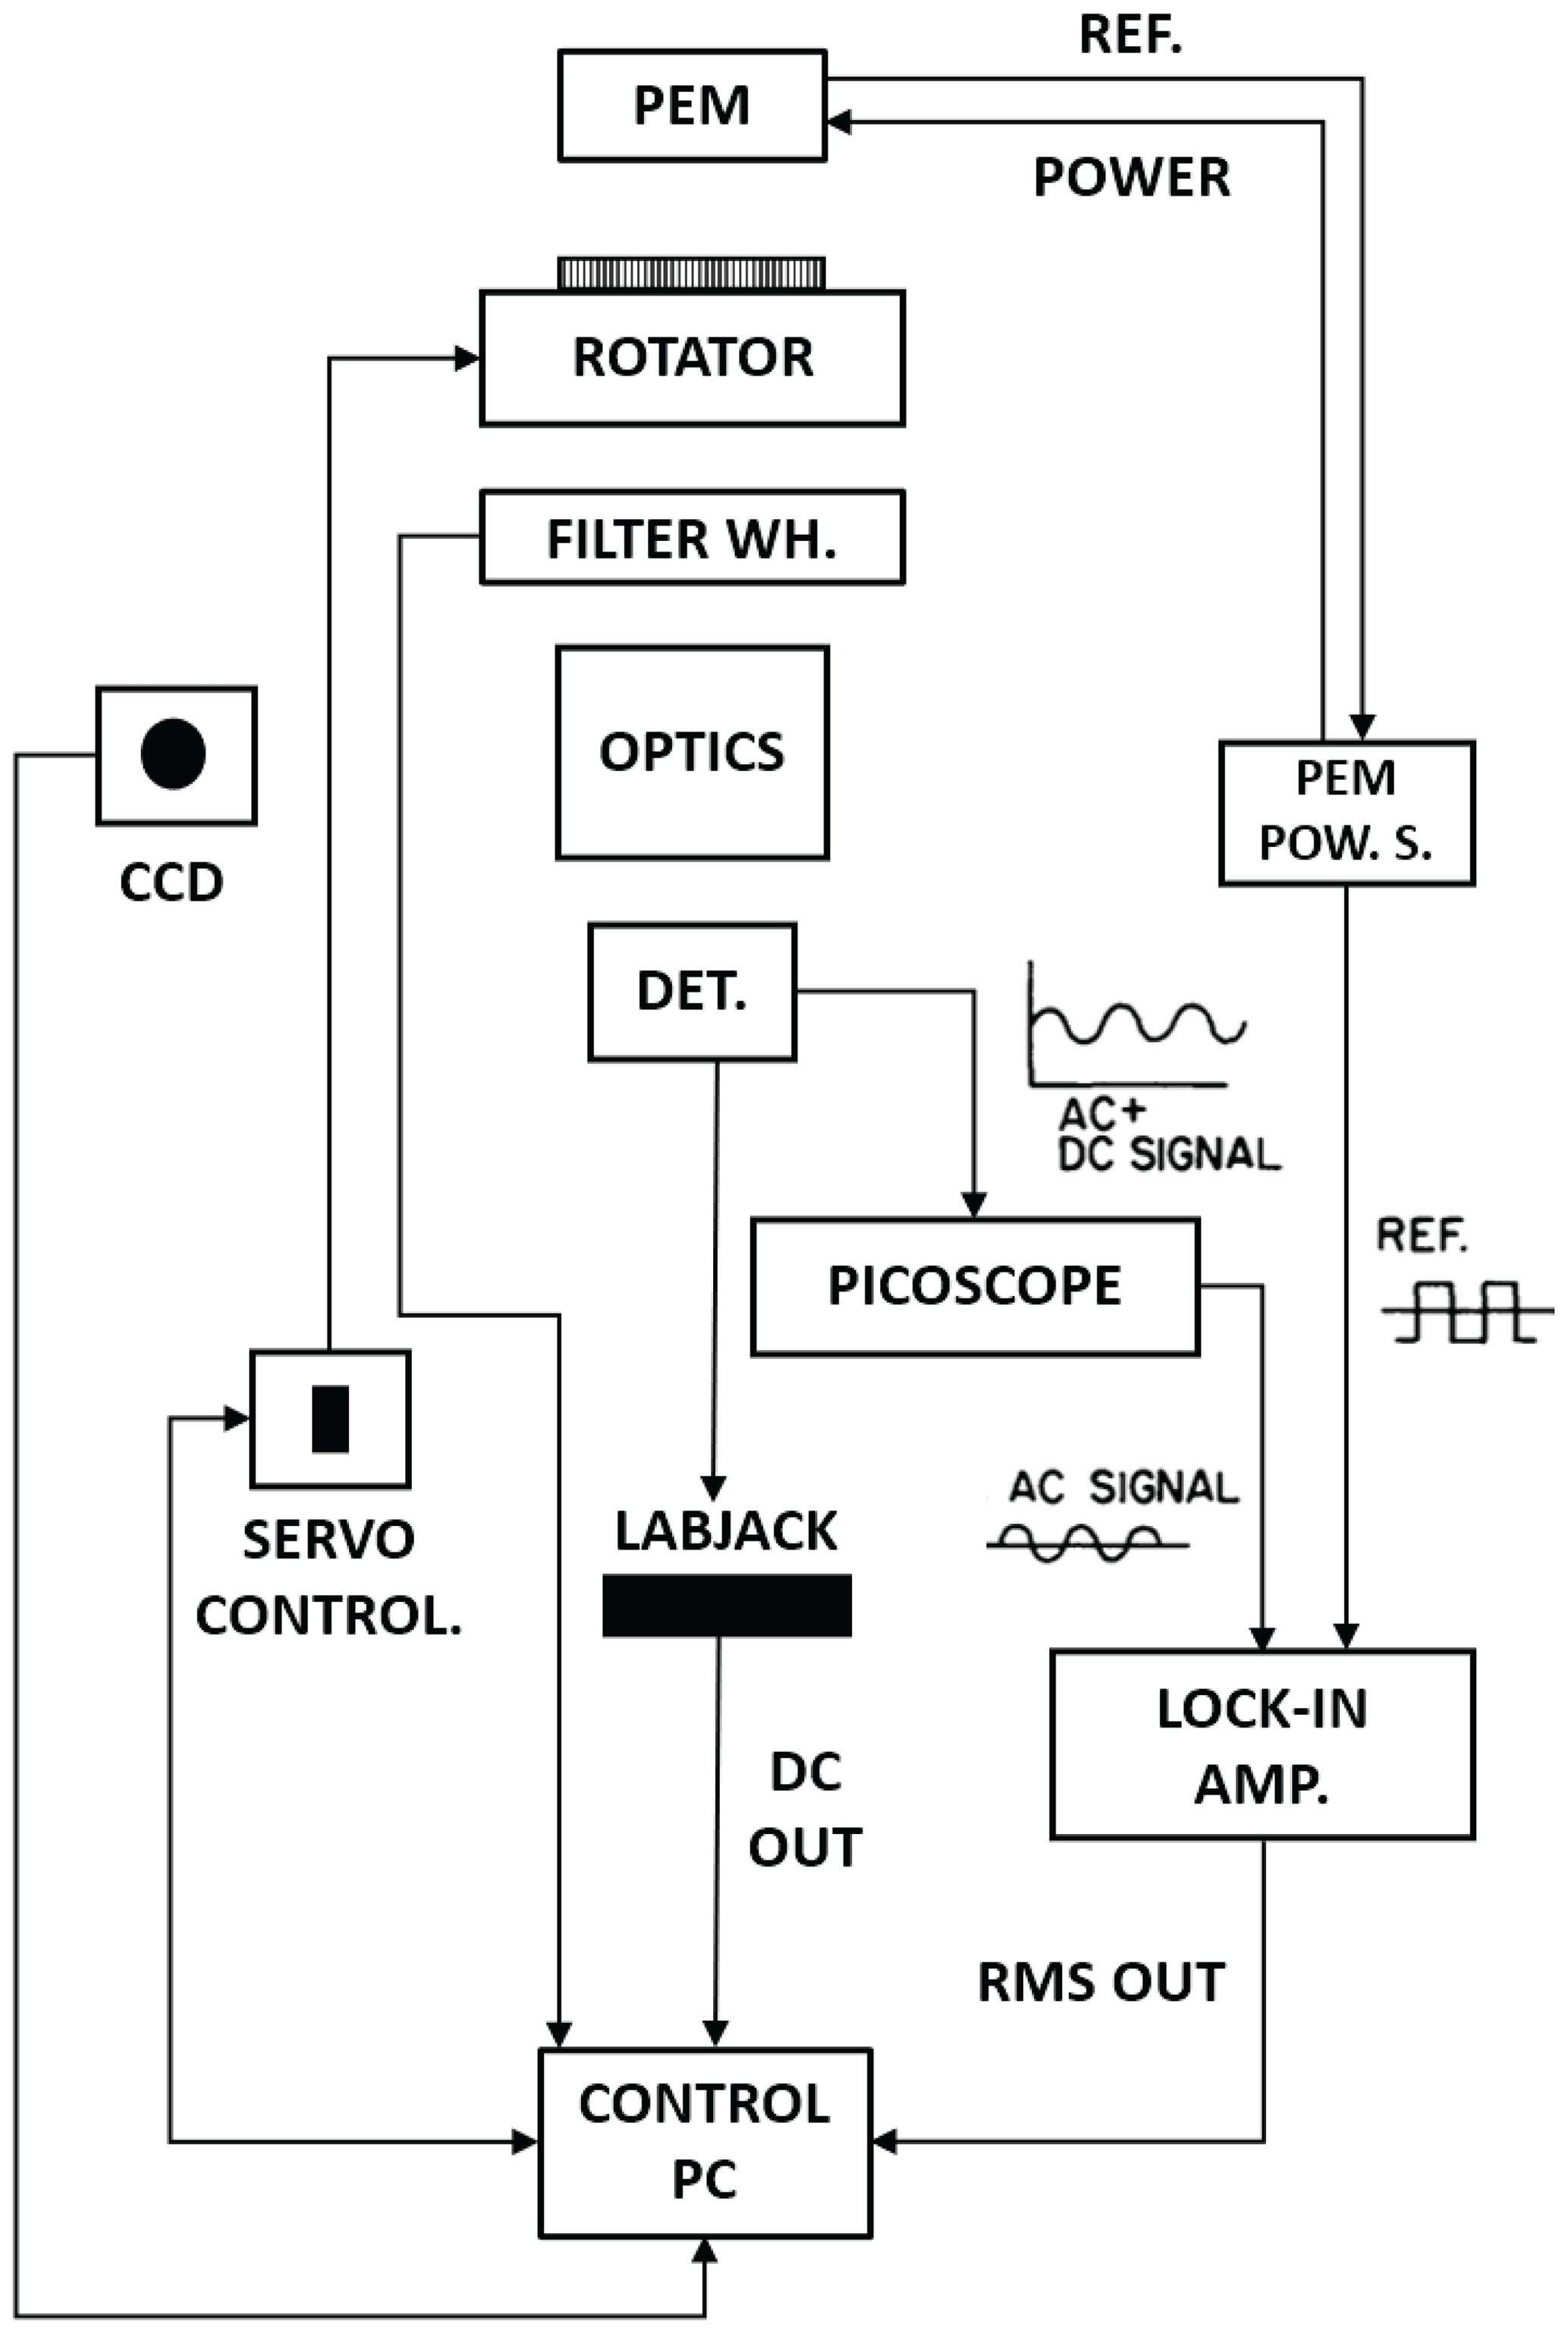
Table A1Measured minimum/maximum dark DC signal intensity and the calculated average value for the selected days of bias correction demonstration.
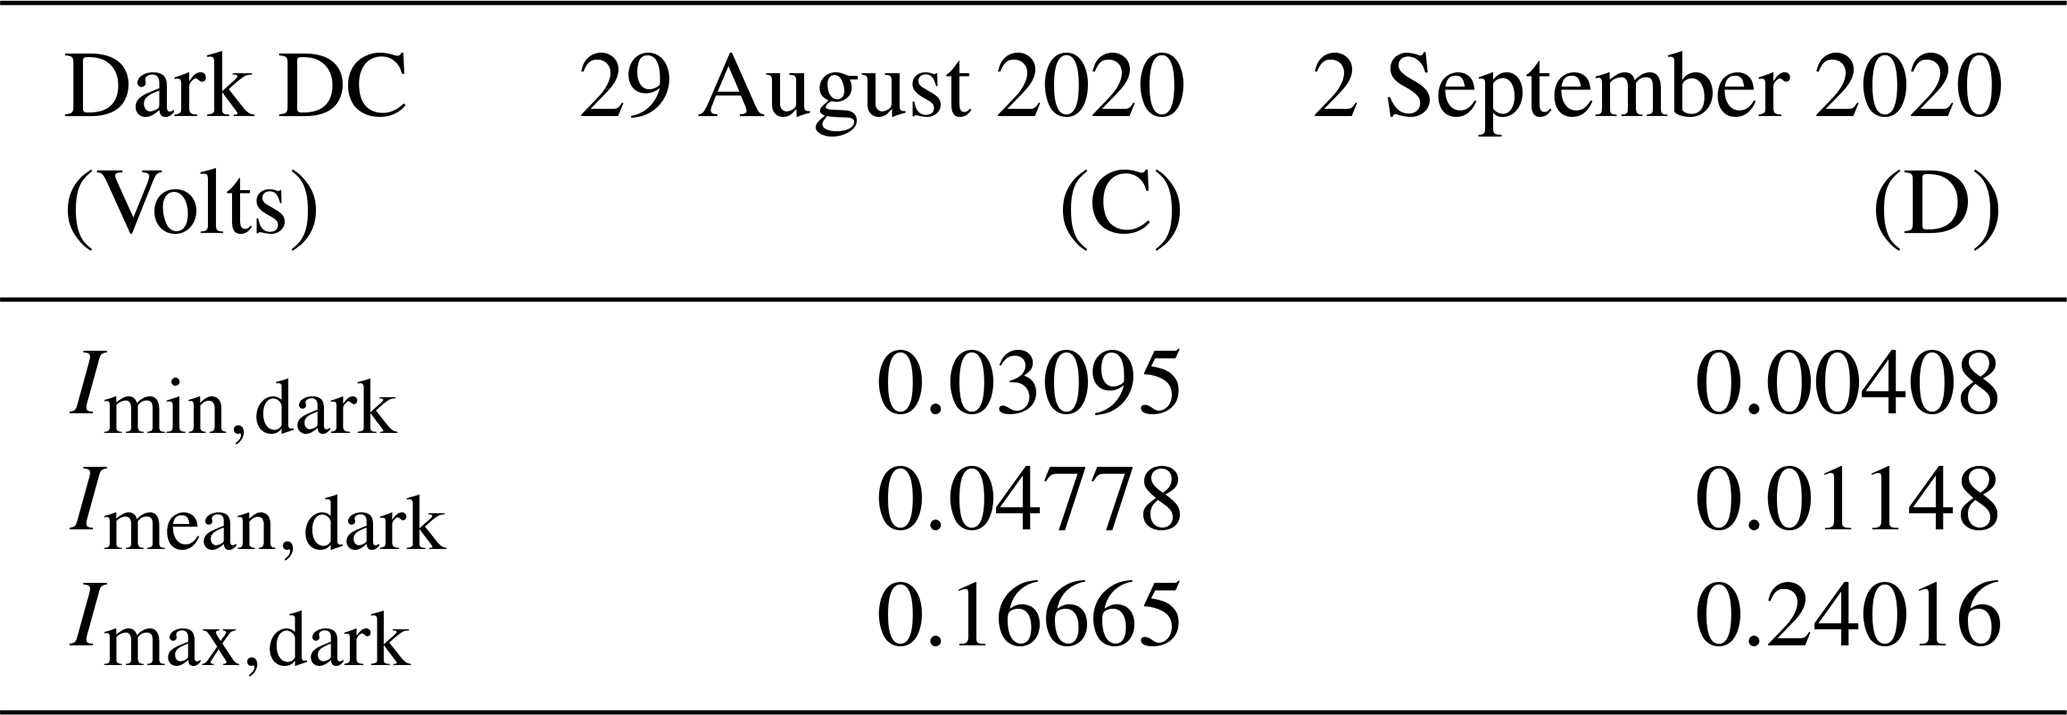
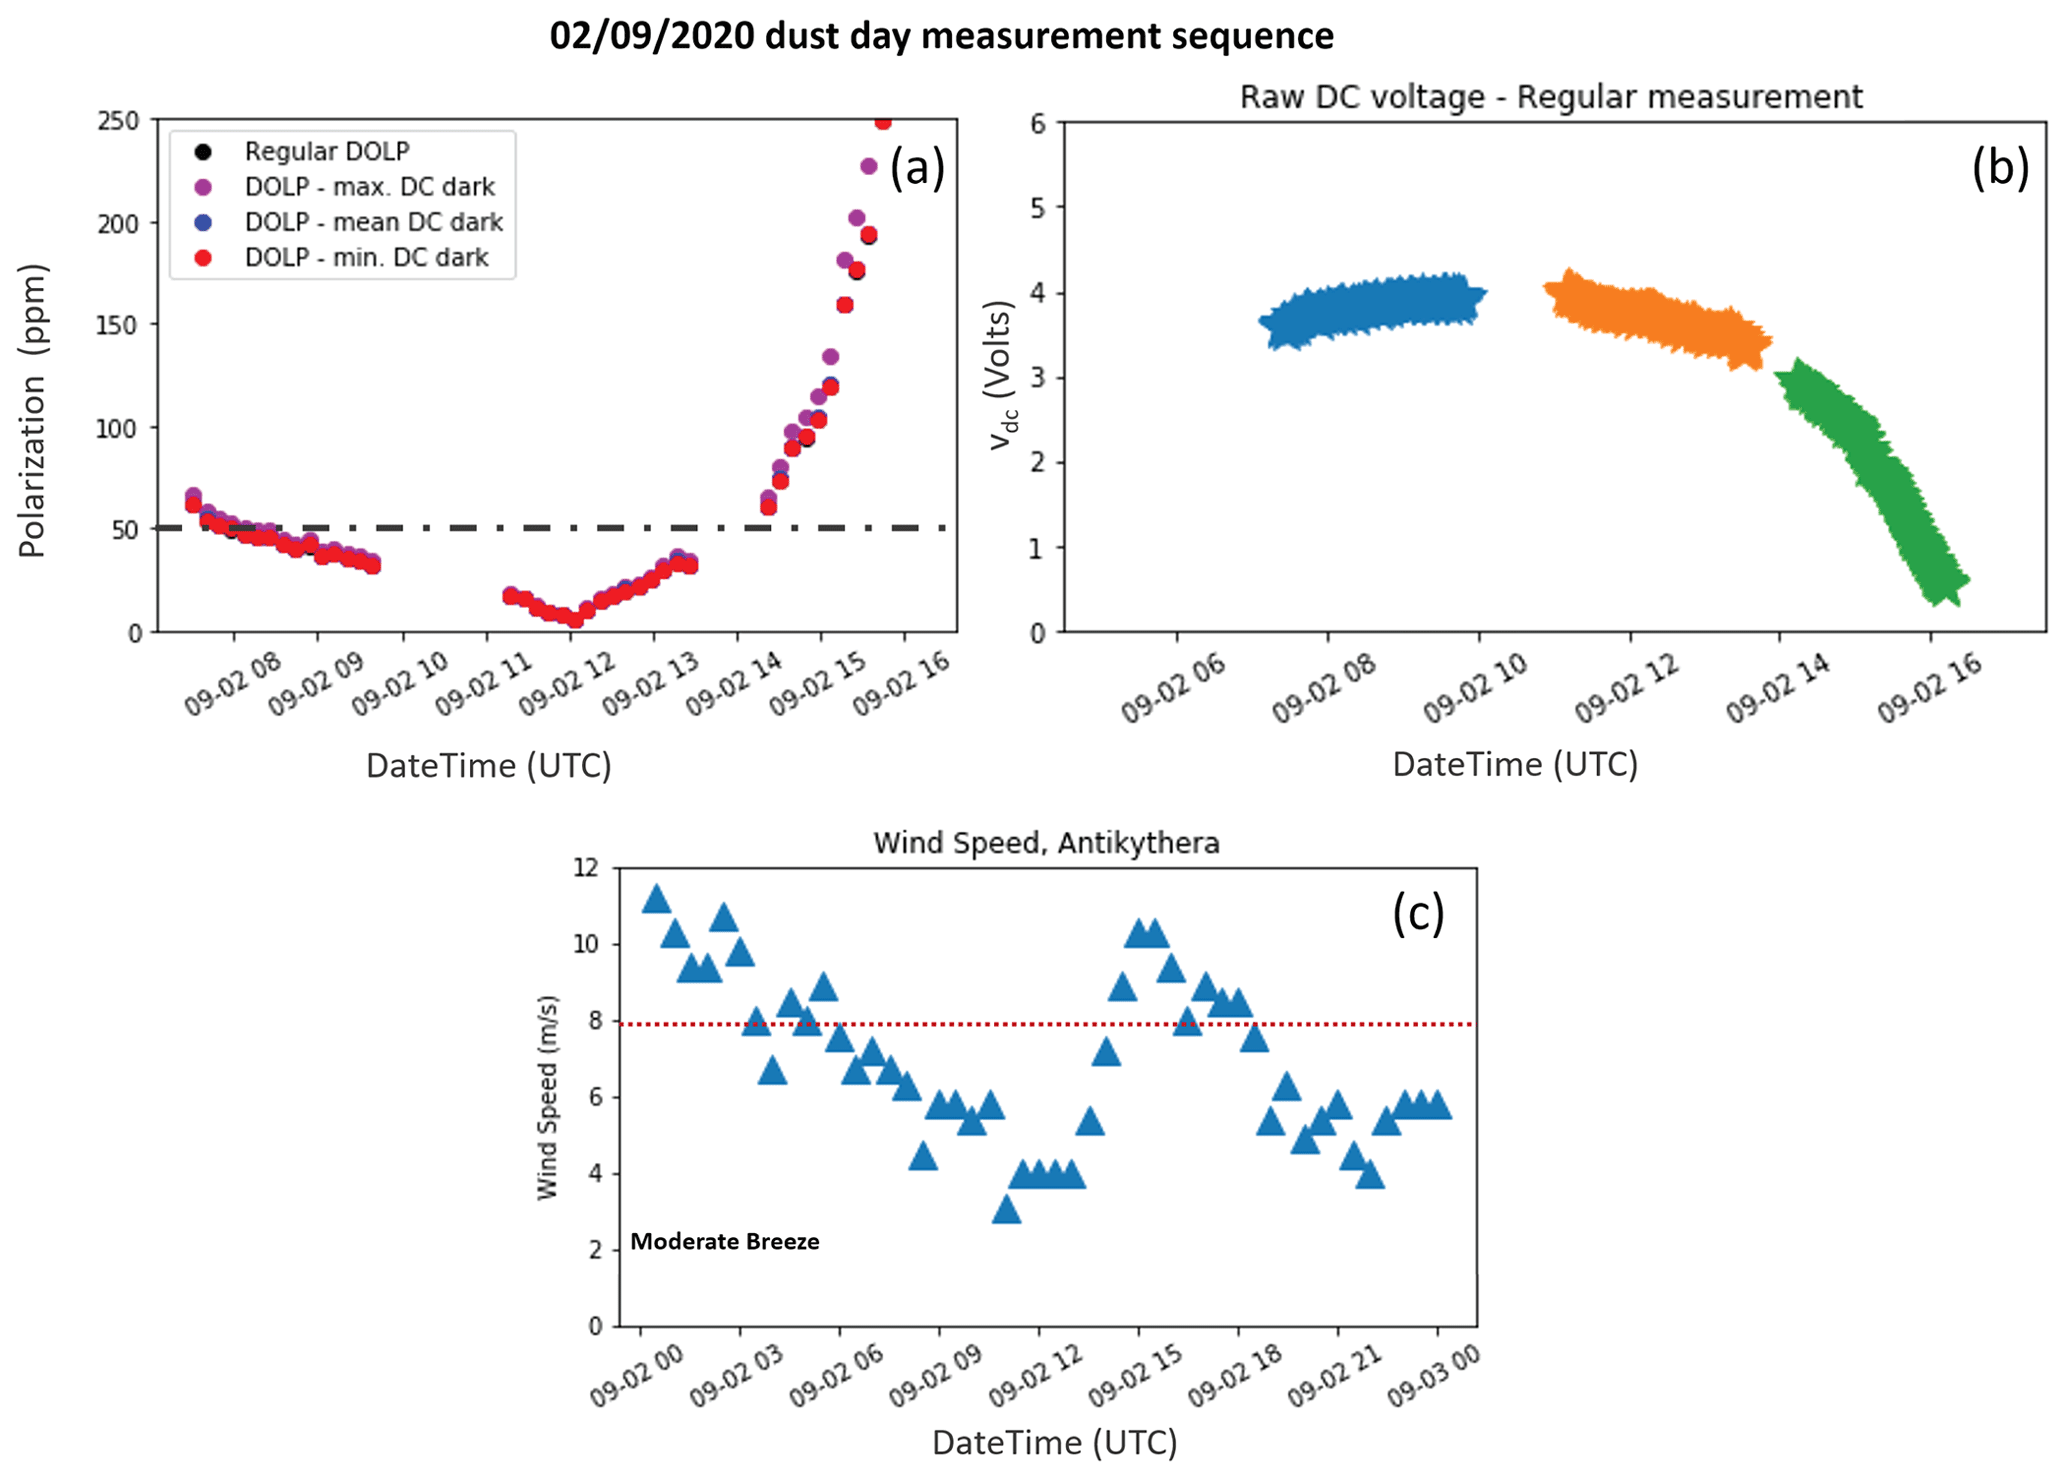
Figure A2SolPol daily measurement on 2 September 2020, spanning from 07:00 to 16:00 UTC at the PANGEA observatory, Antikythera. The specific day is affected by a persistent dust outbreak above the station, has zero percent cloud cover, and consists of a typical dust-driven measurement for the instrument. (a) The DOLP is plotted in parts per million in polarization for four test cases: calculated without subtracting the dark DC voltage for the specific day (black dots), by subtracting the maximum value (purple dots), average (blue dots), and minimum (red dots) values of the dark DC voltage output. The dash-dotted grey line signifies the instrument noise level at 50 ppm, (b) the total incoming sunlight intensity, vDC in volts as recorded by the lock-in amplifier. Different colours signify the corresponding measurement subsets within the day. (c) The recorded wind speed in m s−1 for 30 min averages for the specific day. During the SolPol measurement moderate winds were blowing over the station.
Polarization angle distribution with SZA
Electric vector polarization angle (EVPA) indicates the angle between the plane of polarization and the plane of reference and is defined as (e.g. general expression from Hansen and Travis, 1974)
We are using the normalized and values as the Stokes input parameters and take into account the constraint that the cos 2χ of angles differing by should have the same sign as . In Fig. A3, we present the EVPA in degrees with respect to SZA for the total SolPol measurement days. The EVPAs are separated into two categories: those that correspond to DOLP values less than 50 ppm (noise threshold) and the ones for DOLP values larger than 50 ppm. When examining the EVPAs that correspond to DOLP values greater than 50 ppm (Fig. A3), there is a clear distribution of angles in three clusters at ∼ 20, 70, and 150∘ that remain centred around these angles regardless of the increasing SZA. The linear feature starts for SZAs between 30 and 60∘, which is expected as some dust days exhibit dichroic extinction traits relatively close to zenith viewing angles. If the particles within the light path are oriented with their long axis perpendicular to the major axis of the polarization ellipse, the 20 and 70∘ polarization angles denote particles being preferentially aligned to an angle of 110∘, almost vertically aligned (yellow tab, Fig. A3) and to 160∘, which correspond to being predominantly horizontally aligned (green tab, Fig. A3) and to 60∘ (red tab, Fig. A3).
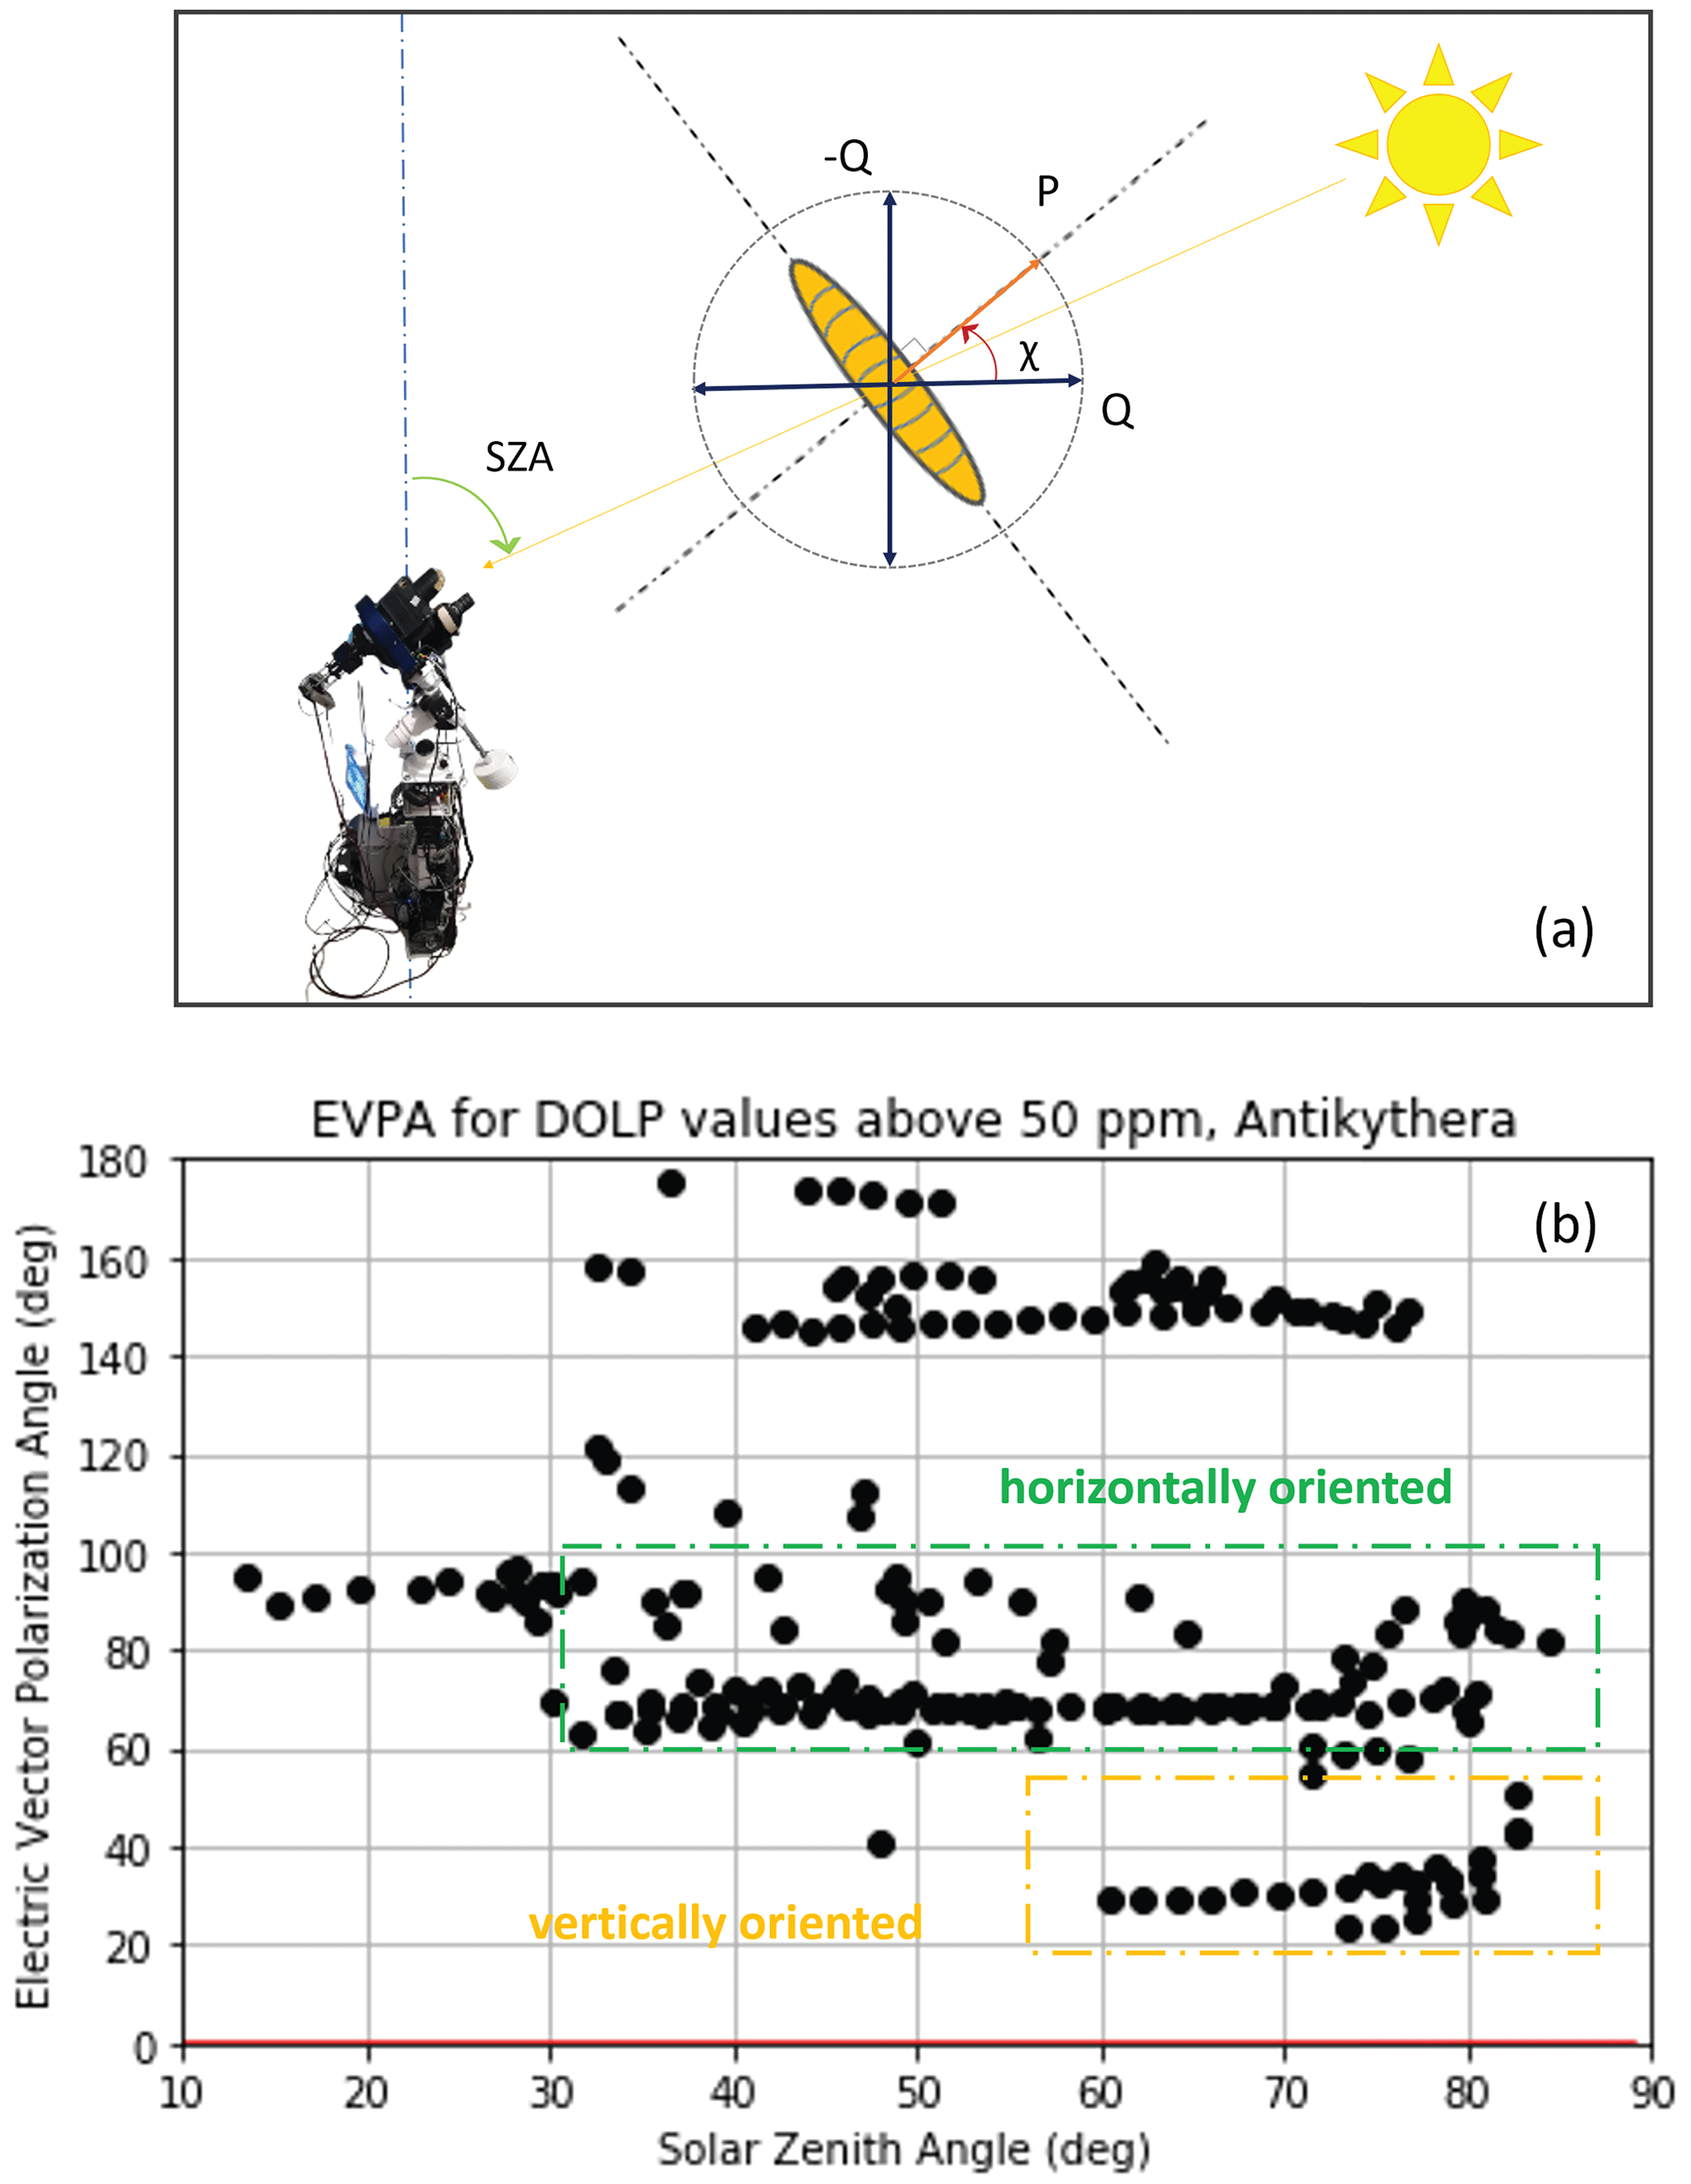
Figure A3(a) SolPol viewing geometry for an elongated dust particle with respect to the solar zenith angle (SZA), (b) electric vector polarization angle (EVPA) in degrees with respect to the SZA for all SolPol measurement days in 2020 and 2021. EVPA angles correspond to DOLP values > 50 ppm. There is a clear distribution of angles in two distinct clusters around 20 and 70∘ that correspond to preferentially vertically (yellow tab) and horizontally (green tab).
All data used for the specific study can be found in the NOA-ReACT Zenodo repository (https://doi.org/10.5281/zenodo.7233498, Daskalopoulou et al., 2022) under CC-BY-SA (CC) rights. A detailed repository with general information about the instrument operation, data curation, and supplementary material is publicly accessible in GitHub: https://github.com/NOA-ReACT/SolPol (Daskalopoulou, 2022; https://doi.org/10.5281/zenodo.8423490, Daskalopoulou, 2023). The present data processing algorithm version written in Python, under GPL-3.0, can also be found in Daskalopoulou (2022).
The supplement related to this article is available online at: https://doi.org/10.5194/amt-16-4529-2023-supplement.
VD installed and operated SolPol in all locations, collected and processed the data, provided physical interpretation to the measurements, authored the instrument manual, and prepared the data repositories and the paper with contributions from all co-authors. VD and PIR tested and optimized the instrument and acquired the measurements shown herein, while AT and VA formulated the measurement strategy. AT also offered her expertise in dust particle orientation for the key physical interpretation of the measurements and manual preparation. VA directed the preparation of the paper, supervised the study, offered his specialty in lidar data interpretation, and gave insight to the linear polarization measurements. SK helped in the realization of the measurement strategy and the paper preparation, offered his expertise in solar radiation measurements, and provided valuable input to the measurement interpretation. ZU offered his expertise in dust polarimetry and unique conceptualization of the phenomena and provided scientific consultation through the entire process. VC provided insightful comments concerning dust orientation signatures. KT provided valuable scientific consultation concerning the acquisition process and the instrument operation as an expert to dust polarimetric observations. Lastly, WM kindly conferred the instrument, co-supervised the study, and provided scientific consultation on data outputs and the processing chain.
At least one of the (co-)authors is a member of the editorial board of Atmospheric Measurement Techniques. The peer-review process was guided by an independent editor, and the authors also have no other competing interests to declare.
Publisher's note: Copernicus Publications remains neutral with regard to jurisdictional claims made in the text, published maps, institutional affiliations, or any other geographical representation in this paper. While Copernicus Publications makes every effort to include appropriate place names, the final responsibility lies with the authors.
The publication is based upon work of COST Action HARMONIA (International network for harmonization of atmospheric aerosol retrievals from ground-based photometers), CA2119, supported by COST (European Cooperation in Science and Technology). The research was supported by data and services obtained from the PANhellenic GEophysical observatory of Antikythera (PANGEA) of NOA. The authors would like to acknowledge support of this work by the project “PANhellenic infrastructure for Atmospheric Composition and climatE change” (MIS 5021516), which is implemented under the action “Reinforcement of the Research and Innovation Infrastructure”, funded by the operational programme “Competitiveness, Entrepreneurship and Innovation” (NSRF 2014–2020) and co-financed by Greece and the European Union (European Regional Development Fund). We are grateful to EARLINET (https://www.earlinet.org/, last access: 16 December 2022) and ACTRIS (https://www.actris.eu, last access: 16 December 2022) for the data collection, calibration, processing, and dissemination. Vasiliki Daskalopoulou would like to thank all the NOA-ReACT members for their help and support during the data retrieval process.
This research has been supported by the State Scholarships Foundation (grant no. MIS-5000432); the European Research Council, H2020 European Research Council (grant nos. 725698 and 771282); COST (European Cooperation in Science and Technology) under the Action CA2119 HARMONIA (International network for harmonization of atmospheric aerosol retrievals from ground-based photometers); the A. G. Leventis Foundation; the Stavros Niarchos Foundation (SNF); ACTRIS-CH (Aerosol, Clouds and Trace Gases Research Infrastructure – Swiss contribution) funded by the State Secretariat for Education, Research, and Innovation, Switzerland; and the Foundation of Research and Technology – Hellas Synergy Grants Program through project POLAR, jointly implemented by the Institute of Astrophysics and the Institute of Computer Science.
This paper was edited by Andrew Sayer and reviewed by two anonymous referees.
Adebiyi, A. A. and Kok, J. F.: Climate models miss most of the coarse dust in the atmosphere, Sci. Adv., 6, 1–9, https://doi.org/10.1126/sciadv.aaz9507, 2020.
Adebiyi, A. A., Kok, J. F., Murray, B. J., Ryder, C. L., Stuut, J.-B. W., Kahn, R. A., Knippertz, P., Formenti, P., Mahowald, N. M., Pérez García-Pando, C., Klose, M., Ansmann, A., Samset, B. H., Ito, A., Balkanski, Y., Di Biagio, C., Romanias, M. N., Huang, Y., and Meng, J.: A review of coarse mineral dust in the Earth system, Aeolian Res., 60, 100849, https://doi.org/10.1016/j.aeolia.2022.100849, 2023.
Andersson, B.-G., Lazarian, A., and Vaillancourt, J. E.: Interstellar Dust Grain Alignment, Annu. Rev. Astron. Astrophys., 53, 501–539, https://doi.org/10.1146/annurev-astro-082214-122414, 2015.
Bailey, J., Ulanowski, Z., Lucas, P. W., Hough, J. H., Hirst, E., and Tamura, M.: The effect of airborne dust on astronomical polarization measurements, Mon. Not. R. Astron. Soc., 386, 1016–1022, https://doi.org/10.1111/j.1365-2966.2008.13088.x, 2008.
Baran, A. J.: On the scattering and absorption properties of cirrus cloud, J. Quant. Spectrosc. Ra., 89, 17–36, https://doi.org/10.1016/j.jqsrt.2004.05.008, 2004.
Bohren, C. F.: Multiple scattering of light and some of its observable consequences, Am. J. Phys., 55, 524–533, https://doi.org/10.1119/1.15109, 1987.
Dasgupta Ajou, K.: Grain alignment in the intergalactic magnetic field, Astrophys. Space Sci., 91, 395–406, 1983.
Daskalopoulou, V.: SolPol data algorithm, GitHub [code], https://github.com/NOA-ReACT/SolPol (last access: 9 October 2023), 2022.
Daskalopoulou, V.: NOA-ReACT/SolPol: SolPol release prior to AMT publication (v1.0), Zenodo [code], https://doi.org/10.5281/zenodo.8423490, 2023.
Daskalopoulou, V., Mallios, S. A., Ulanowski, Z., Hloupis, G., Gialitaki, A., Tsikoudi, I., Tassis, K., and Amiridis, V.: The electrical activity of Saharan dust as perceived from surface electric field observations, Atmos. Chem. Phys., 21, 927–949, https://doi.org/10.5194/acp-21-927-2021, 2021a.
Daskalopoulou, V., Hloupis, G., Mallios, S. A., Makrakis, I., Skoubris, E., Kezoudi, M., Ulanowski, Z., and Amiridis, V.: Vertical profiling of the electrical properties of charged desert dust during the pre-ASKOS campaign, in: 15th COMECAP, 26–29 September 2021, Ioannina, Greece, 204–208, ISBN 978-960-233-267-2, 2021b.
Daskalopoulou, V., Raptis, P. I., Tsekeri, A., Amiridis, V., Kazadzis, S., Ulanowski, Z., Charmandaris, V., Tassis, K., and Martin, W.: D-TECT: SolPol measurements, Zenodo [data set], https://doi.org/10.5281/zenodo.7233498, 2022.
Drakaki, E., Amiridis, V., Tsekeri, A., Gkikas, A., Proestakis, E., Mallios, S., Solomos, S., Spyrou, C., Marinou, E., Ryder, C. L., Bouris, D., and Katsafados, P.: Modeling coarse and giant desert dust particles, Atmos. Chem. Phys., 22, 12727–12748, https://doi.org/10.5194/acp-22-12727-2022, 2022.
Dubovik, O., Sinyuk, A., Lapyonok, T., Holben, B. N., Mishchenko, M., Yang, P., Eck, T. F., Volten, H., Muñoz, O., Veihelmann, B., van der Zande, W. J., Leon, J.-F., Sorokin, M., and Slutsker, I.: Application of spheroid models to account for aerosol particle nonsphericity in remote sensing of desert dust, J. Geophys. Res., 111, D11208, https://doi.org/10.1029/2005JD006619, 2006.
Emde, C., Buehler, S. A., Davis, C., Eriksson, P., Sreerekha, T. R., and Teichmann, C.: A polarized discrete ordinate scattering model for simulations of limb and nadir long-wave measurements in 1-D/3-D spherical atmospheres, J. Geophys. Res.-Atmos., 109, 1–20, https://doi.org/10.1029/2004JD005140, 2004.
Emde, C., Buras-Schnell, R., Sterzik, M., and Bagnulo, S.: Influence of aerosols, clouds, and sunglint on polarization spectra of Earthshine, Astron. Astrophys., 605, 1–15, https://doi.org/10.1051/0004-6361/201629948, 2017.
Engelmann, R., Kanitz, T., Baars, H., Heese, B., Althausen, D., Skupin, A., Wandinger, U., Komppula, M., Stachlewska, I. S., Amiridis, V., Marinou, E., Mattis, I., Linné, H., and Ansmann, A.: The automated multiwavelength Raman polarization and water-vapor lidar PollyXT: the neXT generation, Atmos. Meas. Tech., 9, 1767–1784, https://doi.org/10.5194/amt-9-1767-2016, 2016.
Freudenthaler, V.: About the effects of polarising optics on lidar signals and the Δ90 calibration, Atmos. Meas. Tech., 9, 4181–4255, https://doi.org/10.5194/amt-9-4181-2016, 2016.
Freudenthaler, V., Esselborn, M., Wiegner, M., Heese, B., Tesche, M., Ansmann, A., Müller, D., Althausen, D., Wirth, M., Fix, A., Ehret, G., Knippertz, P., Toledano, C., Gasteiger, J., Garhammer, M., and Seefeldner, M.: Depolarization ratio profiling at several wavelengths in pure Saharan dust during SAMUM 2006, Tellus B, 61, 165–179, https://doi.org/10.1111/j.1600-0889.2008.00396.x, 2009.
Gassó, S. and Knobelspiesse, K. D.: Circular polarization in atmospheric aerosols, Atmos. Chem. Phys., 22, 13581–13605, https://doi.org/10.5194/acp-22-13581-2022, 2022.
Gasteiger, J., Wiegner, M., Groß, S., Freudenthaler, V., Toledano, C., Tesche, M., and Kandler, K.: Modelling lidar-relevant optical properties of complex mineral dust aerosols, Tellus B, 63, 725–741, https://doi.org/10.1111/j.1600-0889.2011.00559.x, 2011.
Ginoux, P.: Effects of nonsphericity on mineral dust modeling, J. Geophys. Res.-Atmos., 108, 4052, https://doi.org/10.1029/2002jd002516, 2003.
Guan, L., Li, S., Zhai, L., Liu, S., Liu, H., Lin, W., Cui, Y., Chu, J., and Xie, H.: Study on skylight polarization patterns over the ocean for polarized light navigation application, Appl. Optics, 57, 6243, https://doi.org/10.1364/ao.57.006243, 2018.
Gueymard, C. A.: Temporal variability in direct and global irradiance at various time scales as affected by aerosols, Sol. Energy, 86, 3544–3553, https://doi.org/10.1016/j.solener.2012.01.013, 2012.
Haarig, M., Ansmann, A., Althausen, D., Klepel, A., Groß, S., Freudenthaler, V., Toledano, C., Mamouri, R.-E., Farrell, D. A., Prescod, D. A., Marinou, E., Burton, S. P., Gasteiger, J., Engelmann, R., and Baars, H.: Triple-wavelength depolarization-ratio profiling of Saharan dust over Barbados during SALTRACE in 2013 and 2014, Atmos. Chem. Phys., 17, 10767–10794, https://doi.org/10.5194/acp-17-10767-2017, 2017.
Hansen, J. E. and Travis, L. D.: Light scattering in planetary atmospheres, Space Sci. Rev., 16, 527–610, https://doi.org/10.1007/BF00168069, 1974.
Hough, J. H., Lucas, P. W., Bailey, J. A., Tamura, M., Hirst, E., Harrison, D., and Bartholomew-Biggs, M.: PlanetPol: A Very High Sensitivity Polarimeter, Publ. Astron. Soc. Pacific, 118, 1302–1318, https://doi.org/10.1086/507955, 2006.
Huang, Y., Adebiyi, A. A., Formenti, P., and Kok, J. F.: Linking the Different Diameter Types of Aspherical Desert Dust Indicates That Models Underestimate Coarse Dust Emission, Geophys. Res. Lett., 48, 1–12, https://doi.org/10.1029/2020GL092054, 2021.
Kemp, J. C. and Barbour, M.: A Photoelastic-Modulator Polarimeter At Pine Mountain Observatory, Publ. Astron. Soc. Pacific, 93, 521–525, 1981.
Kemp, J. C., Henson, G. D., Steiner, C. T., and Powell, E. R.: The optical polarization of the Sun measured at a sensitivity of parts in ten million, Nature, 326, 270–273, https://doi.org/10.1038/326270a0, 1987.
Klett, J. D.: Orientation Model for Particles in Turbulence, J. Atmos. Sci., 52, 2276–2285, 1995.
Kolokolova, L. and Nagdimunov, L.: Comparative analysis of polarimetric signatures of aligned and optically active (“homochiral”) dust particles, Planet. Space Sci., 100, 57–63, https://doi.org/10.1016/j.pss.2014.01.002, 2014.
Lazarian, A.: Tracing magnetic fields with aligned grains, J. Quant. Spectrosc. Ra., 106, 225–256, https://doi.org/10.1016/j.jqsrt.2007.01.038, 2007.
Lelieveld, J., Berresheim, H., Borrmann, S., Crutzen, P. J., Dentener, F. J., Fischer, H., Feichter, J., Flatau, P. J., Heland, J., Holzinger, R., Korrmann, R., Lawrence, M. G., Levin, Z., Markowicz, K. M., Mihalopoulos, N., Minikin, A., Ramanathan, V., De Reus, M., Roelofs, G. J., Scheeren, H. A., Sciare, J., Schlager, H., Schultz, M., Siegmund, P., Steil, B., Stephanou, E. G., Stier, P., Traub, M., Warneke, C., Williams, J., and Ziereis, H.: Global air pollution crossroads over the Mediterranean, Science, 298, 794–799, https://doi.org/10.1126/science.1075457, 2002.
Li, S., Wang, R., Dai, C., Xu, W., and Zhan, J.: The impact of aerosols on the polarization patterns of full-sky background radiation, Opt. Express, 31, 19918–19930, https://doi.org/10.1364/oe.492041, 2023.
Li, X., Maring, H., Savoie, D., Voss, K., and Prospero, J. M.: Dominance of mineral dust in aerosol light-scattering in the North Atlantic trade winds, Nature, 380, 416–419, https://doi.org/10.1038/380416a0, 1996.
Mallios, S. A., Drakaki, E., and Amiridis, V.: Effects of dust particle sphericity and orientation on their gravitational settling in the earth's atmosphere, J. Aerosol Sci., 150, 105634, https://doi.org/10.1016/j.jaerosci.2020.105634, 2020.
Mallios, S. A., Daskalopoulou, V., and Amiridis, V.: Orientation of non spherical prolate dust particles moving vertically in the Earth's atmosphere, J. Aerosol Sci., 151, 105657, https://doi.org/10.1016/j.jaerosci.2020.105657, 2021.
Mallios, S. A., Daskalopoulou, V., and Amiridis, V.: Modeling of the electrical interaction between desert dust particles and the Earth's atmosphere, J. Aerosol Sci., 165, 106044, https://doi.org/10.1016/j.jaerosci.2022.106044, 2022.
Martin, W. E., Hesse, E., Hough, J. H., Sparks, W. B., Cockell, C. S., Ulanowski, Z., Germer, T. A., and Kaye, P. H.: Polarized optical scattering signatures from biological materials, J. Quant. Spectrosc. Ra., 111, 2444–2459, https://doi.org/10.1016/j.jqsrt.2010.07.001, 2010.
Martin, W. E., Hesse, E., Hough, J. H., and Gledhill, T. M.: High-sensitivity Stokes spectropolarimetry on cyanobacteria, J. Quant. Spectrosc. Ra., 170, 131–141, https://doi.org/10.1016/j.jqsrt.2015.10.014, 2016.
Miller, R. L. and Tegen, I.: Climate response to soil dust aerosols, J. Climate, 11, 3247–3267, https://doi.org/10.1175/1520-0442(1998)011<3247:CRTSDA>2.0.CO;2, 1998.
Miller, R. L., Knippertz, P., Pérez García-Pando, C., Perlwitz, J. P., and Tegen, I.: Impact of dust radiative forcing upon climate, in: Mineral Dust: A Key Player in the Earth System, edited by: Knippertz, P. and Stuut, J.-B. W., Springer, Dordrecht, the Netherlands, 327–357, https://doi.org/10.1007/978-94-017-8978-3_13, 2014.
Nicoll, K. A., Harrison, R. G., and Ulanowski, Z.: Observations of Saharan dust layer electrification, Environ. Res. Lett., 6, 1–8, https://doi.org/10.1088/1748-9326/6/1/014001, 2011.
Pan, P., Wang, X., Yang, T., Pu, X., Wang, W., Bao, C., and Gao, J.: High-similarity analytical model of skylight polarization pattern based on position variations of neutral points, Opt. Express, 31, 15189, https://doi.org/10.1364/oe.489534, 2023.
Povel, H.-P.: Imaging Stokes polarimetry with piezoelastic modulators and charge-coupled-device image sensors, Opt. Eng., 34 1870, https://doi.org/10.1117/12.200596, 1995.
Saidou Chaibou, A. A., Ma, X., and Sha, T.: Dust radiative forcing and its impact on surface energy budget over West Africa, Sci. Rep., 10, 1–18, https://doi.org/10.1038/s41598-020-69223-4, 2020.
Saito, M. and Yang, P.: Advanced Bulk Optical Models Linking the Backscattering and Microphysical Properties of Mineral Dust Aerosol, Geophys. Res. Lett., 48, 1–12, https://doi.org/10.1029/2021GL095121, 2021.
Siebenmorgen, R., Voshchinnikov, N. V., and Bagnulo, S.: Dust in the diffuse interstellar medium Extinction, emission, linear and circular polarisation, Astron. Astrophys., 561, A82, https://doi.org/10.1051/0004-6361/201321716, 2014.
Skalidis, R. and Tassis, K.: High-accuracy estimation of magnetic field strength in the interstellar medium from dust polarization, arXiv [preprint], https://doi.org/10.48550/arXiv.2010.15141, 28 October 2020.
Stenflo, J. O.: Polarization of the Sun's continuous spectrum, Astron. Astrophys., 429, 713–730, https://doi.org/10.1051/0004-6361:20041667, 2005.
Tegen, I., Hollrig, P., Chin, M., Fung, I., Jacob, D., and Penner, J.: Contribution of different aerosol species to the global aerosol extinction optical thickness: Estimates from model results, J. Geophys. Res.-Atmos., 102, 23895–23915, https://doi.org/10.1029/97jd01864, 1997.
Tsekeri, A., Amiridis, V., Louridas, A., Georgoussis, G., Freudenthaler, V., Metallinos, S., Doxastakis, G., Gasteiger, J., Siomos, N., Paschou, P., Georgiou, T., Tsaknakis, G., Evangelatos, C., and Binietoglou, I.: Polarization lidar for detecting dust orientation: system design and calibration, Atmos. Meas. Tech., 14, 7453–7474, https://doi.org/10.5194/amt-14-7453-2021, 2021.
Ulanowski, Z., Hesse, E., Kaye, P. H., and Baran, A. J.: Light scattering by complex ice-analogue crystals, J. Quant. Spectrosc. Ra., 100, 382–392, https://doi.org/10.1016/j.jqsrt.2005.11.052, 2006.
Ulanowski, Z., Bailey, J., Lucas, P. W., Hough, J. H., and Hirst, E.: Alignment of atmospheric mineral dust due to electric field, Atmos. Chem. Phys., 7, 6161–6173, https://doi.org/10.5194/acp-7-6161-2007, 2007.
Van de Hulst, H. C.: Light Scattering by Small Particles, John Wiley and Sons, New York, Chapman and Hall, London, https://doi.org/10.1063/1.3060205, 1957.
Veselovskii, I., Goloub, P., Podvin, T., Bovchaliuk, V., Derimian, Y., Augustin, P., Fourmentin, M., Tanre, D., Korenskiy, M., Whiteman, D. N., Diallo, A., Ndiaye, T., Kolgotin, A., and Dubovik, O.: Retrieval of optical and physical properties of African dust from multiwavelength Raman lidar measurements during the SHADOW campaign in Senegal, Atmos. Chem. Phys., 16, 7013–7028, https://doi.org/10.5194/acp-16-7013-2016, 2016.
Veselovskii, I., Hu, Q., Goloub, P., Podvin, T., Korenskiy, M., Derimian, Y., Legrand, M., and Castellanos, P.: Variability in lidar-derived particle properties over West Africa due to changes in absorption: towards an understanding, Atmos. Chem. Phys., 20, 6563–6581, https://doi.org/10.5194/acp-20-6563-2020, 2020.
- Abstract
- Introduction
- SolPol: components and principles of operation
- Data and methodology
- Observations
- Analysis and discussion
- Conclusions
- Appendix A
- Code and data availability
- Author contributions
- Competing interests
- Disclaimer
- Acknowledgements
- Financial support
- Review statement
- References
- Supplement