the Creative Commons Attribution 4.0 License.
the Creative Commons Attribution 4.0 License.
 | 12 Oct 2023
Spectral aerosol optical depth from SI-traceable spectral solar irradiance measurements
Julian Gröbner
Natalia Kouremeti
Gregor Hülsen
Ralf Zuber
Mario Ribnitzky
Saulius Nevas
Peter Sperfeld
Kerstin Schwind
Philipp Schneider
Stelios Kazadzis
África Barreto
Tom Gardiner
Kavitha Mottungan
David Medland
Marc Coleman
Spectroradiometric measurements of direct solar irradiance traceable to the SI were performed by three spectroradiometer systems during a 3-week campaign in September 2022 at the Izaña Atmospheric Observatory (IZO) located on the island of Tenerife, Canary Islands, Spain. The spectroradiometers provided direct spectral irradiance measurements in the spectral ranges 300 to 550 nm (QASUME), 550 to 1700 nm (QASUME-IR), 300 to 2150 nm (BiTec Sensor, BTS), and 316 to 1030 nm (Precision Solar Spectroradiometer, PSR), with relative standard uncertainties of 0.7 %, 0.9 %, and 1 % for QASUME/QASUME-IR, the PSR, and the BTS respectively. The calibration of QASUME and QASUME-IR was validated prior to this campaign at Physikalisch-Technische Bundesanstalt (PTB) by measuring the spectral irradiance from two spectral irradiance sources, the high-temperature blackbody BB3200pg as a national primary standard and the tuneable laser facility TULIP. The top-of-atmosphere (ToA) solar irradiance spectra from the spectroradiometers were retrieved from direct solar irradiance measurements using zero-air-mass extrapolation during cloud-free conditions, which were then compared to the TSIS-1 Hybrid Solar Reference Spectrum (HSRS). These ToA solar spectra agreed to within 1 % for spectral ranges longer than 400 nm (for QASUME also at shorter wavelengths) in the spectral regions free of significant trace gas absorption and were well within the combined uncertainties over the full investigated spectral range. Using the results from the comparison with QASUME, the relative standard uncertainty of the TSIS-1 HSRS ToA solar spectrum in the spectral range 308 to 400 nm could be reduced from its nominal 1.3 % to 0.8 %, representing the relative standard uncertainty of the QASUME ToA solar spectrum in this spectral range. The spectral aerosol optical depth (AOD) retrieved from the solar irradiance measurements of these spectroradiometers using the TSIS-1 HSRS as the reference ToA solar spectrum agreed to within 0.01 in optical depth in nearly all common spectral channels of two narrowband filter radiometers belonging to the Global Atmosphere Watch Precision Filter Radiometer (GAW-PFR) network and Aerosol Robotic Network (AERONET). This study shows that it is now possible to retrieve spectral AOD over the extended spectral range from 300 to 1700 nm using solar irradiance measurements traceable to the SI using laboratory-calibrated spectroradiometers with similar quality to that from traditional Langley-based calibrated instruments. The main improvement to previous investigations is the recent availability of the high-spectral-resolution TSIS-1 HSRS with very low uncertainties, which provides the top-of-atmosphere reference for the spectral atmospheric transmission measurements obtained from ground-based solar irradiance measurements.
- Article
(3025 KB) - Full-text XML
-
Supplement
(8966 KB) - BibTeX
- EndNote


Atmospheric aerosols are minor constituents of the atmosphere but an important component in terms of impacts on the climate. Their properties have been recognised as essential climate variables (ECVs) by the Global Climate Observing System (GCOS) of the World Meteorological Organization (WMO). As pointed out in all Intergovernmental Panel on Climate Change (IPCC) reports, aerosols continue to contribute the largest uncertainty to estimates and interpretations of the Earth's changing energy budget (IPCC, 2021). Long-term monitoring of aerosol ECVs including their uncertainties is needed for observing sensitive changes in the Earth climate system. Aerosol optical properties from ground-based passive remote sensing radiometers have been retrieved consistently for the past 20 years.
Current aerosol optical remote sensing networks rely either on a strict calibration hierarchy, based on bilateral comparisons between network and reference instruments (Global Atmosphere Watch Precision Filter Radiometer, GAW-PFR – Kazadzis et al., 2018; Aerosol Robotic Network, AERONET – Holben et al., 1998), or on in situ calibrations of network radiometers without any link to traceable standards (SKYNET; Nakajima et al., 2020). While the latter procedure precludes any form of metrological traceability, the GAW-PFR network and AERONET have well-established procedures for the traceability of network radiometers to their reference radiometers. These radiometers use narrowband interference filters in specifically chosen spectral regions unaffected by strong atmospheric gas absorptions to retrieve the spectral aerosol optical depth from spectral transmission measurements of the atmosphere. The crucial element in this process is knowledge of the solar (or lunar) irradiance at the top of atmosphere (ToA). The established methodology for obtaining the top-of-atmosphere spectral irradiances is through in situ calibrations of the reference radiometers based on zero-air-mass extrapolations (also called Langley-plot procedures) at pristine high-altitude sites (Shaw, 1983; Toledano et al., 2018, and references therein). Then, assuming stability of the radiometers, these are relocated to their respective calibration sites (for example Physikalisch-Meteorologisches Observatorium Davos, World Radiation Center – PMOD/WRC, Davos, Switzerland, for GAW-PFR or Observatoire de Haute-Provence, France, and Valladolid and Izaña, Spain, in the case of AERONET Europe) to transfer their ToA irradiance values to the network radiometers.
This approach is currently the most accurate method for the determination of atmospheric transmission, since only relative measurements of the same instrument are required to obtain the ToA and the surface irradiances (Toledano et al., 2018). The corresponding measurement uncertainty of the atmospheric transmission can be quantified by the variability in the retrieved ToA solar spectrum on subsequent half-days. As discussed by Toledano et al. (2018), the standard error of the mean of the retrieved ToA irradiances can be significantly less than 0.5 %, as also shown later in this study.
However there are several disadvantages to this methodology:
-
The Langley procedure to retrieve the ToA irradiances requires stable atmospheric conditions with constant aerosol optical depth (AOD) during at least 1 half-day to extrapolate the irradiance measurements to zero air mass. The procedure assumes that the atmosphere varies randomly during the calibration period, and a statistical approach is applied to retrieve a representative ToA irradiance from a set of measurements (Toledano et al., 2018). Systematic atmospheric variations (for example in the short ultraviolet due to ozone-related photochemical effects) would go unnoticed and potentially falsify the results (Forgan, 1994; Studer et al., 2014). Furthermore, there is a trade-off between the length of the calibration period and the observed degradation of the instrument, which is difficult to quantify and varies for different instruments.
-
The zero-air-mass extrapolation fails in spectral regions with saturated trace gas absorptions, as for example in the water vapour regions around 930 nm.
-
Metrological traceability of the reference radiometers is lost after their relocation from the high-altitude site to their respective nominal operation sites. The calibration validity is instead assessed through instrument redundancy and assumptions about instrument stability and degradation.
-
Since the irradiance measurements of the radiometers are not traceable to the SI, the solar irradiance measurements themselves cannot be used for quality control or comparisons between instruments.
Since the 1970s, stratospheric balloon, rocket, and then satellite-based experiments have been measuring the top-of-atmosphere spectral solar irradiance with negligible atmospheric absorption. In principle, these ToA solar spectra, given in SI units, typically in W m−2 nm−1, therefore provide directly the ToA irradiances needed to retrieve the atmospheric transmission from calibrated ground-based solar irradiance measurements. However uncertainties in the ToA solar spectra and in the ground-based spectral measurements have so far been too large to achieve the desired uncertainties in atmospheric transmission and thus AOD, when compared to the self-consistent approach based on the zero-air-mass extrapolation for each instrument.
The situation has considerably improved with the advent of fully SI-traceable characterised and calibrated satellite experiments such as TSIS-1, with a combined standard uncertainty of less than 0.25 % (Richard et al., 2020). Furthermore, a hybrid high-spectral-resolution solar spectrum based on TSIS-1 measurements has been constructed to provide ToA solar spectra with standard uncertainties between 0.3 % and 1.3 % over the spectral range from 202 to 2370 nm (Coddington et al., 2021). As discussed in Coddington et al. (2021), the TSIS-1 Hybrid Solar Reference Spectrum (HSRS) agreed to within 0.5 % with the ToA solar spectrum QASUMEFTS obtained from zero-air-mass extrapolations from SI-traceable ground-based solar irradiance measurements with the QASUME spectroradiometer in the spectral range 300 to 500 nm (Gröbner et al., 2017). Furthermore, Kouremeti et al. (2022) have shown that AOD retrieved from SI-traceable solar irradiance measurements with a precision filter radiometer at the spectral channels 368, 412, 500, and 862 nm agreed to within 0.01 when compared with the AOD derived using a Langley-plot-based calibration of the same instrument.
In this study, we will discuss SI-traceable spectral solar irradiance measurements performed with solar spectroradiometers at the high-altitude observatory in Izaña, Tenerife, during a 3-week field campaign in the frame of the project EMPIR 19ENV04 MAPP (“Metrology for aerosol optical properties”). The ToA solar spectra derived from zero-air-mass extrapolations are compared with the TSIS-1 HSRS over the range 300 to 2100 nm. Furthermore, the spectral aerosol optical depths retrieved from using the TSIS-1 HSRS ToA solar irradiances are compared with the AODs from collocated measurements from reference filter radiometers from the GAW-PFR network and AERONET.
The measurements were performed at the Izaña Atmospheric Observatory (IZO) located on the island of Tenerife (Canary Islands, Spain; 28.309∘ N, 16.499∘ W) from 6 to 22 September 2022. IZO is a high mountain station at an elevation of 2373 m above sea level (a.s.l) above a strong subtropical temperature inversion layer, which acts as a natural barrier for local pollution and low-level clouds. The site is a primary calibration site for instruments performing zero-air-mass extrapolations due to its stable atmospheric conditions during most of the year. Based on a long-term climatology of the site, the period of the campaign was selected so as to offer the highest probability for clear skies and stable total column ozone values and a minor probability of Saharan dust intrusions.
The spectroradiometers deployed at this campaign and used in this study are described in the following sub-sections.
2.1 QASUME spectroradiometer
The transportable reference spectroradiometer QASUME is essentially the same instrument as used in a previous campaign in 2016 to retrieve the ToA solar spectrum between 300 and 500 nm (Gröbner et al., 2017). It consists of a scanning double monochromator with a focal length of 150 mm and two gratings of 2400 lines per millimetre, resulting in a full width at half maximum (FWHM) of 0.86 nm. The whole system resides in a temperature-controlled enclosure to allow outdoor operation under varying ambient conditions. The solar radiation is collected with a temperature-stabilised diffuser connected via an optical fibre to the entrance slit of the monochromator. A portable lamp monitoring system allows for the calibration of the whole system while being deployed in the field. A detailed description of the system can be found in Gröbner et al. (2005) and Hülsen et al. (2016). A collimator tube with a full opening angle of 2.5∘ is mounted on an optical tracker to which the diffuser head can be fitted, allowing the measurement of direct solar spectral irradiance.
One significant improvement to the instrument was the addition of a monitor diode at the output of the monochromator to correct for daily hysteresis changes of up to 1 % coming from the photomultiplier. This slightly reduced the uncertainty budget described in Gröbner et al. (2017) from 1.8 % to 1.4 % (expanded relative uncertainty, k=2, representing a coverage probability of 95 % assuming a normal probability distribution). QASUME was calibrated every day using a portable lamp monitoring system with a set of three 250 W tungsten–halogen lamps in order to verify its stability and confirm its traceability to the SI. The calibrations were performed daily and varied by less than ±0.5 % over the course of the campaign.
2.2 QASUME-IR spectroradiometer
The QASUME-IR spectroradiometer consists of a single monochromator with a focal length of 300 mm. Two gratings are used to cover the extended spectral ranges from 550 to 900 nm (1200 lines per millimetre) and 900 to 1700 nm (830 lines per millimetre). The corresponding spectral resolution for these two regions is 1.6 and 2.4 nm (FWHM). The entrance optics consist of an integrating sphere, coupled to the entrance port of the spectroradiometer with an optical quartz fibre. The integrating sphere is connected to a collimator with the same dimensions as used for QASUME to allow measurements of the direct solar irradiance. Two temperature-stabilised photodiodes (silicon-based until 900 nm and InGaAs for the second spectral range) measure the dispersed radiation at the two output slits of the monochromator. The instrument was calibrated daily using the same portable system as used for QASUME, resulting in a similar relative expanded uncertainty of 1.4 % (k=2) apart from at the spectral bands strongly affected by atmospheric humidity, as discussed below.
The responsivity of QASUME-IR was very stable throughout the campaign, with a variability of less than 0.4 % in the spectral range 550 to 1300 nm. Between 1300 and 1500 nm, the measured responsivity varied by 1.5 %, due to ambient changes in relative humidity that absorbed some of the radiation emitted by the transfer standard lamp in the portable monitoring system, before reaching the entrance optics of the spectroradiometer. This effect was not corrected since the atmospheric water vapour absorbs nearly all of the solar irradiance in this spectral interval, and thus this part of the solar spectrum was not further used in the analysis.
2.3 Precision Solar Spectroradiometer (PSR)
The Precision Solar Spectroradiometer (PSR) was designed and built at PMOD/WRC (Gröbner and Kouremeti, 2019). It is based on a temperature-stabilised grating spectroradiometer with a 1024-pixel Hamamatsu diode-array detector, operated in a temperature-controlled hermetically sealed nitrogen-flushed enclosure. The spectroradiometer measures the solar spectrum in the 316-to-1030 nm spectral range with a FWHM of between 1.5 and 4 nm. The relative expanded uncertainty (k=2) is 1.8 % for direct normal solar spectral irradiance measurements in the central wavelength range between 400 and 900 nm, with slightly increasing uncertainties at either end of the spectrum. In this campaign, PSR009 was deployed, using a responsivity calibration performed in the optical laboratory of PMOD/WRC prior to and after the campaign using transfer standards traceable to the primary spectral irradiance standard of Physikalisch-Technische Bundesanstalt (PTB; Gröbner and Sperfeld, 2005). The differences in the two calibrations were less than 1 % over the whole spectral range, confirming the uncertainty budget described in Gröbner and Kouremeti (2019).
2.4 BTS spectroradiometers
The BiTec Sensor (BTS) is a commercially available system composed of two array spectroradiometers made by the company Gigahertz Optik GmbH. The spectral range from 300 to 1050 nm is covered with a 2048-pixel Si BTS2048-VL-TEC-WP with a nominal spectral resolution (FWHM) of 2.5 nm, whose characterisation was described in Zuber et al. (2018), while the spectral range from 950 to 2150 nm is measured with a BTS2048-IR-WP with a nominal spectral resolution of 8 nm (FWHM) with 512 pixels and an extended InGaAs detector. The spectral region of AOD could be extended above 1700 to 2150 nm compared to the other instruments used. Both instruments are temperature stabilised and directly mounted on a solar tracker without any optical fibre. Each spectroradiometer has a collimator to measure only direct solar irradiance with a diffuser entrance optic. The BTS2048-IR-WP was calibrated by PTB 6 months before the campaign and has an estimated relative expanded measurement uncertainty of 3.3 % (k=2) up to 1600 nm and 4.3 % (k=2) above 1600 nm.
The BTS2048-VL-TEC-WP was calibrated in the ISO 17025 calibration laboratory of Gigahertz Optik, which is traceable to PTB and has been validated by PTB, who confirmed the calibration uncertainty. An estimated expanded measurement uncertainty (k=2) of 3.5 % from 300 to 330 nm, 1.9 % (k=2) from 330 to 450 nm, and 1.8 % (k=2) for the remaining spectral range was achieved. The calibrations were checked on-site using a commercially available mobile transfer standard based on a 250 W tungsten lamp called BN-LHSI-WP before and after the measurement campaign. The BTS2048-VL-TEC-WP calibration did not change significantly, and therefore the laboratory calibration was used during the whole campaign.
2.5 Narrowband filter sun photometers
The AODs from a precision filter radiometer (Wehrli, 2000) and a Cimel CE318 sun photometer belonging to the GAW-PFR network and AERONET respectively were used for the comparison and validation of the spectral aerosol optical depth retrieved from the spectroradiometers. The operation, data production, and measurement uncertainties are as described in the extensive literature of their networks (Kazadzis et al., 2018; Holben et al., 1998). Noteworthy for their use in this study is that both radiometers are so-called reference or master instruments of their respective networks, since Izaña is the calibration site at which the zero-air-mass extrapolation is performed. Therefore the AOD obtained from these radiometers is based directly and without any further calibration steps on the zero-air-mass extrapolation performed at the site without instrument transportation or other activities which could break the traceability.
Precision filter radiometer PFR N01
A second precision filter radiometer, PFR N01, was also operated during the measurement campaign. The four spectral channels of this radiometer were fully characterised and calibrated with respect to the SI at the tuneable laser facility of PTB in January 2021 (Kouremeti et al., 2022). As shown in that study, the ToA solar irradiances retrieved with this radiometer agreed very well with the TSIS-1 HSRS. A slight decrease in the responsivity of PFR N01 was observed between its calibration at PTB in January 2021, linked with the comparison to the PFR triad in September 2020, and its deployment during this campaign in September 2022. This degradation was monitored by intermediate comparisons to the PFR triad at PMOD/WRC (Kazadzis et al., 2018) and verified by a Langley calibration. These comparisons showed that the responsivity of PFR N01 decreased in these 2 years by 0.12 %, 0.35 %, 0.52 %, and 0.62 % for the spectral channels 862, 500, 411, and 368 nm respectively. This change in responsivity was taken into account when calculating the solar irradiances of PFR N01 during this campaign.
2.6 Solar-pointing Fourier transform infrared spectrometer
A solar-pointing Fourier transform infrared (FTIR) spectrometer was also deployed at IZO during the campaign. This instrument was a scanning Michelson design supplied by Bruker Corporation (model 125M) coupled to a solar tracking system (also supplied by Bruker). It was used to provide high-resolution (0.01 cm−1) measurements of the solar spectrum between 500 and 5500 nm. Langley analysis based on Kiedron and Michalsky (2016) was used to separate the top-of-atmosphere and atmospheric contributions to the measurements across the near-infrared region between 950 and 2100 nm. This instrument has previously been used in the evaluation of the near-infrared top-of-atmosphere spectrum (Elsey et al., 2017) and assessment of the water vapour continuum in the near-infrared region (Elsey et al., 2020).
The spectral irradiance measurements of the spectroradiometers used in this study are ultimately traceable to the high-temperature blackbody at PTB, acting as the German national standard for spectral irradiance. The spectral irradiance measurements at PMOD/WRC are traceable to that primary spectral irradiance standard via a set of transfer standard lamps, with an estimated standard uncertainty of 0.55 % (Hülsen et al., 2016). Several low-power lamps are used in a portable calibration facility to provide this traceability to the measurements of QASUME when it is measuring outside of the optical laboratory of PMOD/WRC. On several occasions, this calibration chain was validated by moving QASUME to PTB and directly measuring the spectral irradiance of the high-temperature blackbody (Gröbner and Sperfeld, 2005; Hülsen et al., 2016). The latest validation campaign was performed in March and April 2022 to validate the spectral irradiance measurements of QASUME and QASUME-IR for the extended spectral range from 300 to 1700 nm. Further to the measurements in front of the high-temperature blackbody, irradiance measurements using the tuneable laser facility TULIP were also performed with both spectroradiometers. The low-power lamps in the portable calibration facility of QASUME provided the linkage between the PMOD/WRC irradiance scale and the irradiance measurements at the two facilities of PTB.
The spectral irradiance measurements at PTB were performed with QASUME and QASUME-IR using the irradiance scale realised at PMOD/WRC from the average of seven 1 kW FEL transfer standard lamps, which were in turn calibrated relative to the national primary standard of PTB for spectral irradiance, the high-temperature blackbody BB3200pg at different times since 2003. Therefore this so-called QASUME irradiance scale represents a long-term average of the spectral irradiance scale realised by PTB. Figure 1 shows the ratio of spectral irradiances of the blackbody and the irradiances at specific wavelength settings of TULIP measured with QASUME and QASUME-IR relative to the irradiances of these two (spectral) irradiance sources. As can be seen in the figure, the measurements, with the exception of a few points measured at TULIP, are all within the expanded uncertainties in the spectral irradiance measurements of QASUME and QASUME-IR, thus validating the spectral irradiance scale at PMOD/WRC and specifically the spectral irradiance measurements of QASUME and QASUME-IR when deployed outside of PMOD/WRC.
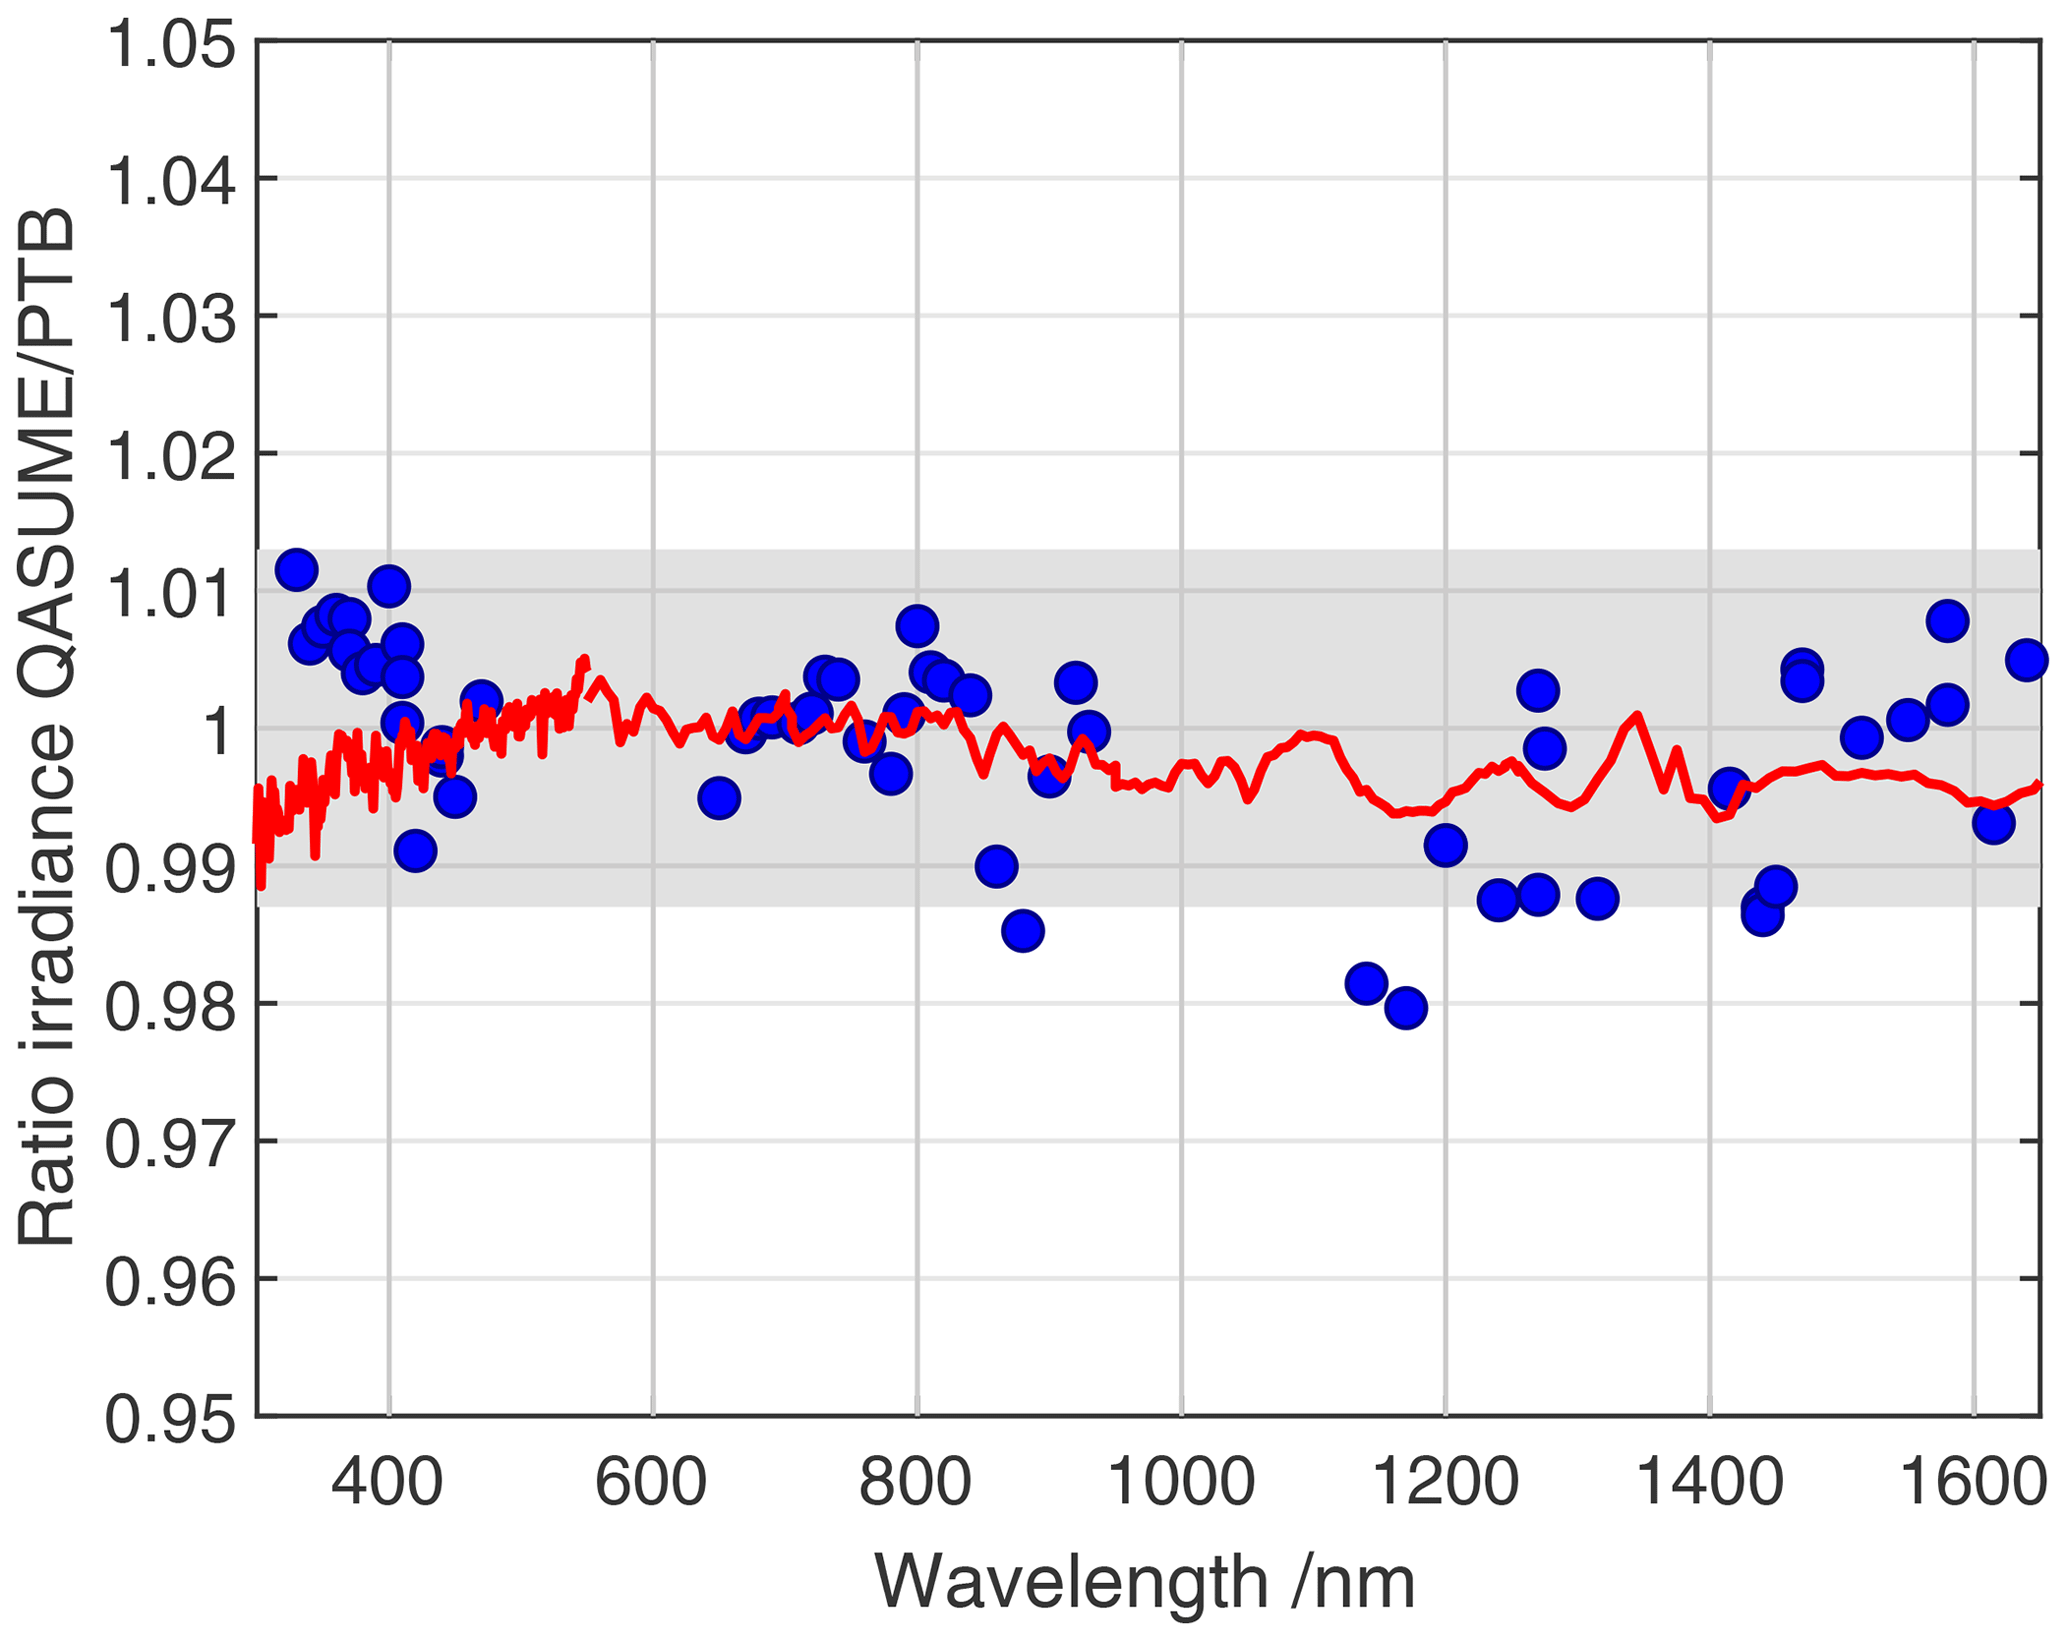
Figure 1Ratio of the spectral irradiances obtained from TULIP (blue dots) and of the high-temperature blackbody BB3200pg (red line) with QASUME (300 to 550 nm) and QASUME-IR (550 to 1700 nm) using as reference 1 kW FEL transfer standards traceable to the SI (QASUME scale) with respect to the spectral irradiances provided by PTB. The grey-shaded area represents the expanded relative uncertainty in the spectral irradiance measurements of QASUME and QASUME-IR.
The retrieval of atmospheric transmission and aerosol optical depth from ground-based spectral direct solar irradiance measurements uses the Beer–Lambert law:
where Iλ represents the solar irradiance measured at wavelength λ, I0λ the solar irradiance at the top of the atmosphere, RSE the sun–Earth distance normalised to 1 au, τλ the total optical depth, and m the air mass. The zero-air-mass extrapolation procedure as described in Gröbner et al. (2017) is used by performing a linear regression of the logarithm of the spectral solar irradiance measurements with respect to air mass to retrieve the spectral solar irradiance value at air mass 0, representing the ToA solar irradiance at wavelength λ. This procedure assumes that during the duration of these measurements, the atmospheric transmission τλ remains constant and that any remaining small atmospheric variations are uncorrelated and therefore random from one day to the next. Furthermore, at wavelengths shorter than 310 nm, the extrapolated solar ToA spectra from the QASUME spectroradiometer are bandwidth-corrected following the procedure described in Gröbner et al. (2017).
From the available measurements in the period 6 to 22 September 2022, between 8 and 15 half-days were selected from the dataset of each spectroradiometer to retrieve ToA solar spectra for each half-day period by zero-air-mass extrapolation. Subsequently, the mean ToA solar spectrum and the corresponding standard error were computed from these retrievals for each spectroradiometer. Figure 2 shows the extrapolated ToA solar spectra in the upper panel and the relative standard error of the mean in the bottom. The ToA solar spectrum from the TSIS-1 HSRS, convolved with a nominal 1 nm FWHM triangular line spread function, is also shown in the upper part of the figure.
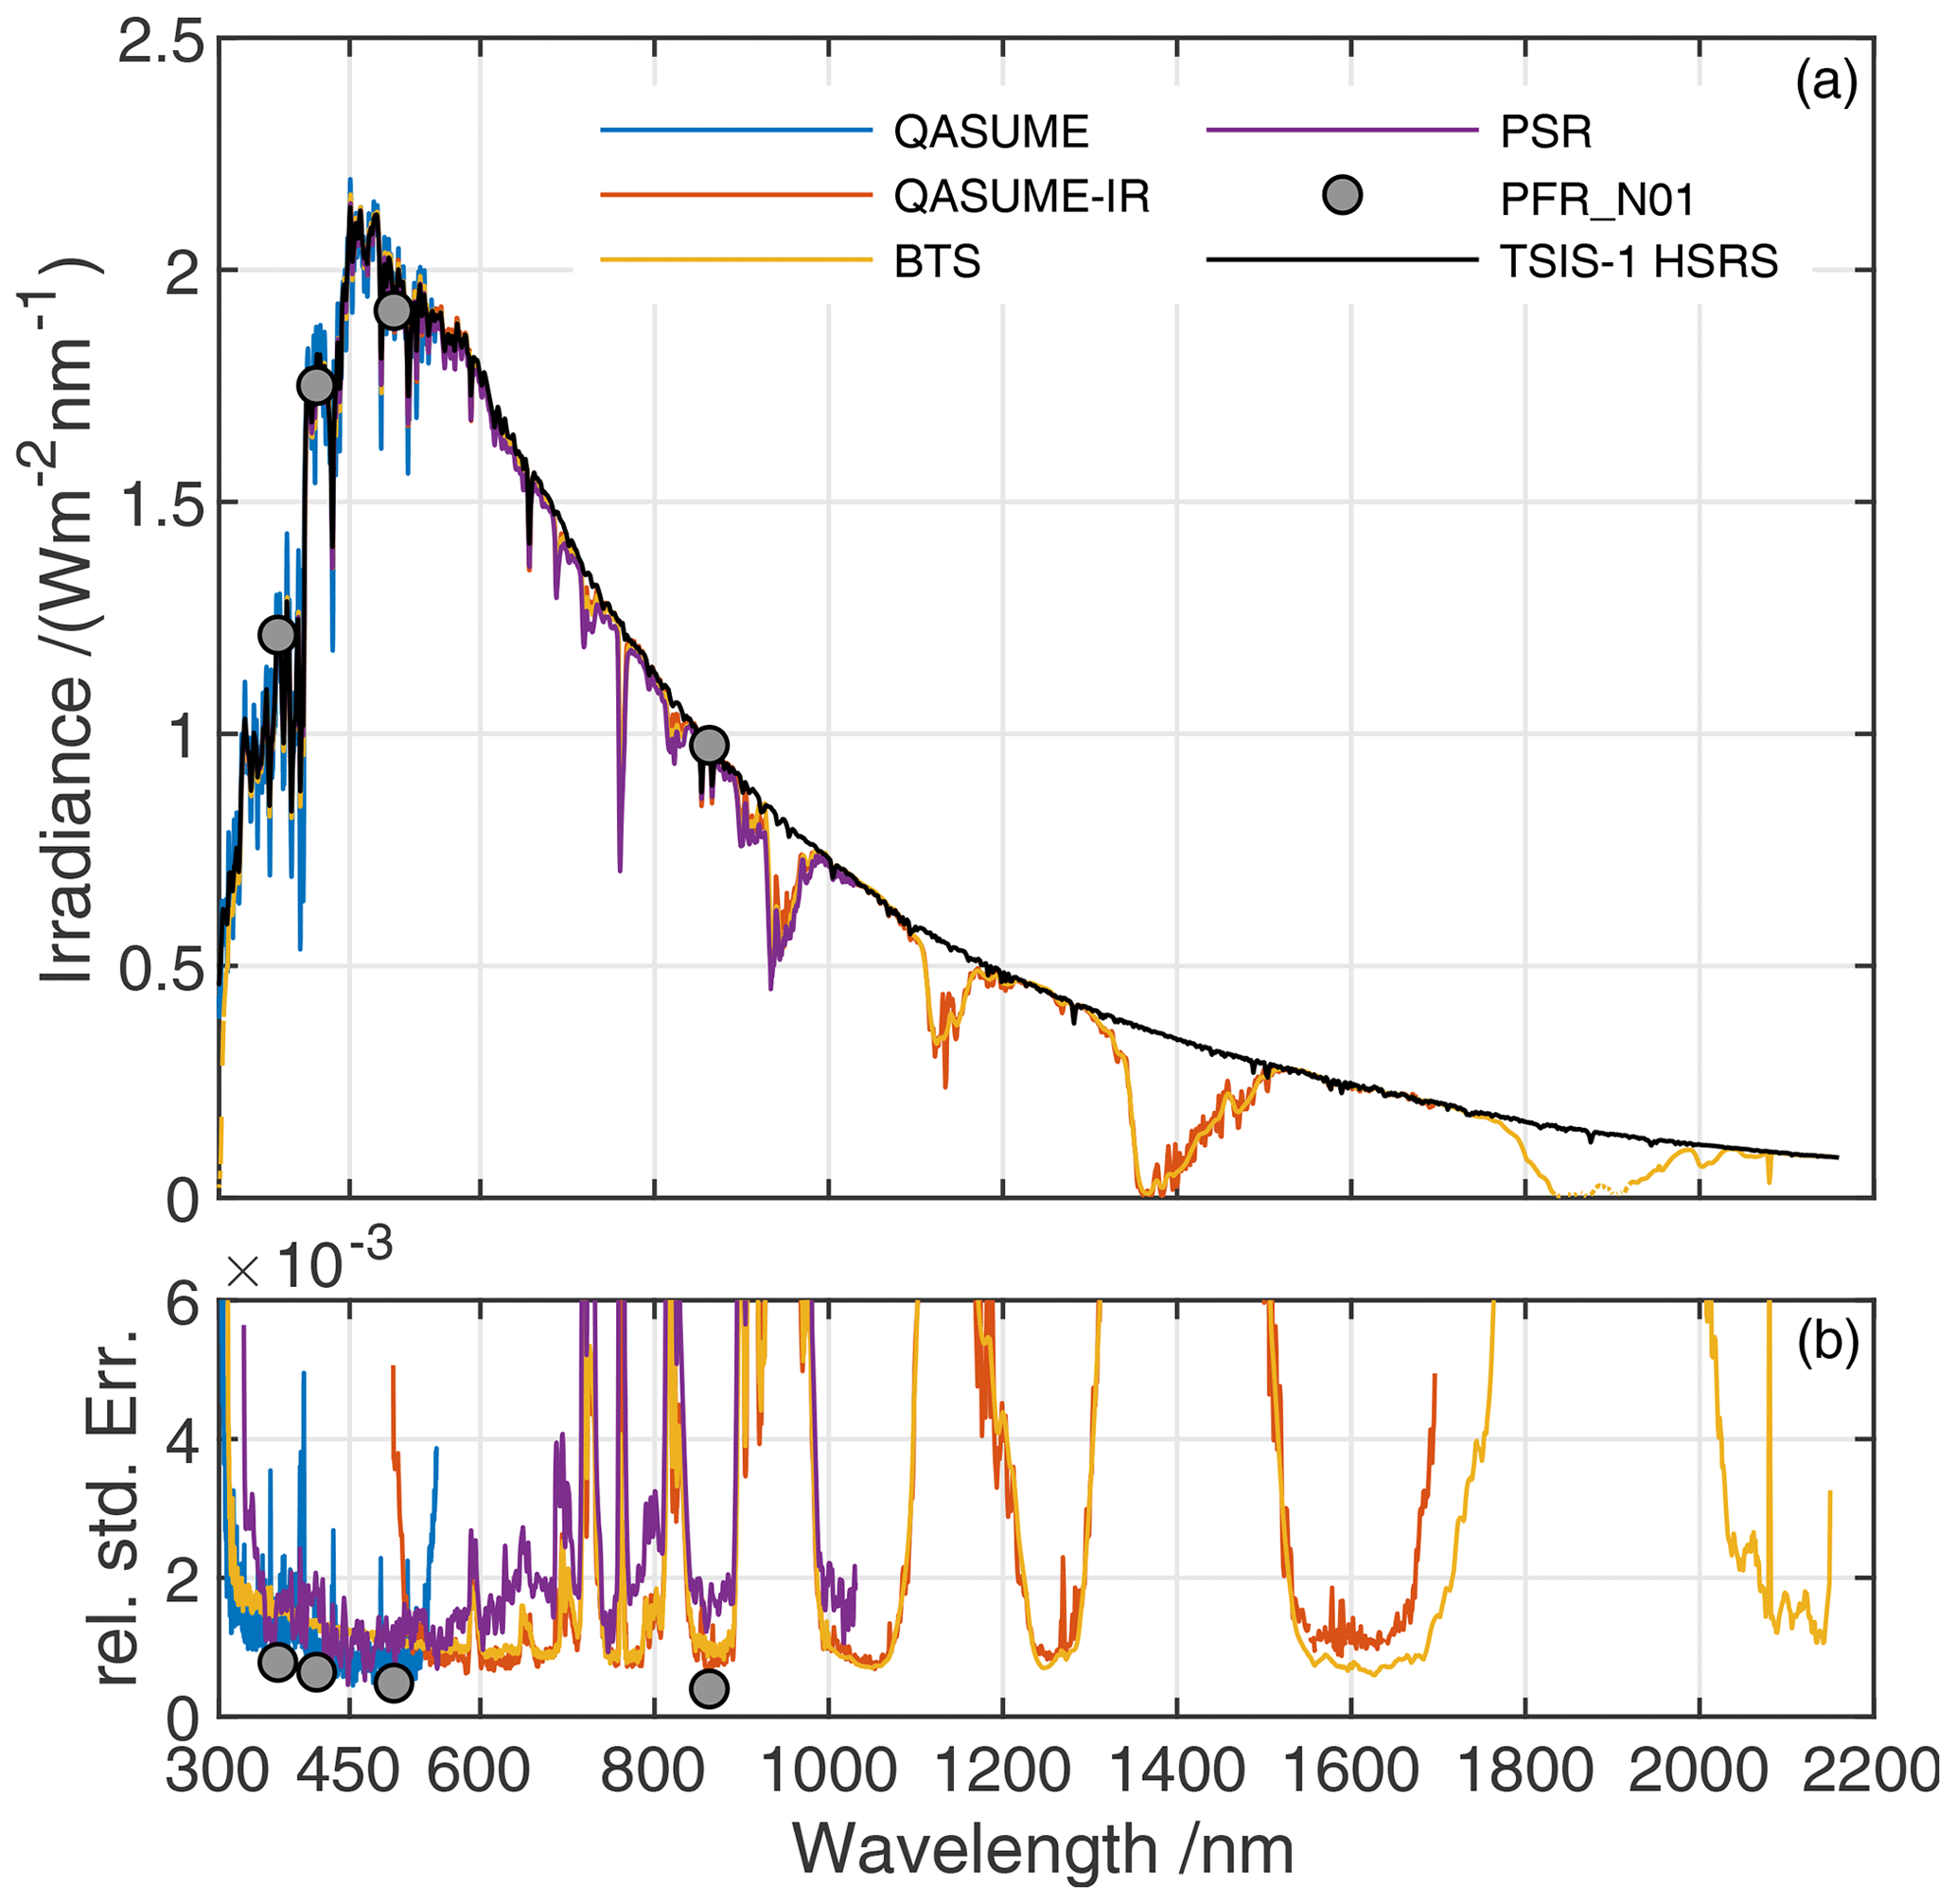
Figure 2(a) Top of atmosphere solar spectra derived from zero-air-mass extrapolations by QASUME (blue), QASUME-IR (red), the BTS (yellow), the PSR (violet), and the TSIS-1 HSRS (black) convolved with a 1 nm FWHM triangular line spread function. The grey circles represent the solar irradiances measured with PFR N01. (b) Relative standard error of the mean of the ToA solar spectra shown in the top panel using the same colour scale.
The larger variabilities seen in Fig. 2 are from spectral regions with strong atmospheric gas absorption where the atmospheric variability is higher. These spectral regions are also visible in the upper panel as remaining absorption features in the extrapolated ToA solar spectra, relative to the TSIS-1 HSRS. This also underlines once more the limitations inherent in the ground-based zero-air-mass extrapolation methodology, since in these spectral regions with strong atmospheric absorption, the zero-air-mass extrapolation using the Beer–Lambert law fails due to the assumption of constant atmospheric absorption and unsaturated trace gas absorptions.
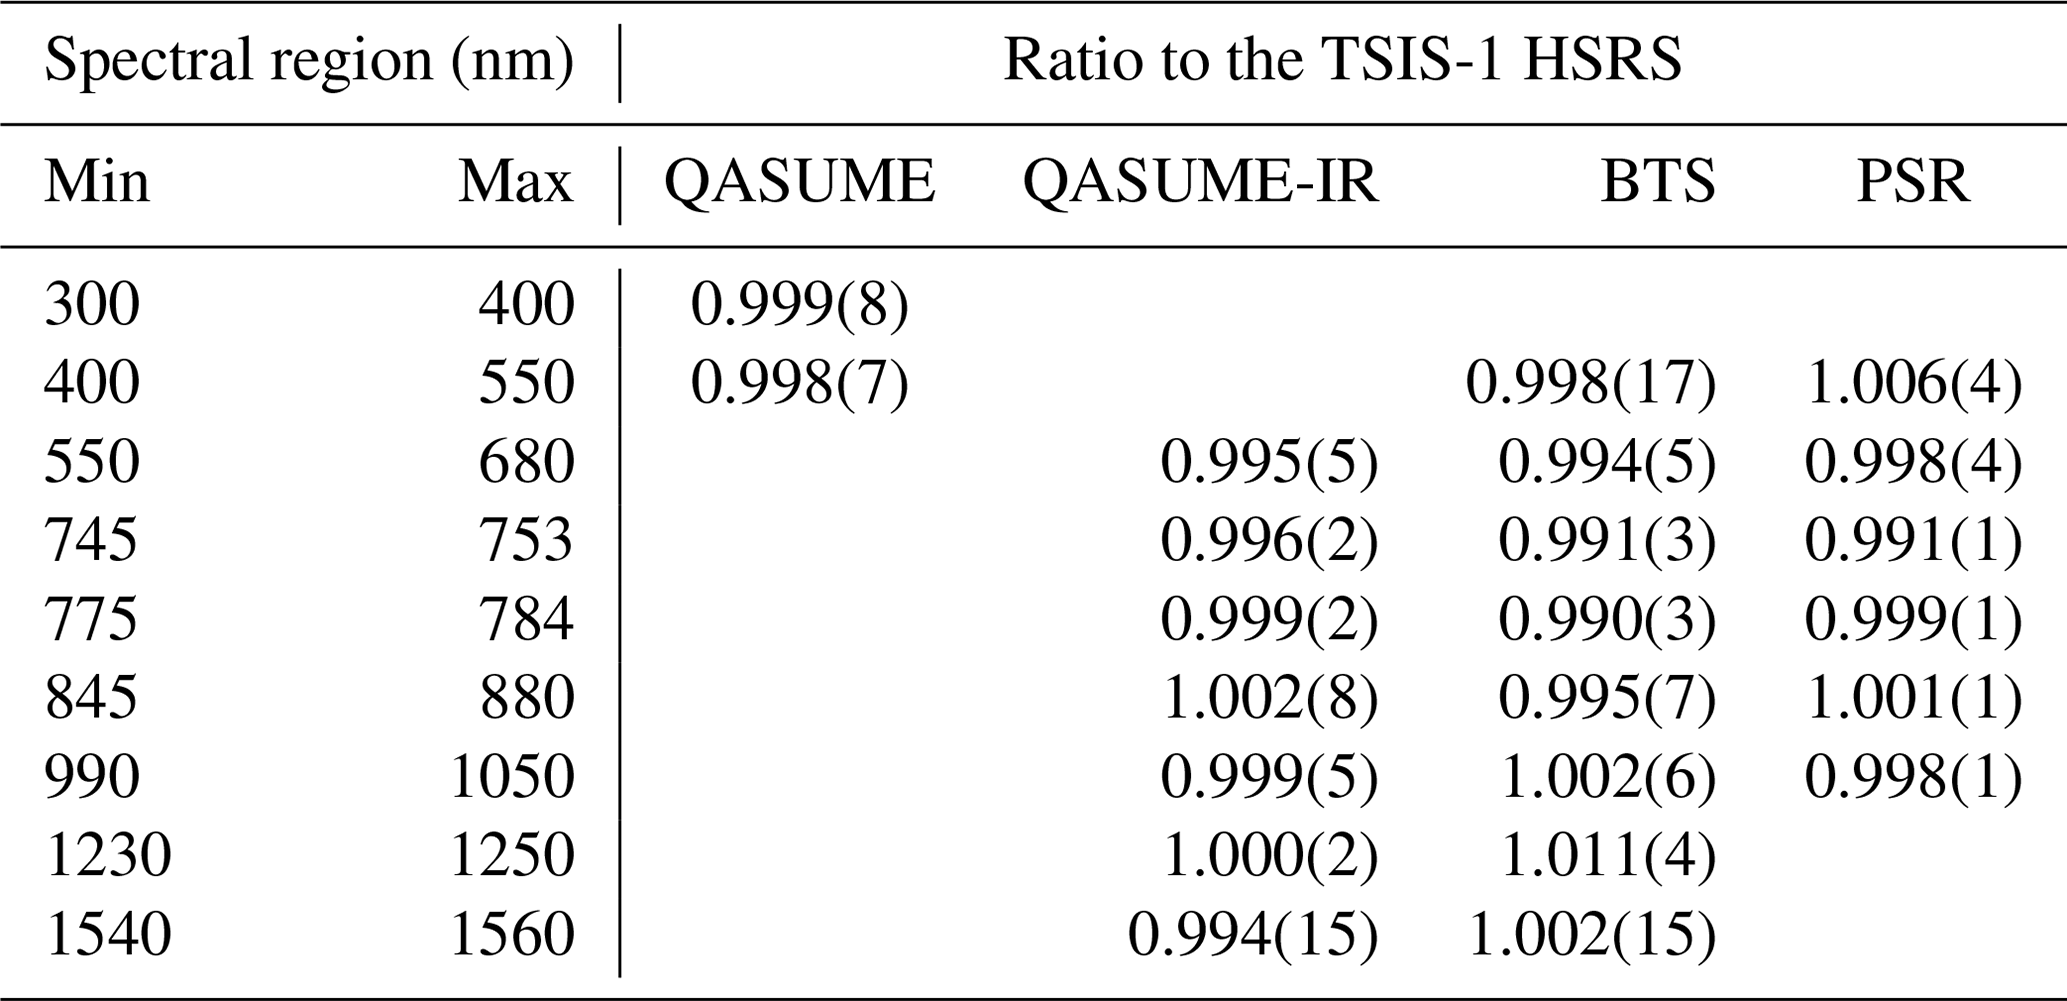
The ratio of the extrapolated ToA solar spectra shown in Fig. 2 to the TSIS-1 HSRS, convolved with the respective line spread functions of the spectroradiometers, is shown in Fig. 3. A 10 nm moving average is applied to the ratios to remove some of the high-frequency spectral variability. The agreement between the extrapolated ToA solar spectra and TSIS-1 HSRS in the spectral regions unaffected by strong gas absorptions is mostly within 1 %. The slightly larger deviations seen with the array spectroradiometers PSR and BTS in the ultraviolet spectral region below 400 nm likely come from unaccounted-for wavelength errors and line-spread-function-related artefacts when convolving the high-spectral-resolution TSIS-1 HSRS with the spectrally varying line spread functions of the PSR and BTS spectroradiometers. Table 1 lists the relative differences between the spectroradiometers and TSIS-1 HSRS for these selected spectral regions.
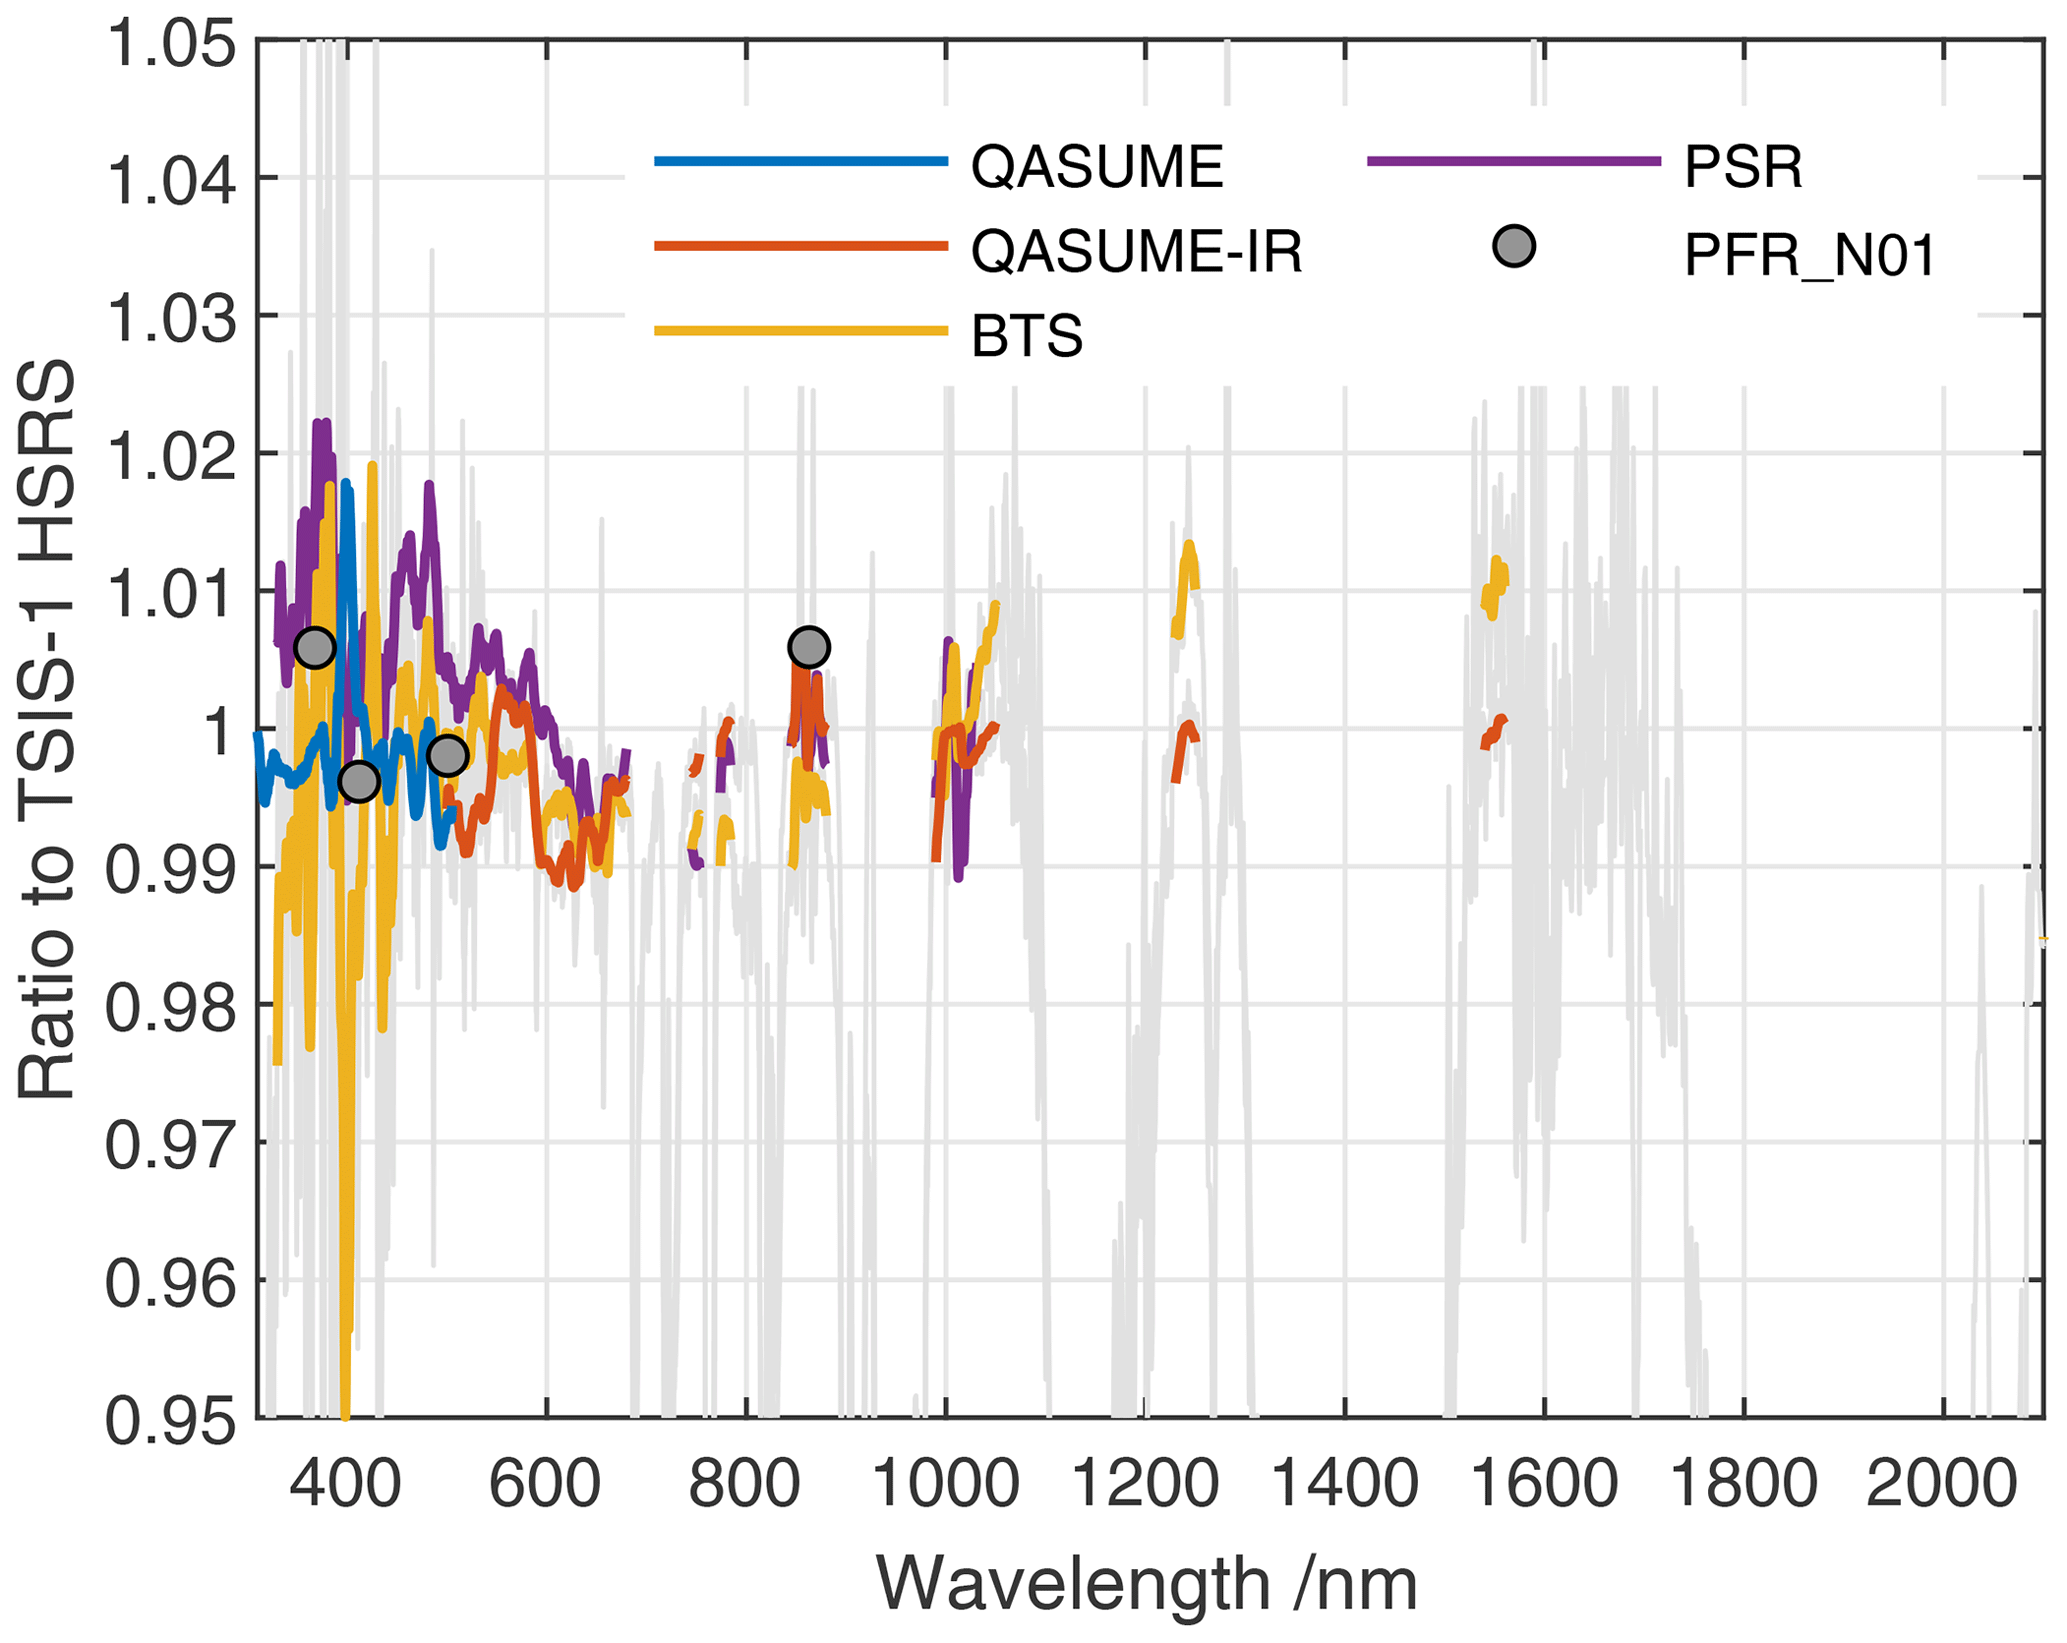
Figure 3Spectral ratio of the zero-air-mass-extrapolated ToA solar spectra from QASUME (blue), QASUME-IR (red), the PSR (violet), and the BTS (yellow) relative to the TSIS-1 HSRS convolved with the respective line spread functions of the spectroradiometers. The coloured lines are a 10 nm moving average of the spectral ratios in spectral regions with no or only weak atmospheric trace gas absorption, while the grey line represents the full spectral ratio of the BTS to the TSIS-1 HSRS. The grey circles represent the ratios of the spectral solar irradiances of PFR N01 with the TSIS-1 HSRS convolved with the spectral filter transmissions of PFR N01.
Table 1Ratios of ToA solar spectra from QASUME, QASUME-IR, the BTS, and the PSR relative to the TSIS-1 HSRS averaged over different spectral intervals unaffected by strong trace gas absorption features. The values in parentheses represent the standard deviation of the spectral ratio within this spectral interval.
The consistency between the TSIS-1 HSRS and the ToA solar irradiances retrieved with PFR N01 is also excellent, with relative differences below 1 %, thus confirming the results already published in Kouremeti et al. (2022).
The spectral measurements with the lowest uncertainties and with the best agreement are obtained with the QASUME (300 to 550 nm) and QASUME-IR (550 to 1700 nm) scanning spectroradiometers. As can be seen in Fig. 3, the agreement of the ToA solar spectra retrieved with QASUME and QASUME-IR agrees within 1 % with the TSIS-1 HSRS in the spectral regions unaffected by strong gas absorption. This agreement is well within the combined uncertainties of the instruments and confirms the excellent agreement observed between measurements of QASUME in the 2016 campaign and the TSIS-1 HSRS (Coddington et al., 2021).
Metrological traceability of space-based solar irradiance measurements is currently not achieved in flight. While pre-flight calibrations can be made traceable, the harsh environment of space following the shock of launch means that generally, radiometric ground calibrations cannot be relied upon in space (Fox and Green, 2020). The mission TRUTHS, Traceable Radiometry Underpinning Terrestrial- and Helio-Studies, expected to be launched at the end of this decade, will, for the first time, establish high-accuracy SI traceability directly in orbit. As stated in Fox and Green (2020), the direct use of a primary standard and replication of the terrestrial traceability chain will extend the SI into space, in effect realising a metrology laboratory in space and providing and enabling SI-traceable measurements of unequivocal accuracy.
The TSIS-1 Spectral Irradiance Monitor (SIM) mission follows a different approach to correct on-orbit degradation by using a three-channel duty cycle. This procedure has maintained those TSIS-1 SIM ground calibrations as validated independently by QASUME and QASUME-IR at the 1 % level (Odele Coddington, personal communication, 2023).
The comparison of the TSIS-1 HSRS ToA solar spectrum with ToA solar irradiance measurements obtained from extrapolated SI-traceable ground-based measurements provides such a metrological validation. Therefore, this comparison also establishes a direct traceability link to the SI for the relevant spectral regions of the TSIS-1 HSRS ToA solar spectrum via the ground-based measurements discussed in this study.
Furthermore, the validation of the TSIS-1 HSRS with the extrapolated ToA solar spectrum from QASUME/QASUME-IR can also be used to confirm, and even reduce, the uncertainty of the TSIS-1 HSRS in the spectral regions where the uncertainties of the TSIS-1 HSRS are larger than the ones of the QASUME/QASUME-IR ToA solar spectrum. Figure 4 shows the standard relative uncertainties as given for the TSIS-1 HSRS (Coddington et al., 2021) and the ones of the QASUME/QASUME-IR ToA solar spectrum. The latter are obtained by combining the measurement uncertainties of 0.7 % (see Sect. 2.1) with the standard error of the ToA retrieval shown in the bottom panel of Fig. 2. While the uncertainties of the TSIS-1 HSRS are lower than those of QASUME for wavelengths longer than 400 nm, at shorter wavelengths the uncertainty of the TSIS-1 HSRS can be significantly reduced from 1.3 % to 0.8 %, which is the relative standard uncertainty of the QASUME ToA solar spectrum. This reduced uncertainty of the TSIS-1 HSRS is valid for the spectral range starting at 308 nm and ending at 400 nm, at which point the TSIS-1 HSRS uncertainty drops to 0.5 %.
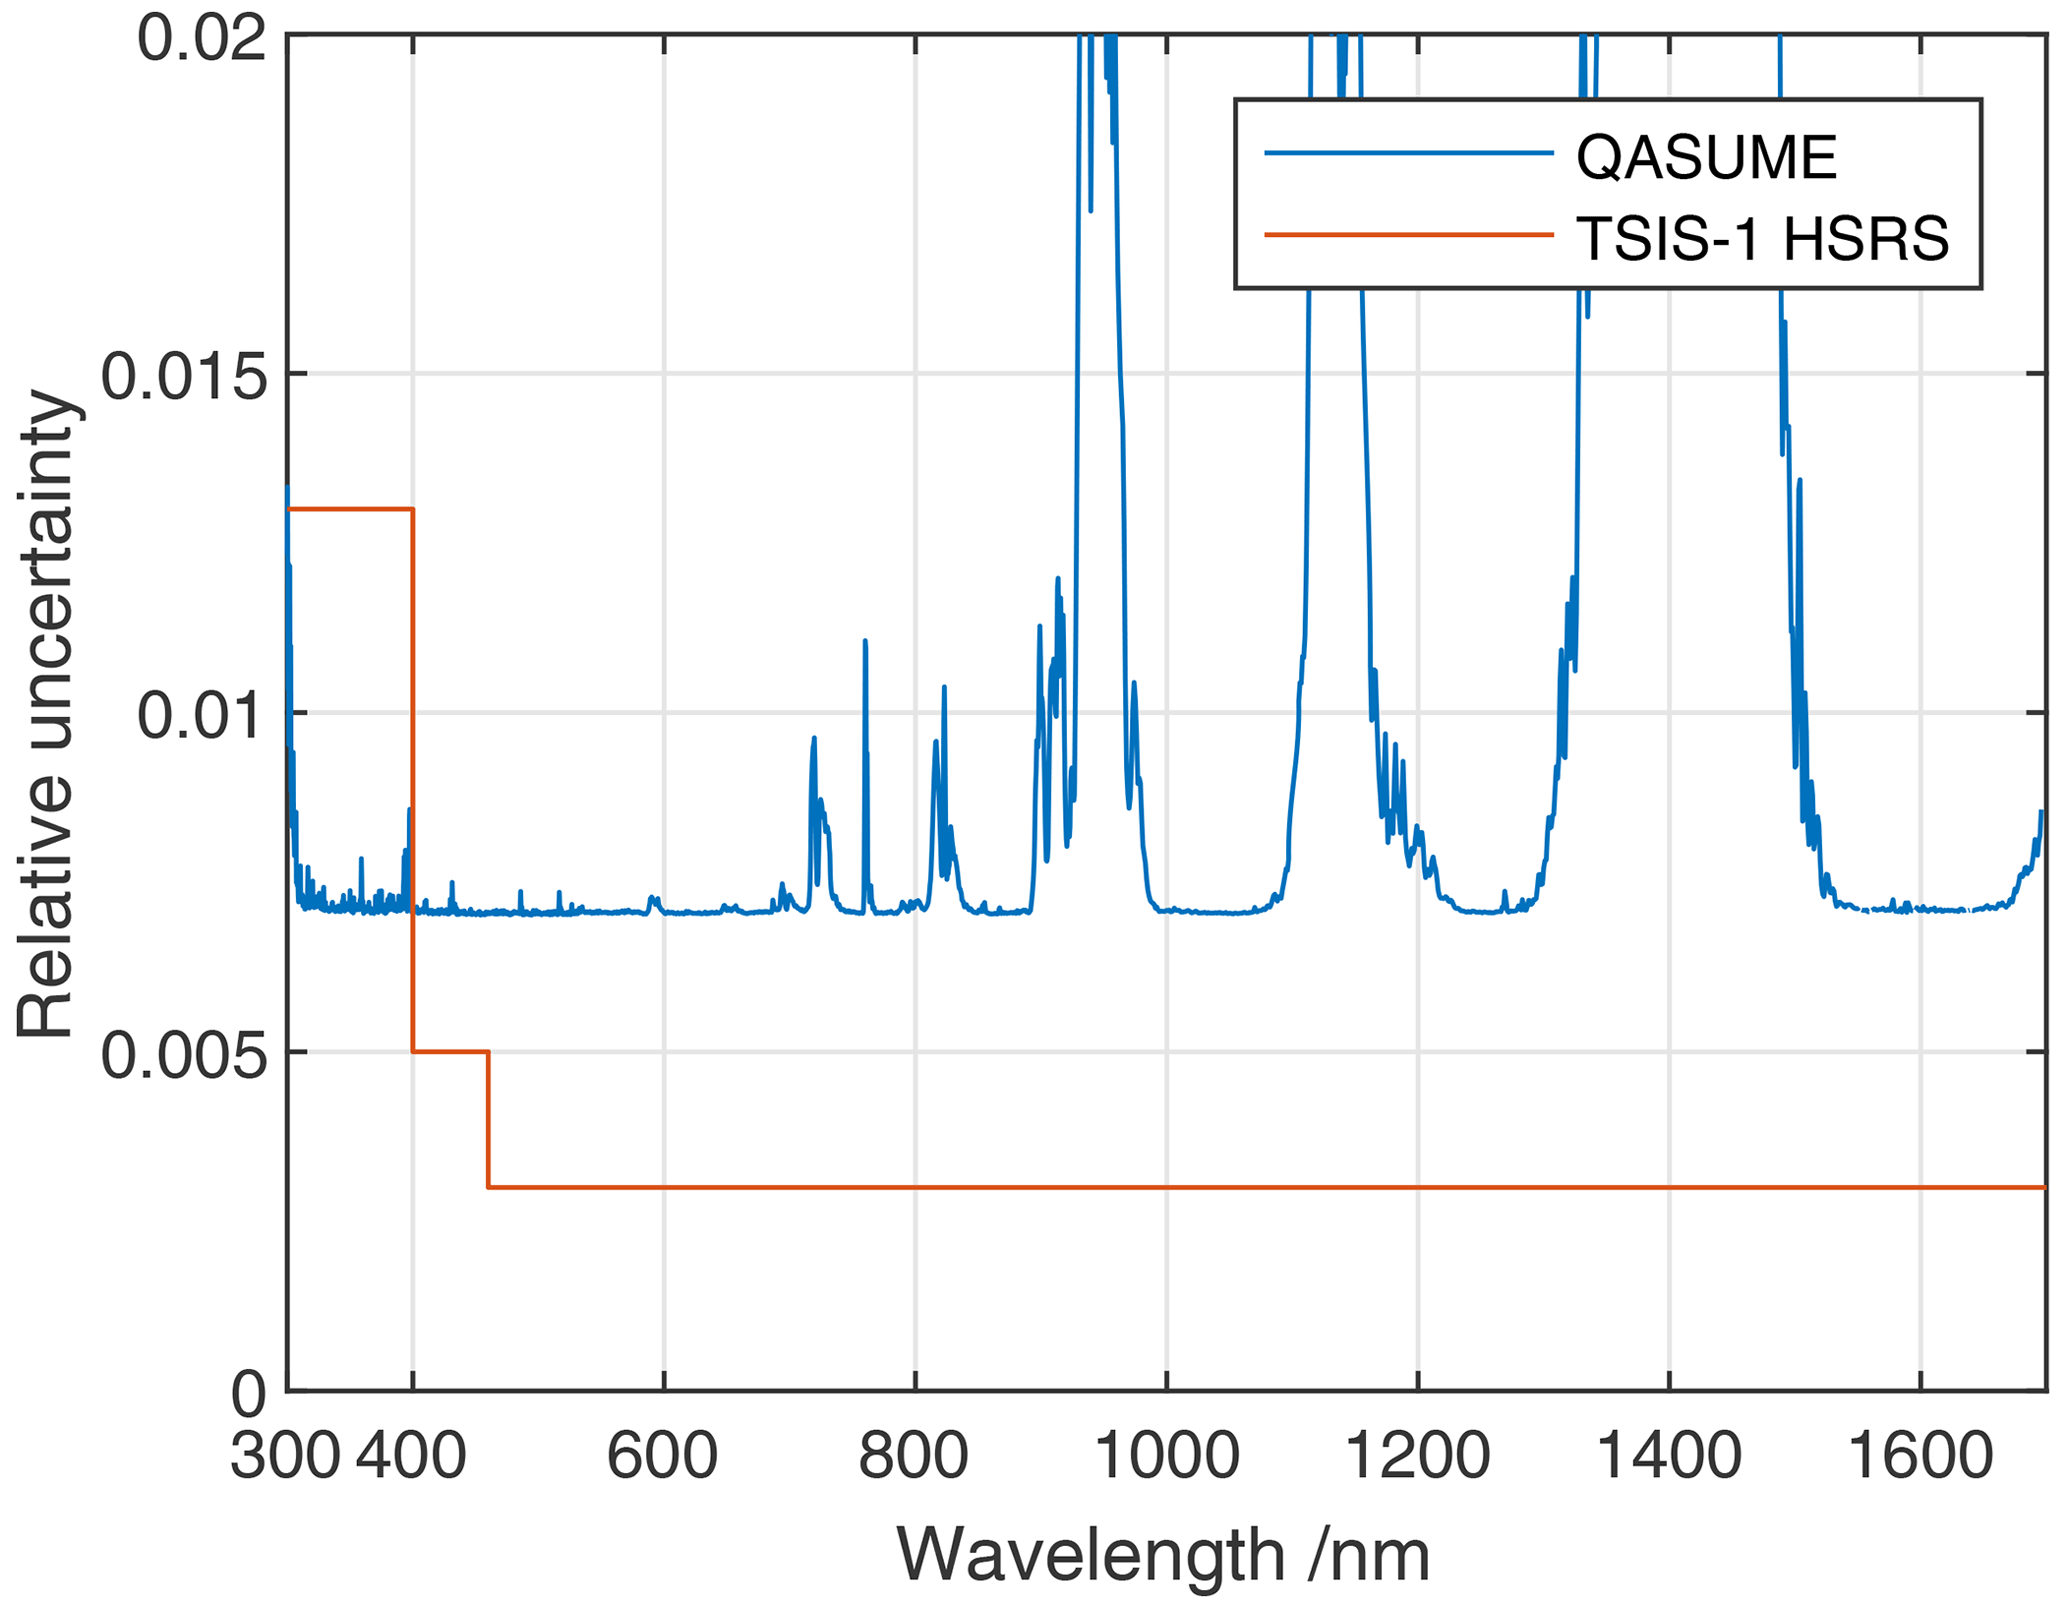
Figure 4Relative standard uncertainty of the ToA solar spectrum from the TSIS-1 HSRS (red) and from QASUME and QASUME-IR (blue).
The spectral optical depth τa is derived by rearranging Eq. 1 and expanding the optical depth τ:
where τi represents the optical depths of the atmospheric trace gas i and mi the corresponding air mass and τR(p,λ) stands for the Rayleigh scattering term which depends on the atmospheric pressure p, with λ being the corresponding wavelength. The sun–Earth correction factor RSE has been omitted for convenience.
For an accurate AOD retrieval, the influence of trace gas absorptions τi needs to be known, so usually, the AOD is retrieved only in the spectral regions where the uncertainty due to their influence is small, either because the absorption is negligible or because it can be corrected for. This is for example the case for atmospheric ozone, which needs to be subtracted in the short ultraviolet below 340 nm or in the Chappuis band between approximately 450 and 750 nm. The ozone absorption was calculated using the ozone absorption cross sections from Serdyuchenko et al. (2014), which have been shown to give the highest consistency between different ground-based ozone monitoring instruments (Gröbner et al., 2021).
The air masses mi depend on the vertical distribution of the respective trace gas in the atmosphere; apart from ozone, which is mostly located in the stratosphere, all other trace gases are assumed to be well mixed and distributed in the troposphere. Since this information is usually not known, for simplicity the air mass is assumed to be equal to the aerosol air mass ma, which is a reasonable approximation as long as the solar zenith angle is below 75∘.
The spectral range under investigation, 300 to 2100 nm, contains spectral absorption features from several atmospheric trace gases, such as water vapour (H2O), ozone (O3), CO2, CH4, and NO2, as well as several additional oxygen absorption bands, the most prominent being at 762 nm. Figure 5 shows the optical depth retrieved from a solar irradiance measurement on 10 September 2022 at 08:29 UTC.
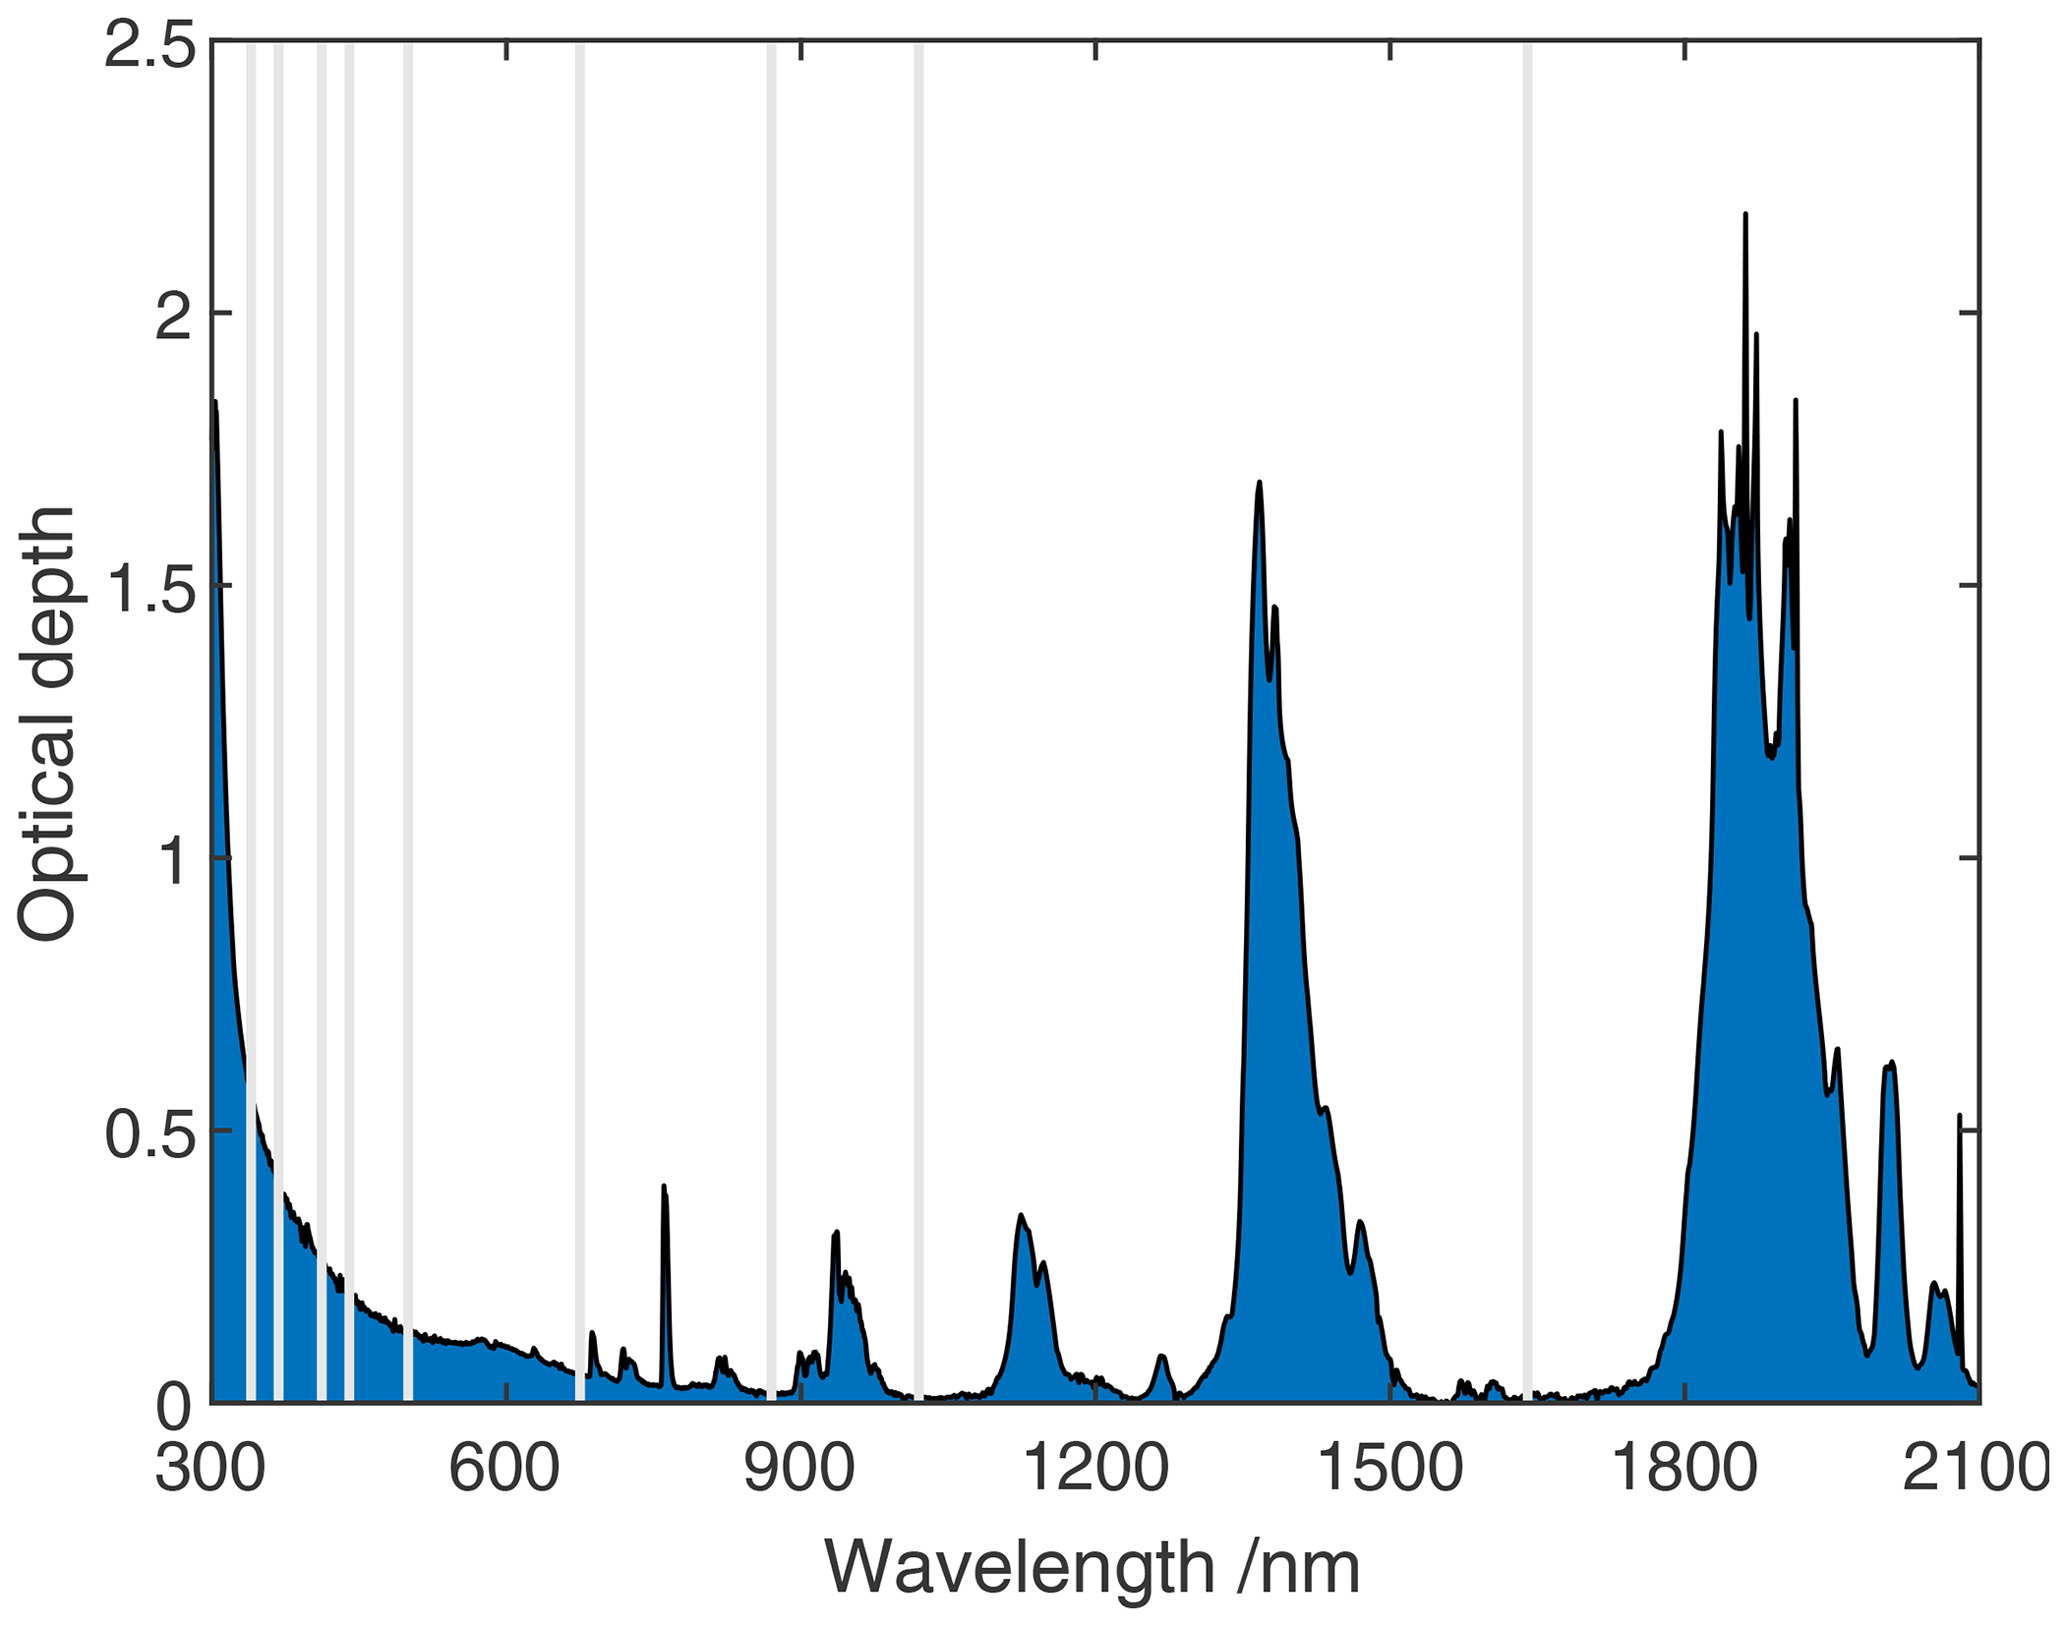
Figure 5Spectral optical depth of the atmosphere between 300 and 2100 nm obtained from direct spectral solar irradiance measurement on 10 September 2022 at 08:29 UTC. The grey bars represent the spectral channels used by the Cimel and PFR sun photometers to retrieve the AOD.
Several prominent absorption features are visible in the figure, stemming from ozone in the ultraviolet and around 600 nm and several water vapour bands, as well as CO2 close to 1600 nm. The AOD is retrieved in the spectral regions with minimum trace gas absorption, which is where the filter channels of the sun photometers are located, as indicated in the figure by the grey bars.
For the measurements described in this study, the only trace gas that was taken into account was ozone, since the absorption from the other trace gases is negligible in these spectral regions, with the exception of the IR channel at 1640 nm, as discussed later. This is also consistent with the AOD retrieved by the GAW-PFR sun photometer that will be used to validate the spectral AOD measurements. The AOD retrieved from the Cimel sun photometer is based on the AERONET procedures and is corrected for several trace gases, as described in Holben et al. (1998). However, apart from the 1640 nm channel, the optical depth corrections from NO2 and H2O in the corresponding channels of the Cimel sun photometer are less than 0.002 for the conditions of Izaña.
5.1 Uncertainty budget
The uncertainty estimation of the spectral AOD is based on Eq. (2) and is shown here for the QASUME and QASUME-IR spectroradiometers. A similar uncertainty estimation can also be made for the PSR and BTS spectroradiometers (not shown).
5.1.1 Atmospheric transmission
The most important uncertainty contribution arises from the atmospheric transmission term . When I0 is obtained from zero-air-mass extrapolation, then the uncertainty is essentially equal to the standard error of the mean of a set of zero-air-mass extrapolations (Toledano et al., 2018). For solar irradiance measurements traceable to the SI, combined with an independent ToA solar spectrum, the combined uncertainty is significantly larger. For QASUME and QASUME-IR, the corresponding uncertainty is obtained from the spectral solar irradiance relative measurement uncertainty of 0.7 %, combined with the uncertainty of the TSIS-1 HSRS ToA solar spectrum. As stated in Coddington et al. (2021), the standard relative uncertainty of the TSIS-1 HSRS ToA solar spectrum is 1.3 % below 400 nm, 0.5 % between 400 and 460 nm, and 0.3 % between 460 and 2400 nm. As discussed in the previous section, the uncertainty of the TSIS-1 HSRS can be reduced in the spectral interval 310 to 400 nm to 0.8 %.
5.1.2 Ozone and Rayleigh optical depth
The additional uncertainty contributions coming from the Rayleigh and ozone optical absorption terms are much smaller, especially at longer wavelengths. The uncertainty in the ozone absorption is obtained by assuming a default uncertainty in the total ozone column of 1 %, as obtained from the measurements of QASUME itself (Egli et al., 2022). Assuming a representative total ozone column value for this study of 280 DU, this yields an uncertainty of 0.007 at 310 nm but less than 0.001 in the spectral bands measured by the sun photometers. This implies that even if the sun photometers used different data sources for their total ozone column correction, the expected uncertainties in that correction are negligible.
Similarly, the Rayleigh scattering is calculated using the formula by Bodhaine et al. (1999). Since this formula has been accepted as the standard by all aerosol monitoring networks, the only relevant uncertainty term is related to the atmospheric pressure, which is measured at the Izaña observatory with an uncertainty of 1 mbar and a correspondingly negligible contribution to the overall uncertainty.
5.1.3 Other trace gases
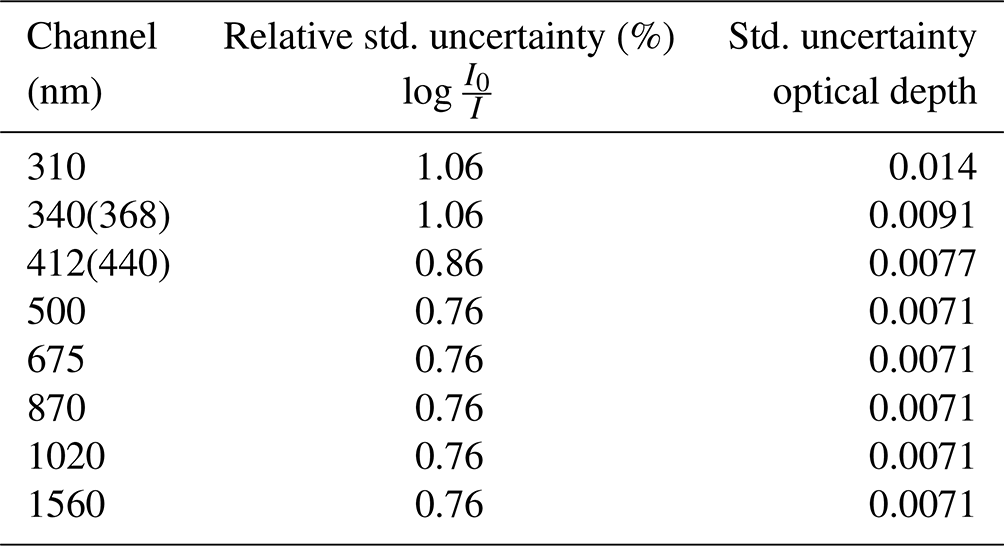
As stated previously, the contribution from other trace gases is negligible in the spectral regions selected by the sun photometers, with the exception of the IR channel at 1640 nm, where water vapour, CO2, and CH4 contribute significantly to the absorption optical depth. Following the calculations described in Giles et al. (2019) yields a correction of 0.0125 for the conditions at this measurement site. However at the nearby spectral region centred at 1560 nm, these trace gas absorptions are much reduced, which is therefore where the AODs for QASUME-IR and the BTS are retrieved. The uncertainty budget for spectral AOD retrieved by QASUME/QASUME-IR is shown in Table 2. For convenience, it is shown for the standard spectral channels of the GAW-PFR and AERONET sun photometers as well as at 310 nm. A constant uncertainty contribution of 0.002 is added to take into account minor absorptions arising from unaccounted-for trace gas absorbers, while at 310 nm the ozone uncertainty increases that component to 0.007.
Table 2Uncertainty budget of AOD for the QASUME and QASUME-IR spectroradiometers at the standard spectral channels of the PFR and Cimel sun photometers for an air mass of 1.5. The channel values in parentheses represent the central wavelengths of the PFR, while the last entry at 1560 nm has the corresponding channel of the Cimel sun photometer at 1640 nm.
The high-resolution measurements provided by the FTIR instrument were used to test the validity of the gas absorption assumptions in the near-infrared region. Figure 6 shows an example atmospheric optical depth between 1500 and 1700 nm, as determined from the gradient of the Langley fit to solar FTIR data taken on 22 September 2022 (Mottungan et al., 2023). In addition to the high-resolution data (black line), three spectrally broadened results are shown, where the FWHM values of 2.4 and 4 nm correspond to the spectral resolutions of the QASUME-IR and BTS spectroradiometers respectively. Table 3 shows the optical depth difference between the broadened results and the baseline optical depth from the high-resolution data at the standard sun photometer spectral channels in the near-infrared region (1020 and 1640 nm) and the alternative channel at 1560 nm identified for the spectroradiometers. The baseline value is determined as the mean value of the high-resolution data points within the respective bandwidths that are unaffected by gas absorption lines. The reported uncertainty is the standard deviation of the optical depth differences seen at each wavelength across the FTIR Langley analyses over the campaign.
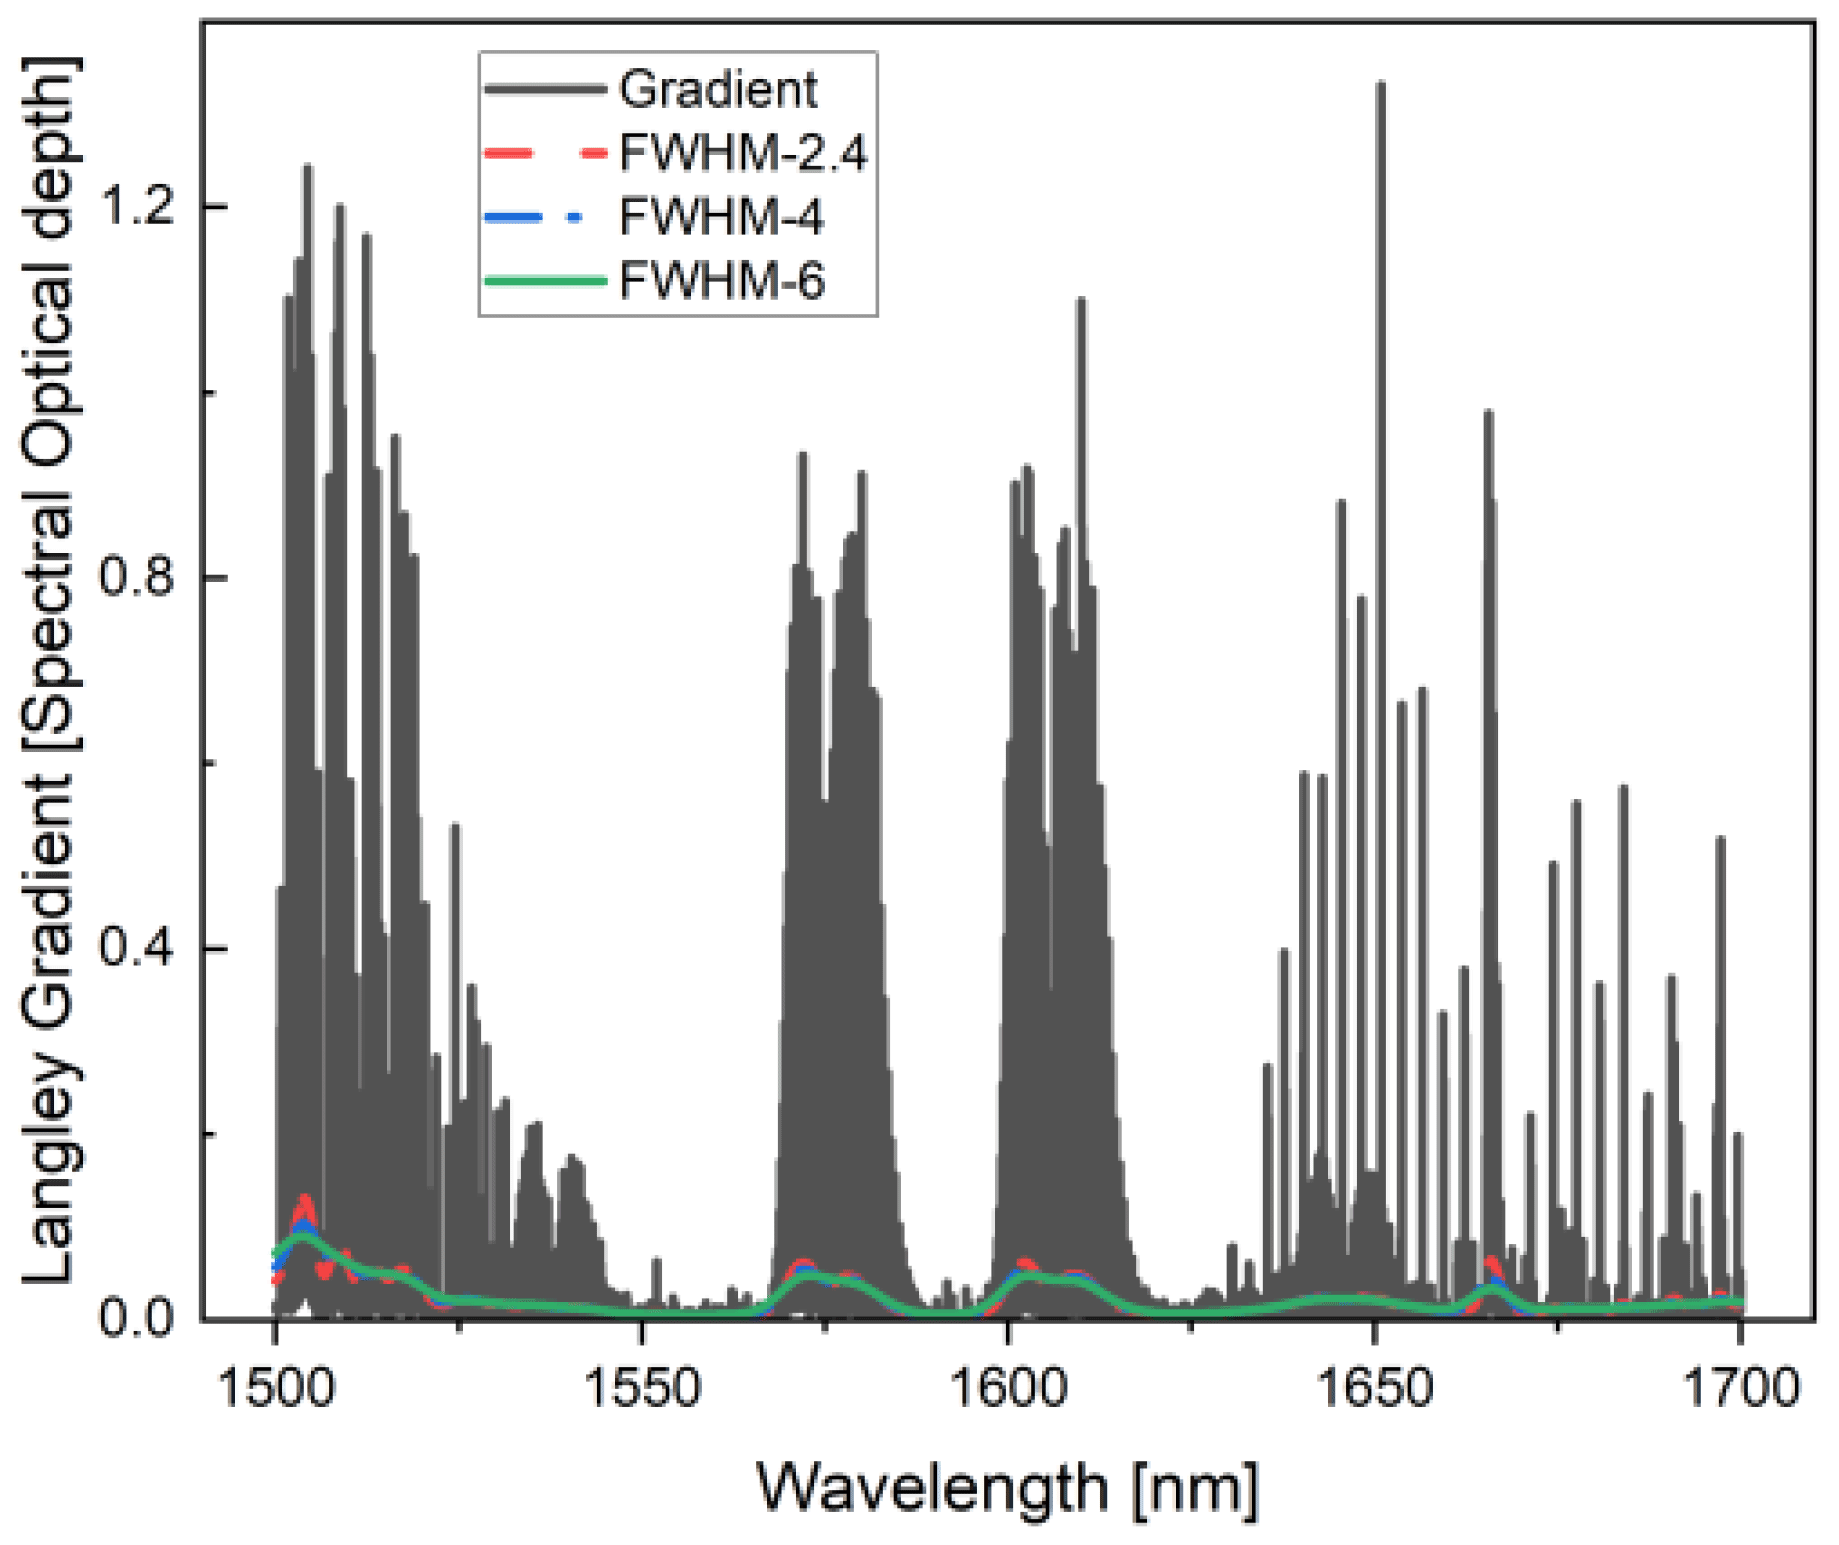
Figure 6Example of high-resolution atmospheric optical depths determined from Langley analysis on 22 September 2022 (black line). Broadened results for spectral resolutions of 2.4, 4, and 6 nm are also shown (red, blue, and green lines respectively).
Table 3Optical depth differences between high-resolution baseline and broadened spectra. The values in parentheses represent the uncertainty (see main text for details).
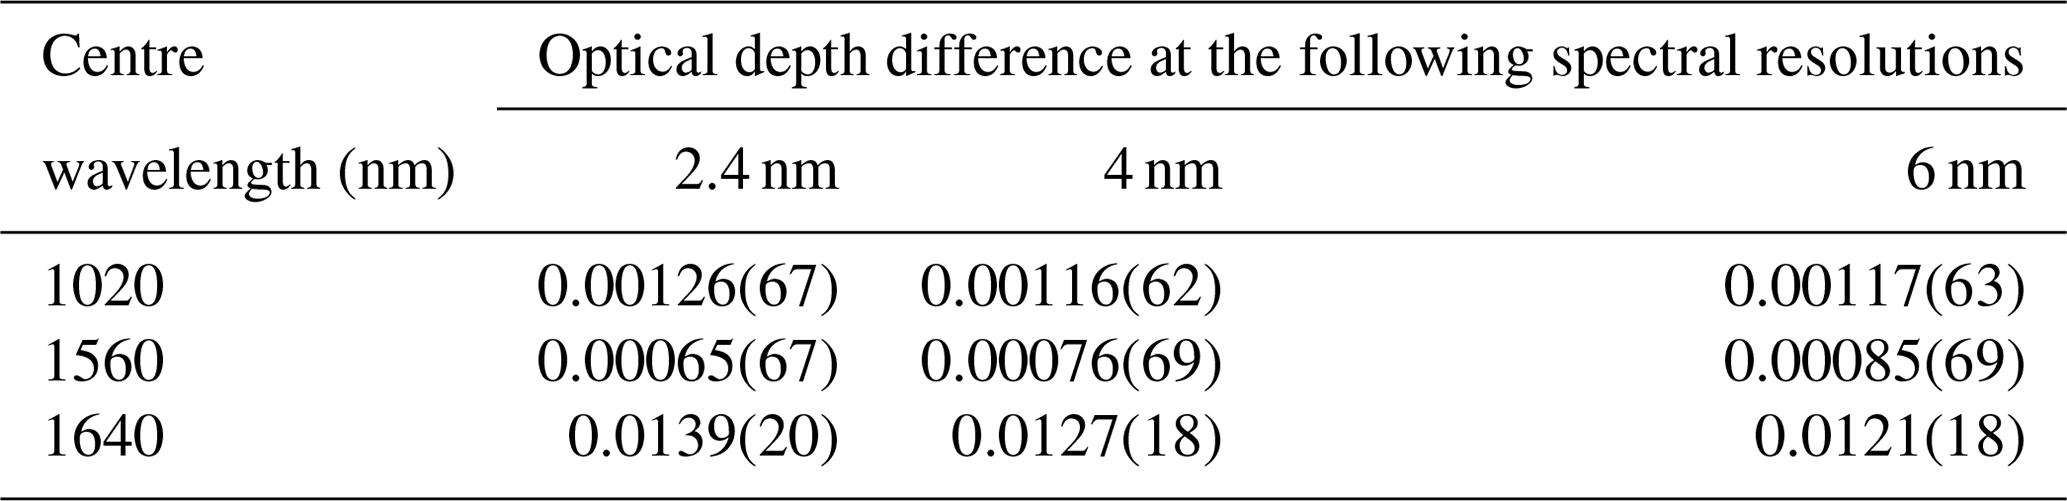
The results at 1640 nm confirm that the 0.0125 optical depth correction applied at this wavelength is appropriate given the gas contributions actually observed during the measurement campaign, while the results at the other wavelengths indicate that the constant 0.002 trace gas uncertainty contribution is a conservative estimate of the uncertainty in the near-infrared region. Table 3 also shows that these assumptions remain valid for spectral resolutions up to a FWHM of 6 nm.
5.2 AOD comparison
The spectral AOD from the cloud-free days of the campaign was retrieved from the QASUME/QASUME-IR, BTS, and PSR spectroradiometers and was compared to two sun photometers from the GAW-PFR network and AERONET. In total 10 d could be used for the comparison where all instruments provided AOD for most or all of the day. The data from the periods where instruments malfunctioned or were calibrated have been removed from the datasets.
As an example, Fig. 7 shows the spectral AOD from 13 September 2022 at 16:00 UTC.
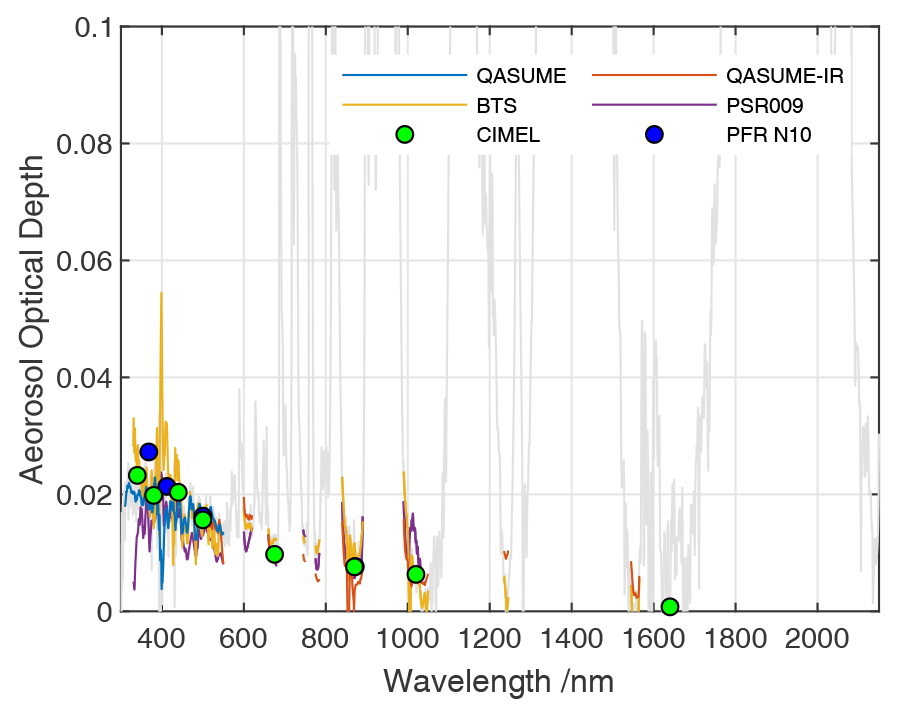
Figure 7Spectral aerosol optical depth from QASUME (blue), QASUME-IR (red), the BTS (yellow), and the PSR (violet) from measurements obtained on 13 September 2022 at 16:00 UTC. The circles are from the PFR (blue) and Cimel (green) sun photometers. The grey curve represents the complete spectral optical depth over the whole spectral interval measured by the spectroradiometers, including spectral regions also contaminated by unaccounted-for trace gas absorptions.
The overall agreement of 0.01 in AOD between the instruments is remarkable, considering the very low spectral AOD at this site. The larger spectral variability in the AOD from the PSR and BTS systems below 400 nm arises from convolving the high-spectral-resolution TSIS-1 HSRS with the line spread functions of the spectroradiometers, which is probably due to the difficulty in accounting for the variable resolution of these instruments in this spectral region. On the other hand, the spectral variability in the AOD from QASUME is less than 0.005 (peak to peak), with the exception of a dip of about 0.01 at 400 nm, which is currently unexplained.
While predefined narrowband filters, once manufactured and assembled, do not permit switching to another spectral region, there is a clear advantage of measuring the complete AOD spectrum, as shown in Fig. 7. This is clearly seen for the IR filter at 1640 nm, where the trace gas absorption from CO2, CH4, and H2O accounts for about 70 % of the total absorption in this spectral region, while on the other hand, a spectral interval with minimal trace gas absorption centred at 1560 nm is available, which can be used to assess the AOD in the infrared region.
Figure 8 shows the diurnal variation in the AOD at the common spectral channels of the sun photometers for this same day. For the PFR, the spectral AOD at 340 and 440 nm was obtained using the Ångström coefficients derived from its four spectral channels. The spectral AODs of the spectroradiometers were averaged over a 5 nm wide spectral band centred at these wavelengths. The grey-shaded area represents the WMO-accepted uncertainty coverage interval in which 95 % of the data from different instruments should be located in order for them to be considered equivalent (WMO, 2005). The reference instrument considered for the WMO criterion is the PFR N10 at all channels shorter than 1640 nm, while at this particular channel the Cimel radiometer is used instead.
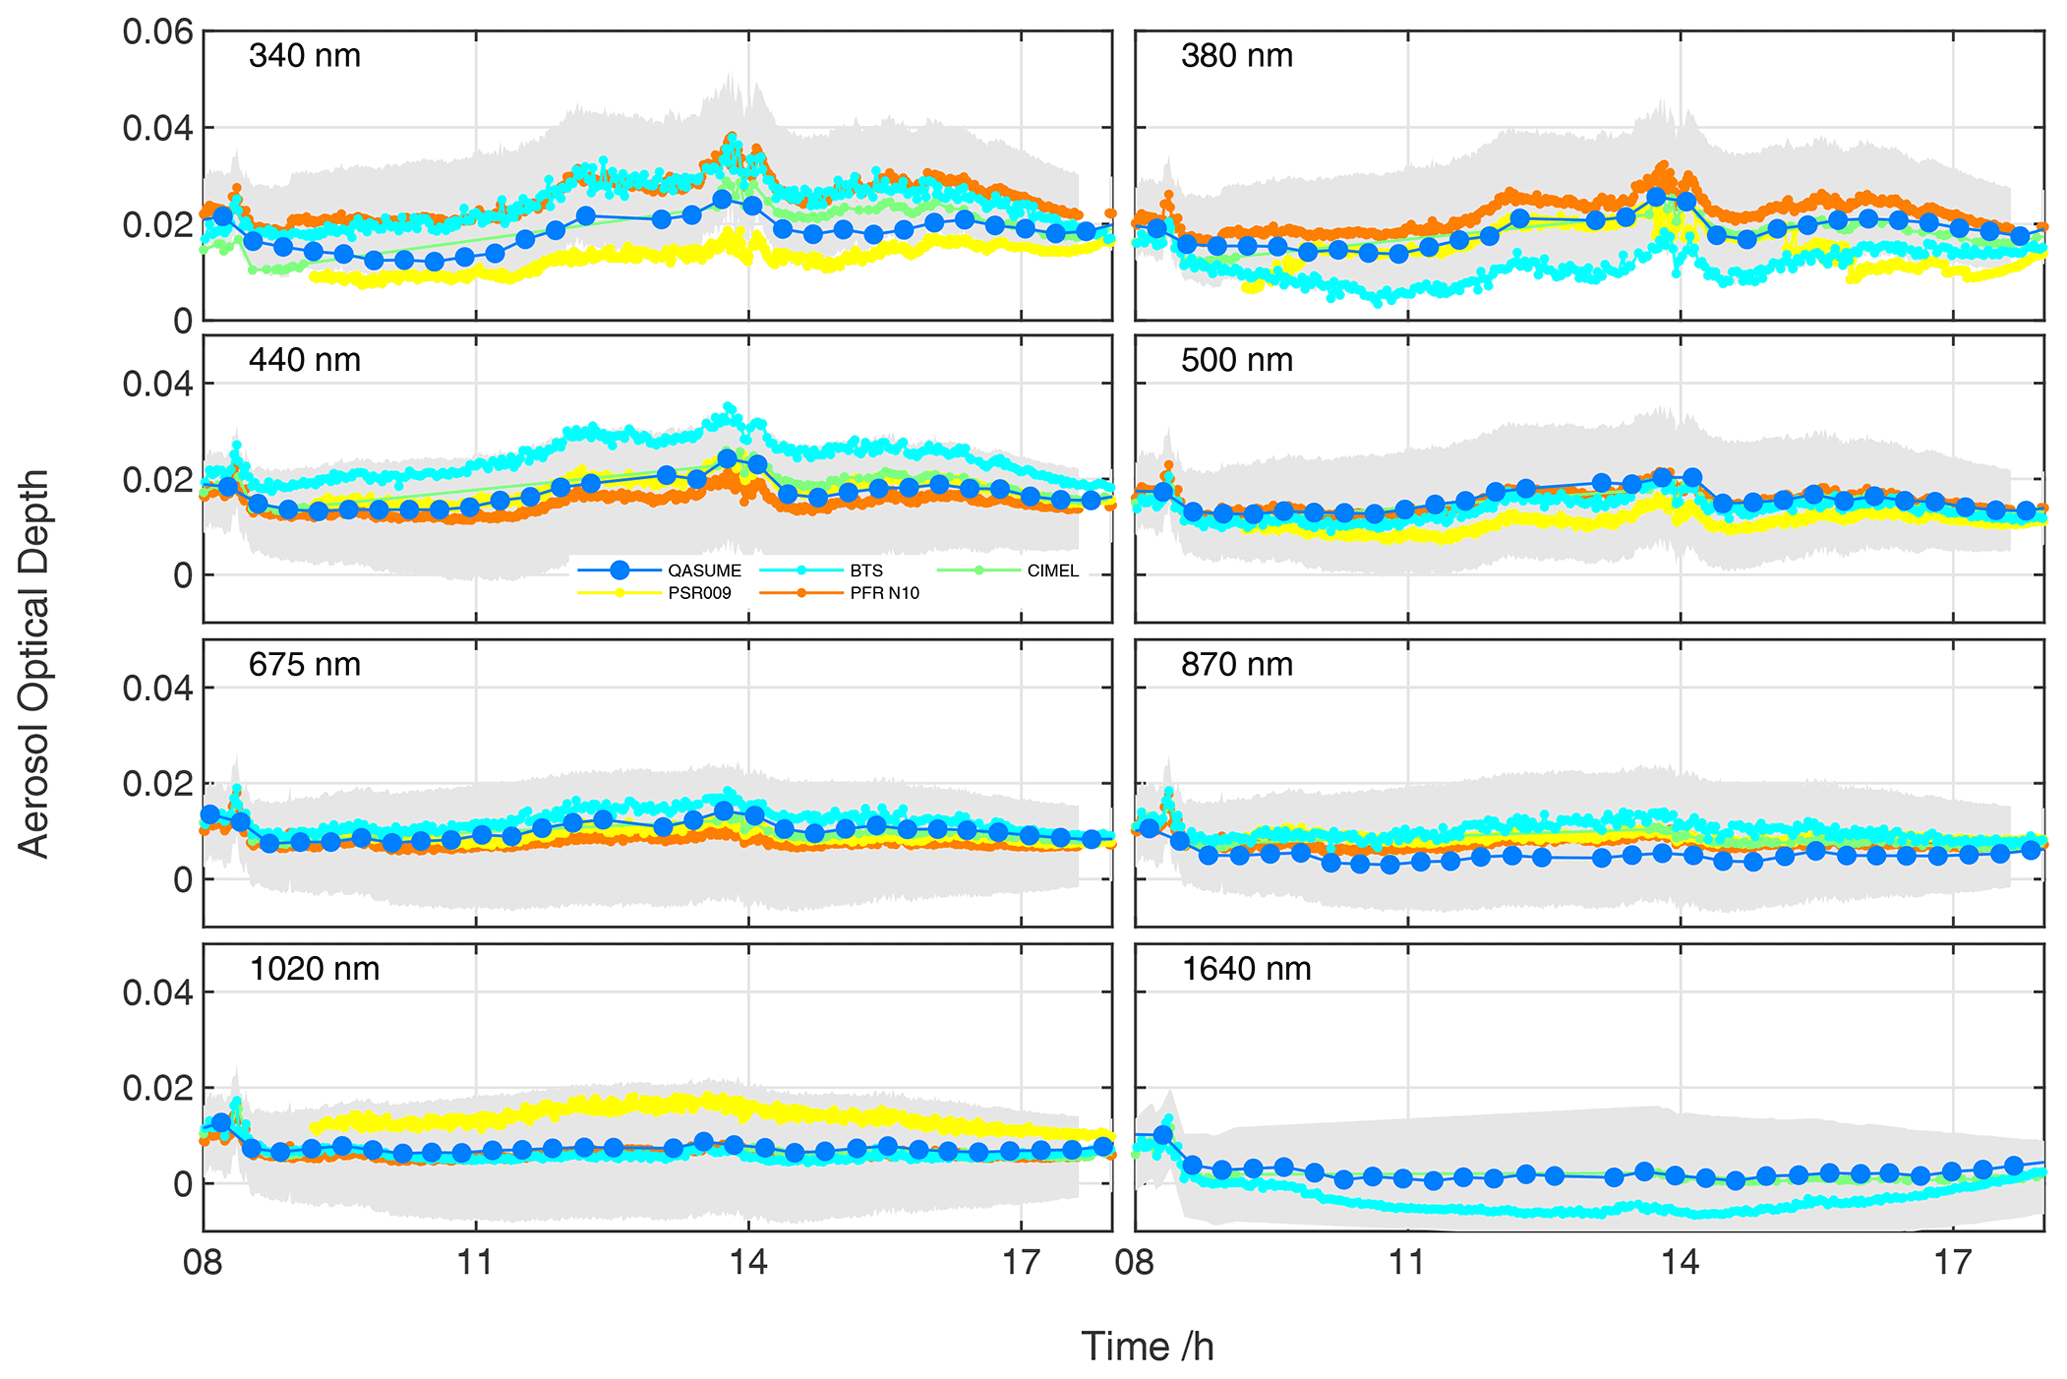
Figure 8Diurnal variation in the AOD on 13 September 2022 for the spectral channels of the Cimel sun photometer. The AOD from QASUME and QASUME-IR (blue dots), the BTS (light blue), and the PSR (yellow) are averaged over a 5 nm wide spectral band centred on the respective wavelength. The AODs from the PFR (orange) shown at 340, 380, and 440 nm were interpolated to the nearby spectral channels of the Cimel sun photometer (green) using the Ångström coefficients retrieved from its four spectral channels. The measurements of QASUME-IR and the BTS at nominally 1640 nm were obtained from averaging their measurements at 1560 nm to avoid the trace gas absorptions at 1640 nm. The grey area represents the WMO limit in which the measurements between different instruments are assumed equivalent.
Considering the very low AOD on this day, the agreement between the instruments is excellent and well within the WMO criterion. Especially noteworthy is that the AOD from the two filter radiometers is obtained using the zero-air-mass extrapolation from this measurement period, while the AOD from the spectroradiometers are based on solar irradiance measurements and an independent solar ToA solar spectrum. One should note that the slightly negative AOD values by the BTS at 1640 nm only arise due to the extremely low AOD at this wavelength; while being clearly unphysical, they are still within 0.01 of the Cimel radiometer and QASUME-IR and thus within the WMO criterion.
Figures S1 to S9 in the Supplement to this paper show the diurnal variation for the other cloud-free days of the intercomparison.
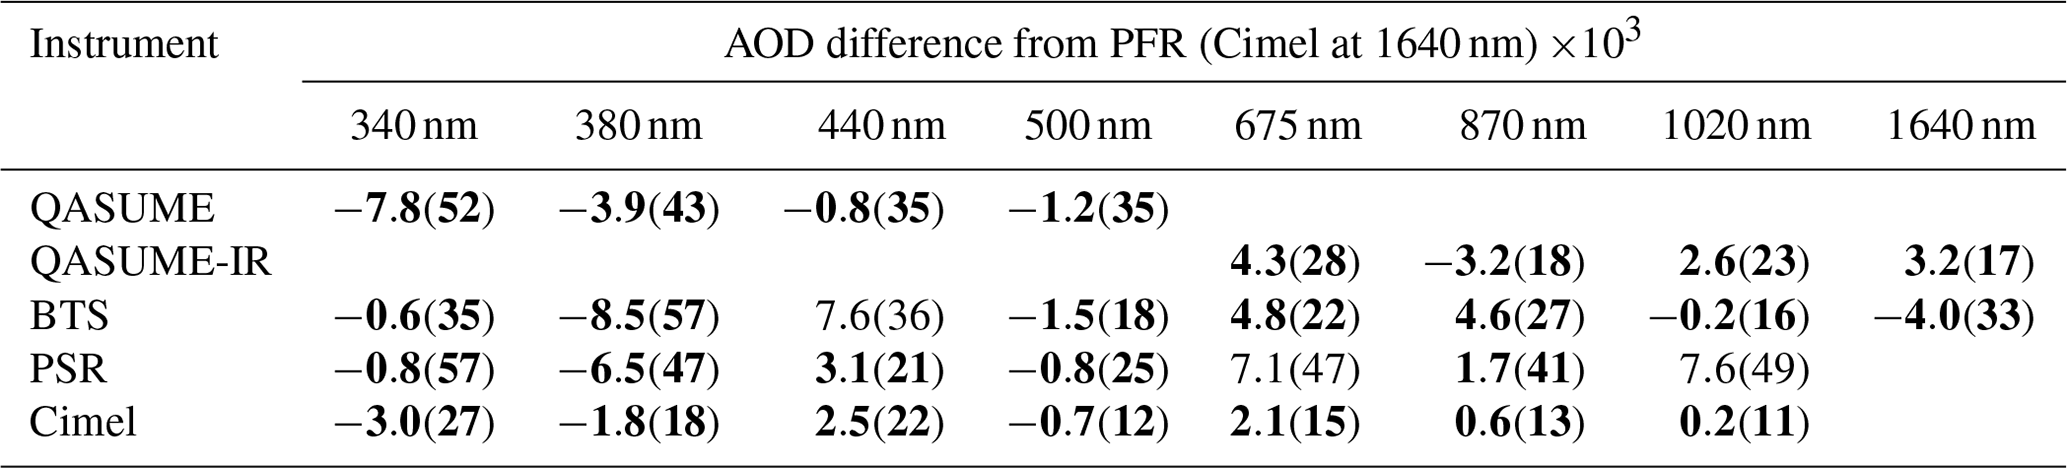
The complete datasets of spectral aerosol optical depth from the 10 cloud-free days were also compared to the PFR at all channels below 1640 nm, while for this channel the Cimel radiometer was used. Table 4 provides a summary of this comparison as averages and standard deviations for all instruments and at all spectral channels. The bold values shown in the table also indicate that the datasets meet the WMO criterion; i.e. 95 % of the available data are within the WMO limit as defined previously. As can be seen in the table, the agreement is excellent, with average differences below 0.01 for all instruments and at all spectral channels (which is also the reported AOD uncertainty of the PFR and Cimel sun photometers). Furthermore, the WMO criterion is met in all but three cases, demonstrating that the spectroradiometers and the reference radiometers meet the WMO equivalency criterion at nearly all spectral channels.
Table 4Average AOD differences and their standard deviations from the following cloud-free days: 6, 7, 8, 9, 10, 13, 14, 15, 17, and 22 September 2022 using QASUME, QASUME-IR, the BTS, the PSR, and Cimel relative to the PFR for the selected spectral channels of the sun photometers. The comparison at 1640 nm is done relative to the Cimel since the PFR does not have a corresponding channel in this spectral range. The bold values indicate that for this particular spectral channel and instrument, 95 % or more of the data are within the WMO limits with respect to the reference instrument.
A further comparison between the AOD retrieved from the QASUME and QASUME-IR spectroradiometers and a number of narrowband filter radiometers was performed during the Fifth WMO Filter Radiometer Comparison (FRC-V) held at PMOD/WRC in Davos, Switzerland, from 27 September to 25 October 2021. This comparison occurred prior to the campaign presented here and produced similarly consistent results with the reference sun photometers deployed at the FRC-V (Kazadzis et al., 2023). The FRC-V also indicated that the AODs derived from solar spectra traceable to the SI are consistent with the AODs derived by reference sun photometers and are within the WMO limits when using well-calibrated spectroradiometers and an accurate ToA solar spectrum, such as the TSIS-1 HSRS or QASUMEFTS. The FRC-V was additionally interesting because the measurements took place at a measurement site at mid-latitudes and not at one of the main high-altitude calibration sites where most of these reference filter radiometers were calibrated using zero-air-mass extrapolations.
Spectral measurements of direct solar irradiance traceable to the SI were performed by several spectroradiometers during a 3-week campaign at the Izaña Atmospheric Observatory (IZO) located on the island of Tenerife, Canary Islands, Spain. The QASUME and QASUME-IR spectroradiometers were calibrated daily using low-power lamps and a portable calibrator to provide traceability to the SI and ultimately to the high-temperature blackbody of PTB, while the PSR was calibrated before and after the campaign in the laboratory of PMOD/WRC. The BTS spectroradiometers were calibrated partly at PTB and at the ISO 17025 calibration laboratory of Gigahertz Optik GmbH. During the campaign, the system was checked with a portable calibrator.
The spectroradiometers measured direct solar spectral irradiance in the spectral range 300 to 550 nm (QASUME), 550 to 1700 nm (QASUME-IR), 300 to 2100 nm (BTS), and 316 to 1030 nm (PSR), with relative standard uncertainties of 0.7 %, 0.95 %2.1 %, and 0.9 % for QASUME/QASUME-IR, the BTS (below/above 1000 nm), and the PSR respectively. The uncertainty budget of QASUME/QASUME-IR was validated prior to this campaign at PTB by measuring the spectral irradiances of the high-temperature blackbody BB3200pg and from the tuneable laser facility TULIP and comparing them to the spectral irradiance scale obtained in the laboratory of PMOD/WRC using a set of transfer standard tungsten–halogen lamps traceable to the same high-temperature blackbody.
The ToA solar irradiance spectrum was retrieved from the solar irradiance measurements using zero-air-mass extrapolation during cloud-free conditions and was compared to the TSIS-1 HSRS. The agreement between the extrapolated ToA solar spectra and TSIS-1 HSRS was excellent and well within the combined uncertainties of the spectroradiometers over the full spectral range. Especially the measurements of QASUME/QASUME-IR between 300 and 1700 nm were within 1 % (peak to peak) of the TSIS-1 HSRS in the spectral regions not affected by trace gas absorptions. Based on this comparison, the measurements of QASUME could be used to reduce the stated relative standard uncertainty of the TSIS-1 HSRS ToA solar spectrum in the spectral range 308 to 400 nm from 1.3 % to 0.8 %.
The spectral AODs retrieved from the solar measurements of the spectroradiometers using the TSIS-1 HSRS as the reference solar spectrum for the ToA were compared to the AOD from two reference narrowband filter radiometers belonging to the GAW-PFR network and AERONET. The agreement in nearly all common spectral channels of the radiometers was well within the acceptance limits defined by the WMO.
These measurements demonstrate that it is now possible to retrieve spectral AOD over the extended spectral range from 300 to 1700 nm using solar irradiance measurements traceable to the SI using laboratory-calibrated spectroradiometers with similar quality to that from traditional Langley-based calibrated instruments. The main improvement to previous investigations is the recent availability of the high-spectral-resolution TSIS-1 HSRS with very low uncertainties, which provides the ToA reference for the spectral atmospheric transmission measurements obtained from ground-based solar irradiance measurements.
While the spectral AOD retrieved from traceable spectral solar irradiance measurements of the spectroradiometers has been shown to be in excellent agreement with the AOD from AERONET and GAW-PFR sun photometers, the corresponding uncertainty is still slightly higher than in the latter due essentially to the uncertainty in the spectral atmospheric transmission measurement resulting from the combined uncertainty in the ToA solar spectrum and in the ground-based measurements.
Nevertheless, the significant improvement of this study is that AOD can now be retrieved from solar irradiance measurements fully traceable to the SI. Furthermore, this process does not rely anymore on Langley-based calibrations of reference radiometers performed at high-altitude sites with consequent loss of traceability after their relocation to their respective network calibration sites.
While global aerosol remote sensing networks such as AERONET or GAW-PFR will most probably keep their established calibration techniques for network filter radiometers through outdoor comparisons with reference radiometers, traceability of the network radiometers could be achieved through calibrating these reference radiometers with respect to the SI. This could be achieved through regular calibrations of the reference radiometers in the laboratory using tuneable laser systems at suitably equipped facilities as has been demonstrated with PFR N01 (Kouremeti et al., 2022). A second traceability route could use collocated reference PFR radiometers at network calibration sites as is planned to be implemented at the Centre for Aerosol Remote Sensing (CARS) of ACTRIS, which operates the European component of AERONET. At these sites, network CARS–AERONET radiometers are calibrated annually with respect to the master CARS–AERONET radiometers; PFR radiometers traceable to the SI would be operated simultaneously with the ACTRIS–AERONET master radiometers and would thereby extend the traceability to the whole CARS–AERONET network. Which of these traceability routes will be finally implemented is currently being discussed.
The main datasets used in this study are available at the following community link on Zenodo, https://zenodo.org/communities/19env04-mapp (last access: 5 October 2023), and specifically at https://doi.org/10.5281/zenodo.8043872 (Gröbner et al., 2023) and at https://doi.org/10.5281/zenodo.7984890 (Mottungan et al., 2023).
The supplement related to this article is available online at: https://doi.org/10.5194/amt-16-4667-2023-supplement.
JG analysed the QASUME and BTS datasets and wrote the manuscript; NK operated the PSR and PFRs and analysed their data; RZ and MR operated the BTS; GH operated QASUME and QASUME-IR; SN, PS, PS, and KS calibrated QASUME, QASUME-IR, the BTS, and the PSR at PTB; AB provided data from Cimel and organised the campaign; SK supported the PFR analysis and provided comments on the manuscript; TG, KM, DM, and MC operated the FTIR, analysed the data, and wrote the relevant section.
At least one of the (co-)authors is a member of the editorial board of Atmospheric Measurement Techniques. The peer-review process was guided by an independent editor, and the authors also have no other competing interests to declare.
Publisher’s note: Copernicus Publications remains neutral with regard to jurisdictional claims made in the text, published maps, institutional affiliations, or any other geographical representation in this paper. While Copernicus Publications makes every effort to include appropriate place names, the final responsibility lies with the authors.
The authors would also like to thank the staff of the Izaña Atmospheric Observatory for their support during the campaign and for providing the ancillary data used in the analysis.
This work has been supported by the European Metrology Program for Innovation and Research (EMPIR) within the joint research project EMPIR 19ENV04 MAPP “Metrology for aerosol optical properties” and is also based upon work from COST Action HARMONIA, CA21119, supported by COST (European Cooperation in Science and Technology).
This paper was edited by Vassilis Amiridis and reviewed by Odele Coddington and one anonymous referee.
Bodhaine, B. A., Wood, N. B., Dutton, E. G., and Slusser, J. R.: On Rayleigh Optical Depth Calculations, J. Atmos. Ocean. Tech., 16, 1854–1861, 1999. a
Coddington, O. M., Richard, E. C., Harber, D., Pilewskie, P., Woods, T. N., Chance, K., Liu, X., and Sun, K.: The TSIS-1 Hybrid Solar Reference Spectrum. Geophys. Res. Lett., 48, e2020GL091709, https://doi.org/10.1029/2020GL091709, 2021. a, b, c, d, e
Egli, L., Gröbner, J., Hülsen, G., Schill, H., and Stübi, R.: Traceable total ozone column retrievals from direct solar spectral irradiance measurements in the ultraviolet, Atmos. Meas. Tech., 15, 1917–1930, https://doi.org/10.5194/amt-15-1917-2022, 2022. a
Elsey, J., Coleman, M. D., Gardiner, T., and Shine, K. P.: Can measurements of the near-infrared solar spectral irradiance be reconciled? A new ground-based assessment between 4,000 and 10,000 cm−1, Geophys. Res. Lett., 44, 10071–10080, https://doi.org/10.1002/2017GL073902, 2017. a
Elsey, J., Coleman, M. D., Gardiner, T. D., Menang, K. P., and Shine, K. P.: Atmospheric observations of the water vapour continuum in the near-infrared windows between 2500 and 6600 cm−1, Atmos. Meas. Tech., 13, 2335–2361, https://doi.org/10.5194/amt-13-2335-2020, 2020. a
Forgan, B.: General method for calibrating Sun photometers, Appl. Optics, 33, 4841–4850, 1994. a
Fox, N. and Green, P.: Traceable Radiometry Underpinning Terrestrial- and Helio-Studies (TRUTHS): An Element of a Space-Based Climate and Calibration Observatory, Remote Sens.-Basel, 12, 2400, https://doi.org/10.3390/rs12152400, 2020. a, b
Giles, D. M., Sinyuk, A., Sorokin, M. G., Schafer, J. S., Smirnov, A., Slutsker, I., Eck, T. F., Holben, B. N., Lewis, J. R., Campbell, J. R., Welton, E. J., Korkin, S. V., and Lyapustin, A. I.: Advancements in the Aerosol Robotic Network (AERONET) Version 3 database – automated near-real-time quality control algorithm with improved cloud screening for Sun photometer aerosol optical depth (AOD) measurements, Atmos. Meas. Tech., 12, 169–209, https://doi.org/10.5194/amt-12-169-2019, 2019. a
Gröbner, J. and Kouremeti, N.: The Precision solar Spectroradiometer (PSR) for direct solar irradiance measurements, Sol. Energy, 185, 199–210, 2019. a, b
Gröbner, J. and Sperfeld, P.: Direct traceability of the portable QASUME irradiance scale to the primary irradiance standard of the PTB, Metrologia, 42, 134–139, 2005. a, b
Gröbner, J., Schreder, J., Kazadzis, S., Bais, A. F., Blumthaler, M., Görts, P., Tax, R., Koskela, T., Seckmeyer, G., Webb, A. R., and Rembges, D.: Traveling reference spectroradiometer for routine quality assurance of spectral solar ultraviolet irradiance measurements, Appl. Optics, 44, 5321–5331, 2005. a
Gröbner, J., Kröger, I., Egli, L., Hülsen, G., Riechelmann, S., and Sperfeld, P.: The high-resolution extraterrestrial solar spectrum (QASUMEFTS) determined from ground-based solar irradiance measurements, Atmos. Meas. Tech., 10, 3375–3383, https://doi.org/10.5194/amt-10-3375-2017, 2017. a, b, c, d, e
Gröbner, J., Schill, H., Egli, L., and Stübi, R.: Consistency of total column ozone measurements between the Brewer and Dobson spectroradiometers of the LKO Arosa and PMOD/WRC Davos, Atmos. Meas. Tech., 14, 3319–3331, https://doi.org/10.5194/amt-14-3319-2021, 2021. a
Gröbner, J., Kouremeti, N., Zuber, R., and Hülsen G.: Datasets of AOD and Top of Atmosphere solar spectra discussed in publication AMT-2023-105, Version 1.0, Zenodo [data set], https://doi.org/10.5281/zenodo.8043872, 2023. a
Holben, B. N., Eck, T. F., Slutsker, I., Tanre, D., Buis, J. P., Setzer, A., Vermote, E., Reagan, J. A., Kaufman, Y. J., Nakajima, T., Lavenu, F., Jankowiak, I., and Smirnov, S.: AERONET – A Federated Instrument Network and Data Archive for Aerosol Characterization, Remote Sens. Environ., 66, 1–16, 1998. a, b, c
Hülsen, G., Gröbner, J., Nevas, S., Sperfeld, P., Egli, L., Porrovecchio, G., and Smid, M.: Traceability of solar UV measurements using the QASUME reference spectroradiometer, Appl. Optics, 55, 7265–7275, 2016. a, b, c
IPCC: Climate Change 2021: The Physical Science Basis. Contribution of Working Group I to the Sixth Assessment Report of the Intergovernmental Panel on Climate Change, edited by: Masson-Delmotte, V., Zhai, P., Pirani, A., Connors, S. L., Péan, C., Berger, S., Caud, N., Chen, Y., Goldfarb, L., Gomis, M. I., Huang, M., Leitzell, K., Lonnoy, E., Matthews, J. B. R., Maycock, T. K., Waterfield, T., Yelekçi, O., Yu, R., and Zhou, B., Cambridge University Press, Cambridge, United Kingdom and New York, NY, USA, 2391 pp., https://doi.org/10.1017/9781009157896, 2021. a
Kazadzis, S., Kouremeti, N., Nyeki, S., Gröbner, J., and Wehrli, C.: The World Optical Depth Research and Calibration Center (WORCC) quality assurance and quality control of GAW-PFR AOD measurements, Geosci. Instrum. Method. Data Syst., 7, 39–53, https://doi.org/10.5194/gi-7-39-2018, 2018. a, b, c
Kazadzis, S., Kouremeti, N., and Gröbner, J.: Fifth WMO Filter Radiometer Comparison (FRC-V) 27 September to 25 October 2021, Davos, Switzerland, WMO GAW report 280, https://library.wmo.int/records/item/66263-fifth-wmo-filter-radiometer-comparison-frc-v?offset=5 (last access: 5 October 2023), 2023. a
Kiedron, P. W. and Michalsky, J. J.: Non-parametric and least squares Langley plot methods, Atmos. Meas. Tech., 9, 215–225, https://doi.org/10.5194/amt-9-215-2016, 2016. a
Kouremeti, N., Nevas, S., Kazadzis, S., Gröbner, J., Schneider, P., and Schwind, K. M.: SI-traceable solar irradiance measurements for aerosol optical depth retrieval, Metrologia, 59, 044001, https://doi.org/10.1088/1681-7575/ac6cbb, 2022. a, b, c, d
Mottungan, K., Gardiner, T., Medland, D., and Coleman, M.: High Resolution Langley, Version 1, Zenodo [data set], https://doi.org/10.5281/zenodo.7984890, 2023. a, b
Nakajima, T., Campanelli, M., Che, H., Estellés, V., Irie, H., Kim, S.-W., Kim, J., Liu, D., Nishizawa, T., Pandithurai, G., Soni, V. K., Thana, B., Tugjsurn, N.-U., Aoki, K., Go, S., Hashimoto, M., Higurashi, A., Kazadzis, S., Khatri, P., Kouremeti, N., Kudo, R., Marenco, F., Momoi, M., Ningombam, S. S., Ryder, C. L., Uchiyama, A., and Yamazaki, A.: An overview of and issues with sky radiometer technology and SKYNET, Atmos. Meas. Tech., 13, 4195–4218, https://doi.org/10.5194/amt-13-4195-2020, 2020. a
Richard, E., Harber, D., Coddington, O., Drake, G., Rutkowski, J., Triplett, M., Pilewskie, P., and Woods, T.: SI-traceable spectral irradiance radiometric characterization and absolute calibration of the TSIS-1 Spectral Irradiance Monitor (SIM), Remote Sens.-Basel, 12, 1818, https://doi.org/10.3390/rs12111818, 2020. a
Serdyuchenko, A., Gorshelev, V., Weber, M., Chehade, W., and Burrows, J. P.: High spectral resolution ozone absorption cross-sections – Part 2: Temperature dependence, Atmos. Meas. Tech., 7, 625–636, https://doi.org/10.5194/amt-7-625-2014, 2014. a
Shaw, G. E.: Sun photometry, B. Am. Meteorol. Soc., 64, 4–10, 1983. a
Studer, S., Hocke, K., Schanz, A., Schmidt, H., and Kämpfer, N.: A climatology of the diurnal variations in stratospheric and mesospheric ozone over Bern, Switzerland, Atmos. Chem. Phys., 14, 5905–5919, https://doi.org/10.5194/acp-14-5905-2014, 2014. a
Toledano, C., González, R., Fuertes, D., Cuevas, E., Eck, T. F., Kazadzis, S., Kouremeti, N., Gröbner, J., Goloub, P., Blarel, L., Román, R., Barreto, Á., Berjón, A., Holben, B. N., and Cachorro, V. E.: Assessment of Sun photometer Langley calibration at the high-elevation sites Mauna Loa and Izaña, Atmos. Chem. Phys., 18, 14555–14567, https://doi.org/10.5194/acp-18-14555-2018, 2018. a, b, c, d, e
Wehrli, C.: Calibrations of filter radiometers for determination of atmospheric optical depths, Metrologia, 37, 419–422, 2000. a
WMO: WMO/GAW Experts workshop on a global surface-based network for long term observations of column aerosol optical properties, edited by: Baltensperger, U., Barries, L., and Wehrli, C., GAW Report 162, WMO/TD-No. 1287, https://library.wmo.int/idurl/4/41246 (last access: 5 October 2023), 2005. a
Zuber, R., Ribnitzky, M., Tobar, M., Lange, K., Kutscher, D., Schrempf, M., Niedzwiedz, A., and Seckmeyer, G.: Global spectral irradiance array spectroradiometer validation according to WMO, Meas. Sci. Technol., 29, 105801, https://doi.org/10.1088/1361-6501/aada34, 2018. a