the Creative Commons Attribution 4.0 License.
the Creative Commons Attribution 4.0 License.
 | 25 Oct 2023
Aerosol properties derived from ground-based Fourier transform spectra within the COllaborative Carbon Column Observing Network
Óscar Alvárez
África Barreto
Omaira E. García
Frank Hase
Rosa D. García
Julian Gröbner
Sergio F. León-Luis
Eliezer Sepúlveda
Virgilio Carreño
Antonio Alcántara
Ramón Ramos
A. Fernando Almansa
Stelios Kazadzis
Noémie Taquet
Carlos Toledano
Emilio Cuevas
Fourier transform infrared (FTIR) spectroscopy is particularly relevant for climate studies due to its ability to provide information on both fine absorption structures (i.e. trace gases) and broadband continuum signatures (i.e. aerosols or water continuum) across the entire infrared (IR) domain. In this context, this study assesses the capability of the portable and compact EM27/SUN spectrometer, used within the research infrastructure COCCON (COllaborative Carbon Column Observing Network), to retrieve spectral aerosol properties from low-resolution FTIR solar absorption spectra (0.5 cm−1). The study focuses on the retrieval of aerosol optical depth (AOD) and its spectral dependence in the 873–2314 nm spectral range from COCCON measurements at the subtropical high-mountain Izaña Observatory (IZO, Tenerife, Spain), which were coincidentally carried out with standard sun photometry within the Aerosol Robotic Network (AERONET) in the 3-year period from December 2019 to September 2022. The co-located AERONET–COCCON database was used to cross-validate these two independent techniques in the common spectral range (870–1640 nm), demonstrating an excellent agreement at the near-coincident spectral bands (mean AOD differences limited to 0.005, standard deviations up to 0.021 and Pearson regression coefficients up to 0.97). This indicates that the low-resolution COCCON instruments are suitable for detecting the aerosol broadband signal contained in the IR spectra in addition to the retrieval of precise trace gas concentrations, provided a robust calibration procedure (Langley-based or absolute calibration procedures) is used to compensate for the optical degradation of the external system (∼ 0.72 % per month). The study also assesses the capability of the EM27/SUN to simultaneously infer aerosols and trace gases and relate their common emission sources in two case study events: a volcanic plume from the La Palma eruption in 2021 and a nearby forest fire in Tenerife in 2022. Overall, our results demonstrate the potential of the portable low-resolution COCCON instruments to enhance the multi-parameter capability of the FTIR technique for atmospheric monitoring.
- Article
(3464 KB) - Full-text XML
- BibTeX
- EndNote


Atmospheric aerosols play a significant role in climate. Despite their short lifetime in the troposphere, aerosols are the second-largest contributor to climate change (Li et al., 2022). They are recognised as an “essential climate variable” by the Global Climate Observing System (GCOS) World Meteorological Organization (WMO) programme (Bojinski et al., 2014) and are a key focus area for the WMO Global Atmosphere Watching (GAW) programme. Over the years, the scientific community has increasingly focused on atmospheric aerosols, and the most recent assessment report by the Intergovernmental Panel on Climate Change (IPCC) estimated the total effective radiative forcing (ERF) due to aerosols over the industrial era to be negative (−11.1 W m−2), with a reduced level of uncertainty compared to the previous IPCC report (Forster et al., 2021). This enhanced understanding of aerosol processes has been made possible by a combination of improved observational analyses and data-assimilated reanalyses (Ma et al., 2014; Benedetti et al., 2018; Rémy et al., 2018; Kinne, 2019; Bellouin et al., 2020; Chen et al., 2022), together with improved modelling approaches (Forster et al., 2021, and references therein), and can be considered relevant in the context of near-term and long-term climate mitigation and decarbonisation strategies (Dreyfus et al., 2022).
To further advance our understanding of atmospheric aerosols, the WMO considers the development of new, reliable and SI-traceable (International System of Units) measurement techniques and non-conventional measurement methods, with an open availability of validation data, as a core activity (WMO, 2010, 2017). Ground-based remote sensing has made recent advancements in this regard, allowing us to monitor aerosol microphysical and optical properties from observations of atmospheric spectral transmission with excellent spacial and temporal (long-term) coverage (Holben et al., 2001; Smirnov et al., 2002; Torres et al., 2017; Cuevas et al., 2019b; Nakajima et al., 2020; Karanikolas et al., 2022, among others).
Spectrometers and spectroradiometers provide excellent spectral performance across a wide range of the solar irradiance spectrum (Gröbner et al., 2017; Gröbner and Kouremeti, 2019; García-Cabrera et al., 2020; Egli et al., 2022; García et al., 2023), enabling radiometric information to be extended to other spectral regions far from the common ultraviolet (UV) and visible (VIS) regions (Barreto et al., 2020; Frausto-Vicencio et al., 2023). For instance, recent works have shown that high-resolution solar spectroscopic measurements from Fourier transform infrared (FTIR) spectrometers can be used to retrieve the spectral aerosol optical depth (AOD) and their spectral dependence in the infrared (IR) region, despite the instrument not being designed for the absolute radiometric stability required for aerosol monitoring (Barreto et al., 2020; Frausto-Vicencio et al., 2023). Monitoring aerosols in the IR spectral range can provide useful information for a better characterisation of atmospheric aerosols, especially for large aerosols like mineral dust, which can effectively interact with both solar and terrestrial radiation (Clarisse et al., 2013; Barreto et al., 2020). The significant impact of scattering and absorption processes in the long-wave region, caused by these large particles (Dufresne et al., 2002; Does et al., 2018), may introduce a potential bias towards a radiative cooling effect in existing dust models (Ryder et al., 2019).
This paper focuses on the use of solar spectroscopic ground-based measurements from an EM27/SUN FTIR spectrometer (Gisi et al., 2012; Hase et al., 2016) to retrieve AOD at eight different bands in the near-infrared (NIR) and short-wave infrared (SWIR) spectral regions. The near-infrared (NIR) and short-wave infrared (SWIR) spectral regions are portions of the electromagnetic spectrum that extend beyond the visible light range. NIR refers to wavelengths between approximately 700 and 900 nm, while SWIR refers to wavelengths between approximately 900 and 2500 nm. These regions have unique properties that make them valuable for various applications, including remote sensing, spectroscopy and imaging. The EM27/SUN is a portable, compact and low-resolution FTIR (0.5 cm−1) spectrometer designed to measure the main greenhouse gases (GHGs) in the atmospheric column and is used for this purpose by the COllaborative Carbon Column Observing Network (COCCON) (Frey et al., 2019; Alberti et al., 2022). The simultaneous retrieval of fine absorption structures (i.e. trace gases) and broadband continuum signatures (i.e. aerosols) across the entire NIR and SWIR domains with the same device, within an extended network like COCCON, is a promising opportunity to develop integral GHG–aerosol infrastructure to target the current global challenges in atmospheric composition monitoring. Additionally, the wealth of spectral information available from the EM27/SUN instruments opens up new perspectives related to satellite validation and improves the spectral characterisation of aerosol particles. This, in turn, will help to improve the accuracy in estimating the aerosol radiative effects on climate, especially for larger particles (Ryder et al., 2019; Clarisse et al., 2013).
The EM27/SUN aerosol properties in the 873–2314 nm spectral range have been determined at the subtropical high-mountain Izaña Observatory (IZO, Tenerife, Spain) using COCCON measurements in a 3-year period from December 2019 to September 2022. Firstly, the consistency and quality assessment of this new AOD database are addressed by comparing them to high-precision aerosol observations performed within the Aerosol Robotic Network (AERONET). Secondly, the potential of the EM27/SUN spectrometer to simultaneously monitor aerosols and trace gases for two case studies (forest fire and volcanic emissions) has been evaluated. To address all of these tasks, this paper is structured as follows: Sects. 2 and 3 describe the test site and the instrumentation used (i.e. the EM27/SUN FTIR spectrometer and Cimel CE318-T radiometer), respectively. Section 4 introduces the methodology developed in this study to retrieve the EM27/SUN AOD products and to ensure their quality, while Sect. 5 addresses the consistency and intercomparison study, as well as discussing the multi-parameter capability of the EM27/SUN spectrometer to monitor aerosols and trace gases. Finally, Sect. 6 summarises the most significant results and conclusions drawn from this work.
The Izaña Observatory (IZO) is a high-altitude observatory situated in Tenerife (Canary Islands, Spain) at 2373 m above sea level (at 28.3∘ N, 16.5∘ W). Managed by the Izaña Atmospheric Research Center (IARC), which is part of the State Meteorological Agency of Spain (AEMET), the IZO is located in the North Atlantic subtropical zone that is well known for its free-troposphere conditions, with a dry atmosphere and pristine skies. These conditions are a result of its elevation as well as its location in the descending branch of the northern Hadley circulation cell (Cuevas et al., 2017, 2019b, a, and references therein). Long-term atmospheric monitoring has been recorded under a comprehensive measurement programme at the IZO, contributing to the WMO GAW programme since 1984. In addition, the IZO was designated as a Commission for Instruments and Methods of Observation (CIMO) test bed for aerosols and water vapour remote sensing instruments by the WMO in 2014 (WMO, 2014).
Many international networks for atmospheric monitoring activities have been developed at the IZO. Among them, the FTIR programme was established in 1999 in the framework of a collaboration between the AEMET and the KIT (Karlsruhe Institute of Technology), with the main goals being the long-term monitoring of atmospheric gas composition and the validation of satellite remote sensing measurements and climate models (Schneider et al., 2005; García et al., 2021). Based on high-resolution FTIR measurements (an IFS 125HR spectrometer), these activities have routinely contributed to two of the most prestigious networks for atmospheric gas composition monitoring: NDACC (Network for the Detection of Atmospheric Composition Change, https://www.ndaccdemo.org, last access: 1 March 2023) since 1999 and TCCON (Total Carbon Column Observing Network, https://tccon-wiki.caltech.edu, last access: 1 March 2023) since 2007. Since 2018, NDACC and TCCON activities have been complemented by a portable, low-resolution FTIR spectrometer (a Bruker EM27/SUN), which operates within the COCCON research infrastructure (Frey et al., 2019; Alberti et al., 2022). More information about the IZO and its atmospheric monitoring programmes can be found in Cuevas et al. (2019a).
The IZO is a widely used site for optimal application of the Langley plot technique (Shaw, 1982, 1983) for a variety of activities, such as zero air mass extrapolations for direct sun and moon calibrations or reference radiometric observations (Barreto et al., 2016; Toledano et al., 2018; Cuevas et al., 2019b; García-Cabrera et al., 2020). The observatory serves as a reference calibration site for two of the most important ground-based photometer aerosol networks: National Aeronautics and Space Administration–Aerosol Robotic Network (NASA–AERONET; https://aeronet.gsfc.nasa.gov/; last access: 30 April 2023) and GAW precision-filter radiometers (GAW-PFRs; http://www.pmodwrc.ch/worcc/; last access: 30 April 2023). Additionally, the IZO is used for retrieving the reference top-of-atmosphere (TOA) solar spectrum from the ground at different spectral ranges (Bolsee et al., 2014; Gröbner et al., 2017). Another relevant aspect of the IZO is its proximity to the African continent (approximately 300 km), where the Earth's largest sources of mineral dust are located (Rodríguez et al., 2011; Prospero and Mayol-Bracero, 2013). This fact makes the IZO a unique and strategic location for studying dust transport and dust physical–chemical properties (e.g. Rodríguez et al., 2011; Cuevas et al., 2017; Barreto et al., 2022a, b).
Aerosol characterisation studies have shown that the summer months are related to high AOD conditions at the IZO due to the prevalence of Saharan dust transport, with AOD at 500 nm above 0.1, which can be associated with the presence of large particles (Ångström exponent, AE) at 440–870 nm below 0.25 for pure mineral dust (Guirado, 2015; Berjón et al., 2019; Barreto et al., 2022a, b). Cleaner conditions can be found at this station for the rest of the year, with AOD at 500 nm below 0.1 and AE above 0.6. Overall, mineral dust is the predominant aerosol in the North Atlantic free troposphere, where the IZO is located, ensuring that the IR spectral AOD characterisation performed in this study is mainly focused on mineral dust particles. Exceptionally, the 2021 La Palma eruption gave us the extraordinary opportunity to study volcanic aerosols during our period of study (Milford et al., 2023; García et al., 2023).
3.1 Bruker EM27/SUN
The Bruker EM27/SUN is a robust and portable FTIR spectrometer, which has been developed by KIT in collaboration with Bruker Optics GmbH (Gisi et al., 2012; Hase et al., 2016). This instrument, based on a RockSolid™ pendulum interferometer, acquires solar absorption spectra in the near-infrared region from 4000 to 11 500 cm−1 with a spectral resolution of 0.5 cm−1 (maximum optical path difference, OPDmax, of 1.8 cm), using a CaF2 beamsplitter and two InGaAs photodetectors. The primary detector covers the spectral section between 5500 and 11 500 cm−1, while the secondary detector covers the 4000–5500 cm−1 region (hereafter referred to as InGaAs-1 and InGaAs-2, respectively) (Hase et al., 2016). The field stop of 0.6 mm diameter limits the field of view (FOV), leading to a narrow semi-FOV angle of only 2.96 mrad. While taking solar spectra, the EM27/SUN FOV is automatically centred at the solar disc by means of the solar CamTracker system (Gisi et al., 2011).
In order to increase the signal-to-noise ratio, five forward and backward scans are routinely added in each measurement; thereby, the acquisition of one spectrum lasts about 1 min. The detectors' signal is DC coupled, allowing corrections for solar intensity variations due, for example, to thin clouds (Keppel-Aleks et al., 2007). Then, spectra are generated from the raw interferograms (IFGs) using a preprocessor tool developed by KIT in the framework of the COCCON-PROCEEDS I–III projects funded by the European Space Agency (ESA). This tool includes the so-called DC correction of the IFGs, a dedicated phase correction scheme for double-sided IFGs, and several quality-control tests (Sha et al., 2020; Frey et al., 2021). These quality filters will be used in the quality-control procedure established in this work (see details in Sect. 4.3).
In this work, EM27/SUN solar spectra are used to retrieve aerosol properties. Nonetheless, this FTIR spectrometer is mainly devoted to monitoring different atmospheric trace gas concentrations (O2, CO2, CH4, CO, H2O, among others) under different conditions (e.g. metropolitan areas, mining regions or volcanic eruptions; Hase et al., 2015; Butz et al., 2017; Frey et al., 2019; Tu et al., 2022, and references therein). The IZO EM27/SUN is operated in accordance with COCCON requirements (Frey et al., 2019; Alberti et al., 2022). This guarantees strict common methods for ensuring the quality of measurements (evaluation of the optical alignment and instrumental line shape), proper calibration of all COCCON spectrometers with respect to the TCCON site Karlsruhe and the COCCON reference EM27/SUN spectrometer operated permanently at KIT (in terms of the standard retrieved species), and adherence to the COCCON data analysis scheme to ensure the generation of precise and accurate data products. The COCCON gas data processing and analysis tools are freely available on the COCCON website (https://www.imk-asf.kit.edu/english/COCCON.php, last access: 24 April 2023).
3.2 Cimel CE318-T radiometer
The Cimel CE318-T radiometer, referred to as CE318-AERONET hereafter, is the reference instrument in AERONET for direct solar and diffuse sky measurements. It utilises a two-axis robot to automatically point to the sun and a four-quadrant sensor installed in the radiometer's head for each direct solar and lunar measurement. Solar, lunar and sky measurements are normally taken every ∼ 15 min or at fixed air mass intervals at specific wavelengths, with a FOV of ∼ 1.3∘ (Holben et al., 1998; Torres et al., 2013). In the case of the photometric information used in this paper, Cimel solar observations have been retrieved with a higher frequency, between 2 and 6 min. The instrument is equipped with Silicon and InGaAs detectors and nine narrow band-pass filters, allowing for the recording of wavelengths at 340, 380, 440, 500, 675, 870, 940, 1020 and 1640 nm. The bandwidth, characterised by the full width at half maximum (FWHM), ranges from 2–4 nm in the UV (340–380 nm) to 10 nm in the visible and near-infrared (440–1020 nm) and 25 nm in the short-wave infrared (1640 nm). Additionally, the radiometer has an integrated barometer for atmospheric pressure measurements.
AOD, with its spectral variations, can be calculated from the direct solar and lunar measurements, and the aerosol's microphysical properties can be retrieved from multi-angular observations using operational inversion algorithms (Holben et al., 1998; Giles et al., 2019; Dubovik and King, 2000). The AOD total uncertainty for CE318-AERONET, from UV to NIR, was estimated to be between 0.002–0.009 and 0.01–0.02 for reference and field instruments, respectively, with higher errors expected for UV spectral bands (Eck et al., 1999). A specific analysis is still required to determine the AOD uncertainty in the SWIR (1640 nm). However, the estimated uncertainty of 0.004, determined in Barreto et al. (2020) by comparing the AERONET 1640 product to high-resolution FTIR AOD retrievals, could be considered a conservative uncertainty value for this band.
The current study utilises the level 1.5 version 3 AOD products from the AERONET database, which provides cloud-screened and quality-controlled AOD data.
4.1 Micro-window selection
In order to estimate AOD from FTIR solar absorption spectra, it is necessary to use atmospheric windows with high solar transmission, as this approach avoids strong absorption bands of gases and reduces the impact of gaseous signatures on the EM27/SUN AOD retrievals. In this study, we followed a similar procedure for the AOD calculation, as described by Barreto et al. (2020). We used low-resolution (0.5 cm−1) EM27/SUN solar absorption spectra, acquired at the IZO in the NIR and SWIR spectral ranges, between 4000 and 11 500 cm−1 (corresponding to 870–2500 nm, Fig. 1). As can be read in Fig. 1, the water vapour absorption bands are clearly distinguished from the atmospheric transparent windows normally used in remote sensing studies. Within these atmospheric windows, we selected eight narrow micro-windows for the EM27/SUN AOD retrievals at the central wavelengths of 872.55, 1020.90, 1238.25, 1558.25, 1636.00, 2133.40, 2192.00 and 2314.20 nm (hereafter referred to as B1, B2, B3, B4, B5, B6, B7 and B8 bands, respectively; Table 1). Seven of the presented spectral bands (B2–B8) were selected with respect to those presented in Barreto et al. (2020), while an additional channel (B1) has been incorporated for the purposes of this study due to the wider coverage range of the EM27/SUN InGaAs detector. Thus, micro-windows B1–B5 are recorded by the first InGaAs detector and micro-windows B6–B8 by the second one. Note that both detectors have different gains (greater for InGaAs-2, i.e. B6–B8 micro-windows in SWIR); therefore, the observed spectral behaviour is not the one expected for the solar radiance: the higher the wavelength, the lower the measured radiation. It is also worth highlighting that the solar spectrum displayed in Fig. 1 corresponds directly to the raw radiation signal as observed for both detectors, as in this study the EM27/SUN solar spectra were neither calibrated nor referenced to any traceable lamp.
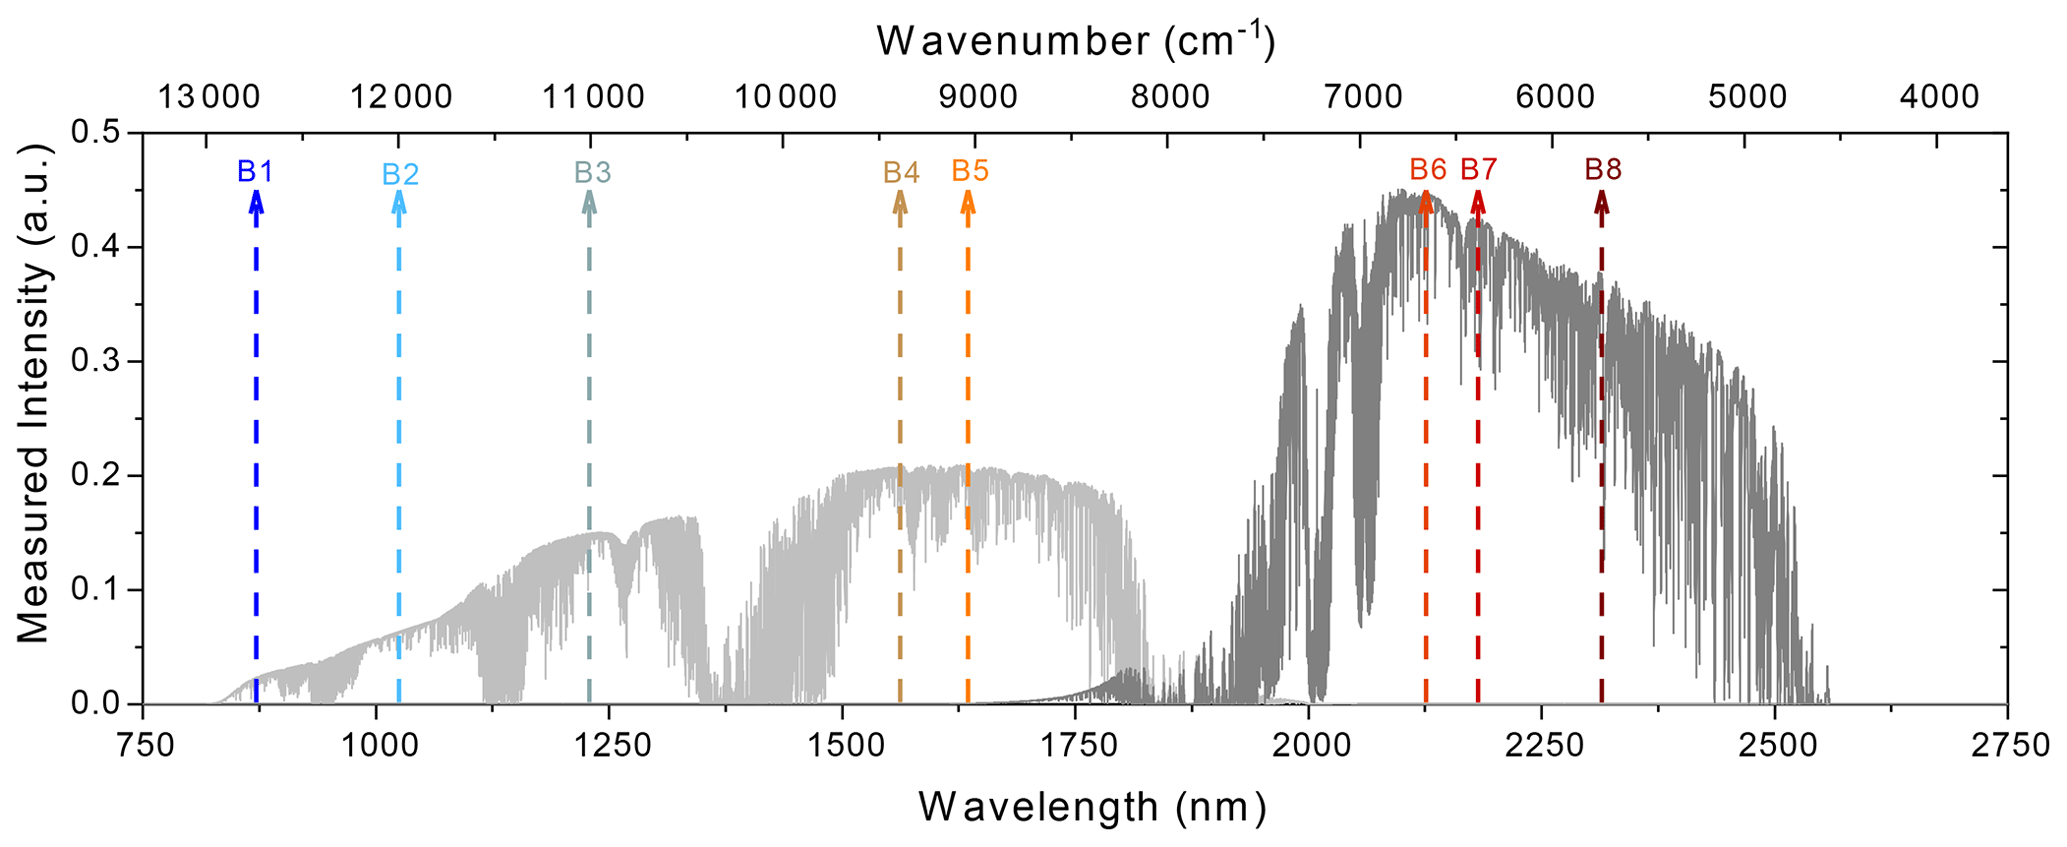
Figure 1The EM27/SUN solar spectrum for the 11 500–4000 cm−1 spectral region, acquired at a spectral resolution of 0.5 cm−1 with the detectors InGaAs-1 and InGaAs-2, displayed as light-grey and grey curves, respectively. The dashed, coloured vertical arrows show the position of the eight narrow spectral bands selected for the EM27/SUN AOD retrievals (B1–B8). The covered spectral range corresponds to 870–2500 nm, with a spectral resolution ranging between 0.04 and 0.27 nm for the B1 and B8 bands, respectively.
Table 1Description of the eight spectral micro-windows used for the EM27/SUN AOD retrievals: spectral range and bandwidth (in nm). It also includes the mean (M) and the standard deviation (σ) of the intra-band coefficient of variation (CV, in %) time series considering all available EM27/SUN solar measurements between December 2019 and September 2021 (N = 56 190) and those acquired for optical air masses (m) smaller than 7 (N = 55 664). The CV is estimated as the ratio between the standard deviation of the raw radiation signal and the mean value in each band. Micro-windows in bold characters represent those bands coincident with CE318-AERONET.
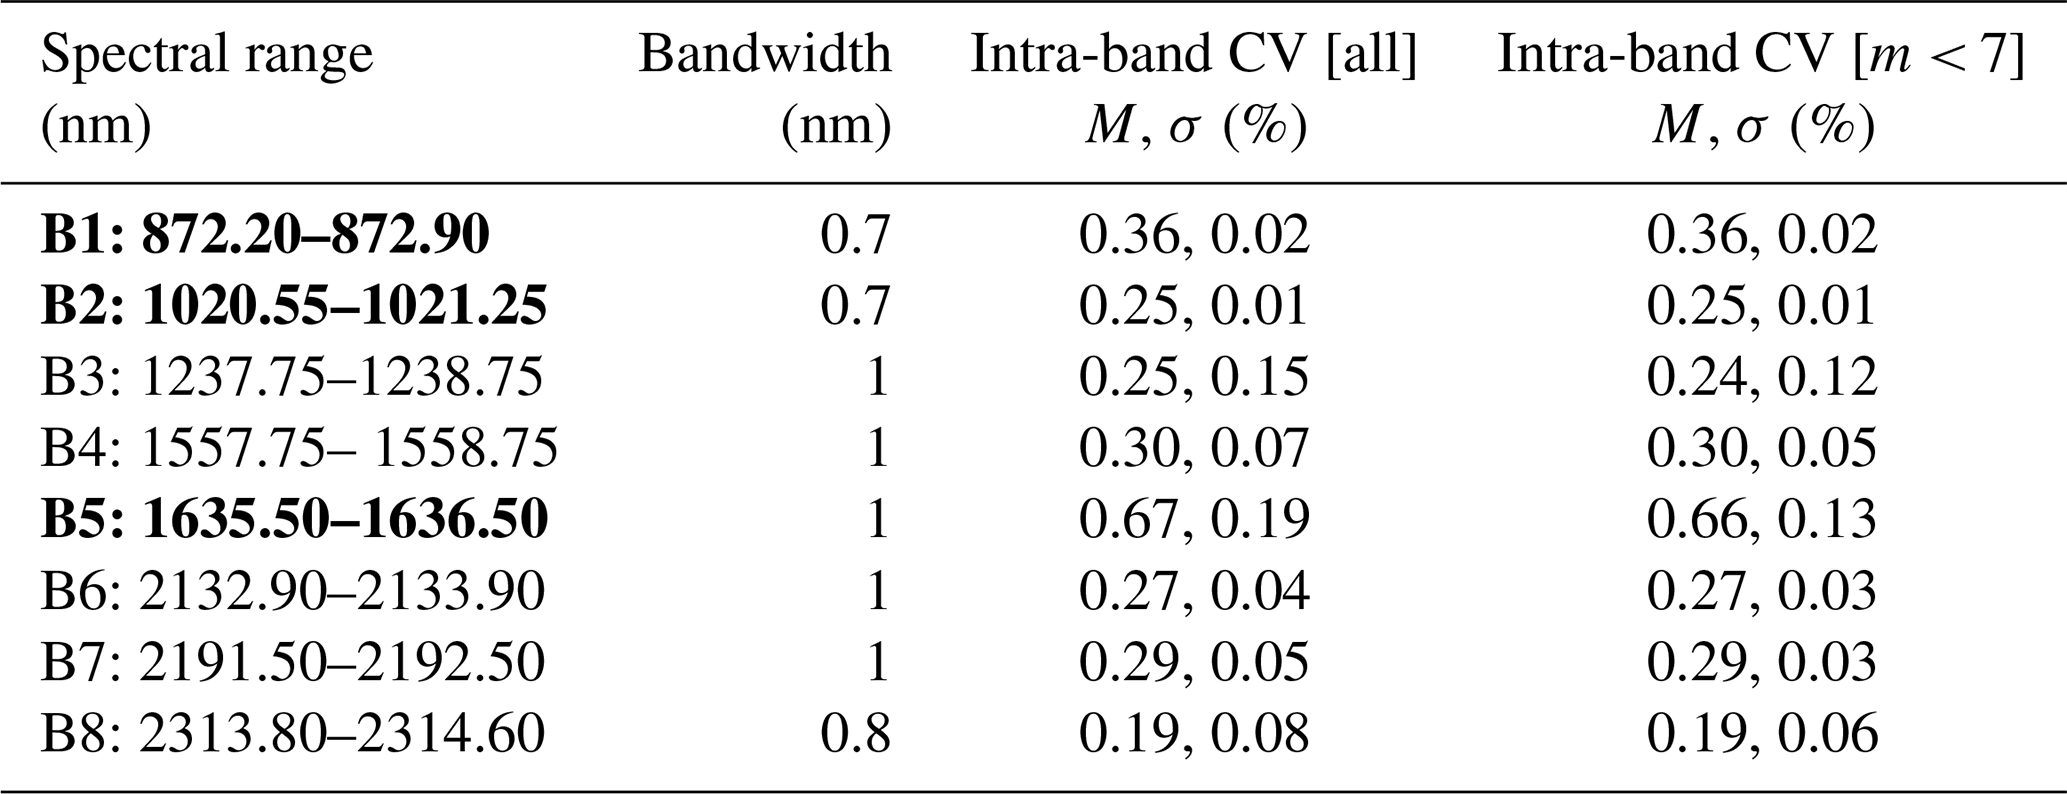
When selecting the optimal micro-windows for AOD retrievals, the temporal stability of the solar radiation and the EM27/SUN instrumental noise should be analysed in detail for each proposed band. To achieve this, we estimated the intra-band coefficient of variation (CV), which is calculated as the standard deviation of radiation counts divided by the mean value in each band. This parameter can be a good indicator of instrumental issues, similar to the signal-to-noise ratio, or the effect of gas absorption interferences within each micro-window (García et al., 2016; Barreto et al., 2020). The EM27/SUN database used for this analysis was filtered according to the criteria defined in Sect. 4.3 about quality-control procedures, resulting in a total number of 187 d between December 2019 and September 2021 (56 190 instantaneous AOD values for each spectral band).
As presented in Table 1, the mean and scatter of the intra-band CV values for the eight EM27/SUN micro-windows (B1–B8) and for the 3-year period are overall consistent among the different bands and with those reported for the high-resolution IFS 125HR spectrometer at the IZO (Barreto et al., 2020). Consistent with these authors, larger variability is expected to be observed in the B3 (0.15 %) and B5 (0.19 %) bands. B3 seems to be somewhat sensitive to the water vapour content, whereas B5 contains CO2 and CH4 absorption lines, leading to an increase in the mean and scatter intra-band CV values provided they are spectrally resolved by the spectrometer. Nonetheless, unlike the IZO IFS 125HR, the EM27/SUN shows considerably lower CV for the B7 (0.05 % compared to 0.27 %), which could be attributed in part to the impact of the different spectral resolutions of the low- and the high-resolution FTIR systems (originally at 0.5 cm−1 in the EM27/SUN and truncated low-resolution 0.5 cm−1 in the case of the IFS 125HR). For the remaining bands, variations are expected to be lower than 0.10 %. Another factor that could account for the observed variability is the range of optical air masses (m) spanned by the measured EM27/SUN solar spectra. This factor may be particularly important at higher solar zenith angles, where air mass changes occur faster than for lower air masses, and measured IFGs are therefore more susceptible to intensity variations. As also listed in Table 1, the intra-band CV retrieved for m below 7 (which is the normal operating range of the common photometers) shows a significant decrease compared to those obtained for all air masses, particularly for bands B3 and B5.
Based on these findings, the proposed EM27/SUN micro-windows could be highly effective in estimating AOD estimation under a wide range of atmospheric conditions.
4.2 Zero air mass extrapolation and AOD calculation
Solar transmittance methods have been used for many years to study aerosol columnar concentration from direct or reflected sunlight measurements. The Beer–Lambert–Bouguer attenuation law is applied to narrow spectral bands (Schmid et al., 1998, 2001), and the retrieval of τa,λ (or AODλ) from direct solar measurements is based on this attenuation law, which can be written as follows:
This equation describes the exponential decay of direct sun measurements at a spectral band centred at the nominal wavelength λ (Vλ). The V0,λ term represents the instrument's signal measured at TOA, and m is the optical air mass. In Eq. (1), the terms τλ and m refer to different attenuators or absorbers in the atmosphere, such as aerosols (τa or AOD and ma); Rayleigh scattering by molecules (τR and mR); or absorption by gases such as O3, NO2 or H2O (τabs and mabs). The distance correction factor has not been included in this study considering the reduced FOV of the EM27, which is much smaller than the solar diameter. We calculated the previous variables following AERONET procedures (Holben et al., 1998; Giles et al., 2019) and the methodology proposed by Barreto et al. (2020). The Langley plot technique (Shaw, 1982, 1983) was used to determine V0,λ, following the criteria defined by Toledano et al. (2018).
The final equation for AODλ or τa,λ determined at the central wavelength λ is retrieved by taking logarithms on both sides of Eq. (1) as follows:
4.3 Cloud mask and quality-control procedure
Three different filters have been implemented in the EM27/SUN data set to avoid cloud-contaminated data and instrumental issues, following the methodology proposed by Barreto et al. (2020). These filters are the following.
-
Cloud mask. The 1 min measurements of co-located global and diffuse short-wave downward radiation were used to screen out cloud-contaminated data (García et al., 2014).
-
Quality control. This process is based on the analysis of the EM27/SUN IFGs and the Langley zero air mass extrapolation.
- a.
COCCON quality filters. As established by COCCON (e.g. Frey et al., 2021), several quality filters are applied on the raw EM27/SUN IFGs, such as requiring a minimum DC level of the maximum detector signal level (5 %), restricting the tolerable DC variation of the measured level (10 %), checking the centreburst location in the IFG and the centreburst amplitudes of forward and backward scans, and the relative amplitude of out-of-band artefacts. The only difference introduced in this work compared to COCCON's standard quality filters is that we applied a more stringent filtering DC criterion, removing IFGs with intensity fluctuations above 1 % and intensities below 1 % of the maximal signal range.
- b.
Flag for non-valid Langley plots. This flag was manually implemented to avoid relevant changes in V0,λ resulting from variations in the instrument's calibration (e.g. mineral dust events or necessary cleaning of external EM27/SUN components).
- a.
As a result of implementing these flags, the original data set between December 2019 and September 2022, containing 59 494 measurements, was filtered up to 9.4 %, resulting in 56 190 quality-controlled observations.
5.1 Top-of-atmosphere reference irradiance determination
The Langley plot method was used in this study to retrieve the V0,λ term and, therefore, to evaluate the radiometric stability of the EM27/SUN system and to calculate spectrally resolved AOD. The developed Langley analysis considers that the derived calibration constant V0,λ is sensitive to any change in atmospheric conditions, which are assumed to be stable during the measurements.
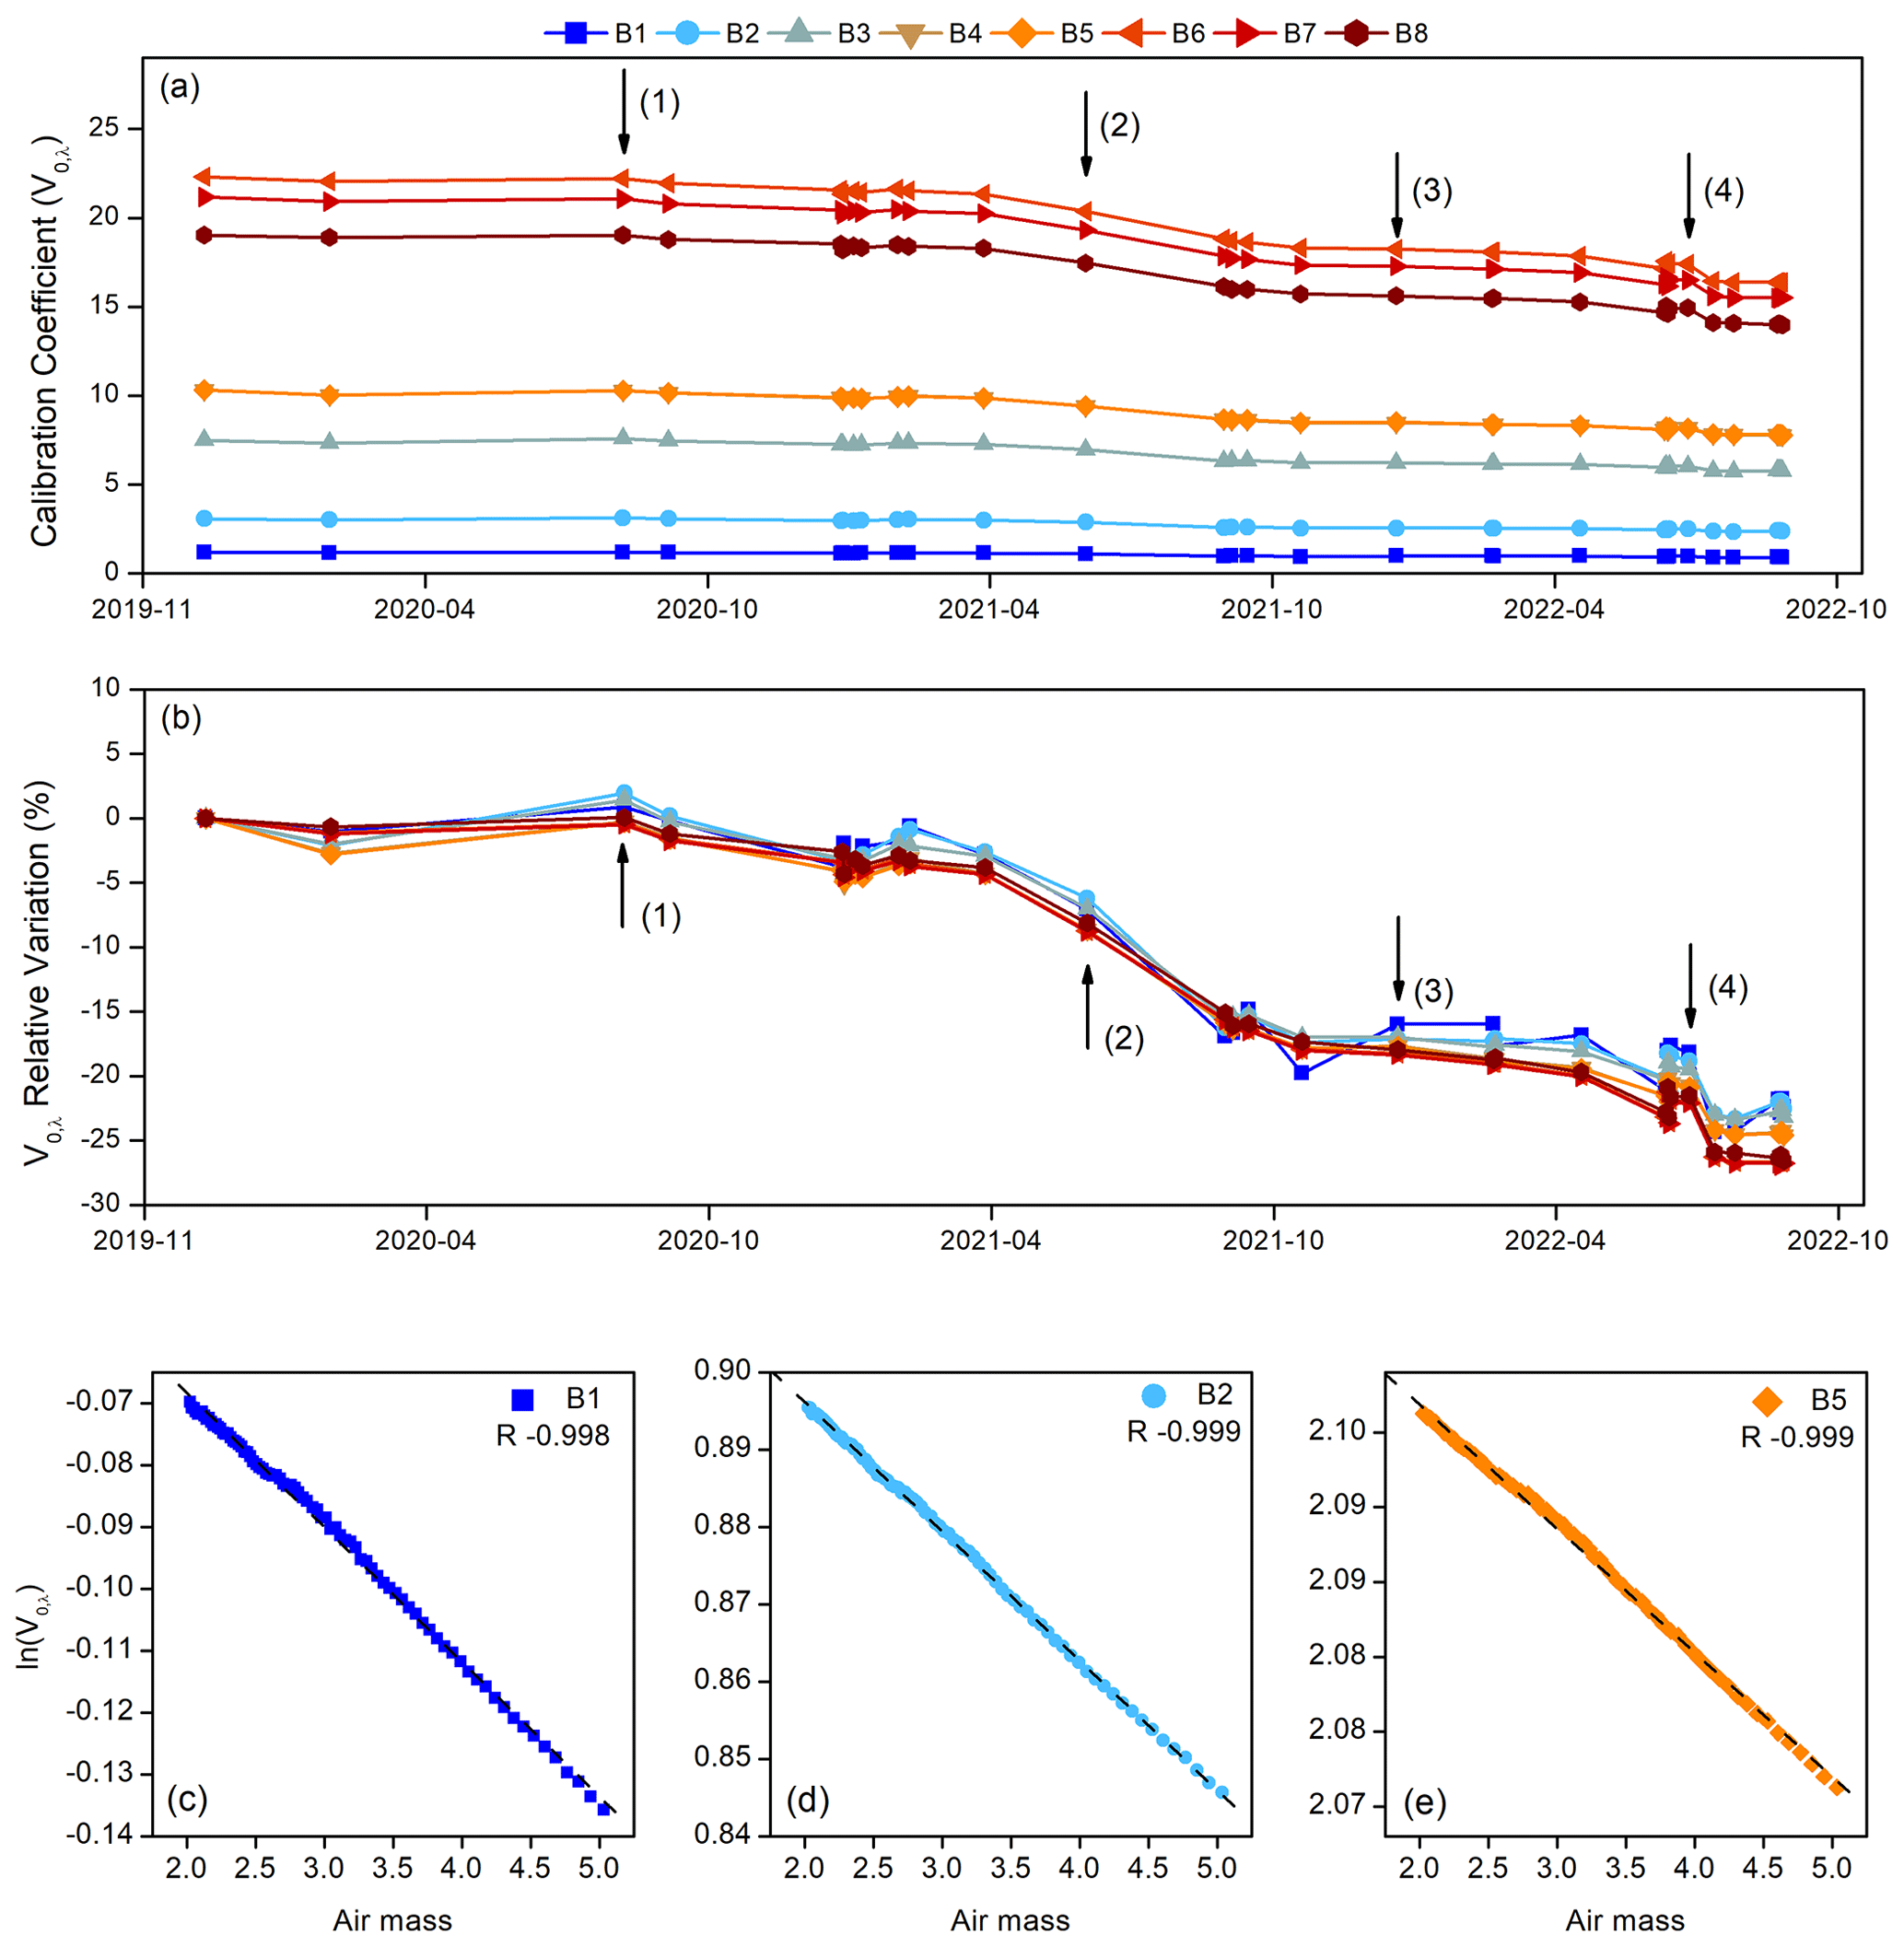
Figure 2(a) Langley plot calibration curve for the EM27/SUN coefficient V0,λ (in ) at the eight EM27/SUN spectral bands from December 2019 to September 2022: the solid lines are the smoothing splines of the V0,λ throughout the whole period. The black arrows mark important changes in the calibration coefficients: (1) 2 September 2020, (2) 24 June 2021, (3) 8 January 2022 and (4) 13 July 2022. (b) Relative variation in V0,λ with respect to the first valid Langley day (in %). The bottom panels are the morning Langley plots for the three CE318-AERONET coincident spectral bands performed on 5 May 2022 for optical air masses between 2 and 5 which are presented for (c) B1 (870 nm), (d) B2 (1020 nm) and (e) B5 (1640 nm). R is the Pearson correlation coefficient.
In contrast to the morning calibration approach used for the IZO high-resolution IFS 125HR (Barreto et al., 2020), the Langley coefficients have been computed using both morning and evening data, with a higher frequency of Langley measurements taken at sunrise. Thus, the Langley days selected for this study, following the criteria published by Toledano et al. (2018), amounted to 31 high-quality Langley plots at the eight EM27/SUN spectral bands between December 2019 and September 2022, as displayed in Fig. 2a. All these cases present similar and higher Pearson correlation coefficients (R between 0.97 and 1.00) and standard deviations of the fitting analysis reaching Toledano's criterion (σfit below 0.006). It should be noted that each EM27/SUN measurement is calibrated using a daily V0,λ, which is estimated from the smoothing spline functions determined with the information of the 31 Langleys performed over the entire period. This is a robust calibration procedure aimed at compensating for the continuous optical degradation of such an exposed optical system. An example of a morning Langley plot for the three CE318-AERONET coincident spectral bands (B1, B2 and B5), performed on 5 May 2022, is represented in Fig. 2c–e.
Temporal degradation and continuous drift of the EM27/SUN calibration coefficients are observed in Fig. 2a and b. The latter depicts the relative variation in V0,λ with respect to the first valid Langley day for a better identification of the change points presented in the calibration evolution. In both figures, important operational procedures and natural events that could affect the calibration are emphasised with black arrows. During the first year of the study, several logistical issues prevented the continuous performance of EM27/SUN Langley plot calibrations, resulting in temporal gaps in the calibration time series. Specifically, due to the COVID-19 lockdown and subsequent restrictions, the EM27/SUN was not calibrated from March to September 2020. However, the external mirrors were manually cleaned on 1 August 2020, which improved the overall EM27/SUN signal by ∼ 2 % (black arrow 1 in Fig. 2a and b).
The most significant loss of EM27/SUN signal over the study period occurred from June 2021 to January 2022, when a V0,λ relative drop between 15 % and 18 % was recorded for the eight bands (black arrows 2 and 3 in Fig. 2a and b). During these 6 months, several dust events were observed at the IZO, and the volcanic activity from the La Palma eruption, which occurred 140 km away from the IZO, led to volcanic ash deposition at the site (Milford et al., 2023). Other natural events, such as a forest fire that occurred at the end of July 2022 very close to the observatory, could also cause a loss of signal (event 4 in Fig. 2a and b). As a result, a significant drop in the Langley plot calibration curve was documented between two nearby calibrations performed on 13 and 29 July 2022 (between 3 % in B5 and 6 % in B1, with an all-band mean of 4.2 % and a σ of 0.9 %).
Considering the entire study period, the most significant changes in EM27/SUN's V0,λ coefficients were observed in the SWIR bands recorded by the InGaAs-2 detector. The overall decrease in V0,λ, from December 2019 to September 2022, ranged from 22 % (B1–B2), 23 %–24 % (B3–B5) and 26 %–27 % (B6–B8), with a mean of 24 % across all bands (σ of 1.8 %). Consequently, the V0,λ degradation resulted in a drop between 0.66 % per month (B1 and B2) and 0.78 % per month (B6–B8), with an all-band mean of 0.72 % per month (σ of 0.27 % per month). These values are relatively low compared to those of the high-resolution IFS 125HR system at the same station, which ranged between about 1.61 % per month (B8) and 1.75 % per month (B2), reaching a total decrease of 14.5 % (B8) and 15.8 % (B2) from May 2019 to February 2020 (Barreto et al., 2020).
5.2 AOD retrievals
The EM27/SUN AOD database was created over the course of 187 d (comprising 56 190 instantaneous AOD values for each spectral band) during the study period of December 2019 to September 2022. This database was constructed using the cloud-screening and quality-controlled procedure, as described in Sect. 4.3. Figure 3a shows the daily mean spectral AOD from EM27/SUN for each defined band. It should be noted that there was a lack of calibration during the 6-month period from March to September 2020 (black arrow 1), as mentioned in Sect. 5.1. This fact causes the AOD values to be calculated by taking into account the smoothing spline functions described in Sect. 5.1.
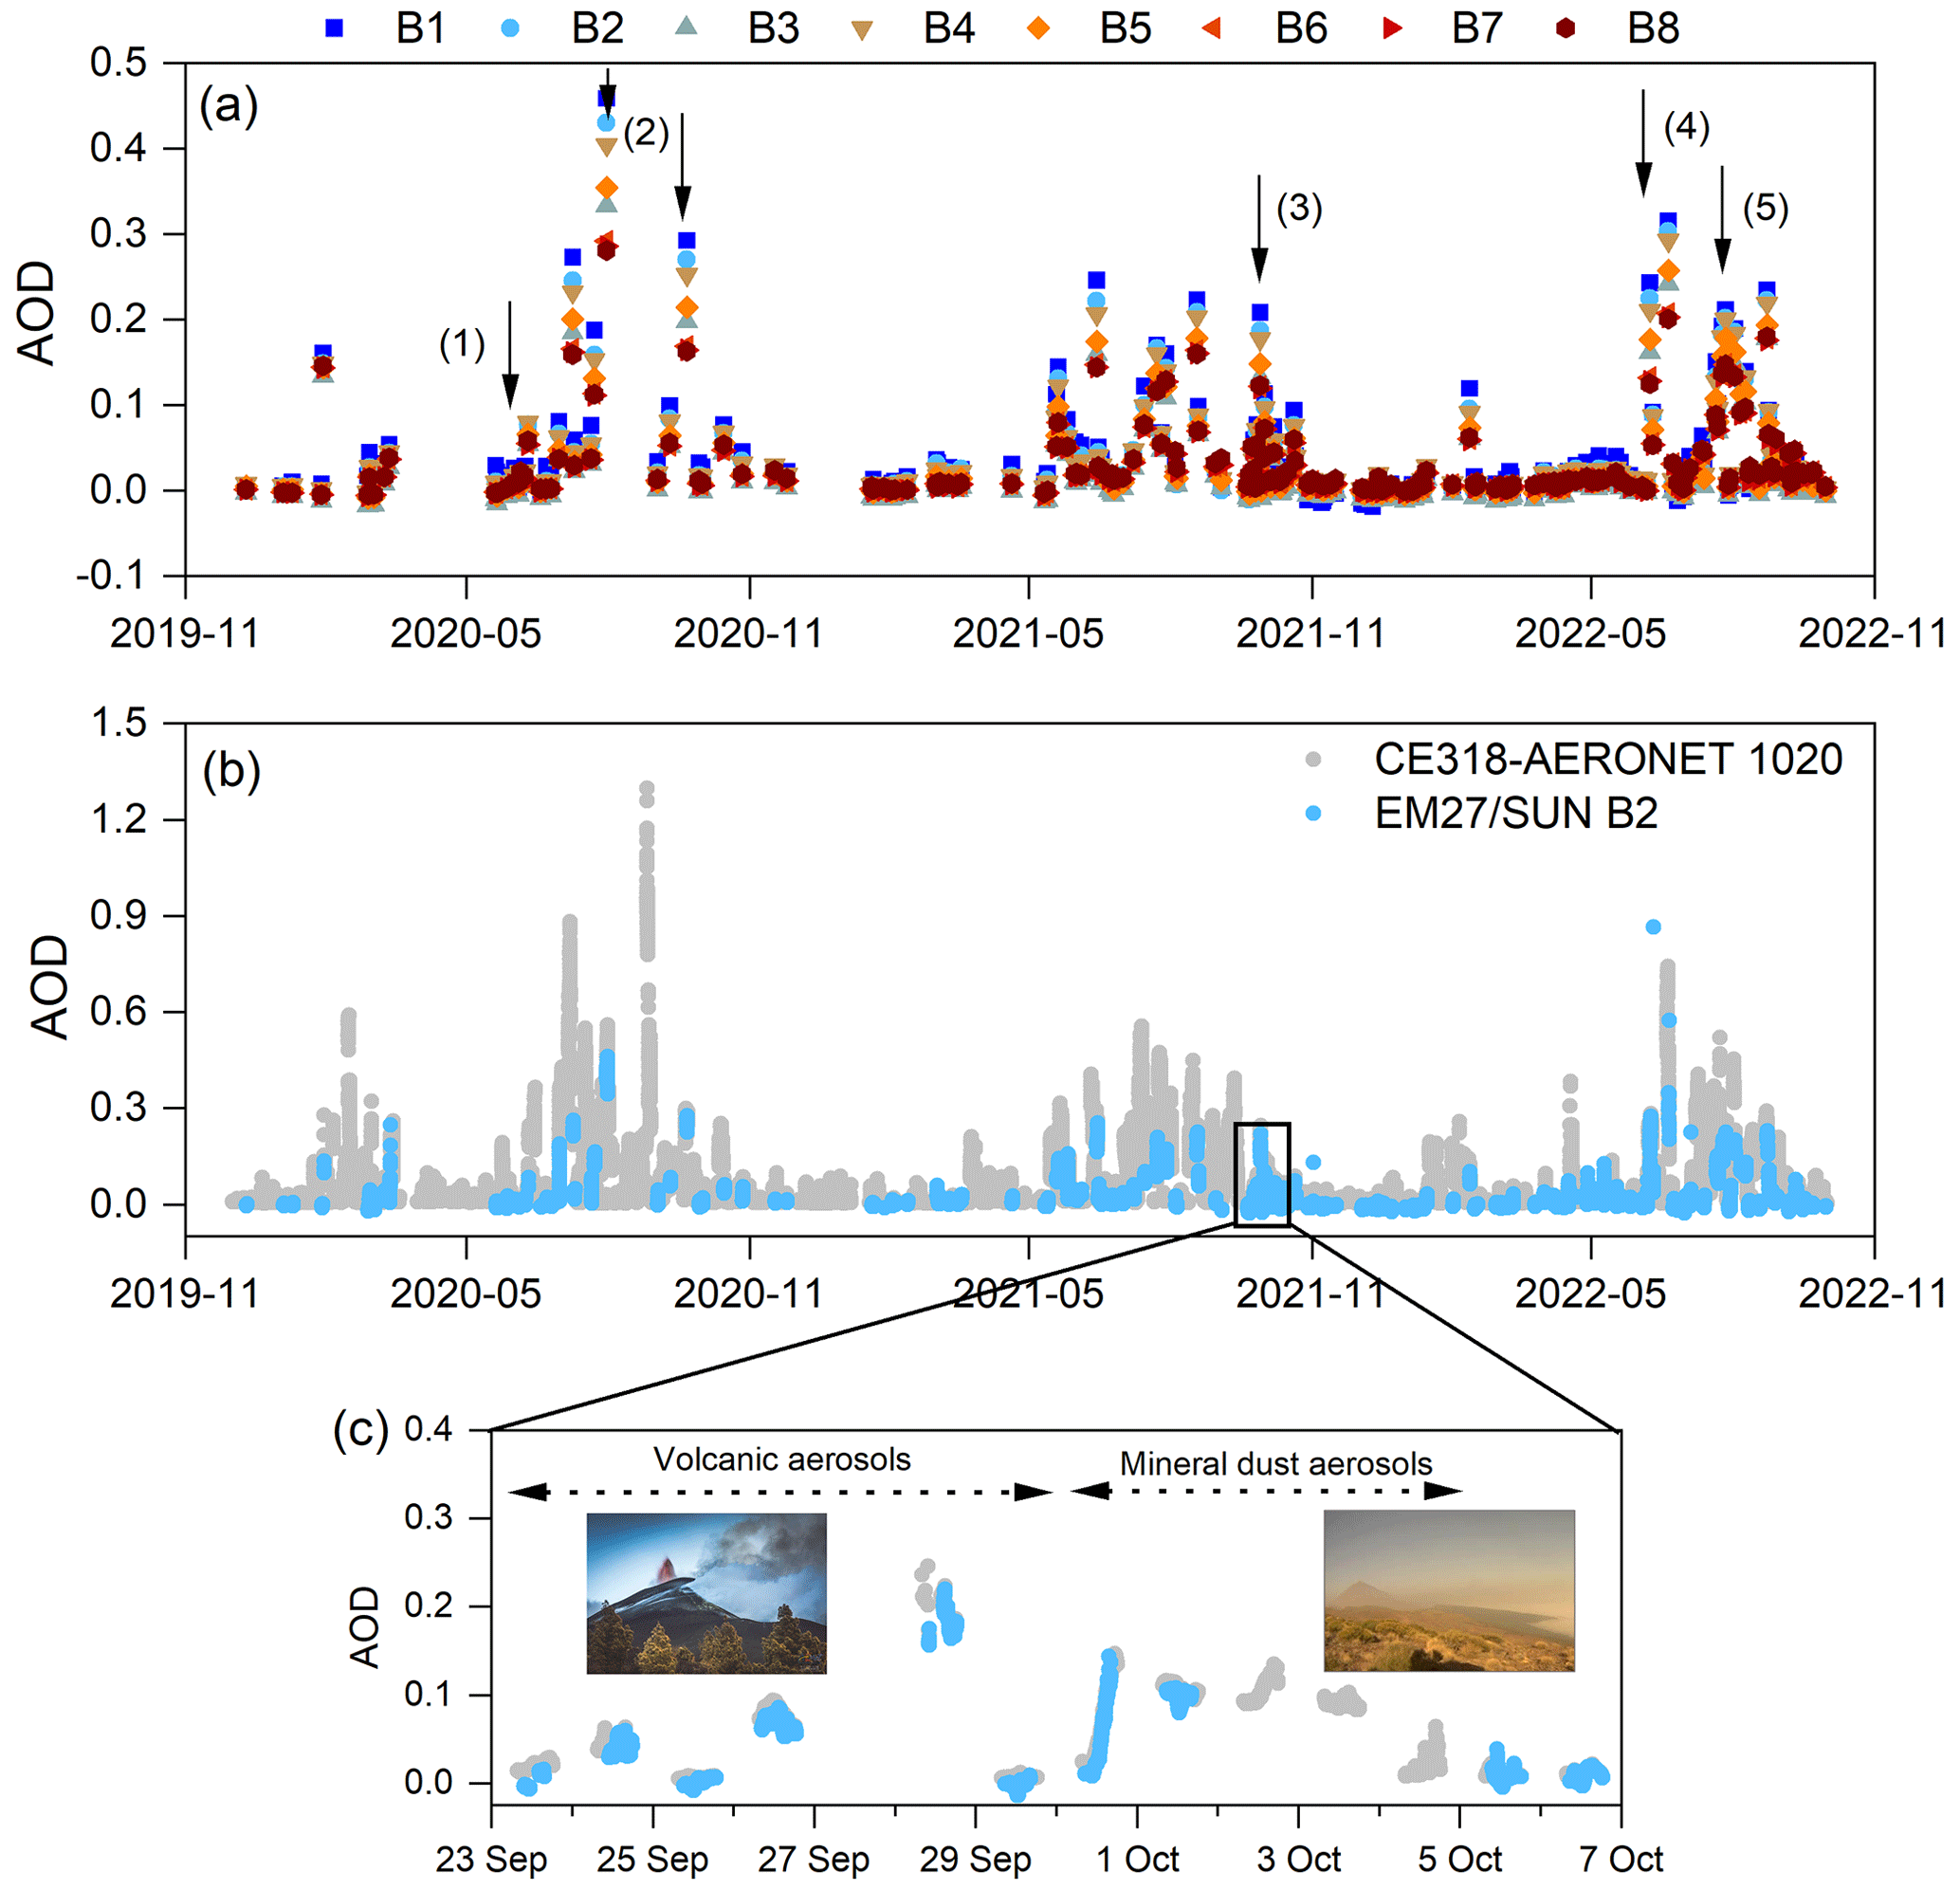
Figure 3Time series, from December 2019 to September 2022, of (a) the daily mean AOD data for the eight EM27/SUN spectral bands and (b) the CE318-AERONET and EM27/SUN AOD values measured at the coincident B2 and 1020 nm band. (c) AOD evolution over a 14 d period in September 2021. The images in panel (c) correspond to the volcano on La Palma (LuzLux/AEMET) and a Saharan dust event at the IZO. The black arrows in panel (a) mark important AOD events: (1) spring/summer 2020, (2) mineral dust outbreaks in July and September 2020, (3) La Palma volcanic eruption between September and December 2021, (4) mineral dust outbreak in June 2022, and (5) forest fire in July 2022.
Throughout the entire EM27/SUN measurement period, two significant dust events were recorded at the IZO on 31 July 2020 and 20 June 2022 (black arrows 2 and 4, respectively, in Fig. 3a), with the maximum AOD recorded by the EM27/SUN exceeding 0.40 in the NIR B1 band. Another noteworthy dust event occurred in September 2020, with AOD values reaching ∼ 0.30 in the lowest wavelength. Additionally, several minor dust events occurred during the study period. Together with the predominant presence of this aerosol, high AOD values were also observed during the volcanic eruption in La Palma from September to December 2021 (black arrow 3), as well as during a significant forest fire that occurred in Tenerife in July 2022 (black arrow 5). Note that the λ–AOD dependence is stronger under high-turbidity conditions, as observed by Barreto et al. (2020) using the high-resolution FTIR spectrometer at the same site.
All these events were simultaneously and consistently recorded by both the EM27/SUN and AERONET Cimel photometer, as presented in Fig. 3b for the coincident B2/1020 nm band. As an example, a zoomed-in view of a 14 d period with continuous measurements is shown in Fig. 3c, demonstrating the excellent temporal coherence between the measurements obtained by both techniques. This period was marked by the arrival of volcanic aerosols and gases from the La Palma eruption (Sicard et al., 2022; Bedoya-Velásquez et al., 2022; Córdoba-Jabonero et al., 2023; García et al., 2023; Milford et al., 2023) during the first part of the period, a Saharan dust outbreak from 30 September to 5 October (AOD1020 nm up to 0.15) (García et al., 2023; Milford et al., 2023) and background conditions (AOD1020 nm less than 0.05) for the rest of the time.
5.3 AOD uncertainty analysis
The uncertainty analysis of the EM27/SUN AOD retrievals has been addressed in this section through the utilisation of uncertainty propagation techniques, specifically employing the guidelines outlined in the “Guide to the Expression of Uncertainty in Measurement” (GUM) and the application of the Monte Carlo method (MCM), as detailed in the work by GUM (2008). The input parameters along with their corresponding relative uncertainties are presented in Table 2. Following the procedure outlined in the publication by García et al. (2021), the number of iterations (M) has been set at 106 in order to achieve a coverage probability of 95 %. To conduct the Monte Carlo calculations, the Python module MetroloPy (available at https://pypi.org/project/metrolopy/; last access: 16 July 2023) was employed.
Fröhlich and Shaw (1980)Kasten and Young (1989)Alexandrov et al. (2009)Giles et al. (2019)Smirnov et al. (2004)Smirnov et al. (2004)Smirnov et al. (2004)Table 2Relative uncertainties of the input parameters in the AOD retrieval and their corresponding references.
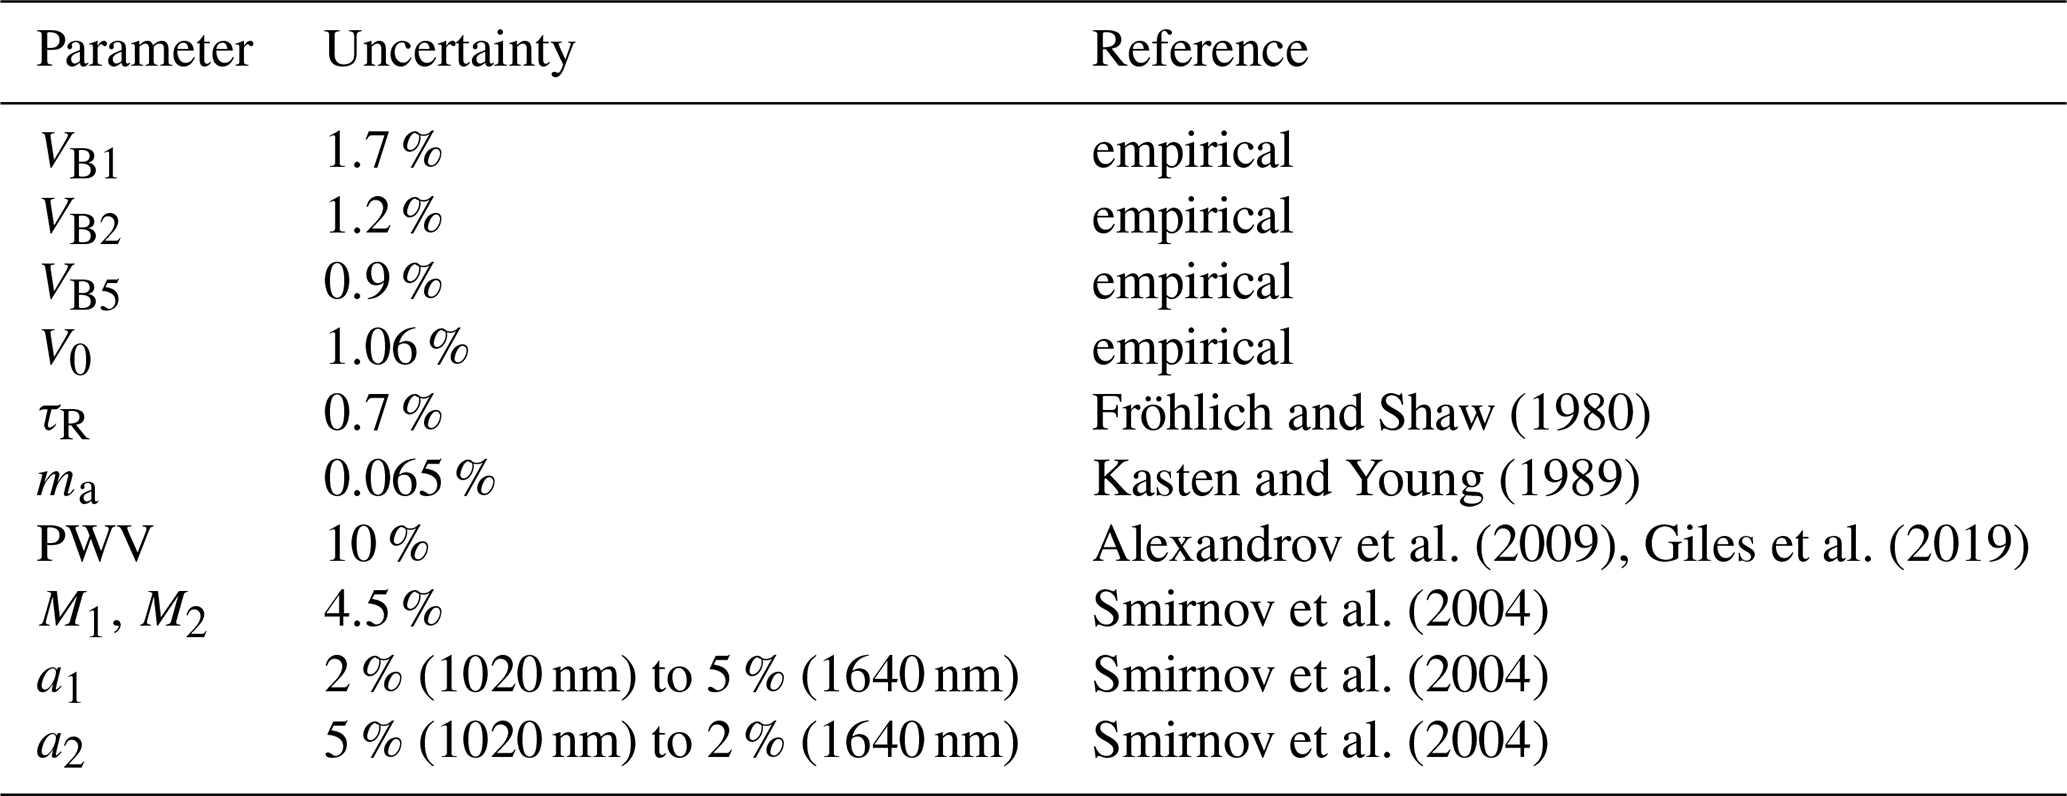
The standard uncertainty estimated with the MCM has been computed considering that our model is given by Eqs. (3)–(5), retrieved by applying Eq. (2) at the three EM27/SUN spectral bands coincident to the CE318-AERONET and using the AERONET standard corrections (Holben et al., 1998; Giles et al., 2019) as follows:
In these equations, ma represents the air mass of atmospheric aerosols (Kasten and Young, 1989), mR is the Rayleigh air mass (computed using the same equation as for aerosols), τR is the Rayleigh optical depth (Bodhaine et al., 1999) and PWV is the precipitable water vapour. Following Giles et al. (2019), the impact of carbon dioxide and methane in the 1640 nm spectral band is estimated with the M1 and M2 terms, including their estimated concentrations adjusted to the station elevation.
Some uncertainties presented in Table 2 have been sourced from a relevant bibliography, while others have been estimated through empirical processes. The assessment of EM27/SUN instrumental uncertainties (Vλ) incorporates the mean voltage ratios between co-located EM27/SUN and CE318-AERONET measurements. This ratio offers insight into potential instrumental issues, such as possible tracking problems or temperature dependence. The average voltage ratios were observed to range between 1.7 % for 870 nm and 0.9 % for 1640 nm (detailed in Table 2). These values are consistent with the fact that the spectral band centred at 872 nm is the closest band to the detector cutoff, which consequently introduces more noise to the EM27/SUN measurements.
The uncertainty linked to the determination of the V0 term has been conservatively approximated at 1.06 %, derived from the maximum standard error of the intercept within the Langley plot linear regression conducted across the entire duration and the three distinct spectral bands encompassing the 31 Langley plots.
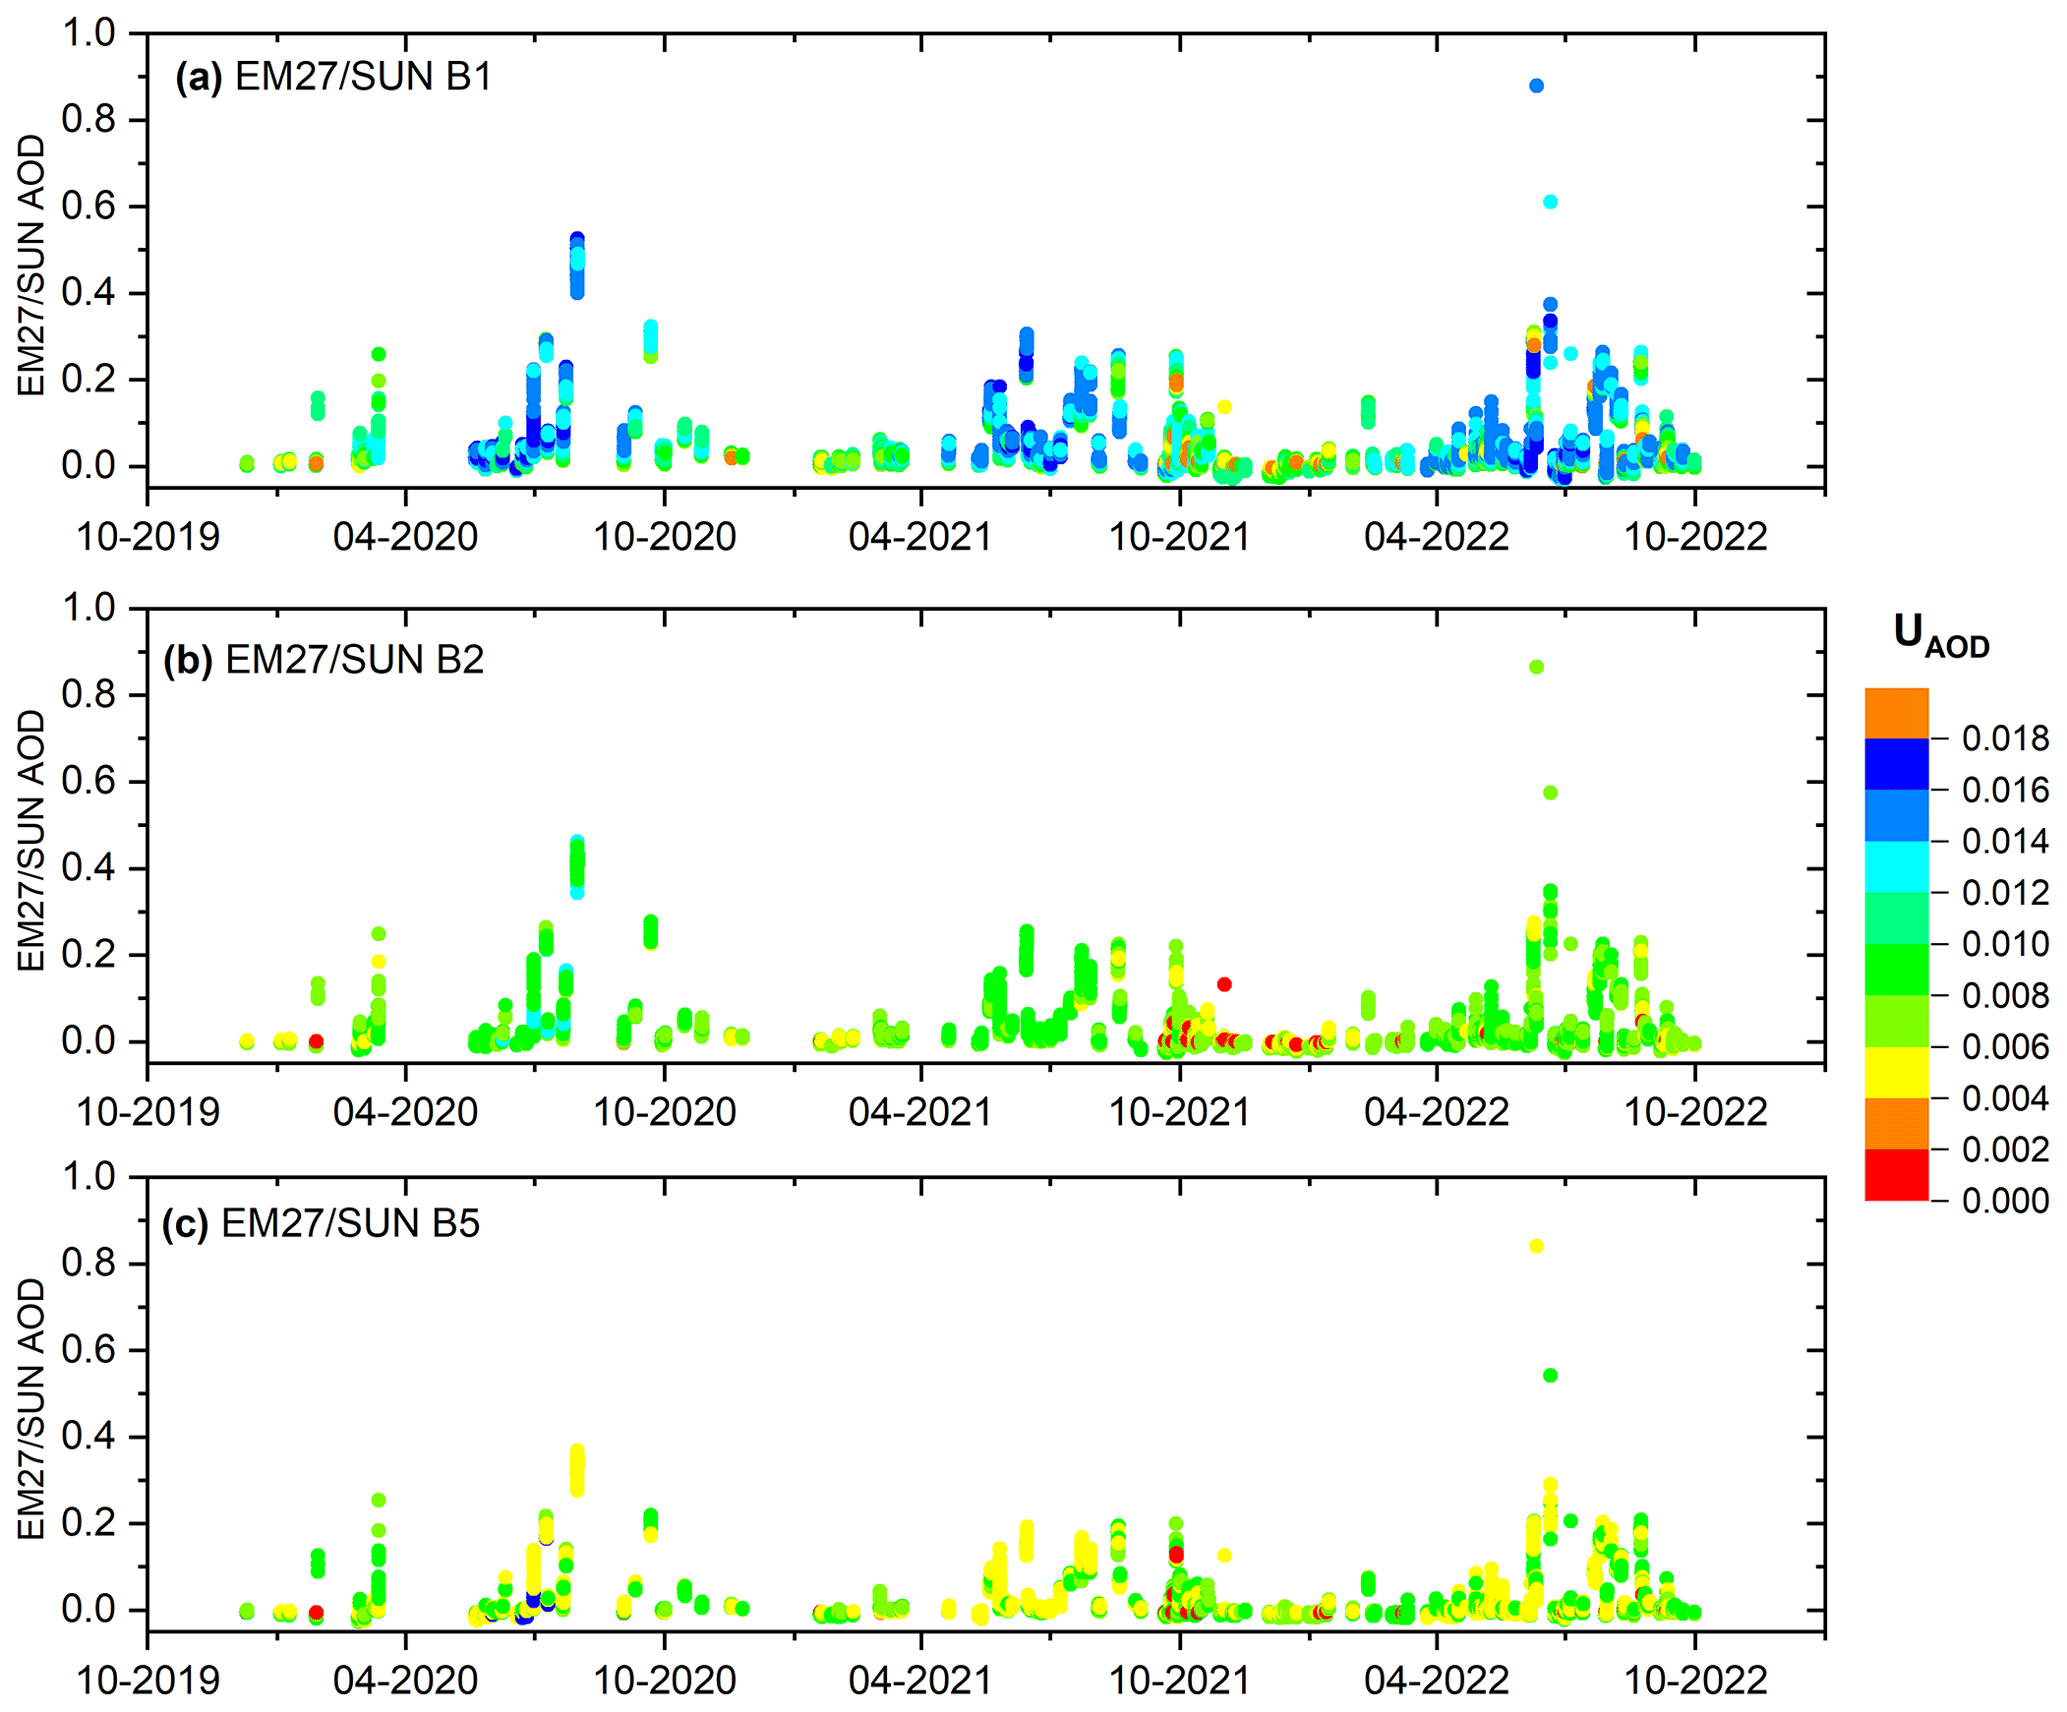
Figure 4Time series, from December 2019 to September 2022, of EM27/SUN AOD (a) B1, (b) B2 and (c) B5. The colour scale indicates the absolute uncertainty (UAOD) calculated by means of the Monte Carlo method.
Figure 4 illustrates the temporal evolution of AOD retrieved using the EM27/SUN instrument spanning the period from December 2019 to September 2022. The graph incorporates the AOD absolute uncertainty (UAOD), which has been computed using the Monte Carlo method (MCM). The UAOD values exhibit a dependence on both wavelength and AOD magnitude, with elevated uncertainties observed within the 870 nm spectral band for higher AOD values. The calculated UAOD from the 870 nm spectral band varies from 0.013 (for AOD values < 0.05) to 0.281 (for AOD values > 0.20). In the case of the 1020 nm band, the UAOD range spans from 0.011 (AOD < 0.05) to 0.275 (AOD > 0.20). For the 1640 nm spectral band, the uncertainties range from < 0.001 (AOD < 0.05) to 0.301 (AOD > 0.20), with this last case encompassing only 1 % of the data set. The average uncertainties are 0.012, 0.013 and 0.009 for 870, 1020 and 1640 nm spectral bands, respectively.
5.4 AOD quality assessment
The consistency of EM27/SUN retrievals was evaluated over the 3-year period by comparing synchronous AOD measurements (within 1 min) of the three coincident spectral bands from EM27/SUN and CE318-AERONET instruments (870, 1020 and 1640 nm). The scatterplot in Figure 5 and the main statistics presented in Table 3 show the results of these synchronous AOD data sets, considering separately the two time periods with different Langley plot calibration frequencies: (1) from December 2019 to December 2020 (Fig. 5a), characterised by a significant calibration gap resulting from the COVID-19 lockdown restrictions, and (2) after January 2021, marked by a notable increase in the calibration frequency (Fig. 5b).
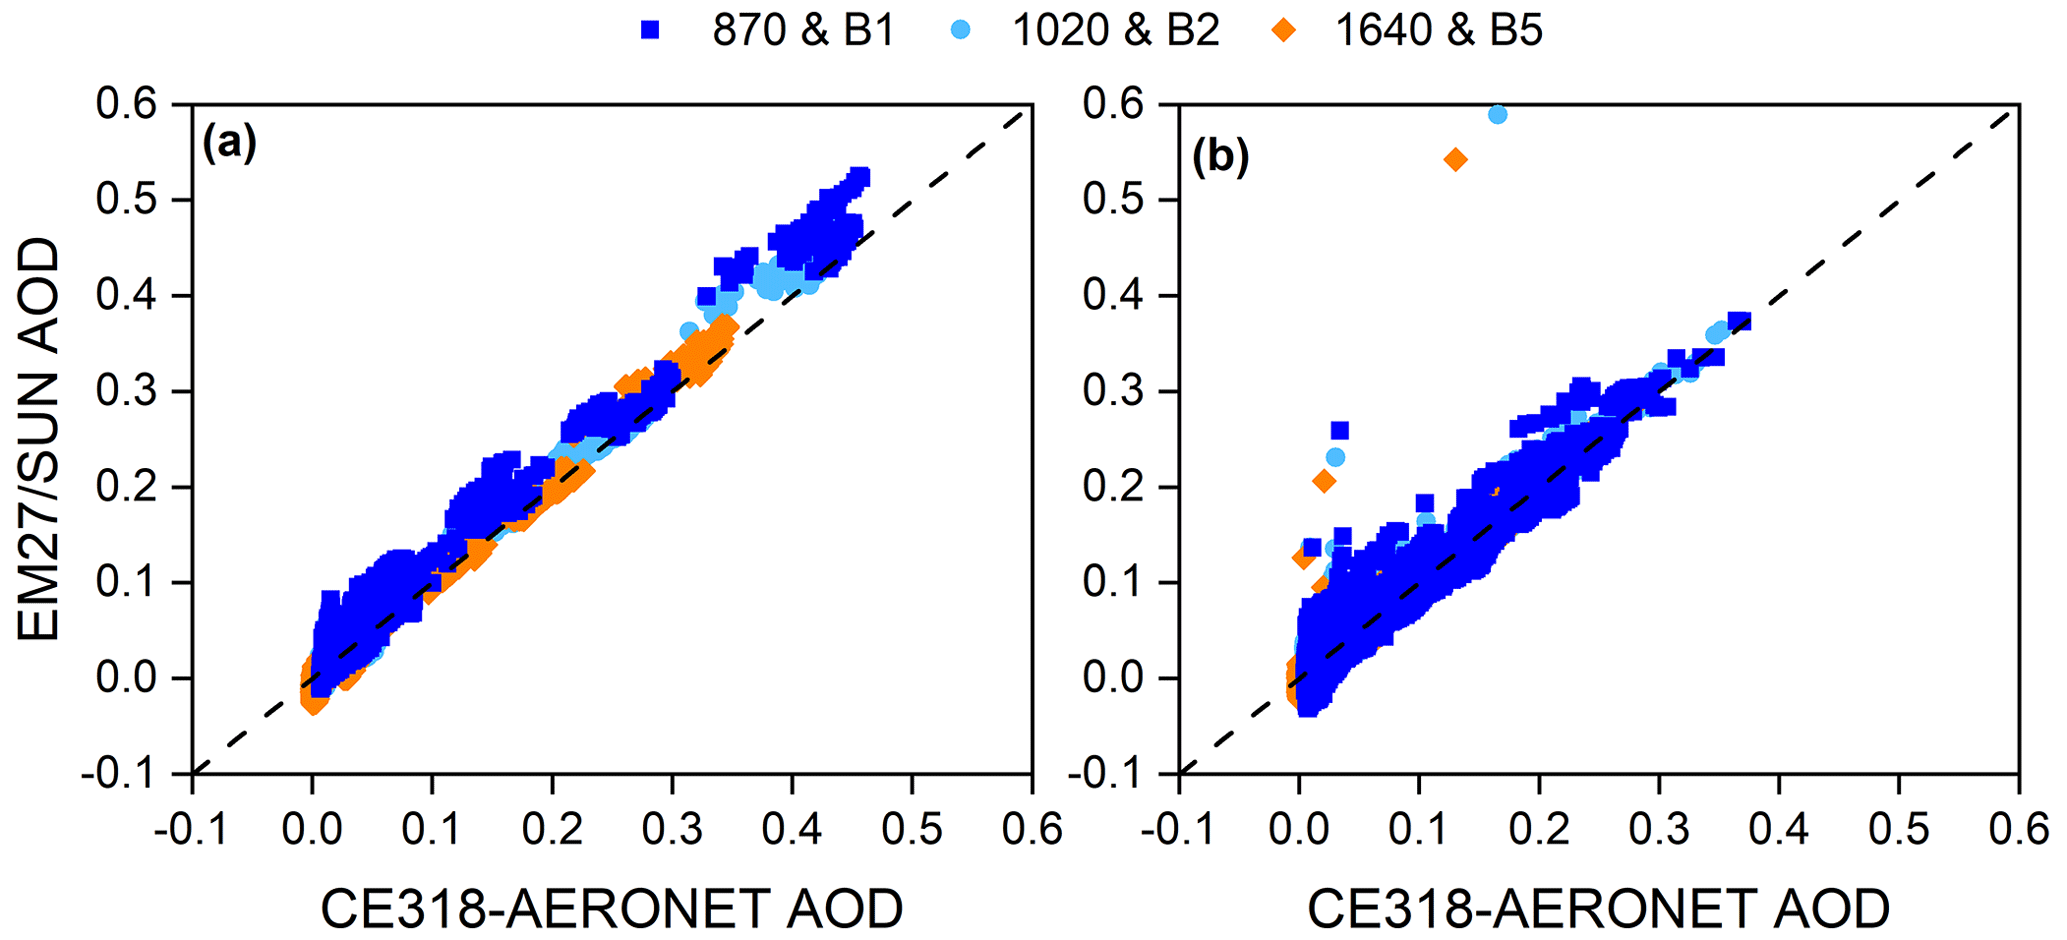
Figure 5Scatterplot for the coincident EM27/SUN versus CE318-AERONET AOD values from (a) December 2019 to December 2020 and (b) January 2021 to September 2022 considering the EM27/SUN B1 (870 nm), B2 (1020 nm) and B5 (1640 nm) micro-windows. The number of coincidences is 14 575 and 2863 in the periods of January 2021–September 2022 and December 2019–December 2020, respectively.
Table 3Main statistics of the CE318-AERONET and EM27/SUN AOD comparison for the coincident spectral bands in the January 2021–September 2022 period, including the results for the entire period (2019–2022) in parentheses. MD stands for the mean AOD difference (CE318-AERONET minus EM27/SUN), σ is the standard deviation and RMSE is the root-mean-squared error of the differences. The fit parameters are also included: Pearson correlation coefficient (R), slope and intercept. The number of coincidences is 14 575 and 2863 in the periods of December 2019–September 2022 and January 2021–September 2022, respectively.
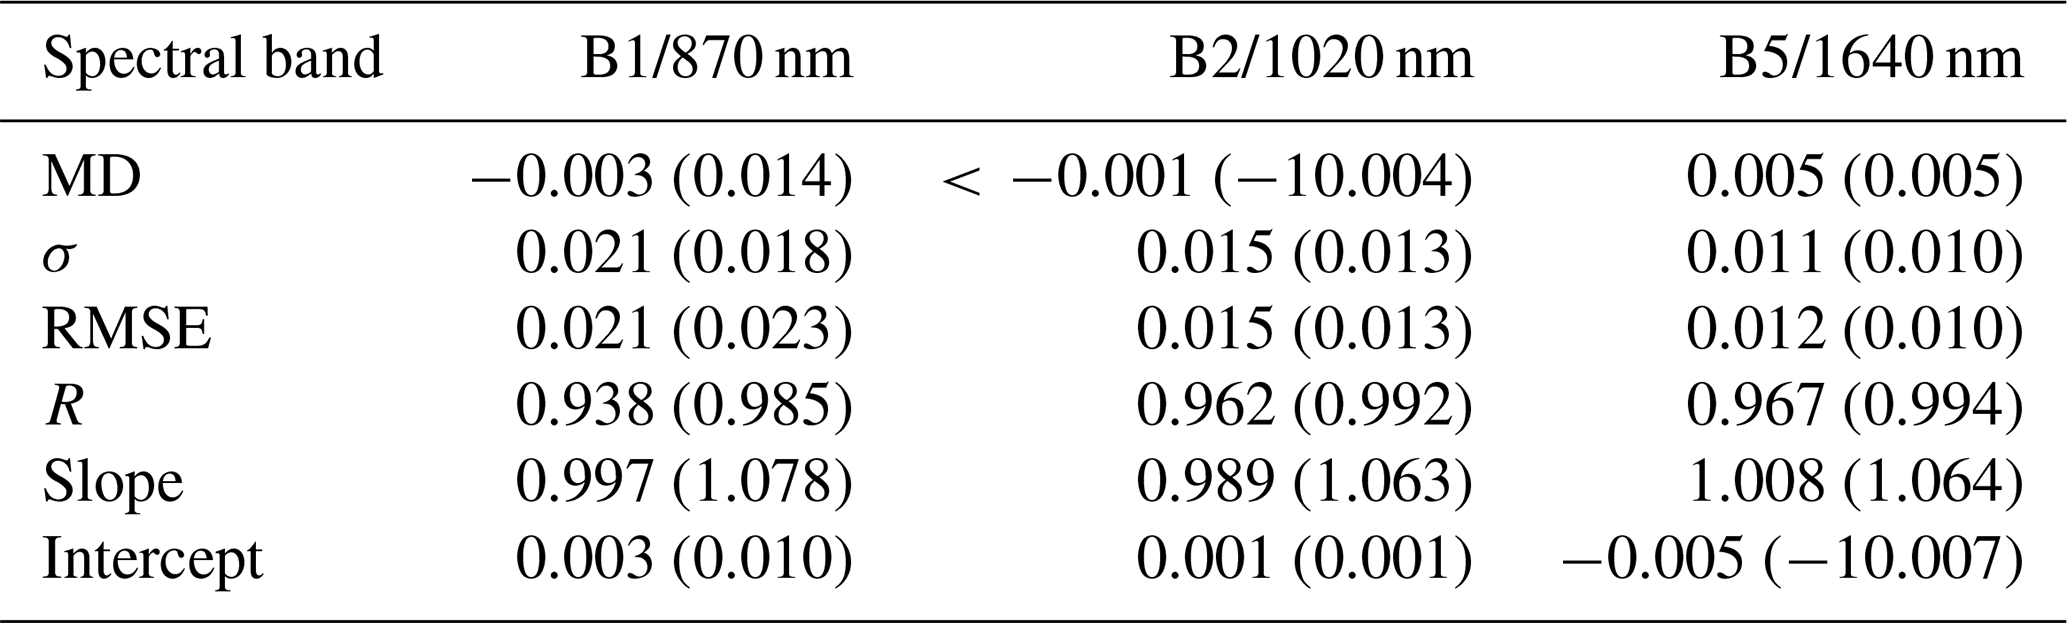
Our findings confirm the consistency between these two independent techniques during two distinct periods marked by varying calibration frequencies. The principal statistical outcomes unveil a notable consistency across the three spectral bands, with mean discrepancies limited to 0.005. These differences align with values akin to those documented in Barreto et al. (2020). While B5 showcases the most favourable results, evidenced by its minimal σ (0.011) and RMSE values (root-mean-squared error of differences, 0.012), as well as its highest R values across the spectral bands (0.967), B1 demonstrates comparatively inferior performance. B1 is characterised by an R value of 0.938 and a σ value of 0.021. This performance discrepancy is attributed to the fact that B1 is the closest band to the detector cutoff, which consequently introduces more noise to the EM27/SUN solar spectra in this particular spectral range.
The observed bias within this intercomparison analysis, described by means of the mean AOD differences, falls within the bounds of uncertainty determined via the Monte Carlo method outlined in Sect. 5.3. These results confirm the uncertainty estimation with respect to the input values performed in our study.
When comparing data from two instruments with different spectral resolutions, like the EM27/SUN and the Cimel CE318-T, a common intercomparison procedure is to degrade the higher-resolution spectra, considering the response functions of the lower-resolution instrument. However, as found by Barreto et al. (2020), both techniques provide a straightforward AOD intercomparison, and the convolution approach yielded very consistent and equivalent results.
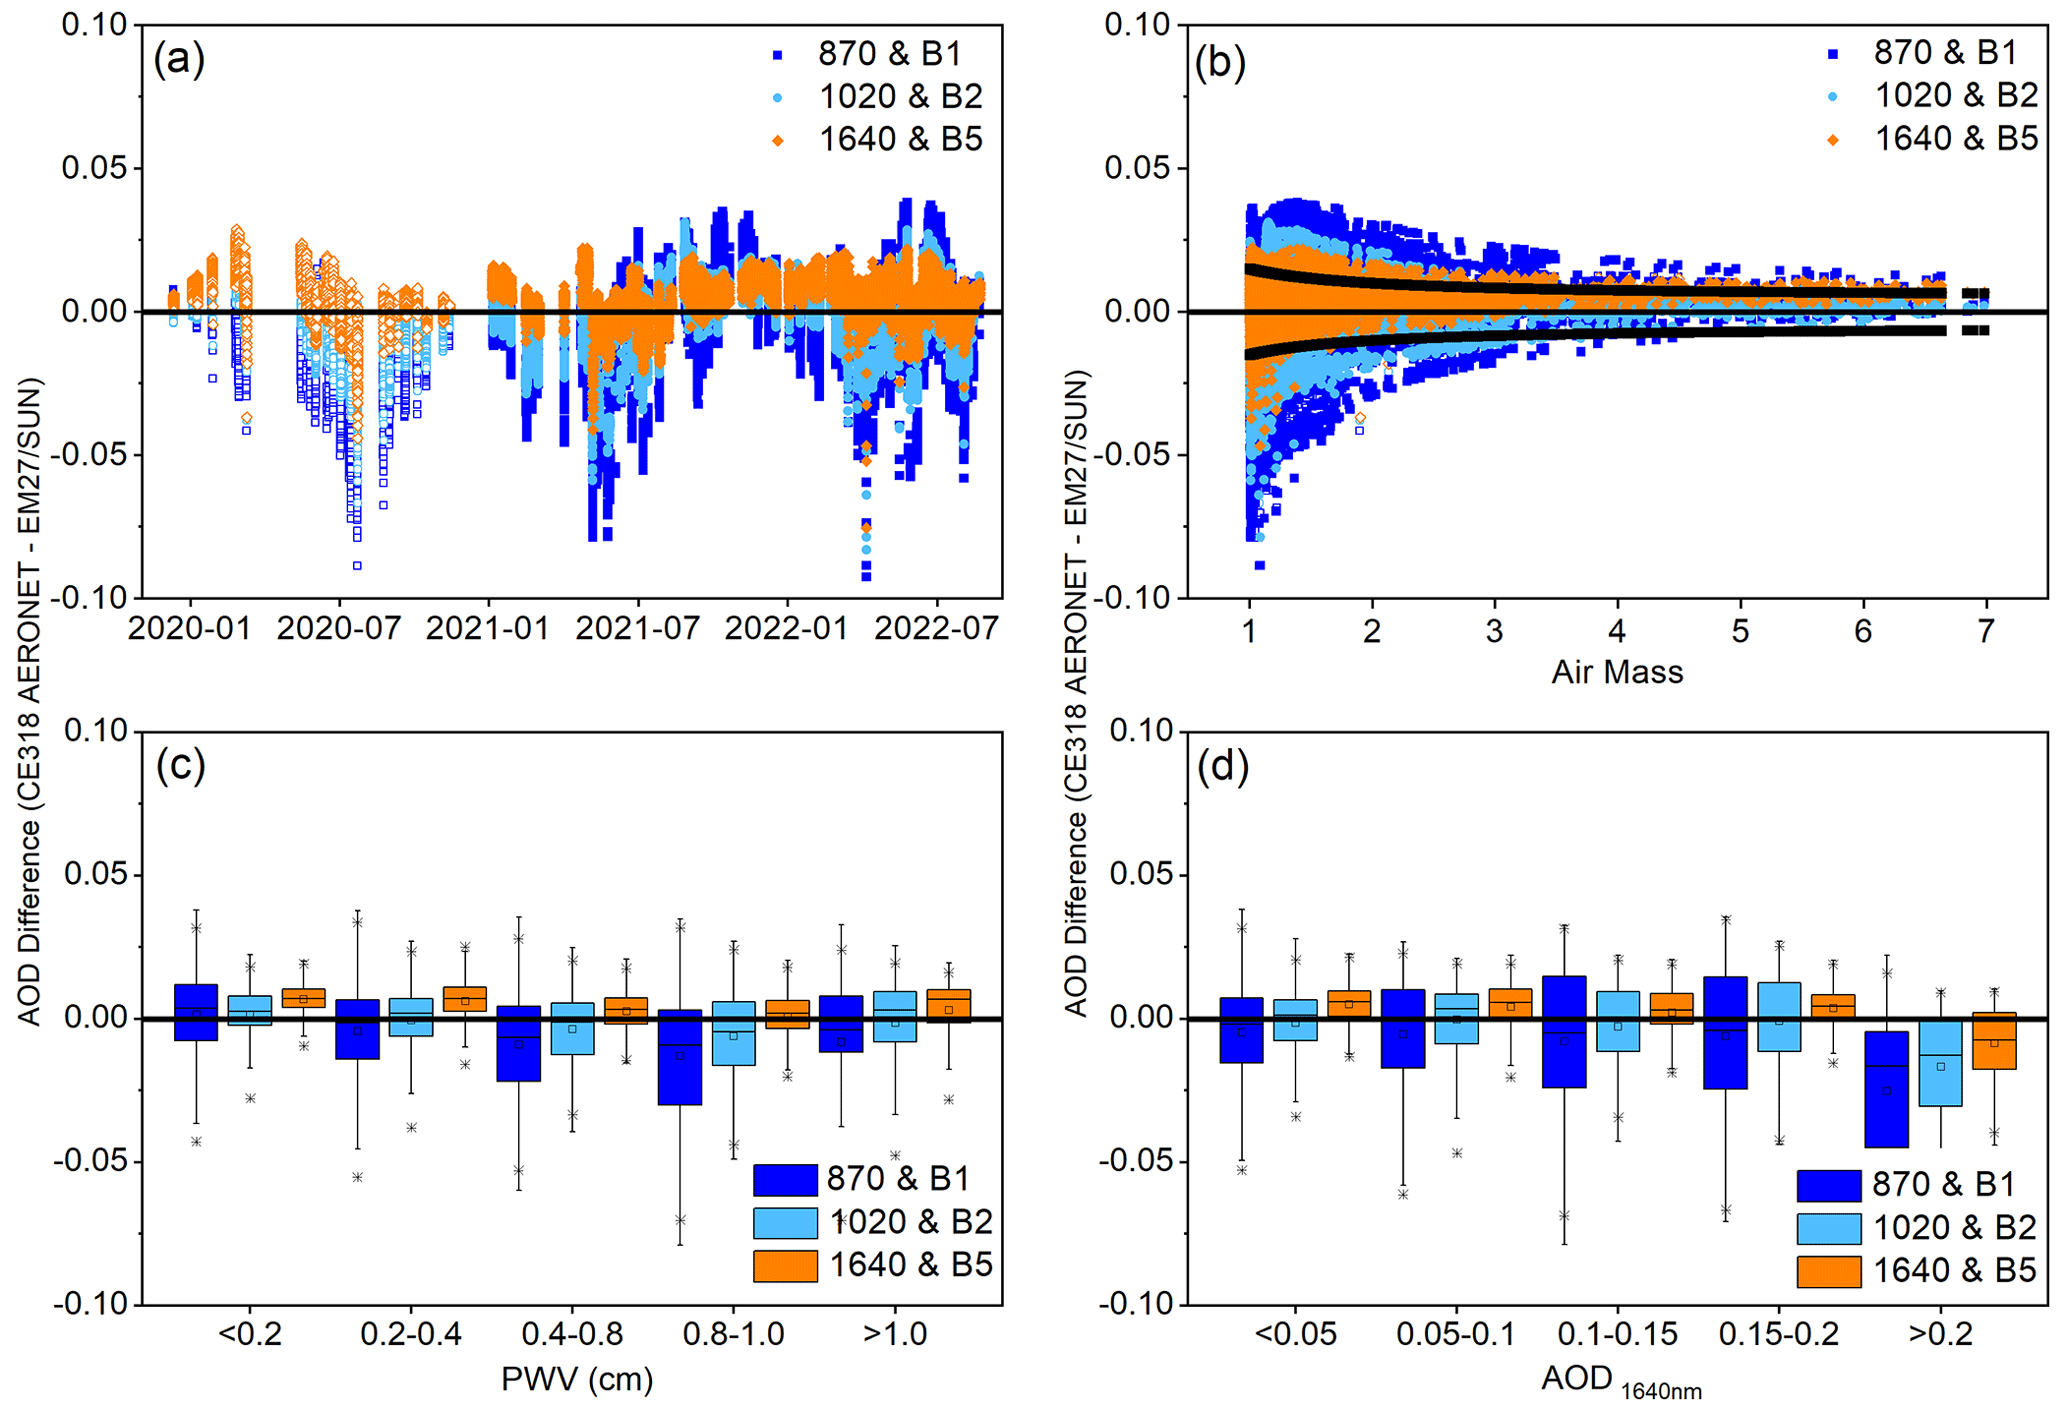
Figure 6AOD comparison between CE318-AERONET and EM27/SUN (2021–2022) in the three coincident spectral bands for CE318-AERONET (870, 1020 and 1640 nm) and EM27/SUN (B1, B2 and B5) according to (a) time, (b) optical air mass, (c) PWV (cm) and (d) AOD at 1640 nm from CE318-AERONET (AOD1640 nm). The open circles in panels (a) and (b) correspond to the September 2019–December 2020 period. The solid curves in panel (b) represent the U95 uncertainty limit. The AOD differences in panels (c) and (d) are displayed as box plots, where the lower and upper boundaries for each box are the 25th and 75th percentiles, the solid line is the median value, the hyphens are the maximum and minimum values, and the asterisks indicate the 1st and 99th percentiles. The number of cases in each box was 3191, 3729, 3690, 773 and 238 for PWV < 0.2, 0.2–0.4, 0.4–0.8, 0.8–1.0 and > 0.1 cm, respectively. In the case of AOD differences with respect to CE318-AERONET AOD, the number of cases was 9757, 929, 542, 364 and 29 for AOD1640 nm < 0.05, 0.05–0.1, 0.1–0.15, 0.15–0.2 and > 0.2, respectively.
Figure 6 investigates the relationship between the AOD differences (CE318-AERONET minus EM27/SUN) and important factors such as aerosol loading (i.e. CE318-AERONET AOD at 1640 nm, AOD1640 nm, as proxy) and precipitable water vapour content (PWV) from AERONET and optical path (i.e. optical air mass), as well as their temporal variations. The comparison with the air mass provides valuable information about the traceability of the two AOD data sets. According to the WMO traceability criteria (WMO, 2005), AOD measurements are considered traceable if 95 % or more of the AOD differences fall within a specified acceptance limit, U95, defined in terms of the aerosol optical air mass as
In this equation, the first term represents instrumental and algorithmic uncertainties, while the second term is related to the calibration uncertainty, estimated to be less than 1 % at maximum (for air mass that equals 1). The optical air mass for U95 has been calculated by using the equation provided by Kasten and Young (1989).
The temporal evolution of the AOD differences is indicated in Fig. 6a for the three coincident bands of CE318-AERONET and EM27/SUN (870, 1020 and 1640 nm). We noted that these differences remained consistent even throughout the period impacted by the absence of Langley plot calibrations (spanning a 6-month period from March to September 2020) as a result of COVID-19 lockdown and subsequent restrictions. Figure 6b shows the behaviour of AOD differences with the air mass for the entire period of this study, with the September 2019–December 2020 period marked as open circles. This analysis serves to calculate traceability limits (U95) of 51.4 %, 70.4 % and 82.2 % for the 870, 1020 and 1640 nm coincident spectral bands, respectively. A slight improvement in traceability has been observed since January 2021, when it increases to values up to 52.0 %, 71.1 % and 83.5 % for the respective bands. It should be noted that even for the 2021–2022 period the proportion of data meeting the WMO traceability requirements is low. However, it is important to consider that the EM27/SUN instrument was not specifically designed to offer the absolute photometric stability necessary for aerosol monitoring. The low traceability identified in our study stands in contrast to the remarkable traceability established between CE318-AERONET and the IFS 125HR, as reported by Barreto et al. (2020). This disparity, evident despite employing identical methodology and spectral resolution, might indicate the existence of mechanisms introducing a variable spectral ordinate calibration in the case of the EM27/SUN.
Figure 6c and d reveal an absence of correlation between differences in AOD and both PWV and AOD values at 1640 nm, as measured by CE318-AERONET, during the period spanning from January 2021 to September 2022. This observation holds true for the 1020 and 1640 nm spectral bands, aligning with the findings documented in Barreto et al. (2020). In contrast, a dependence on these variables is observed for the 870 nm spectral band. This correlation is attributed to the anticipated higher uncertainty in the AOD estimation within this specific spectral band, particularly under conditions of elevated AOD. Such conditions are frequently encountered at the Izaña site due to the presence of the Saharan Air Layer, which manifests as a distinct, well-stratified and humid layer when contrasted with the standard free-troposphere conditions at the location (Barreto et al., 2022a).
Consequently, the EM27/SUN AOD retrievals presented in this study exhibit strong potential for broad applicability across diverse atmospheric conditions, encompassing scenarios such as humid environments and varying aerosol compositions.
5.5 Spectral consistency
Section 5.4 compared and evaluated EM27/SUN AOD retrievals using AERONET data for the three coincident spectral bands (870, 1020 and 1640 nm). To indirectly assess the spectral consistency of the EM27/SUN AOD database in the entire 873–2314 nm spectral range (B1–B8), we verified the λ–AOD dependence by performing a correlation matrix analysis. This information served as a cross-validation of the EM27/SUN AOD observations across different spectral bands. The assessment has been limited to the 2021–2022 period of reliable EM27/SUN AOD records due to the high frequency of Langley plot calibrations.
As shown in previous works (e.g. Toledano et al., 2019; Barreto et al., 2020, and references therein), the spectral dependence of AOD does not follow the Ångström power law (Junge, 1955), especially in the short-wave infrared for mineral dust aerosols. As the linear λ–AOD behaviour (in logarithmic space) is not the expected one, the Kendall rank correlation coefficient (RK) has been used here as an indicator of the degree of correlation between all the EM27/SUN AOD observations. This non-parametric statistical test checks whether two variables are statistically dependent without making any assumptions about the distributions of the two variables being compared (Kendall, 1938).
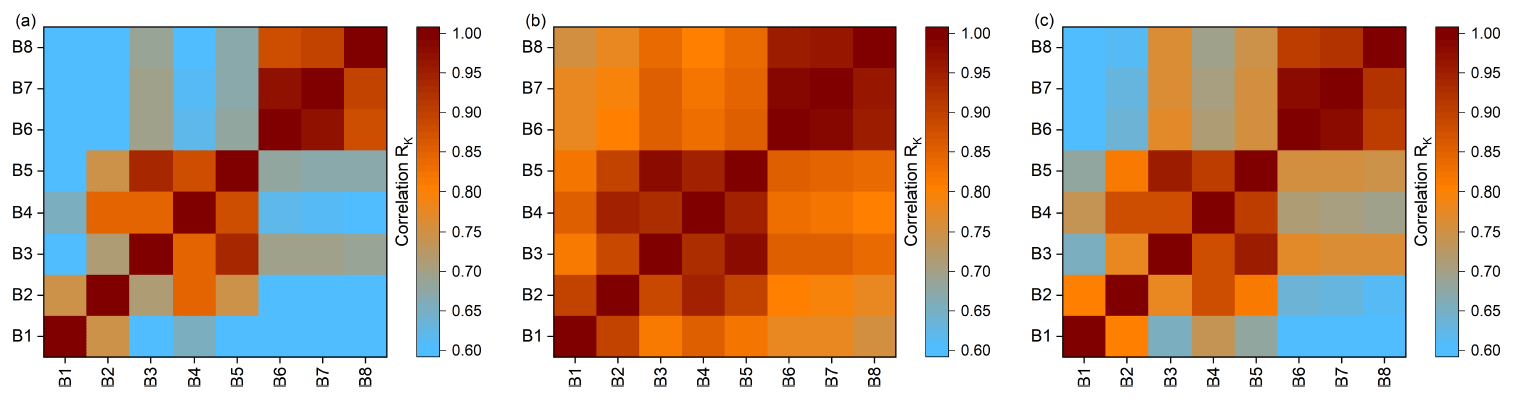
Figure 7Kendall rank correlation coefficient between EM27/SUN AOD retrievals for the eight bands in the 2021–2022 period for different aerosol regimes: (a) clean conditions (AOD1640 nm<0.074), (b) dusty conditions (AOD1640 nm>0.074) and (c) all aerosol regimes.
Figure 7 shows the Kendall rank correlation coefficient between the AOD retrieved in the eight EM27/SUN spectral bands for three different aerosol regimes at the IZO, according to Barreto et al. (2022a, b). Following these authors, background conditions at the IZO can be characterised by AOD1640 nm<0.074. We subsequently calculated matrix correlation coefficients for clean conditions (AOD1640 nm<0.074) in Fig. 7a, for dusty conditions (AOD1640 nm>0.074) in Fig. 7b and for all conditions in Fig. 7c. Three correlation blocks are clearly distinguished, where we found spectral consistency between nearby spectral bands, particularly under high-AOD regimes (dusty conditions). These results are in agreement with the results published by Barreto et al. (2020). B1 and B2 exhibited RK values up to 0.85; B3–B5 had the highest correlations in the NIR, with RK values > 0.90; and B6–B8 (SWIR) had the highest RK values of the entire spectral range (> 0.90). It is particularly relevant that a weaker correlation was observed between B3 and B4, which are only separated by 320 nm, while the correlation between B2 and B5, with a λ separation of 398 nm, is higher. We attribute these results to the presence of gas absorption bands, such as H2O in the case of B3, which were not considered in this analysis. The weakest relationship between the different AOD bands is documented under clean conditions. In these cases, the retrieved EM27/SUN AOD values are susceptible to including artefacts due to the rather low AOD values, especially close to the edge-cutoff limits of the EM27/SUN detectors. Therefore, our results demonstrate the agreement between EM27/SUN AOD observations in the 873–1021, 1238–1636 and 2133–2314 nm wavelength ranges, which we attribute to the spectral AOD coherence in each range.
5.6 Combination of aerosol and gas retrievals
As demonstrated in this study, the EM27/SUN's multi-parameter capability enables simultaneous retrievals of spectrally resolved aerosol and trace gas information, opening up new opportunities to enhance atmospheric chemistry monitoring (Paton-Walsh et al., 2005, 2010; Frausto-Vicencio et al., 2023). Providing such combined measurements is crucial for monitoring and understanding in-plume aerosol–gas interactions or assessing the impact of aerosols on remote gas observations. The latter is especially important for validating satellite missions devoted to GHG observations, which are strongly affected by artificial distortions due to the presence of aerosols, particularly in complex emission scenes such as urban/industrial, biomass burning or mining emissions (e.g. Jung et al., 2016; Ke et al., 2022). Here, two case studies have been selected to analyse the relationship between co-emitted tracers (aerosols, CO2 and CO molecules) when these atmospheric compounds share a similar emission source.
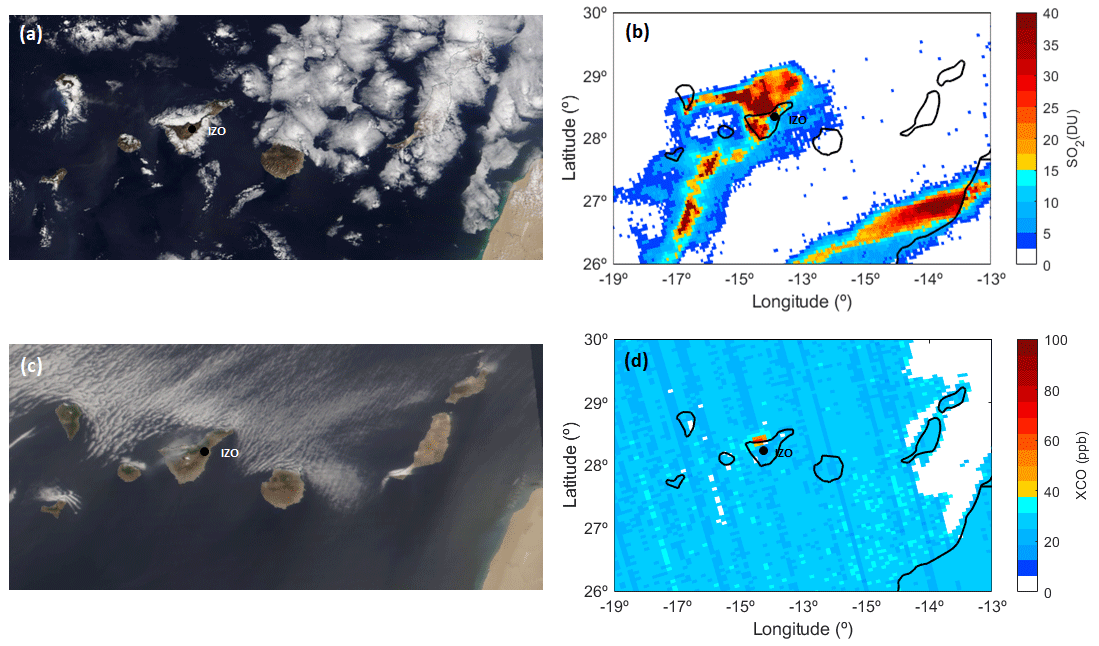
Figure 8Images captured by the Moderate Resolution Imaging Spectroradiometer (MODIS) sensor on board the NASA's Terra satellite (https://worldview.earthdata.nasa.gov, last access: 16 July 2023) on (a) 11 October 2021 (volcanic plume) and (c) 21 July 2022 (forest fire plume). Satellite-column-integrated (b) sulfur dioxide (SO2, in DU) on 11 October 2021 and (d) monoxide carbon mole fraction (XCO, in ppb) between 20 and 22 July 2022 from Copernicus Sentinel-5P TROPOMI (https://maps.s5p-pal.com/, last access: 28 April 2023). The location of the Izaña Observatory (IZO) is indicated with a black dot.
The first case study corresponds to a volcanic event that impacted the IZO on 11 October 2021 (Fig. 8a), with a peak surface sulfur dioxide (SO2) of 377.1µg m−3 compared to the very low background level of 0.2µg m−3 at the site (Cuevas et al., 2022; Milford et al., 2023). SO2 total column amounts up to 11 DU (Dobson units) were also recorded by the high-resolution IFS 125HR spectrometer at the IZO, when typical background values are lower than 1 DU (García et al., 2022). The volcanic influence of this event from the La Palma eruption was also confirmed using the Sentinel-5P TROPOMI SO2 product (ESA, 2021a) (Fig. 8b) and back trajectory analysis (not shown here).
The second case study analyses biomass burning emissions from a forest fire that started on 11 July 2022 in the municipality of Los Realejos, at ∼ 10 km distance from the IZO, on the northern side of Tenerife (Fig. 8c). This fire affected an area of more than 2700 ha and was considered stabilised on 25 July 2022. We included the EM27/SUN data affected by the biomass burning emissions in the afternoon of 21 July 2022. The TROPOMI XCO product corresponding to this event is presented in Fig. 8d (ESA, 2021b).
The EM27/SUN gas observations were retrieved at the same time as the AOD values. For this purpose, the measured EM27/SUN absorption spectra were analysed using the non-linear least-squares fitting algorithm PROFFAST, obtaining the total columns of different trace gases (O2, CO2, CH4, CO and H2O) (Sha et al., 2020; Frey et al., 2021, and references therein). Then, the total column-averaged dry-air mole fractions of these gases (XGas) were computed by using the co-observed O2 total columns. The XGas mole fractions were calibrated onto the WMO gas standard scale maintained by the NOAA (National Oceanic and Atmospheric Administration, https://www.noaa.gov/, last access: 3 May 2023) and provided as standard COCCON products (Hase et al., 2016; Frey et al., 2019; Sha et al., 2020; Frey et al., 2021).
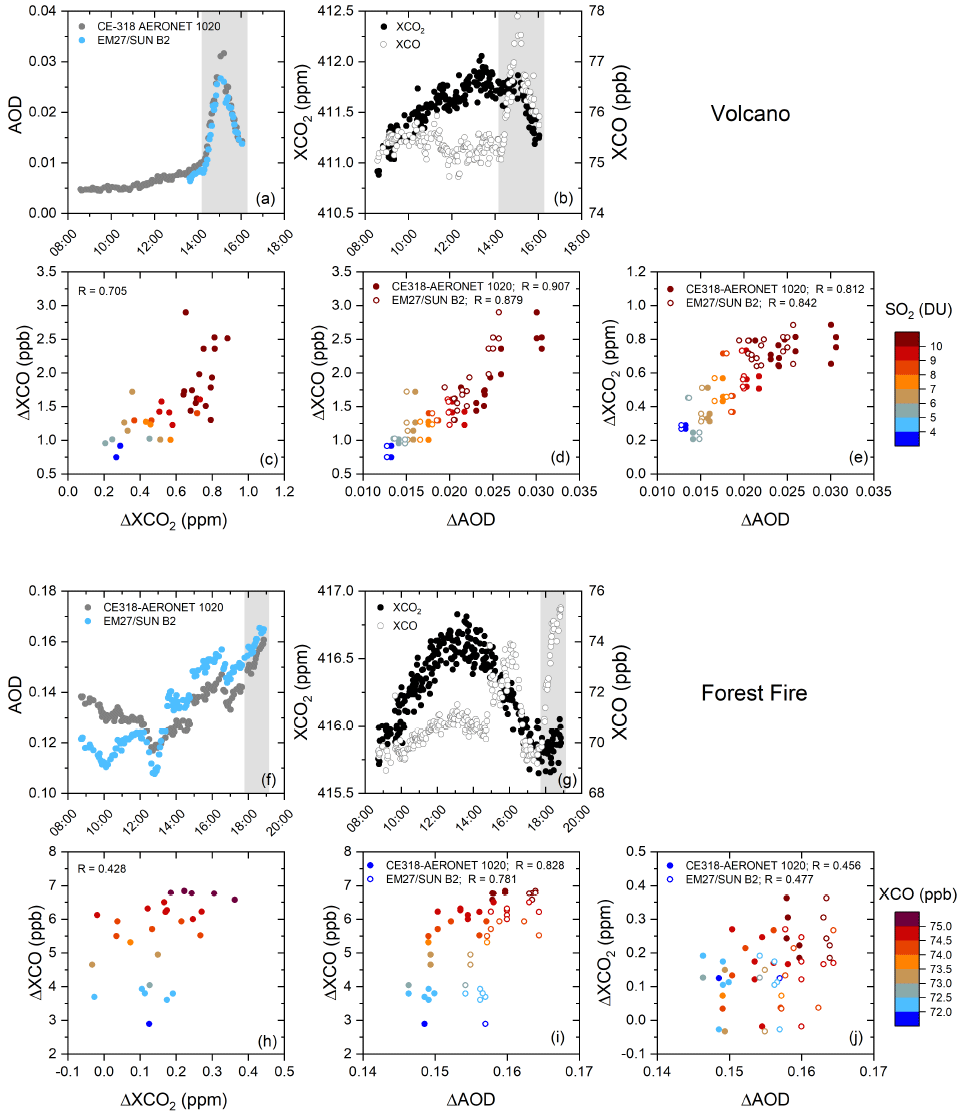
Figure 9The top panels show the volcanic event on 11 October 2021 (a–e). The bottom panels show the forest fire on 21 July 2022 (f–j). Each panel displays the instantaneous EM27/SUN and CE318-AERONET AOD values for B2 and 1020 nm band (a, f), EM27/SUN mole fractions of XCO2 (ppm) and XCO (ppb) (b, g), scatterplots of ΔXCO (ppb) versus ΔXCO2 (ppm) (c, h), ΔXCO (ppb) versus ΔAOD at B2/1020 nm (d, i), and ΔXCO2 (ppm) versus ΔAOD at B2/1020 nm (e, j). The time periods selected for the tracer–tracer anomaly assessment displayed in panels (c–e) and (h–j) correspond to the shaded areas in panels (a, b) and (f, g), respectively. R stands for the Pearson correlation coefficient.
For both case studies, the tracer–tracer anomaly correlation technique has been used to analyse the relationship between aerosol and trace gas enhancements (ΔAOD and ΔXGas, respectively) (e.g. Wong et al., 2016; García et al., 2021). To quantify the enhancements, we followed the approach of Frausto-Vicencio et al. (2023) and subtracted background from instantaneous values. Background gas values were calculated using the second percentile of daily measurements, whereas for ΔAOD the climatology background value at the IZO of 0.001 at 1020 nm was taken as a reference (Toledano et al., 2018). In Fig. 7, which summarises the two case studies, each panel depicts the instantaneous EM27/SUN and CE318-AERONET AOD values at B2/1020 nm, EM27/SUN XCO2 and XCO mole fractions and the correlation plots for ΔXCO–ΔXCO2, ΔXCO–ΔAOD and ΔXCO2–ΔAOD. The time periods selected for the tracer–tracer anomaly assessment were identified based on observed increases, especially in AOD and XCO records (shaded areas in Fig. 9a, b, f and g). It should be noted that although only the analysis for AOD at B2/1020 nm is discussed as a reference, similar conclusions were drawn from the other AOD bands (data not shown).
For the volcanic event, significant ΔXCO2 and ΔXCO of up to 1 ppm and 3 ppb were recorded, which represent mean increases of ∼ 0.15 % and 2 % with respect to the IZO background values, respectively. These ΔXCO2 values at the IZO, which is located 140 km from the La Palma volcano crater, are comparable to those observed, for example, for the Kilauea eruption (Hawaii) in 2018 at a distance of ∼ 200 km from the volcano (∼ 1–2 ppm; Johnson et al., 2020) or for passive degassing in Mt. Etna's plume (Italy) at only 5–10 km distance (up to 1.5 ppm; Butz et al., 2017) and in the Popocatépetl's plume at a distance of ∼ 12 km (∼ 1 ppm; Stremme et al., 2023). Despite the minor aerosol abundance observed during this event, both ΔXCO2 and ΔXCO show significant agreements with aerosol enhancements (R larger than 0.80 for ΔXCO2 and 0.85 for ΔXCO; Fig. 9d and e), suggesting that aerosol and emission sources, as well as the vertical mixing of emissions and their transport patterns, are similar. We found mean ratios of 30.8±3.8 ppm ΔAOD and 43.0±4.7 ppm ΔAOD for CE318-AERONET and EM27/SUN, respectively, whereas the mean ratios were 90.5±7.2 ppb ΔAOD and 118.2±11.0 ppb ΔAOD for CE318-AERONET and EM27/SUN, respectively. The clear linear relationship also observed with the SO2 total columns further confirms the volcanic origin of aerosol and trace gas emissions (R ranging between 0.80 and 0.90, with a mean Δ ratio of 48.4±4.8 and Δ of 0.10±0.02).
These results are also corroborated by the significant correlation found between CO2 and CO variations (R of 0.70), with a mean ratio of 1.86±0.32 . This ratio is in the lower range of that reported for other volcanoes (1 to 120 ) (e.g. Oppenheimer et al., 2002; Wardell et al., 2004; Mori and Notsu, 2008; Oppenheimer et al., 2018, and references therein). From a volcanological perspective, ratios in volcanic plumes are likely to provide valuable information on the redox conditions of magma, required for degassing models (Oppenheimer and Kyle, 2002; Moussallam et al., 2014; Ilanko et al., 2015). Following Moussallam et al. (2014) and considering a magma temperature of 1140 ∘C at La Palma (e.g. Day et al., 2022), a ratio of 1.86 would correspond to a log(fO2) of −6.4 equivalent to fayalite–magnetite–quartz (FMQ) redox buffer +2.6. It is in agreement with the vanadium-in-olivine oximetry results reported by Day et al. (2022) for the 2021 La Palma eruption.
For the forest fire event, the estimated ΔXCO values were twice as high as those from volcanic emissions, with values reaching up to 7 ppb (i.e. ∼ 7 % with respect to the IZO background levels). This highlights the significant contribution of CO from combustion processes during biomass burning emissions. In fact, the CO variations inferred in this study are similar to those associated with urban/industrial environments (e.g. Madrid and St. Petersburg; García et al., 2021; Makarova et al., 2021). Conversely, the CO2 signal was relatively weak, with enhancements smaller than 0.5 ppm (i.e. ∼ 0.04 % with respect to the IZO background levels). The subtle CO2 signature during this event was also corroborated by the surface CO2 records taken at the IZO in the framework of the WMO GAW programme (data not shown). As a result, the correlation between ΔXCO2, ΔXCO and ΔAOD is found to be moderate (R between 0.40 and 0.50; Fig. 9h and j), with a mean ratio of 5.2±2.2 and ratios of 10.7±4.8 ppm ΔAOD and 13.8±5.1 ppm ΔAOD for CE318-AERONET and EM27/SUN, respectively.
Although the ratio strongly depends on the type of vegetation, the ratio values obtained in this study are significantly lower than those found in the literature. For instance, previous studies have reported ratios of ∼ 60 for biomass burning emissions from tropical forests (Yokelson et al., 2007), whereas ratios ranging from 80 to ∼ 150 have been attributed to boreal forest emissions (Akagi et al., 2014; Vasileva et al., 2017). It is worth highlighting that, despite observing marked variability in the distribution, the ratios estimated here are comparable to those found for more diluted plumes from urban/industrial emissions using ground-based (i.e. 5.9–6.2 in St. Petersburg, 5.68–8.44 in Paris, 1.92–6.6 in London, 6–9 in Indianapolis; Makarova et al., 2021, and references therein) and satellite-based observations (ranging from 3.7 in Dallas to 23.9 in Tehran, as reported by MacDonald et al., 2023).
The relationship between CO and aerosol biomass burning emissions is more evident (R of ∼ 0.80), with mean ratios of 233 ± 31 ppb ΔAOD and 271 ± 43 ppb ΔAOD for CE318-AERONET and EM27/SUN, respectively. Considering CO total column amounts, the ratios for CE318-AERONET and EM27/SUN are calculated to be 1.57±0.05 ΔAOD and 1.85±0.06 ΔAOD, respectively. These values are in good agreement with the ratio of 1.50 ± 0.10 AOD (at 500 nm) reported by Paton-Walsh et al. (2005) for Australian forest fires.
The moderate agreement found for the forest fire event compared to volcanic emissions could be attributed, in part, to the proximity of the biomass burning source to the IZO, resulting in more temporally and spatially variable plumes. Additionally, these events coincided with the presence of mineral dust aerosols at the IZO, which contributed to the AOD records recorded at the observatory (see Fig. 9f). Therefore, this complex mixture of scenes could account for part of the observed variability.
This study utilised the low-resolution EM27/SUN FTIR spectrometer to obtain columnar spectral aerosol information in eight micro-windows in the infrared spectral range (873–2314 nm) under different conditions at the Izaña Observatory (IZO, Tenerife, Spain). The Langley plot procedure was applied to calibrate the instrument, not only to provide AOD retrievals but also to evaluate the radiometric stability of the EM27/SUN system. It is important to note that this Langley plot calibration is dispensable for standard trace gas retrievals, since high-resolution solar absorption spectra are self-calibrating in the sense that the absorption signature is referenced to the surrounding continuum. The temporal degradation observed in the calibration coefficients V0,λ was relatively low compared to that of the high-resolution IFS 125HR system at the same station, ranging between 0.66 % per month (B1–B2) and 0.78 % per month (B6–B8), with an all-band mean of 0.72 % per month (σ of 0.27 % per month).
The assessment of uncertainty in the EM27/SUN AOD retrievals (UAOD) was conducted in this study through the use of the Monte Carlo method. This approach encompassed the propagation of uncertainties linked to the parameters and measurements integral to the AOD retrieval process. Our results revealed expected uncertainties of 0.012, 0.013 and 0.009 for 870, 1020 and 1640 nm spectral bands, respectively.
The study successfully retrieved EM27/SUN spectral AOD in the infrared region, which was validated against the Cimel 318-T radiometer (as part of AERONET). A 3-year period of synchronous CE318-AERONET and EM27/SUN measurements was available to verify the coherence between the two data sets. The complete time span covered both an initial phase (2019–2020), characterised by a significant Langley plot calibration gap resulting from the COVID-19 lockdown restrictions, in addition to a subsequent 2-year interval (2021–2022) marked by a notable increase in the calibration frequency. In this regard, our results demonstrate that the calibration approach used in this paper based on Langley plot regular calibrations and smoothing spline functions to cover the calibration gaps is adequate to compensate for the optical degradation of the system. Other possible solutions to address this issue could involve the design of protective domes to prevent system degradation during operation or other absolute radiometric calibration procedures, such as using high-intensity calibration sources or robust calibration transfers, as already implemented during sporadic field campaigns by Gardiner et al. (2012), Menang et al. (2013) and Elsey et al. (2017). The AERONET–COCCON cross-validation showed average AOD differences limited to 0.005, with Pearson regression coefficients reaching up to 0.967. Based on the World Meteorological Organization (WMO) traceability criteria (U95), EM27/SUN AOD was traceable to CE318-AERONET up to 52.0 %, 71.1 % and 83.5 % for the 870, 1020 and 1640 nm coincident spectral bands, respectively.
The study also checked the spectral coherence between the EM27/SUN AOD retrievals by using a correlation matrix analysis, which showed a better spectral consistency in high-turbidity conditions between the bands within the 873–1021 nm (Kendall correlation coefficient, RK ∼ 0.90), 1238–1636 nm (RK= 0.92–0.98) and 2133–2314 nm (RK= 0.93–0.98) spectral ranges.
Two case studies were selected to demonstrate the potential of the EM27/SUN for improving the monitoring and understanding of atmospheric processes due to its ability to simultaneously retrieve column-integrated aerosol and trace gas information. These events were chosen when aerosols and trace gases shared similar emission sources, allowing AOD information to be used as a proxy to trace gas concentrations and vice versa and providing a comprehensive perspective of events. One case study was a volcanic plume that impacted the IZO on 11 October 2021 from the La Palma eruption, and the other was a forest fire that also affected the station on 21 July 2022. The analysis revealed a strong correlation between the enhancements of aerosols and trace gases (AOD, CO2 and CO), particularly for the volcanic case, which may be attributed to the well-mixed volcanic plume reaching the IZO.
In conclusion, EM27/SUN observations can enhance our understanding of atmospheric chemistry during events that generate high concentrations of particles or gases, such as dust events, forest fires, urban/industrial emissions or volcanic emissions. Simultaneous measurements of gases and aerosols are crucial, for example, to understand degassing processes in volcanoes, monitor in-plume chemistry and assess the impact of aerosols on remote gas measurements. The capability of the EM27/SUN to provide aerosol information in the NIR and SWIR spectral ranges can also be used to improve our knowledge of the radiative effect of large aerosols on climate. This portable instrument is highly versatile and can be deployed at numerous stations worldwide to meet specific measurement needs. Therefore, it has the potential to serve as a crucial tool for densifying current ground-based networks for observing aerosols and gases, as well as for validating satellite-based gas and aerosol products.
| ACTRIS | Aerosols, Clouds, and Trace Gases Research Infrastructure |
| AE | Ångström exponent |
| AEMET | State Meteorological Agency of Spain |
| AERONET | Aerosol Robotic Network |
| AOD | Aerosol optical depth |
| CIMO | Commission for Instruments and Methods of Observation |
| COCCON | COllaborative Carbon Column Observing Network |
| CV | Coefficient of variation |
| DU | Dobson units |
| EMPIR | European Metrology Programme for Innovation and Research |
| ERF | Effective radiative forcing |
| ESA | European Space Agency |
| EURAMET | European Association of National Metrology Institutes |
| FWHM | Full width at half maximum |
| GAW | Global Atmospheric Watching |
| GAW-PFR | Precision-filter radiometer |
| GCOS | Global Climate Observing System |
| GHG | Greenhouse gas |
| GUM | Guide to the Expression of Uncertainty in Measurement |
| FOV | Field of view |
| FTIR | Fourier transform infrared |
| IARC | Izaña Atmospheric Research Center |
| InGaAs | Indium gallium arsenide |
| IPCC | Intergovernmental Panel on Climate Change |
| IR | Infrared |
| IZO | Izaña Observatory |
| KIT | Karlsruhe Institute of Technology |
| MAPP | Metrology for aerosol properties |
| MD | Mean deviation |
| MCM | Monte Carlo method |
| NASA | National Aeronautics and Space Administration |
| NDACC | Network for the Detection of Atmospheric Composite Change |
| NIR | Near-infrared spectral region |
| NOAA | National Oceanic and Atmospheric Administration |
| OPD | Optical path difference |
| PWV | Precipitable water vapour |
| RK | Kendall rank correlation coefficient |
| RMSE | Root-mean-squared error |
| SI | International System of Units |
| SWIR | Short-wave infrared spectral region |
| TCCON | Total Carbon Column Observing Network |
| TOA | Top of atmosphere |
| TROPOMI | Tropospheric Monitoring Instrument |
| UV | Ultraviolet spectral region |
| VIS | Visible region |
| WMO | World Meteorological Organization |
The AERONET–Cimel data from the Izaña Observatory (“Izaña”) are available on the AERONET website: https://aeronet.gsfc.nasa.gov/cgi-bin/data_display_aod_v3?site= Izana&nachal=2&level=3&place_code=10 (Holben et al., 1998). The EM27/SUN and IFS 125HR data are available upon request to the corresponding authors.
OA, AB and OEG designed and wrote the structure and methodology of the paper. OA performed the calculations required for this analysis. FH, RDG, JG, SK and CT discussed the results and participated in the retrieval analysis. SFLL, ES, VC, AA, RR, AFA and NT performed the maintenance and daily checks of the IFS 125HR and EM27/SUN spectrometers and CE318-AERONET radiometer, respectively, providing detailed technical information on this instrumentation. EC ensured the provision of funds for the aerosol measurement programme at the Izaña Observatory. All authors discussed the results and contributed to the final paper.
At least one of the (co-)authors is a member of the editorial board of Atmospheric Measurement Techniques. The peer-review process was guided by an independent editor, and the authors also have no other competing interests to declare.
Publisher’s note: Copernicus Publications remains neutral with regard to jurisdictional claims made in the text, published maps, institutional affiliations, or any other geographical representation in this paper. While Copernicus Publications makes every effort to include appropriate place names, the final responsibility lies with the authors.
This work has been supported by the European Metrology Programme for Innovation and Research (EMPIR) within the joint research project EMPIR 19ENV04 MAPP. The EMPIR is jointly funded by the EMPIR-participating countries within EURAMET and the European Union. Additionally, the activities have been developed within the framework of the World Meteorological Organization (WMO) Commission for Instruments and Methods of Observations (CIMO) Izaña Testbed for Aerosols and Water Vapour Remote Sensing Instruments. The AERONET sun photometers at the Izaña Observatory (IZO) were calibrated through the AEROSPAIN Central Facility (https://aerospain.aemet.es/, last access: 16 July 2023), supported by the European Community Research Infrastructure Action under the ACTRIS grant (agreement no. 871115). The authors also acknowledge the support from the Ministerio de Economía y Competitividad of Spain through the project SYNERA (PID2020-521-118793GA-I00), as well as the IZO staff for maintaining the instrumentation, thus ensuring the quality of the data.
This research has been supported by the European Community Research Infrastructure Action under the ACTRIS grant (grant no. 871115), the Ministerio de Economía y Competitividad of Spain through the project SYNERA (grant no. PID2020-521-118793GA-I00), and the European Metrology Programme for Innovation and Research (EMPIR) within the joint research project EMPIR 19ENV04 MAPP. The EMPIR is jointly funded by the EMPIR-participating countries within EURAMET and the European Union.
This paper was edited by Vassilis Amiridis and reviewed by two anonymous referees.
Akagi, S. K., Burling, I. R., Mendoza, A., Johnson, T. J., Cameron, M., Griffith, D. W. T., Paton-Walsh, C., Weise, D. R., Reardon, J., and Yokelson, R. J.: Field measurements of trace gases emitted by prescribed fires in southeastern US pine forests using an open-path FTIR system, Atmos. Chem. Phys., 14, 199–215, https://doi.org/10.5194/acp-14-199-2014, 2014. a
Alberti, C., Hase, F., Frey, M., Dubravica, D., Blumenstock, T., Dehn, A., Castracane, P., Surawicz, G., Harig, R., Baier, B. C., Bès, C., Bi, J., Boesch, H., Butz, A., Cai, Z., Chen, J., Crowell, S. M., Deutscher, N. M., Ene, D., Franklin, J. E., García, O., Griffith, D., Grouiez, B., Grutter, M., Hamdouni, A., Houweling, S., Humpage, N., Jacobs, N., Jeong, S., Joly, L., Jones, N. B., Jouglet, D., Kivi, R., Kleinschek, R., Lopez, M., Medeiros, D. J., Morino, I., Mostafavipak, N., Müller, A., Ohyama, H., Palmer, P. I., Pathakoti, M., Pollard, D. F., Raffalski, U., Ramonet, M., Ramsay, R., Sha, M. K., Shiomi, K., Simpson, W., Stremme, W., Sun, Y., Tanimoto, H., Té, Y., Tsidu, G. M., Velazco, V. A., Vogel, F., Watanabe, M., Wei, C., Wunch, D., Yamasoe, M., Zhang, L., and Orphal, J.: Improved calibration procedures for the EM27/SUN spectrometers of the COllaborative Carbon Column Observing Network (COCCON), Atmos. Meas. Tech., 15, 2433–2463, https://doi.org/10.5194/amt-15-2433-2022, 2022. a, b, c
Alexandrov, M. D., Schmid, B., Turner, D. D., Cairns, B., Oinas, V., Lacis, A. A., Gutman, S. I., Westwater, E. R., Smirnov, A., and Eilers, J.: Columnar water vapor retrievals from multifilter rotating shadowband radiometer data, J. Geophys. Res.-Atmos., 114, D02306, https://doi.org/10.1029/2008JD010543, 2009. a
Barreto, Á., Cuevas, E., Granados-Muñoz, M.-J., Alados-Arboledas, L., Romero, P. M., Gröbner, J., Kouremeti, N., Almansa, A. F., Stone, T., Toledano, C., Román, R., Sorokin, M., Holben, B., Canini, M., and Yela, M.: The new sun-sky-lunar Cimel CE318-T multiband photometer – a comprehensive performance evaluation, Atmos. Meas. Tech., 9, 631–654, https://doi.org/10.5194/amt-9-631-2016, 2016. a
Barreto, A., García, O., Schneider, M., García, R., Hase, F., Sepúlveda, E., Almansa, A., Cuevas, E., and Blumenstock, T.: Spectral Aerosol Optical Depth Retrievals by Ground-Based Fourier Transform Infrared Spectrometry, Remote Sens.-Basel, 12, 3148, https://doi.org/10.3390/rs12193148, 2020. a, b, c, d, e, f, g, h, i, j, k, l, m, n, o, p, q, r
Barreto, Á., Cuevas, E., García, R. D., Carrillo, J., Prospero, J. M., Ilić, L., Basart, S., Berjón, A. J., Marrero, C. L., Hernández, Y., Bustos, J. J., Ničković, S., and Yela, M.: Long-term characterisation of the vertical structure of the Saharan Air Layer over the Canary Islands using lidar and radiosonde profiles: implications for radiative and cloud processes over the subtropical Atlantic Ocean, Atmos. Chem. Phys., 22, 739–763, https://doi.org/10.5194/acp-22-739-2022, 2022a. a, b, c, d
Barreto, Á., García, R. D., Guirado-Fuentes, C., Cuevas, E., Almansa, A. F., Milford, C., Toledano, C., Expósito, F. J., Díaz, J. P., and León-Luis, S. F.: Aerosol characterisation in the subtropical eastern North Atlantic region using long-term AERONET measurements, Atmos. Chem. Phys., 22, 11105–11124, https://doi.org/10.5194/acp-22-11105-2022, 2022b. a, b, c
Bedoya-Velásquez, A. E., Hoyos-Restrepo, M., Barreto, A., García, R. D., Romero-Campos, P. M., García, O., Ramos, R., Roininen, R., Toledano, C., Sicard, M., and Ceolato, R.: Estimation of the Mass Concentration of Volcanic Ash Using Ceilometers: Study of Fresh and Transported Plumes from La Palma Volcano, Remote Sens.-Basel, 14, 5680, https://doi.org/10.3390/rs14225680, 2022. a
Bellouin, N., Quaas, J., Gryspeerdt, E., Kinne, S., Stier, P., Watson-Parris, D., Boucher, O., Carslaw, K. S., Christensen, M., Daniau, A.-L., Dufresne, J.-L., Feingold, G., Fiedler, S., Forster, P., Gettelman, A., Haywood, J. M., Lohmann, U., Malavelle, F., Mauritsen, T., McCoy, D. T., Myhre, G., Mülmenstädt, J., Neubauer, D., Possner, A., Rugenstein, M., Sato, Y., Schulz, M., Schwartz, S. E., Sourdeval, O., Storelvmo, T., Toll, V., Winker, D., and Stevens, B.: Bounding Global Aerosol Radiative Forcing of Climate Change, Rev. Geophys., 58, e2019RG000660, https://doi.org/10.1029/2019RG000660, 2020. a
Benedetti, A., Reid, J. S., Knippertz, P., Marsham, J. H., Di Giuseppe, F., Rémy, S., Basart, S., Boucher, O., Brooks, I. M., Menut, L., Mona, L., Laj, P., Pappalardo, G., Wiedensohler, A., Baklanov, A., Brooks, M., Colarco, P. R., Cuevas, E., da Silva, A., Escribano, J., Flemming, J., Huneeus, N., Jorba, O., Kazadzis, S., Kinne, S., Popp, T., Quinn, P. K., Sekiyama, T. T., Tanaka, T., and Terradellas, E.: Status and future of numerical atmospheric aerosol prediction with a focus on data requirements, Atmos. Chem. Phys., 18, 10615–10643, https://doi.org/10.5194/acp-18-10615-2018, 2018. a
Berjón, A., Barreto, A., Hernández, Y., Yela, M., Toledano, C., and Cuevas, E.: A 10-year characterization of the Saharan Air Layer lidar ratio in the subtropical North Atlantic, Atmos. Chem. Phys., 19, 6331–6349, https://doi.org/10.5194/acp-19-6331-2019, 2019. a
Bodhaine, B. A., Wood, N. B., Dutton, E. G., and Slusser, J. R.: On Rayleigh Optical Depth Calculations, J. Atmos. Ocean Tech., 16, 1854–1861, https://doi.org/10.1175/1520-0426(1999)016<1854:ORODC>2.0.CO;2, 1999. a
Bojinski, S., Verstraete, M. M., Peterson, T. C., Richter, C. G., Simmons, A., and Zemp, M.: The Concept of Essential Climate Variables in Support of Climate Research, Applications, and Policy, B. Am. Meteorol. Soc., 95, 1431–1443, 2014. a
Bolsee, D., Pereira, N., Decuyper, W., Gillotay, D., Yu, H., Sperfeld, P., Pape, S., Cuevas, E., Redondas, A., and Hernandez, Y.: Accurate Determination of the TOA Solar Spectral NIR Irradiance Using a Primary Standard Source and Bouguer–Langley Technique, Solar Phys., 289, 2433–2457, https://doi.org/10.1007/s11207-014-0474-1, 2014. a
Butz, A., Dinger, A. S., Bobrowski, N., Kostinek, J., Fieber, L., Fischerkeller, C., Giuffrida, G. B., Hase, F., Klappenbach, F., Kuhn, J., Lübcke, P., Tirpitz, L., and Tu, Q.: Remote sensing of volcanic CO2, HF, HCl, SO2, and BrO in the downwind plume of Mt. Etna, Atmos. Meas. Tech., 10, 1–14, https://doi.org/10.5194/amt-10-1-2017, 2017. a, b
Chen, C., Dubovik, O., Schuster, G., Chin, M., Henze, D., Lapyonok, T., Derimian, Y., and Ying, Z.: Multi-angular polarimetric remote sensing to pinpoint global aerosol absorption and direct radiative forcing, Nat. Commun., 13, 7459, https://doi.org/10.1038/s41467-022-35147-y, 2022. a
Clarisse, L., Coheur, P.-F., Prata, F., Hadji-Lazaro, J., Hurtmans, D., and Clerbaux, C.: A unified approach to infrared aerosol remote sensing and type specification, Atmos. Chem. Phys., 13, 2195–2221, https://doi.org/10.5194/acp-13-2195-2013, 2013. a, b
Córdoba-Jabonero, C., Sicard, M., África Barreto, Toledano, C., Ángeles López-Cayuela, M., Gil-Díaz, C., García, O., Carvajal-Pérez, C. V., Comerón, A., Ramos, R., Muñoz-Porcar, C., and Rodríguez-Gómez, A.: Fresh volcanic aerosols injected in the atmosphere during the volcano eruptive activity at the Cumbre Vieja area (La Palma, Canary Islands): Temporal evolution and vertical impact, Atmos. Environ., 300, 119667, https://doi.org/10.1016/j.atmosenv.2023.119667, 2023. a
Cuevas, E., Gómez-Peláez, A., Rodríguez, S., Terradellas, E., Basart, S., García, R., García, O., and Alonso-Pérez, S.: The pulsating nature of large-scale Saharan dust transport as a result of interplays between mid-latitude Rossby waves and the North African Dipole Intensity, Atmos. Environ., 167, 586–602, https://doi.org/10.1016/j.atmosenv.2017.08.059, 2017. a, b
Cuevas, E., Milford, C., Bustos, J. J., García, O. E., García, R. D., Gómez-Peláez, A. J., Guirado-Fuentes, C., Marrero, C., Prats, N., Ramos, R., Redondas, A., Reyes, E., Rivas-Soriano, P. P., Rodríguez, S., Romero-Campos, P. M., Torres, C. J., Schneider, M., Yela, M., Belmonte, J., del Campo-Hernández, R., Almansa, F., Barreto, A., López-Solano, C., Basart, S., Terradellas, E., Werner, E., Afonso, S., Bayo, C., Berjón, A., Carreño, V., Castro, N. J., Chinea, N., Cruz, A. M., Damas, M., De Ory-Ajamil, F., García, M. I., Gómez-Trueba, V., Hernández, C., Hernández, Y., Hernández-Cruz, B., León-Luís, S. F., López-Fernández, R., López-Solano, J., Parra, F., Rodríguez, E., Rodríguez-Valido, M., Sálamo, C., Sanromá, E., Santana, D., Santo Tomás, F., Sepúlveda, E., , and Sosa, E.: Izaña Atmospheric Research Center Activity Report 2017-2018., Tech. Rep. WMO/GAW No. 247, World Meteorological Organization & Izaña Atmospheric Research Center (AEMET), https://izana.aemet.es/wp-content/docs/Izana_Report_2017_2018.pdf (last access: 16 July 2023), 2019a. a, b
Cuevas, E., Romero-Campos, P. M., Kouremeti, N., Kazadzis, S., Räisänen, P., García, R. D., Barreto, A., Guirado-Fuentes, C., Ramos, R., Toledano, C., Almansa, F., and Gröbner, J.: Aerosol optical depth comparison between GAW-PFR and AERONET-Cimel radiometers from long-term (2005–2015) 1 min synchronous measurements, Atmos. Meas. Tech., 12, 4309–4337, https://doi.org/10.5194/amt-12-4309-2019, 2019b. a, b, c
Cuevas, E., Milford, C., Barreto, A., Bustos, J. J., García, O. E., García, R. D., Marrero, C., Prats, N., Redondas, A., Reyes, E., Rivas-Soriano, P. P., Romero-Campos, P. M., Torres, C. J., Schneider, M., Yela, M., Belmonte, J., Almansa, F., López-Solano, C., Basart, S., Werner, E., Rodríguez, S., Afonso, S., Alcántara, A., Álvarez, O., Bayo, C., Berjón, A., Carreño, V., Castro, N. J., Chinea, N., Cruz, A. M., Damas, M., Gómez-Trueba, V., González, Y., Guirado-Fuentes, C., Hérnandez, C., León-Luis, S. L., López-Fernández, R., López-Solano, J., Parra, F., Pérez de la Puerta, J., Rodríguez-Valido, M., Sálamo, C., Santana, D., Santo-Tomas, F., Sepúlveda, E., and Serrano, A.: Iza na Atmospheric Research Center, WMO/GAW Report No. 276, World Meteorological Organization & Izaña Atmospheric Researh Center (AEMET), https://izana.aemet.es/wp-content/docs/Izana_Report_2019_2020.pdf (last access: 16 July 2023), 2022. a
Day, J. M., Troll, V. R., Aulinas, M., Deegan, F. M., Geiger, H., Carracedo, J. C., Pinto, G. G., and Perez-Torrado, F. J.: Mantle source characteristics and magmatic processes during the 2021 La Palma eruption, Earth Planet. Sc. Lett., 597, 117793, https://doi.org/10.1016/j.epsl.2022.117793, 2022. a, b
Does, M., Knippertz, P., Zschenderlein, P., Harrison, R., and Stuut, J.-B.: The mysterious long-range transport of giant mineral dust particles, Sci. Adv., 4, eaau2768, https://doi.org/10.1126/sciadv.aau2768, 2018. a
Dreyfus, G., Xu, Y., Shindell, D., Zaelke, D., and Ramanathan, V.: Mitigating climate disruption in time: A self-consistent approach for avoiding both near-term and long-term global warming, P. Natl. Acad. Sci. USA, 119, e2123536119, https://doi.org/10.1073/pnas.2123536119, 2022. a
Dubovik, O. and King, M. D.: A flexible inversion algorithm for retrieval of aerosol optical properties from Sun and sky radiance measurements, J. Geophys. Res.-Atmos., 105, 20673–20696, https://doi.org/10.1029/2000JD900282, 2000. a
Dufresne, J.-L., Gautier, C., Ricchiazzi, P., and Fouquart, Y.: Longwave Scattering Effects of Mineral Aerosols, J. Atmos. Sci., 59, 1959–1966, https://doi.org/10.1175/1520-0469(2002)059<1959:LSEOMA>2.0.CO;2, 2002. a
Eck, T. F., Holben, B. N., Reid, J., Dubovik, O., Smirnov, A., Neill, N., Slutsker, I., and Kinne, S.: Wavelength dependence of the optical depth of biomass burning, urban, and desert dust aerosols, J. Geophys. Res., 104349, 333–31, https://doi.org/10.1029/1999JD900923, 1999. a
Egli, L., Gröbner, J., Hülsen, G., Schill, H., and Stübi, R.: Traceable total ozone column retrievals from direct solar spectral irradiance measurements in the ultraviolet, Atmos. Meas. Tech., 15, 1917–1930, https://doi.org/10.5194/amt-15-1917-2022, 2022. a
Elsey, J., Coleman, M. D., Gardiner, T., and Shine, K. P.: Can Measurements of the Near-Infrared Solar Spectral Irradiance be Reconciled? A New Ground-Based Assessment Between 4,000 and 10,000 cm−1, Geophys. Res. Lett., 44, 10071–10080, https://doi.org/10.1002/2017GL073902, 2017. a
ESA: Copernicus Sentinel-5P (processed by ESA (European Space Agency)), 2021, TROPOMI Level 2 Carbon Monoxide total column products, Version 02, European Space Agency, https://doi.org/10.5270/S5P-bj3nry0, 2021a. a
ESA: Copernicus Sentinel-5P (processed by ESA (European Space Agency), 2021, TROPOMI Level 2 Carbon Monoxide total column products, Version 02, European Space Agency, https://doi.org/10.5270/S5P-bj3nry0, 2021b. a
Forster, P., Storelvmo, T., Armour, K., Collins, W., Dufresne, J.-L., Frame, D., Lunt, D., Mauritsen, T., Palmer, M., Watanabe, M., Wild, M., and Zhang, H.: The Earth's Energy Budget, Climate Feedbacks, and Climate Sensitivity, Cambridge University Press, Cambridge, United Kingdom and New York, NY, USA, https://doi.org/10.1017/9781009157896.009, p. 923–1054, 2021. a, b
Frausto-Vicencio, I., Heerah, S., Meyer, A. G., Parker, H. A., Dubey, M., and Hopkins, F. M.: Ground solar absorption observations of total column CO, CO2, CH4, and aerosol optical depth from California's Sequoia Lightning Complex Fire: emission factors and modified combustion efficiency at regional scales, Atmos. Chem. Phys., 23, 4521–4543, https://doi.org/10.5194/acp-23-4521-2023, 2023. a, b, c, d
Frey, M., Sha, M. K., Hase, F., Kiel, M., Blumenstock, T., Harig, R., Surawicz, G., Deutscher, N. M., Shiomi, K., Franklin, J. E., Bösch, H., Chen, J., Grutter, M., Ohyama, H., Sun, Y., Butz, A., Mengistu Tsidu, G., Ene, D., Wunch, D., Cao, Z., Garcia, O., Ramonet, M., Vogel, F., and Orphal, J.: Building the COllaborative Carbon Column Observing Network (COCCON): long-term stability and ensemble performance of the EM27/SUN Fourier transform spectrometer, Atmos. Meas. Tech., 12, 1513–1530, https://doi.org/10.5194/amt-12-1513-2019, 2019. a, b, c, d, e
Frey, M. M., Hase, F., Blumenstock, T., Dubravica, D., Groß, J., Göttsche, F., Handjaba, M., Amadhila, P., Mushi, R., Morino, I., Shiomi, K., Sha, M. K., de Mazière, M., and Pollard, D. F.: Long-term column-averaged greenhouse gas observations using a COCCON spectrometer at the high-surface-albedo site in Gobabeb, Namibia, Atmos. Meas. Tech., 14, 5887–5911, https://doi.org/10.5194/amt-14-5887-2021, 2021. a, b, c, d
Fröhlich, C. and Shaw, G. E.: New determination of Rayleigh scattering in the terrestrial atmosphere, Appl. Optics, 19, 1773–1775, https://doi.org/10.1364/AO.19.001773, 1980. a
García, O., Sepúlveda, E., León-Luis, S., Morgui, J.-A., Frey, M., Schneider, C., Ramos, R., Torres, C., Curcoll, R., Estruch, C., Barreto, A., Toledano, C., Hase, F., Butz, A., Cuevas, E., Blumenstock, T., Bustos, J., and Marrero, C.: Monitoring of Greenhouse Gas and Aerosol Emissions in Madrid megacity (MEGEI-MAD), in: GAW Symposium 2021, 28 June–3 July 2021, online, 2021. a, b
García, O., Stremme, W., Taquet, N., Hase, F., Ortega, I., Hannigan, J., Smale, D., Vigouroux, C., Grutter, M., Blumenstock, T., Schneider, M., and Redondas, A.: Sulphur dioxide from ground-based Fourier transform infrared spectroscopy: application to volcanic emissions, in: IRWG-NDACC Meeting 2022, 26–30 September 2022, online, 2022. a
García, O. E., Sepúlveda, E., Schneider, M., Hase, F., August, T., Blumenstock, T., Kühl, S., Munro, R., Gómez-Peláez, Á. J., Hultberg, T., Redondas, A., Barthlott, S., Wiegele, A., González, Y., and Sanromá, E.: Consistency and quality assessment of the Metop-A/IASI and Metop-B/IASI operational trace gas products (O3, CO, N2O, CH4, and CO2) in the subtropical North Atlantic, Atmos. Meas. Tech., 9, 2315–2333, https://doi.org/10.5194/amt-9-2315-2016, 2016. a
García, O. E., Schneider, M., Sepúlveda, E., Hase, F., Blumenstock, T., Cuevas, E., Ramos, R., Gross, J., Barthlott, S., Röhling, A. N., Sanromá, E., González, Y., Gómez-Peláez, Á. J., Navarro-Comas, M., Puentedura, O., Yela, M., Redondas, A., Carreño, V., León-Luis, S. F., Reyes, E., García, R. D., Rivas, P. P., Romero-Campos, P. M., Torres, C., Prats, N., Hernández, M., and López, C.: Twenty years of ground-based NDACC FTIR spectrometry at Izaña Observatory – overview and long-term comparison to other techniques, Atmos. Chem. Phys., 21, 15519–15554, https://doi.org/10.5194/acp-21-15519-2021, 2021. a, b
García, R. D., García, O. E., Cuevas, E., Cachorro, V. E., Romero-Campos, P. M., Ramos, R., and de Frutos, A. M.: Solar radiation measurements compared to simulations at the BSRN Izaña station. Mineral dust radiative forcing and efficiency study, J. Geophys. Res.-Atmos., 119, 179–194, https://doi.org/10.1002/2013JD020301, 2014. a
García-Cabrera, R. D., Cuevas-Agulló, E., Barreto, Á., Cachorro, V. E., Pó, M., Ramos, R., and Hoogendijk, K.: Aerosol retrievals from the EKO MS-711 spectral direct irradiance measurements and corrections of the circumsolar radiation, Atmos. Meas. Tech., 13, 2601–2621, https://doi.org/10.5194/amt-13-2601-2020, 2020. a, b
García, R. D., García, O. E., Cuevas-Agulló, E., Barreto, A., Cachorro, V. E., Marrero, C., Almansa, F., Ramos, R., and Pó, M.: Spectral Aerosol Radiative Forcing and Efficiency of the La Palma Volcanic Plume over the Izaña Observatory, Remote Sens.-Basel, 15, 173, https://doi.org/10.3390/rs15010173, 2023. a, b, c, d
Gardiner, T. D., Coleman, M., Browning, H., Tallis, L., Ptashnik, I. V., and Shine, K. P.: Absolute high spectral resolution measurements of surface solar radiation for detection of water vapour continuum absorption, Philos. T. R. Soc. A., 370, 2590–2610, https://doi.org/10.1098/rsta.2011.0221, 2012. a
Giles, D. M., Sinyuk, A., Sorokin, M. G., Schafer, J. S., Smirnov, A., Slutsker, I., Eck, T. F., Holben, B. N., Lewis, J. R., Campbell, J. R., Welton, E. J., Korkin, S. V., and Lyapustin, A. I.: Advancements in the Aerosol Robotic Network (AERONET) Version 3 database – automated near-real-time quality control algorithm with improved cloud screening for Sun photometer aerosol optical depth (AOD) measurements, Atmos. Meas. Tech., 12, 169–209, https://doi.org/10.5194/amt-12-169-2019, 2019. a, b, c, d, e
Gisi, M., Hase, F., Dohe, S., and Blumenstock, T.: Camtracker: a new camera controlled high precision solar tracker system for FTIR-spectrometers, Atmos. Meas. Tech., 4, 47–54, https://doi.org/10.5194/amt-4-47-2011, 2011. a
Gisi, M., Hase, F., Dohe, S., Blumenstock, T., Simon, A., and Keens, A.: XCO2−measurements with a tabletop FTS using solar absorption spectroscopy, Atmos. Meas. Tech., 5, 2969–2980, https://doi.org/10.5194/amt-5-2969-2012, 2012. a, b
Gröbner, J. and Kouremeti, N.: The Precision Solar Spectroradiometer (PSR) for direct solar irradiance measurements, J. Sol. Energ., 185, 199–210, https://doi.org/10.1016/j.solener.2019.04.060, 2019. a
Gröbner, J., Kröger, I., Egli, L., Hülsen, G., Riechelmann, S., and Sperfeld, P.: The high-resolution extraterrestrial solar spectrum (QASUMEFTS) determined from ground-based solar irradiance measurements, Atmos. Meas. Tech., 10, 3375–3383, https://doi.org/10.5194/amt-10-3375-2017, 2017. a, b
Guirado, C.: Caracterización de las propiedades de los aerosoles en columna en la región subtropical, PhD thesis, Universidad de Valladolid, http://uvadoc.uva.es/handle/10324/13220 (last access: 16 July 2023), 2015. a
GUM: Guide to the Expression of Uncertainty in Measurement, 1995, with Supplement 1, Evaluation of measurement data, JCGM 101: 2008, Organization for Standardization, Geneva, Switzerland, 2008. a
Hase, F., Frey, M., Blumenstock, T., Groß, J., Kiel, M., Kohlhepp, R., Mengistu Tsidu, G., Schäfer, K., Sha, M. K., and Orphal, J.: Application of portable FTIR spectrometers for detecting greenhouse gas emissions of the major city Berlin, Atmos. Meas. Tech., 8, 3059–3068, https://doi.org/10.5194/amt-8-3059-2015, 2015. a
Hase, F., Frey, M., Kiel, M., Blumenstock, T., Harig, R., Keens, A., and Orphal, J.: Addition of a channel for XCO observations to a portable FTIR spectrometer for greenhouse gas measurements, Atmos. Meas. Tech., 9, 2303–2313, https://doi.org/10.5194/amt-9-2303-2016, 2016. a, b, c, d
Holben, B., Eck, T., Slutsker, I., Tanré, D., Buis, J., Setzer, A., Vermote, E., Reagan, J., Kaufman, Y., Nakajima, T., Lavenu, F., Jankowiak, I., and Smirnov, A.: AERONET – A Federated Instrument Network and Data Archive for Aerosol Characterization, Remote Sens. Environ., 66, 1–16, https://doi.org/10.1016/S0034-4257(98)00031-5, 1998 (data available at: https://aeronet.gsfc.nasa.gov/cgi-bin/data_display_aod_v3?site=Izana&nachal=2&level=3&place _code=10, last access: 16 July 2023). a, b, c, d, e
Holben, B. N., Tanré, D., Smirnov, A., Eck, T. F., Slutsker, I., Abuhassan, N., Newcomb, W. W., Schafer, J. S., Chatenet, B., Lavenu, F., Kaufman, Y. J., Castle, J. V., Setzer, A., Markham, B., Clark, D., Frouin, R., Halthore, R., Karneli, A., O'Neill, N. T., Pietras, C., Pinker, R. T., Voss, K., and Zibordi, G.: An emerging ground-based aerosol climatology: Aerosol optical depth from AERONET, J. Geophys. Res.-Atmos., 106, 12067–12097, https://doi.org/10.1029/2001JD900014, 2001. a
Ilanko, T., Oppenheimer, C., Burgisser, A., and Kyle, P.: Cyclic degassing of Erebus volcano, Antarctica, B. Volcanol., 77, 1–15, https://doi.org/10.1007/s00445-015-0941-z, 2015. a
Johnson, M. S., Schwandner, F. M., Potter, C. S., Nguyen, H. M., Bell, E., Nelson, R. R., S., P., and C. W., O.: Carbon dioxide emissions during the 2018 Kilauea volcano eruption estimated using OCO-2 satellite retrievals, Geophys. Res. Lett., 47, e2020GL090507, https://doi.org/10.1029/2020GL090507, 2020. a
Jung, Y., Kim, J., Kim, W., Boesch, H., Lee, H., Cho, C., and Goo, T.-Y.: Impact of Aerosol Property on the Accuracy of a CO2 Retrieval Algorithm from Satellite Remote Sensing, Remote Sens.-Basel, 8, https://doi.org/10.3390/rs8040322, 2016. a
Junge, C.: The size distribution and aging of natural aerosols as determined from electrical and optical data on the atmosphere, J. Meteorol., 12, 13–25, https://doi.org/10.1175/1520-0469(1955)012<0013:TSDAAO>2.0.CO;2, 1955. a
Karanikolas, A., Kouremeti, N., Gröbner, J., Egli, L., and Kazadzis, S.: Sensitivity of aerosol optical depth trends using long-term measurements of different sun photometers, Atmos. Meas. Tech., 15, 5667–5680, https://doi.org/10.5194/amt-15-5667-2022, 2022. a
Kasten, F. and Young, A. T.: Revised optical air mass tables and approximation formula, Appl. Optics, 28, 4735–4738, https://doi.org/10.1364/AO.28.004735, 1989. a, b, c
Ke, J., Wang, S., Chen, S., Dong, C., Sun, Y., and Liu, D.: Retrieved XCO2 Accuracy Improvement by Reducing Aerosol-Induced Bias for China's Future High-Precision Greenhouse Gases Monitoring Satellite Mission, Atmosphere, 13, 1384, https://doi.org/10.3390/atmos13091384, 2022. a
Kendall, M.: A New Measure of Rank Correlation, Biometrika, 30, 81–89, https://doi.org/10.1093/biomet/30.1-2.81, 1938. a
Keppel-Aleks, G., Toon, G., Wennberg, P., and Deutscher, N.: Reducing the impact of source brightness fluctuations on spectra obtained by Fourier-transform spectrometry, Appl. Optics, 46, 4774–9, https://doi.org/10.1364/AO.46.004774, 2007. a
Kinne, S.: Aerosol radiative effects with MACv2, Atmos. Chem. Phys., 19, 10919–10959, https://doi.org/10.5194/acp-19-10919-2019, 2019. a
Li, J., Carlson, B., Yung, Y., Lv, D., Hansen, J., Penner, J., Liao, H., Ramaswamy, V., Kahn, R., Zhang, P., Dubovik, O., Ding, A., Lacis, A., Zhang, L., and Dong, Y.: Scattering and absorbing aerosols in the climate system, Nat. Rev. Earth Environ., 3, 363–379, https://doi.org/10.1038/s43017-022-00296-7, 2022. a
Ma, X., Yu, F., and Quaas, J.: Reassessment of satellite-based estimate of aerosol climate forcing, J. Geophys. Res.-Atmos., 119, 10394–10409, https://doi.org/10.1002/2014JD021670, 2014. a
MacDonald, C. G., Mastrogiacomo, J.-P., Laughner, J. L., Hedelius, J. K., Nassar, R., and Wunch, D.: Estimating enhancement ratios of nitrogen dioxide, carbon monoxide and carbon dioxide using satellite observations, Atmos. Chem. Phys., 23, 3493–3516, https://doi.org/10.5194/acp-23-3493-2023, 2023. a
Makarova, M. V., Alberti, C., Ionov, D. V., Hase, F., Foka, S. C., Blumenstock, T., Warneke, T., Virolainen, Y. A., Kostsov, V. S., Frey, M., Poberovskii, A. V., Timofeyev, Y. M., Paramonova, N. N., Volkova, K. A., Zaitsev, N. A., Biryukov, E. Y., Osipov, S. I., Makarov, B. K., Polyakov, A. V., Ivakhov, V. M., Imhasin, H. Kh., and Mikhailov, E. F.: Emission Monitoring Mobile Experiment (EMME): an overview and first results of the St. Petersburg megacity campaign 2019, Atmos. Meas. Tech., 14, 1047–1073, https://doi.org/10.5194/amt-14-1047-2021, 2021. a, b
Menang, K. P., Coleman, M. D., Gardiner, T. D., Ptashnik, I. V., and Shine, K. P.: A high-resolution near-infrared extraterrestrial solar spectrum derived from ground-based Fourier transform spectrometer measurements, J. Geophys. Res.-Atmos., 118, 5319–5331, https://doi.org/10.1002/jgrd.50425, 2013. a
Milford, C., Torres, C., Vilches, J., Gossman, A.-K., Weis, F., Suárez-Molina, D., García, O. E., Prats, N., África Barreto, García, R. D., Bustos, J. J., Marrero, C. L., Ramos, R., Chinea, N., Boulesteix, T., Taquet, N., Rodríguez, S., López-Darias, J., Sicard, M., Córdoba-Jabonero, C., and Cuevas, E.: Impact of the 2021 La Palma volcanic eruption on air quality: Insights from a multidisciplinary approach, Sci. Total Environ., 869, 161652, https://doi.org/10.1016/j.scitotenv.2023.161652, 2023. a, b, c, d, e
Mori, T. and Notsu, K.: Temporal variation in chemical composition of the volcanic plume from Aso volcano, Japan, measured by remote FT-IR spectroscopy, Geochem. J., 42, 133–140, https://doi.org/10.2343/geochemj.42.133, 2008. a
Moussallam, Y., Peters, N., Ramírez, C., Oppenheimer, C., Aiuppa, A., and Giudice, G.: Characterisation of the magmatic signature in gas emissions from Turrialba Volcano, Costa Rica, Solid Earth, 5, 1341–1350, https://doi.org/10.5194/se-5-1341-2014, 2014. a, b
Nakajima, T., Campanelli, M., Che, H., Estellés, V., Irie, H., Kim, S.-W., Kim, J., Liu, D., Nishizawa, T., Pandithurai, G., Soni, V. K., Thana, B., Tugjsurn, N.-U., Aoki, K., Go, S., Hashimoto, M., Higurashi, A., Kazadzis, S., Khatri, P., Kouremeti, N., Kudo, R., Marenco, F., Momoi, M., Ningombam, S. S., Ryder, C. L., Uchiyama, A., and Yamazaki, A.: An overview of and issues with sky radiometer technology and SKYNET, Atmos. Meas. Tech., 13, 4195–4218, https://doi.org/10.5194/amt-13-4195-2020, 2020. a
Oppenheimer, C. and Kyle, P. R.: Probing the magma plumbing of Erebus volcano, Antarctica, by open-path FTIR spectroscopy of gas emissions, J. Volcanol. Geoth. Res., 177, 743–754, https://doi.org/10.1016/j.jvolgeores.2007.08.022, 2008. a
Oppenheimer, C., Burton, M. R., Durieux, J., and Pyle, D. M.: Open-path Fourier transform spectroscopy of gas emissions from Oldoinyo Lengai volcano, Tanzania, Opt. Laser Eng., 37, 203–214, 2002. a
Oppenheimer, C., Scaillet, B., Woods, A., Sutton, A. J., Elias, T., and Moussallam, Y.: Influence of eruptive style on volcanic gas emission chemistry and temperature, Nat. Geosci., 11, 678–681, 2018. a
Paton-Walsh, C., Jones, N. B., Wilson, S. R., Haverd, V., Meier, A., Griffith, D. W. T., and Rinsland, C. P.: Measurements of trace gas emissions from Australian forest fires and correlations with coincident measurements of aerosol optical depth, J. Geophys. Res.-Atmos., 110, D24305, https://doi.org/10.1029/2005JD006202, 2005. a, b
Paton-Walsh, C., Emmons, L. K., and Wilson, S. R.: Estimated total emissions of trace gases from the Canberra Wildfires of 2003: a new method using satellite measurements of aerosol optical depth & the MOZART chemical transport model, Atmos. Chem. Phys., 10, 5739–5748, https://doi.org/10.5194/acp-10-5739-2010, 2010. a
Prospero, J. M. and Mayol-Bracero, O. L.: Understanding the Transport and Impact of African Dust on the Caribbean Basin, B. Am. Meteorol. Soc., 94, 1329–1337, https://doi.org/10.1175/BAMS-D-12-00142.1, 2013. a
Rémy, S., Bellouin, N., Benedetti, A., and Boucher, O.: Aerosols, in: State of the Climate in 2017, B. Am. Meteorol. Soc., 99, https://doi.org/10.1175/2018bamsstateoftheclimate.1, 2018. a
Rodríguez, S., Alastuey, A., Alonso-Pérez, S., Querol, X., Cuevas, E., Abreu-Afonso, J., Viana, M., Pérez, N., Pandolfi, M., and de la Rosa, J.: Transport of desert dust mixed with North African industrial pollutants in the subtropical Saharan Air Layer, Atmos. Chem. Phys., 11, 6663–6685, https://doi.org/10.5194/acp-11-6663-2011, 2011. a, b
Ryder, C. L., Highwood, E. J., Walser, A., Seibert, P., Philipp, A., and Weinzierl, B.: Coarse and giant particles are ubiquitous in Saharan dust export regions and are radiatively significant over the Sahara, Atmos. Chem. Phys., 19, 15353–15376, https://doi.org/10.5194/acp-19-15353-2019, 2019. a, b
Schmid, B., Spyak, P. R., Biggar, S. F., Wehrli, C., Sekler, J., Ingold, T., Mätzler, C., and Kämpfer, N.: Evaluation of the applicability of solar and lamp radiometric calibrations of aprecision sun photometer operating between 300 and 1025 nm, Appl. Optics, 37, 3923–3941, https://doi.org/10.1364/AO.37.003923, 1998. a
Schmid, B., Michalsky, J. J., Slater, D. W., Barnard, J. C., Halthore, R. N., Liljegren, J. C., Holben, B. N., Eck, T. F., Livingston, J. M., Russell, P. B., Ingold, T., and Slutsker, I.: Comparison of columnar water-vapor measurements from solar transmittance methods, Appl. Optics, 40, 1886–1896, https://doi.org/10.1364/AO.40.001886, 2001. a
Schneider, M., Blumenstock, T., Chipperfield, M. P., Hase, F., Kouker, W., Reddmann, T., Ruhnke, R., Cuevas, E., and Fischer, H.: Subtropical trace gas profiles determined by ground-based FTIR spectroscopy at Izaña (28∘ N, 16∘ W): Five-year record, error analysis, and comparison with 3-D CTMs, Atmos. Chem. Phys., 5, 153–167, https://doi.org/10.5194/acp-5-153-2005, 2005. a
Sha, M. K., De Mazière, M., Notholt, J., Blumenstock, T., Chen, H., Dehn, A., Griffith, D. W. T., Hase, F., Heikkinen, P., Hermans, C., Hoffmann, A., Huebner, M., Jones, N., Kivi, R., Langerock, B., Petri, C., Scolas, F., Tu, Q., and Weidmann, D.: Intercomparison of low- and high-resolution infrared spectrometers for ground-based solar remote sensing measurements of total column concentrations of CO2, CH4, and CO, Atmos. Meas. Tech., 13, 4791–4839, https://doi.org/10.5194/amt-13-4791-2020, 2020. a, b, c
Shaw, G. E.: Solar spectral irradiance and atmospheric transmission at Mauna Loa Observatory, Appl. Optics, 21, 2006–2011, https://doi.org/10.1364/AO.21.002006, 1982. a, b
Shaw, G. E.: Sun Photometry, B. Am. Meteorol. Soc., 64, 4–10, https://doi.org/10.1175/1520-0477(1983)064<0004:SP>2.0.CO;2, 1983. a, b
Sicard, M., Córdoba-Jabonero, C., Barreto, A., Welton, E. J., Gil-Díaz, C., Carvajal-Pérez, C. V., Comerón, A., García, O., García, R., López-Cayuela, M.-A., Muñoz-Porcar, C., Prats, N., Ramos, R., Rodríguez-Gómez, A., Toledano, C., and Torres, C.: Volcanic Eruption of Cumbre Vieja, La Palma, Spain: A First Insight to the Particulate Matter Injected in the Troposphere, Remote Sens.-Basel, 14, 2470, https://doi.org/10.3390/rs14102470, 2022. a
Smirnov, A., Holben, B., Lyapustin, A., Slutsker, I., and Eck, T.: AERONET processing algorithms refinement, in: AERONET Workshop, 10–14 May 2004, El Arenosillo, Spain, 10–14, 2004. a, b, c
Smirnov, A., Holben, B. N., Kaufman, Y. J., Dubovik, O., Eck, T. F., Slutsker, I., Pietras, C., and Halthore, R. N.: Optical Properties of Atmospheric Aerosol in Maritime Environments, J. Atmos. Sci., 59, 501–523, https://doi.org/10.1175/1520-0469(2002)059<0501:OPOAAI>2.0.CO;2, 2002. a
Stremme, W., Grutter, M., Baylón, J., Taquet, N., Bezanilla, A., Plaza-Medina, E., Schiavo, B., Rivera Cárdenas, C., Blumenstock, T., and Hase, F.: Direct solar FTIR measurements of CO2 and HCl in the plume of Popocatepetl Volcano, Mexico, Front. Earth Sci., 11, 1022976, https://doi.org/10.3389/feart.2023.1022976, 2023. a
Toledano, C., González, R., Fuertes, D., Cuevas, E., Eck, T. F., Kazadzis, S., Kouremeti, N., Gröbner, J., Goloub, P., Blarel, L., Román, R., Barreto, Á., Berjón, A., Holben, B. N., and Cachorro, V. E.: Assessment of Sun photometer Langley calibration at the high-elevation sites Mauna Loa and Izaña, Atmos. Chem. Phys., 18, 14555–14567, https://doi.org/10.5194/acp-18-14555-2018, 2018. a, b, c, d
Toledano, C., Torres, B., Velasco-Merino, C., Althausen, D., Groß, S., Wiegner, M., Weinzierl, B., Gasteiger, J., Ansmann, A., González, R., Mateos, D., Farrel, D., Müller, T., Haarig, M., and Cachorro, V. E.: Sun photometer retrievals of Saharan dust properties over Barbados during SALTRACE, Atmos. Chem. Phys., 19, 14571–14583, https://doi.org/10.5194/acp-19-14571-2019, 2019. a
Torres, B., Toledano, C., Berjón, A., Fuertes, D., Molina, V., Gonzalez, R., Canini, M., Cachorro, V. E., Goloub, P., Podvin, T., Blarel, L., Dubovik, O., Bennouna, Y., and de Frutos, A. M.: Measurements on pointing error and field of view of Cimel-318 Sun photometers in the scope of AERONET, Atmos. Meas. Tech., 6, 2207–2220, https://doi.org/10.5194/amt-6-2207-2013, 2013. a
Torres, B., Dubovik, O., Fuertes, D., Schuster, G., Cachorro, V. E., Lapyonok, T., Goloub, P., Blarel, L., Barreto, A., Mallet, M., Toledano, C., and Tanré, D.: Advanced characterisation of aerosol size properties from measurements of spectral optical depth using the GRASP algorithm, Atmos. Meas. Tech., 10, 3743–3781, https://doi.org/10.5194/amt-10-3743-2017, 2017. a
Tu, Q., Hase, F., Schneider, M., García, O., Blumenstock, T., Borsdorff, T., Frey, M., Khosrawi, F., Lorente, A., Alberti, C., Bustos, J. J., Butz, A., Carreño, V., Cuevas, E., Curcoll, R., Diekmann, C. J., Dubravica, D., Ertl, B., Estruch, C., León-Luis, S. F., Marrero, C., Morgui, J.-A., Ramos, R., Scharun, C., Schneider, C., Sepúlveda, E., Toledano, C., and Torres, C.: Quantification of CH4 emissions from waste disposal sites near the city of Madrid using ground- and space-based observations of COCCON, TROPOMI and IASI, Atmos. Chem. Phys., 22, 295–317, https://doi.org/10.5194/acp-22-295-2022, 2022. a
Vasileva, A., Moiseenko, K., Skorokhod, A., Belikov, I., Kopeikin, V., and Lavrova, O.: Emission ratios of trace gases and particles for Siberian forest fires on the basis of mobile ground observations, Atmos. Chem. Phys., 17, 12303–12325, https://doi.org/10.5194/acp-17-12303-2017, 2017. a
Wardell, L. J., Kyle, P. R., and Chaffin, C.: Carbon dioxide and carbon monoxide emission rates from an alkaline intra-plate volcano: Mt. Erebus, Antarctica, J. Volcanol. Geoth., 131, 109–121, 2004. a
WMO: WMO/GAW Experts Workshop on a Global Surface-Based Network for Long Term Observations of Column Aerosol Optical Properties, Tech. Rep., GAW Report No. 162, WMO, Davos, Switzerland, TD No. 1287, 2005. a
WMO: Report on the WMO-BIPM workshop on Measurement Challenges for Global Observation Systems for Climate Change Monitoring: Traceability, Stability and Uncertainty, Tech. Rep. IOM-Report No. 105, WMO, Geneva, Switzerland, TD-No. 1557, 2010. a
WMO: Commission for Instruments and Methods of Observation. Sixteenth session, Tech. Rep. WMO No. 1138, https://library.wmo.int/doc_num.php?explnum_id=5576 (last access: 16 July 2023), 2014. a
WMO: WMO Global Atmosphere Watch (GAW) Implementation Plan: 2016-2023, Tech. Rep., GAW Report No. 228, WMO, Geneva, Switzerland, 2017. a
Wong, C. K., Pongetti, T. J., Oda, T., Rao, P., Gurney, K. R., Newman, S., Duren, R. M., Miller, C. E., Yung, Y. L., and Sander, S. P.: Monthly trends of methane emissions in Los Angeles from 2011 to 2015 inferred by CLARS-FTS observations, Atmos. Chem. Phys., 16, 13121–13130, https://doi.org/10.5194/acp-16-13121-2016, 2016. a
Yokelson, R. J., Karl, T., Artaxo, P., Blake, D. R., Christian, T. J., Griffith, D. W. T., Guenther, A., and Hao, W. M.: The Tropical Forest and Fire Emissions Experiment: overview and airborne fire emission factor measurements, Atmos. Chem. Phys., 7, 5175–5196, https://doi.org/10.5194/acp-7-5175-2007, 2007. a