the Creative Commons Attribution 4.0 License.
the Creative Commons Attribution 4.0 License.
 | 07 Nov 2023
Impact analysis of processing strategies for long-term GPS zenith tropospheric delay (ZTD)
Jingna Bai
Yidong Lou
Weixing Zhang
Yaozong Zhou
Zhenyi Zhang
Chuang Shi
Jingnan Liu
Homogenized atmospheric water vapour data are an important prerequisite for climate analysis. Compared with other techniques, GPS has an inherent homogeneity advantage, but it still requires reprocessing and homogenization to eliminate impacts of applied strategy and observation environmental changes where a selection of proper processing strategies is critical. This paper comprehensively investigates the influence of the mapping function, the elevation cut-off angle and homogenization on long-term reprocessing results, in particular for zenith tropospheric delay (ZTD) products, using GPS observations at 44 IGS (International GNSS Service) stations during 1995 to 2014. In the analysis, for the first time, we included the mapping function (the latest Vienna mapping function, VMF3) and exploited homogenized radiosonde data as a reference for ZTD trend evaluations. Our analysis shows that both site position and ZTD solutions achieved the best accuracy when using VMF3 and the 3∘ elevation cut-off angle. Regarding the long-term ZTD trends, homogenization reduced the trend inconsistency among different elevation cut-off angles. ZTD trend results show that the impact of mapping functions is very small, with a maximum difference of 0.19 mm yr−1. On the other hand, the discrepancy can reach 0.60 mm yr−1 using different elevation cut-off angles. Low-elevation cut-off angles (3∘ or 7∘) are suggested for the best estimates of ZTD reprocessing time series when compared to homogenized radiosonde data or ERA5 reference time series.
- Article
(1250 KB) - Full-text XML
- BibTeX
- EndNote


As the most dominant greenhouse gas, water vapour plays a vital role in the global energy and hydrologic cycle (Kiehl and Trenberth, 1997). According to the Clausius–Clapeyron equation, an increase of 1 K in atmospheric temperature will cause an increase of about 7 % in water content if the relative humidity is assumed to remain constant, which in turn will further speed up the warming significantly (Trenberth et al., 2003). A strong positive feedback associated with increased water vapour significantly affects the Earth's climate (IPCC, 2023). Monitoring variations of atmospheric water vapour is thus important not only for detecting the climate change, but also for a better understanding of a water vapour feedback on the global warming.
In recent years, many studies have been conducted to analyse climatic trends in water vapour time series from radiosonde data, reanalysis data, and Global Positioning System (GPS) data. Radiosonde observations provide the longest water vapour records which have been used to quantify long-term trends (e.g. Ross and Elliott, 2001; Wang et al., 2003; Rowe et al., 2008; Wang et al., 2013; Zhang et al., 2017). However, due to changes in station location, instrument, or operation procedures, radiosonde data suffer from an inhomogeneity issue, which leads to ambiguities in long-term trends of water vapour (Dee et al., 2011). Reanalysis data can provide water vapour data with a global coverage, a higher spatial integrity and a complete record (Lu et al., 2015). However, the inhomogeneity issue in radiosonde humidity data was generally not fixed before being assimilated into reanalysis products (Dee et al., 2011), leading to spurious signals in long-term water vapour trends (Bengtsson et al., 2004; Trenberth et al., 2005; Qian et al., 2006; Dai et al., 2011). On the other hand, ground-based GPS can provide high-precision, real-time and continuous water vapour distribution information at low cost and is almost not affected by weather conditions. GPS water vapour is therefore identified as one of the reference data (priority 1) for the Global Climate Observing System (GCOS) Reference Upper-Air Network (GRUAN) (Seidel et al., 2009). Since the early 1990s, GPS has accumulated nearly 30 years of data, but GPS observations have not been assimilated into reanalyses yet, making GPS data an ideal independent observational dataset that can be used for climate change analyses.
Although GPS has an inherent advantage in homogeneity, updates of GPS data processing models and strategies as well as changes in observing environment can still bring inhomogeneities into the resulting time series. Therefore, to get reliable GPS products for climate research, two procedures are indispensable, namely (1) reprocessing of GPS data using a consistent strategy, such as EPN-repro1 (Völksen, 2011) and EPN-repro2 (Pacione et al., 2017; Dousa et al., 2017), and the three reprocessing campaigns at IGS (International GNSS Service; repro 1, 2 and 3) (Steigenberger et al., 2006; Rebischung et al., 2016; Rebischung, 2021), and (2) homogenization of GPS products for eliminating impacts of changes in observing environment.
Many studies have been performed to study the impact of different strategies on data processing results; in particular, the mapping function and the elevation cut-off angle are two factors that were investigated frequently. For example, Vey et al. (2006) and Steigenberger et al. (2009) found that using different mapping functions result in differences in ZTD estimates. Thomas et al. (2011) confirmed that these differences could be translated into precipitable water vapour (PWV). However, these studies used data for a short period only. For long-term studies, Ning and Elgered (2012) analysed an influence of eight elevation cut-off angle settings on PWV trends when using 14 years of data at 12 GPS stations in Sweden and Finland. They found that correlations between trends of GPS PWV and radiosonde PWV were the highest when the 25∘ elevation cut-off angle was used, while the root mean square (rms) values of PWV errors were the lowest at 10 and 15∘ elevation cut-off angles. Baldysz et al. (2018) reprocessed 20 years of data at 20 European stations using eight different strategies. The Precise Point Positioning (PPP) method, the Global Pressure and Temperature 2 (GPT2) mapping function and a high-elevation cut-off angle were recommended for GPS PWV linear trend estimates.
However, a main deficit in current studies is the utilization of raw radiosonde data or reanalysis products as reference time series, hence introducing additional inhomogeneities to the evaluation of long-term products and making conclusions questionable. Dai et al. (2011) proposed a new method for homogenizing radiosonde humidity parameters and generating a new homogeneous radiosonde dataset (referred to as Dai dataset hereafter). The Dai dataset has achieved a better homogeneity and a better agreement with GPS long-term trends (Zhao et al., 2015). In this study, we will thus use the Dai dataset as a reference to investigate impacts of different mapping functions and elevation cut-off angles on the long-term GPS tropospheric product. Considering the fact that most GPS stations do not have collocated meteorological measurements for converting ZTD into PWV, and the use of other resources such as nearby meteorological stations or numerical weather model (NWM) will introduce additional errors to the PWV, this work will pay attention to the ZTD as derived from GPS data processing rather than to the PWV. This is reasonable because the main purpose of this work is to study the impact of data processing strategies on a long-term solution. The latest Vienna mapping function, the VMF3 (Landskron and Böhm, 2018), will be included in this kind of analysis for the first time. In addition, the latest global reanalysis, the ERA5, the successor of the widely used ERA-Interim (referred to as ERAI hereafter), will be compared and taken as a reference in the homogenization of reprocessing ZTD time series using a modified penalized maximal t test method (PMTred) (Wang, 2008).
The paper is organized as follows: the datasets, including GPS data, radiosonde data, and reanalysis data (ERA5), and the method to estimate ZTD trends are described in Sect. 2. Section 3 will focus on analysing the accuracy of estimated coordinates and ZTDs. The method for detecting change points is introduced in Sect. 4 together with assessing impacts of the mapping function and the elevation cut-off angle settings on estimated ZTD trends. The last section concludes our findings.
2.1 GPS data
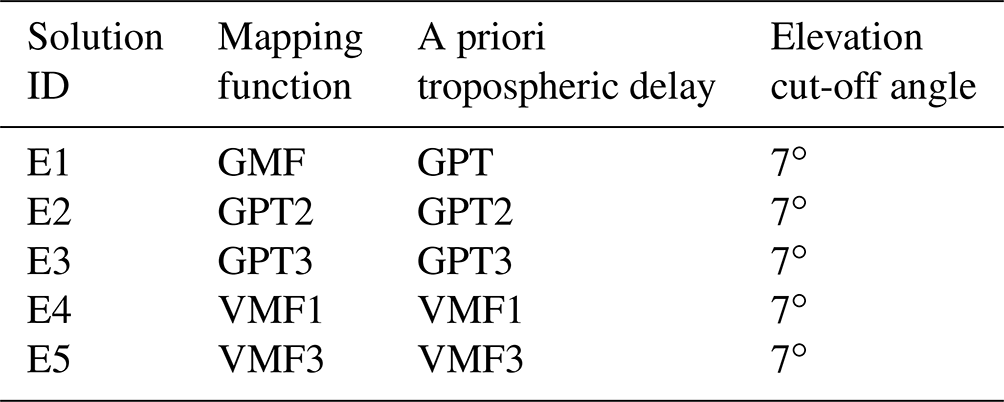
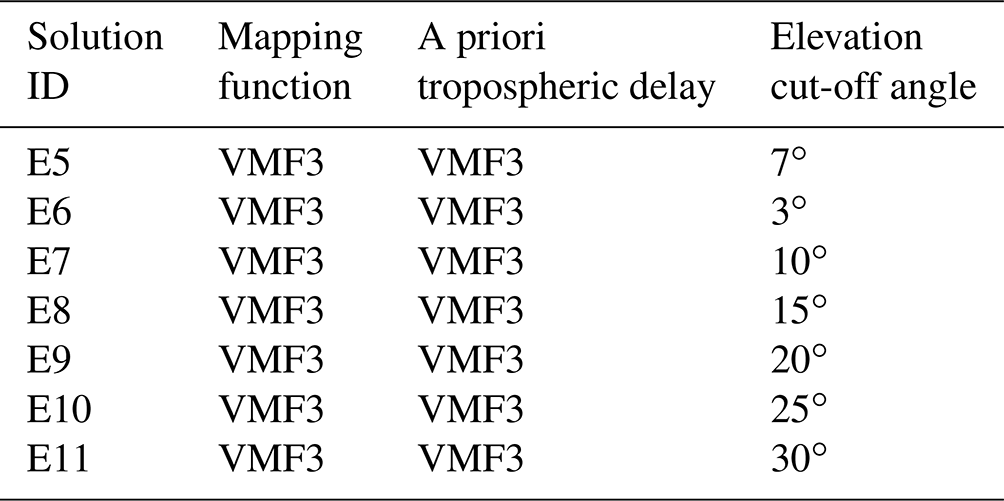
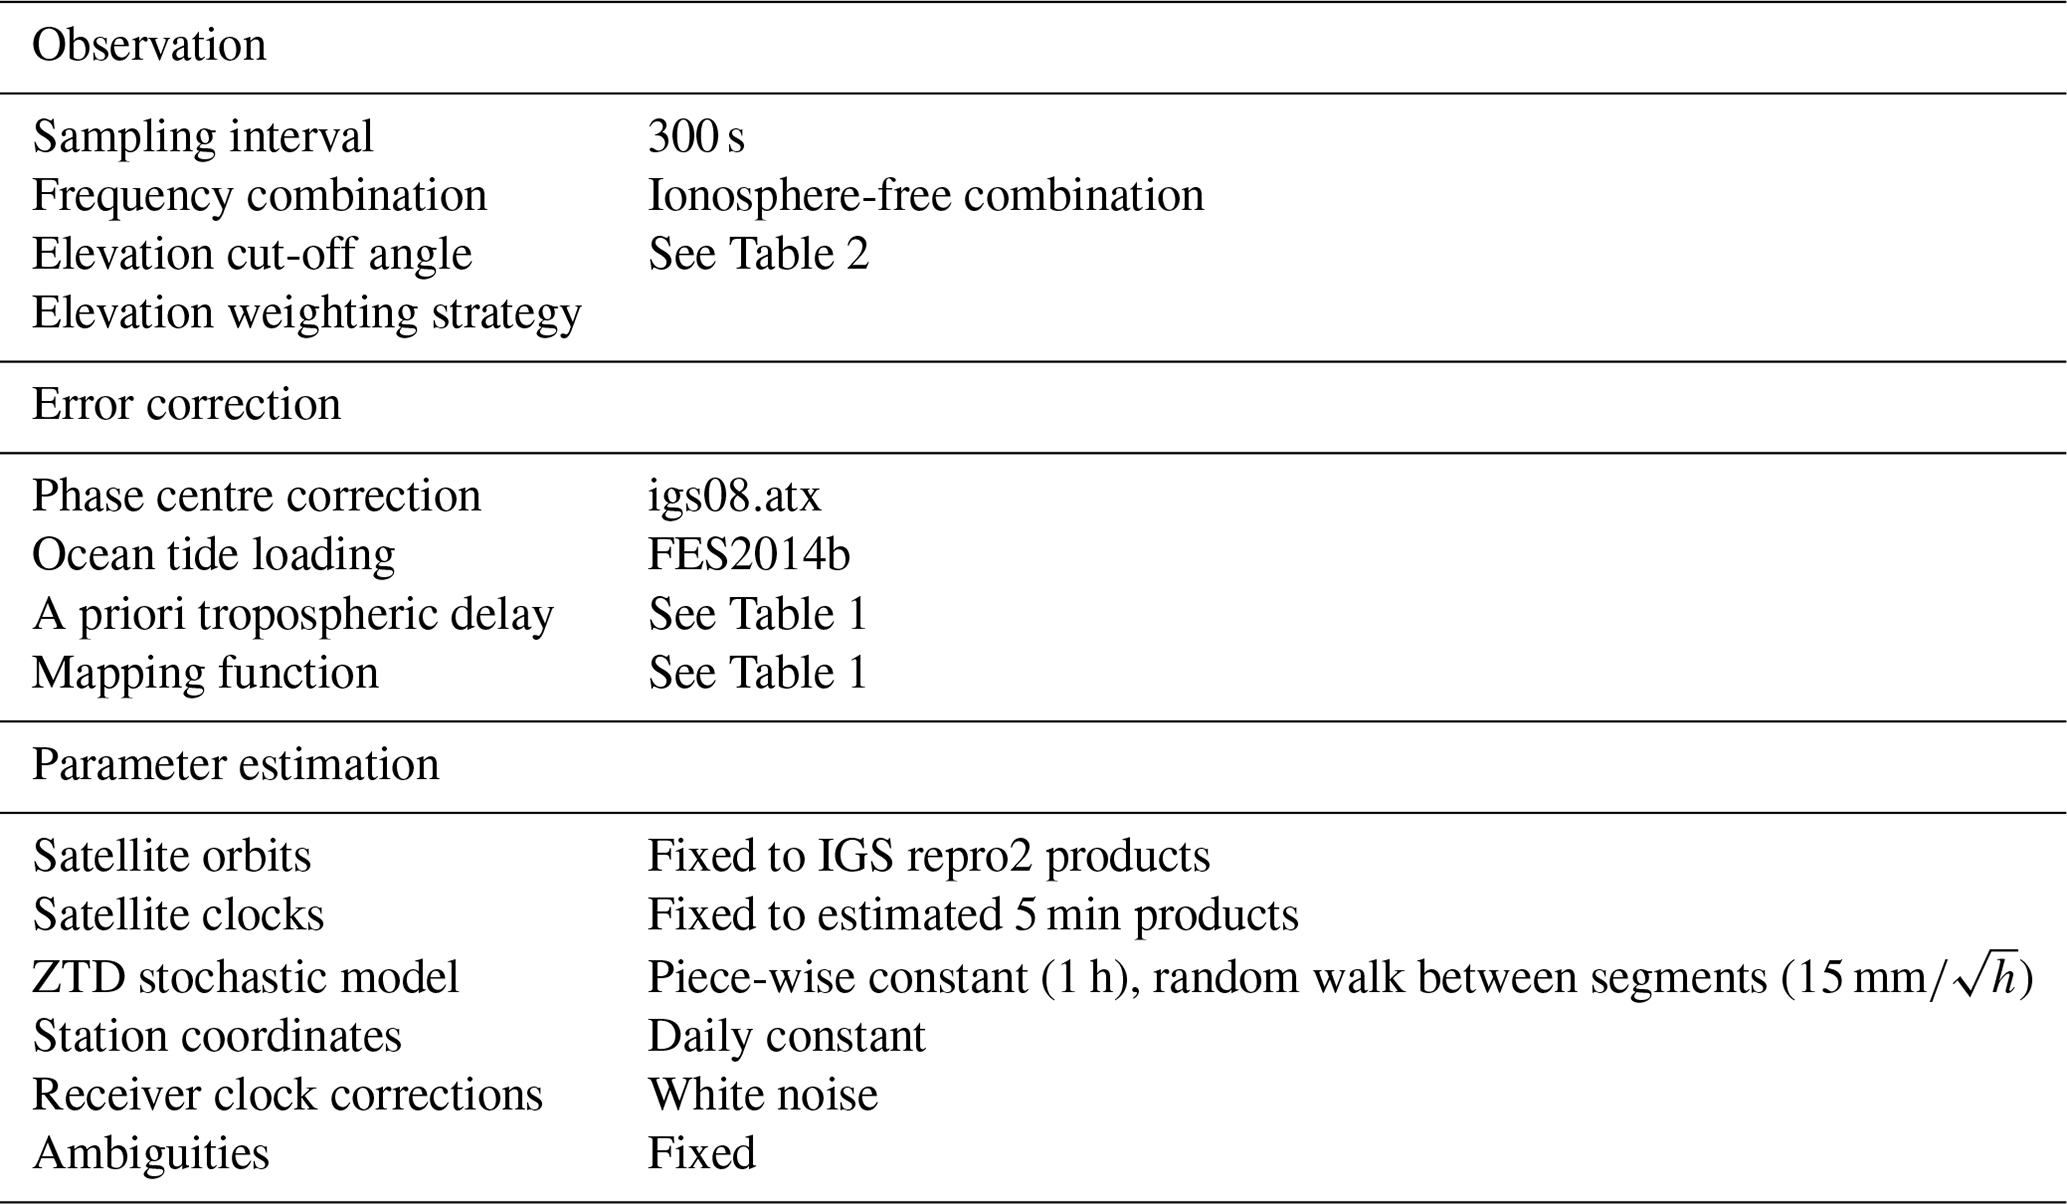
Altogether, 44 permanent stations of the IGS network, as displayed in Fig. 1, covering the period from 1995 to 2014, were selected in this study, considering two factors: (1) first GPS observations before 1999 and (2) collocated radiosonde stations within 100 km in the horizontal and 150 m in the vertical. The GPS observations in 300 s intervals were reprocessed on a daily basis using the Position And Navigation Data Analyst (PANDA) software package (Shi et al., 2008) developed at Wuhan University. Precise orbits from the second IGS reprocessing campaign in the IGb08 reference frame were used (Rebischung et al., 2012). Griffiths (2019) argued that the IGS repro2 precise clock products are not ideal, suggesting that users either exploit double differences of observations or an explicit clock estimation fully consistent with the orbits. In this study, the satellite clocks were therefore estimated first by fixing IGS repro2 orbits, and then the ZTD and station positions were estimated in the PPP mode using the IGS repro2 orbits and the estimated clocks. Altogether, 11 experiments, summarized in Tables 1 and 2, were designed for studying the impacts of mapping functions and elevation cut-off angles on reprocessing results. The E5 (experiment 5) solution is used both in the mapping-function comparison and in the elevation cut-off angle comparison. The details of the GPS data processing strategy are given in Table 3.
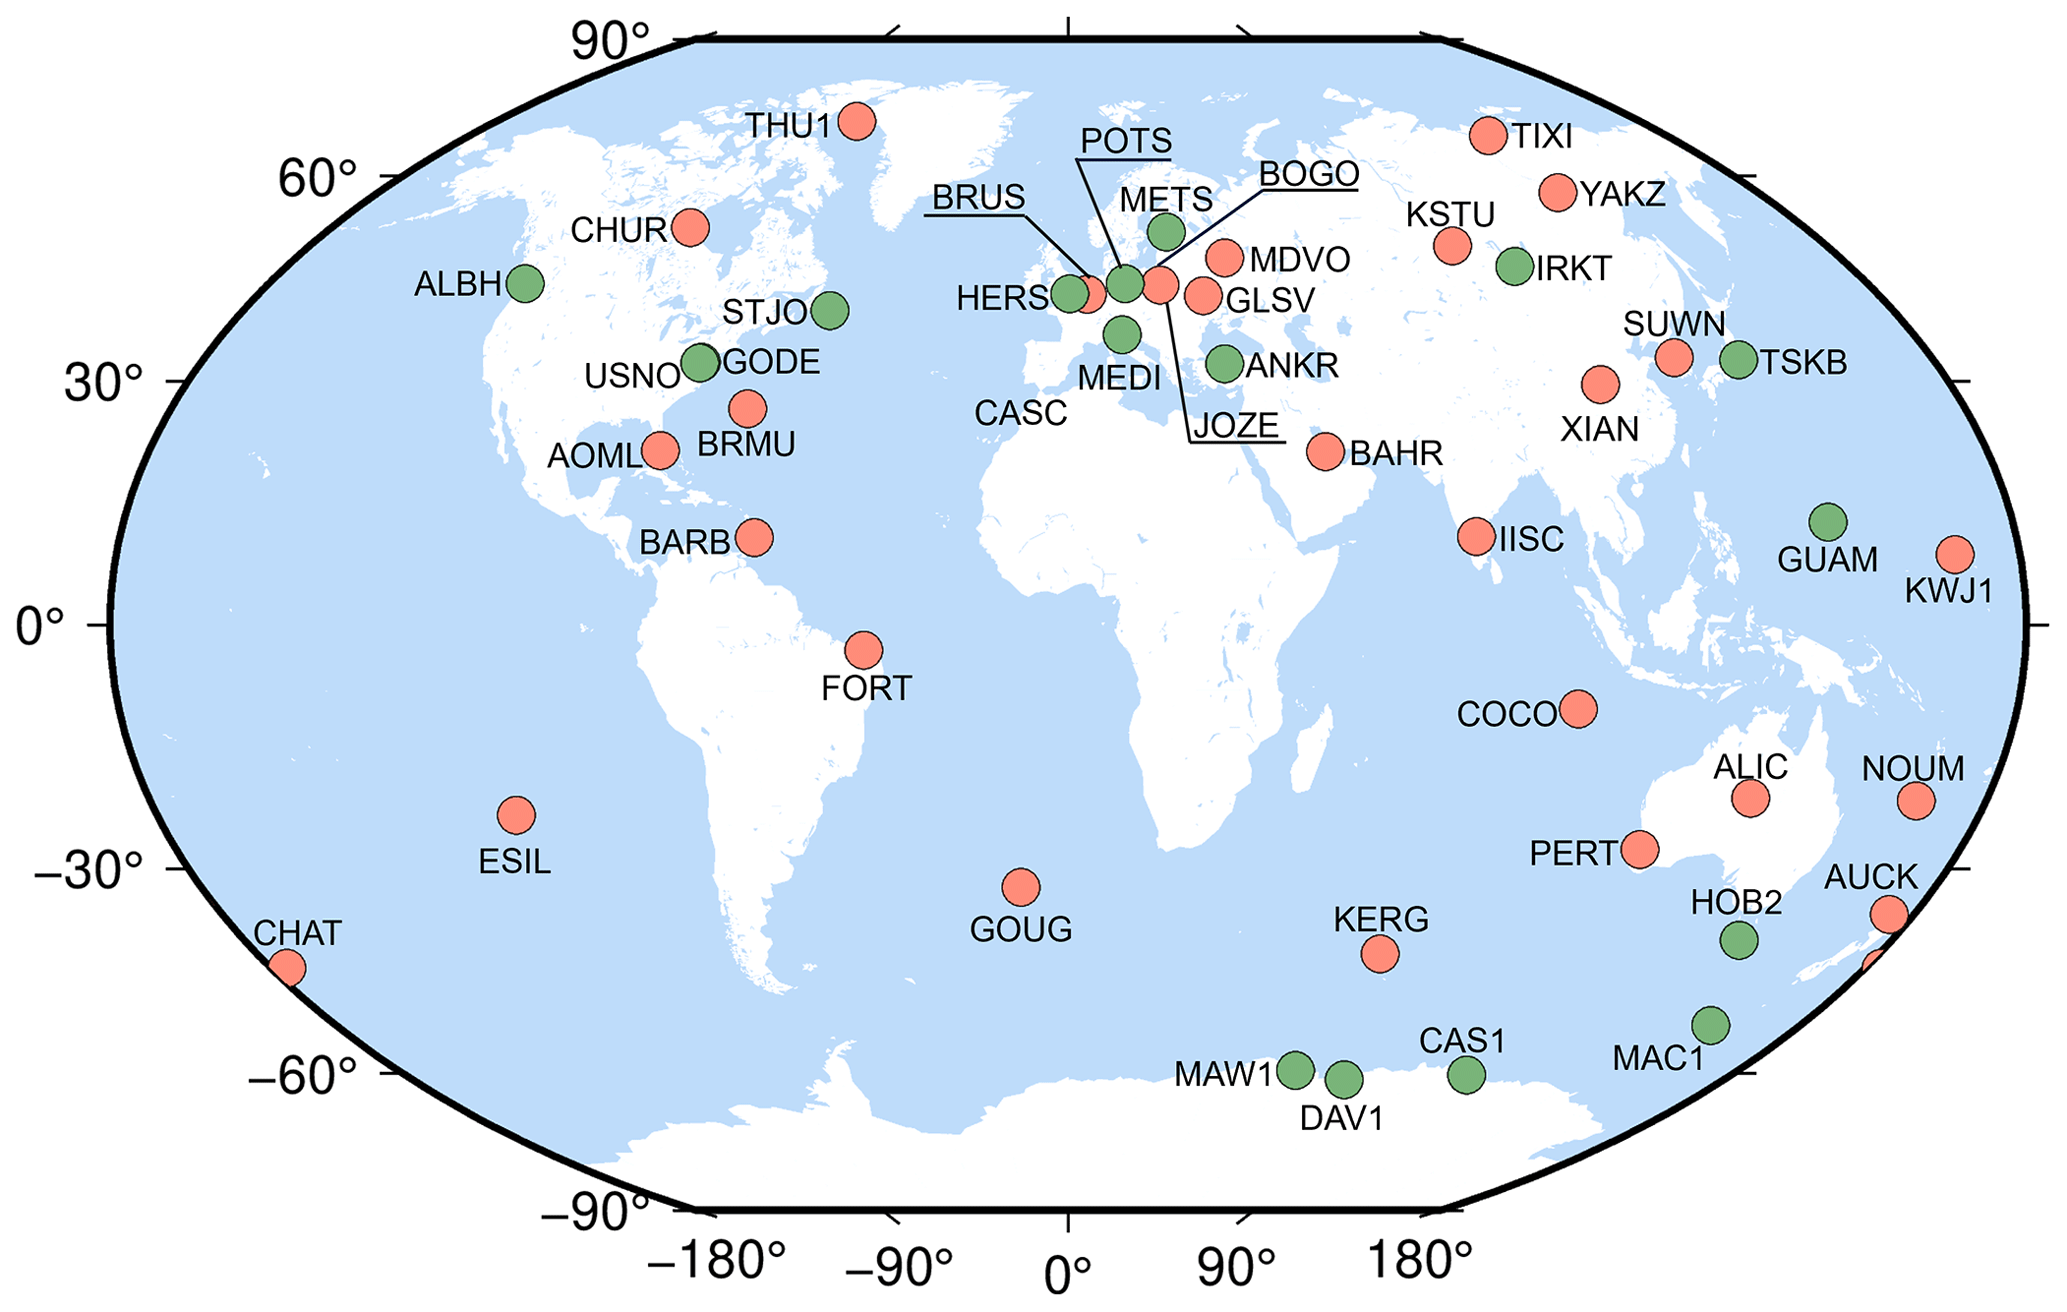
Figure 1Geographical distribution of the selected IGS stations. The stations marked in green are used for ZTD trend analysis.
2.2 Reanalysis data
The ERA5 is the latest atmospheric reanalysis from the European Centre for Medium-Range Weather Forecasts (ECMWF) (Hersbach et al., 2019). It provides a higher resolution and a better performance compared to the ERAI. We will compare GPS ZTDs with ERA5 ZTDs and use the ERA5 ZTD products as a reference to detect change points in the GPS ZTD time series. The method described in Haase et al. (2003) was used for calculating ZTD from ERA5. The method for spatial interpolation from ERA5 grids to GPS station was the same as the method described by Zhang et al. (2017).
2.3 Radiosonde data
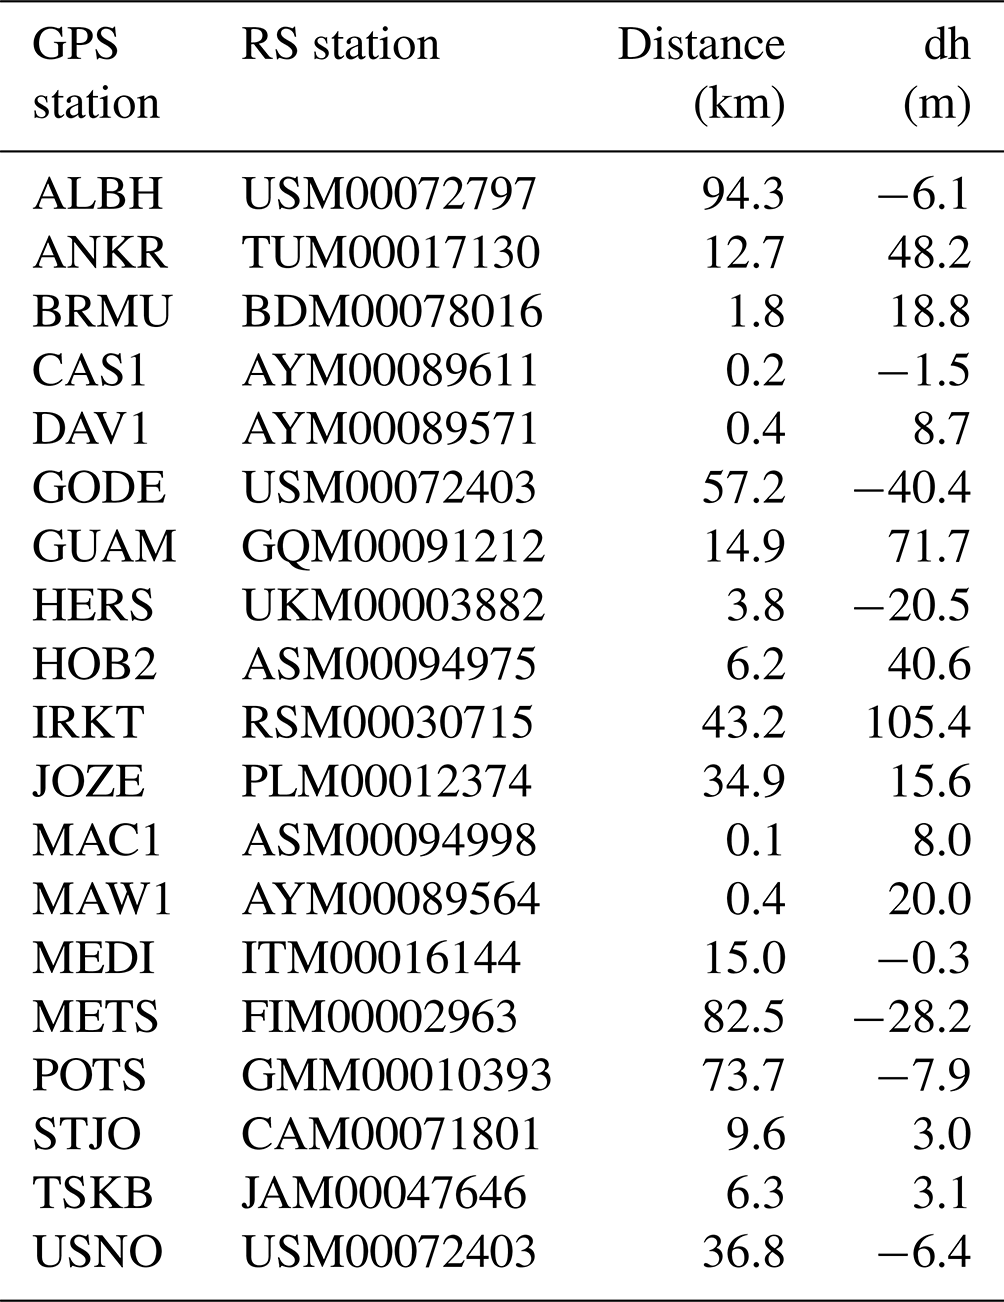
Altogether, 19 radiosonde sites collocated with IGS stations were selected in this study, and the distances between GPS and radiosonde (RS) stations are presented in Table 4. Dai et al. (2011) detected change points first in daily tropospheric dewpoint depression (DPD) time series and then used the most recent segment as a reference to adjust the time series for eliminating discontinuities. Such homogenized time series show generally more realistic long-term trends reported in several previous studies (e.g. Zhao et al., 2012, 2015; Zhang et al., 2019). Therefore, the radiosonde products during 1995 to 2012 homogenized with the method proposed by Dai et al. (2011) were taken as a reference to evaluate the GPS ZTD trends, while the original radiosonde products (referred to as “Raw” hereafter) from 1995 to 2014 were also compared. The method described in Haase et al. (2003) was used for calculating ZTD from radiosonde observation.
Table 4List of GPS and RS stations with approximate distance between them and height differences (dh is the altitude of the GNSS station minus the altitude of the RS station).
2.4 Trend estimation
ZTD linear trends at GPS stations were estimated using ZTD monthly anomaly time series and Sen's nonparametric method (Sen, 1968), which has been recognized as more robust than the least-squares method (Fan and Yao, 2003). The trend is estimated as
where xj and xi are the ZTD monthly anomaly values at time tj and ti (tj>ti). The tj and ti are all possible combinations (tj>ti). The standard error of the estimated trend is calculated as
where n is a count of data points of the time series, xi is a ZTD monthly anomaly at time ti and is the average of all ti. The is estimated from the following equation:
In this section, the impact of reprocessing strategies on the position and ZTD estimates was studied.
3.1 Station position analysis
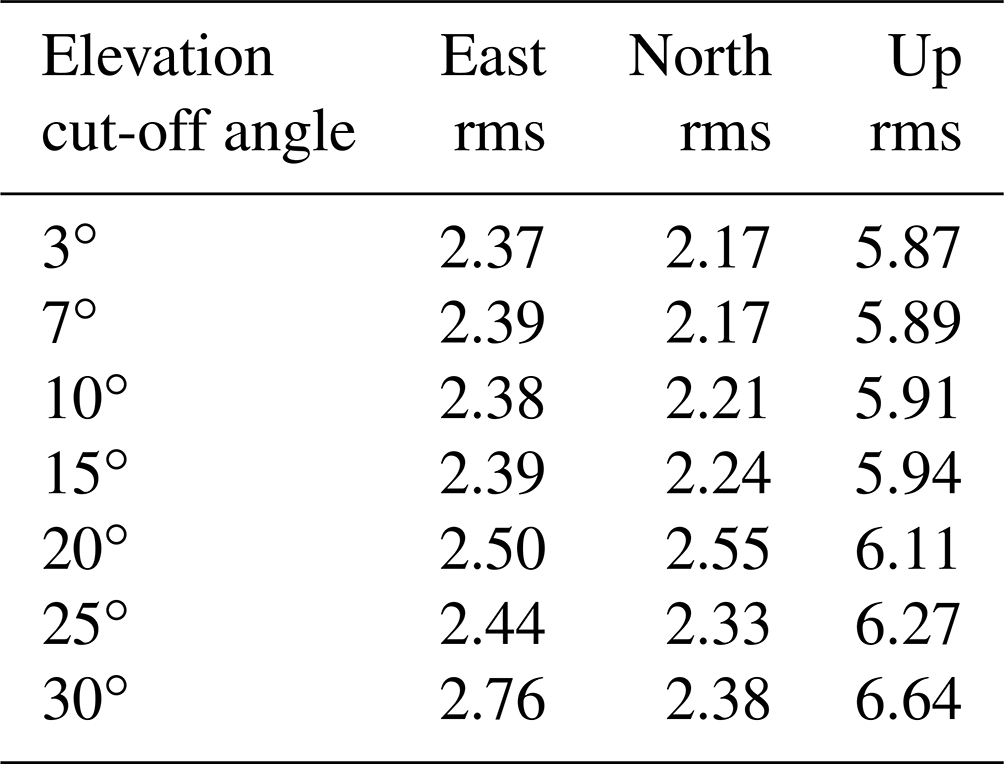
We use coordinate repeatability to assess the quality of the processing strategies applied in GPS data analysis. Tables 5 and 6 summarize the average rms of coordinate repeatability in the east, north and up (vertical) components of all stations. Results in Table 5 demonstrate that different mapping functions have small impact on coordinate repeatability, with maximum difference of 0.02, 0.07 and 0.06 mm in the east, north and up components, respectively, and VMF3 shows slightly better results than other mapping functions. On the other hand, by increasing the elevation cut-off angle from 3 to 30∘, we can observe obvious increases in coordinate repeatability rms, especially in the up component, with an rms of 5.87 mm for a 3∘ cut-off angle and 6.64 mm for 30∘, as shown in Table 6. Based on the statistics, when the product of interest is station position, cut-off angles higher than 15∘ are not recommended in data reprocessing.
Table 5Coordinate repeatability using different mapping functions with an elevation cut-off angle of 7∘ (E1–E5) (unit: mm).
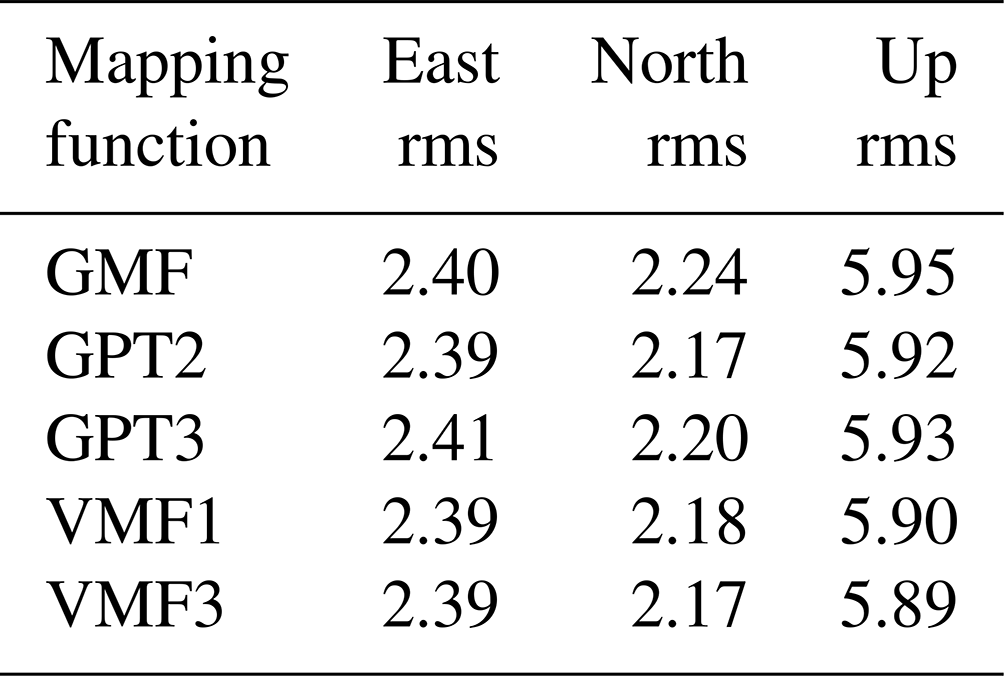
Table 6Coordinate repeatability using different elevation cut-off angles with the mapping function of VMF3 (E5–E11) (unit: mm).
3.2 ZTD error analysis
In addition to the coordinate repeatability, we also assess the ZTD error by taking ERA5-ZTD as reference. We removed the GPS ZTD outliers by checking ZTD differences (GPSERA5) larger than 3 times a standard deviation of the differences before the comparison, with about 5.5 % to 6.3 % of the data removed in different experiments. Tables 7 and 8 present the comparisons using different mapping functions and different elevation cut-off angles, respectively. The bias, standard deviation (SD) and rms are calculated as
where N is the number of the stations. For each station, t is the number of ZTD observations in the time series. ZTDGj and ZTDEj represent the jth GPS and ERA5 ZTD products in the time series, respectively.
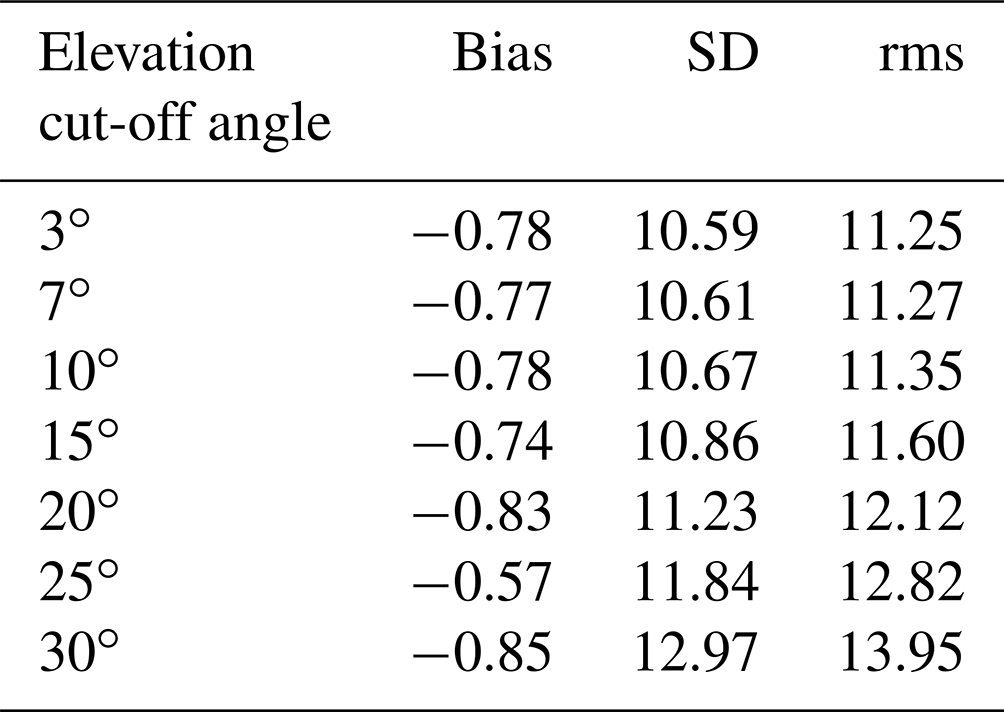
We find a bias of about −0.8 mm in all experiments, indicating a generally larger ZTD from GPS than ERA5. Dousa et al. (2017) and Pacione et al. (2017) found a bias of about −2 mm in the European GPS reprocessing products from 1996 to 2014 when compared with ERAI ZTD. Similar to the coordinate repeatability, there are much smaller impacts from mapping functions than from elevation cut-off angles on the ZTD errors. Using VMF3 slightly reduces the ZTD RMSE from 11.34 mm (using the Global Mapping Function – GMF) to 11.27 mm. As for different elevation cut-off angle settings, using 3∘ results in the best performance, with a ZTD RMSE of 11.25 mm, compared to 13.95 mm using a 30∘ cut-off angle, and the 7∘ cut-off angle setting, which is also commonly used at some analysis centres, has almost the same rms as for the 3∘ setting. Based on statistics, when the product of interest is the ZTD, the cut-off angle 3∘ (or 7∘) and VMF3 mapping function are recommended.
Table 7Bias, SD and rms of ZTD differences between GPS ZTD and ERA5 ZTD for the different mapping functions. The elevation cut-off angle is fixed at 7∘ (E1–E5) (unit: mm).
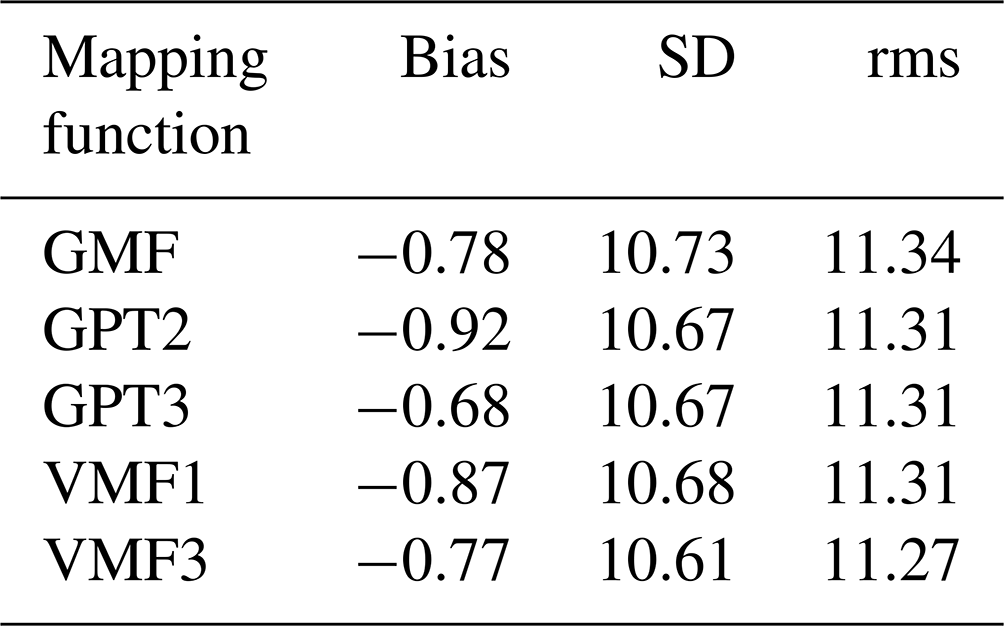
Table 8Bias, SD and rms of ZTD differences between GPS ZTD and ERA5 ZTD for the different elevation cut-off angles. The mapping function is fixed to VMF3. (E5–E11) (unit: mm).
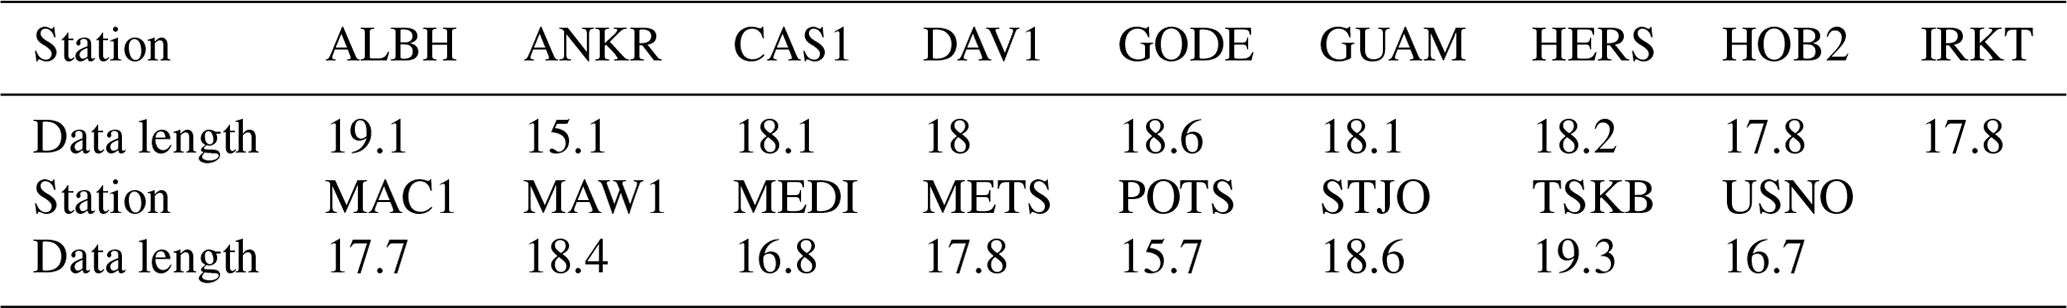
As mentioned above, after the data reprocessing using consistent models and strategies, the ZTD time series need homogenization for long-term trend analysis; namely, change points in GPS ZTD products should be detected and corrected. Impacts of different strategies on long-term trends will be investigated in this section, including the homogenization, mapping function and elevation cut-off angle. After removing the months with less than half of the GPS observations, we selected 17 of the 44 IGS stations with common ZTD time series between GPS and radiosonde longer than 15 years for trend analysis. The data length is summarized in Table 9, where the length of the data is calculated based on the number of the months. To avoid the impact of time period on estimated ZTD trends, we used the same time period (1995–2012) for different data sets (GPS, ERA5, Raw and Dai) when estimating ZTD trends.
Table 9The data completeness of stations selected for ZTD trend analysis (unit: year).
4.1 Change point detection and correction
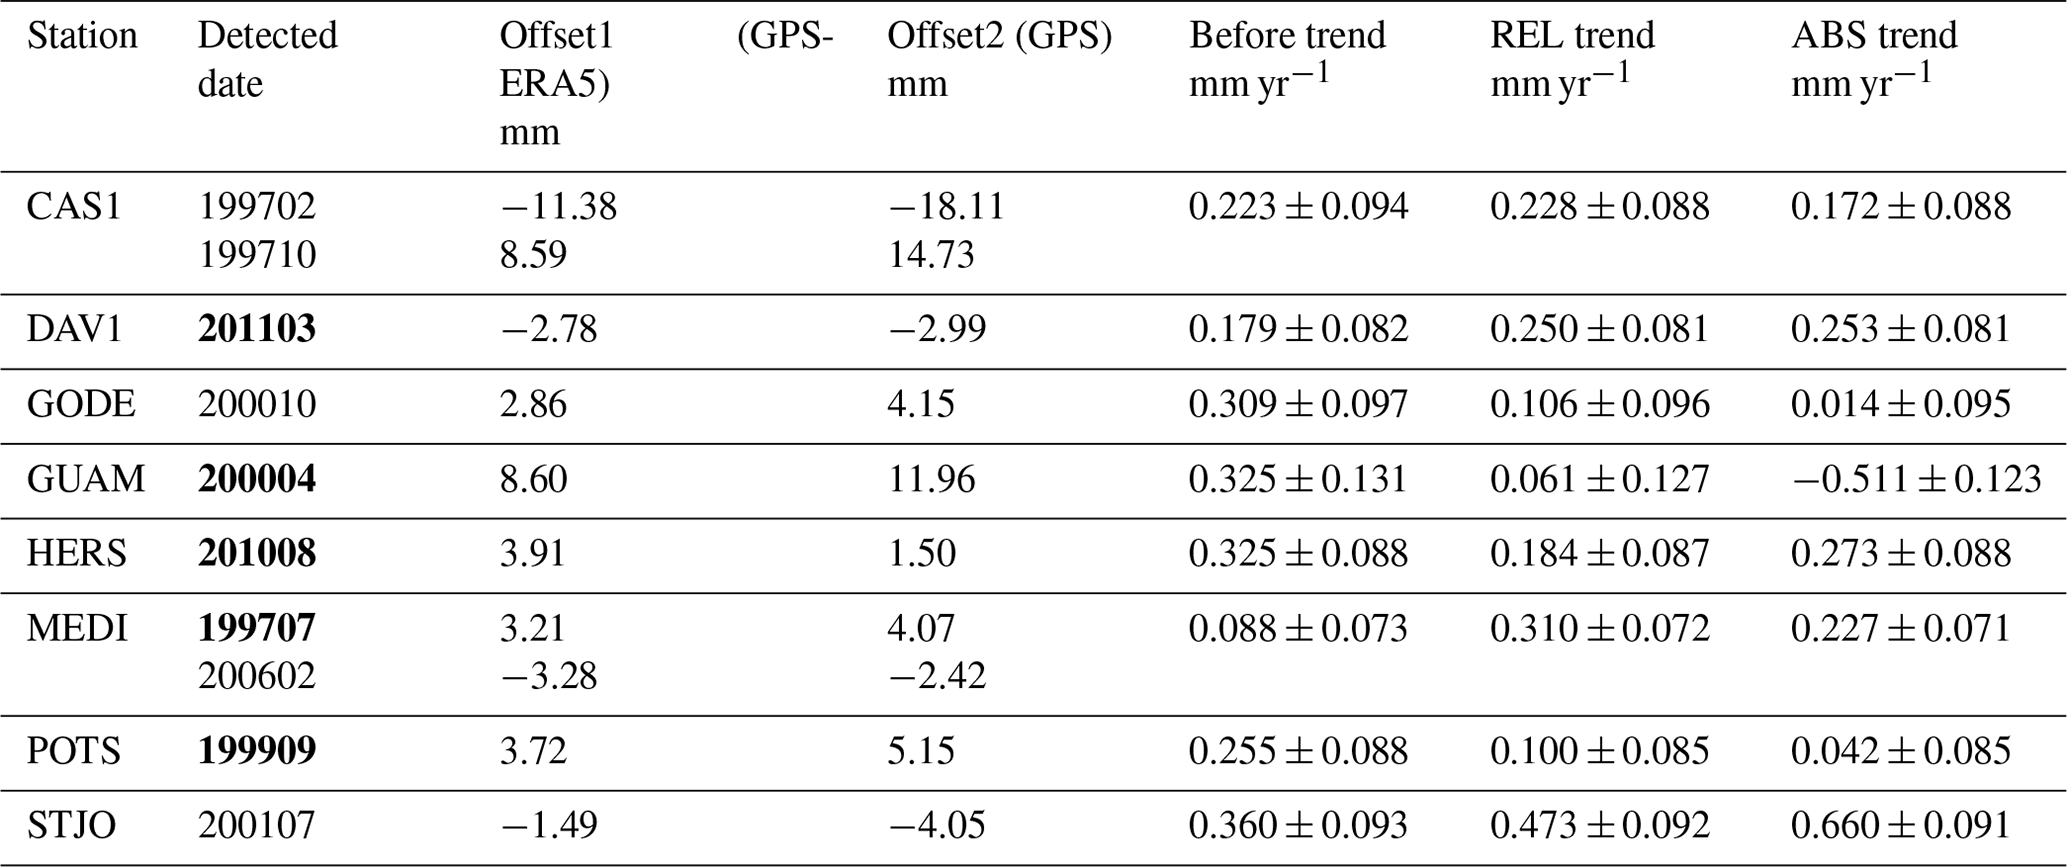
The PMTred method proposed by Wang (2008) which can account for a first-order autoregressive noise in time series was used to detect change points by checking ZTD monthly differences between GPS and ERA5 datasets. More details can be referred to in Ning et al. (2016). For each IGS GPS site, there is a log file that records all site-related changes (i.e. receiver, antenna, radome, etc.). We applied all change points in the station log when using the PMTred method, but some change points were refused. We noticed that different strategies can result in different detected change points. For example, more change points were detected with a higher-elevation cut-off angle setting, which might be due to the reason that higher-elevation cut-off angles could induce larger systematic errors in ZTD time series. As for each change point, the offset can be estimated either from the ZTD difference series between GPS and ERA5 (relative correction, denoted as “REL”) or from the GPS ZTD series itself after de-seasonalization (absolute correction, denoted as “ABS”). We only accept the change points when Offset 1 and Offset 2 have the same sign, namely, both positive or both negative. An example of the detected change points and corresponding estimated offsets using VMF3 and a 7∘ cut-off angle setting is given in Table 10. Table 10 also shows the trends and uncertainties before and after homogenization. It is noted that the homogenization can reduce the uncertainties of trends. The uncertainties are estimated from Eq. (2) in Sect. 2.4.
Table 10Detected change points after applying the PMTred test to the monthly mean ZTD difference time series between the GPS (applying VMF3 and 7∘ settings) and ERA5 data. Bold font means that the change point is documented in the log of the GPS sites.
4.2 Impact of homogenization method
Taking ERA5 products as reference, we analysed the GPS ZTD trend after REL correction and ABS correction; an example of the STJO station is illustrated in Fig. 2. We can clearly find that all GPS ZTD trends after REL correction are close to the ERA5 ZTD trend regardless of processing strategies, while this phenomenon does not occur after ABS correction. Taking the VMF3 and 7∘ setting as an example, the ZTD trend differences between GPS ZTD and ERA5 products at all stations are displayed in Fig. 3. After REL correction, ZTD trend differences at almost all stations are close to zero. We can therefore conclude that the trend after REL correction will be tuned to the trend of the reference product (namely ERA5 in this work). Therefore, in the following sections, only the ZTD time series homogenized by ABS method will be discussed.
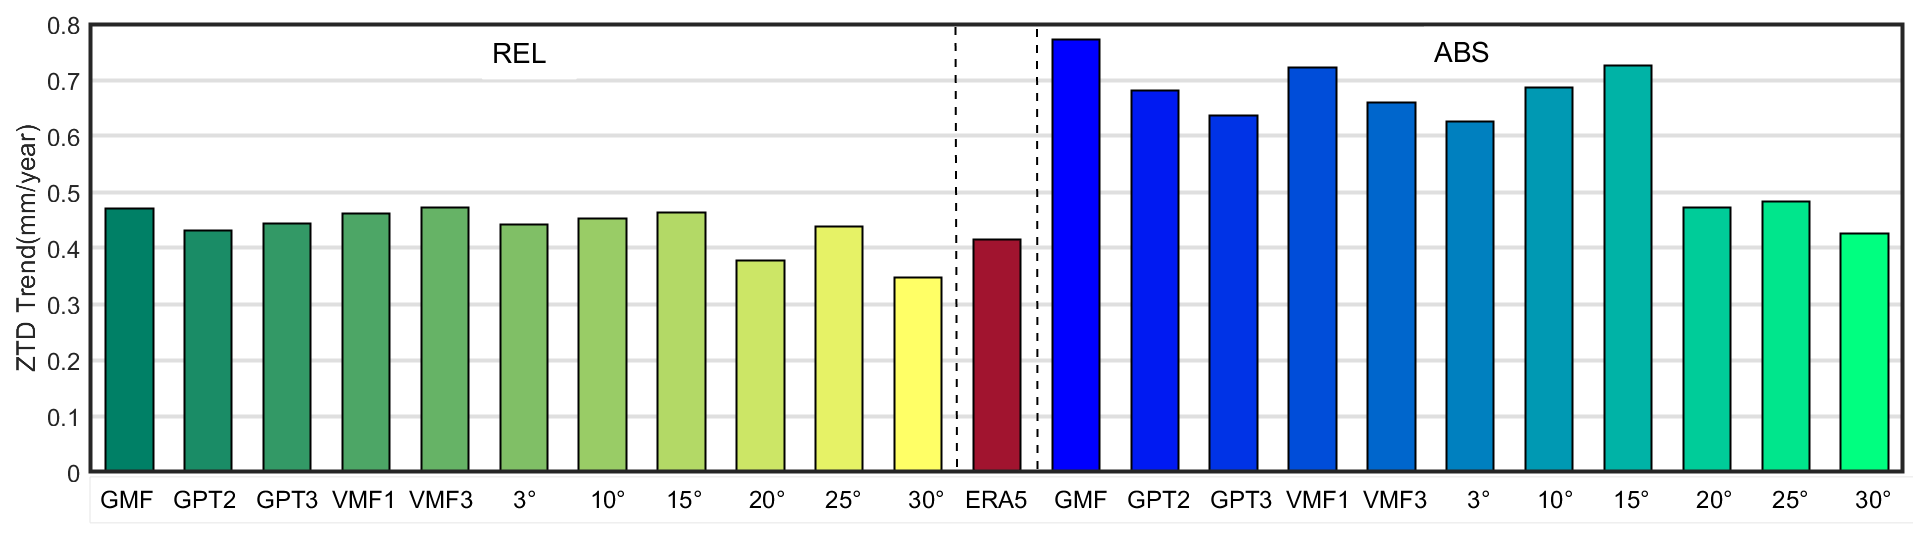
Figure 2ERA5 trend (red bar) and GPS ZTD trend derived from different processing strategies after REL correction (green bars) and ABS correction (blue bars) at the STJO station.
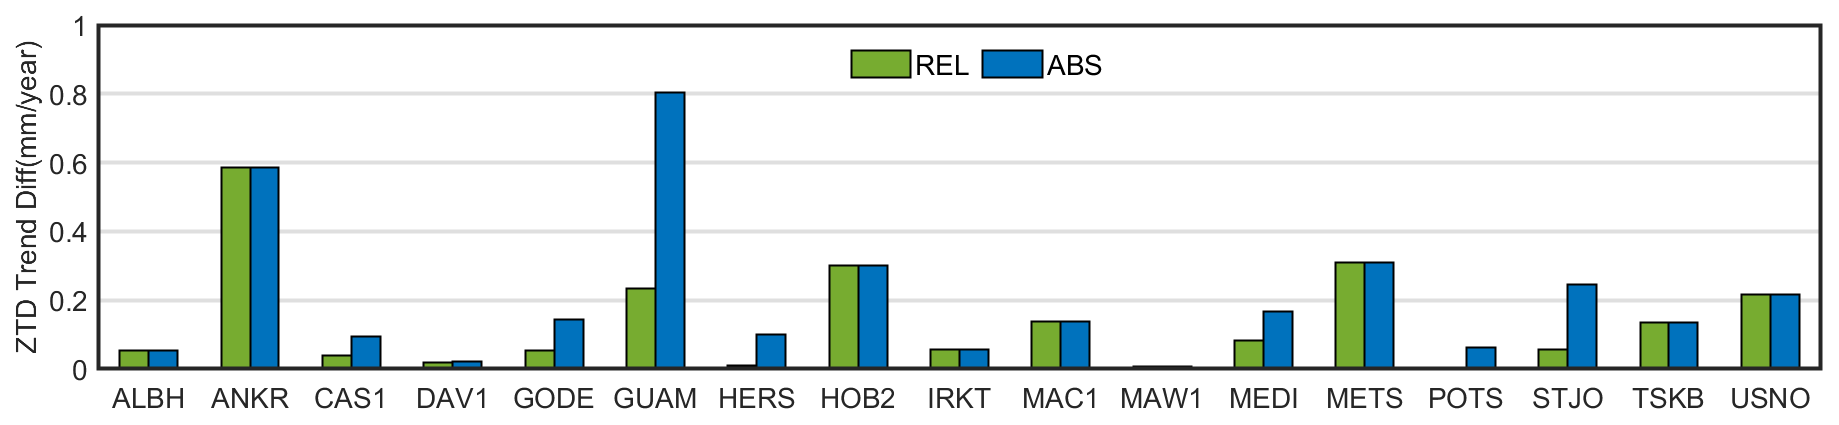
Figure 3ZTD trend differences between GPS ZTD after REL correction (green) and ABS correction (blue) and ERA5 products at all stations.
4.3 Impact of mapping function
ZTD linear trends estimated from GPS products by applying different mapping functions before (green bars) and after ABS (pink bars) correction, together with ZTD trends from ERA5 and Dai radiosonde, are displayed in Fig. 4. Figure 4 also shows the uncertainties (black error bars) of the estimated trends. We find that ZTD trends using different mapping functions before and after homogenization are both close to each other, with differences smaller than 0.19 mm yr−1 at all stations. Baldysz et al. (2018) also concluded that the PWV products estimated using different mapping functions showed negligible differences in the trends from 1996 to 2015. After homogenization, nine stations have positive GPS ZTD trends, one station has a negative trend and the trends of the remaining stations are very small. The trend uncertainties are larger than GPS ZTD trends in ALBH, GODE, HOB2, IRKT, MAC1, MEDI and POTS stations, while ZTD trends of other stations are significant. It is worth noting that the GUAM station has the opposite GPS ZTD trend after homogenization and becomes close to the Dai radiosonde trend. In addition, we can clearly see that very often, the ERA5 ZTD and radiosonde ZTD trends are quite different. However, the ZTD trends estimated from different mapping functions are very consistent.
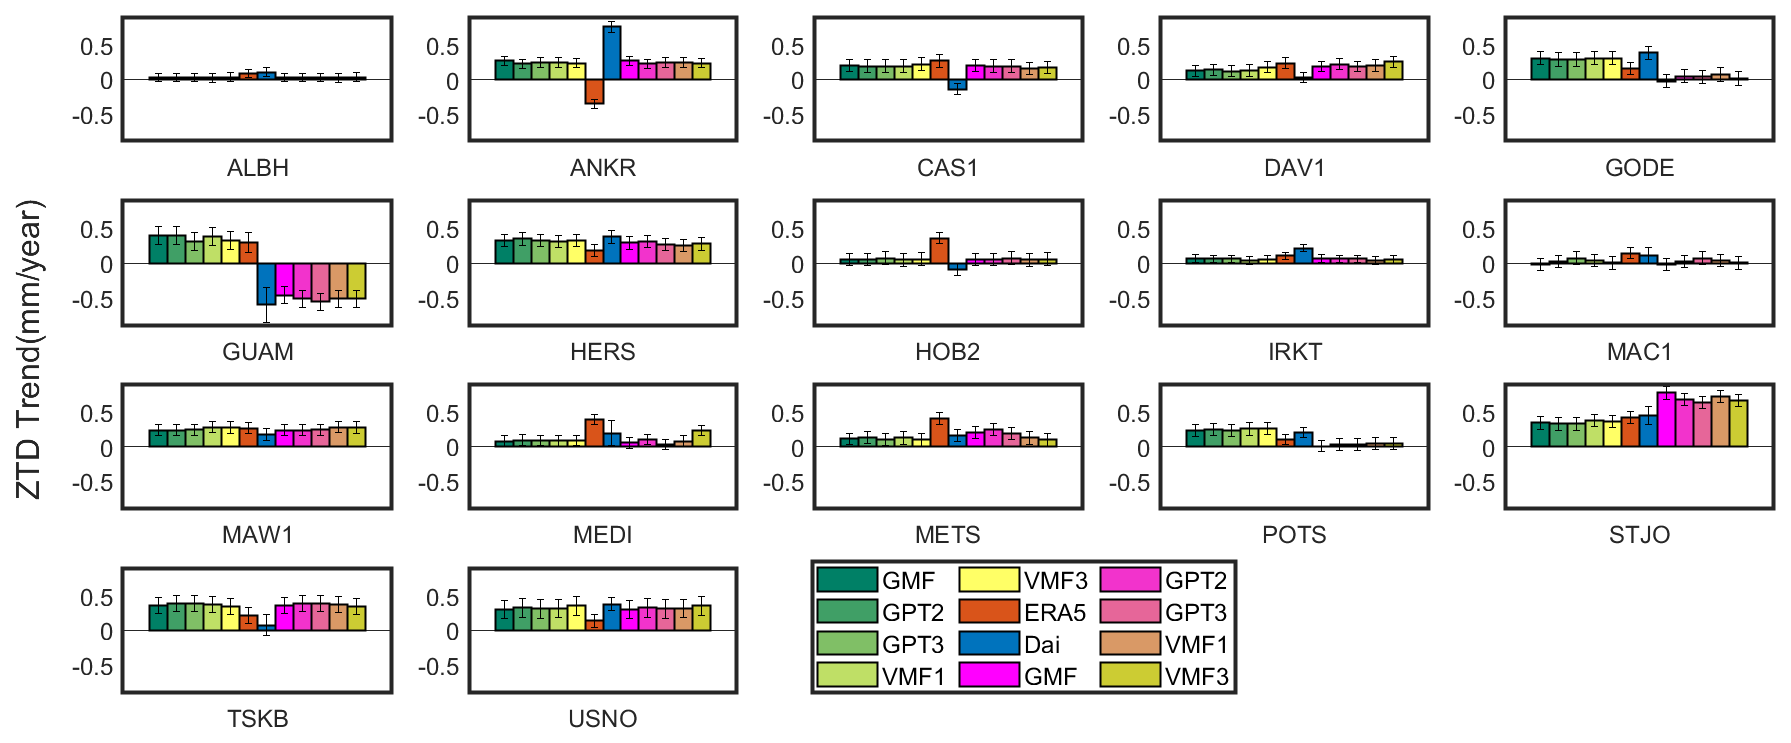
Figure 4ZTD linear trends (mm yr−1) and their uncertainties (black error bars) estimated from GPS products applying different mapping functions before (green bars) and after ABS (pink bars) correction, ERA5 products and Dai radiosonde data.
Taking different data as reference (Dai, Raw and ERA5), Fig. 5 presents the mean value of absolute trend difference for all stations using different mapping function settings. The GPS-derived trends generally agree better with Dai than with Raw data, which is consistent with the findings in Zhang et al. (2019). Different mapping functions show almost the same consistency with references Dai, Raw and ERA5.
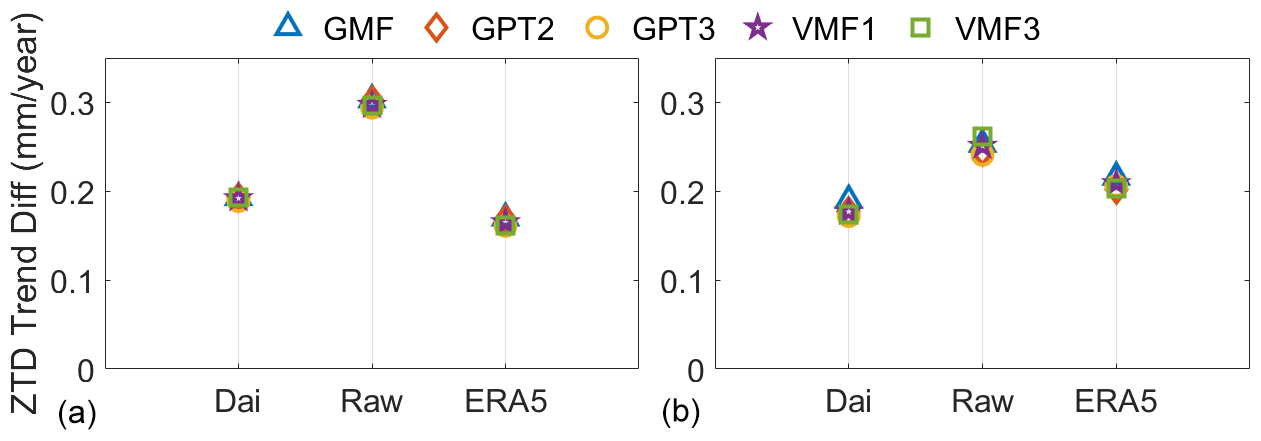
Figure 5Average ZTD trend differences (mm yr−1) for 17 selected stations between GPS (a before homogenization, b after homogenization) and different references (Dai, Raw, ERA5) using different mapping functions (E1–E5).
4.4 Impact of elevation cut-off angle
Similarly, Fig. 6 presents GPS ZTD trends and their uncertainties using different elevation cut-off angle settings before and after homogenization, together with Dai- and ERA5-derived ZTD trends, and statistics of all stations are shown in Fig. 7. It can be noticed that elevation cut-off angles have a much larger impact on ZTD trends than mapping function, reaching 2.07 mm yr−1 at station IRKT between 20 and 30∘ before homogenization. After homogenization, the estimated ZTD trends are close to each other regardless of the elevation cut-off angle, with differences smaller than 0.60 mm yr−1, which illustrates the effectiveness of the homogenization method. This large impact was also reported in previous literature such as Ning and Elgered (2012) and Dousa et al. (2017). By taking Raw-derived ZTD as reference, GPS ZTD trends before homogenization have the best performance using a high-elevation cut-off angle (i.e. 20∘), which agrees with conclusions from Ning and Elgered (2012) and Baldysz et al. (2018). On the other hand, when comparing with Dai- and ERA5-derived results, GPS ZTD trends using low-elevation cut-off angles (< 15∘) show better consistency. As for GPS ZTD time series before homogenization, trends using 30∘ elevation cut-off angle have the largest deviations from all references. After homogenization, the deviations decrease and are close to trends from using other cut-off angles. If taking Dai-derived ZTD trends as reference, the low-elevation cut-off angle settings (3 and 7∘) have smaller trend differences.
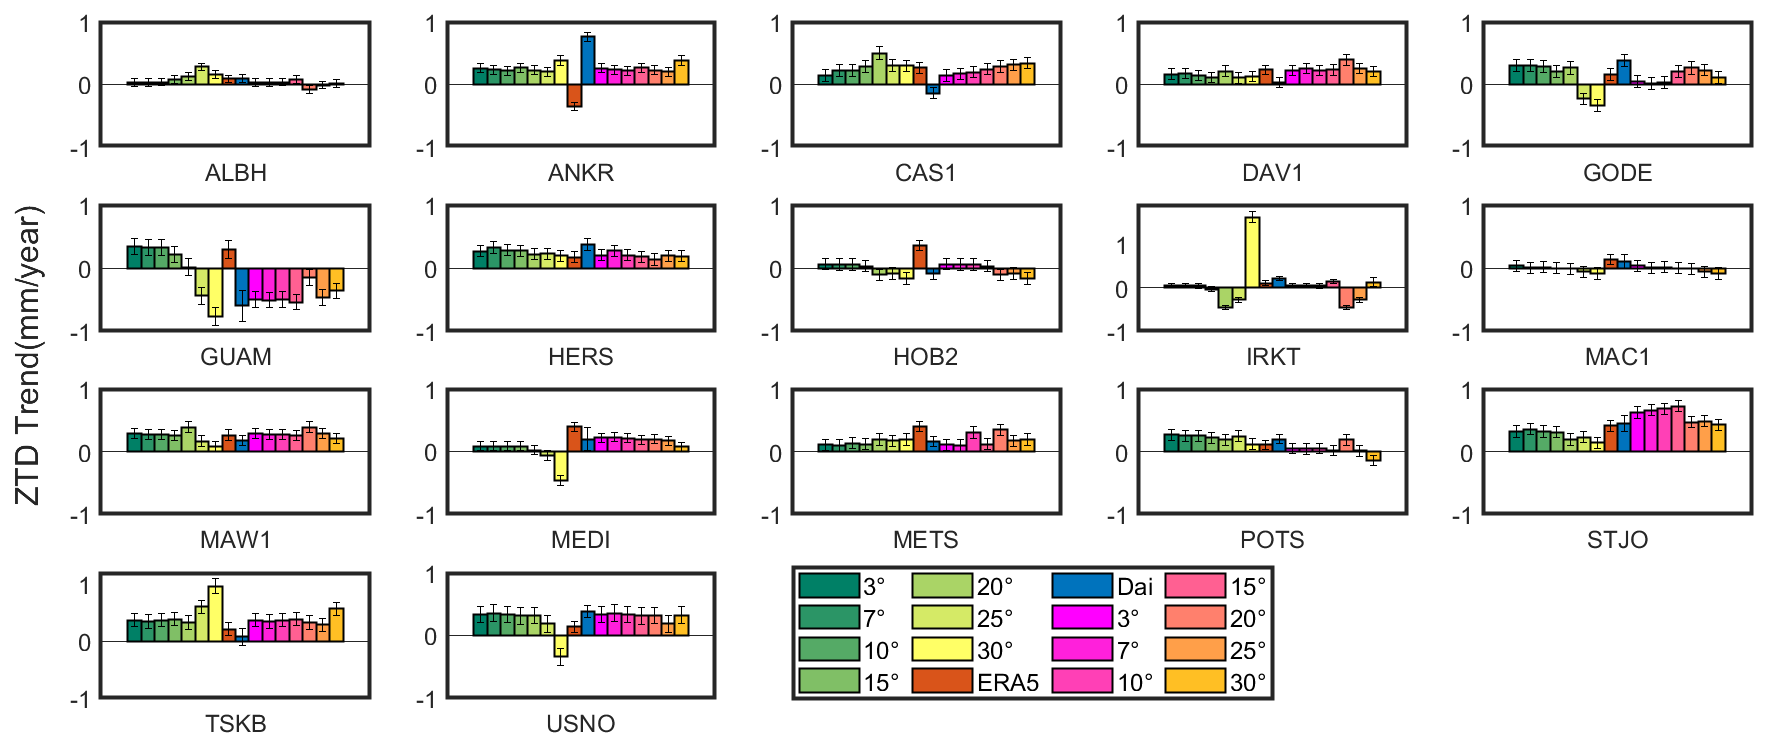
Figure 6ZTD linear trends and their uncertainties (black error bars) estimated from GPS products applying different elevation cut-off angles before (green bars) and after ABS (pink bars) correction, ERA5 products and Dai radiosonde data.
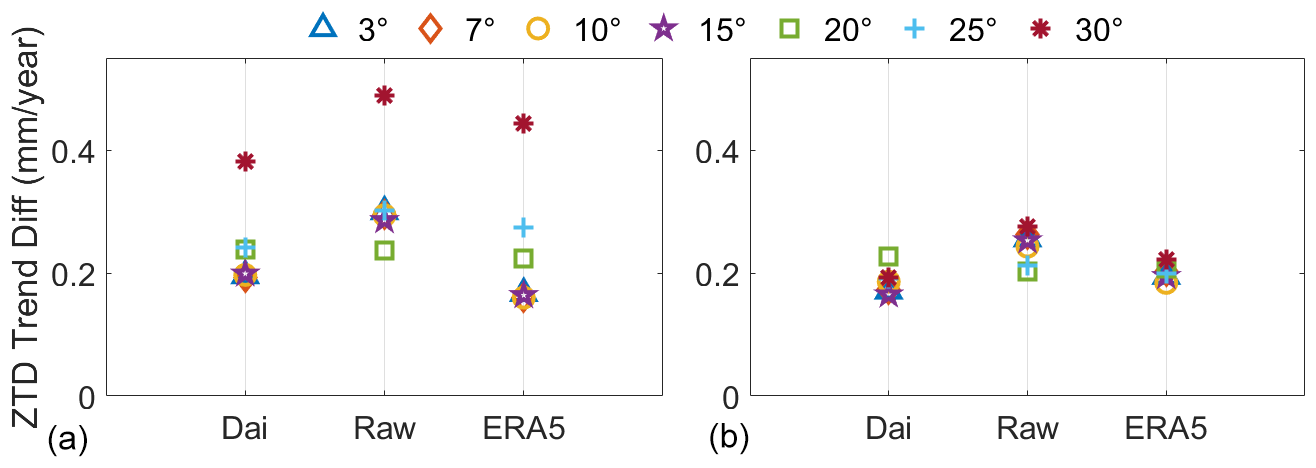
Figure 7Average ZTD trend differences (mm yr−1) for 17 selected stations between GPS (a before homogenization and b after homogenization) and different references (Dai, Raw, ERA5) using different elevation cut-off angle (E5–E11).
Ground-based GPS stations have already accumulated nearly 30 years of observations since 1990s, which can provide great potential for climate analysis. However, long-term homogeneity is a prerequisite for which data reprocessing and homogenization are necessary to eliminate the impact due to changes of data processing strategies and the observation environment. This study aims to comprehensively investigate the impact of some key factors in data processing on long-term ZTD trends, including the mapping function, elevation cut-off angle and homogenization method. By reprocessing GPS data at 44 IGS stations from 1995 to 2014, we firstly evaluated the position repeatability and ZTD error using different mapping functions and elevation cut-off angle settings. Results show that the elevation cut-off angle setting has a much larger impact than the mapping function on the GPS position and ZTD product. Generally, using the VMF3 mapping function gives slightly better solutions than other mapping functions, with a position repeatability rms of 5.89 mm in the up component and a ZTD RMSE of 11.27 mm, compared to 5.95 and 11.34 mm when using GMF, respectively. As for elevation cut-off angles, both the position and ZTD errors increase with cut-off angles, with the best performance achieved using a 3∘ setting, with a position repeatability rms of 2.37, 2.17 and 5.87 mm in the east, north and up component, respectively, and a ZTD RMSE of about 11.25 mm.
We then resorted to the PMTred method to detect and correct change points in ZTD time series using ERA5-derived ZTD as reference. The offset between segments before and after change points can be either estimated using GPSERA5 series (relative method) or using de-seasonalized GPS ZTD itself (absolute method), and we found that the relative method will tune the homogenized ZTD time series to the reference, i.e. ERA5, with almost the same GPS ZTD trends with ERA5 ZTD trends, regardless of the processing strategies used. The impacts of mapping functions, elevation cut-off angles and homogenization on long-term ZTD trends and their uncertainties were then evaluated by comparing with different references, especially, for the first time, including the homogenized radiosonde dataset (Dai) and ERA5. Results show that the homogenization can significantly change the ZTD trends. After homogenization, the estimated trends are almost identical regardless of the elevation cut-off angle. The maximum difference was reduced from 2.07 to 0.60 mm yr−1. Different mapping functions show almost same consistency with references Dai and ERA5. On the other hand, as for using different elevation cut-off angle settings, GPS ZTD trends before homogenization have the best agreement with Raw radiosonde data using a high-elevation cut-off angle (i.e. 20∘), which agrees with conclusions from Ning and Elgered (2012) and Baldysz et al. (2018). However, for other situations, i.e. taking Dai- or ERA5-derived ZTD trends as references for un-homogenized GPS ZTD evaluation, or taking any reference for homogenized GPS ZTD evaluation, low-elevation cut-off angle settings, especially 3∘ or 7∘, show better performance than high angle settings. The homogenization can reduce the uncertainties of the estimated trends. One thing we need to note is that impacts of different factors on the long-term ZTD trends have been discussed in this work, but how large these impacts are compared to the expected trend itself due to climate change is still absent because it is very hard to know climate-induced trends exactly. The main reason is that we have few observing techniques that can get reliable ZTD or water vapour trends due to the inhomogeneity issue. Some studies have argued that the water vapour content should change with the temperature following the Clausius–Clapeyron (CC) equation if the relative humidity is constant (Trenberth et al., 2003). On the other hand, different regions can show quite a different scale of the CC relationship (Lenderink and Van Meijgaard, 2008). It is therefore not easy to answer how significant these impacts are in the light of the expected trends due to climate change.
GPS data are provided by IGS and can be accessed from ftp://gdc.cddis.eosdis.nasa.gov/pub/gps/data/daily/ (International GNSS Service, 2023). The reanalysis data from ERA5 products were released by ECMWF and are available at https://doi.org/10.24381/cds.bd0915c6 (Hersbach et al., 2023). Radiosonde data are archived at https://www.ncei.noaa.gov/data/integrated-global-radiosonde-archive/access/data-por/ (National Climate Data Center, 2023).
YL and WZ proposed the initial ideas. JB and WZ designed and performed the specific experiments with the help and support of YZ and ZZ. JB, WZ and YL were involved in the manuscript writing. CS and JL reviewed this paper and provided suggestions. All authors read and approved the final paper.
The contact author has declared that none of the authors has any competing interests.
Publisher's note: Copernicus Publications remains neutral with regard to jurisdictional claims made in the text, published maps, institutional affiliations, or any other geographical representation in this paper. While Copernicus Publications makes every effort to include appropriate place names, the final responsibility lies with the authors.
The authors would like to thank IGS for providing GPS data, IGRA for providing radiosonde station observations data, Junhong Wang from the University at Albany, State University of New York (SUNY), for providing the homogenized radiosonde dataset and ECMWF for providing ERAI and ERA5 products. The numerical calculations in this paper have been done on the supercomputing system in the Supercomputing Center of Wuhan University.
This research has been supported the National Natural Science Foundation of China (grant no. 42174027), the Fundamental Research Funds for the Central Universities (grant no. 2042022kf1198), the Young Elite Scientist Sponsorship Program by CAST (grant no. YESS20200110), the Knowledge Innovation Program of Wuhan Shuguang (grant no. 2022010801020129).
This paper was edited by Roeland Van Malderen and reviewed by two anonymous referees.
Baldysz, Z., Nykiel, G., Figurski, M., and Araszkiewicz, A.: Assessment of the impact of GNSS processing strategies on the long-term parameters of 20 Years IWV time series, Remote Sens.-Basel, 10, 496, https://doi.org/10.3390/rs10040496, 2018.
Bengtsson, L., Hagemann, S., and Hodges, K. I.: Can climate trends be calculated from reanalysis data, J. Geophys. Res., 109, D1111, https://doi.org/10.1029/2004JD004536, 2004.
Dai, A., Wang, J. W., Thorne, P. W., Parker, D. E., Haimberger, L., and Wang, X. L.: A new approach to homogenize daily radiosonde humidity data, J. Climate, 24, 965–991, https://doi.org/10.1175/2010JCLI3816.1, 2011.
Dee, D. P., Uppala, S. M., Simmons, A. J., Berrisford, P., Poli, P., Kobayashi, S., Andrae, U., Balmaseda, M. A., Balsamo, G., Bauer, P., Bechtold, P., Beljaars, A. C. M., van de Berg, L., Bidlot, J., Bormann, N., Delsol, C., Dragani, R., Fuentes, M., Geer, A. J., Haimberger, L., Healy, S. B., Hersbach, H., Hólm, E. V., Isaksen, L., Kållberg, P., Köhler, A. J., Haimberger, L., Healy, S. B., Hersbach, H., Hólm, E. V., Isaksen, L., Kållberg, P., Köhler, M., Matricardi, M., McNally, A. P., MongeM., Matricardi, M., McNally, A. P., Monge-Sanz, B. M., Morcrette, J., Sanz, B. M., Morcrette, J.-J., Park, B. J., Park, B.-K., Peubey, C., de Rosnay, P., Tavolato, C., Thépaut, J.-N., and Vitart, F.: The ERA-Interim reanalysis: configuration and performance of the data assimilation system, Q. J. Roy. Meteor. Soc.. 137, 553–597, https://doi.org/10.1002/qj.828, 2011.
Dousa, J., Vaclavovic, P., and Elias, M.: Tropospheric products of the second GOP European GNSS reprocessing (1996–2014), Atmos. Meas. Tech., 10, 3589–3607, https://doi.org/10.5194/amt-10-3589-2017, 2017.
Fan, J. Q. and Yao, Q. W.: Nonlinear Time Series: Nonparametric and Parametric Methods, Springer, 553 pp., https://doi.org/10.1007/978-0-387-69395-8, 2003.
Griffiths, J.: Combined orbits and clocks from IGS second reprocessing, J. Geodesy, 93, 177–195, https://doi.org/10.1007/s00190-018-1149-8, 2019.
Haase, J., Ge, M., Vedel, H., and Calais, E.: Accuracy and Variability of GPS Tropospheric Delay Measurements of Water Vapor in the Western Mediterranean, J. Appl. Meteorol., 42, 1547–1568, https://doi.org/10.1175/1520-0450(2003)042<1547:AAVOGT>2.0.CO;2, 2003.
Hersbach, H., Bell, B., Berrisford, P., Horányi, A., Sabater, J. M., Nicolas, J., and Dee, D.: Global reanalysis: goodbye ERA-Interim, hello ERA5, ECMWF Newsletters, 159, 17–24, https://www.ecmwf.int/en/elibrary/81046-global-reanalysis-goodbye-era-interim-hello-era5 (last access: October 2023), 2019.
Hersbach, H., Bell, B., Berrisford, P., Biavati, G., Horányi, A., Muñoz Sabater, J., Nicolas, J., Peubey, C., Radu, R., Rozum, I., Schepers, D., Simmons, A., Soci, C., Dee, D., and Thépaut, J-N.: ERA5 hourly data on pressure levels from 1940 to present, Copernicus Climate Change Service (C3S) Climate Data Store (CDS) [data set], https://doi.org/10.24381/cds.bd0915c6, 2023.
International GNSS Service: GPS data and products archive, International GNSS Service [data set], ftp://gdc.cddis.eosdis.nasa.gov/pub/gps/data/daily/, last access: October 2023.
IPCC: Climate Change 2021, Contribution of Working Group I to the Sixth Assessment Report of the Intergovernmental Panel on Climate Change, edited by: Masson-Delmotte, V., Zhai, P., Pirani, A., Connors, S. L., Péan, C., Berger, S., Caud, N., Chen, Y., Goldfarb, L., Gomis, M. I., Huang, M., Leitzell, K., Lonnoy, E., Matthews, J. B. R., Maycock, T. K., Waterfield, T., Yelekçi, O., Yu, R., and Zhou, B., Cambridge University Press, Cambridge, United Kingdom and New York, NY, USA, 2391 pp., https://doi.org/10.1017/9781009157896, 2023.
Kendall, M. G.: Rank Correlation Methods, Charles Griffin, 202 pp., https://doi.org/10.1007/978-1-4684-6683-6_9, 1975.
Kiehl, J. T. and Trenberth, K. E.: Earth's annual global mean energy budget, B. Am. Meteorol. Soc., 78, 197–208, https://doi.org/10.1175/1520-0477(1997)078<0197:EAGMEB>2.0.CO;2, 1997.
Landskron, D. and Böhm, J.: VMF3/GPT3: refined discrete and empirical troposphere mapping functions, J. Geodesy, 92, 349–360, https://doi.org/10.1007/s00190-017-1066-2, 2018.
Lenderink, G. and van Meijgaard, E.: Increase in hourly precipitation extremes beyond expectations from temperature changes, Nat. Geosci. 1, 511–514, https://doi.org/10.1038/ngeo262, 2008.
Lu, N., Trenberth, K. E., Qin, J., Yang, K., and Yao, L.: Detecting long-term trends in precipitable water over the Tibetan Plateau by synthesis of station and MODIS observations, J. Climate, 28, 1707–1722, https://doi.org/10.1175/JCLI-D-14-00303.1, 2015.
National Climate Data Center: IGRA data, National Climate Data Center [data set], https://www.ncei.noaa.gov/data/integrated-global-radiosonde-archive/access/data-por/, last access: October 2023.
Ning, T. and Elgered, G.: Trends in the atmospheric water vapour content from ground-based GPS: the impact of the elevation cutoff angle, IEEE J-STARS, 5, 744–751, https://doi.org/10.1109/JSTARS.2012.2191392, 2012.
Ning, T., Wickert, J., Deng, Z., Heise, S., Dick, G., Vey, S., and Schöne, T.: Homogenized time series of the atmospheric water vapor content obtained from the GNSS reprocessed data, J. Climate, 29, 2443–2456, https://doi.org/10.1175/JCLI-D-15-0158.1, 2016.
Pacione, R., Araszkiewicz, A., Brockmann, E., and Dousa, J.: EPN-Repro2: A reference GNSS tropospheric data set over Europe, Atmos. Meas. Tech., 10, 1689–1705, https://doi.org/10.5194/amt-10-1689-2017, 2017.
Qian, T., Dai, A., Trenberth, K. E., and Oleson, K. W.: Simulation of global land surface conditions from 1948 to 2002: Part I: Forcing data and evaluations, J. Hydrometeorol., 7, 953–975, https://doi.org/10.1175/JHM540.1, 2006.
Rebischung, P.: Terrestrial frame solutions from the IGS third reprocessing, EGU General Assembly 2021, online, 19–30 Apr 2021, EGU21-2144, https://doi.org/10.5194/egusphere-egu21-2144, 2021.
Rebischung, P., Griffiths, J., Ray, J., Schmid, R., Collilieux, X., and Garayt, B.: IGS08: the IGS realization of ITRF2008, GPS Solut., 16, 483–494, https://doi.org/10.1007/s10291-011-0248-2, 2012.
Rebischung, P., Altamimi, Z., Ray, J., and Garayt, B.: The IGS contribution to ITRF2014, J. Geodesy, 90, 611–630, https://doi.org/10.1007/s00190-016-0897-6, 2016.
Ross, R. J. and Elliott, W. P.: Radiosonde-based Northern Hemisphere tropospheric water vapor trends, J. Climate, 14, 1602–1612, https://doi.org/10.1175/1520-0442(2001)014<1602:RBNHTW>2.0.CO;2, 2001.
Rowe, P. M., Miloshevich, L. M., Turner, D. D., and Walden, V. P.: Dry bias in Vaisala RS90 radiosonde humidity profiles over Antarctica, J. Atmos. Ocean. Tech., 25, 1529–1541, https://doi.org/10.1175/2008JTECHA1009.1, 2008.
Seidel, D., Berger, F., Immler, F., Sommer, M., Vömel, H., Diamond, H., Dykema, J., Goodrich, D., Murray, W., Peterson, T., Sisterson, D., Thorne, P., and Wang, J. J.: Reference upper-air observations for climate: Rationale, progress, and plans, B. Am. Meteorol. Soc., 90, 361–369, https://doi.org/10.1175/2008BAMS2540.1, 2009.
Sen, P. K.: Estimates of the regression coefficient based on Kendall's tau, J. Am. Stat. Assoc., 63, 1379–1389, https://doi.org/10.1080/01621459.1968.10480934, 1968.
Shi, C., Zhao, Q., Geng, J., Lou, Y., Ge, M., and Liu, J.: Recent development of PANDA software in GNSS data processing, in: International Conference on Earth Observation Data Processing and Analysis (ICEODPA), edited by: Li, D., Gong, J., and Wu, H., International Society for Optical Engineering, Wuhan, China, SPIE Proceedings, 7285, 72851S pp., https://doi.org/10.1117/12.816261, 2008.
Steigenberger, P., Rothacher, M., Dietrich, R., Dietrich, R., Fritsche, M., Rülke, A., and Vey, S.: Reprocessing of a global GPS network, J. Geophys. Res.-Sol. Ea., 111, B05402, https://doi.org/10.1029/2005JB003747, 2006.
Steigenberger, P., Boehm, J., and Tesmer, V.: Comparison of GMF/GPT with VMF1/ECMWF and implications for atmospheric loading, J. Geodesy, 83, 943–951, https://doi.org/10.1007/s00190-009-0311-8, 2009.
Thomas, I. D., King, M. A., Clarke, P. J., and Penna, N. T.: Precipitable water vapor estimates from homogeneously reprocessed GPS data: An intertechnique comparison in Antarctica, J. Geophys. Res., 116, D04107, https://doi.org/10.1029/2010JD013889, 2011.
Trenberth, K. E., Dai, A., Rasmussen, R. M., and Parsons, D. B.: The changing character of precipitation, B. Am. Meteorol. Soc., 84, 1205–1217, https://doi.org/10.1175/BAMS-84-9-1205, 2003.
Trenberth, K. E., Fasullo, J., and Smith, L.: Trends and variability in column-integrated water vapour, Clim. Dynam., 24, 741–758, https://doi.org/10.1007/s00382-005-0017-4, 2005.
Vey, S., Dietrich, R., Fritsche, M., Rülke, A., Rothacher, M., and Steigenberger, P.: Influence of mapping function parameters on global GPS network analyses: Comparisons between NMF and IMF, Geophys. Res. Lett., 33, L01814, https://doi.org/10.1029/2005GL024361, 2006.
Völksen, C.: An update on the EPN reprocessing project: Current achievements and status, in: EUREF 2011 symposium, 25–28, https://www.epncb.oma.be/_documentation/papers/eurefsymposium2011/an_update_on_epn_reprocessing_project_current_achievement_and_status (last access: October 2023), 2011.
Wang, J., Carlson, D. J., Parsons, D. B., Hock, T. F., Lauritsen, D., Cole, H. L., Beierle, K., and Chamberlain, E.: Performance of operational radiosonde humidity sensors in direct comparison with a chilled mirror dew-point hygrometer and its climate implication, Geophys. Res. Lett., 30, 1860, https://doi.org/10.1029/2003GL016985, 2003.
Wang, X. L.: Accounting for autocorrelation in detecting mean shifts in climate data series using the penalized maximal t or F test, J. Appl. Meteor. Clim., 47, 2423–2444, https://doi.org/10.1175/2008JAMC1741.1, 2008.
Wang, J., Zhang, L., Dai, A., Immler, F., Sommer, M., and Vömel, H.: Radiation dry bias correction of Vaisala RS92 humidity data and its impacts on historical radiosonde data, J. Atmos. Ocean. Tech., 30, 197–214, https://doi.org/10.1175/JTECH-D-12-00113.1, 2013.
Zhao, T., Dai, A., and Wang, J.: Trends in tropospheric humidity from 1970 to 2008 over China from a homogenized radiosonde dataset, J. Climate, 25, 4549–4567, https://doi.org/10.1175/JCLI-D-11-00557.1, 2012.
Zhao, T., Wang, J., and Dai, A.: Evaluation of atmospheric precipitable water from reanalysis products using homogenized radiosonde observations over China, J. Geophys. Res.-Atmos., 120, 10703–10727, https://doi.org/10.1002/2015JD023906, 2015.
Zhang, W. X., Lou, Y. D., Haase, J., Zhang, R., Zheng, G., Huang, J. F., Shi, C., and Liu, J. N.: The use of ground-based GPS precipitable water measurements over China to assess radiosonde and ERA-Interim moisture rends and errors from 1999 to 2015, J. Climate, 30, 7643–7667, https://doi.org/10.1175/JCLI-D-16-0591.1, 2017.
Zhang, W. X., Lou, Y. D., Cao, Y. C., Liang, H., Shi, C., Huang, J. F., Liu, W. X., Zhang, Y., and Fan, B. B.: Corrections of Radiosonde-based Precipitable Water Using Ground-based GPS and Applications on Historical Radiosonde Data over China, J. Geophys. Res.-Atmos., 124, 3208–3222, https://doi.org/10.1029/2018JD029662, 2019.