the Creative Commons Attribution 4.0 License.
the Creative Commons Attribution 4.0 License.
 | 14 Nov 2023
Theoretical derivation of aerosol lidar ratio using Mie theory for CALIOP-CALIPSO and OPAC aerosol models
Radhika A. Chipade
Mehul R. Pandya
The extinction-to-backscattering ratio, popularly known as lidar (light detection and ranging) ratio of atmospheric aerosols is an important optical property, which is essential to retrieve the extinction profiles of atmospheric aerosols. Lidar satellite observations can provide the global coverage of atmospheric aerosols along with their vertical extent. NASA's Cloud-Aerosol LIdar with Orthogonal Polarization (CALIOP) on board the Cloud-Aerosol Lidar and Infrared Pathfinder Satellite Observation (CALIPSO) satellite is the only space-based platform available, so far, that provides the vertical profiles of extinction due to atmospheric aerosols. A physics-based theoretical approach is presented in the present paper that estimates lidar ratio values for CALIPSO aerosol models, which can be used as inputs to determine the extinction profiles of aerosols using CALIPSO data. The developed methodology was also qualified by comparing it with the lidar ratio values derived using AERONET (AErosol RObotic NETwork) datasets. Lidar ratio values for CALIPSO aerosol models were estimated in the range of 38.72 to 85.98 sr at 532 nm, whereas at 1064 nm lidar ratio varied between 20.11 to 71.11 sr depending upon the aerosol type and their size distributions.
Aerosols are compositions of various particles; thus, the presence of water vapour in the atmosphere can affect the optical properties of the aerosols. Thus, the effect of relative humidity on lidar ratio was studied using Optical Properties of Aerosols and Clouds (OPAC) aerosol models, which are the standard aerosol models against the cluster-classified AERONET and CALIPSO aerosol models. Water-soluble particles contribute substantially in clean continental, clean marine, tropical marine and desert aerosol models and are hygroscopic in nature. Hygroscopic sulfate particles dominate the Antarctic aerosols during summertime. In the presence of relative humidity between 0 %–80 %, the lidar ratio values were observed to decrease from 53.59 to 47.13, from 53.66 to 47.15, from 53.70 to 47.16, and from 55.32 to 48.78 sr at 532 nm for clean continental, clean marine, tropical marine, and desert aerosols, respectively, whereas lidar ratio gradually increased from 47.13 to 51, from 47.15 to 51, from 47.16 to 51, and from 48.78 to 51.68 sr, respectively, for these aerosol models when relative humidity was between 80 %–99 %, due to constituent hygroscopic particles. In the case of Antarctic aerosols, the lidar ratio was observed to increase from 57.73 to 97.64 sr due to hygroscopic sulfate particles that backscattered heavily in the presence of water vapour at 532 nm. The soot particles dominate the polluted continental and polluted marine particles, causing an increase in lidar ratio over its corresponding clean counterpart. Similar results were observed at 1064 nm for OPAC aerosol models.
- Article
(3062 KB) - Full-text XML
- BibTeX
- EndNote


Light detection and ranging (lidar) measurements are considered appropriate to retrieve the range-resolved values of vertical backscatter and extinction profiles of tropospheric aerosols. The single-scattering lidar equation is solved in order to determine extinction and backscatter profiles of aerosols, which depends on the ratio of extinction-to-backscatter coefficient, known as lidar ratio. Thus, estimation of lidar ratio is essential to solve the lidar equation and important in the study of the climatic impact of aerosols.
Many researchers have reported the lidar ratio estimation as a part of the retrieval of extinction and backscatter profiles of tropospheric aerosols using ground as well as satellite data. Takamura et al. (1994) derived lidar ratio combining the measurements from a lidar, sun photometer and optical particle counter. Lidar ratio can be directly estimated using Raman lidar. Ansmann et al. (2002) demonstrated that the lidar ratio retrieved using Raman lidar can be used to retrieve extinction profiles of the aerosols using elastic backscatter lidar. The National Aeronautics and Space Administration's (NASA's) Cloud-Aerosol LIdar with Orthogonal Polarization (CALIOP) on board Cloud-Aerosol Lidar and Infrared Pathfinder Satellite Observation (CALIPSO) launched in 2006 is the only available source of satellite data to retrieve vertical profiles of tropospheric aerosols. CALIOP is an elastic backscatter lidar (Hunt et al., 2009) that records the backscattered photon counts due to tropospheric aerosols and the vertical extinction, and backscatter profiles of aerosols are retrieved by solving the single-scattering lidar equation (Young and Vaughan, 2009). This retrieval process uses a look-up table approach for lidar ratio in order to solve the lidar equation. The lidar ratio selection scheme used for CALIOP-CALIPSO products is based on cluster analysis of aerosol measurements using data recorded at several AERONET (AErosol RObotic NETwork) stations spread across the globe (Omar et al., 2009; Young and Vaughan, 2009). Thus, a novel theoretical approach is presented in this paper to retrieve the lidar ratio for CALIOP-CALIPSO aerosol models.
The lidar ratio depends on two optical properties, viz. extinction coefficient and backscattering coefficient; thus, it depends on the incident wavelength, refractive index and the size distribution of the aerosols. In real atmospheric conditions, aerosols particles exhibit different shapes and sizes and are composed of various kinds of compounds. In addition to this, various aerosol components are affected due to variations in relative humidity. Thus, it is essential to study the variations in lidar ratio due to different atmospheric conditions for various compositions of aerosols. Salemink et al. (1984) reported a linear increase in the lidar ratio when relative humidity was increased from 40 % to 80 % during a field experiment, details of which are not mentioned in the paper. Ackermann (1998) has reported a numerical study of lidar ratio with respect to variations in relative humidity for Nd:YAG (neodymium-doped yttrium aluminium garnet) wavelengths for continental, maritime and desert aerosol models, where the author has considered some hypothetical cases for number mixing ratios of the aerosol components. The author has established a non-linear relationship between relative humidity and lidar ratio. Zhao et al. (2017) used Mie theory and κ-Köhler theory to study the influences of aerosol hygroscopic growth on lidar ratio and used in situ data collected during a field campaign to establish a relationship between lidar ratio and relative humidity. Düsing et al. (2021) has also established a non-linear relationship between lidar ratio and relative humidity for central European aerosols using in situ data. Optical properties of aerosols are important to study the radiation balance of the Earth and climate change. The Optical Properties of Aerosols and Clouds (OPAC) software tool facilitates this with the dataset of optical properties of the aerosols and clouds and a program to extract these datasets. The standard global aerosol models are considered in OPAC as given in d'Almeida et al. (1991) and Hess et al. (1998). Component mixing in aerosols is based on particle number densities, which are independent of relative humidities in OPAC. However, this will affect the aerosol lidar ratio.
Several authors have reported different lidar ratio values for different aerosol models using a variety of methodologies. D'Almeida et al. (1991) have reported values of 16–22 sr for clean marine and desert models at ruby wavelength when lidar ratio was estimated as the ratio of extinction coefficient to phase function at 180∘. They have reported a value up to 80 sr for Antarctic aerosols at ruby wavelength. Anderson et al. (2000) have showed a variation of 8 to 95 sr in lidar ratio values for the polluted continental model at 532 nm using nephelometer data. Omar et al. (2009) have reported lidar ratio values for desert, smoke, clean continental, polluted continental, clean marine and polluted dust aerosols at 532 and 1064 nm, varying between 20–70 sr using AERONET data. These values are reported with 30 % uncertainty and are selected as lidar ratio in the CALIPSO-V1 operational algorithms. The lidar ratios for polluted dust aerosols are updated to 55 and 48 sr at 532 and 1064 nm, respectively, in the CALIPSO-V3 operational algorithm, whereas lidar ratio for clean continental aerosols is updated to 53 sr at 532 nm in the CALIPSO-V4 operational algorithm (Kim et al., 2018). Lopes et al. (2013) have reported a regional study in Brazil about the lidar ratio selection algorithm for CALIPSO data only at 532 nm using AERONET sun photometers. They have reported similar values for all aerosol models as used in the CALIPSO-V1 algorithm by Omar et al. (2009) except for polluted dust in which case the lidar ratio value is updated to 55 sr. Li et al. (2022) have assessed the CALIPSO-V4 lidar ratio selection algorithm by retrieving lidar ratios as a combination of CALIPSO columnar attenuated backscatter and Synergised Optical Depth of Aerosols (SODA) algorithms. This study has ignored clean continental aerosols and has proposed elevated smoke and dusty marine aerosol models with lidar ratios of 47 and 32 sr, respectively, during the night at 532 nm.
The present study reports a theoretical approach for estimation of lidar ratio from various sources, such as aerosol models reported by Hess et al. (1998) (OPAC aerosol models) and Omar et al. (2005, 2009) for wavelengths of 532, 673 and 1064 nm (CALIPSO and AERONET aerosol models). The variation in lidar ratio with respect to relative humidity was also studied at Nd:YAG wavelengths using OPAC (Hess et al., 1998) aerosol models. Hess et al. (1998) have reported aerosol models as a composition of various components contributing to different aerosol types, whereas Omar et al. (2005, 2009) have reported aerosol models in terms of a contribution from fine and coarse particles, i.e. in terms of aerosol sizes. As mentioned earlier, a theoretical approach for lidar ratio estimation using Mie theory is still a gap area for CALIPSO and OPAC aerosol models; thus, this study attempts to provide a physics-based theoretical approach covering all types of aerosol models over the varying lidar ratio values based on in situ measurements.
The paper is organized into five sections. The first section presents the introductory literature review and motivation behind this study. The second section outlines the data used in this study. The detailed methodology and Mie theory for lidar ratio estimation is presented in the third section of this paper. The results are discussed in the fourth section, whereas the concluding remarks are listed in the fifth section of this paper.
The lidar ratio depends on aerosol size distribution, refractive index and incident wavelength. The inputs used in this study are the aerosol models provided in d'Almeida et al. (1991), Ackermann (1998), Hess et al. (1998) and Omar et al. (2005, 2009).
Tables 1 and 2 present the CALIOP-CALIPSO aerosol models and cluster-classified AERONET aerosol models, respectively, defined in Omar et al. (2009, 2005) at 532, 673 and 1064 nm. These data include the refractive indices (in terms of real part (mr) and imaginary part (mi)) for each of the component aerosols along with the size distribution of the aerosol in terms of median radius (rm) and standard deviation (σ).
Table 1Physical and optical properties of CALIPSO aerosol models (Omar et al., 2009).
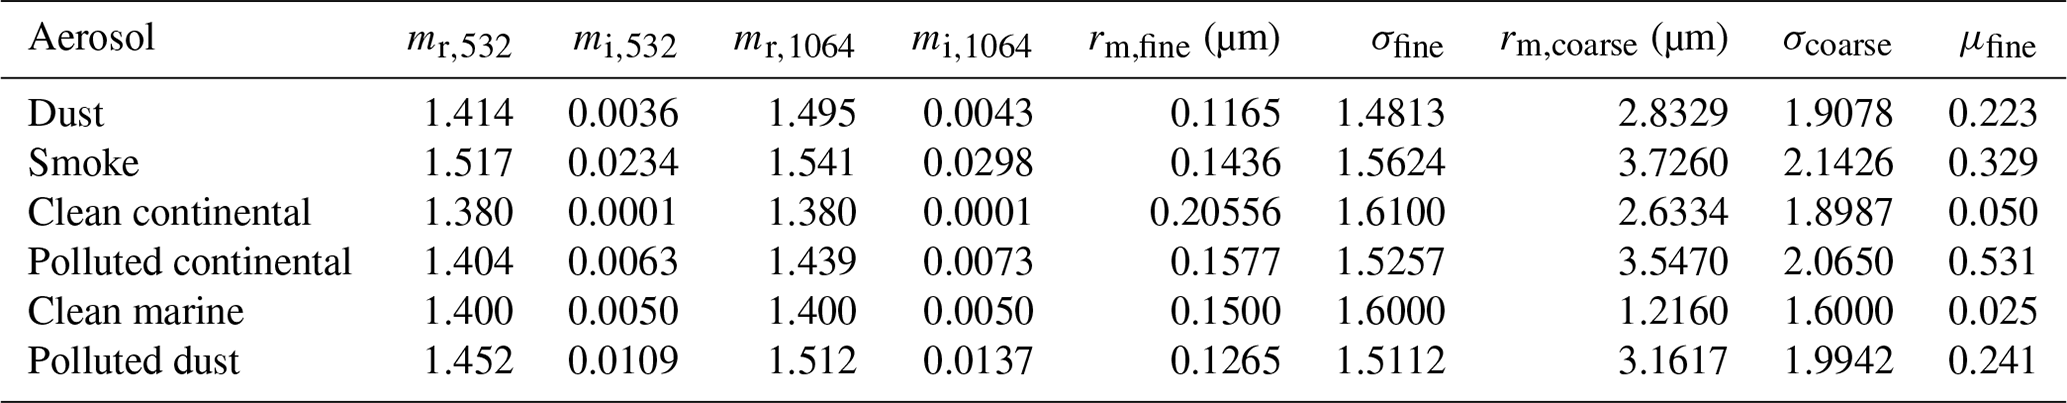
Table 2Physical and optical properties of AERONET aerosol models at 673 nm classified using cluster analysis (Omar et al., 2005).
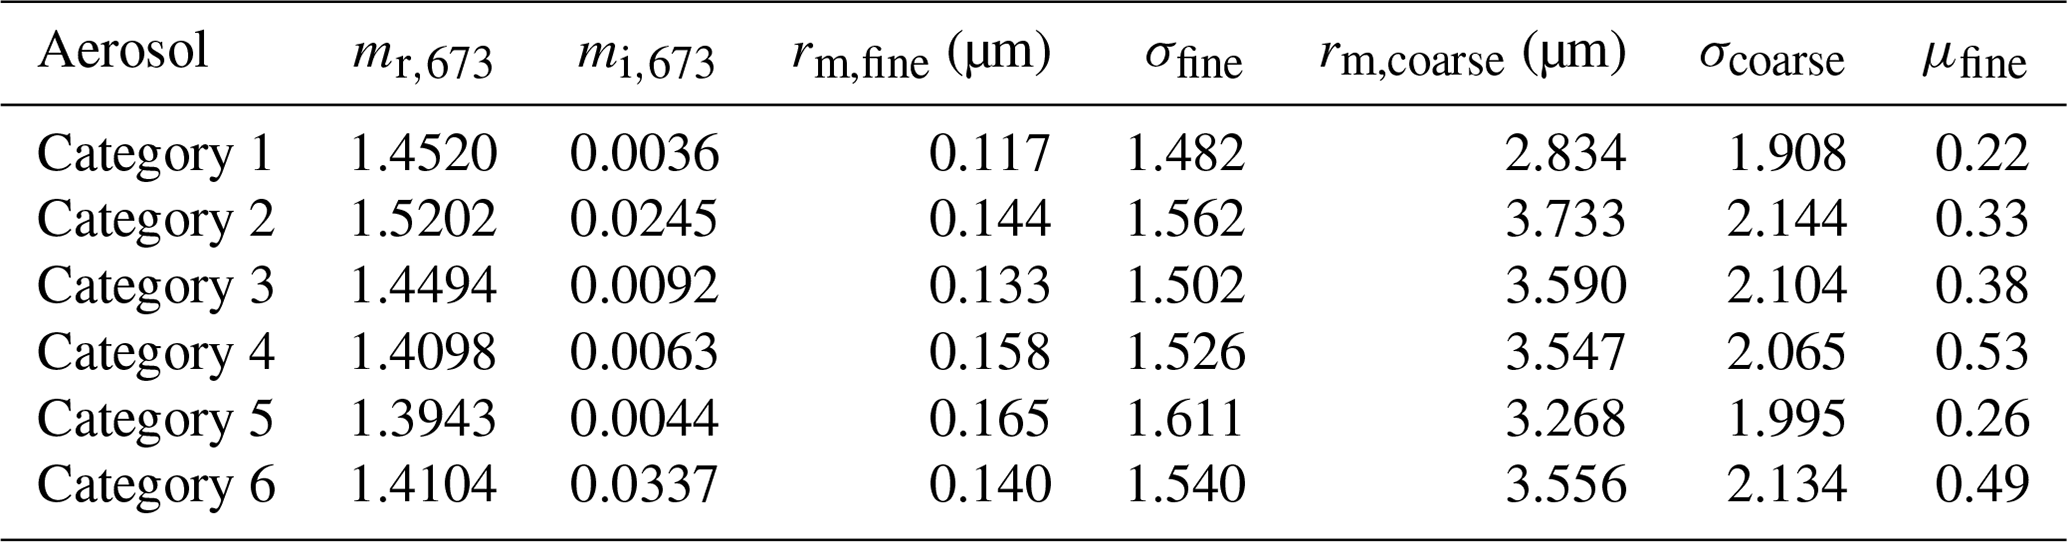
Omar et al. (2005) have reported aerosol refractive indices at 673 nm and have classified aerosols through cluster analysis into six different categories numbered 1–6, viz. desert dust, biomass burning, rural, industrial pollution, polluted marine and dirty pollution, using AERONET data. The desert dust and polluted marine (i.e. category 1 and category 5) aerosol models represent the categories of aerosols originated from natural sources, whereas the biomass burning, continental pollution and dirty pollution (i.e. categories 2, 4 and 6) aerosol models represent the aerosols emanating from the anthropogenic sources. The rural background aerosol model (i.e. category 3) represent those aerosols which are observed in a relatively clean atmosphere.
The category-1 aerosols have fine fraction by volume of 0.22, indicating that coarse particles dominate the volume of this category. The median radius and geometric standard deviation for the fine mode is of 0.12 µm and 1.48, respectively, for this category. The refractive index of this category of aerosols is considered to be 1.45−0.0036i as reported in Table 2. The sites considered for this category of aerosols are either desert regions, close to desert regions or the sites where desert dust has been observed as a result of long-range transport. The category-2 aerosols have fine fraction by volume of 0.33, whereas median and geometric standard deviation for the fine mode is 0.14 µm and 1.56, respectively. Category-2 aerosols are dominated by coarse mode particles which have a median radius and geometric standard deviation of 3.73 µm and 2.14, respectively. Category-1 and category-2 aerosols have single-scattering albedo values of 0.94 and 0.82, respectively which are estimated using Mie theory presented in this paper. These single-scattering albedo values are consistent with those reported by Omar et al. (2005).
Category-3 aerosols are characterized by low optical depth values as they are originated from clean atmosphere. These aerosols have fine fraction by volume of 0.38, indicating a dominance of coarse particles. The median radius and geometric standard deviation for the fine mode are 0.13 µm and 1.50, respectively. The refractive index for this category of aerosols is considered to be 1.45−0.0092i. The single-scattering albedo value is observed to be 0.89 for category-3 aerosols. The category-4 aerosols are found in urban centres or near urban centres and are dominated by the natural pollutants such as sulfate particles (Omar et al., 2005). The refractive index for this category of aerosols is considered to be 1.41−0.0063i, which is representing the natural pollutants comprising category-4 aerosols. The size distribution of category-4 aerosols is described by a median radius and geometric standard deviation for fine mode of 0.16 µm and 1.53, respectively. The median radius and geometric standard deviation for coarse mode is of 3.55 µm and 2.07, respectively. The single-scattering albedo for this category of aerosols is estimated to be 0.93.
The category-5 aerosols are observed at islands or at coastal regions. The fine fraction by volume is 0.26, and size distribution is described by a median radius and geometric standard deviation for fine mode of 0.17 µm and 1.61, respectively. The refractive index for this category of aerosols is considered to be 1.39−0.0044i. These optical properties are resulted in the single-scattering albedo of 0.94 for polluted marine aerosols. The category-6 aerosols are similar to category-4 aerosols with a high imaginary part of refractive index. The refractive index of category-6 aerosols is considered to be 1.41−0.0337i, which resulted in a low single-scattering albedo of 0.68. The low single-scattering albedo indicates that these are the aerosols with mostly carbon element in it (Omar et al., 2005). The size distribution of this category of aerosols is described by a median radius and geometric standard deviation of 0.14 µm and 1.54, respectively. The more details about these six categories of aerosols can be found in Omar et al. (2005).
The theoretically derived lidar ratios were compared with lidar ratio derived using AERONET data for three different stations classified for each of the above-mentioned six categories. The details are discussed in the “Results and discussion” section of this paper.
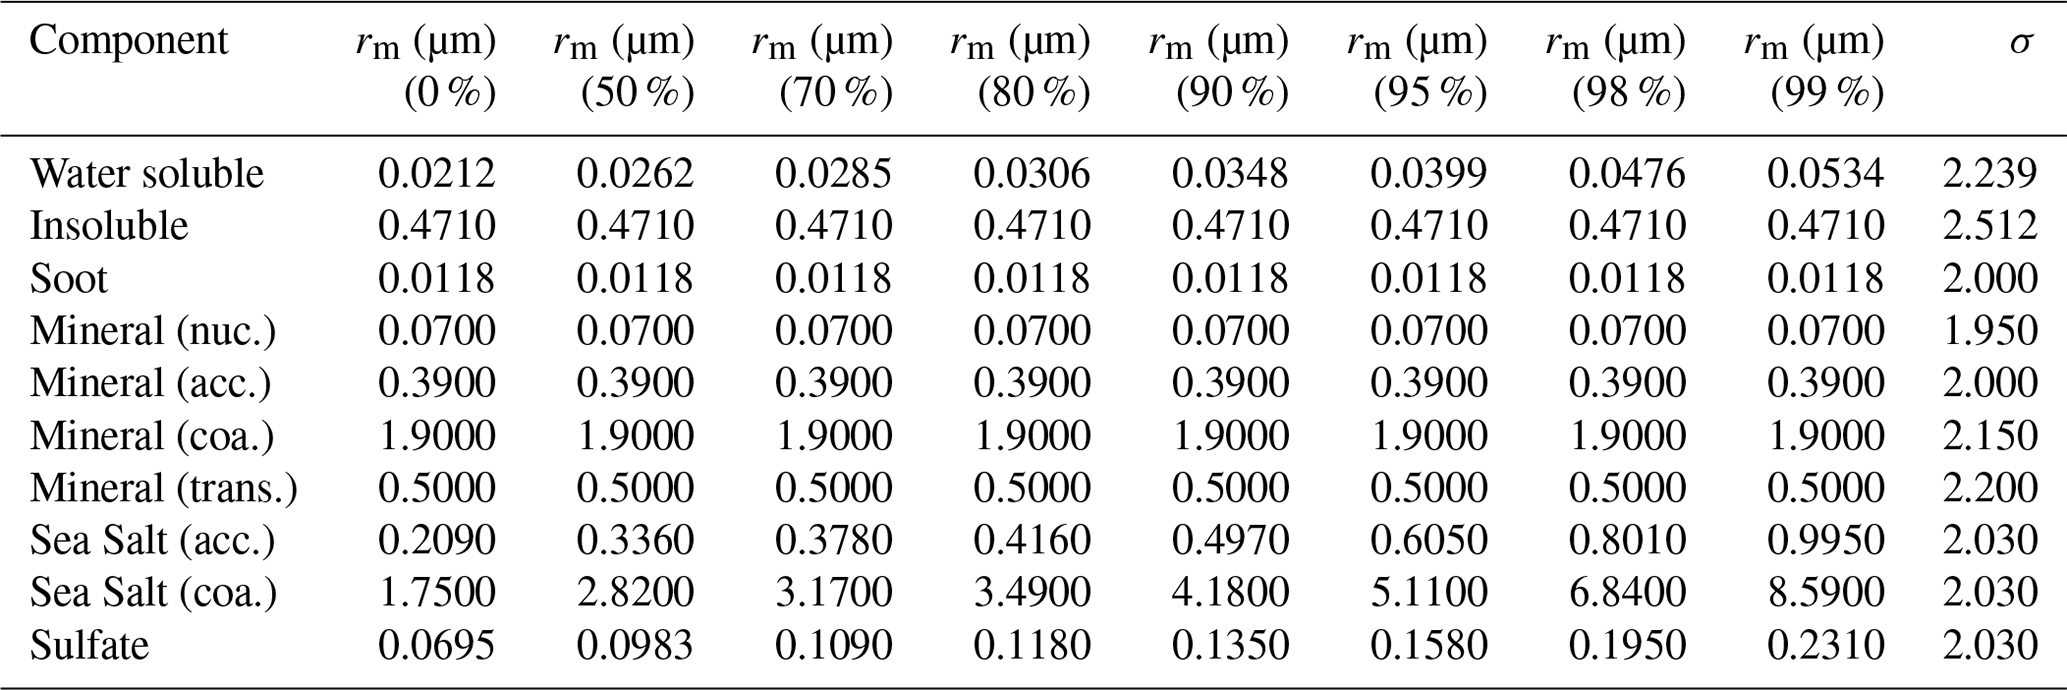
Tables 3–5 collectively report the OPAC aerosol models. These aerosol models are defined in terms of their size distribution with respect to relative humidity, refractive indices at 532 and 1064 nm, and composition of aerosol types in terms of number mixing ratio (μ). The log-normally distributed aerosol components were considered in this study. The relative humidity was varied from 0 % to 99 % with intermediate steps at 50 %, 70 %, 80 %, 90 % and 98 %. The details about OPAC aerosol models can be found in Hess et al. (1998).
Table 3Size distribution of aerosol components for models used in OPAC for different relative humidities (d'Almeida et al., 1991; Ackermann, 1998).
In this study, the aerosols were assumed as homogeneous isotropic spheres scattering the electromagnetic radiation incident upon them. These scattering phenomena are modelled using Mie theory, which is discussed in Bohren and Huffman (1983) and Vermote et al. (2006) as well as many other authors. The lidar ratio, which is defined as the ratio of extinction coefficient to backscattering coefficient, is derived in the present study using the Mie theory equations. The computational equations are presented here briefly for easy reference.
The Mie parameter (x) for an aerosol with refractive index is defined as
where r is the aerosol particle radius in micrometres, and λ is the wavelength in micrometres. Here m is the refractive index with real part mr and imaginary part mi.
Two complex functions and related to amplitude of scattered radiation that are perpendicular and parallel to the plane of scattering with scattering angle θ, respectively, can be defined as follows.
and
where, the complex functions an(x,m) and bn(x,m) are given by
which are defined in terms of Ricatti–Bessel functions Ψn(z=x or mx) and ξn(z=x or mx). Ricatti–Bessel functions are evaluated using their logarithmic derivatives, details of which are provided in Vermote et al. (2006).
In order to compute the complex functions and , the functions πn and τn are computed using associated Legendre polynomials. The functions πn and τn are the functions of scattering angle θ. These can be computed using the recurrence relations
which are initialized with π0(cos θ)=0, π1(cos θ)=1 and τ0(cos θ)=cos θ.
Using these quantities, the extinction efficiency (), dimensionless angular-scattering intensity efficiency (), the scattering efficiency () and backscattering efficiency () can be computed as
where r is the particle radius, is the extinction cross section and is the scattering cross section.
Table 4Refractive indices of the aerosol components for the OPAC aerosol models used in this study (d'Almeida et al., 1991; Ackermann, 1998).
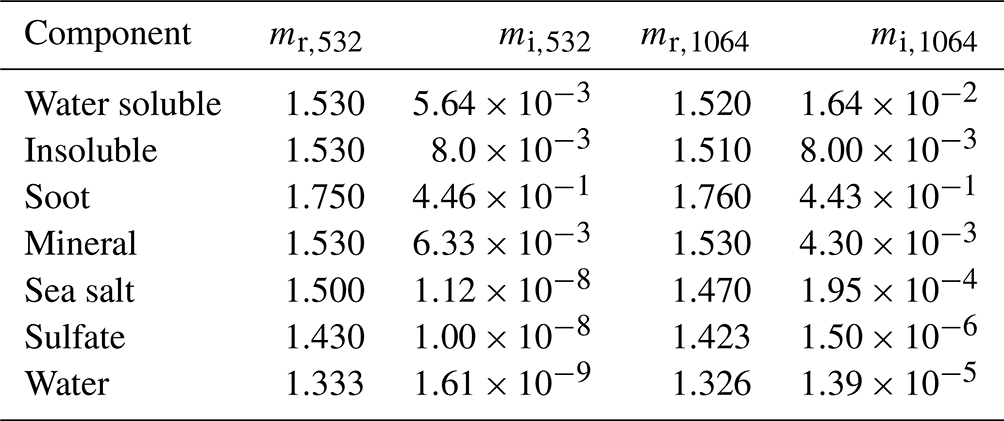
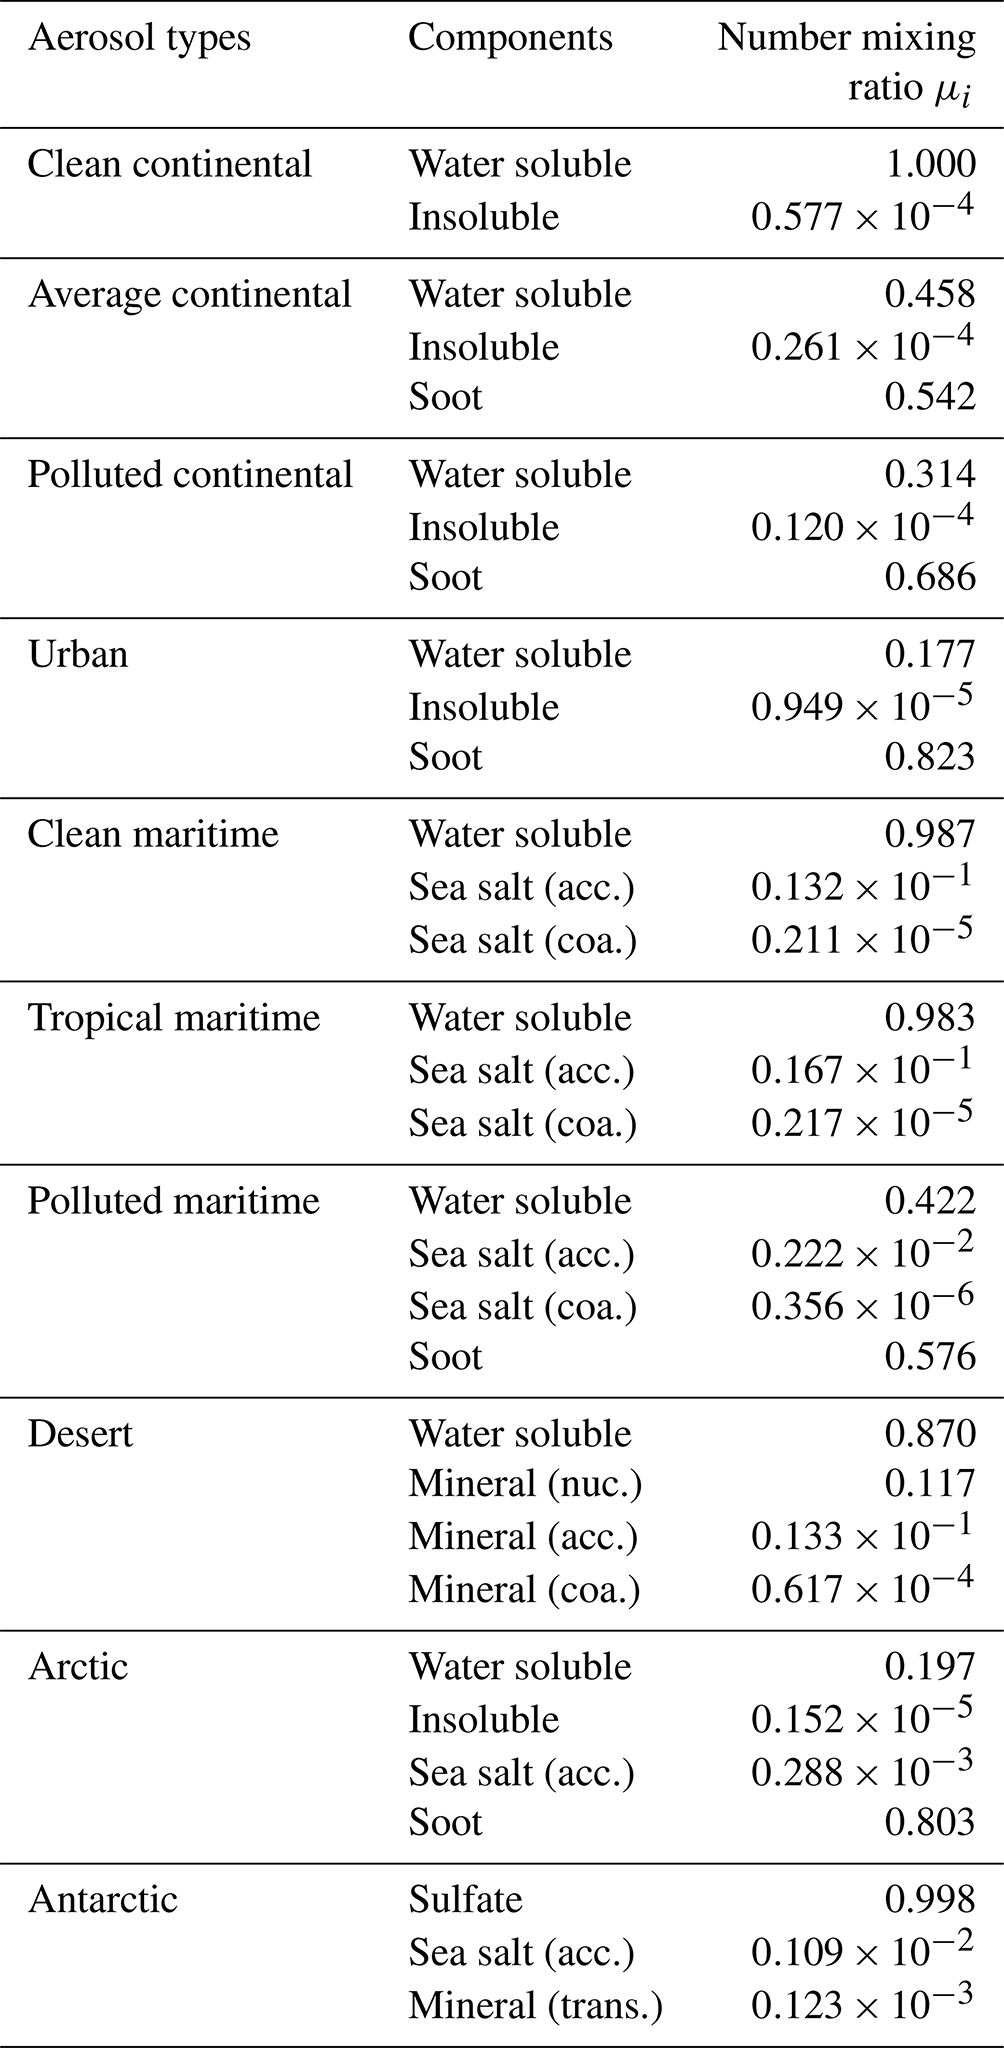
Table 5Composition of aerosol models used in OPAC (Hess et al., 1998).
Thus, the lidar ratio can be computed as
The single-scattering albedo can be computed as
In this study, an aerosol is considered a mixture of its constituent components. And each of the components is log-normally distributed with median radius rm and standard deviation σ. Thus,
where μ is the number mixing ratio (i.e. normalized number particle concentration), and Ntot is the total number density of the aerosol component.
The relative humidity influences the refractive index of the hygroscopic aerosol components, and the effective refractive index is
where mw is the refractive index of the water, m0,i is the refractive index of the dry particle of component i and r0,i is the median radius of the dry particle of component i.
The theory presented above is with the assumption of homogeneous spherical isotropic aerosol particles, which simplifies the computation of lidar ratio. The scattering phase function for anisotropic particles will differ. Thus, if the particles are not homogeneous and anisotropic, then the above theory may cause errors. Moreover, if the particles are non-hygroscopic, especially when the particles are large as compared to the incident wavelength, then the above theory fails (Ackermann, 1998).
4.1 Lidar ratio for AERONET and CALIPSO aerosol models defined in terms of particle sizes
The aerosol models defined in terms of particle size by Omar et al. (2005, 2009) were used to estimate the lidar ratio for aerosol models used in operational algorithms of CALIOP-CALIPSO. Omar et al. (2005) used cluster analysis for AERONET data to define the aerosol models at 673 nm. Table 6 shows the lidar ratio estimated using Mie theory for each of the six clusters defined by Omar et al. (2005). The maximum lidar ratio of 48.87 sr was observed for the dirty pollution type of aerosols, whereas the minimum of 28.76 sr was observed for the desert dust kind of aerosols. The lidar ratios at 532 nm are mostly discussed in the literature (Ackermann, 1998; Anderson et al., 2000; Omar et al., 2009; Lopes et al., 2013; Kim et al., 2018, 2020), and scanty literature is available for lidar ratios at 673 nm. Moreover, these aerosol models are derived using AERONET data. Thus, the estimated lidar ratios at 673 nm were compared with those of the AERONET data.
Table 6Lidar ratio (in sr) estimated using Mie theory for Omar et al. (2005) aerosol models.

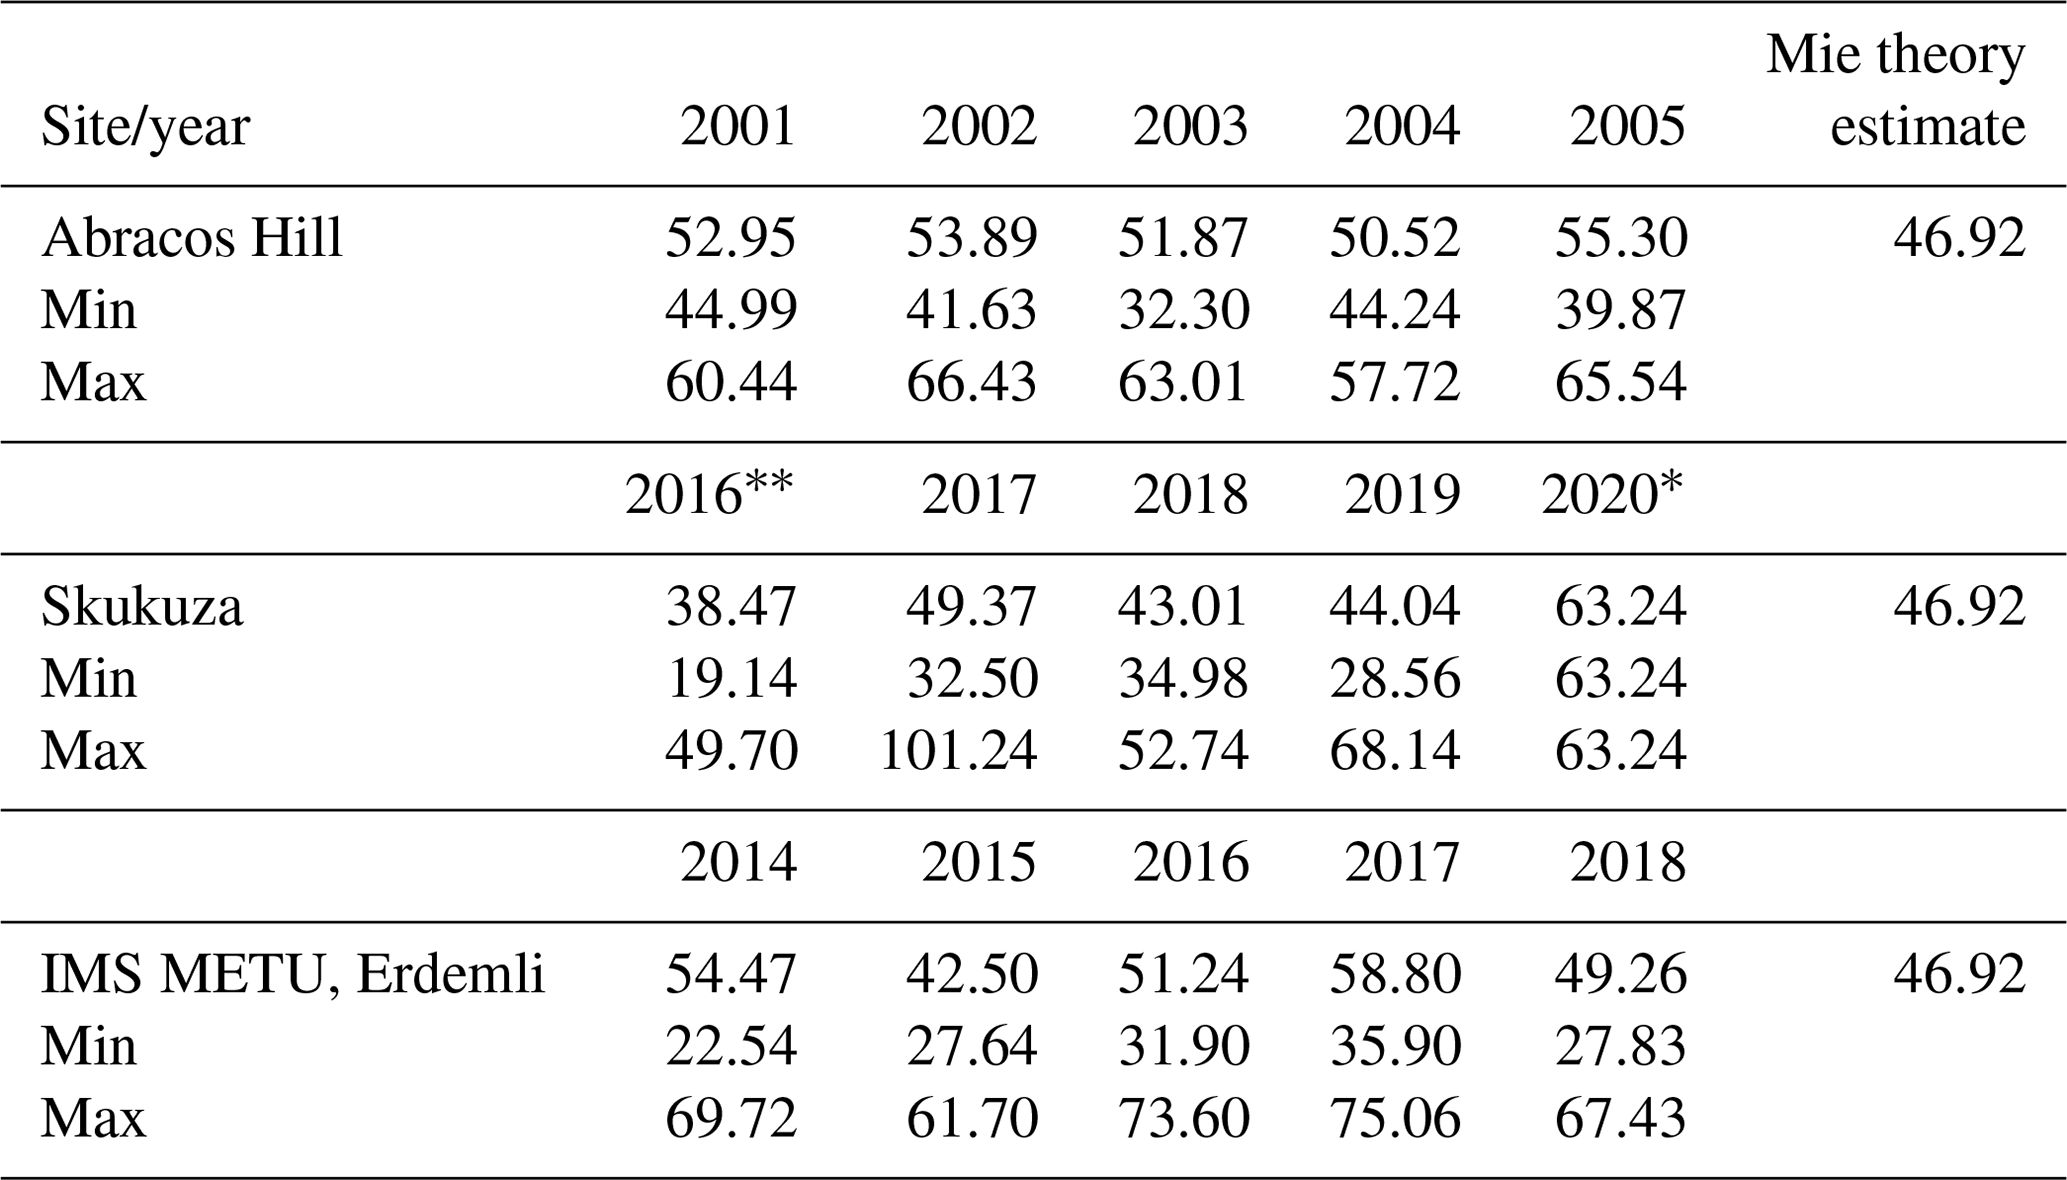
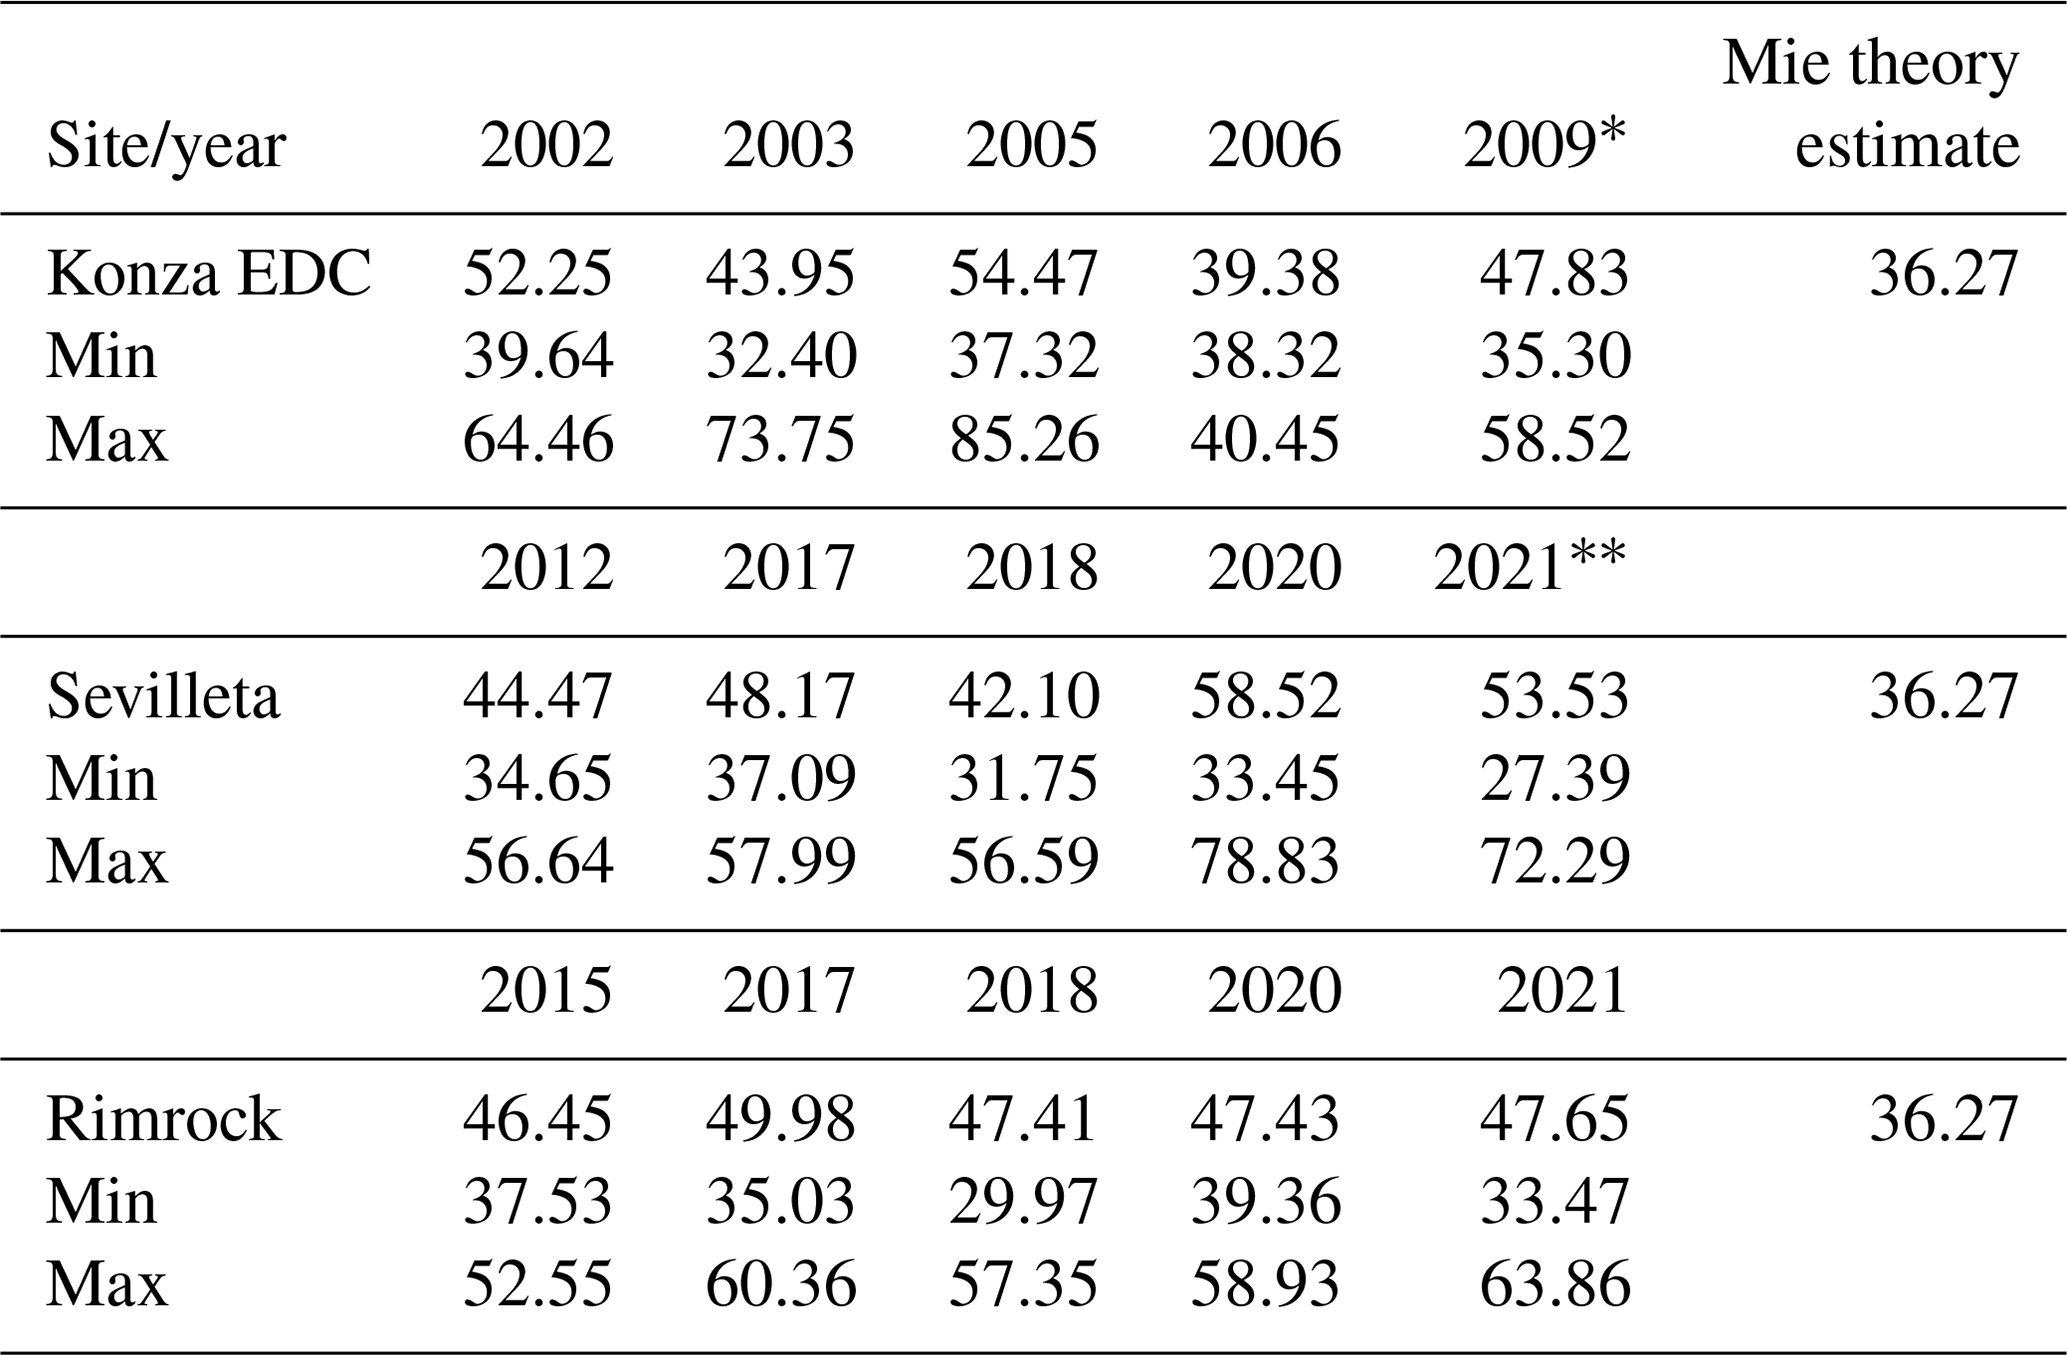
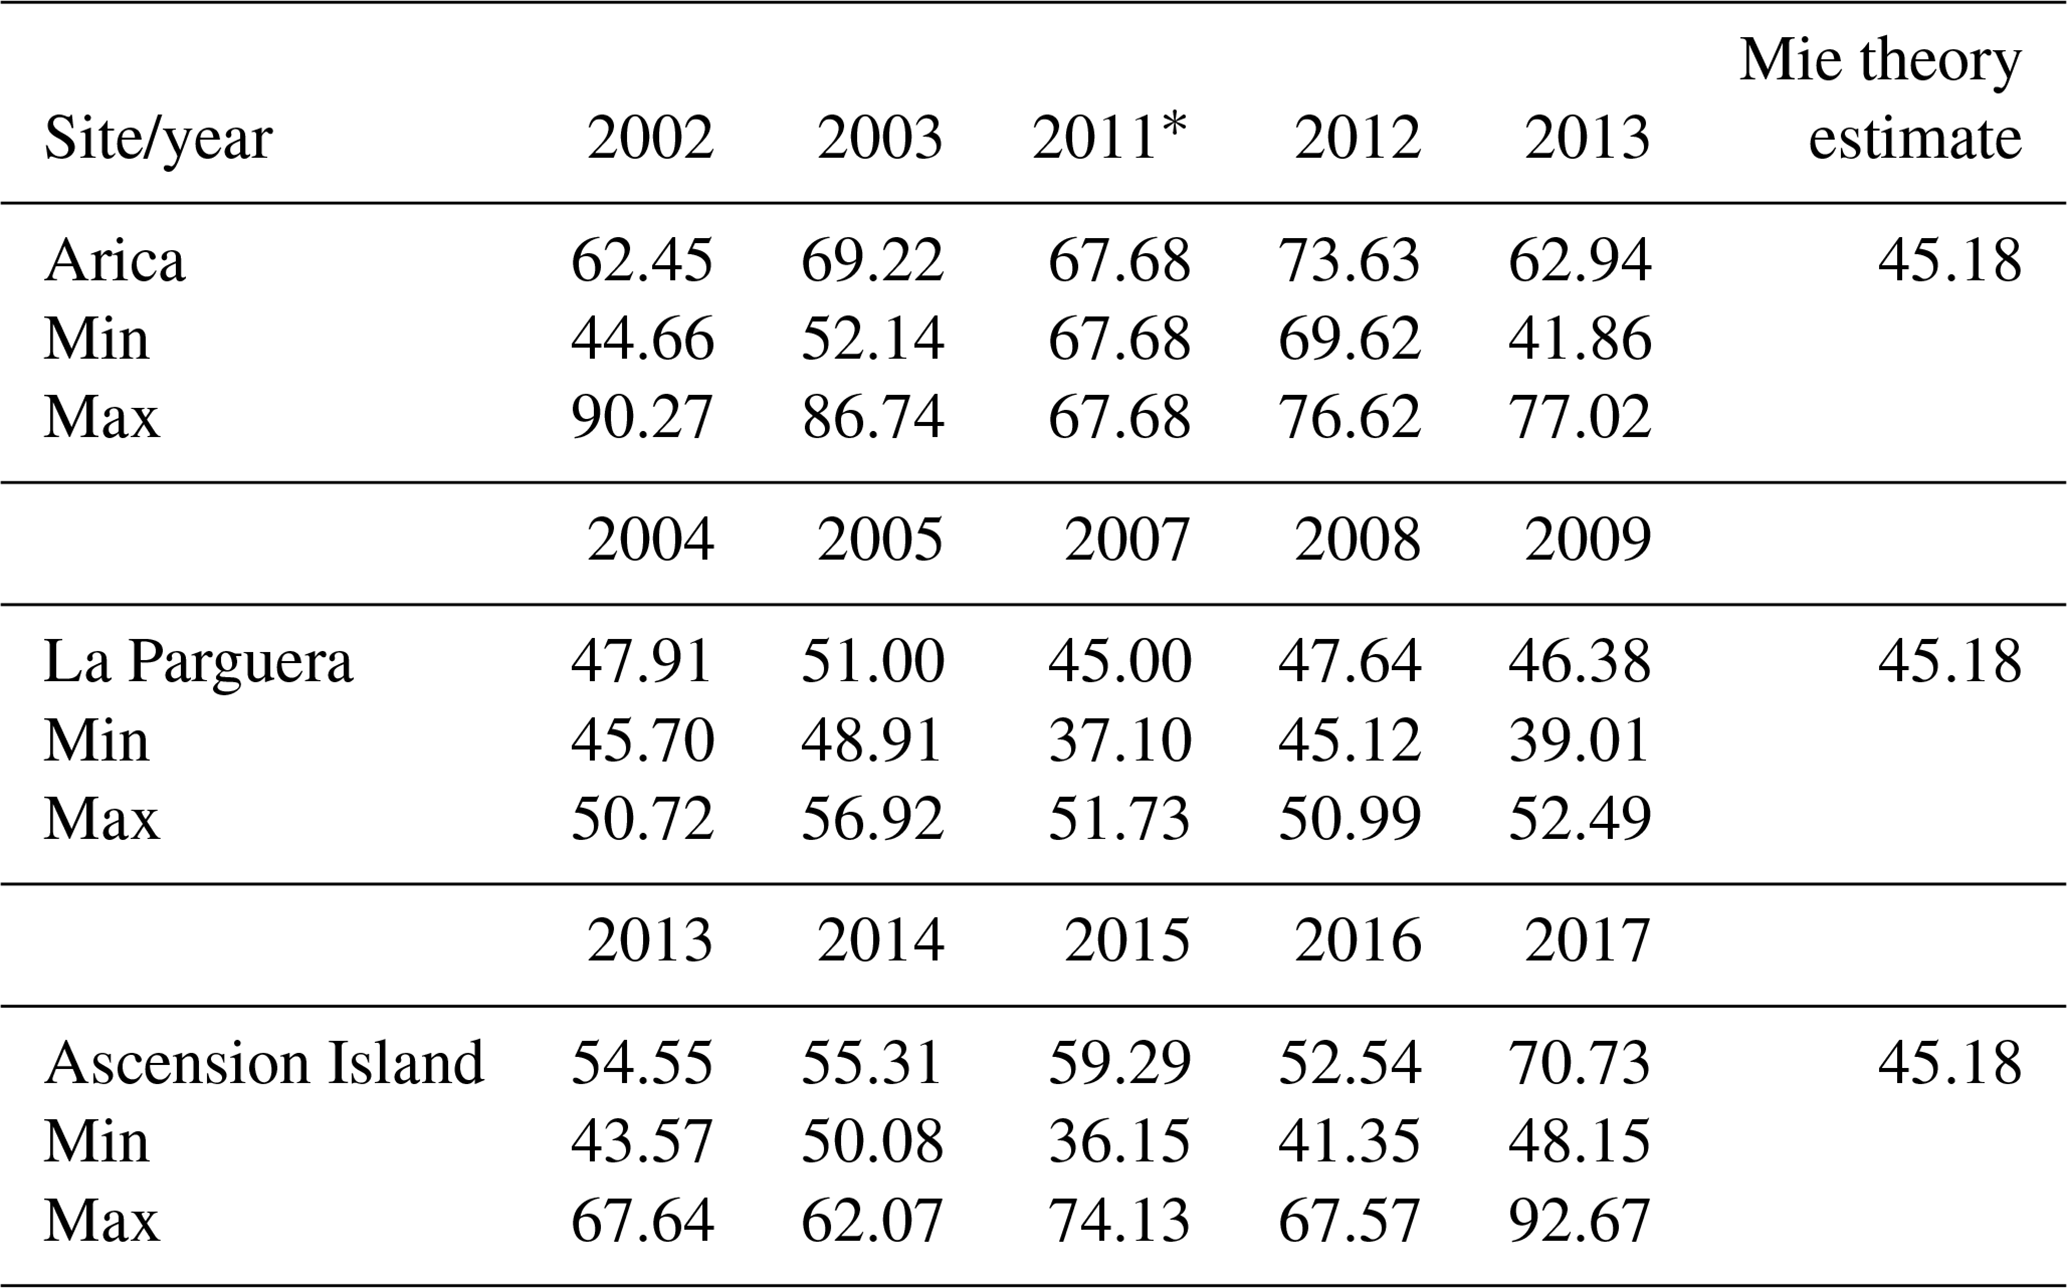
The data for three different stations for each of the categories were selected, and aerosol lidar ratio was computed using Eq. (12) as a multiplier of 4π. Tables 7–12 show the statistics of the lidar ratio for different AERONET stations belonging to different categories. The daily averages of the lidar ratios were obtained using the AERONET single-scattering albedo and phase function values and were compared with Mie theory-estimated values. The Mie theory-estimated values were observed to comply with the observed values of lidar ratios using AERONET data as the theoretically estimated values were lying in between the minimum and maximum of the daily lidar ratio values. The differences in the theoretical values estimated using Mie theory and those observed using AERONET data were primarily due to the refractive indices of the different aerosol types present at the different AERONET stations. Omar et al. (2005) had classified the different aerosol types mentioned in Sect. 2 using cluster analysis, and the geographical location of these AERONET stations was also considered to be an important factor during classification. Thus, the composition of the aerosols observed over a period of time varied, resulting in the variation of the refractive indices. The theoretically computed lidar ratios were based on the refractive index of the centre of the cluster analysed using AERONET data before 2002 (Omar et al., 2005), whereas the AERONET station data used in this study spanned over 1998 to 2021 leading to the differences in the refractive indices of the aerosol types. The shape of the aerosol particles, their size distribution and their particle density present in the atmosphere may be the secondary reasons for the differences between the theoretically estimated values of lidar ratio using Mie theory and the lidar ratio computed using AERONET station data, which needs further investigation.
Table 7Lidar ratio (in sr) comparison between theoretical values estimated using Mie theory and in situ values using category-1 AERONET data.
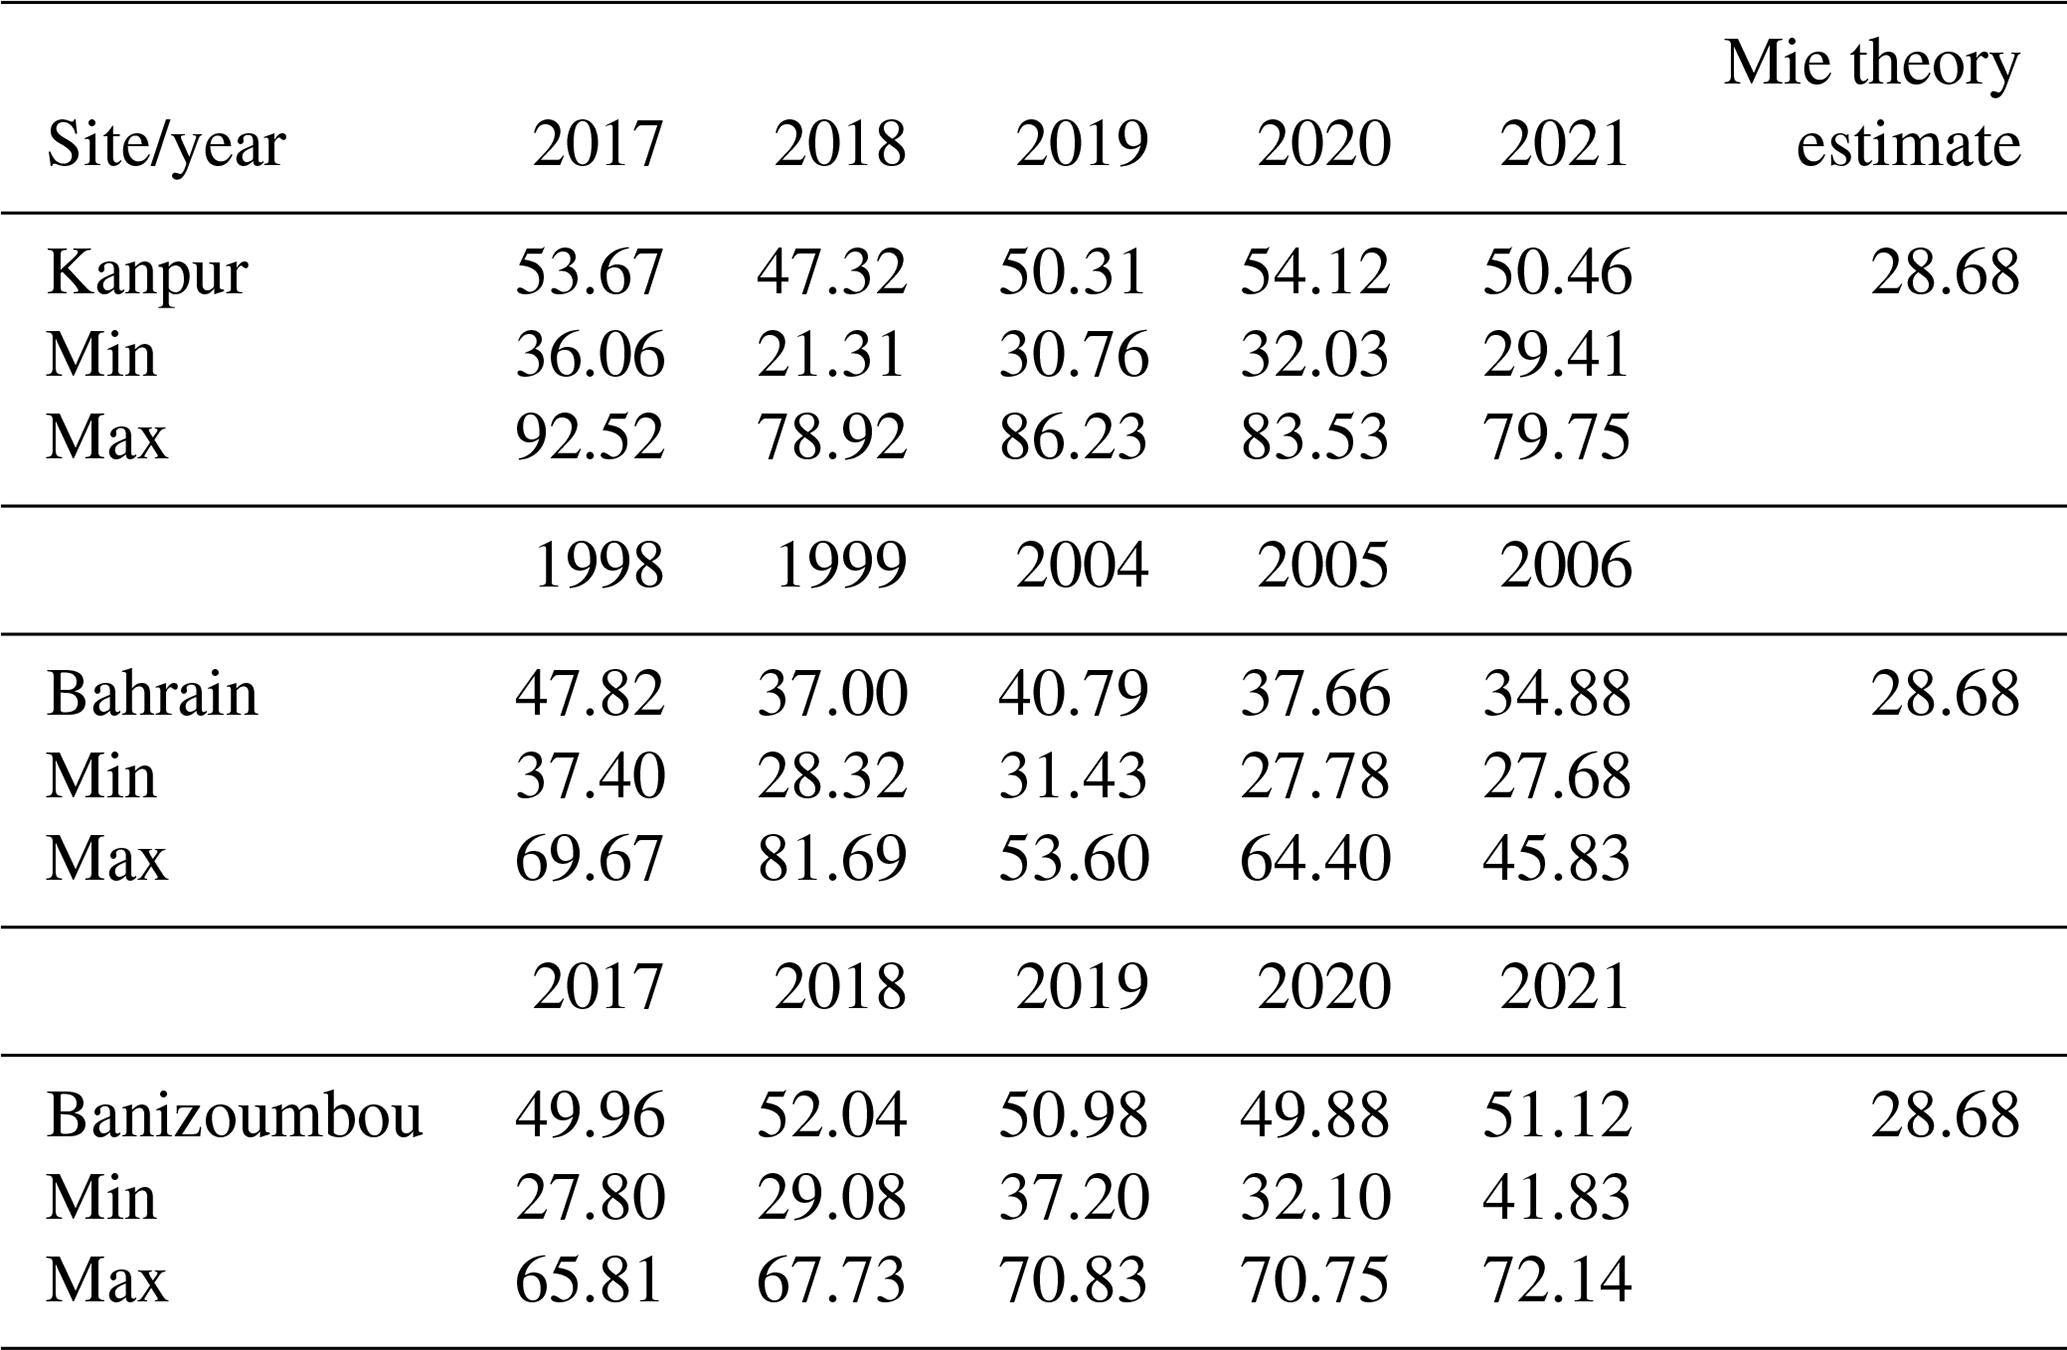
Table 8Lidar ratio (in sr) comparison between theoretical values estimated using Mie theory and in situ values using category-2 AERONET data.
∗ Only single data value is available. The data has an outlier. Without outlier the value of LR is 43.30 sr.
Table 9Lidar ratio (in sr) comparison between theoretical values estimated using Mie theory and in situ values using category-3 AERONET data.
∗ Only two data values are available. The data has an outlier. Without outlier the value of LR is 50.40 sr.
Table 10Lidar ratio (in sr) comparison between theoretical values estimated using Mie theory and in situ values using category-4 AERONET data. GSFC represents the AERONET station at Goddard Space Flight Center.
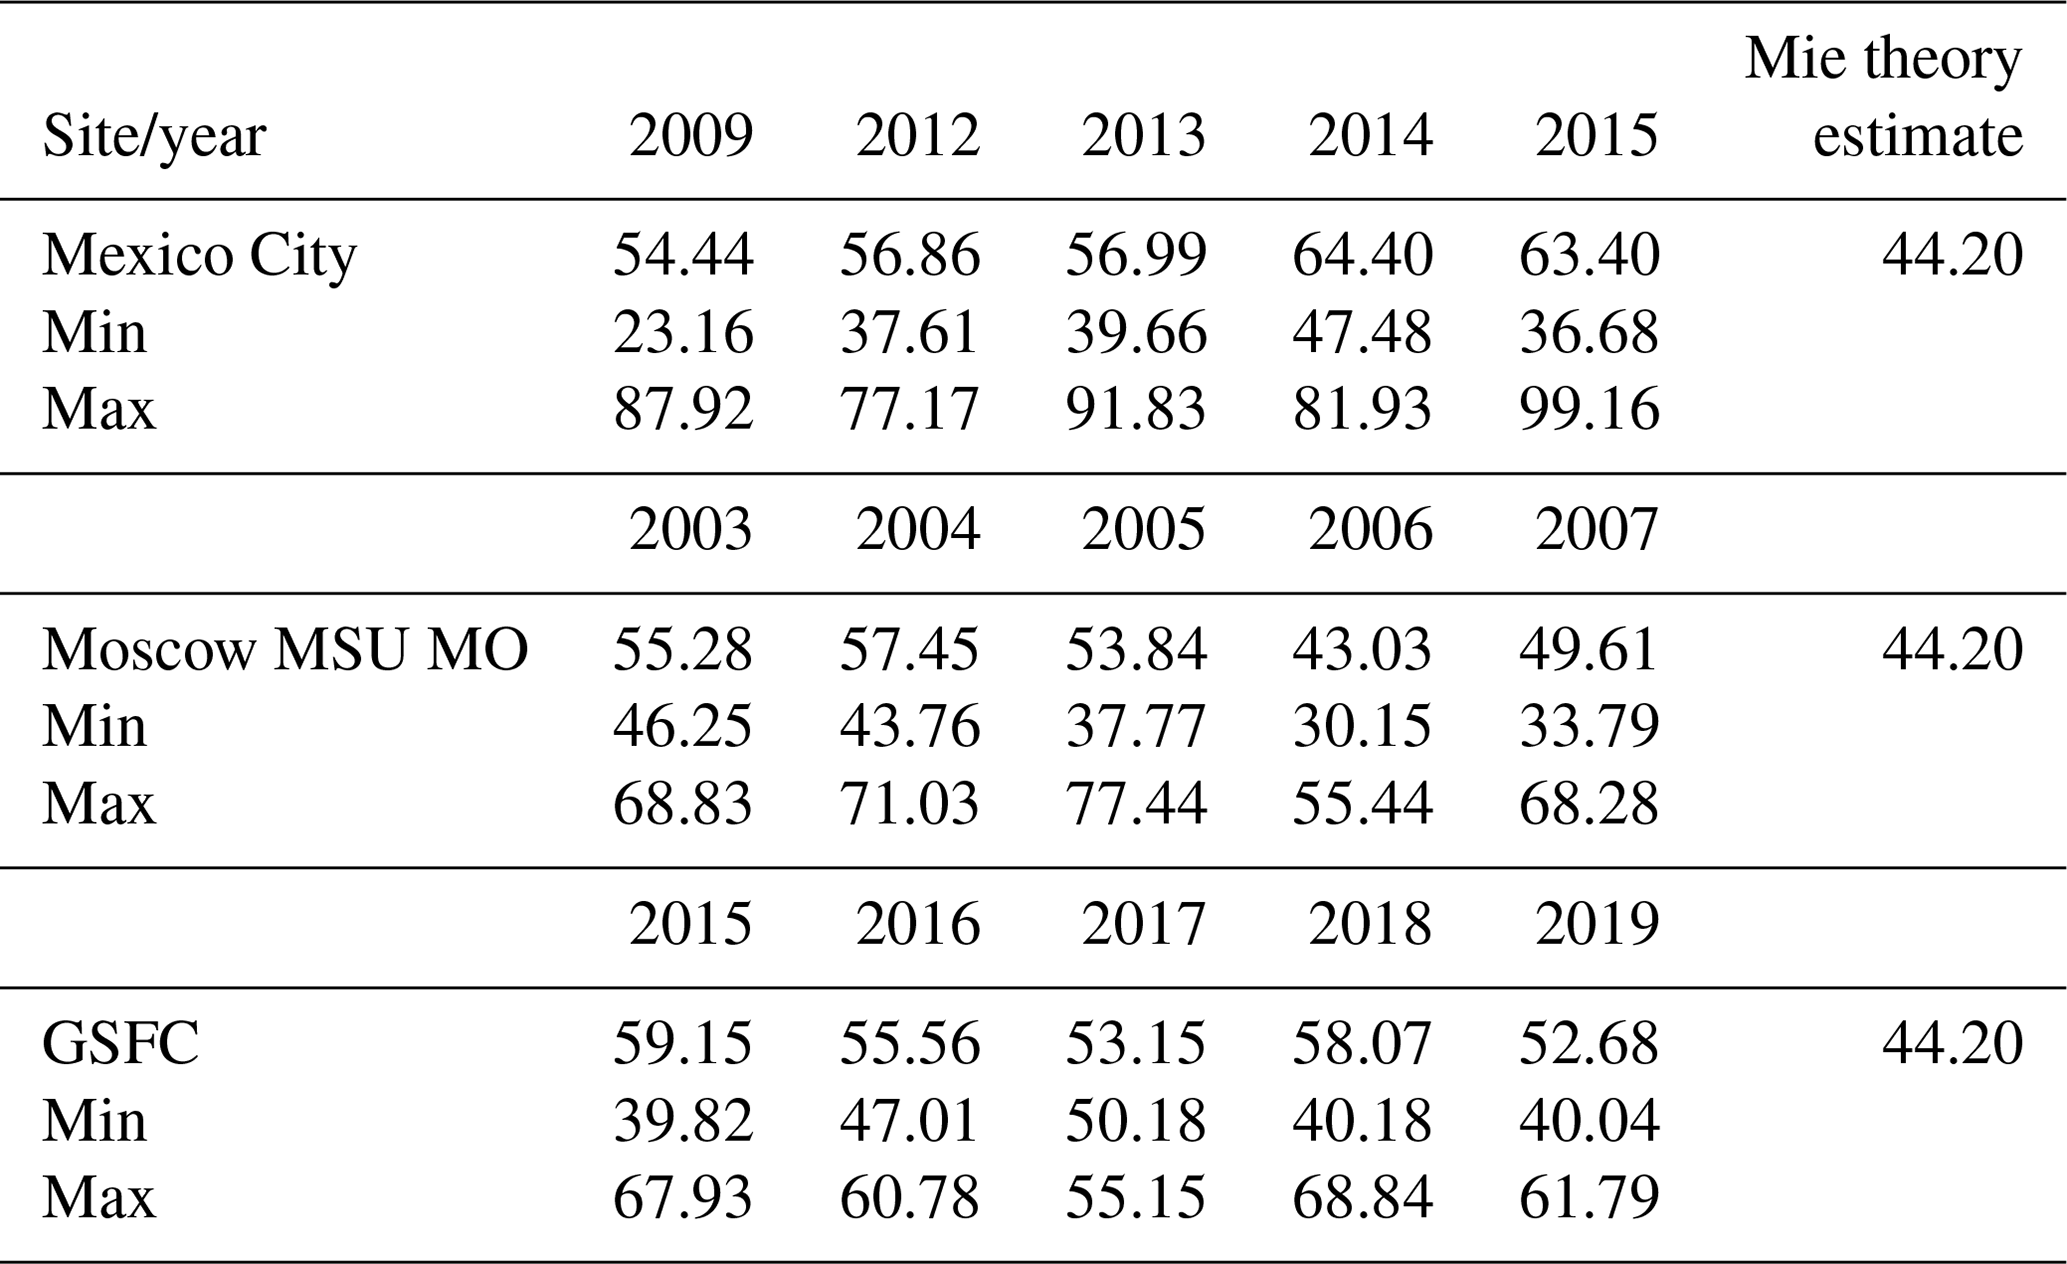
Table 11Lidar ratio (in sr) comparison between theoretical values estimated using Mie theory and in situ values using category-5 AERONET data.
∗ Only single data value is available.
Table 12Lidar ratio (in sr) comparison between theoretical values estimated using Mie theory and in situ values using category-6 AERONET data.
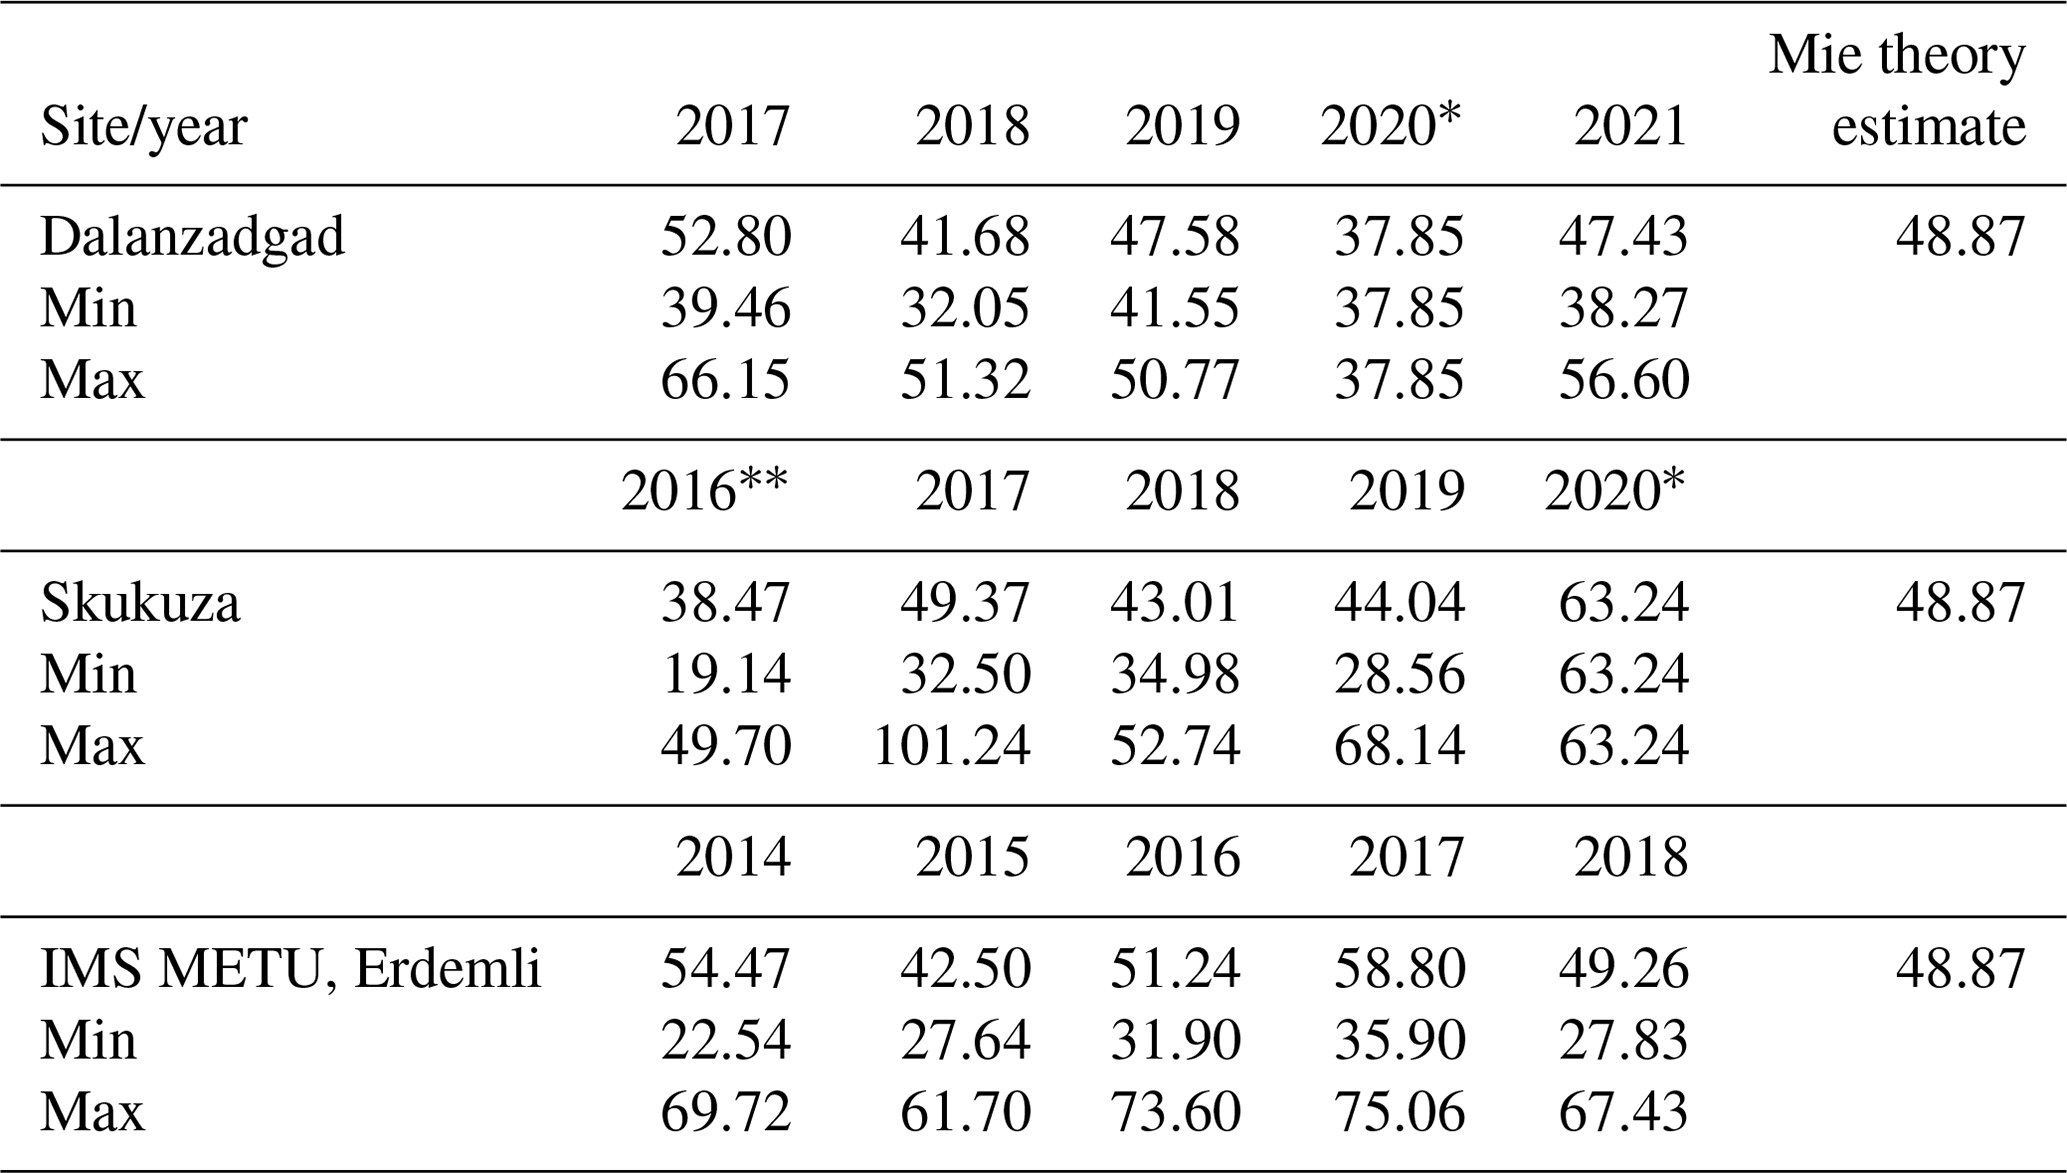
∗ Only single data value is available. The data has an outlier. Without outlier the value of LR is 43.30 sr.
The aerosol models derived using the cluster analysis by Omar et al. (2005) and their respective lidar ratios were used in lidar ratio selection and feature the detection algorithm of CALIOP-CALIPSO (Young and Vaughan, 2009). These aerosol models and their respective lidar ratios used in operational algorithms of CALIOP-CALIPSO are specified in Young and Vaughan (2009). These lidar ratios were subsequently updated in the V3 and V4 CALIOP-CALIPSO operational algorithms (Kim et al., 2018). The basis for the lidar ratio selection algorithm for the CALIOP-CALIPSO operational products has been the cluster analysis using the AERONET data; thus, the lidar ratios were estimated using Mie theory, which gives the physical basis for the lidar ratio selection algorithm.
Figures 1 and 2 show the distribution of extinction and backscattering coefficients for CALIPSO aerosol models at 532 and 1064 nm, respectively. The particle sizes were varied from 0.01 to 5 µm and the cut-off radius for fine particles was taken to be 1 µm for all CALIPSO aerosol models except clean marine aerosols in which case the fine particle radius cut-off was 0.6 µm. The maxima of extinction and backscattering coefficients at 532 and 1064 nm for all aerosol models except clean marine aerosols were observed between 0.07 to 0.4 µm. In the case of all aerosol models, it was observed that the contribution from fine particles was higher in magnitude compared to that from coarser particles at 532 and 1064 nm, except the clean marine model. In the case of clean marine aerosols at 1064 nm, the coarser particles were observed to contribute significantly in magnitude to the extinction coefficient as compared to fine particles producing a lidar ratio value of 71 sr.
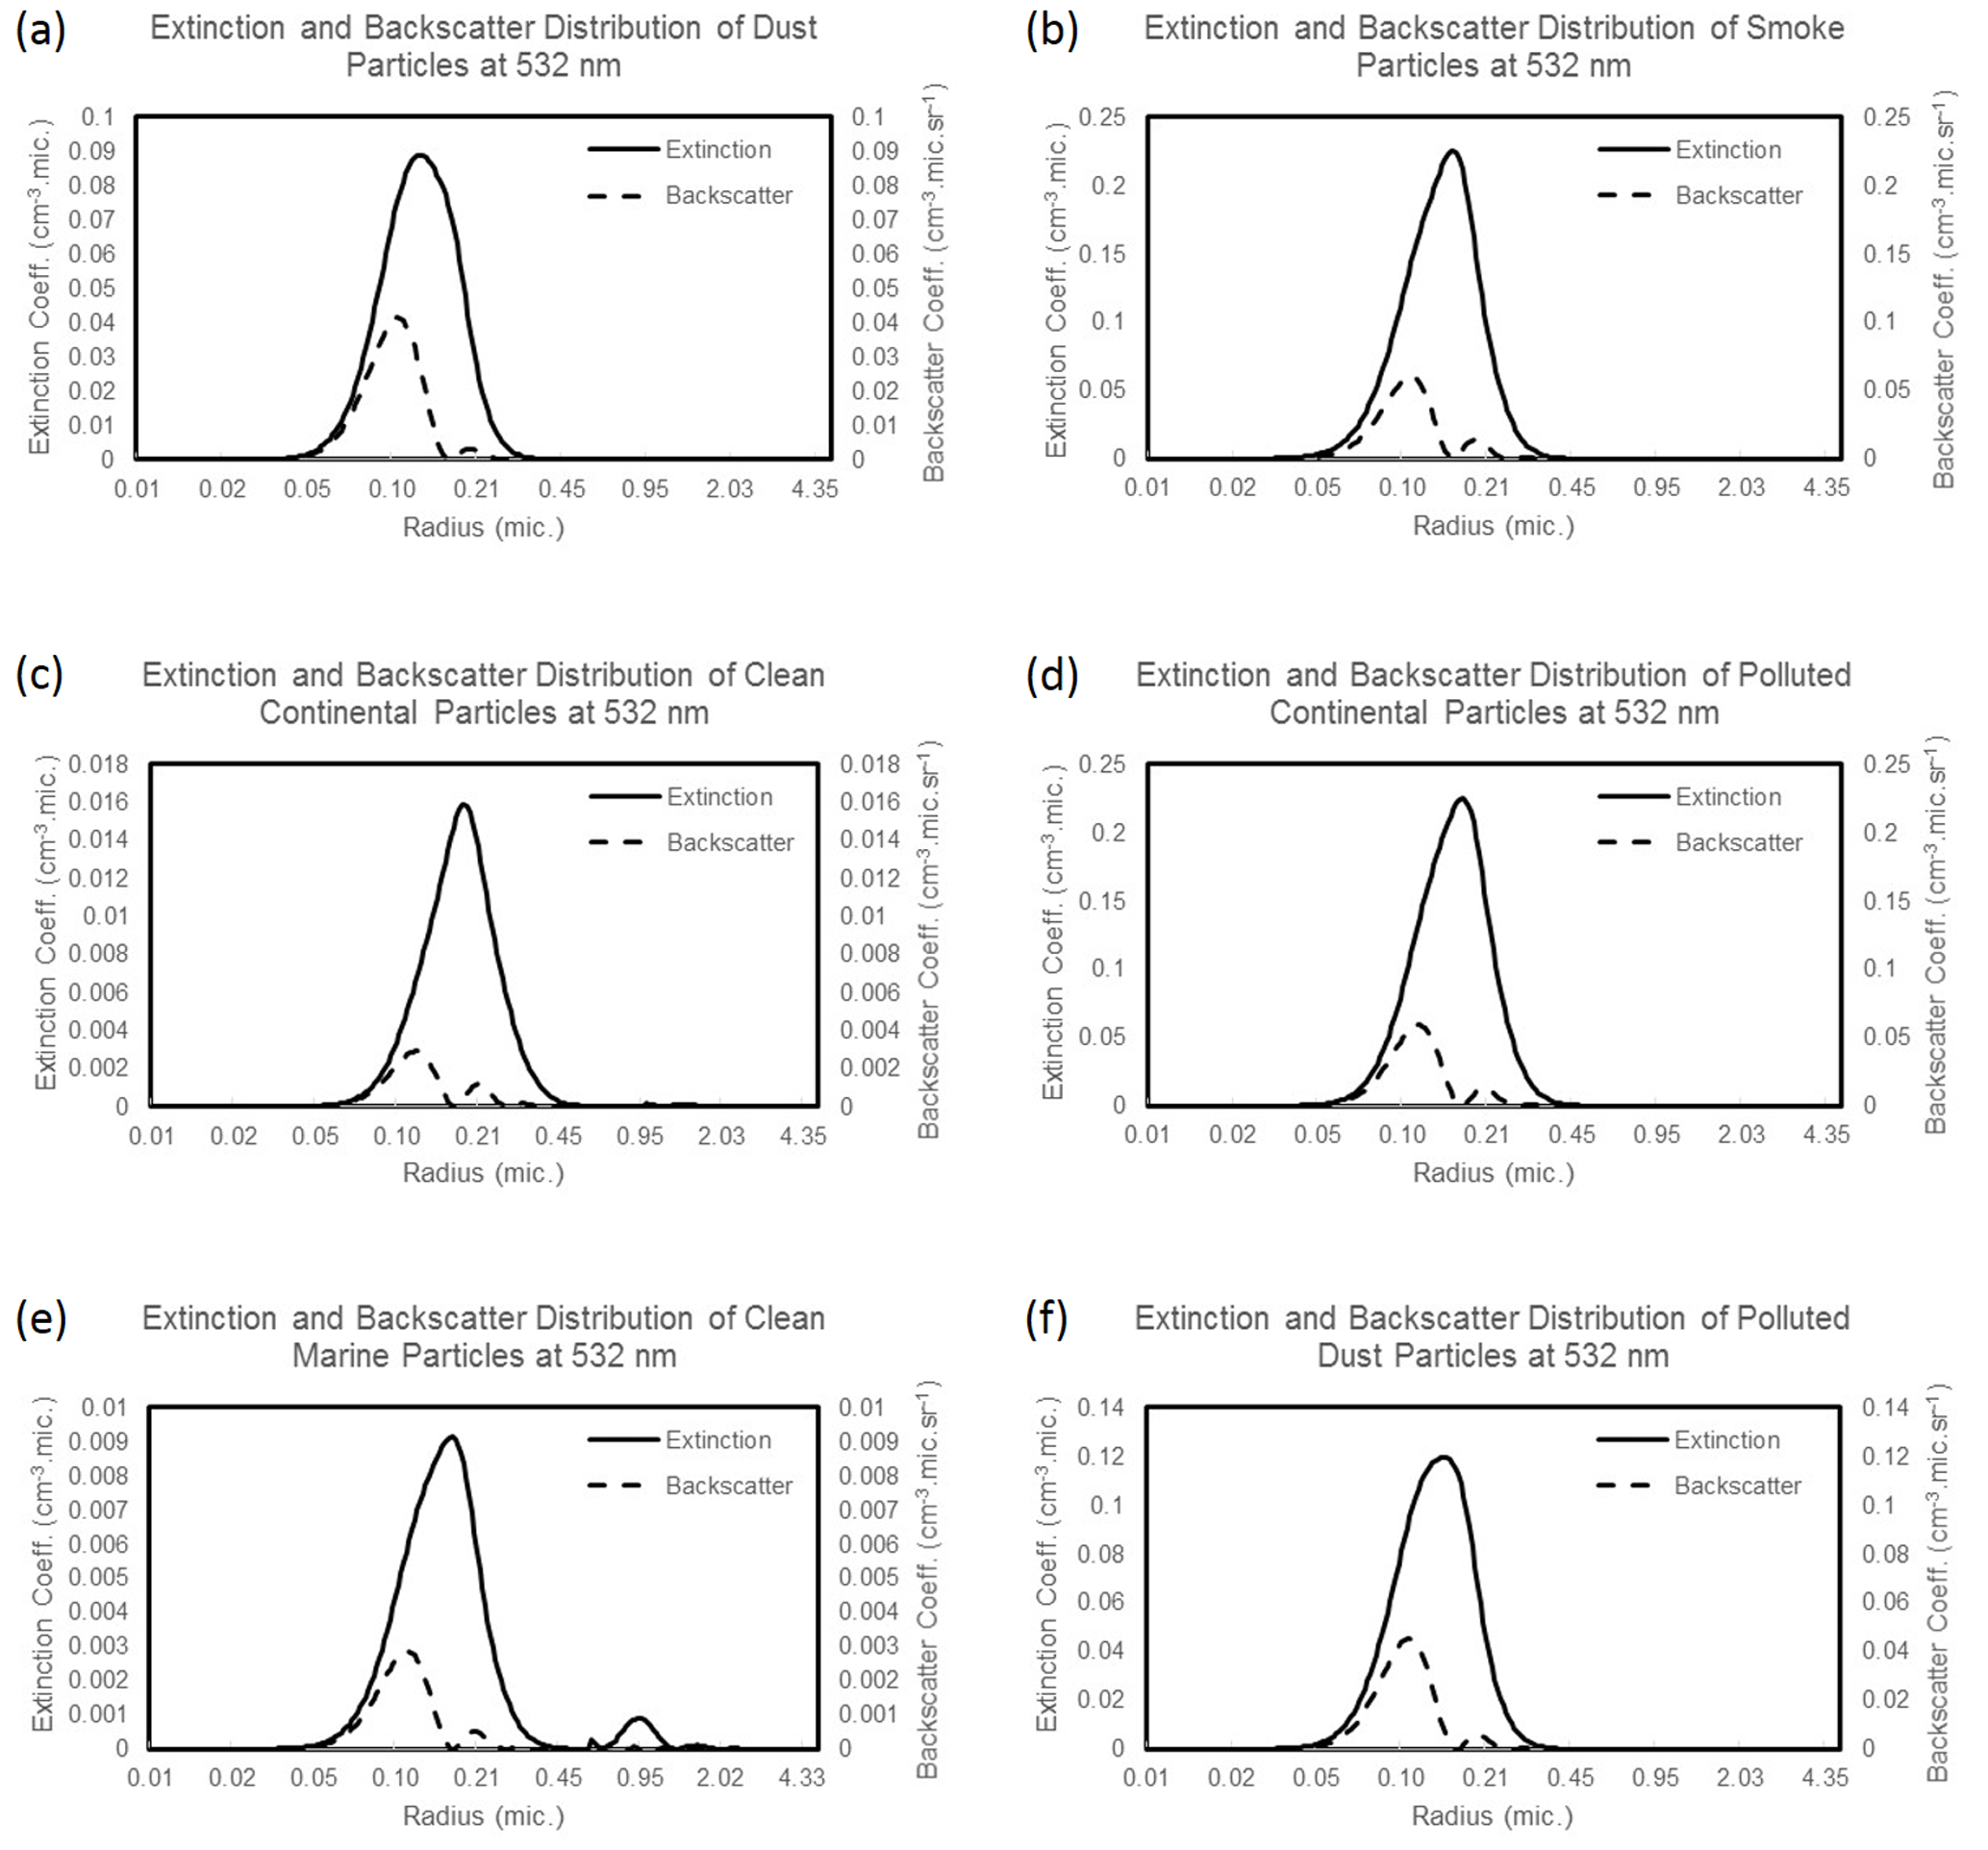
Figure 1Extinction and backscatter distribution at 532 nm of CALIPSO aerosol models, viz. (a) dust, (b) smoke, (c) clean continental, (d) polluted continental, (e) clean marine and (f) polluted dust.
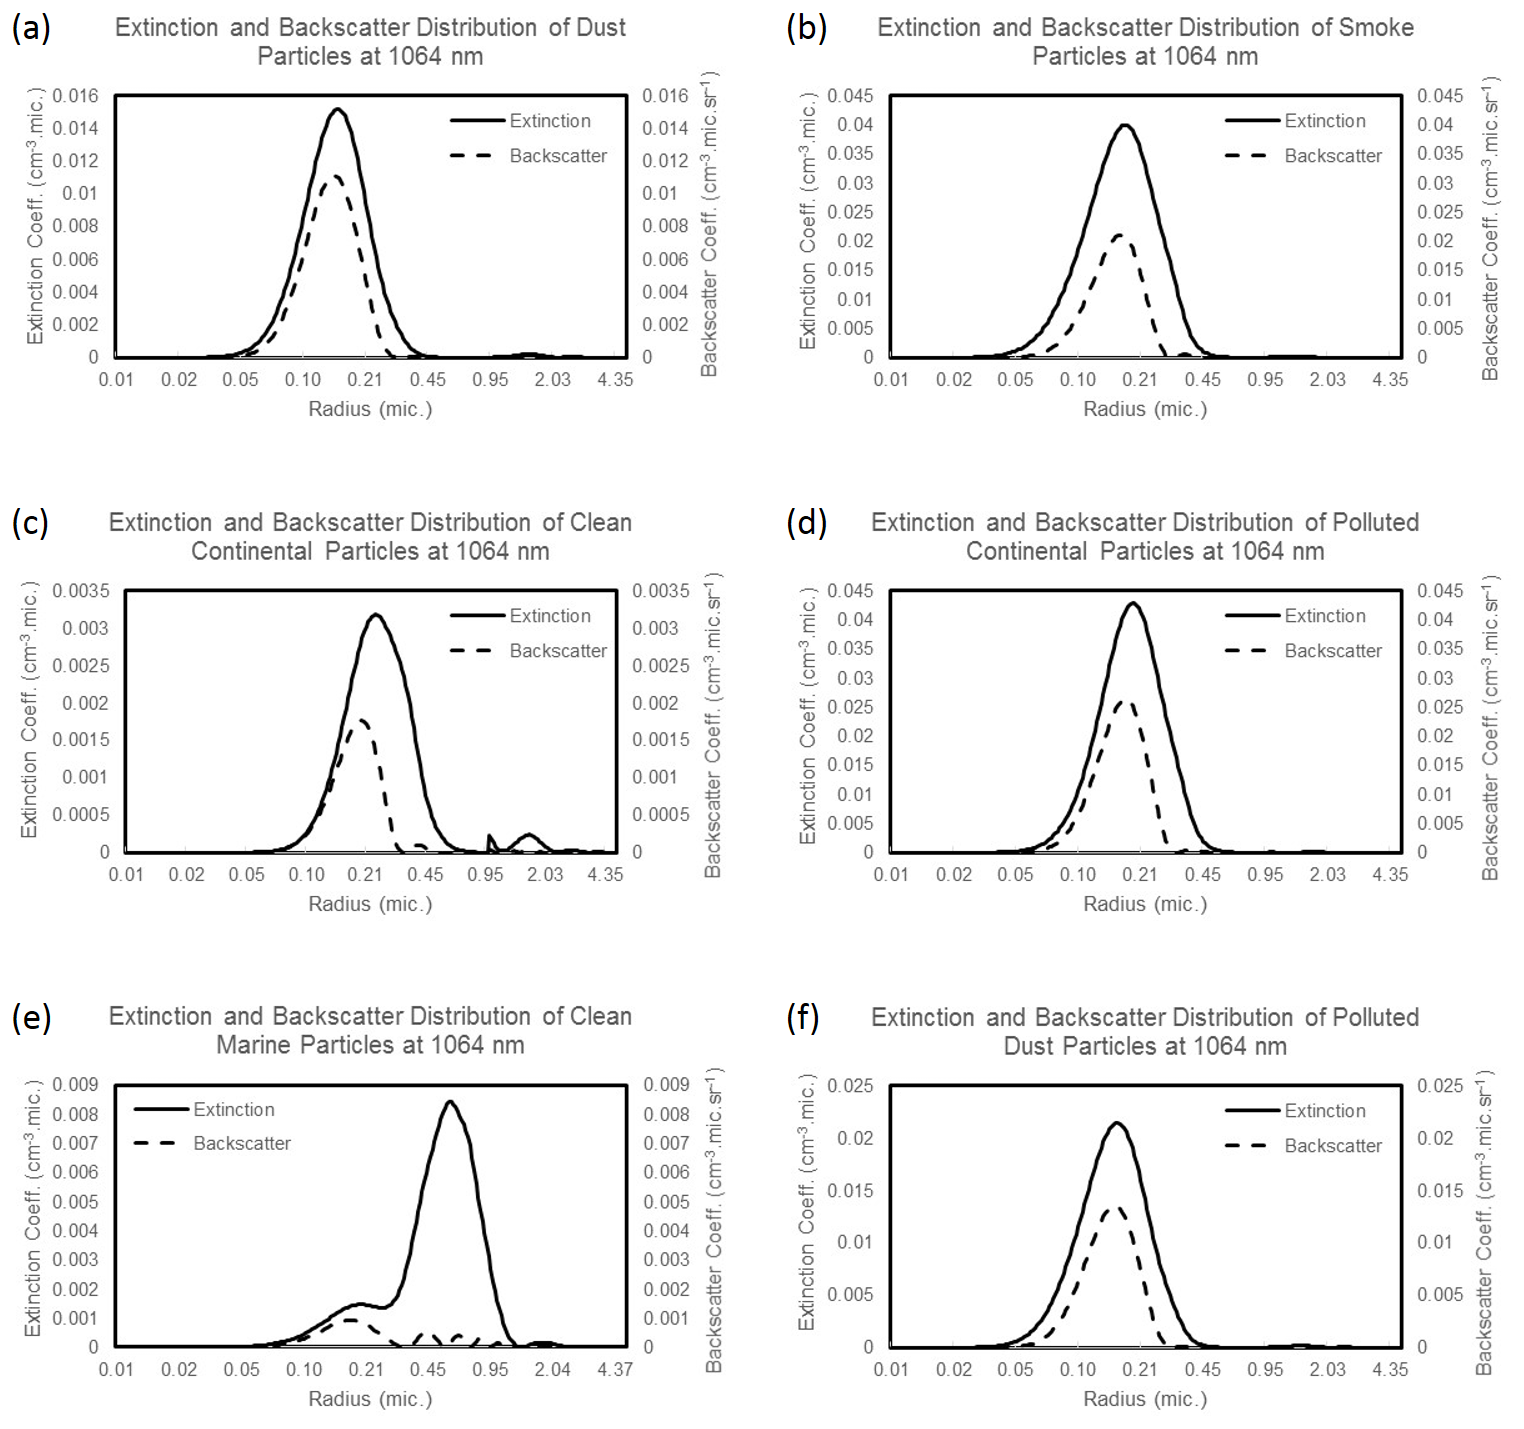
Figure 2Extinction and backscatter distribution at 1064 nm of CALIPSO aerosol models, viz. (a) dust, (b) smoke, (c) clean continental, (d) polluted continental, (e) clean marine and (f) polluted dust.
Table 13 shows the lidar ratio values estimated for the CALIPSO aerosol models specified in Omar et al. (2009) and its comparison with the lidar ratio values selected in various versions of the CALIOP-CALIPSO operational algorithms. It was observed that the lidar ratio values estimated using Mie theory in the present study comply with the lidar ratio values reported in the literature for the CALIPSO operational algorithms. Omar et al. (2006) reported that the lidar ratio for dust aerosols varied between 10 to 146 sr when AERONET station data were classified using cluster analysis. However, the lidar ratio value for dust aerosols proposed in this study at 1064 nm is lower than that used in the CALIPSO V4 operational algorithm. In the case of desert dust particles at 1064 nm, the variation up to 31 sr was allowed in the CALIPSO V4 operational algorithm, whereas the present study proposed a lidar ratio value of 20 sr for desert dust aerosols at 1064 nm. The desert dust lidar ratio at 1064 nm proposed for the CALIPSO aerosol model was observed to be consistent with the OPAC desert aerosol model in which case lidar ratio was observed to be centred on 23 sr. These results for desert aerosols at 1064 nm comply with those reported by Ackermann (1998), where the dry desert aerosol lidar ratio was lying just under 20 sr. The results for OPAC aerosol models are discussed in detail in the subsequent section. The dust aerosol lidar ratio values at 532 and 1064 nm were defined using the discrete-dipole approximation (DDA) technique in the CALIPSO operational algorithm initially (Omar et al., 2009). The DDA technique considers the non-sphericity of the dust particles (Kalashnikova and Sokolik, 2002), whereas Mie theory is quite applicable to spherical homogeneous particles. Thus, the lidar ratio value at 1064 nm was observed to be underestimated using Mie theory, which was also reported by Cattrall et al. (2005). Shin et al. (2018) have reported that the dust lidar ratio at 1020 nm was centred at 44, 40, 54, 36, and 35 sr for the Gobi, Arabian, Saharan, Great Basin and Great Victoria deserts, respectively. The dust lidar ratio at 1064 nm has thus shown a large variation temporally and geographically; thus, encouraging the utility of the proposed value of dust lidar ratio for retrieval of aerosol optical properties using CALIPSO data.
Table 13Lidar ratio (in sr) for aerosol models in the CALIPSO operational algorithm.
The lidar ratio proposed for the clean continental model at 532 nm in the CALIPSO V4 operational algorithm was 53±24 sr, allowing for the variation up to 77 sr. The Mie theory estimate for the clean continental model at 532 nm was centred on 85 sr, considering the refractive index of the centre cluster as provided in Omar et al. (2009). This lidar ratio value for the clean continental aerosol model was observed to be consistent with those reported in the literature. Omar et al. (2006) have reported that the clean continental lidar ratio value varied between 10 to 149 sr when estimated using AERONET station data, and Nehrir et al. (2011) have reported the variation in clean continental lidar ratio of 55–95 sr at 532 nm observed at Bozeman, Montana. The high value of lidar ratio at 532 nm for clean continental aerosols was observed due to high absorption by fine submicron (particles with radius <0.5 µm) particles. The variation in refractive index will also affect the lidar ratio value, which was evident when compared to OPAC aerosol models where the lidar ratio of clean continental aerosols was centred on 53 sr. Similar results were observed in case of clean marine aerosols at 532 nm.
The theoretically proposed value in the present study for clean marine aerosols at 532 nm was 57.31 sr. The absorption by the fine particles at 532 nm leads to the high value of lidar ratio. The theoretically estimated lidar ratio for clean marine aerosols at 532 nm was observed to be consistent with that reported in the literature. Masonis et al. (2003) have measured the clean marine aerosol lidar ratio as 60.1 sr at 532 nm during the Shoreline Environment Aerosol Study (SEAS) experiment. Dawson et al. (2015) have reported a variation of 10–90 sr in the lidar ratio of clean marine aerosols. Li et al. (2022) reported the median value of lidar ratio for clean marine aerosols of 60 sr at 532 nm. Li et al. (2022) have measured a peak value of 55 sr at 532 nm over the Bay of Bengal. The CALIPSO operational V3 algorithm allowed for variation up to 68 sr in lidar ratio of clean marine aerosols at 1064 nm, whereas the present study estimated the value of 71 sr for clean marine aerosols at 1064 nm. This high lidar ratio value for clean marine particles at 1064 nm was due to scattering by coarse supermicron (particles with radius >0.5 µm) particles, which was observed to be consistent, as reported in Masonis et al. (2003). Thus, the Mie theory-estimated lidar ratio values can provide a physical basis for the CALIPSO operational algorithms and can be used as a look-up table to derive the vertical extinction and backscatter particulate profiles using satellite data.
The theoretical approach proposed in this study to estimate lidar ratio for CALIPSO aerosol models was further validated through estimation of single-scattering albedo at 673 nm for the aerosol models classified using AERONET data as described in Table 2. The single-scattering albedo values for AERONET aerosol models, viz. category 1 to category 6, were estimated using the above presented Mie theory as 0.94, 0.82, 0.89, 0.93, 0.94 and 0.68, respectively. The single-scattering values at 673 nm for these AERONET aerosol models, viz. category 1 to category 6, were reported by Omar et al. (2005) as 0.93, 0.80, 0.88, 0.92, 0.93 and 0.72. The comparison between the theoretically estimated and literature reported single-scattering albedo values showed the percent absolute difference between 1.06 % to 5.56 %, which validates the proposed Mie theory for estimation of lidar ratio.
4.2 Lidar ratio for OPAC aerosol models defined in terms of constituent components
The lidar ratios were also estimated when aerosol models were specified in terms of different constituent compositions as used in OPAC. The aerosol models, viz. clean continental, average continental, polluted continental, urban, clean maritime, maritime tropical, polluted maritime, desert, arctic and Antarctic, were used in the present study to estimate the lidar ratio using Mie theory. The number mixing ratios as specified in the OPAC software by Hess et al. (1998) were used in the present study to define the size distribution of aerosols. The relative humidity causes an increase in size of a hygroscopic particle such as water-soluble, sea salt and sulfate particles. Thus, the backscattering and extinction profiles of these particles are significantly affected.
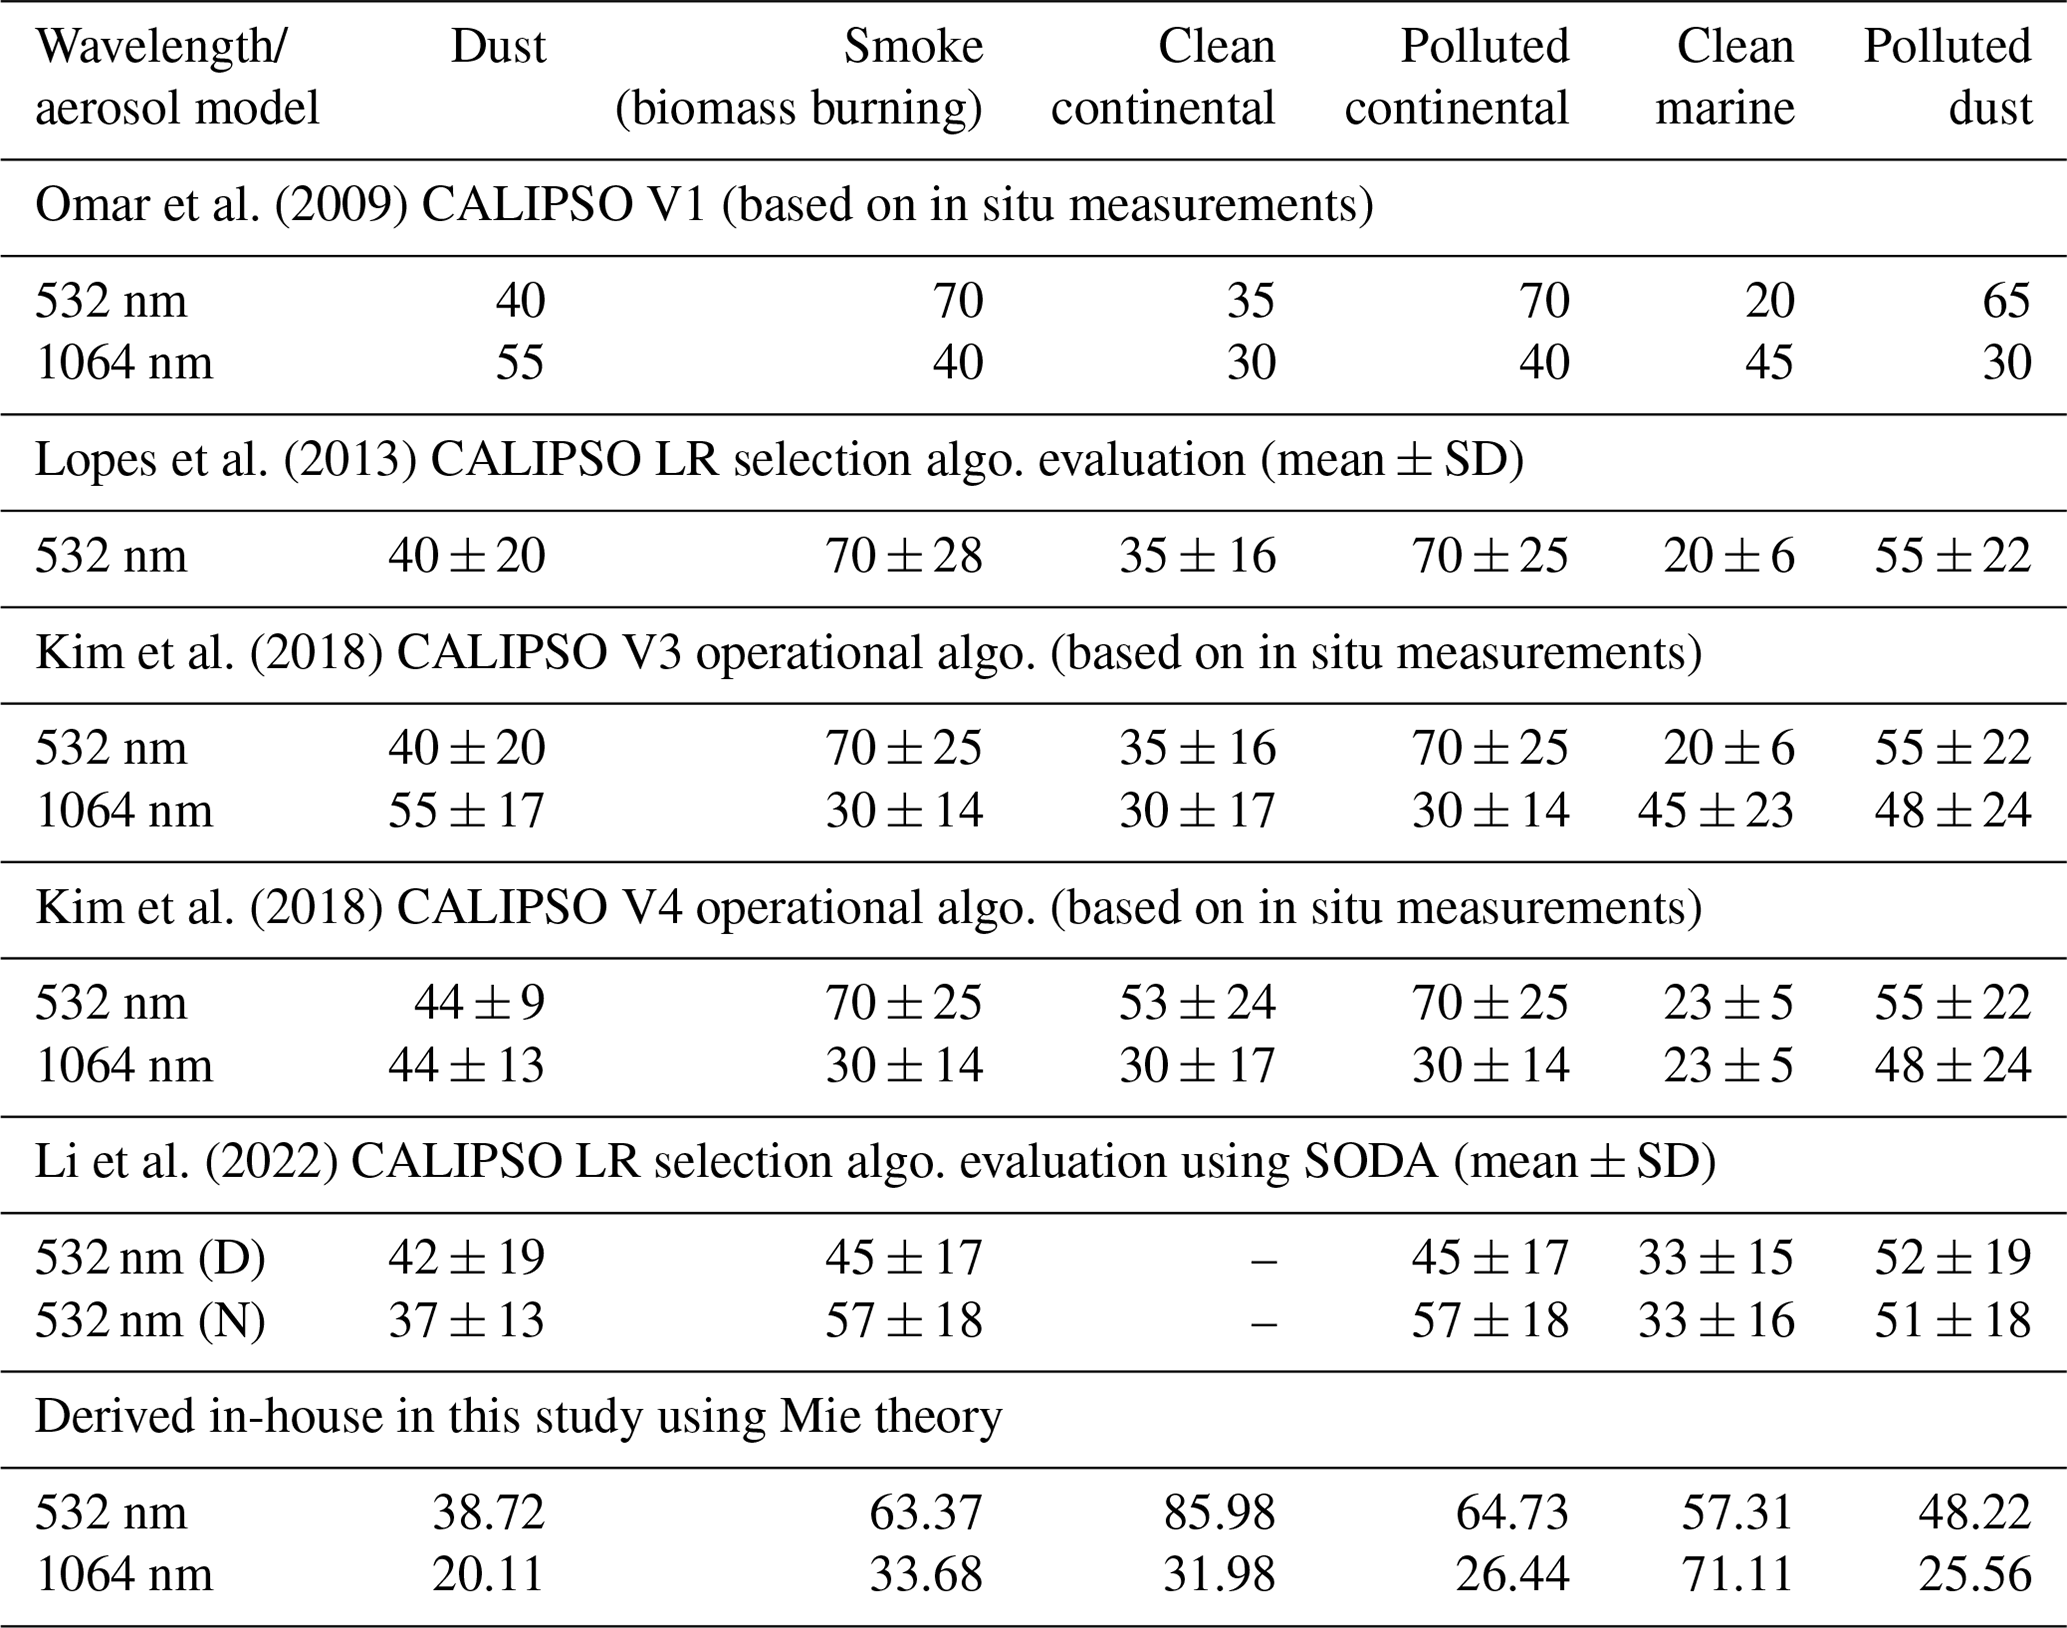
Figure 3 shows the variation in backscattering coefficient of the continental and maritime aerosols at 532 and 1064 nm. The backscattering coefficient of continental and maritime aerosols were observed to increase when relative humidity was increased from 0 % to 99 %. The increase in backscattering with relative humidity was considerably higher in clean continental and clean maritime aerosols as compared to polluted continental, urban, and polluted maritime aerosols at 532 and 1064 nm. Clean maritime and tropical maritime aerosols were observed to have equivalent backscattering coefficients due to their equivalent composition of water-soluble and sea salt particles.
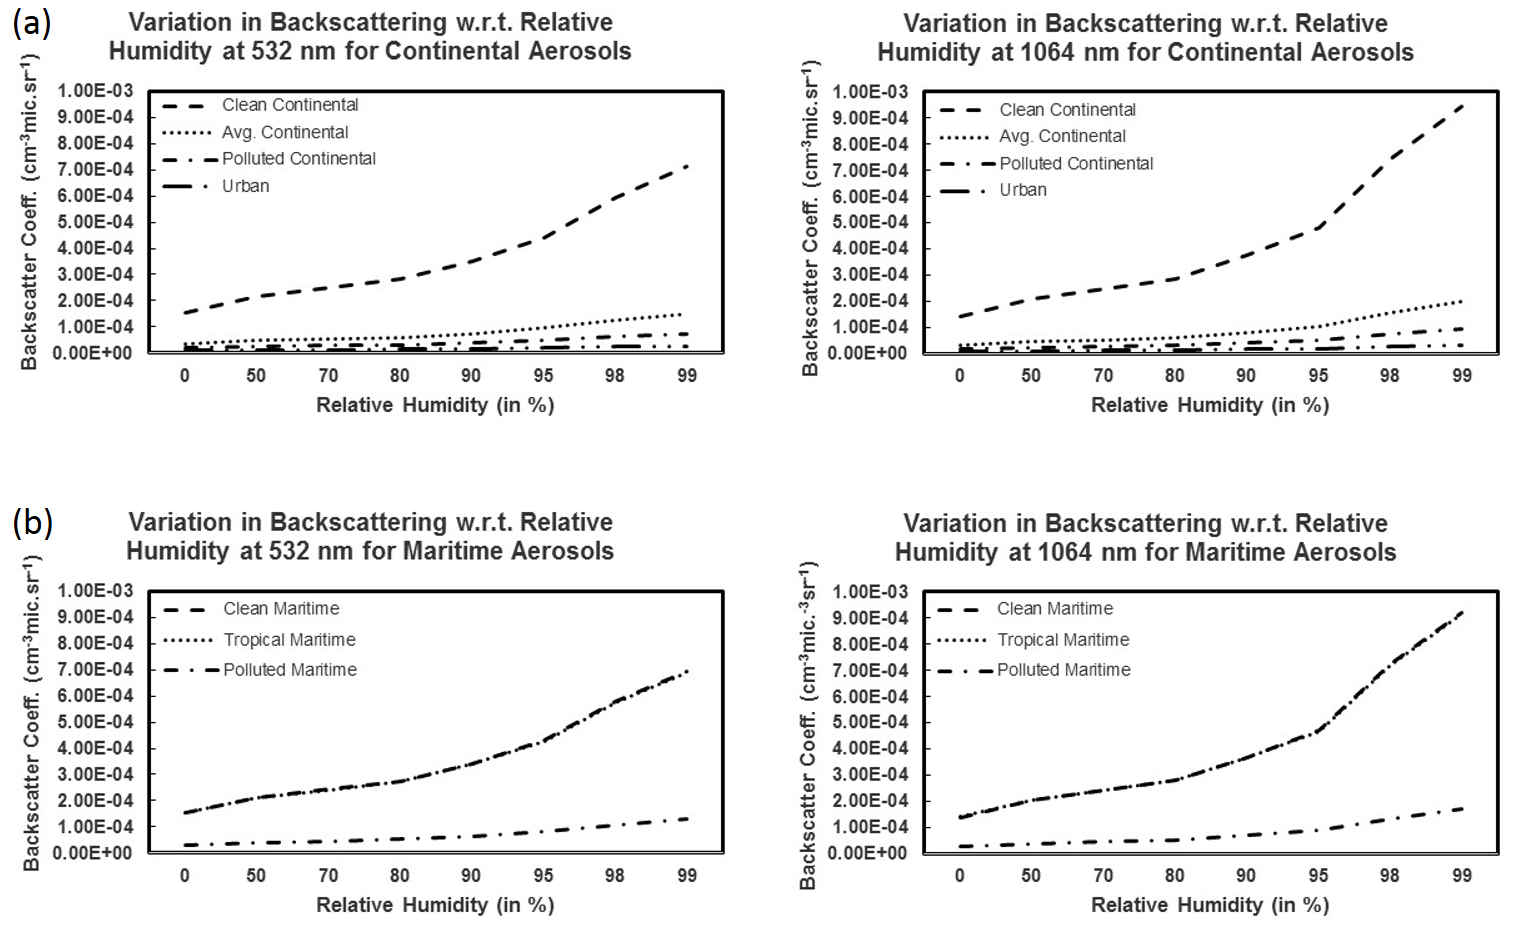
Figure 3Variation in backscattering coefficient with respect to relative humidity for (a) continental aerosols and (b) maritime aerosols at 532 and 1064 nm.
Figure 4 shows the variation in backscattering coefficients of the desert, arctic and Antarctic aerosol models at 532 and 1064 nm. The Antarctic aerosols showed a sharp and significant increase in their backscattering coefficients at 532 and 1064 nm. The increase in backscattering coefficients was observed to be higher at 1064 nm compared to 532 nm. According to Fig. 6c, both wavelengths show an increase in lidar ratio, but 532 nm has a more significant increase than 1064 nm. In addition, the lidar ratio values are lower at 1064 nm than at 532 nm. The increase in backscattering coefficient with relative humidity at 532 and 1064 nm will cause an increase or decrease in lidar ratio with respect to relative humidity, depending upon the rate at which the extinction and backscattering coefficients are increasing or decreasing.
Figure 4Variation in backscattering coefficient with respect to relative humidity for (a) desert aerosols and (b) arctic aerosols and (c) Antarctic aerosols at 532 and 1064 nm.
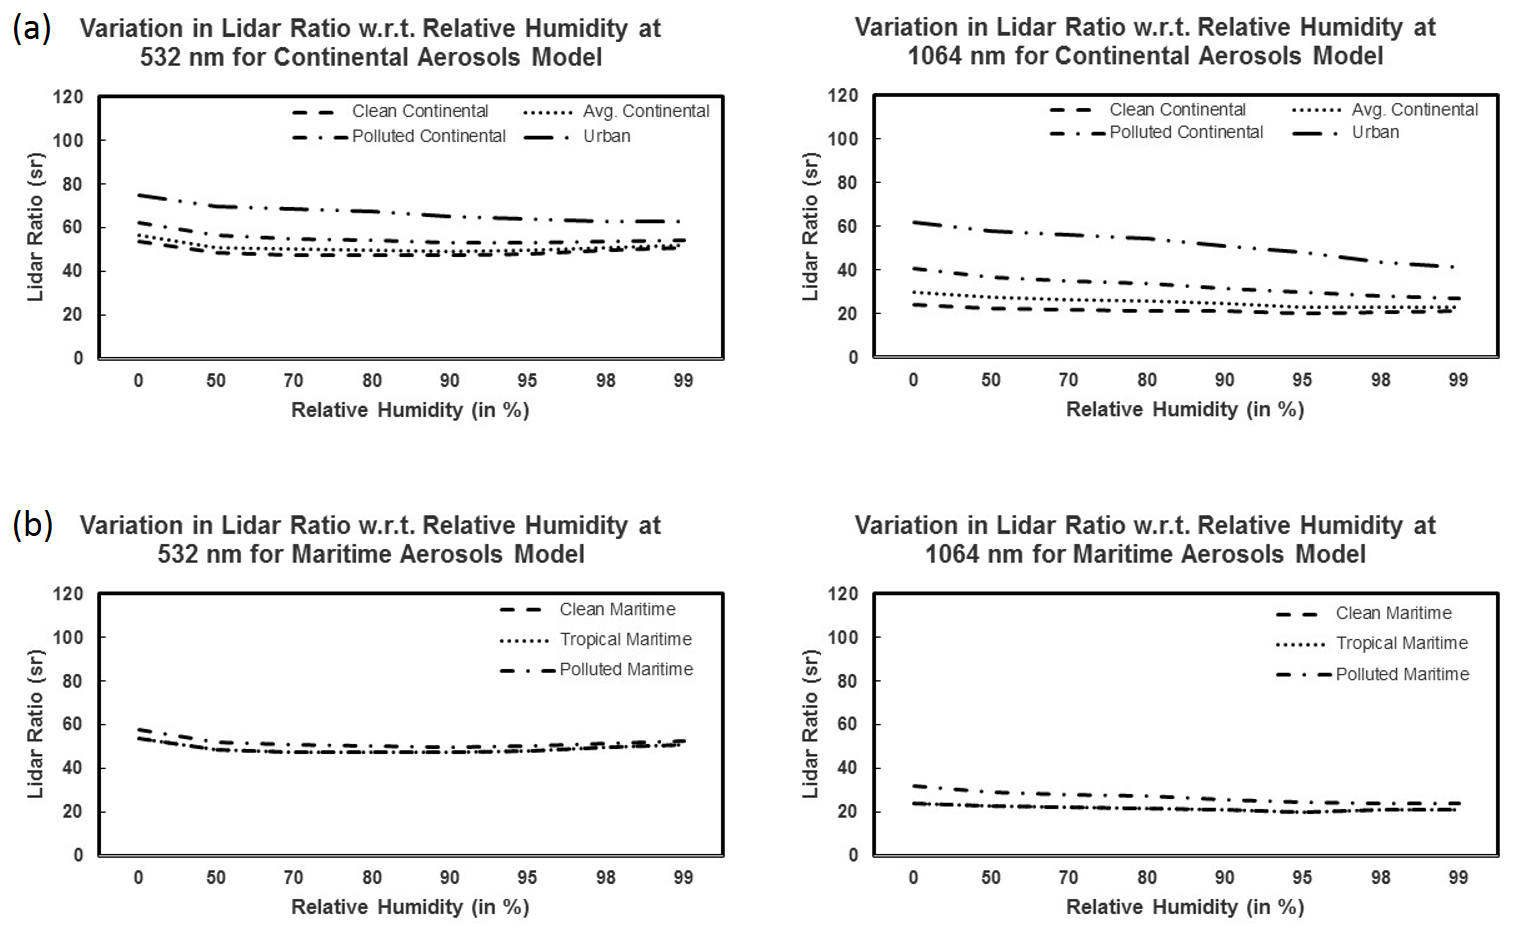
Figure 5Variation in lidar ratio with respect to relative humidity for (a) continental aerosols and (b) maritime aerosols at 532 and 1064 nm.
The variation in lidar ratios of continental and maritime aerosol models with reference to relative humidity at 532 and 1064 nm is as shown in Fig. 5. The lidar ratio showed an increase in values for polluted continental and polluted maritime aerosols over the clean continental and clean maritime aerosols. This increase was mainly observed due to greater contribution of soot particles in the polluted aerosols. Soot particles are submicron absorbing particles. Thus, with increasing number mixing ratio of soot particles in the polluted aerosols as compared to clean aerosols, the extinction coefficient increases, leading to an increase in lidar ratio values of polluted aerosols. An increase in lidar ratio values was observed at 532 and 1064 nm when relative humidity was increased from 80 % to 99 % in all types of continental and maritime aerosols, primarily due to increase in the size of water-soluble particles. The decrease in lidar ratio when relative humidity was increased from 0 % to 80 % was observed due to a decrease in lidar ratio of the water-soluble particles which are hygroscopic in nature. This decrease was primarily due to a significant decrease in the imaginary part of the refractive index of the water-soluble component due to relative humidity. The decrease in the imaginary part of refractive index of water-soluble particles leads to a decrease in absorption. As a result, the rate at which the extinction coefficient increases is either less than or equivalent to the rate at which the backscattering coefficient increases. This results in the decrease in lidar ratio of aerosols when relative humidity is increased from 0 % to 80 %. The increase in lidar ratio from 80 % to 99 % is primarily due to increase in size of water-soluble particles. Continental and maritime aerosols are dominated by water-soluble particles as defined in OPAC and thus an initial decrease and a gradual increase in lidar ratio values was observed at 532 and 1064 nm when relative humidity was increased from 0 % to 99 %.
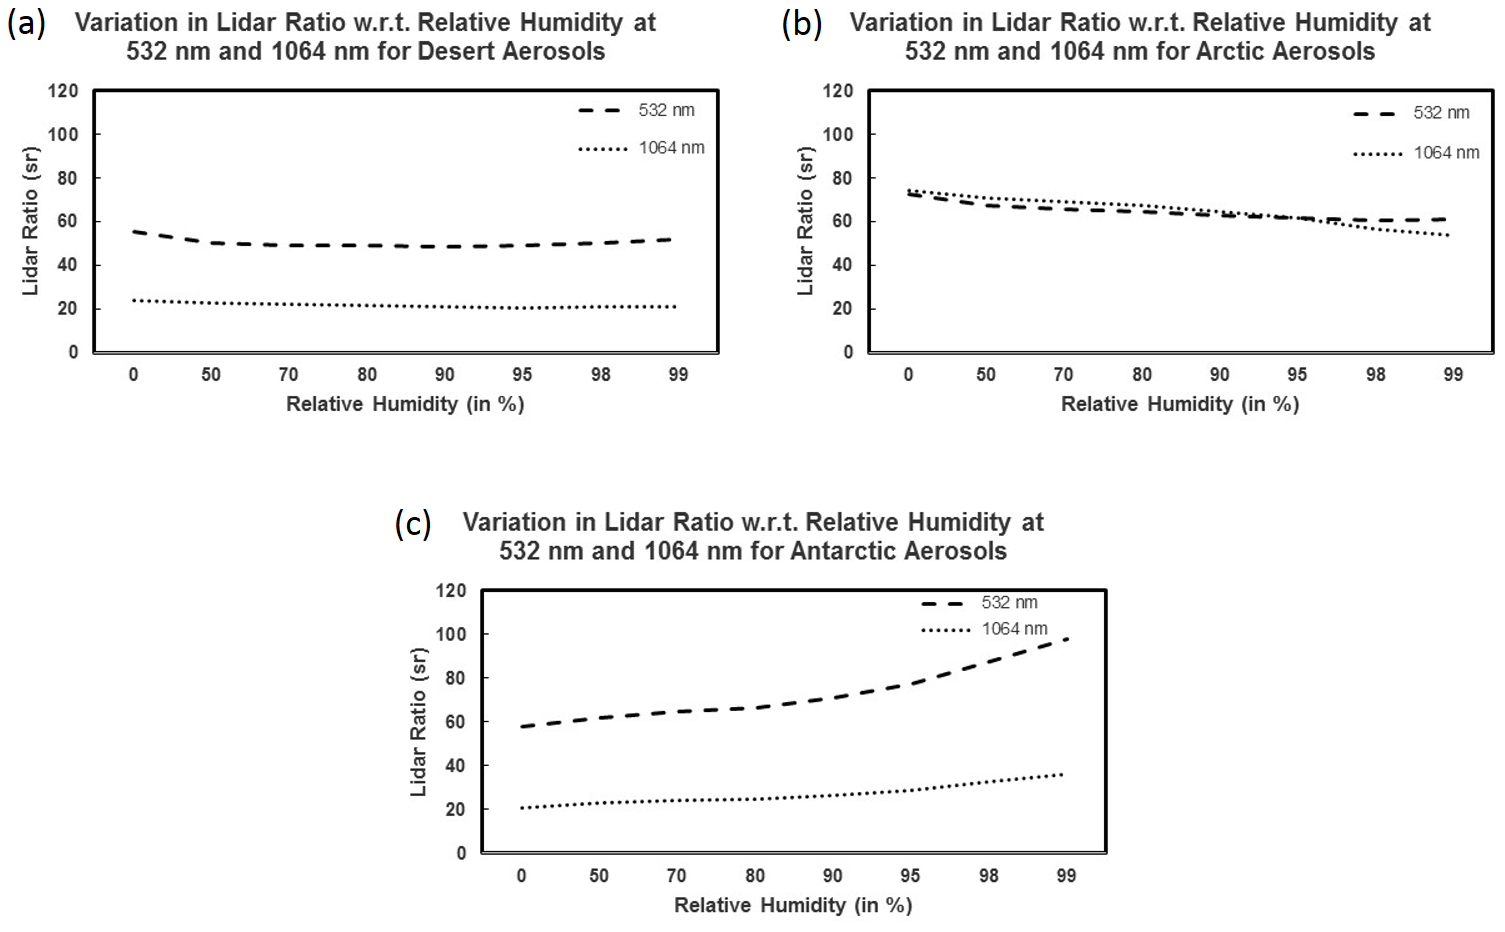
Figure 6Variation in lidar ratio with respect to relative humidity for (a) desert aerosols, (b) arctic aerosols, and (c) Antarctic aerosols at 532 and 1064 nm.
The lidar ratio values of the clean continental model and clean maritime aerosol models at 532 and 1064 nm were observed to be centred around 53 to 51 sr with varying relative humidity. This is mainly because of the composition of aerosol models as defined in OPAC. In both clean continental and clean maritime models, water-soluble particles were dominant, which are smaller in size as compared to the sea salt particles. However, in OPAC the number mixing ratio of sea salt particles, which are coarser particles, is very low as compared to finer water-soluble particles, which is not the case in the CALIPSO clean marine aerosol model. In the CALIPSO clean marine model, though coarser particles are more in proportion, their contribution to the backscattering and extinction coefficients was observed to be less in magnitude as compared to the fine particles at 532 nm. Thus, the resulting lidar ratio values for the CALIPSO aerosol model were centred on 57 sr at 532 nm, which is consistent with the results for the OPAC clean maritime aerosol model.
The urban aerosols showed a significant increase in the lidar ratio values at 532 and 1064 nm compared to other continental aerosols. The dry urban aerosols showed a lidar ratio values of 74.88 and 61.73 sr at 532 and 1064 nm, respectively, whereas dry clean continental aerosols exhibited the lidar ratio of 53.59 and 23.9 sr at 532 and 1064 nm, respectively. This significant increase in lidar ratio values of urban aerosols is primarily due to scattering soot particles. Insoluble particles hardly have any impact on lidar ratio values of urban and continental aerosols due to their very small composition. Similar results were observed when polluted maritime particles were compared to the clean maritime particles.
The variation in lidar ratios of desert, arctic and Antarctic aerosols with respect to relative humidity is as shown in Fig. 6. The lidar ratio values at 532 nm were observed to be greater than those at 1064 nm values for desert and Antarctic aerosols. The dry desert dust lidar ratio at 532 nm was observed to be 55.32 sr. This result complies with the values for desert dust lidar ratio at 532 nm reported in the literature by Muller et al. (2007), Omar et al. (2009), Kim et al. (2018) and Li et al. (2022). The lidar ratio values showed a decrease with relative humidity except the lidar ratio values of Antarctic aerosols at 532 and 1064 nm. The model of arctic aerosols that is used in the present study is for the spring season when the arctic aerosols are mainly the soot particles. Thus, a decrease in lidar ratio values with relative humidity was observed in arctic aerosols as it was in polluted continental and urban aerosols at 1064 nm.
The lidar ratio of dry Antarctic aerosols was observed to be 57.73 sr at 532 nm and 20.90 sr at 1064 nm. The summertime model of Antarctic aerosols as defined in OPAC was used in the present study where the Antarctic aerosols are dominated by the sulfate particles (d'Almeida et al., 1991; Hess et al., 1998). Sulfate particles are hygroscopic in nature with significantly large sizes as compared to water-soluble particles. The imaginary part of the refractive index of sulfate particles is considerably small as compared to water-soluble particles at 532 and 1064 nm. Thus, a sharp increase in lidar ratio of sulfate particles was observed when relative humidity was increased from 0 % to 99 % as opposed to continental, maritime or desert aerosol models.
This paper presented a complex theoretical approach for estimating lidar ratio through Mie theory using CALIPSO and OPAC aerosol models. The lidar ratios were estimated at three wavelengths, viz. 532, 673 and 1064 nm. Mie theory-estimated lidar ratios at 673 nm were compared with AERONET data-derived lidar ratios at 675 nm, and Mie theory-estimated lidar ratios at 673 nm were observed to lie between the minima and maxima of the AERONET data-derived lidar ratios at 675 nm. Mie theory-estimated lidar ratio values for CALIPSO aerosol models were in good agreement with those reported in the literature for the CALIPSO operational algorithm. Thus, theoretically estimated lidar ratios for CALIPSO aerosol models may be used in future for CALIPSO operational algorithms. CALIPSO aerosol models were specified in terms of number mixing ratio of the fine and coarse particles instead of component particle type, and fine particles were observed to have more significant contribution towards extinction and backscattering coefficient despite their low mixing ratio as compared to coarse particles. Thus, Mie theory-derived lidar ratio values provide the physical basis for the lidar ratio selection algorithm for derivation of vertical extinction and backscatter particulate profiles using CALIPSO data.
The dependence of lidar ratio with relative humidity was analysed using OPAC aerosol models including arctic and Antarctic aerosols where each aerosol type was identified with the corresponding number mixing ratio of the component particles. The lidar ratio was observed to decrease when relative humidity was increased from 0 % to 80 %, and a gradual increase in lidar ratio was observed when relative humidity was increased further to 99 %. This phenomenon is the result of the dominance of hygroscopic water-soluble particles constituting clean continental, clean marine, tropical continental and desert aerosols. The increase in number mixing ratio of soot particles showed an overall increase in the lidar ratio values of polluted continental, urban and polluted marine aerosols over clean continental and clean marine particles. The soot particles dominate the urban aerosols and arctic aerosols, which are non-hygroscopic fine particles. Thus, a decrease in lidar ratio of urban and arctic aerosols was observed with respect to relative humidity, and an increase in the backscattering coefficient of urban and arctic aerosols was observed with relative humidity due to the contribution from the hygroscopic water-soluble particles that grow in size in the presence of water vapour in the atmosphere. In the case of Antarctic aerosols, the lidar ratio was observed to increase with respect to relative humidity due to hygroscopic sulfate particles that backscattered heavily in the presence of water vapour.
The method presented in this study to estimate the lidar ratio using Mie theory is valid only for spherical, isotropic, non-hygroscopic particles and thus there can be possible errors occurring in the lidar ratio values, especially when the aerosols are anisotropic and hygroscopic in nature. Thus, there is future scope for the present study to extend it to theoretical estimation of lidar ratio in the case of hygroscopic and anisotropic non-homogeneous particles.
A C-language code was generated in-house to compute the extinction and backscattering efficiency using Mie theory. No external codes were used in this study. This code is not publicly available due to the secrecy policy of Space Applications Centre, ISRO, India.
The AERONET data used in this study are available at https://aeronet.gsfc.nasa.gov/new_web/webtool_inv_v3.html (NASA, 2023).
RAC: conceptualization of the study, C-program coding, data download and analysis, and manuscript writing. MRP: designing of the study and manuscript, modelling of the lidar ratio, and overall guidance and supervision.
The contact author has declared that none of the authors has any competing interests.
Publisher's note: Copernicus Publications remains neutral with regard to jurisdictional claims made in the text, published maps, institutional affiliations, or any other geographical representation in this paper. While Copernicus Publications makes every effort to include appropriate place names, the final responsibility lies with the authors.
The authors are thankful to Nilesh M. Desai, Director Space Applications Centre (SAC), ISRO; Rashmi Sharma, DD-EPSA/SAC; and Bimal K. Bhattacharya, GD-AESG/EPSA/SAC for their support and encouragement to carry out this work. The authors are thankful to all those who directly and indirectly supported the realization of this activity. This research is carried out under SAC, ISRO's TDP/R&D programme.
This paper was edited by Alexander Kokhanovsky and reviewed by five anonymous referees.
Ackermann, J.: The Extinction-to-Backscatter Ratio of Tropospheric Aerosol: A Numerical Study, J. Atmos. Ocean. Tech., 15, 1043–1050, 1998.
Anderson, T. L., Masonis, S. J., Covert, D. S., Charlson, R. J., and Rood, M. J.: In situ measurement of the Aerosol Extinction-to-Backscatter Ratio at a Polluted Continental Site, J. Geophys. Res., 105, 26907–26915, 2000.
Ansmann, A., Wagner, F., Müller, D., Althausen, D., Herber, A., von Hoyningen-Huene, W., and Wandinger, U.: European Pollution Outbreaks during ACE 2: Optical Particle Properties Inferred from Multiwavelength Lidar and Star-Sun Photometry, J. Geophys. Res.-Atmos., 107, 8–14, 2002.
Bohren, C. F. and Huffman, D. R.: Absorption and Scattering of Light by Small Particles, Wiley and Sons, 530 pp., ISBN 0471293407, 1983.
Cattrall, C., Reagan, J., Thome, K., and Dubovik, O.: Variability of Aerosol and Spectral Lidar and Backscatter and Extinction Ratios of Key Aerosol Types Derived from Selected Aerosol Robotic Network Locations, J. Geophys. Res.-Atmos., 110, D10S11, https://doi.org/10.1029/2004JD005124, 2005.
d'Almeida, G., Koepke, P., and Shettle, E. P.: Atmospheric Aerosols: Global Climatology and Radiative Characteristics, A. Deepak, 561 pp., ISBN 0-937194-22-0, 1991.
Dawson, K. W., Meskhidze, N., Josset, D., and Gassó, S.: Spaceborne observations of the lidar ratio of marine aerosols, Atmos. Chem. Phys., 15, 3241–3255, https://doi.org/10.5194/acp-15-3241-2015, 2015.
Düsing, S., Ansmann, A., Baars, H., Corbin, J. C., Denjean, C., Gysel-Beer, M., Müller, T., Poulain, L., Siebert, H., Spindler, G., Tuch, T., Wehner, B., and Wiedensohler, A.: Measurement report: Comparison of airborne, in situ measured, lidar-based, and modeled aerosol optical properties in the central European background – identifying sources of deviations, Atmos. Chem. Phys., 21, 16745–16773, https://doi.org/10.5194/acp-21-16745-2021, 2021.
Hess, M., Koepke, P., and Schult, I.: Optical Properties of Aerosols and Clouds: The Software Package OPAC, B. Am. Meteorol. Soc., 79, 831–844, 1998.
Hunt, W. H., Winker, D. M., Vaughan, M. A., Powell, K. A., Lucker, P. L., and Weimer, C.: CALIPSO lidar description and performance assessment, J. Atmos. Ocean. Tech., 26, 1214–1228, https://doi.org/10.1175/2009JTECHA1223.1, 2009.
Kalashnikova, O. V. and Sokolik, I. N.: Importance of Shapes and Compositions of Wind-blown Dust Particles for Remote Sensing at Solar Wavelengths, Geophys. Res. Lett., 29, 1398, 2002.
Kim, M.-H., Omar, A. H., Tackett, J. L., Vaughan, M. A., Winker, D. M., Trepte, C. R., Hu, Y., Liu, Z., Poole, L. R., Pitts, M. C., Kar, J., and Magill, B. E.: The CALIPSO version 4 automated aerosol classification and lidar ratio selection algorithm, Atmos. Meas. Tech., 11, 6107–6135, https://doi.org/10.5194/amt-11-6107-2018, 2018.
Kim, M.-H., Kim, S.-W., and Omar, A. H.: Dust lidar ratios retrieved from the CALIOP measurements using the MODIS AOD as a constraint, Rem. Sens., 12, 251, https://doi.org/10.3390/rs12020251, 2020.
Li, Z., Painemal, D., Schuster, G., Clayton, M., Ferrare, R., Vaughan, M., Josset, D., Kar, J., and Trepte, C.: Assessment of tropospheric CALIPSO Version 4.2 aerosol types over the ocean using independent CALIPSO–SODA lidar ratios, Atmos. Meas. Tech., 15, 2745–2766, https://doi.org/10.5194/amt-15-2745-2022, 2022.
Lopes, F. J. S., Landulfo, E., and Vaughan, M. A.: Evaluating CALIPSO's 532 nm lidar ratio selection algorithm using AERONET sun photometers in Brazil, Atmos. Meas. Tech., 6, 3281–3299, https://doi.org/10.5194/amt-6-3281-2013, 2013.
Masonis, S. J., Anderson, T. L., Covert, D. S., Kapustin, V., Clarke, A. D., Howell, S., and Moore, K.: A Study of the Extinction-to-Backscatter Ratio of Marine Aerosol during the Shoreline Environment Aerosol Study, J. Atmos. Ocean. Tech., 20, 1388–1402, 2003.
Muller, D., Ansmann, A., Mattis, I., Tesche, M., Wandinger, U., Althausen, D., and Pisani, G.: Aerosol-type-dependent Lidar Ratios Observed with Raman Lidar, J. Geophys. Res., 112, D16202, https://doi.org/10.1029/2006JD008292, 2007.
NASA: AERONET, Aerosol Inversions, NASA [data set], https://aeronet.gsfc.nasa.gov/new_web/webtool_inv_v3.html (last access: 2 December 2022), 2023.
Nehrir, A. R., Repasky, K. S., Reagan, J. A., and Carlsten, J. L.: Optical Characterisation of Continental and Biomass-Burning Aerosols over Bozeman, Montana: A Case Study of the Aerosol Direct Effect, J. Geophys. Res.-Atmos., 116, D201201, https://doi.org/10.1029/2011JD016016, 2011.
Omar, A. H., Won, J. G., Winker, D. M., Yoon, S. C., Dubovik, O., and McCormick, M. P.: Development of Global Aerosol Models using Cluster Analysis of Aerosol Robotic Network (AERONET) Measurements, J. Geophys. Res., 110, 1–14, 2005.
Omar, A. H., Winker, D. M., and Vaughan, M. A.: Selection Algorithm for CALIPSO Lidar Aerosol Extinction-to-Backscatter Ratio, Proc. SPIE 6367, Lidar Technologies, Techniques and Measurements for Atmospheric Remote Sensing II, 63670M, Stockholm, Sweden, 3 October 2006, https://doi.org/10.1117/12.689868, 2006.
Omar, A. H., Winker, D. M., Kittaka, C., Vaughan, M. A., Liu, Z., Hu, Y., Trepte, C. R., Rogers, R. R., Ferrare, R. A., Lee, K. P., Kuehn, R. E., and Hostetler, C. A.: The CALIPSO Automated Aerosol Classification and Lidar Ratio Selection Algorithm, J. Atmos. Ocean. Tech., 26, 1994–2014, 2009.
Salemink, H., Schotanus, P., and Bergwerff, J. B.: Quantitative Lidar at 532 nm for Vertical Extinction Profiles in the Lidar Solution, Appl. Phys. B, 34, 187–189, 1984.
Shin, S.-K., Tesche, M., Kim, K., Kezoudi, M., Tatarov, B., Müller, D., and Noh, Y.: On the spectral depolarisation and lidar ratio of mineral dust provided in the AERONET version 3 inversion product, Atmos. Chem. Phys., 18, 12735–12746, https://doi.org/10.5194/acp-18-12735-2018, 2018.
Takamura, T., Sasano Y., and Hayasaka T.: Tropospheric Aerosol Optical Properties Derived from Lidar, Sun Photometer, and Optical Particle Counter Measurements, Appl. Optics, 33, 7132–7140, 1994.
Vermote, E. F., Tanre, D., Deuze, J. L., Herman, M., Morcrette, J. J., Kotchenova, and S. Y.: Second Simulation of a Satellite Signal in the Solar Spectrum – Vector (6SV) User Guide Version 3 – Part II, http://6s.ltdri.org/ (last access: 30 July 2012), 2006.
Young, S. A. and Vaughan, M. A.: The Retrieval of Profiles of Particulate Extinction from Cloud-Aerosol Lidar Infrared Pathfinder Satellite Observations (CALIPSO) data: Algorithm Description, J. Atmos. Ocean. Tech., 26, 1105–1119, 2009.
Zhao, G., Zhao, C., Kuang, Y., Tao, J., Tan, W., Bian, Y., Li, J., and Li, C.: Impact of aerosol hygroscopic growth on retrieving aerosol extinction coefficient profiles from elastic-backscatter lidar signals, Atmos. Chem. Phys., 17, 12133–12143, https://doi.org/10.5194/acp-17-12133-2017, 2017.