the Creative Commons Attribution 4.0 License.
the Creative Commons Attribution 4.0 License.
 | 21 Nov 2023
A new accurate retrieval algorithm of bromine monoxide columns inside minor volcanic plumes from Sentinel-5P TROPOMI observations
Simon Warnach
Holger Sihler
Christian Borger
Nicole Bobrowski
Steffen Beirle
Ulrich Platt
Thomas Wagner
Bromine monoxide (BrO) is a key radical in the atmosphere, influencing the chemical state of the atmosphere, most notably the abundance of ozone (O3). O3 depletion caused by the release of bromine has been observed and modeled in polar regions, salt pans, and in particular inside volcanic plumes. Furthermore, the molar ratio of BrO and SO2 – which can be detected simultaneously via spectroscopic measurements using the differential optical absorption spectroscopy (DOAS) method – is a proxy for the magmatic composition of a volcano and potentially an eruption forecast parameter.
The detection of BrO in volcanic plumes from satellite spectroscopic observations is limited by the precision and sensitivity of the retrieval, which so far only allowed for the detection of BrO during major eruptions. The unprecedented spatial resolution of up to 3.5 km×5.5 km and the high signal-to-noise ratio of the TROPOspheric Monitoring Instrument (TROPOMI) on board Sentinel-5 Precursor (S-5P) enable observing and monitoring volcanic bromine release globally even for minor eruptions or even quiescent degassing.
In this study, we investigate how far the BrO retrieval can be improved using TROPOMI data and how well BrO can be detected, even in small eruptions and during quiescent volcanic degassing. There are two steps for which improvements in accuracy are investigated and applied: the improvement and quantitative determination of (1) the detection limit of the DOAS BrO column retrieval and (2) the correction of the non-volcanic background BrO signal. First, the DOAS retrieval settings are varied, and their influence on accuracy and precision is investigated with respect to the detection limit and potential systematic influences. Based on these results, we propose a dedicated DOAS evaluation scheme optimized for the detection of BrO in volcanic plumes. For the DOAS retrieval, we propose the use of a large fit window from 323–360 nm, yielding a statistical uncertainty lower by a factor of 1.8 compared to previous BrO DOAS algorithms while not enhancing systematic influences. Second, the effect of the background BrO is reduced by a latitude-dependent empirical correction scheme correlated to cloud information as well as information on the O3 column. Via these improvements, the combined statistical and systematic uncertainties in the resulting BrO vertical column density is on the order of .
We present a new and accurate retrieval algorithm of BrO columns from TROPOMI observations which allows for the detection of even slightly enhanced BrO amounts inside minor eruptive plumes of bromine-rich volcanoes. While designed specifically for TROPOMI observations, the retrieval algorithm is in general also applicable to other hyperspectral satellite observations. However, some parts might require adaptation.
- Article
(34805 KB) - Full-text XML
- BibTeX
- EndNote


Bromine monoxide (BrO) has been found to be a catalyst for ozone (O3) destruction (e.g., in the polar regions; see Barrie et al., 1988; Simpson et al., 2007). Volcanic bromine release is thought to also affect atmospheric O3 chemistry (Bobrowski et al., 2003; von Glasow, 2010; Surl et al., 2021). However, O3 measurements inside volcanic plumes are limited and the strength of the O3 destruction of volcanic bromine is still not fully clear (an estimation can be found in the review by Surl et al., 2015). Recently, the development of chemiluminescence instruments for the detection of O3 inside volcanic plumes shows promising results (Rüth, 2021; Bräutigam, 2022) and could help to better constrain the volcanic O3 destruction, as they allow for interference-free measurements of O3 in volcanic plumes, in contrast to the standard ultraviolet–O3 (UV) monitors often used today. Strong eruptions ejecting bromine into the tropical stratosphere could potentially impact global stratospheric O3 abundance over a 10-year period (Brenna et al., 2019).
BrO in volcanic plumes was first detected at the Soufrière Hills volcano (Bobrowski et al., 2003) using ground-based differential optical absorption spectroscopy (DOAS; Perner and Platt, 1979) measurements. BrO and sulfur dioxide (SO2), which can be detected by DOAS simultaneously, have been measured over the last 20 years at many volcanoes using ground-based instruments. Ground-based (Bobrowski and Platt, 2007; Gutmann et al., 2018) and satellite observations (Hörmann et al., 2013) report inter-volcanic variations in the ratio of 3 orders of magnitude, strongly suggesting a link to differences in the geological settings of the individual volcanoes (Platt and Bobrowski, 2015). Additionally, variations in over time have been considered a proxy for changes in the volcanic systems, for instance at Mt. Etna, Italy (Bobrowski and Giuffrida, 2012); Nevado del Ruiz, Colombia (Lübcke et al., 2014); Cotopaxi, Ecuador (Dinger et al., 2018); and Tungurahua, Ecuador (Warnach et al., 2019). These variations are suggested to be linked to differences in the partitioning of bromine and sulfur from the magmatic melt, i.e., that bromine and sulfur are released at different depths below the surface. However, the interpretation remains difficult, as the partitioning of bromine from the melt is not yet well-constrained.
After the unsuccessful attempt to detect BrO in volcanic plumes using satellite data from the Global Ozone Monitoring Experiment (GOME) and SCanning Imaging Absorption SpectroMeter for Atmospheric CHartographY (SCIAMACHY) instruments (Afe et al., 2004), volcanic BrO was first detected from GOME-2 in the plume of Kasatochi in 2008 by Theys et al. (2009). A global detection algorithm of BrO and the ratios inside volcanic plumes from GOME-2 was developed by Hörmann et al. (2013).
DOAS retrievals of BrO from satellites have varied over time, with respect to both the fit wavelength range and other DOAS fit settings. The first detection of tropospheric BrO from the GOME instrument by Wagner and Platt (1998) employs a wavelength range of 345–359.5 nm. Other studies use almost identical fit ranges for spectra from GOME (Richter et al., 1998, 2002; Hegels et al., 1998; Chance, 1998) and for spectra from the Ozone Monitoring Instrument (OMI; Chance, 2002). For SCIAMACHY and GOME-2 measurements, the short wavelength limit of the fit range was lowered to 336 nm, and the upper limit varied between 347 nm (Afe et al., 2004; Begoin et al., 2010), 351–352 nm (Valks et al., 2009; Theys et al., 2009), and 360 nm (Heue et al., 2011; Sihler et al., 2012; Hörmann et al., 2013). The short wavelength limit of 336 nm was also found to be best in a long-term study combining GOME, SCIAMACHY, and GOME-2 measurements (Bougoudis et al., 2020). For recent global studies of BrO from GOME-2 (Theys et al., 2011) and the TROPOspheric Monitoring Instrument (TROPOMI; Seo et al., 2019) the lower boundary was further lowered and a fit range of 332–359 and 334.6–358 nm was chosen.
The DOAS BrO fit used in this study is based on the BrO fit developed by Sihler et al. (2012) for the retrieval of BrO in Arctic regions, which was also used for the detection of BrO in volcanic plumes by Hörmann et al. (2013). There, a fit range from 336–360 nm was chosen. The omission of shorter wavelengths was mainly attributed to the strong O3 absorption in the UV at high latitudes, caused by the large O3 columns and high solar zenith angles (SZAs).
SO2 is one major constituent of volcanic gas plumes, accounting for 1 %–25 % of the volcanic gas emissions (Textor et al., 2004). In contrast to BrO, there is no significant stratospheric column of SO2. As SO2 has differential absorption structures in the UV, it is widely used as an indicator for the detection of volcanic plumes (e.g., Hörmann et al., 2013; Fioletov et al., 2016; Carn et al., 2017).
DOAS SO2 retrievals from satellites were performed starting with the launch of GOME in 1995 (Eisinger and Burrows, 1998; Thomas et al., 2005; Khokhar et al., 2005); later DOAS retrievals were implemented also for SCIAMACHY (Afe et al., 2004), GOME-2 (Rix et al., 2012; Hörmann et al., 2013), OMI (Theys et al., 2015), and most recently TROPOMI (Theys et al., 2017). As SO2 columns in volcanic plumes vary over multiple orders of magnitude, recent algorithms introduced a scheme using multiple fits in different wavelength ranges with varying SO2 absorption strength (Hörmann et al., 2013; Theys et al., 2015; Warnach, 2022).
In this study, we report on the further improvement in the BrO DOAS retrieval with a specific focus on the detection of BrO in volcanic plumes and propose a new accurate BrO retrieval for detection within minor volcanic plumes. Retrieval improvements are investigated by varying the DOAS fit settings, by both considering lower wavelengths and the inclusion/exclusion of the formaldehyde (HCHO) cross-section in the DOAS fit. The aim of this task is to achieve both a low statistical uncertainty and low systematic errors, especially for low interferences caused by clouds, O3, and HCHO.
There are several reasons why – in contrast to previous retrievals – lower wavelengths can be included in current BrO DOAS retrievals for the detection of volcanic plumes. First, the introduction of the so-called “Puķīte” terms (Puķīte et al., 2010) can largely compensate the spectral effects of the strong O3 absorption. Second, volcanic plumes mainly occur at tropical latitudes, where O3 columns and the SZAs are considerably lower compared to mid-latitudes and high latitudes. Third, the use of an earthshine reference spectrum recorded around the Equator reduces the optical density of O3 to 0 at the Equator, further reducing potential O3 interference at tropical latitudes.
The question whether it is advantageous to include HCHO in the BrO DOAS fit has been long debated, as the interference between BrO and HCHO is a well-known difficulty both in BrO and HCHO DOAS retrievals (Theys et al., 2011; Vogel et al., 2013; De Smedt et al., 2018). The structure of the absorption cross-section of BrO and HCHO is very similar (see Fig. 1). Particularly the fact that the largest absorption peak of BrO overlaps with a major absorption peak of HCHO at 339 nm can cause a spectral interference between both trace gases. For Arctic applications, such as Wagner and Platt (1998) and Richter et al. (1998), and also for the more recent study by Sihler et al. (2012), HCHO was not included as an absorber in the DOAS retrieval because HCHO is almost not abundant in Arctic regions. However, in equatorial regions, where HCHO can reach high column densities due to biogenic emissions or biomass burning, spectral interference with HCHO can become important. HCHO is therefore included within the DOAS analysis of the global BrO detection algorithms of GOME-2 by Theys et al. (2011) and TROPOMI by Seo et al. (2019). Interferences between BrO and HCHO are observed for equatorial regions by Theys et al. (2011). Using 332 nm compared to 336 nm (used in Sihler et al., 2012) as the lower fit boundary reduces these interferences (Theys et al., 2011). Hence, both Theys et al. (2011) and Seo et al. (2019) employ fit ranges with a lower wavelength limit of 332 and 334.6 nm respectively.
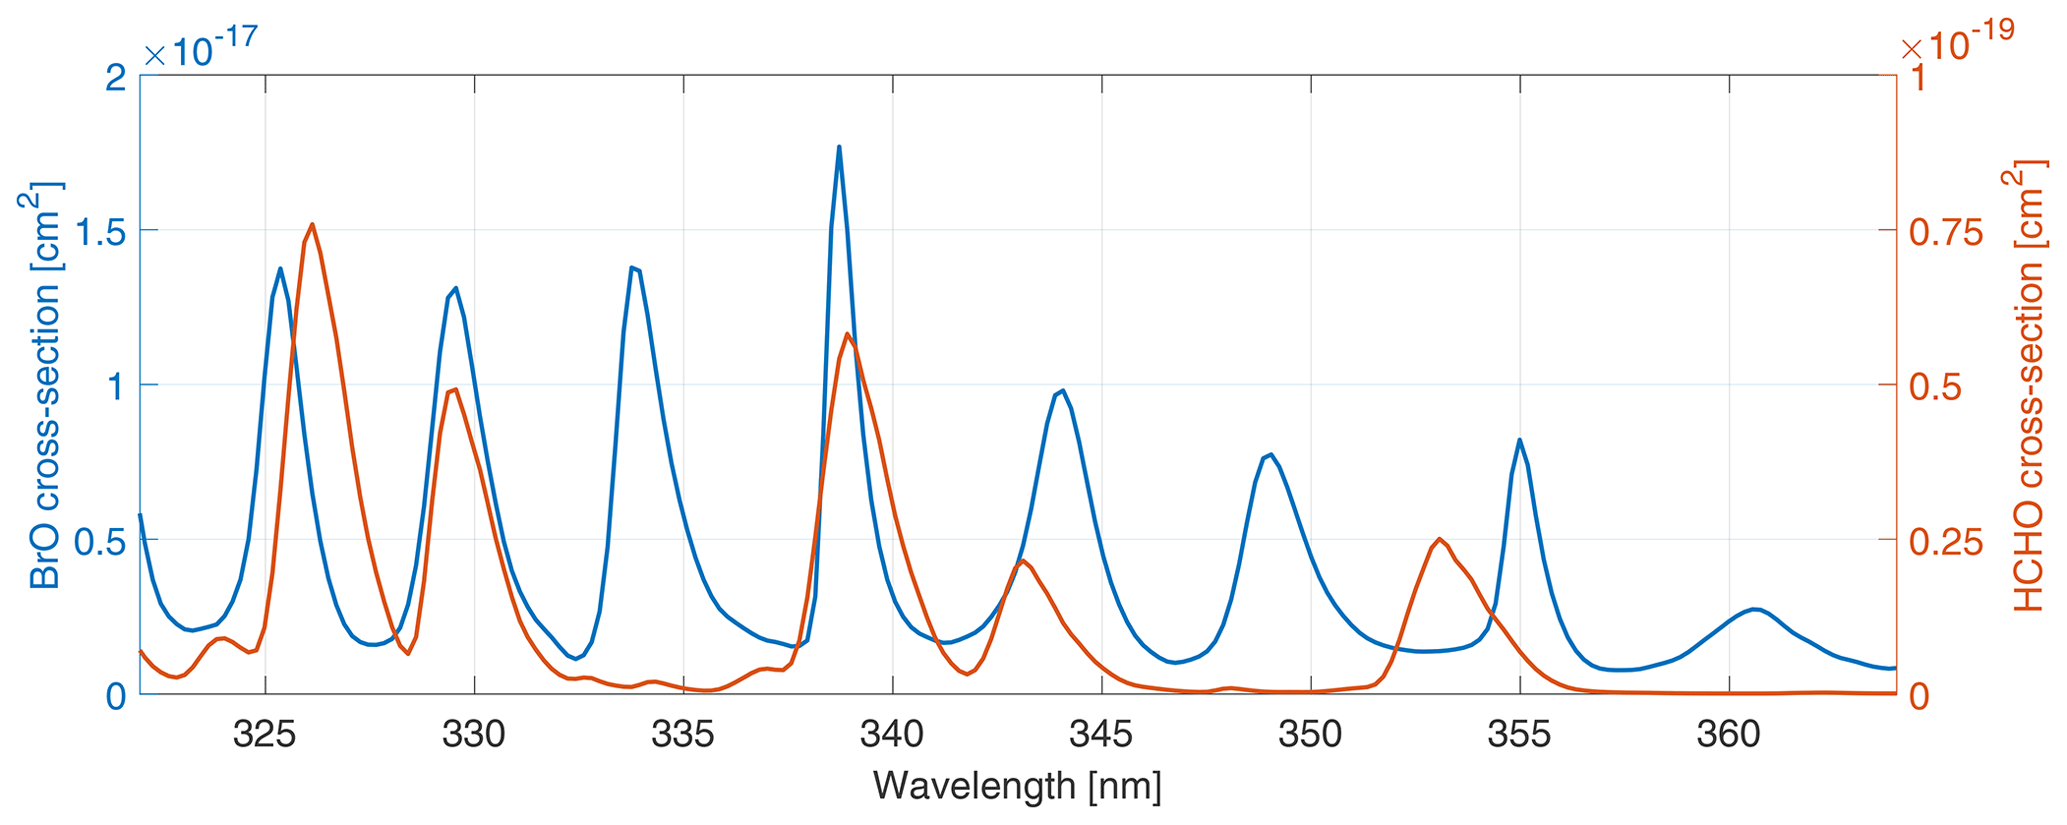
Figure 1Absorption cross-section of BrO (blue, based on Fleischmann et al., 2004) and HCHO (red, based on Meller and Moortgat, 2000) convolved with a typical TROPOMI instrument spectral-response function.
The stratospheric background of BrO together with the potential BrO background of the free troposphere is up to 1 order of magnitude larger than typical volcanic BrO columns of small eruptions. Therefore, an imperfect subtraction of the background column can yield uncertainties on the order of small volcanic signals. Hence, an accurate background correction is essential. Fortunately, horizontal gradients of the stratospheric BrO column occur on a much larger scale than the extension of volcanic plumes. Moreover, while stratospheric gradients mainly originate from changes in the tropopause height (Sihler et al., 2012), volcanic plumes are dispersions of point sources. Thus, the patterns are spatially independent from each other and a separation can be achieved by the application of a spatial high-pass filter. Moreover, volcanic plumes can be independently detected due to their enhanced SO2 column density. Background correction on this basis was for example implemented by Hörmann et al. (2013) by first masking the volcanic plume, which is very detectable via the SO2 signal, and subtracting a 2D polynomial fitted to the area around the volcanic plume.
While our BrO DOAS retrieval is in principle applicable to the complete globe, similar to the retrievals presented in Theys et al. (2011), Sihler et al. (2012), and Seo et al. (2019), it is specifically optimized for the most accurate detection of BrO originating from volcanic plumes, which are local/regional events whose spatial extent is typically on the order of 10–100 km, only rarely exceeding 1000 km.
Even though our BrO retrieval algorithm is designed for TROPOMI observations, the improvements tested are – aside from satellite-specific adaptations – in principle applicable to all hyperspectral satellite observations.
This paper is structured as follows: in Sect. 2, we describe the TROPOMI instrument and the basics of our BrO DOAS satellite retrieval. The investigation of different DOAS fit settings is described in Sect. 3. For these fit settings the systematic influence of clouds, O3, and HCHO is discussed and corrected, and the remaining systematic influences are quantified in Sect. 4. In combination with an investigation of the statistical uncertainties (Sect. 5.1), the most suitable fit settings for an accurate retrieval within minor volcanic plumes is proposed in Sect. 5. The proposed retrieval algorithm is tested on multiple volcanic plumes of different emission strengths and at different latitudes in Sect. 6 to demonstrate its accuracy and efficacy. Lastly, conclusions are drawn in Sect. 7.
2.1 The TROPOMI instrument
The TROPOspheric Monitoring Instrument (TROPOMI; Veefkind et al., 2012) is on board the satellite Sentinel-5 Precursor (S-5P) of the European Space Agency (ESA). S-5P is a Sun-synchronous, polar-orbiting satellite with an orbital inclination of 98.7∘ on a low-Earth orbit (altitude of 824 km) launched on 13 October 2017. Its Equator-crossing time is roughly at 13:30 mean local solar time, and it has a repeat cycle of 17 d. S-5P and its single payload of TROPOMI are designed to determine and monitor the atmospheric composition. TROPOMI uses a push-broom method to scan Earth's surface. The opening angle of 108∘ leads to a ground swath of approx. 2600 km (separated to 450 pixels) and allows for an almost complete daily coverage of the whole globe.
TROPOMI is a hyperspectral imaging spectrometer measuring radiance spectra via four different detectors in the ultraviolet (UV) spectrum at 270–320 nm, UV–visible (UVIS) spectrum at 310–500 nm, near-infrared (NIR) spectrum at 675–775 nm, and shortwave infrared (SWIR) spectrum at 2305–2385 nm. A detailed overview of the spectral characteristics for each detector is given in Veefkind et al. (2012).
2.1.1 Selection of spectra: TROPOMI UVIS
For the DOAS retrieval of BrO the Level-1B (L1B) radiance spectra from the UVIS channel are used. The UVIS channel has an along-track pixel size of 7 km, which was reduced to 5.5 km on 6 August 2019. There are 450 across-track pixels, whose size varies from 3.5 km at nadir up to 14.4 km at large viewing angles. Thus, the highest spatial resolution is .
2.1.2 Additional input data
For the investigation of systematic errors and their correction, several additional input data sets are used in this study.
First, for the investigation of the influence of clouds onto the retrieval and for its correction, two cloud data sets are used: the cloud height (CH) and the cloud fraction (CF). Both data sets are calculated using the Fast Retrieval Scheme for Clouds from the O2 A-band (FRESCO; Compernolle et al., 2021) algorithm, which derives a radiometric cloud fraction and cloud pressure using the reflectance spectrum at 760 nm (in the O2 A-band) assuming a Lambertian cloud model. The FRESCO data products are provided within the NO2 operational product (van Geffen et al., 2021; Copernicus Sentinel-5P NO2 L2 product, 2021). While the cloud fraction is directly inferred within the FRESCO algorithm, the cloud height is calculated from the FRESCO cloud pressure (CP), surface pressure (SP), and surface altitude (SA) – all provided within the NO2 product (van Geffen et al., 2021; Copernicus Sentinel-5P NO2 L2 product, 2021) – via the barometric pressure formula. To ensure the use of the latest FRESCO product, we used the reprocessed version of the NO2 product, provided via the Sentinel-5P Expert Users Data Hub (https://s5pexp.copernicus.eu/, last access: 2 November 2023). For this study, we chose the FRESCO cloud products, as they are easily accessible via the operational NO2 product and are therefore available for the complete TROPOMI sensing period. However, also other cloud products are available (a comparison of TROPOMI cloud products can be found in Latsch et al., 2022), such as the operational cloud product (Optical Cloud Recognition Algorithm–Retrieval of Cloud Information using Neural Networks, OCRA–ROCINN; Loyola et al., 2018), and could in principle be used. For example the use of the cloud fractions provided by the Mainz Iterative Cloud Retrieval Utilities (MICRU; Sihler et al., 2021) was tested in Warnach (2022) and found to be suitable for application within the retrieval presented here. However, unfortunately it is not available for the complete TROPOMI measurement period.
Second, for the study of the influence of HCHO onto the BrO retrieval, HCHO slant column densities (SCDs) – provided within the operational TROPOMI HCHO Level-2 (L2) product – are used (De Smedt et al., 2018). The HCHO SCDs are derived from a DOAS fit in a fit wavelength range similar to that of BrO (328.5–346 nm). In order to minimize interference with BrO, the BrO SCD is fixed using a SCD derived in an independent pre-fit in a larger fit wavelength range (328.5–359 nm) (De Smedt et al., 2018).
Third, for the estimation of the stratospheric column strength, the O3 vertical column density (VCD) is used. The O3 VCD is derived directly from the BrO DOAS fit. We favor this O3 VCD over the operational O3 Level-2 product (1) because it is more practical and most importantly (2) because, different from our fit, the operational O3 product does not include SO2 within the DOAS fit and is therefore affected stronger by SO2–O3 spectral interference leading to high inaccuracies within volcanic plumes. Since there are two different O3 absorption cross-sections as well as the two Puķīte pseudo absorbers included in the BrO DOAS fit (see Table 1) to account for the spectral absorption signal of O3, the contributions of the individual fitted O3 terms are combined to the complete slant column following Puķīte and Wagner (2016):
where the slant columns and correspond to the cross-sections for two temperatures, while the last two terms of and correspond to the two Puķīte term pseudo absorbers (Puķīte et al., 2010), with λ corresponding to the wavelength and corresponding to the O3 absorption cross-sections. For simplicity, wavelength λ and cross-section were taken only at the wavelength of the first maximum of the absorption cross-section closest to the lower wavelength boundary (e.g., for the fit wavelength range 323–360 nm: λ=325.0 nm and ).
Serdyuchenko et al. (2014)Serdyuchenko et al. (2014)Bogumil et al. (2003)Fleischmann et al. (2004)Thalman and Volkamer (2013)Bogumil et al. (2003)Vandaele et al. (1998)Meller and Moortgat (2000)Wagner et al. (2009)Wagner et al. (2009)Puķīte et al. (2010)Puķīte et al. (2010)Beirle et al. (2017)Beirle et al. (2013)Table 1Fit settings for the eight BrO DOAS retrievals: each fit wavelength range is applied once including and excluding the HCHO cross-section. The proposed final fit wavelength range is highlighted in bold. The fit settings that are included in the SO2 DOAS fit are indicated by an asterisk in the column “Incl. in SO2 fit”.
a For the SO2 fit, the wavelength range is 312–324 nm. b Not included in standard retrieval (SR) fits. Not included in the proposed final fit settings. c Instrument spectral-response function. d w: width parameter; aw: asymmetry parameter; k: shape parameter of a super-Gaussian distribution function.
The resulting O3 SCD is then converted to the geometric O3 VCD via the geometric following the formalism described in Sect. 2.2.
2.2 The DOAS fitting routine
The DOAS method was introduced by Perner and Platt (1979) and is based on the attenuation of light in the atmosphere described by the Beer–Lambert–Bouguer law. The DOAS method makes use of the fact that molecules are distinguishable by their unique absorption structure originating from electronic, vibrational, and rotational excitations. These structures usually contain high-frequency structures, which can be distinguished from the broadband extinction features of atmospheric scattering processes such as Mie and Rayleigh scattering. Essentially, optical density τ of the absorption of the trace gas in question is retrieved by comparing the measurement spectrum's intensity I(λ) with a so-called “reference spectrum” I0(λ):
where σi(λ) is the absorption cross-section and ci(l) the concentration of trace gas i, while polynomial term P(λ) accounts for broadband absorption and scattering, e.g., Rayleigh and Mie scattering.
The result of the DOAS analysis will be the difference in the columns of the trace gases between the reference and measurement spectrum, the slant column density (SCD). DOAS thus requires only knowledge about absorption cross-sections σ of the relevant absorbing molecules. Traditional DOAS algorithms employ a combination of a linear (for the contribution of the reference spectra) and non-linear (for spectral shift and distortion compensation) fit in order to determine the column of the absorber. However, for satellite applications, where huge data sets are recorded daily, a linearization of the non-linear DOAS fit was developed by Beirle et al. (2013) and is used here. The fitting algorithm used here was implemented and described in detail by Borger et al. (2020).
The slant column density (SCD) retrieved in the DOAS fit is the integrated concentration along the light path. As the light path depends on the measurement geometry, i.e., viewing angle, solar angle, and the radiative transfer, the SCD is converted to the vertical column density (VCD, the vertically integrated concentration) via the so-called air mass factor (AMF):
One simple approximation of the AMF is the geometric AMF, depending only on the solar zenith angle (SZA) and viewing zenith angle (VZA):
The geometric AMF is a valid approximation for stratospheric light paths in the UV if the SZA does not exceed 70∘ (Burrows et al., 2011) and accounts for the satellite and solar viewing geometry. For tropospheric columns, usually a more complex derivation using radiative transfer calculations is performed, including the trace gas profile (i.e., the plume height in the case of a volcanic plume), surface albedo, and cloud cover. For trace gases close to the surface the AMF can be up to 1 order of magnitude lower compared to the geometric approximation (Theys et al., 2017).
In this study we employ only geometric AMFs, since (1) the focus of the study is to look at systematic influences and background corrections and (2) as the main focus of volcanic BrO is to derive the ratio, for which the AMF divergence will cancel out in first approximation.
2.3 Selection of the reference region
Traditionally, DOAS retrievals from satellites use the direct solar spectrum recorded on each day as a reference spectrum. This ensures that the DOAS retrieval can yield absolute slant columns of the respective trace gas. However, the direct solar spectra are obtained through a different optical input channel and traverse different optical parts (see Veefkind et al., 2012). Thus, these differences will cause stripes in the across-track direction (Richter and Wagner, 2001; Chance, 2007). While this can be corrected via a so-called “destriping” algorithm (e.g., Chance, 2007; Boersma et al., 2011; Hörmann et al., 2016), in recent times it has been found to be advantageous to use an earthshine spectrum as reference spectrum for the retrieval (Theys et al., 2017; Seo et al., 2019). Ideally, such an earthshine spectrum is calculated from radiances obtained at regions where the respective trace gas is not abundant. Thus, regions over the equatorial Pacific are used (Sihler et al., 2012; Hörmann et al., 2013, 2016; Seo et al., 2019), far away from potential anthropogenic pollution sources and remote from volcanoes. In this study, we expand the region an earthshine spectrum is calculated using the complete equatorial latitude band as a reference region [ N, E]. This large band is chosen to (1) increase the statistics and (2) ensure that the earthshine reference is least susceptible to variation in the detector response over the day, i.e., that the earthshine spectrum is representative of each longitudes.
For SO2, the assumption that remaining SO2 is negligible holds true for this reference area. For BrO, however, there is still a significant stratospheric background signal over the equatorial region with VCDs of roughly , as stated by Richter et al. (2002) and also found within this study. Thus, using the earthshine reference will still yield differential SCDs (dSCDs) instead of absolute SCDs. However, the stratospheric signal will introduce an offset in the resulting slant column densities, which is only slowly changing in spatial direction. In this study, the focus is on local volcanic plumes. Volcanic plumes are singular events, whose (1) spatial patterns usually have a high contrast compared to the background and (2) spatial extent is almost always much smaller compared to stratospheric patterns. Thus, the stratospheric signal can be removed effectively by performing a local background correction for SO2 and BrO (see Sect. 6.2).
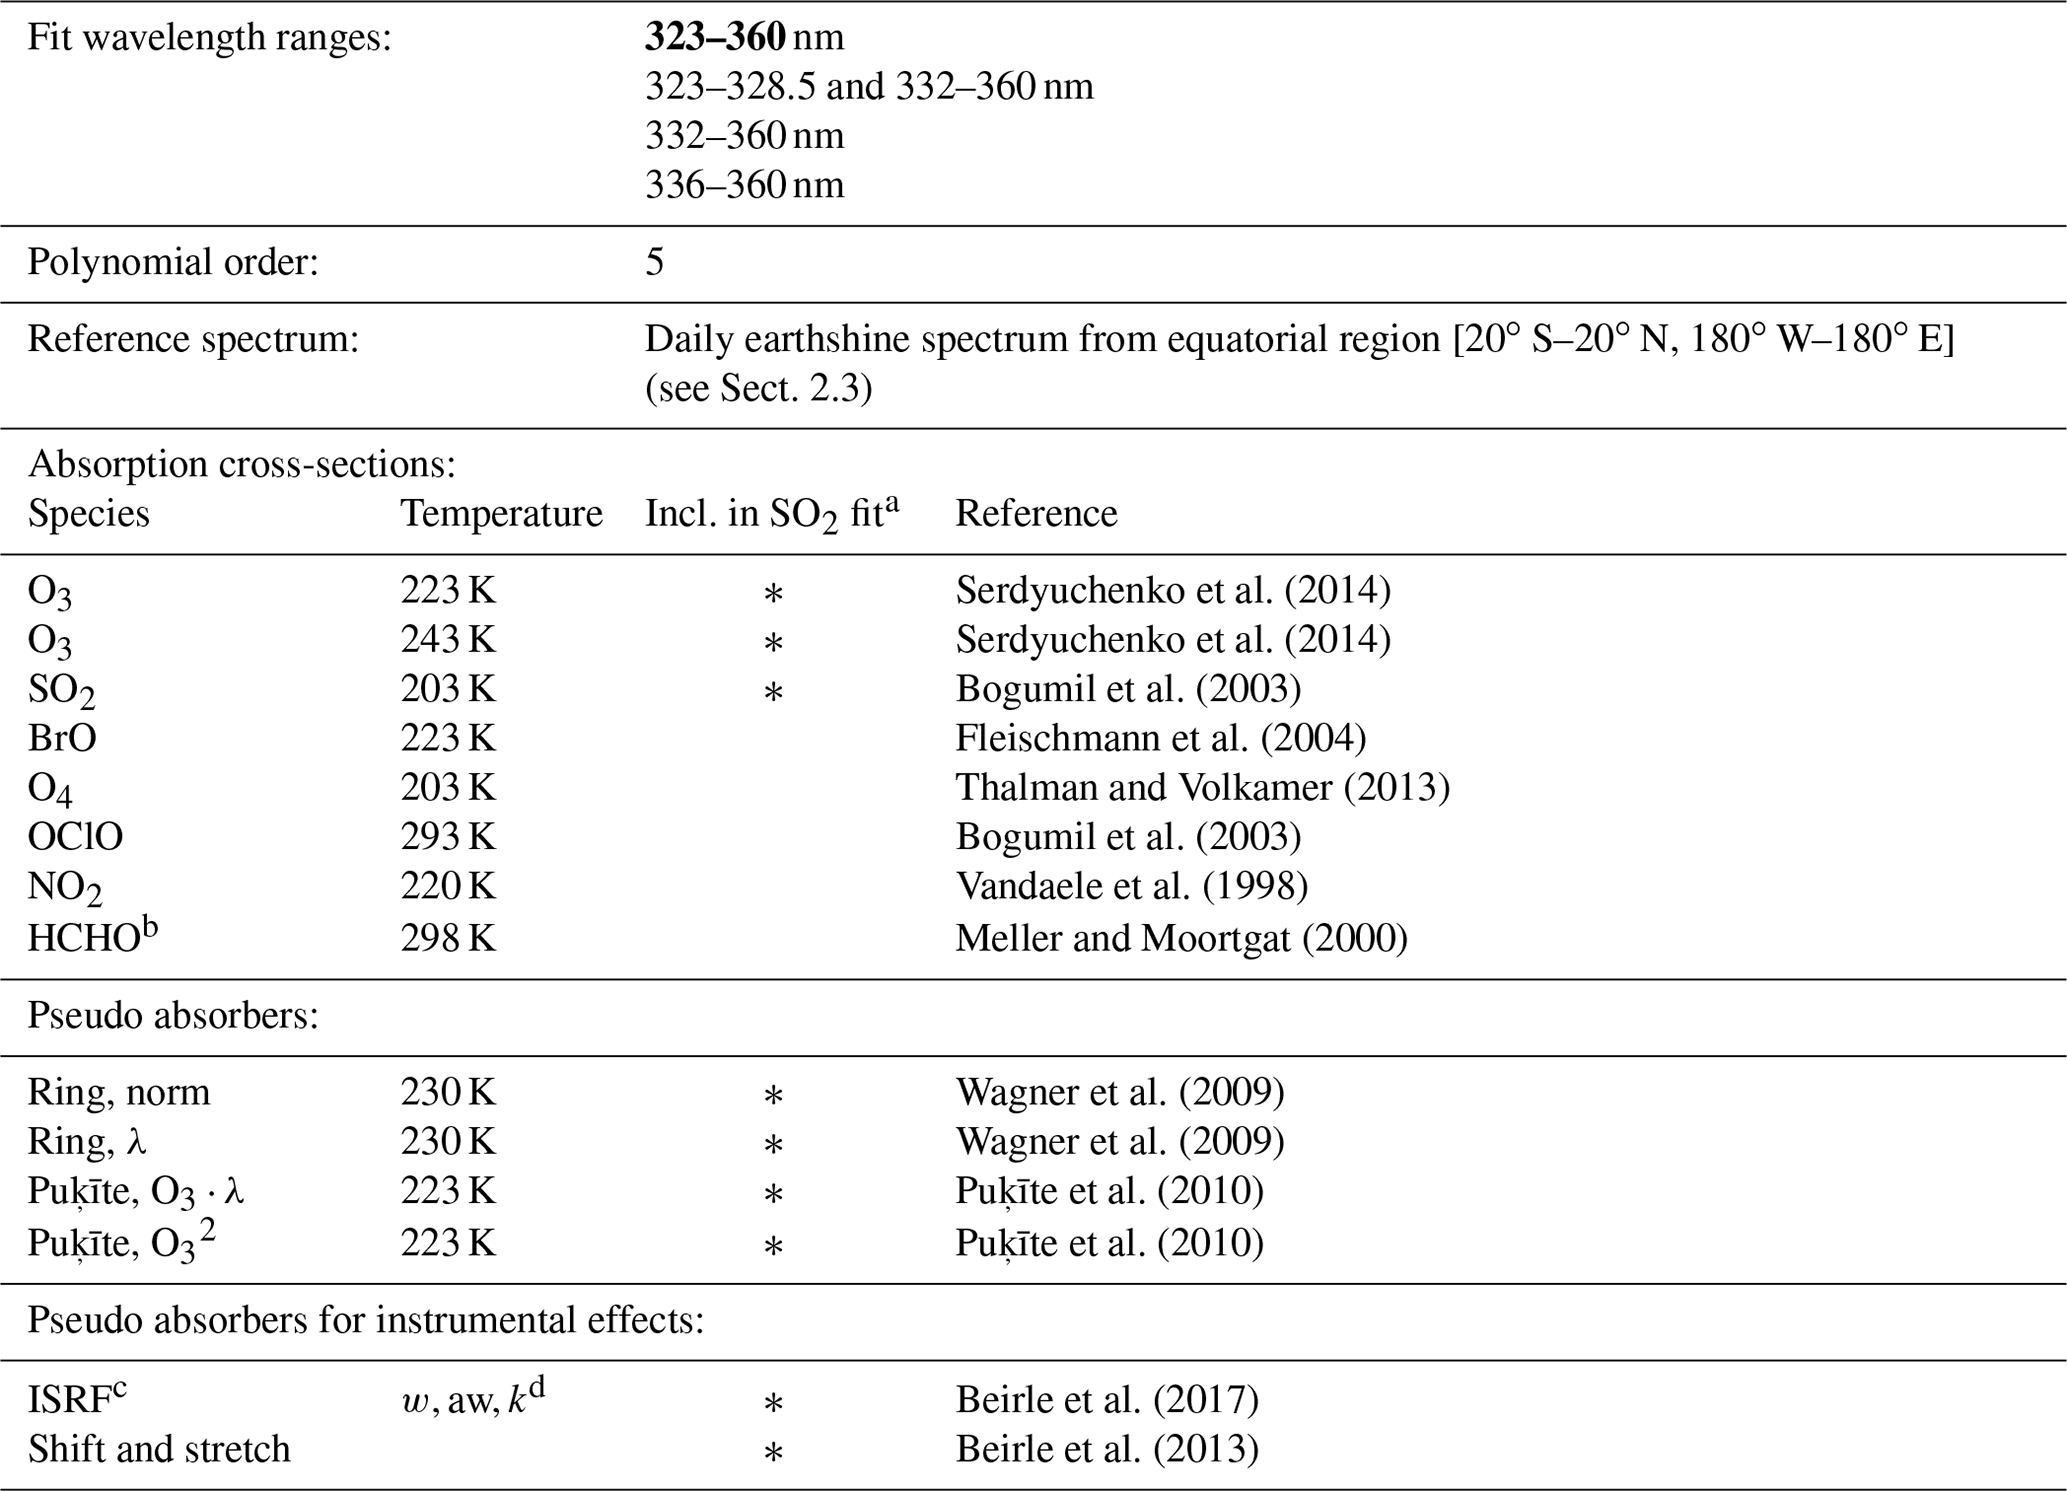
However, an earthshine spectrum using the complete equatorial latitude band might include influences from volcanoes as well as biogenic or anthropogenic influences. A comparison between the use of the new, expanded earthshine spectrum calculated from the complete equatorial region [ N, E] and the earthshine spectrum from the equatorial Pacific region only [ N, 135–105∘ W], as well as using an irradiance spectrum, is shown in Fig. 2 for measurements over the equatorial region [ N, E]. It can be seen that the retrieved VCDs show no difference or offset between all three fits (here the stratospheric influence in the irradiance data is eliminated for comparison by subtracting the median BrO VCD). The fit root mean square (rms), however, is about 25 % lower for the earthshine fit and roughly . This rms distribution is in very good agreement with rms reported over an equatorial Pacific region by Seo et al. (2019, their Fig. 11b), who employed a DOAS earthshine fit based on a large equatorial Pacific region [ N, 150–240∘ E] independently from the fit presented in this study.
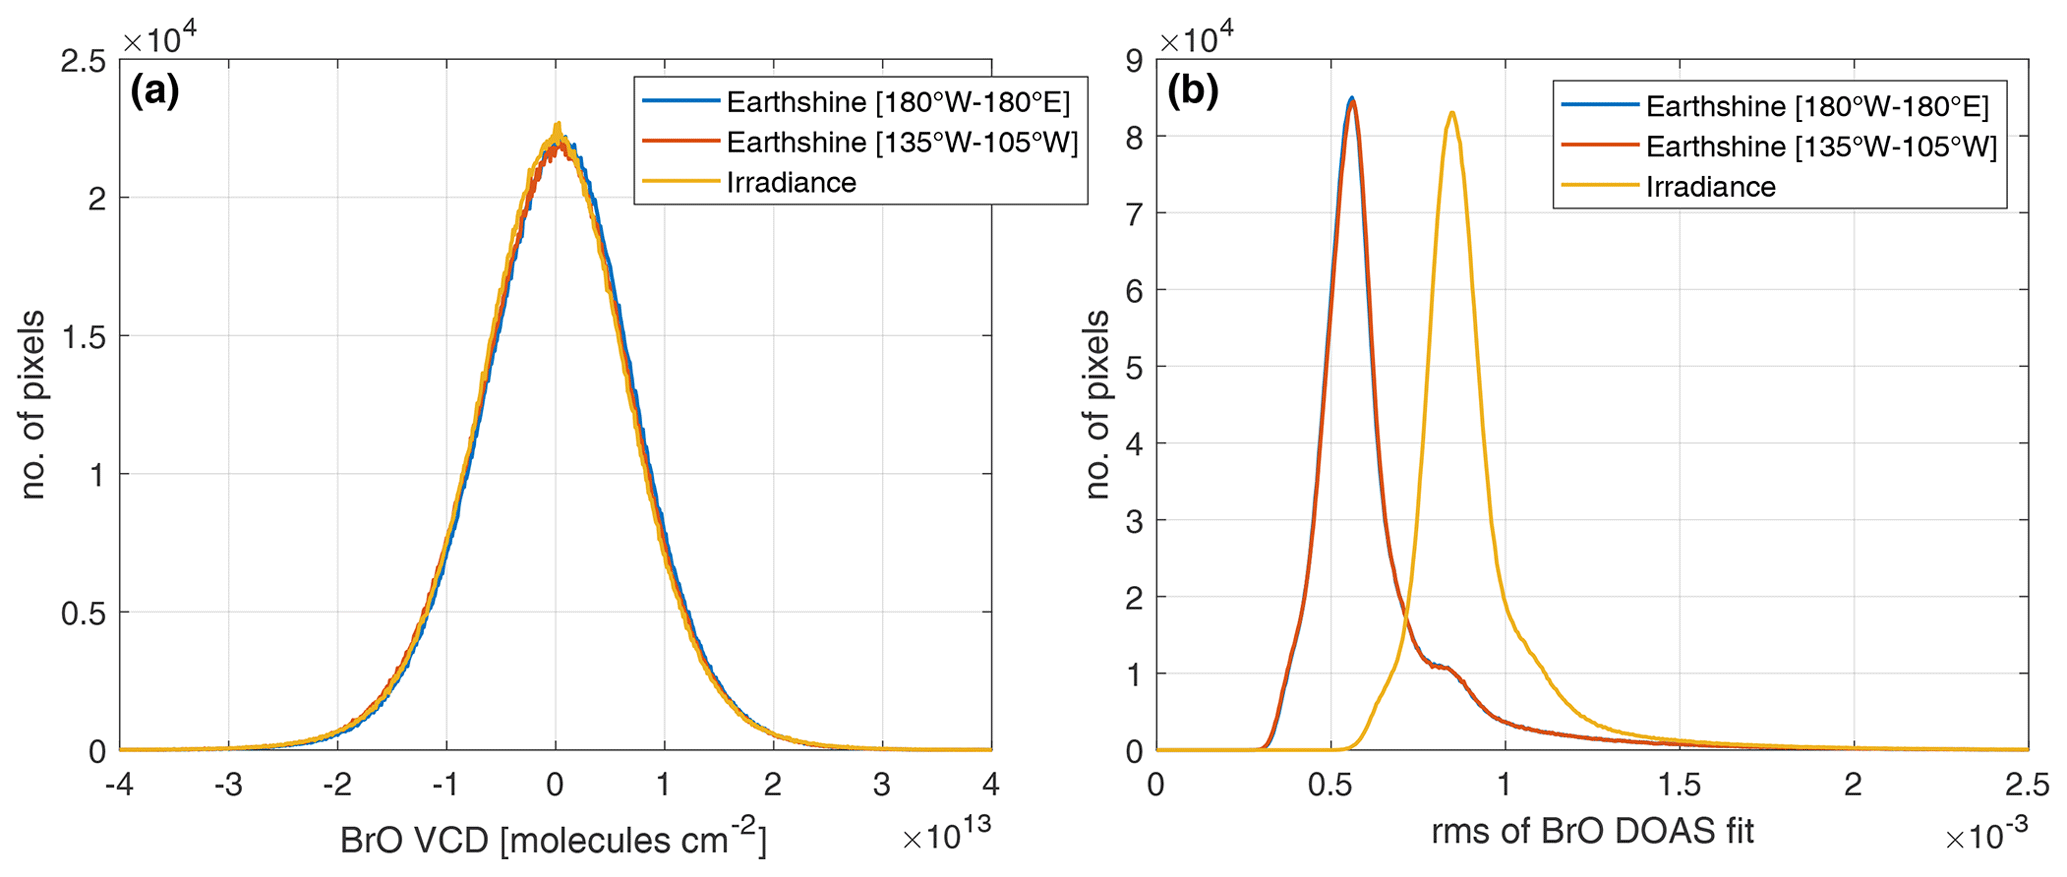
Figure 2Distribution of (a) the BrO VCD and (b) the rms uncertainty in the DOAS fit for the complete equatorial region [ N, E] on 1 October 2018 employing three different reference spectra: an earthshine spectrum calculated using the complete equatorial region [ N, E] (blue), an earthshine spectrum calculated using the equatorial Pacific region [ N, 135–105∘ W] (red), and an irradiance spectrum (yellow). For comparability with the earthshine results, the median BrO VCD (corresponding to the median stratospheric column) is subtracted for the irradiance BrO VCDs.
In order to ensure that the inclusion of volcanic plumes within the reference spectrum will not introduce a noticeable contamination into the reference spectrum, we investigated the difference between including and excluding volcanic areas onto the retrieved mean SCD over the Equator. This is done for two dates in Appendix A: 2 October 2021, where only several, small plumes are present (see Fig. A1a, red areas), representative of normal conditions, and 30 July 2018, where a very large plume stretched over a large portion of the equatorial region (see Fig. A2a, red areas), representative of exceptionally strong volcanic activity within the equatorial region. For the normal conditions on 2 October 2021, excluding the volcanic areas only leads to negligible changes in the SO2 SCD (see Fig. A1c) and no detectable changes in the BrO SCD (see Fig. A1d). For the exceptional conditions on 30 July 2018, there is a difference of several hundreds of billions of molecules per square centimeter () visible between including and excluding the volcanic areas for BrO SCDs (see Fig. A2d). However, this is 1.5 orders of magnitude below typical volcanic BrO columns () and therefore negligible. The same is the case for SO2 SCD, where it is more pronounced but still 1 order of magnitude below typical volcanic columns of (see Fig. A2c). Furthermore, the large plume on 30 July 2018 also stretches over the Pacific area of 120–160∘ W used as reference region for the operational SO2 product (Theys et al., 2017), and it even stretches over the larger Pacific area of 150∘ E–120∘ W used in Seo et al. (2019). Thus, in this exceptional case using a Pacific reference sector will also not be free of volcanic influence. To the contrary, in this case the influence is most likely stronger using a Pacific reference area, as the plume affects a relatively larger portion of pixels within the Pacific reference area compared to our reference area which spans the complete equatorial band. It should further be noted that a constant offset expanding over all across-track detectors would be removed efficiently by our background correction algorithm and would therefore be irrelevant to our approach.
The earthshine reference spectra are calculated in the following way: firstly, all radiances within the global latitude band [180∘ W–180∘ E] around the Equator [20∘ S–20∘ N] are selected, as mentioned above. In a second step, the radiances are normalized with respect to their maximum intensity in order to prevent scenes or geometries resulting in a brighter backscatter radiation, e.g., cloudy scenes, to be systematically weighted more strongly. In the last step, the mean of the normalized radiances is taken as the daily reference spectrum in the DOAS analysis. This process is performed separately for each spectra of the 450 across-track detector pixels of the TROPOMI instrument and for each day.
In the following sections, different wavelength ranges of the BrO DOAS fit are investigated. The performance with respect to the statistical variation, systematic spatial patterns of various origin, and interference with HCHO is checked by comparing the results of four fit wavelength ranges, where the upper fit range boundary is unchanged at 360 nm, as varying the upper fit range boundary was found to be less critical for the fit performance (Vogel et al., 2013; Seo et al., 2019). This upper fit wavelength range boundary is thus chosen to be 360 nm, as in Sihler et al. (2012), which is used as a baseline BrO DOAS fit. The lower wavelength boundary is varied, yielding the following wavelength ranges.
-
336–360 nm. This smallest fit wavelength range includes four BrO absorption bands (see Fig. 1) and is the baseline wavelength range used by Sihler et al. (2012) and Hörmann et al. (2013, 2016).
-
332–360 nm. This fit wavelength range is chosen because it adds one more BrO absorption band compared to the baseline while adding no additional HCHO absorption band (see Fig. 1). This lower wavelength boundary is also used in Theys et al. (2011) (GOME-2) and Seo et al. (2019) (TROPOMI). Theys et al. (2011) found that including this additional absorption band reduces the interference with HCHO.
-
323–360 nm. This largest fit wavelength range was chosen such that it includes seven BrO absorption bands while avoiding interference with very strong O3 or SO2 bands at wavelengths below 320 nm. It has not been used in DOAS satellite retrievals so far due to the strong O3 absorption for high latitudes.
-
323–328.5 and 332–360 nm. This also encompasses the largest fit wavelength range, but the HCHO absorption band around 329 nm, which overlaps with a BrO absorption band, is excluded in order to avoid HCHO interference (see Fig. 1).
All four fit wavelength ranges are implemented with two different fit settings, which differ only in the inclusion and exclusion of the HCHO absorption cross-section in the DOAS fit. Thus, there is a total set of eight different fits compared. The fits including the HCHO absorption cross-section are labeled “HCHO”, and the ones excluding HCHO are labeled “SR” (standard retrieval), i.e., the HCHO 332–360 nm fit corresponds to a DOAS fit evaluated in the wavelength range 332 to 360 nm with the HCHO absorption cross-section included, while the fit labeled SR 332–360 nm corresponds to the same DOAS fit just without the HCHO absorption cross-sections included. These labels will be used throughout this paper. An overview on the DOAS fit settings and the included absorption cross-sections for both SR and HCHO fits is listed in Table 1. Since the sensitivity study described in Sect. 4 suggests that the SR 323–360 nm fit is the most suitable fit (see Sect. 5), most of the results in the main part of the paper will be shown only for this fit. The corresponding results for the other fits can be found in the Appendix B2.
To illustrate the fit performance, the global BrO VCD map for 1 October 2018 for the SR 323–360 nm fit is shown in Fig. 3. Enhanced BrO occurs at high latitudes and is caused by the stratospheric signal, related to variations in the tropopause height (Sihler et al., 2012; Schöne, 2023). Hence, the variations in the BrO dSCD is directly linked to variations in the O3 column, which in turn can be used as a proxy for the strength of the stratospheric BrO column (Sihler et al., 2012). The enhanced BrO columns in southern high latitudes can be additionally caused by tropospheric BrO events occurring during polar spring (Sihler et al., 2012; Herrmann et al., 2022). In the equatorial region there are also distinct spatial patterns in the BrO columns not originating from volcanic plumes. They might be related to clouds and will be investigated in more detail in Sect. 4.1. The reason for this cloud effect is not fully clear. The effect could be a spectroscopic artifact (e.g., via the ring spectrum) or a true shielding effect of a potential tropospheric BrO background column.
Figure 3Global map of the geometric BrO VCD retrieved using the SR 323–360 nm fit on 1 October 2018. The areas in the Equator and mid-latitude region (marked by red rectangles) are used as case studies to investigate and quantify the influence of clouds and O3 respectively (see Sect. 4.1).
As all gradients in the BrO column of non-volcanic origin constitute a potential systematic error source, they ideally are removed via a background correction (e.g., via a spatial polynomial; Hörmann et al., 2013). In order to further improve the accuracy of the BrO retrieval, we investigate a more sophisticated correction scheme in Sect. 4.2.
In this section, the systematic influences of following three effects onto the BrO retrieval are investigated and discussed for the eight different BrO fit settings: potential systematic influences of O3, influences of clouds (Sect. 4.1), and the spectral interference with HCHO (Sect. 4.3).
4.1 Influence of clouds and O3
The aforementioned structures in the global BrO map (see Fig. 3) are probably correlated to clouds (equatorial region) and the O3 column (high-latitude regions). To showcase this, we look at two regions: first, an equatorial Pacific region [ N, 160–100∘ W] where the cloud structures are assumed to dominate the systematic structures and, second, a high-latitude region [40–60∘ N, 110–50∘ W] where changes in the stratospheric column height are assumed to dominate the systematic structures in the BrO column. The former is depicted in Fig. 4, including both FRESCO CF (Fig. 4a) and FRESCO CH (Fig. 4c) as well as the BrO VCD for the SR 323–360 nm fit (Fig. 4b). Furthermore, the BrO VCD after applying the correction scheme for clouds and O3 (described in Sect. 4.2) is also included in Fig. 4d.
It can be seen that the patterns in the BrO VCDs correlate to the cloud patterns and lower BrO VCDs are retrieved in the presence of clouds. Furthermore, the impact of large cloud fractions and high cloud heights (e.g., around 15∘ N, 110∘ W) seems much stronger compared to a large cloud fraction and low cloud height (e.g., around 15∘ S, 110∘ W). This suggests that both the cloud fraction (which is a measure of the fraction of a pixel area covered by a cloud) as well as the top height of clouds influences the spectroscopic response and cause a different BrO VCD response. Ideally, we would like to correct the cloud influence based on knowledge of its physical cause. However, it is unclear if this is simply due to shielding of the tropospheric BrO partial column below the clouds or a purely spectral response or has other origins. We therefore test a correction of these structures via an empirical scheme based on the two cloud parameters.
It is noteworthy that this decrease in the BrO column for cloudy scenes is an indication for cloud shielding of tropospheric BrO columns and can be used to derive and estimate the tropospheric column, as done by Theys et al. (2011). However, as it is unclear if the cloud relation does not have a different origin and in this study we simply want to remove non-volcanic influences on the BrO column, this question is not pursued further here.
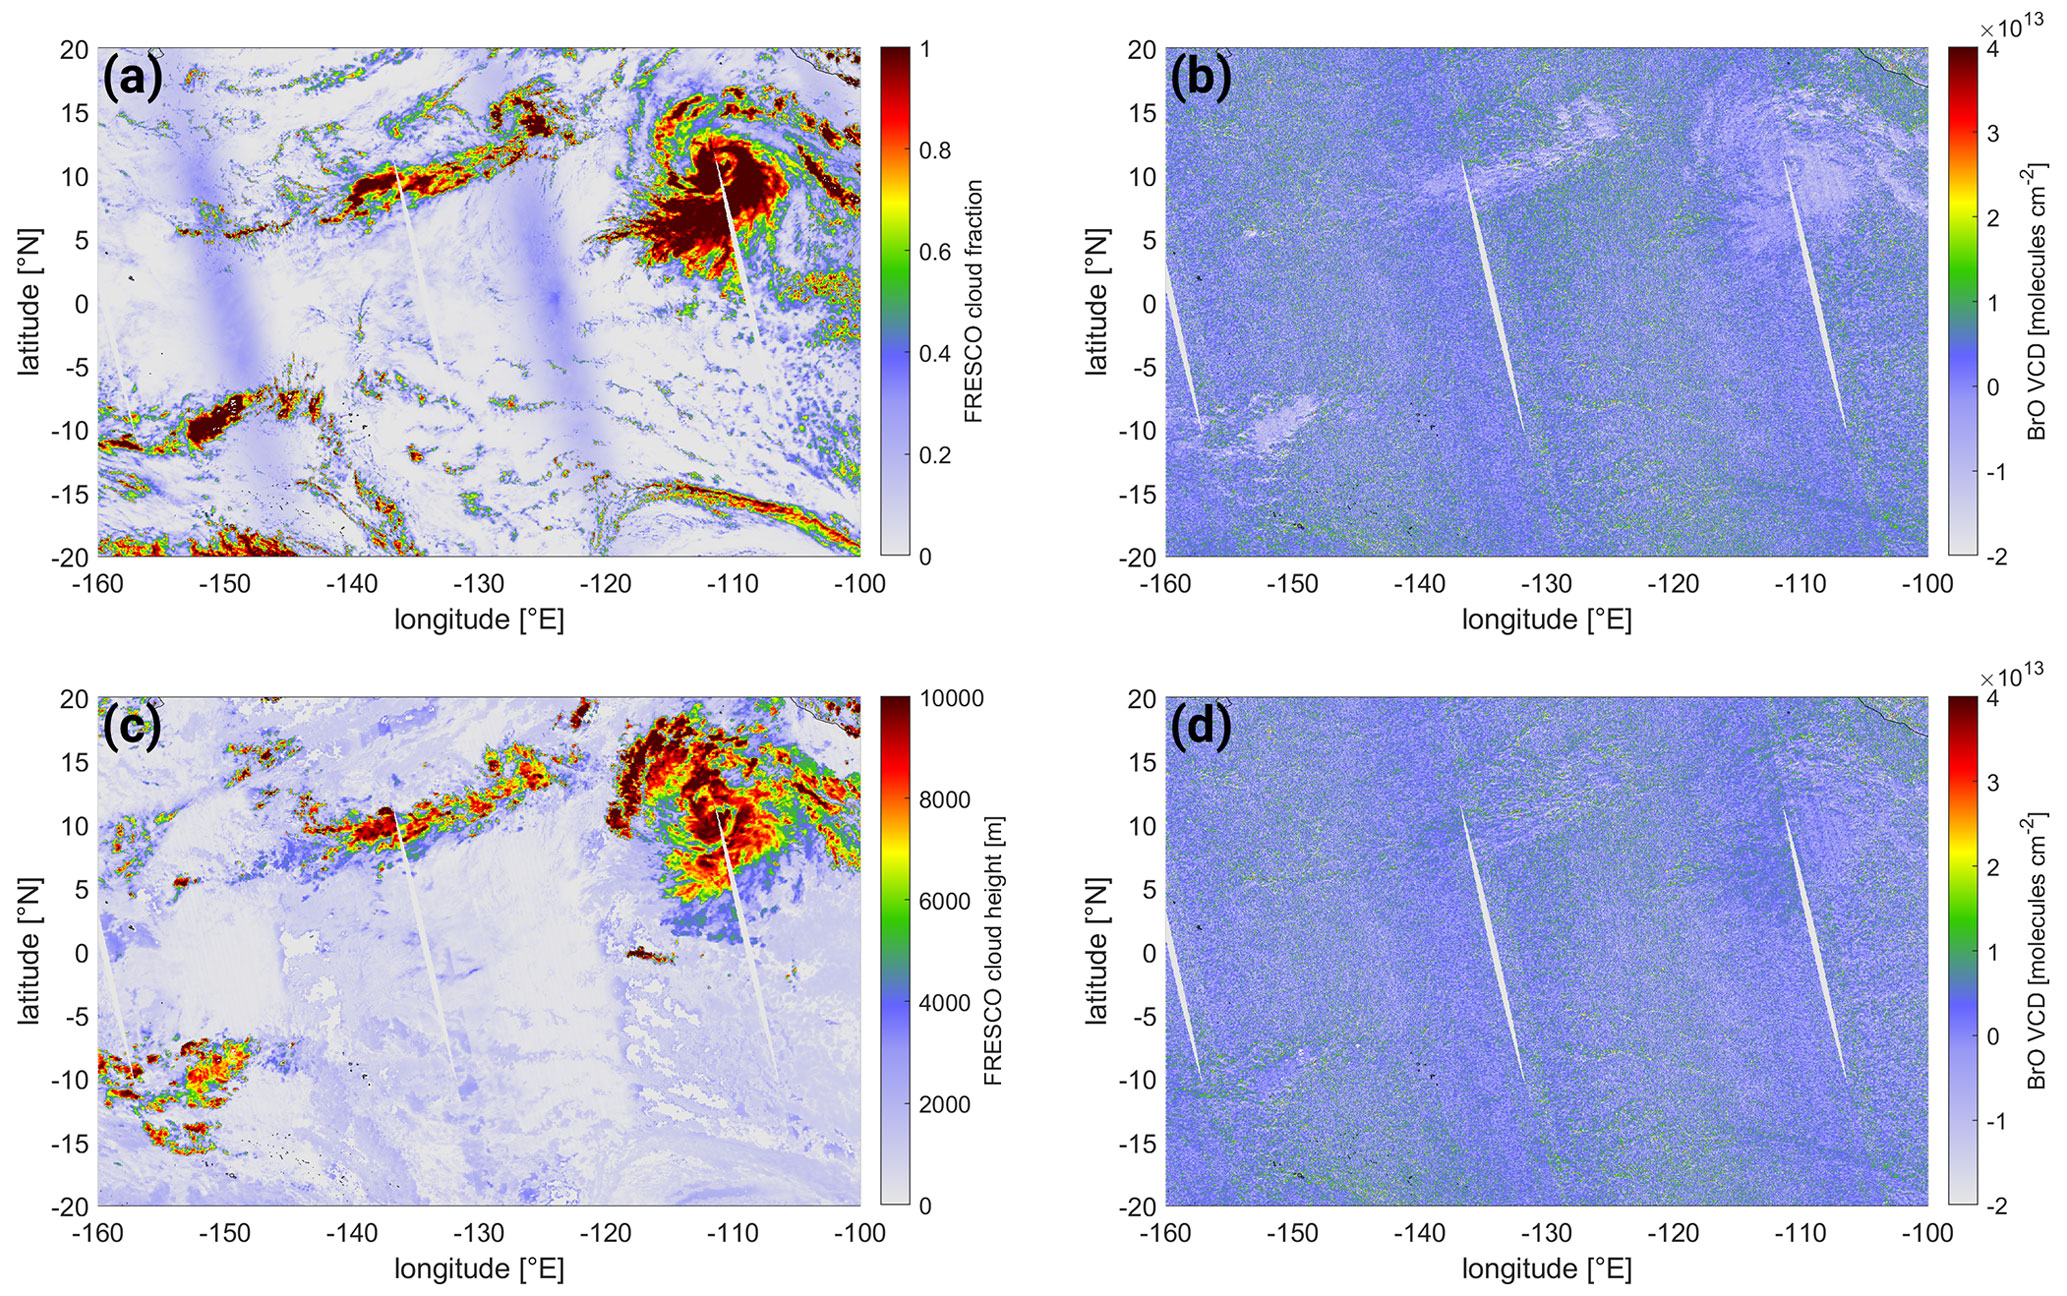
Figure 4(a) FRESCO cloud fraction, (b) BrO VCD from the SR 323–360 nm fit, (c) FRESCO cloud height, and (d) BrO VCD from the SR 323–360 nm fit after applying the correction scheme. Data taken over the equatorial region [±20∘ N, 160–100∘ W] on 1 October 2018.
The high-latitude example is depicted in Fig. 5, including the FRESCO CF (Fig. 5a) as well as the O3 VCD (Fig. 5c, taken from the BrO DOAS fit; see Sect. 2.1.2 for a description of the calculation of the O3 VCD) and the BrO VCD (Fig. 5b). There is a clear gradient in the BrO VCD visible along 50∘ N, where BrO VCDs increase by more than . This follows the gradient line of O3 along the same latitude (see Fig. 5c). Both BrO and O3 gradients coincide with the transition from mid-latitudes to polar air masses indicated by the presence of the jet stream and a change in the tropopause height (see Fig. B1), where O3 is higher and the stratospheric column is increasing. This gradient is overlaid by structures in the BrO VCD map south of 50∘ N, e.g., between 40–45∘ N and 85–95∘ W. These coincide with cloud cover (indicated by the cloud fraction) and show a positive BrO signal for high cloud cover. Both these gradients and structures in the BrO VCD are reduced after applying the correction scheme (see Sect. 4.2), as can be seen in the corresponding map of the corrected BrO VCD (Fig. 5d).
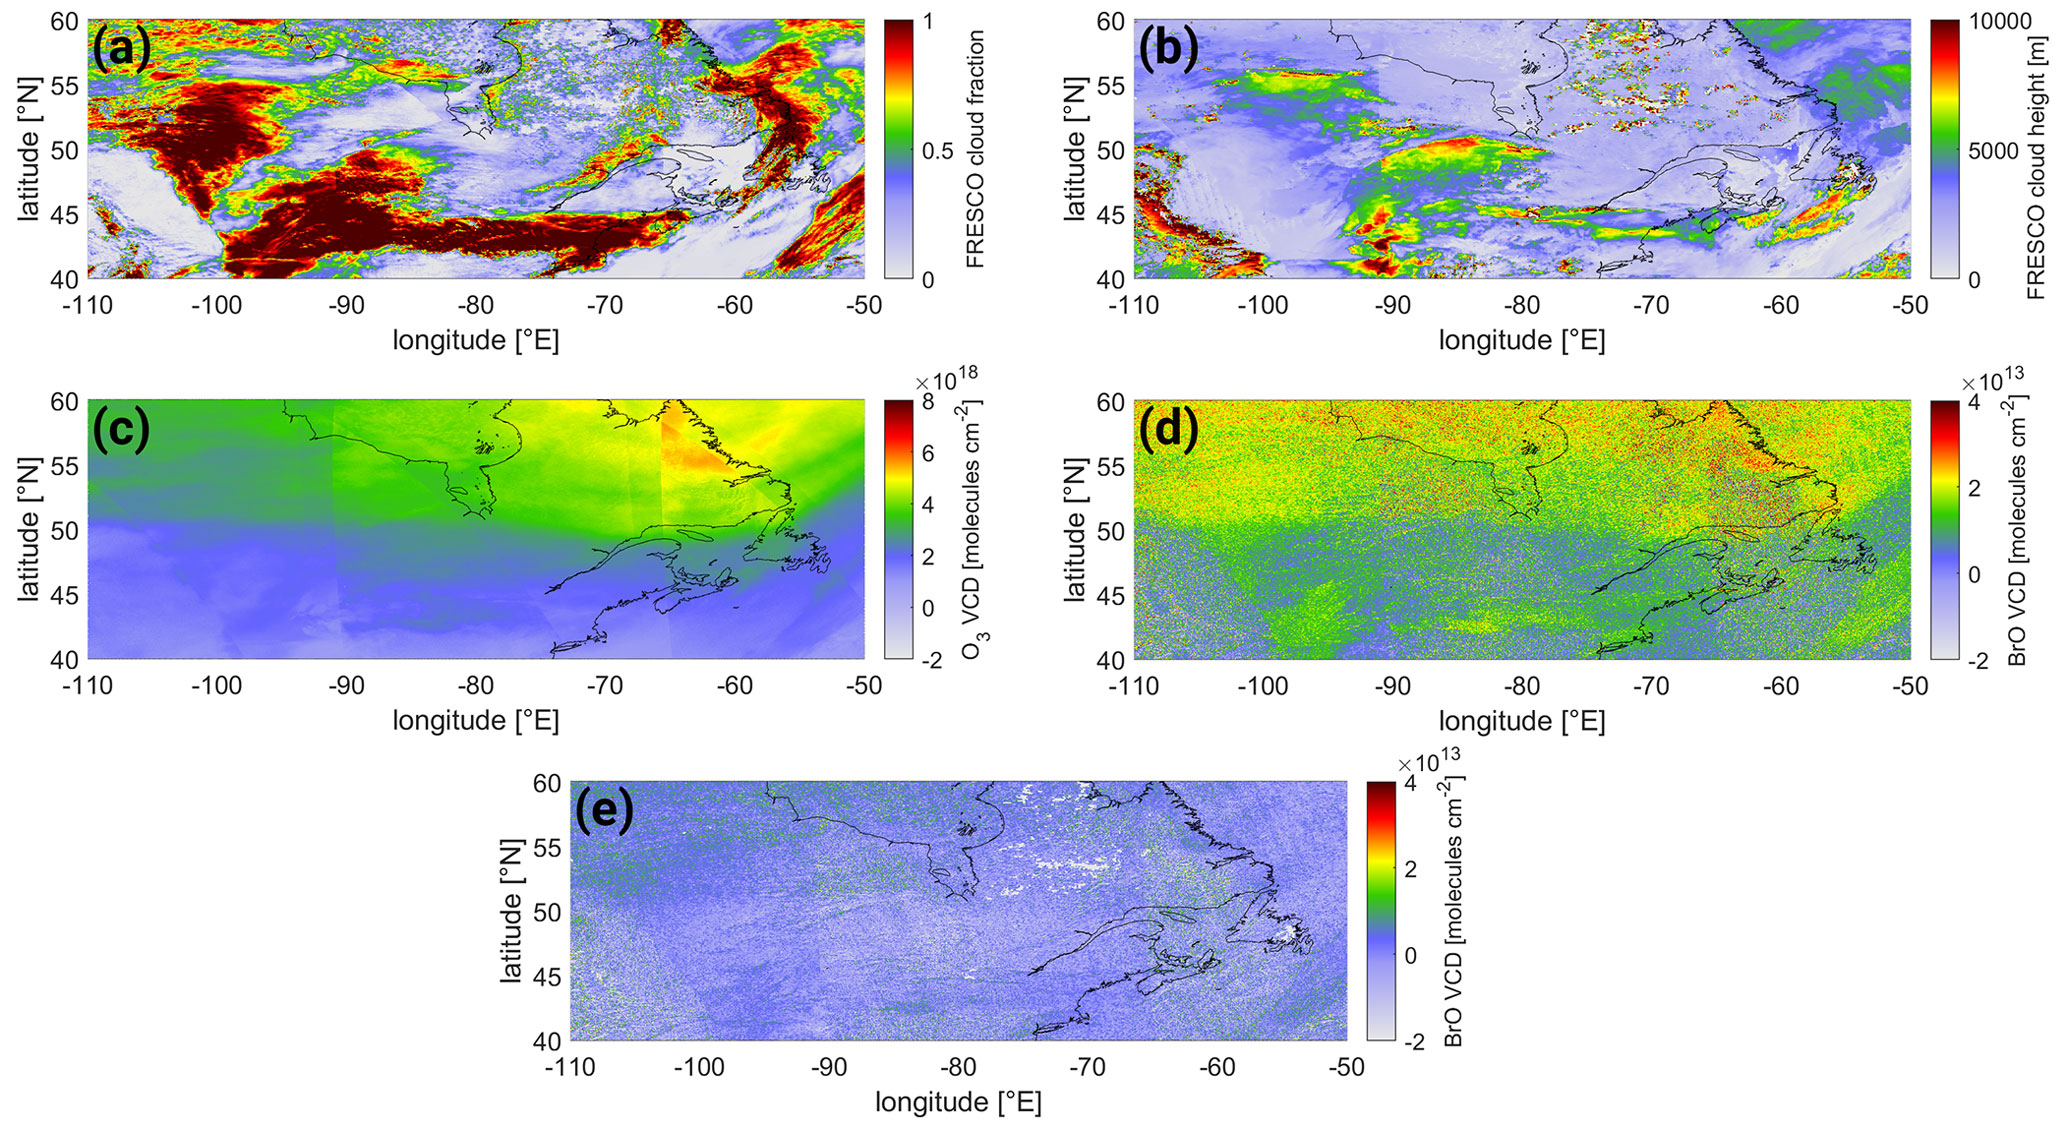
Figure 5Maps of the (a) FRESCO cloud fraction, (b) FRESCO cloud height, (c) retrieved O3 VCD, and (d) BrO VCD from the SR 323–360 nm fit without any correction and (e) BrO VCD from the SR 323–360 nm fit after applying the correction scheme. Data taken over the northern high-latitude region [40–60∘ N, 110–50∘ W] on 1 October 2018.
In the following, we will investigate the cloud and O3 dependency for different latitudes. In order to investigate this potentially systematic effect of clouds on the BrO retrieval, the individual pixels are sorted in bins of 0.05 for the cloud fraction and 500 m cloud height (CH–CF bins). This is done first for the complete equatorial latitude band [ N, E]. The magnitude of the BrO response is quantified by taking the mean BrO VCD of all pixels in each respective bin.
The mean BrO VCD systematically decreases, both for increasing CH and increasing CF. The corresponding plots for all eight fits can be found in Fig. B2. The relation of the mean BrO VCD both to CH and CF appears to be almost linear for all eight fit ranges but with varying strength. Therefore this linearity seems independent of the fit settings chosen here, allowing for deriving a correction term, which will be described in Sect. 4.2.
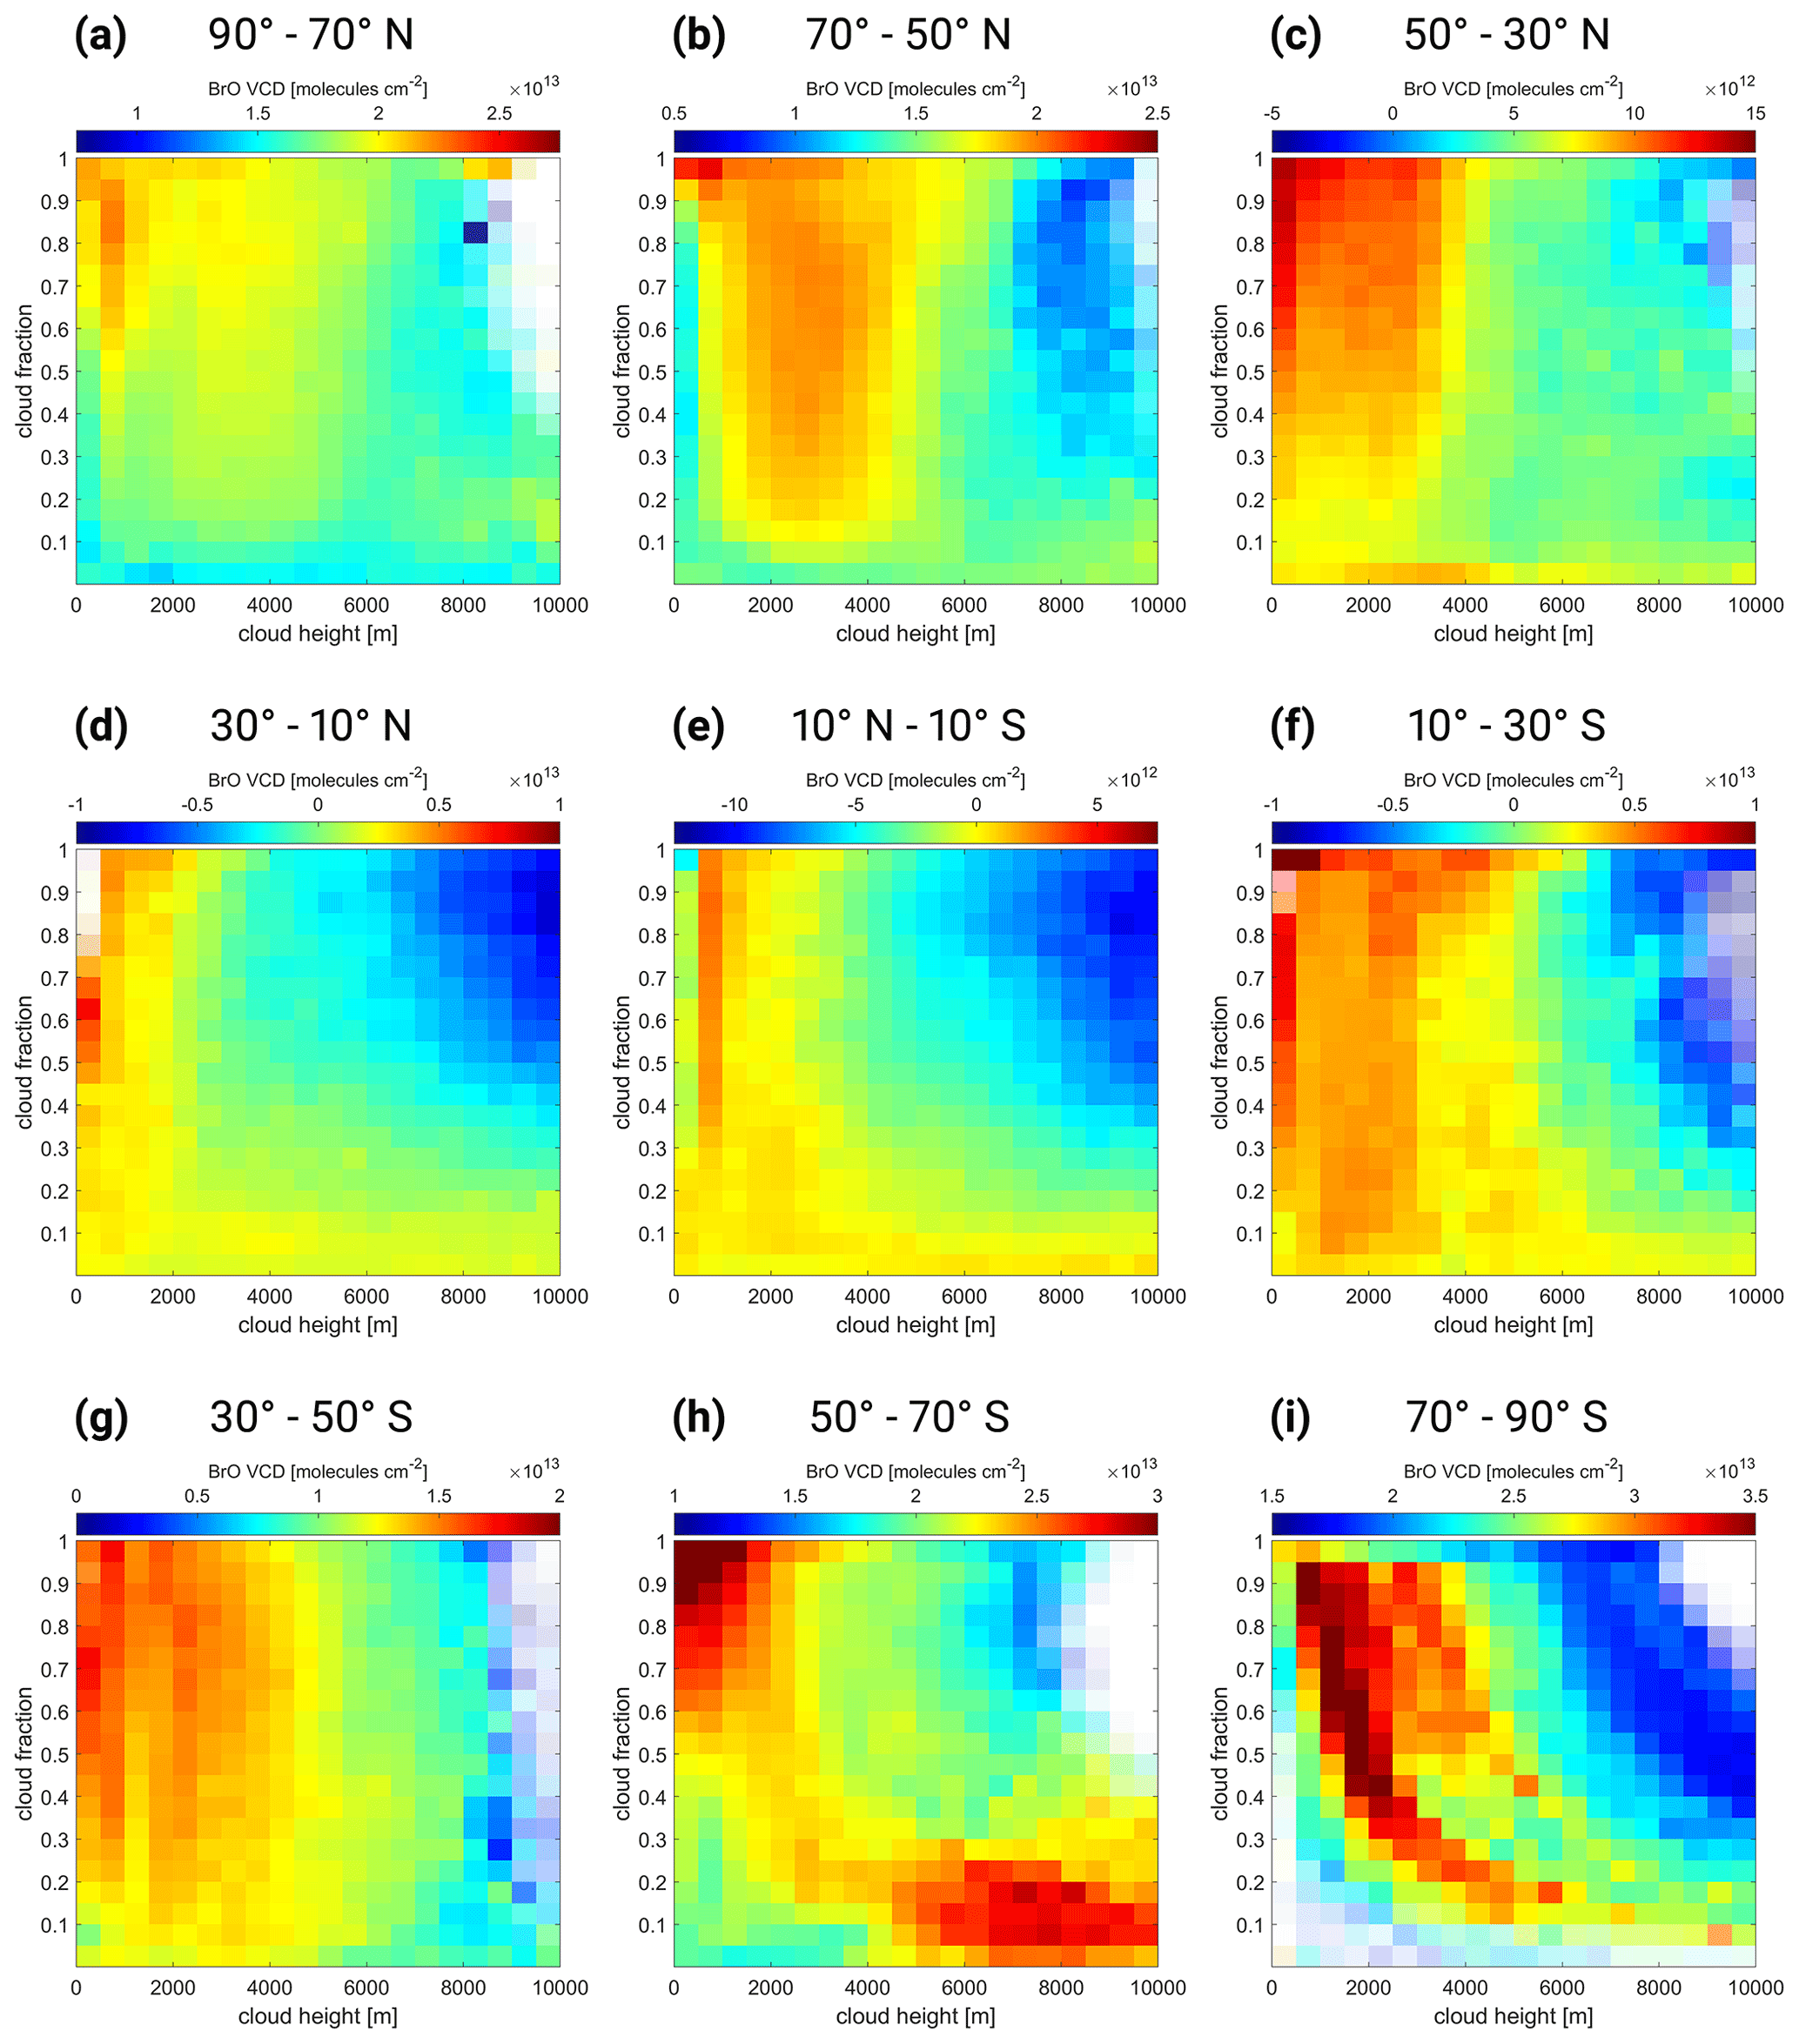
Figure 6Mean BrO VCD for the cloud height–cloud fraction bins for the SR 323–360 nm fit for the global latitude bands in 20∘ steps from (a) 90∘ N to (i) 90∘ S. (d–f) The almost linear influence of both cloud height and cloud fraction is clearly visible for tropical latitudes. This changes for (a–c) mid-latitudes to (g–i) high latitudes and where other influences related to the stratospheric column independent of the cloud parameters can also be seen. Note the different color scales for each subplot. They always encompass the same range of but start at different BrO VCDs.
While the cloud influence is very strong and rather linear for the equatorial region, there are also systematic structures in mid-latitudes and high latitudes (see Fig. 3). Since these structures are related not only to the presence of clouds but also to the O3 columns (see Fig. 5) and possibly other factors, the same CH–CF binning is performed for 20∘ latitude bands over the whole globe, which are shown in Fig. 6 for the SR 323–360 nm fit. The almost linear dependency on CH and CF observed for the Equator case is also found for neighboring latitude bands from 30 to 10∘ S and from 10 to 30∘ N. For mid-latitudes to high latitudes north and south, this dependency of BrO on CH and CF is changing and/or is overlaid by other features.
While the general CH dependency of the BrO VCD (higher clouds, lower BrO VCD) predominates for high latitudes, the CF dependency appears to be changing its sign so that a lower cloud fraction leads to a lower BrO VCD for 70–90∘ N. However, there is an overlaying BrO signal for cloud heights between 1000 and 5000 m, independent of the cloud fraction in this region, which complicates the interpretation. This feature is clearly visible for northern latitudes (30–90∘ N) and appears to shift to higher cloud heights for higher latitudes; i.e., this shifts from 0–3000 to 1000–4000 and to 2000–5000 m CH for 30–50, 50–70, and 70–90∘ N respectively. These structures in the CH–CF plot are most likely caused by an increase in the stratospheric slant column (due to the high SZA at high latitudes). For latitudes south of 50∘ S additional structures occur, which are most likely attributed to tropospheric BrO enhancements during polar spring.
In order to correct for these systematic effects in the BrO VCDs, different correction approaches are investigated in the next section (Sect. 4.2). Since the dependency on cloud parameters is latitude dependent, the correction approach is applied to different latitude bands independently. Furthermore, since the systematic structures in high latitudes might be correlated to the stratospheric column, the inclusion of the O3 VCD in the correction scheme as a first-order indicator for the extent of the stratospheric column is tested.
4.2 Cloud and O3 correction scheme
In order to investigate and correct the effects of the three parameters of the cloud fraction, cloud height, and O3 VCD onto the BrO VCDs, three multi-dimensional polynomial fitting schemes are tested on the BrO VCDs of 1 October 2018.
The three correction schemes are referred to as “ozone”, “latitude”, and “ozone latitude” in the following (see Table 2). All schemes include the two cloud parameters of the cloud fraction and cloud height derived from FRESCO. In addition, the ozone and ozone latitude schemes also include the O3 VCD, taken from the BrO fit (see Sect. 2.1.2 for a detailed description about the calculation of the O3 VCD). The O3 VCD is then used in two of the three BrO correction schemes.
Table 2Overview over the cloud and O3 correction schemes. The applied latitude region, the fitted parameter, and their polynomial degrees are listed for the three correction schemes.
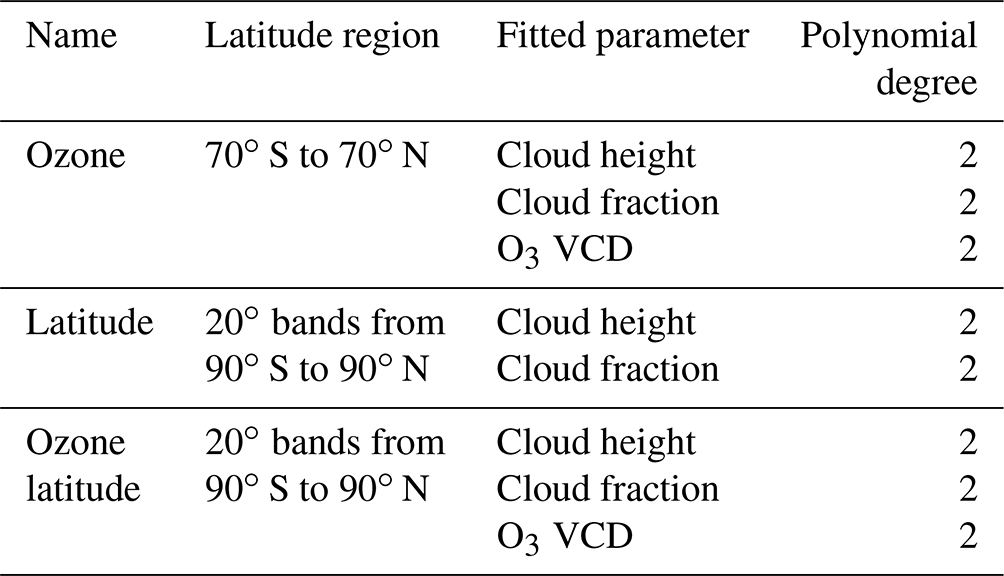
Each of the three BrO correction schemes is employed as a multi-dimensional polynomial P including the respective fitted parameters (see Table 2). Polynomial P comprising of p fitted parameters x1…xp and their corresponding polynomial degrees n1…np is defined in the following way:
where are the resulting fitted coefficients describing the dependency of the fitted quantity (in our case the BrO VCD) to the fitting parameters (in our case cloud parameters).
This means for example that for the latitude correction scheme (see Table 2), where the fitted parameters are the cloud height and the cloud fraction with a second-degree polynomial for both parameters, polynomial P looks like
The principle output of this fit is the coefficients . Afterwards polynomial P is subtracted from the uncorrected BrO VCDs forming the corrected BrO VCDs.
In this section polynomial P is tested for the complete global data set. However, for the latitude and ozone latitude correction schemes there are separate sets of coefficients for each 20∘ latitude band. Thus, for the retrieval of BrO inside a volcanic plume (Sect. 6) the correction coefficients can be calculated specifically for the latitude band around the volcano's latitude, ensuring a mostly accurate correction specific to each volcano's latitude.
In the following, the correction schemes will be applied and discussed for the SR 323–360 nm fit only. The correction schemes yield similar results for the other fits, but the SR 323–360 nm fit shows the best performance with respect to the HCHO influence (see Sect. 4.3) and statistical uncertainties (see Sect. 5.1) and is therefore chosen as the best fit in the end.
The corrected global maps – after applying the ozone, latitude, and ozone latitude correction schemes – are shown in Fig. 7a–c respectively for the settings of SR 323–360 nm (excluding HCHO). Note that the scale of the BrO VCD color code differs from the uncorrected map (see Fig. 3).
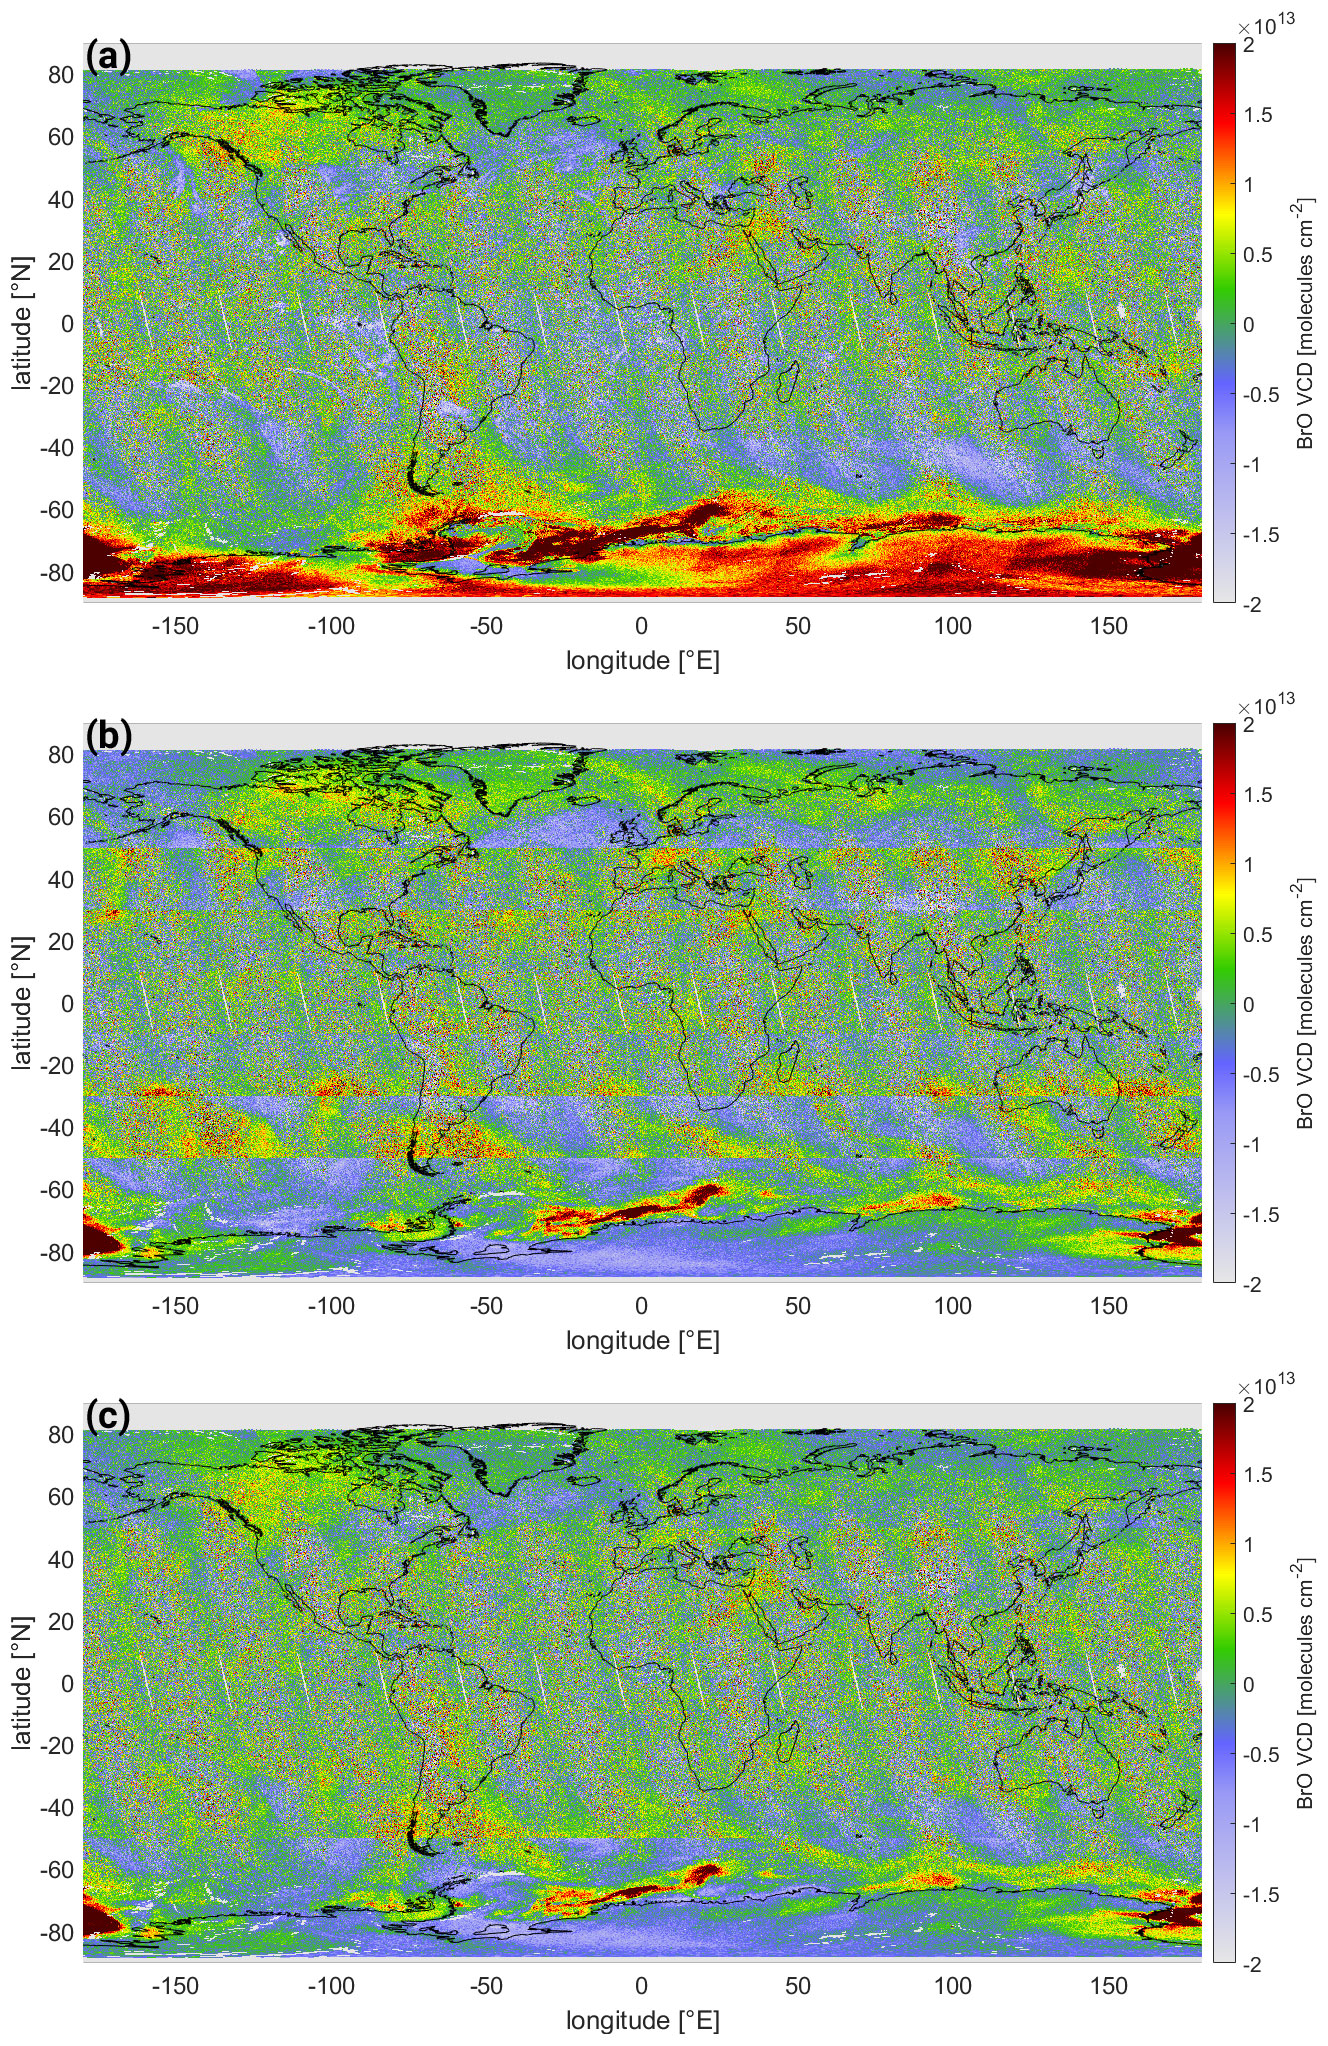
Figure 7Global map of the BrO VCDs of the SR 323–360 nm fit with (a) an ozone correction; (b) a CF and CH latitude correction only; and (c) a CH, CF, and O3 ozone latitude correction. The maps of the corresponding correction terms are plotted in Fig. B3.
The systematic structures in the equatorial region are effectively removed both by the latitude and ozone latitude correction schemes (Fig. 7b and c). For the ozone correction scheme (Fig. 7a), however, the systematic structures predominate even though they are reduced in magnitude.
The systematic structures in mid-latitudes to high latitudes are reduced for all three correction schemes. However, for the latitude correction scheme, which is the only one where the O3 VCD is not included as a parameter, there are still significant structures visible for latitudes larger than 30∘ N and S. The structures are best reduced by the ozone latitude correction scheme. However, it is important to note that even for this most sophisticated correction scheme, very strong BrO signals in the Antarctic region uncorrelated with O3 remain. These are probably tropospheric signals in the polar spring (cf. Wagner and Platt, 1998; Sihler et al., 2012). If volcanic plumes are analyzed for such conditions, the correction schemes developed in this study will not be able to separate the BrO in the volcanic plume from such events of enhanced tropospheric BrO.
For both the latitude and the ozone latitude correction schemes, the correction is done separately for 20∘ latitude bands. It can be seen that on the edges of the latitude bands jumps in the BrO VCD occur (see Fig. 7b and c). However, for the ozone latitude correction scheme (Fig. 7c) these only occur at high latitudes. As the latitude band's location can be adjusted freely, the latitude band will be chosen individually for each volcano in order to ensure that the volcano is located at its center and never on its edge (e.g., for Mt. Etna, Italy, located at 37∘ N, the latitude band of 25–45∘ N is chosen for the background correction; see Sect. 6.3). Furthermore, only a 20∘ latitude band around the volcano should be considered. Only very large plumes – recurring once every several years – might exceed this limit. For these cases the correction coefficients derived from the 20∘ latitude band surrounding the volcano are also applicable. For the development of a global BrO product including these corrections, the jumps on the edges of different correction bands might be avoided by an interpolation of the correction parameters with latitude.
In order to quantify the efficacy of the different correction schemes, the mean of the corrected BrO VCD is calculated for each CH–CF bin for each latitude band independently. The corresponding plots are depicted in Fig. 8 for all three correction schemes as well as the bins without any correction. Ideally, there should be no or little dependency on the cloud parameters remaining after correction and no structures independent of the cloud parameter appearing.
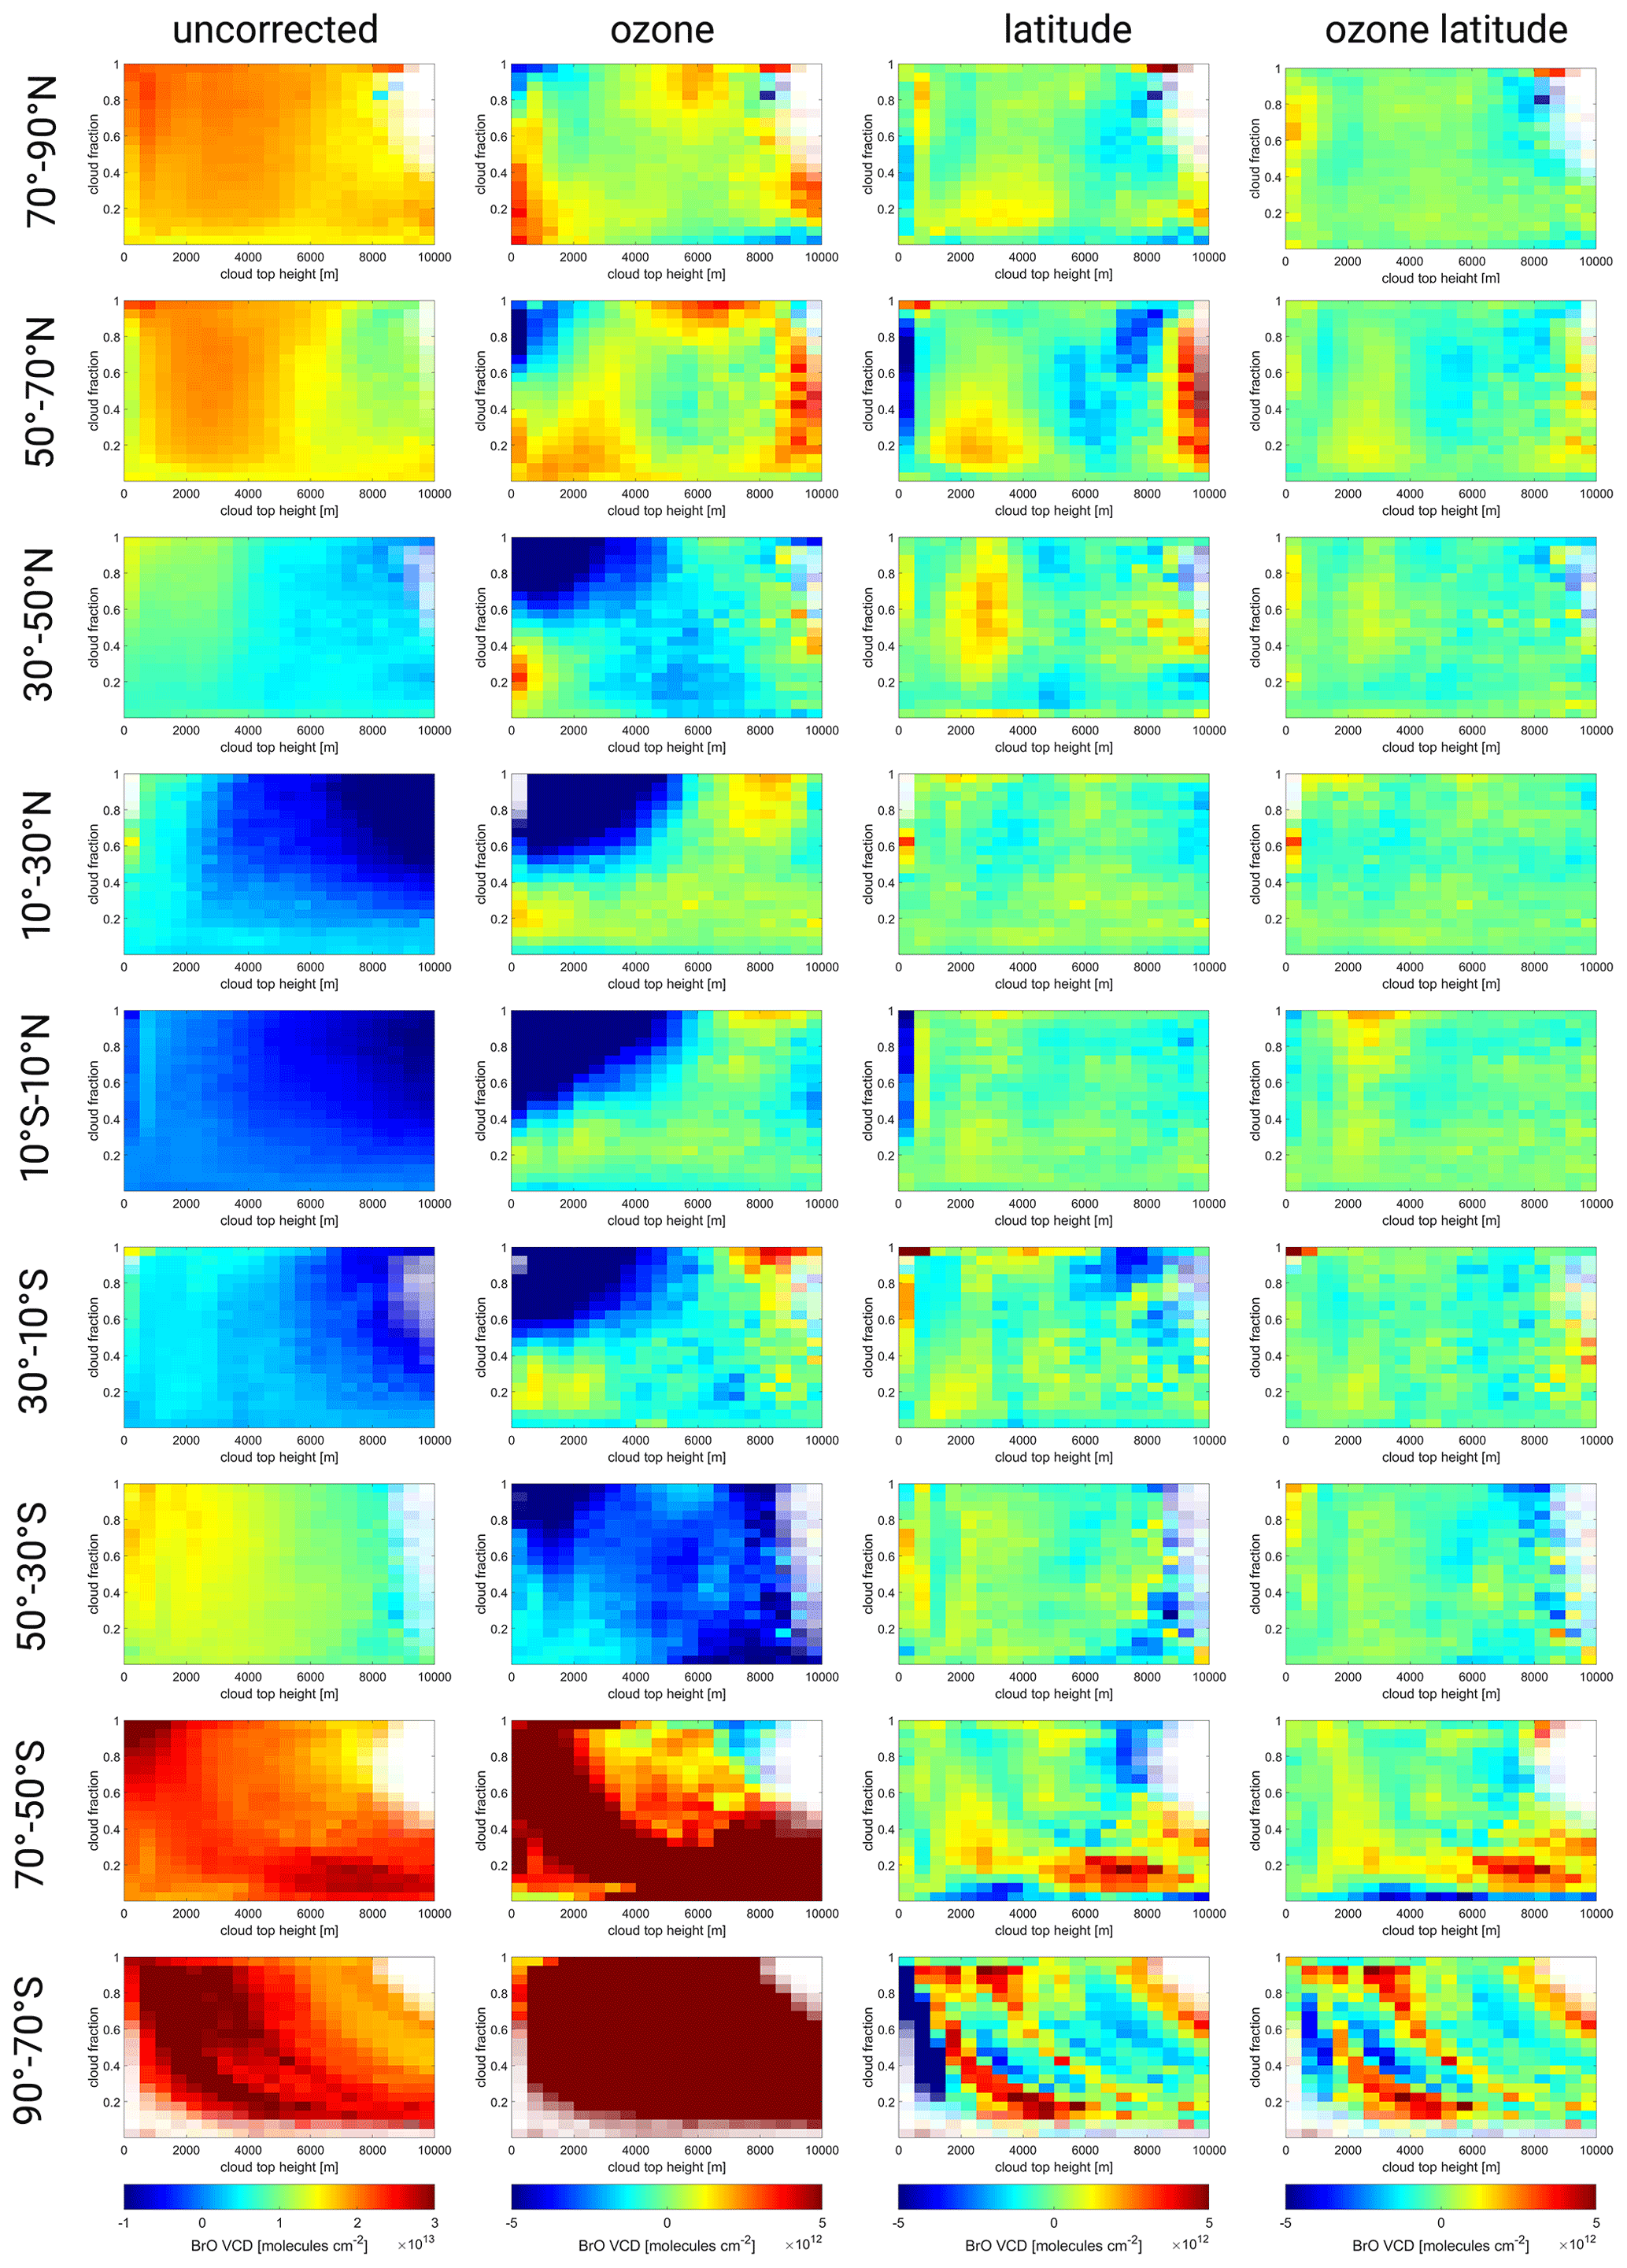
Figure 8Mean BrO VCD as a function of the cloud height–cloud fraction bins for different latitude bands (rows from north to south) and correction schemes (from left to right): the uncorrected BrO VCD and corrected BrO VCDs using the ozone, latitude, and ozone latitude correction scheme. Note that the color scale range for the uncorrected plots is 4 times larger compared to the corrected plots.
All three correction schemes reduce the cloud dependency. It is noteworthy that the color scale of the uncorrected plots is twice as large as that of the corrected ones.
It can be seen that the correction schemes working on each latitude band separately (latitude and ozone latitude) are much better at reducing the dependencies, both on the cloud fraction and on the cloud height compared to the global ozone correction scheme, which produces new CH–CF gradients in equatorial regions. However, these gradients are weaker than the original gradients. The latitude correction scheme reduces most cloud dependencies for latitude bins between 90∘ N and 50∘ S. However, cloud-independent signals remain in mid-latitudes to high latitudes. The inclusion of ozone in the correction scheme (ozone latitude) not only further reduces the cloud dependencies but most importantly drastically reduces the cloud-independent structures. For this correction scheme maximal differences in the CH–CF plots are typically for latitudes from 90∘ N to 50∘ S and for latitudes south of 50∘ S.
Thus, including O3 in the latitude-dependent correction scheme (ozone latitude) appears to be the best correction both with respect to consistency in the global map (see Fig. 7c) and in the CH–CF bin plots (see Fig. 8). Therefore, this correction scheme is chosen for this study. In this approach the correction scheme is performed on separate 20∘ latitudinal bands. For the calculation of the correction factors, we thus propose using the data on the 20∘ latitudinal band around the latitude of the volcanic plume.
From now on, all BrO VCDs used in this study will be, by default, corrected using the ozone latitude correction scheme.
4.3 Influence of formaldehyde
Formaldehyde (HCHO) is an organic compound emitted into the atmosphere mostly via biogenic emissions or biomass burning. The highest columns are observed in tropical regions (De Smedt et al., 2018). Since the cross-sections of BrO and HCHO in the UV range are very similar (see Fig. 1), atmospheric HCHO absorptions can cause systematic interference for the DOAS BrO retrieval.
The response of the eight different BrO DOAS fits to atmospheric HCHO absorption is investigated using the example of a biomass burning event in Africa between 0–20∘ S and 10∘ W–40∘ E on 1 October 2018.
The main question is whether the inclusion of the HCHO absorption cross-section in the fit is necessary for the analysis of BrO in volcanic plumes, i.e., whether the exclusion of HCHO in the fit introduces a systematic offset in the BrO results in the presence of enhanced HCHO absorption. One reason why it would be advantageous not to include the HCHO absorption cross-section is that the analysis yields more noise in the retrieved BrO SCDs if HCHO is included (as shown in Sect. 5.1). Equally important is the question of which fit wavelength range results in the lowest systematic influence of HCHO onto the BrO results, as well as the quantification of the strength of a potential false BrO signal in the presence of enhanced HCHO absorption.
For information on the atmospheric HCHO column, the HCHO SCDs from the operational TROPOMI HCHO L2 product (De Smedt et al., 2018) are used. The cloud information (cloud fraction and cloud height) is taken from FRESCO as in the previous sections.
The HCHO SCD derived from the operational TROPOMI HCHO L2 product for the selected region is plotted in Fig. 9 (denoted “HCHO L2 SCD”, topmost left). There is a region of high HCHO columns exceeding on the African continent around 5∘ S, 29∘ E. Most importantly, this region is mostly cloud free (see Fig. 9, denoted “FRESCO cloud fraction”, topmost right), ensuring minimal influence of clouds.
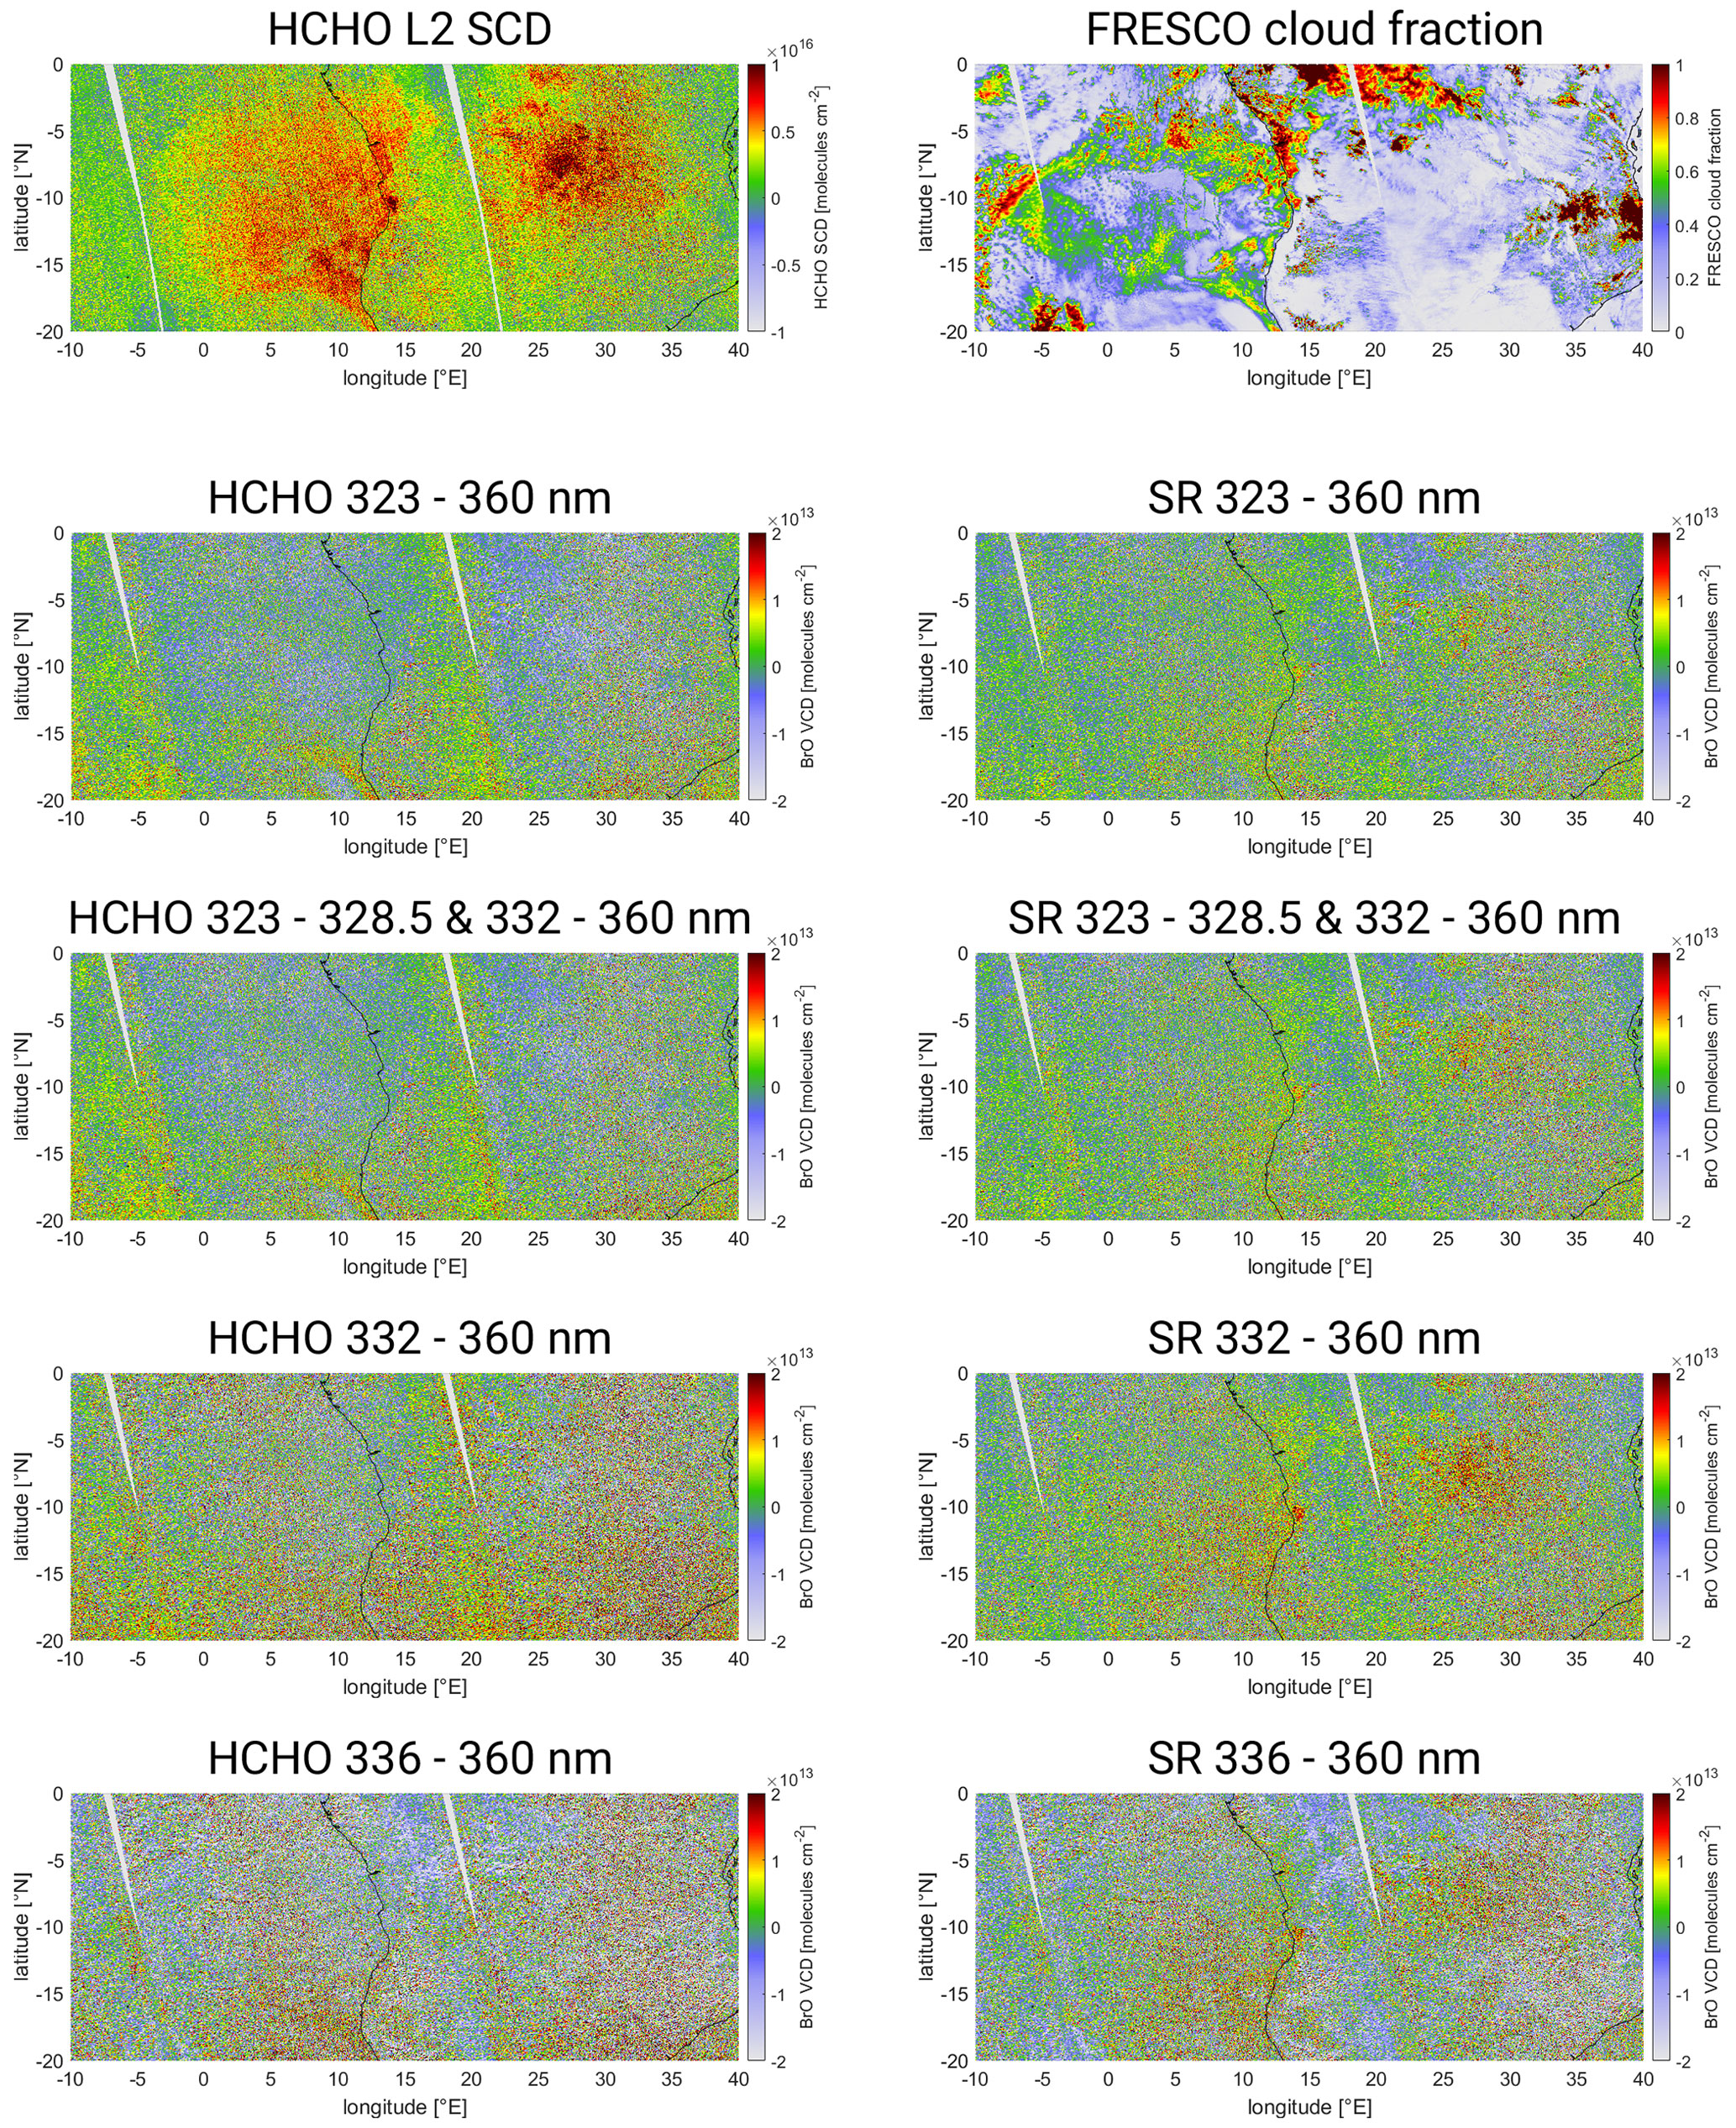
Figure 9Maps of the auxiliary data and the BrO VCD for the eight fits over the African biomass burning region on 1 October 2018. The auxiliary data in the topmost row are as follows: operational TROPOMI HCHO SCD (left) and FRESCO cloud fraction (right). Below is found the BrO VCD: BrO VCDs for the eight different fit ranges. The four fit wavelength ranges are listed from the second row from the top to the bottom row: 323–360 nm, 323–328.5 and 332–360 nm, 332–360 nm, and 336–360 nm. The left column contains fits including HCHO (HCHO); the right column contains fits excluding HCHO (SR).
The BrO VCDs are corrected using the ozone latitude correction scheme described in Sect. 4.2. The corresponding maps for the eight fits are plotted in Fig. 9. The maps of the fits including HCHO (HCHO, Fig. 9, left column) do not reveal a distinct positive BrO VCD signal in the region of the HCHO event. To the contrary, there rather seems to be a systematic negative offset in this region, most visible for the HCHO 323–360 nm and HCHO 323–328.5 and 332–360 nm fits. The fits excluding HCHO (SR, Fig. 9, right column) show a positive offset in the region of high HCHO SCDs. This is most prominent for the SR 332–360 nm fit (fourth from top, right column), where the BrO VCDs exceed 1×10¹³ over a large area.
In order to investigate the potential systematic response of the BrO retrieval onto HCHO, the pixels are separated into bins of HCHO SCD and cloud fraction. In order to separate the HCHO effect from potential cloud influence (which is also an error source in the operational HCHO fit; De Smedt et al., 2018), at this point only cloud-free pixels are considered, i.e., cloud fractions below 0.1. The resulting mean BrO VCDs for the different HCHO bins for all eights fits are shown in Fig. 10. For the fits including the HCHO cross-section (HCHO, solid lines in Fig. 10) the BrO VCD is anti-correlated to the HCHO SCD; i.e., negative HCHO SCDs are found together with positive BrO SCDs which decrease almost linearly towards higher HCHO SCDs. This is consistent for all four fit ranges. However, HCHO 332–360 nm and HCHO 336–360 nm show the strongest response, while the fits starting at 323 nm show a slightly weaker response. The fits not including the HCHO cross-section (SR, dashed lines in Fig. 10) show a positive response to HCHO; i.e., BrO SCDs increase for increasing HCHO SCDs. However, this only occurs for high HCHO SCDs and varies strongly for the different fit ranges. The effect is strongest for the fit range of SR 332–360 nm, where BrO VCDs exceed , whereas it is much less pronounced for the other fit ranges, where maximal BrO VCDs are in the range of . In addition, for low HCHO SCDs the BrO VCD changes only slightly or remains constant. This is most prominent for the SR 323–360 nm fit (dashed green line). Here, the BrO VCDs are 0 for HCHO SCDs below . For higher HCHO SCDs, the BrO VCDs slowly increase, reaching about for maximal HCHO SCDs of about . Interestingly the SR 323–328.5 and 332–360 nm fit, in which an overlapping absorption band is left out compared to the SR 323–360 nm fit and thus a weaker response would be expected, shows a higher false-positive signal.
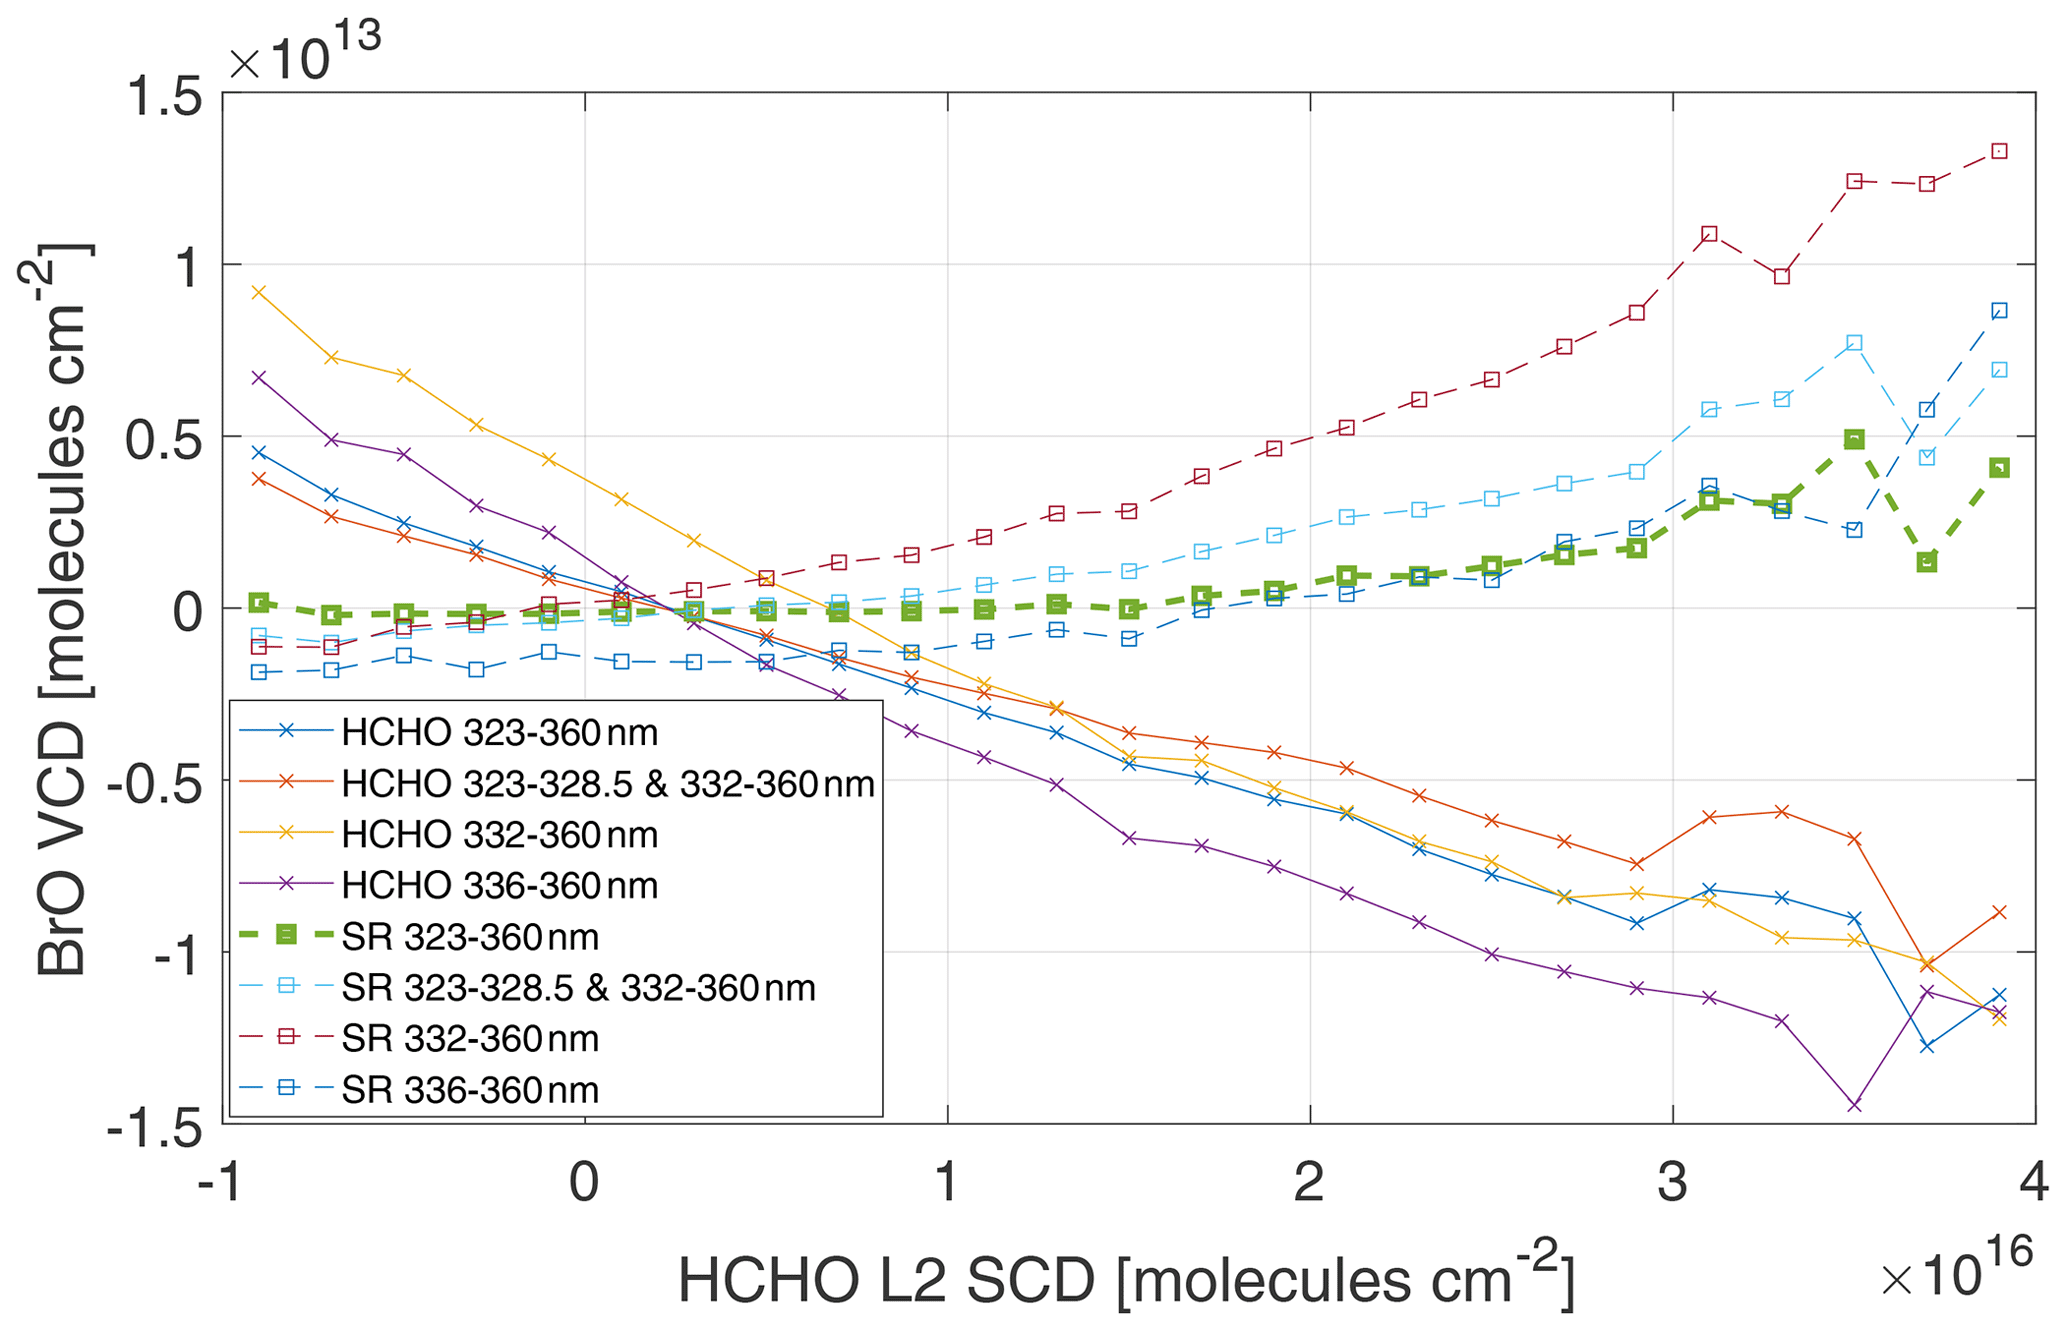
Figure 10Mean BrO VCD as a function of the HCHO SCD for the African biomass region on 1 October 2018 for the eight different fits including HCHO (HCHO) and excluding HCHO (SR). Only cloud-free pixels (cloud fraction <0.1) are considered.
In order to also include cloudy scenes, the mean BrO SCD is calculated for all the HCHO–CF bins. The corresponding plots for the eight fits are shown in Fig. B4, where the four different fit wavelength ranges are plotted from left to right. The fits excluding the HCHO cross-section are in the upper row, while the fits including the HCHO cross-section are plotted in the lower row.
Both the effects of the decreasing BrO SCDs with increasing HCHO SCD for the fits including the HCHO cross-section (HCHO) and the opposite behavior of the fits not including the HCHO cross-section (SR) also predominate for cloudy scenes but are sometimes weaker. Nevertheless, for volcanoes in regions where HCHO columns are high, spatial HCHO patterns overlapping with the volcanic plumes (identified by their SO2 signal), these effects should be considered.
It can be thus concluded that the inclusion of the HCHO cross-section in the BrO DOAS retrieval is not necessary. Even though there can be a systematic false-positive BrO response produced by very high HCHO columns, this effect is very low for the SR 323–360 nm fit, with no response for HCHO SCDs below and a response not exceeding for very large columns. HCHO columns above are only observed for tropical biomass burning events, mostly occurring around the Equator; i.e., the systematic impact of HCHO on the BrO retrieval using the SR 323–360 nm fit is negligible for most cases.
4.4 Quantification of the systematic effects
In order to quantify the uncertainty originating from remaining systematic uncertainties onto the retrieval, i.e., the potential “false” BrO signal created by clouds, O3, or other systematic effects, we look at the BrO VCD of the SR 323–360 nm fit (after the correction with the ozone latitude correction scheme).
The uncertainties in any data set are comprised of both statistical and systematic uncertainties. By averaging over neighboring pixels the statistical variation can be gradually reduced, and often the remaining uncertainties can be attributed to systematic effects. The statistical variation can be quantified by a Gaussian fit over the BrO VCD distribution, and the statistical variation can then be estimated by the standard deviation. Statistical fluctuation can be reduced by spatial binning of neighboring pixels, which reduces the standard deviation of the binned data by , where N is the number of pixels binned. Systematic effects however can generally not be eliminated with spatial averaging/binning. Thus, ideally only the systematic effects remain for high binning factors, and the deviation from the expected decrease can be used as an estimate for the order of magnitude of systematic effects.
In order to estimate the systematic uncertainties, we employ a spatial binning of neighboring pixels using binning factors of 1 to 100 in both spatial dimensions, corresponding to 1 to 10 000 pixels binned respectively. For each binning factor as well as for each latitude band a Gaussian fit is done separately. The resulting standard deviations are plotted in Fig. 11.
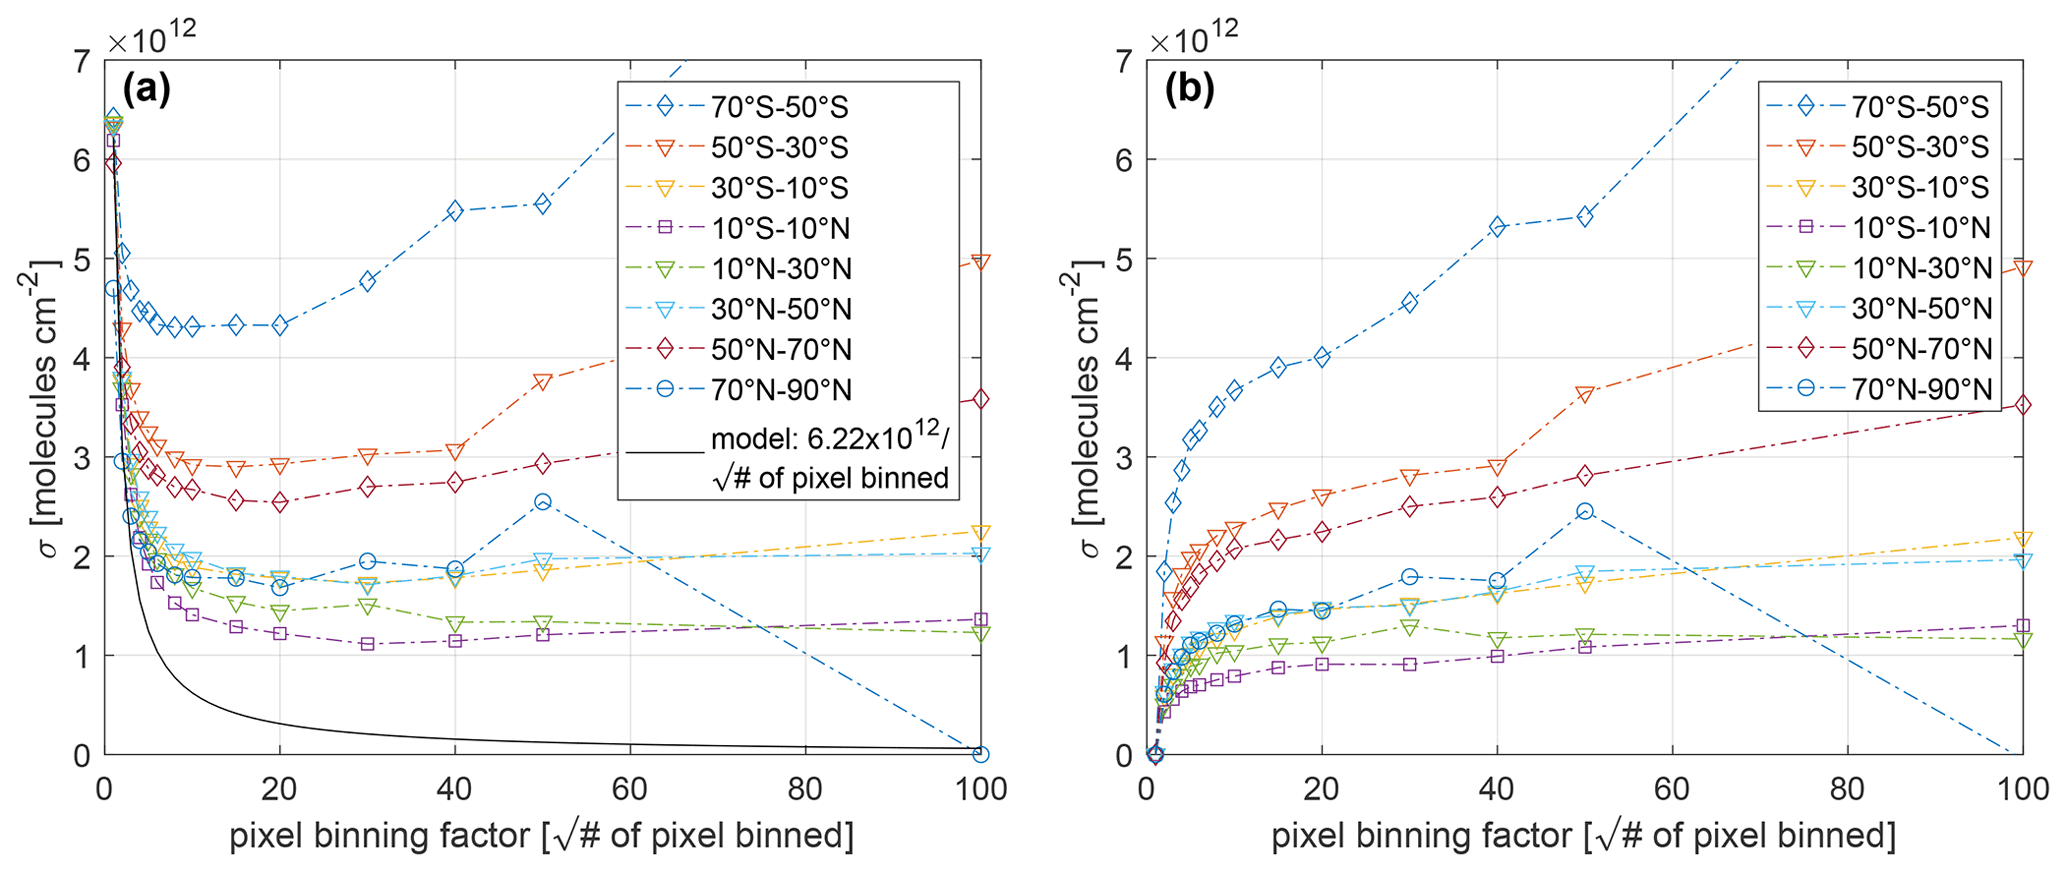
Figure 11(a) The standard deviation of the BrO VCD distribution for different binnings for the seven latitude bands (colored lines). Also shown are the results of a model assuming that the total variation would be purely statistically distributed (, where N is the number of pixels binned; black line). For illustration purposes only the model curve for the equatorial region [10∘ S–10∘ N] is plotted. (b) The difference from the statistical model is plotted for the seven latitude bands. For each latitude band an individual model curve based on the respective standard deviation for a pixel binning factor of 1 is used.
It can be seen in Fig. 11 that the standard deviation decreases more slowly for increasing binning factors (square root of the number of pixels binned) compared to the purely statistical model (black line in Fig. 11a) for all latitudes. For binning factors exceeding 20 (i.e., more than 400 pixels are binned together) the statistical model predicts a standard deviation of less than , while the measured data show a standard deviation between 1 and depending on the latitude. Thus, this remaining variance can be attributed to systematic effects. Around the Equator (10∘ S and 10∘ N; Fig. 11b, violet square) the minimum standard deviation is almost , and this is chosen to be representative of the equatorial region. For the mid-latitudes below 50∘ N (triangles in Fig. 11) and the bands of 10–30∘ N (green triangle), 30–50∘ N (light-blue triangle), and 10–30∘ S (yellow triangle), the standard deviation is in the range of 1–, while it is for the band of 30–50∘ S (light-red triangle). We therefore choose the uncertainty to be for mid-latitudes. For the high latitudes north of 50∘ N (dark-red diamond and dark-blue circle) and south of 50∘ S (blue diamond), there is a large difference. The northern high latitudes (dark-red diamond and dark-blue circle) show a standard deviation of 2.5×10¹² and , similar to the latitude band of 30–50∘ S (light-red triangle). The same latitude band in the south (50–70∘ S, blue triangle), where the polar spring induces tropospheric BrO enhancements, which are not accounted for by the latitude ozone correction, yields a much higher standard deviation of . For high latitudes, we therefore choose an uncertainty of under normal conditions and an uncertainty of for polar-spring conditions. The latitude band of 70–90∘ S did not yield a meaningful Gaussian fit due to the strong interference of an enhanced tropospheric BrO event in polar spring. These uncertainties are then used as general systematic uncertainties in Table 3.
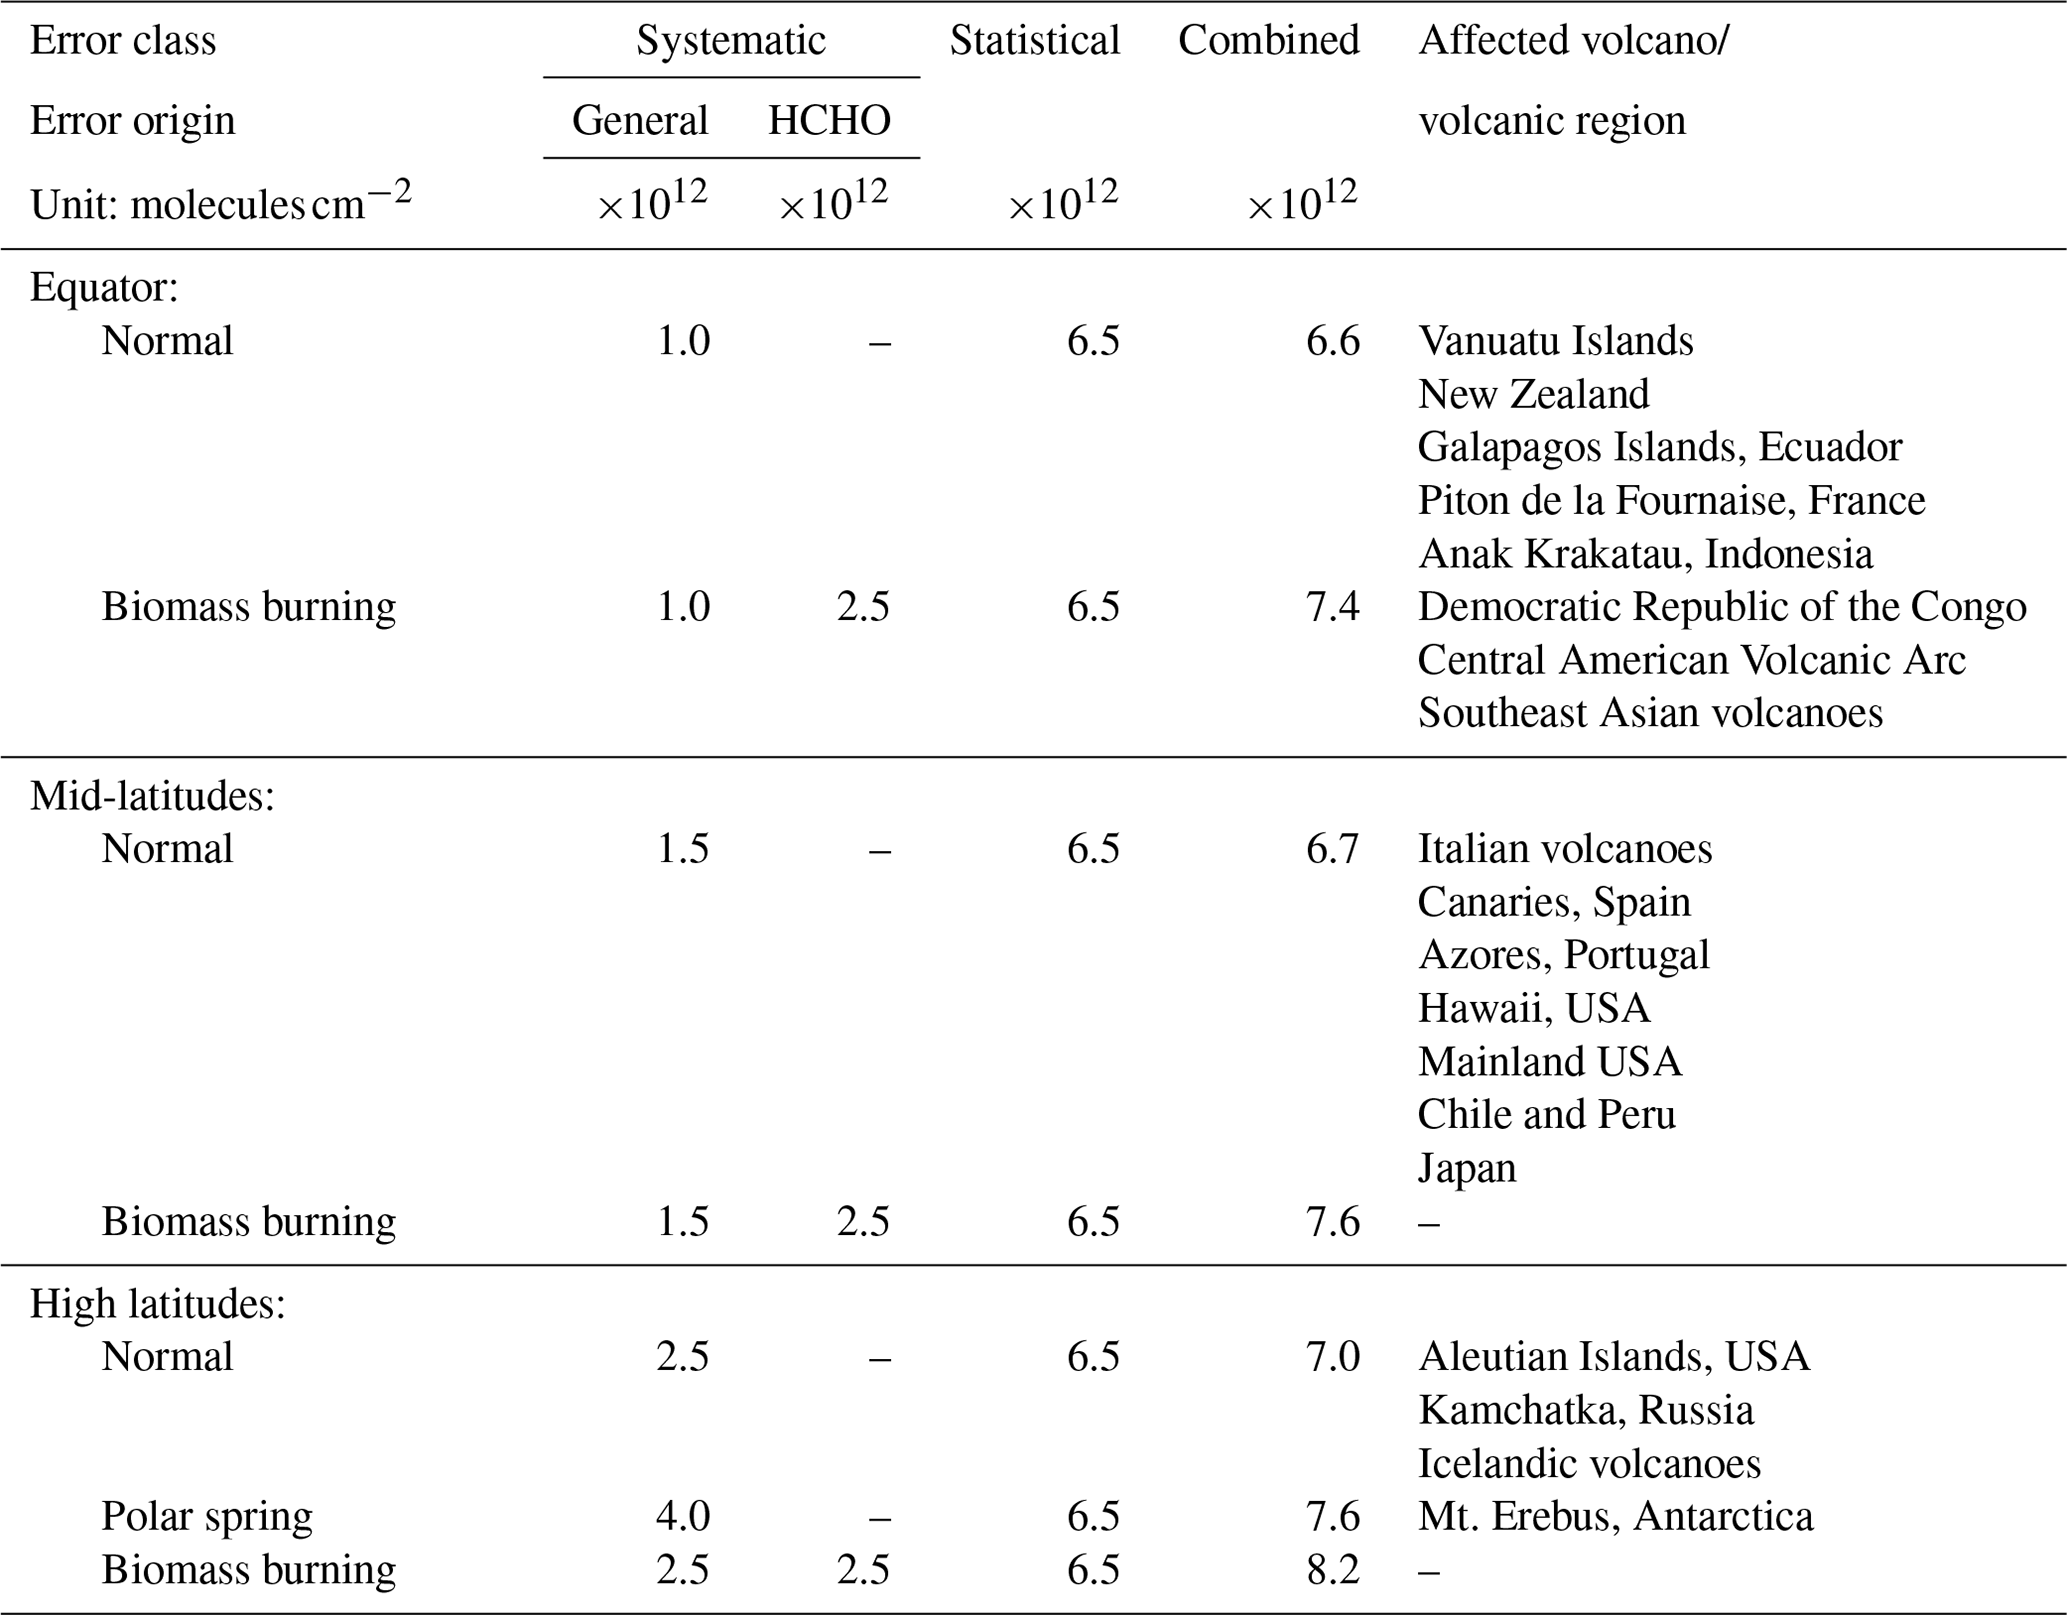
Table 3Overview of the systematic and statistical error estimates for different latitudes and scenes. Recently active volcanic regions are listed for each scenario.
It is noteworthy that for high-latitude bands of 70–50∘ S, 50–30∘ S, and 50∘ S–70∘ N, there is even an increase in the standard deviation for binning factors above 20. This is due to the lower number of total pixels in this region. Due to the limited light availability in these regions (solar zenith angle ) which will lead to an even smaller number of data points after binning. This effect can be seen for all latitudes where a slight increase in the standard deviation compared to lower binning factors is found.
In addition to the systematic influences onto the BrO retrieval, the statistical uncertainties in the eight BrO DOAS fits also has to be taken into account in deciding which fit settings are optimal.
5.1 Quantification of the statistical uncertainties
In order to investigate the statistical performance of the BrO DOAS fit, the distribution of BrO VCDs in the equatorial region [ N, 180∘ W–180∘ E] is examined for all eight fit settings (see Fig. 12). The distributions are separated into the fits excluding the HCHO cross-section (SR, Fig. 12a) and the ones including the HCHO cross-section (HCHO, Fig. 12b) so that the same fit wavelength ranges have the same colors in both subplots. Increasing the fit wavelength range towards a lower wavelength leads to a significant reduction in the statistical variation for both fit settings. For the SR fits the smallest fit range (SR 336–360 nm, which is the baseline fit range from Sihler et al., 2012) shows a standard deviation σ of , which subsequently decreases to (SR 332–360 nm) and finally (SR 323–360 nm) when the wavelength range is expanded. This is to be expected as a larger wavelength range increases the information content.
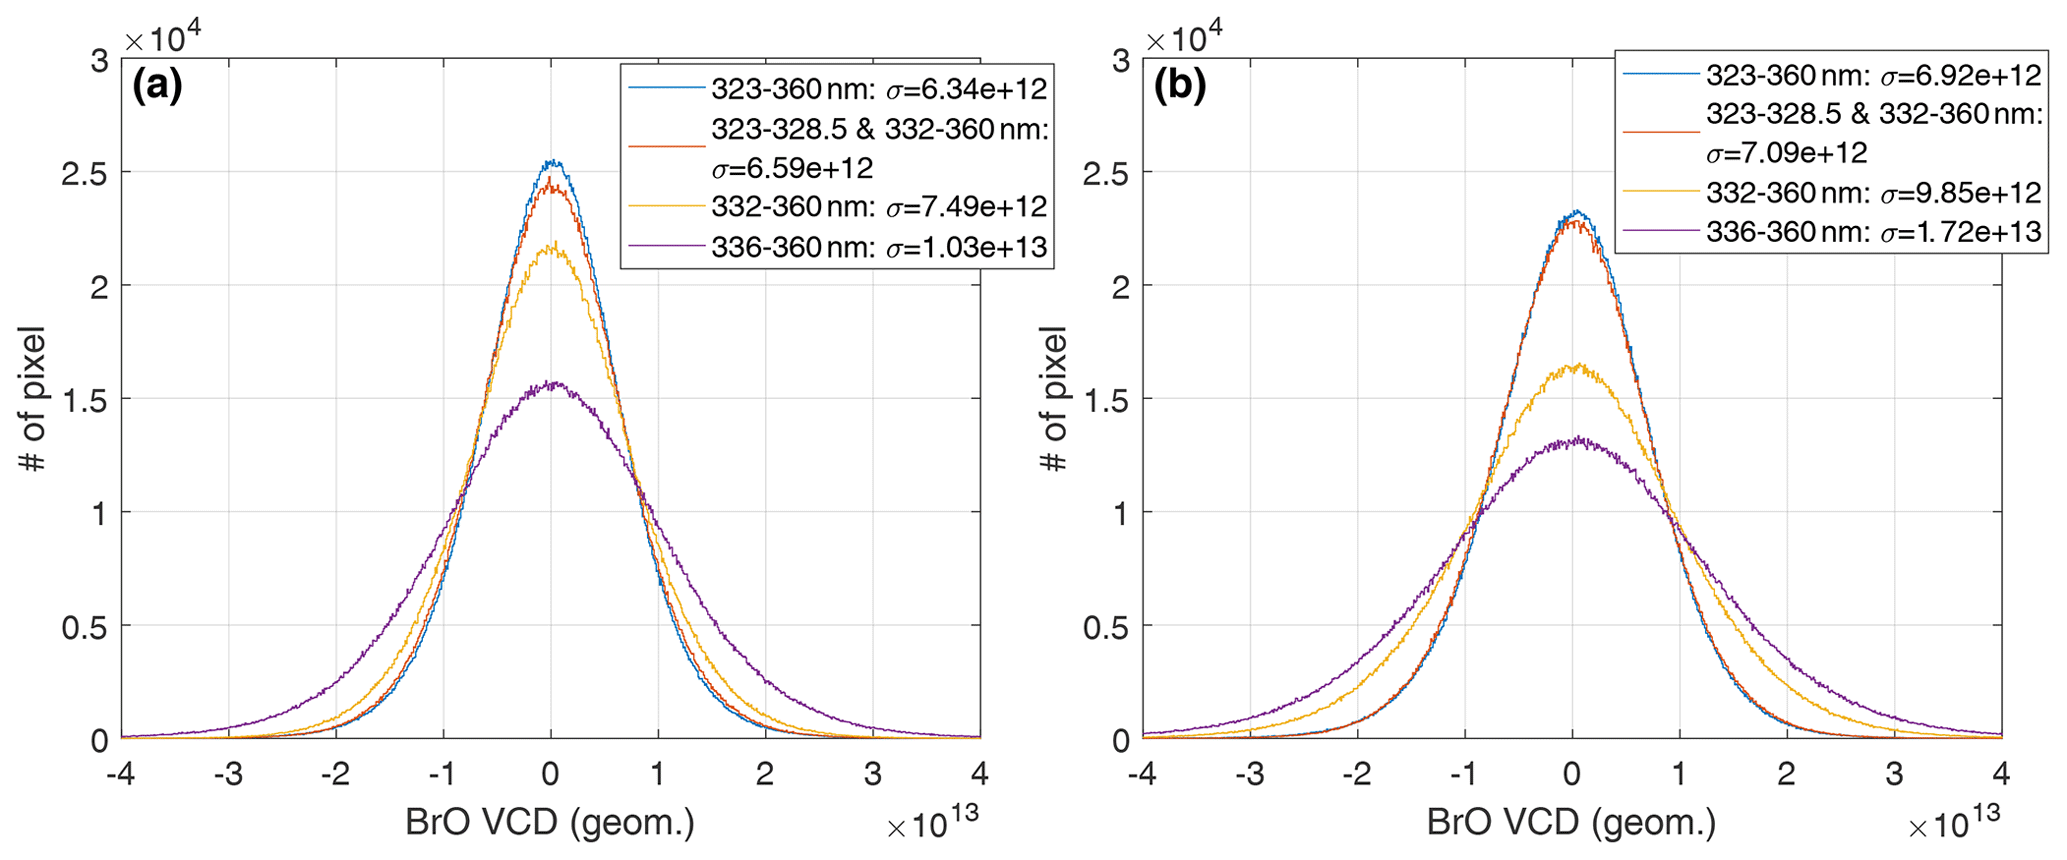
Figure 12Distribution of BrO VCDs (a) for the four fits excluding HCHO (SR) and (b) including HCHO (HCHO). The corresponding standard deviations are given in the legend. All pixels on 1 October 2018 in the Equator band between 20∘ S and 20∘ N over the whole longitude band are considered.
In comparison to the SR fits, the HCHO fits have a larger standard deviation for all wavelength ranges, leading to a minimal σ of (compared to for the corresponding SR fit) and a maximum σ of (compared to for the corresponding SR fit).
Thus, in order to achieve the lowest statistical uncertainties, the largest fit wavelength range excluding the HCHO cross-section should be chosen (SR 323–360 nm).
Looking at the whole globe for the SR 323–360 nm fit shows that the standard deviation is around for the mid- to low-latitude band between 70∘ S and 50∘ N (see Fig. 13a). In the Arctic region, the standard deviation gradually decreases towards high northern latitudes, which can be due to the higher AMFs in high latitudes; i.e., the variation in the SCD is divided by a larger number. In the Antarctic region, the standard deviation also decreases for a latitude of 80∘ S. However, the distribution is not well represented by a Gaussian distribution (see Fig. 13b, blue lines). There is a positive tail of elevated BrO VCDs due to enhanced tropospheric BrO columns in polar-spring events. Furthermore, the distribution is not centered around 0; i.e., the correction term is offset.
In conclusion, the statistical variation in the SR 323–360 nm fit can be best estimated by the standard deviation of or less for all latitudes.
5.2 Summary of the findings
The investigation of the eight different fits can be summarized by the following.
-
The statistical uncertainty decreases if (1) the fit wavelength range of the fit is increased and (2) the HCHO cross-section is not included in the DOAS fit.
-
The systematic influence of clouds and the stratospheric background can be corrected by the correction scheme described in Sect. 4.1 well for all eight fits. Thus, there is no preference for a fit range or fit setting.
-
The influence of HCHO is lowest for the SR 323–360 nm fit. The BrO column shows no cross-sensitivity for moderate HCHO columns and the lowest increase for very high HCHO columns.
Thus, the fit range of SR 323–360 nm is chosen for the BrO DOAS evaluation, since it shows the lowest statistical variation and is least susceptible to HCHO interference. The complete overview of the DOAS fit settings is listed in Table 1, considering the fit wavelength range of 323–360 nm and excluding the absorption cross-section of HCHO. The chosen best fit settings are also recommended for further studies on BrO in volcanic plumes.
5.3 Estimation of the combined statistical and systematic uncertainties
In order to give an estimate for the total error under all the various cases and locations where volcanic plumes occur, three latitude regions are distinguished: the Equator is the latitude band between 20∘ S and 20∘ N, mid-latitudes stretch from the equatorial region to 50∘ N and 50∘ S, and high latitudes are further north and south respectively. In addition, two special cases are distinguished: the polar spring in high latitudes with increased tropospheric BrO columns and biomass burning events which are typically located close to the Equator. Since biomass burning can also rarely occur in mid-latitudes or boreal summer, these cases are included as well.
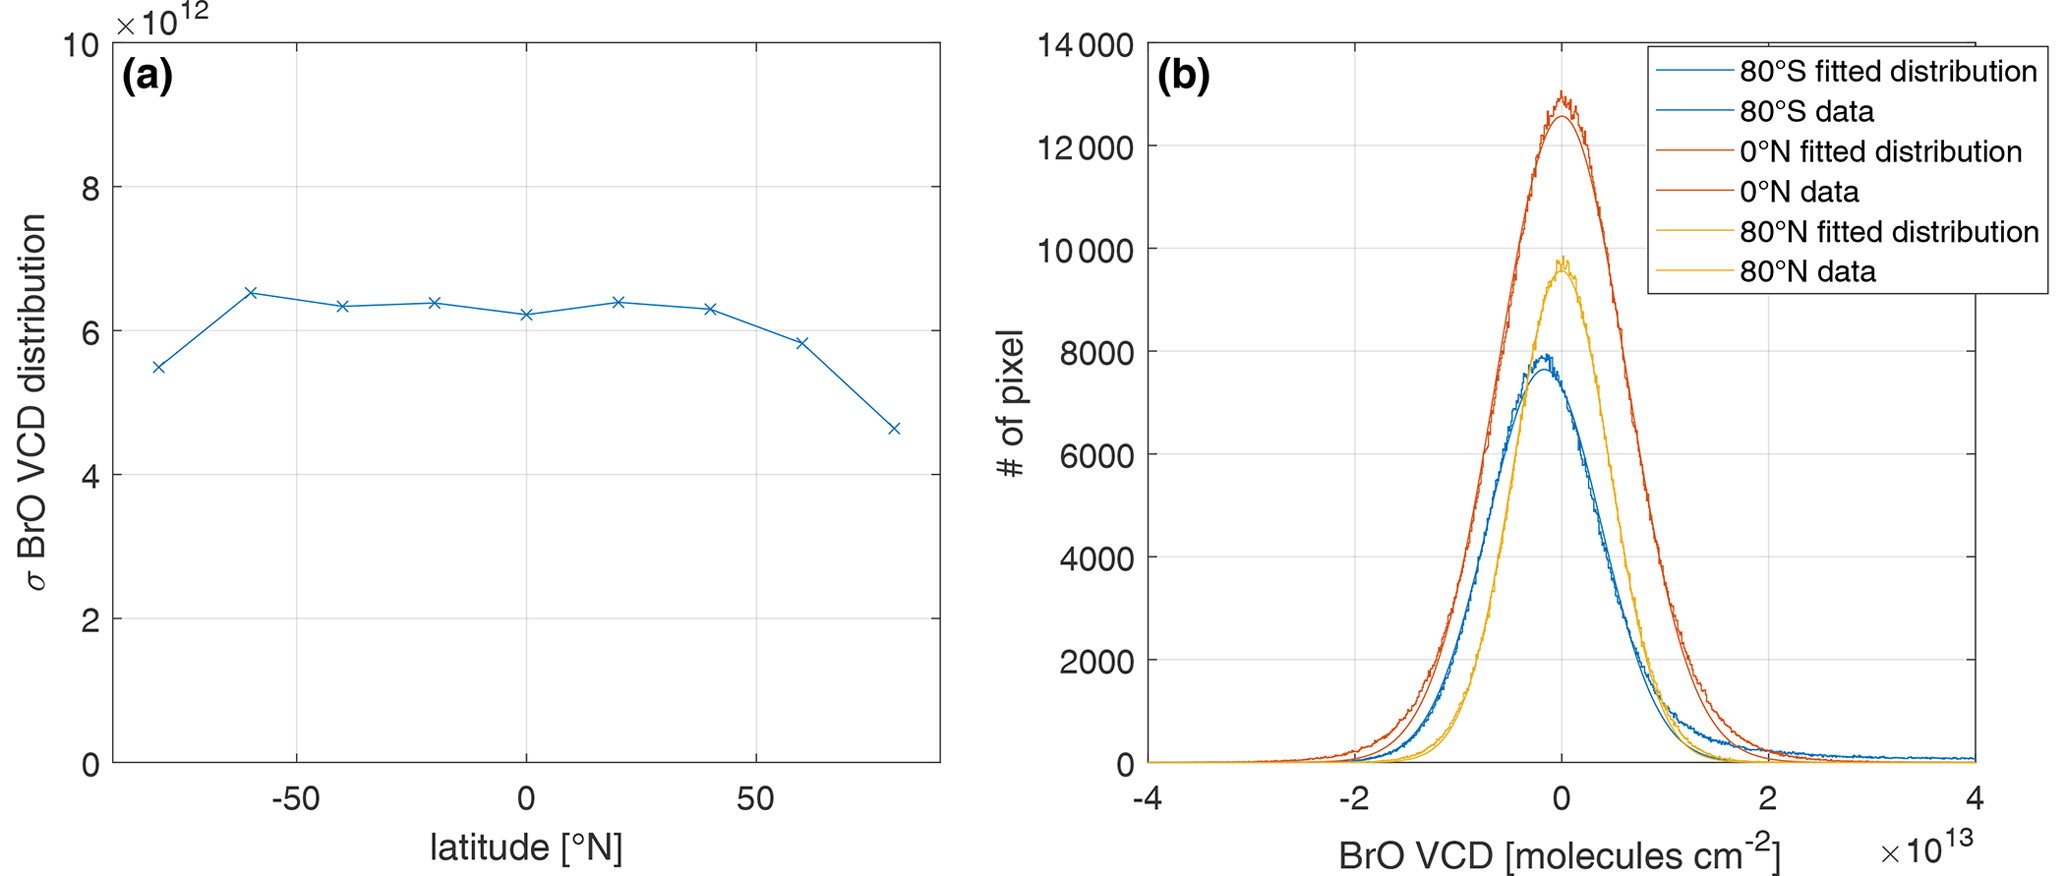
Figure 13Latitudinal variation in the statistical uncertainty. (a) Standard deviation σ of the distribution of the BrO VCD of the SR 323–360 nm fit for different latitude bands on 1 October 2018. (b) BrO VCD distribution of the SR 323–360 nm fit for 80∘ S (blue), 0∘ S (red), and 80∘ N (yellow). The corresponding fitted Gaussian distributions are indicated by a solid line in the respective color.
Finally, for each of these cases the statistical uncertainty and the systematic uncertainties are added quadratically:
The systematic uncertainties comprise those derived in Sect. 4.4 for each latitude region and those derived in Sect.. 4.3 (depicted in Fig. 10) caused by large HCHO columns. The statistical uncertainties are derived for each latitude region in Sect. 5.1 (depicted in Fig. 13).
The added systematic, statistical, and combined overall uncertainties are shown for all cases in Table 3. Under normal conditions (that means in the absence of high HCHO columns and polar tropospheric BrO enhancements), the combined uncertainty is between 6.6 and . Such conditions are representative of most of the volcanoes, e.g., not only the island volcanoes in the equatorial region (Galapagos, Vanuatu, Mayon) but also all mid- and high-latitude volcanoes such as Mt. Etna, Kīlauea, and La Palma as well as Kamchatka, Iceland, and the Aleutian volcanic regions.
The volcanoes with a risk of a general influence of biomass burning are located in the equatorial region in the vicinity of a rain forest. These are most notably the African Great Rift Valley volcanoes Nyiragongo and Nyamuragira, the northern Andes volcanoes (e.g., Nevado del Ruiz), and the Central American Volcanic Arc volcanoes (e.g., Masaya and Fuego). Here, an uncertainty of has to be assumed. While mid- to high-latitude volcanic regions can also be affected by high HCHO columns which would increase the combined uncertainty by roughly to 7.6 to , this is expected only under very rare circumstances.
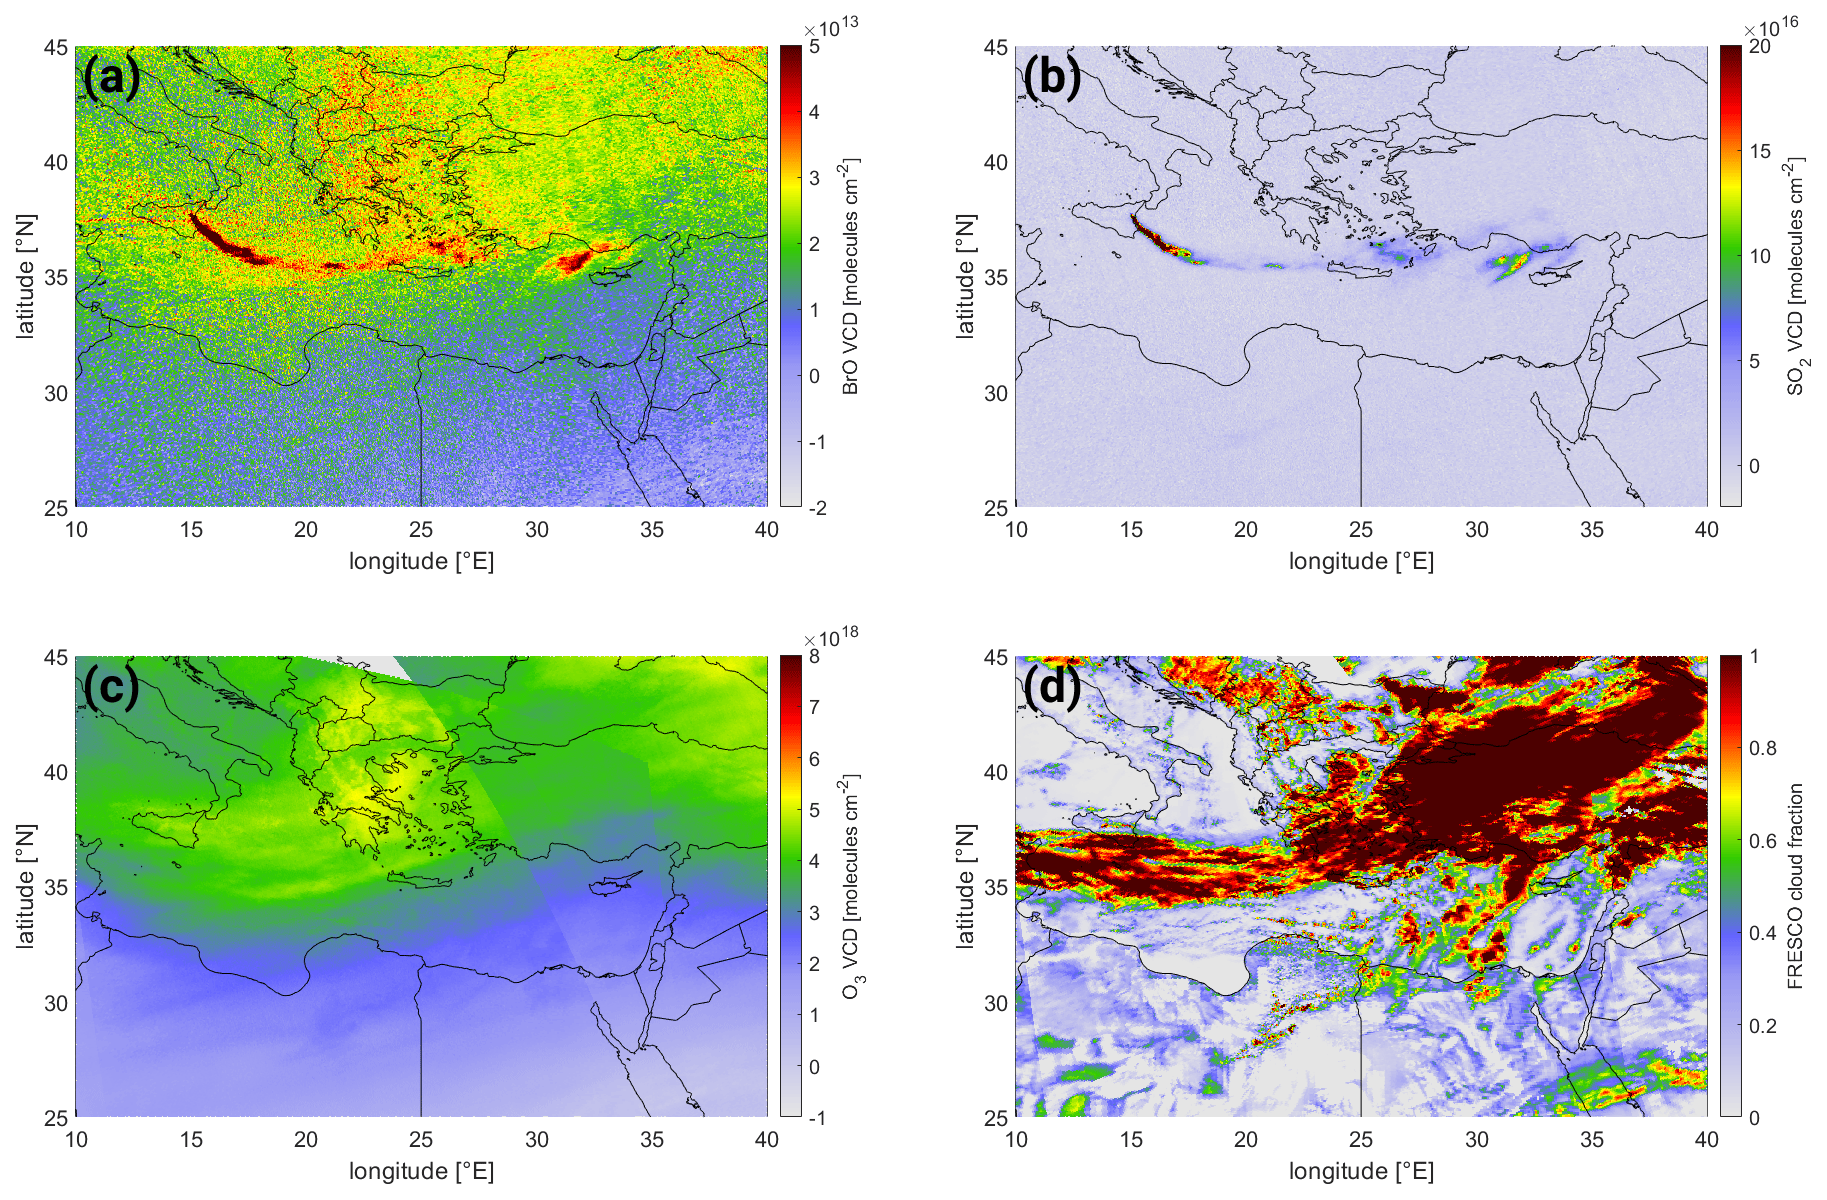
Figure 14Plume of Mt. Etna on 25 December 2018. (a) The BrO VCD map and (b) the SO2 VCD map without correction. (c) The O3 VCD derived from the BrO fit and (d) the cloud fraction (from FRESCO), both used in the ozone latitude correction scheme.
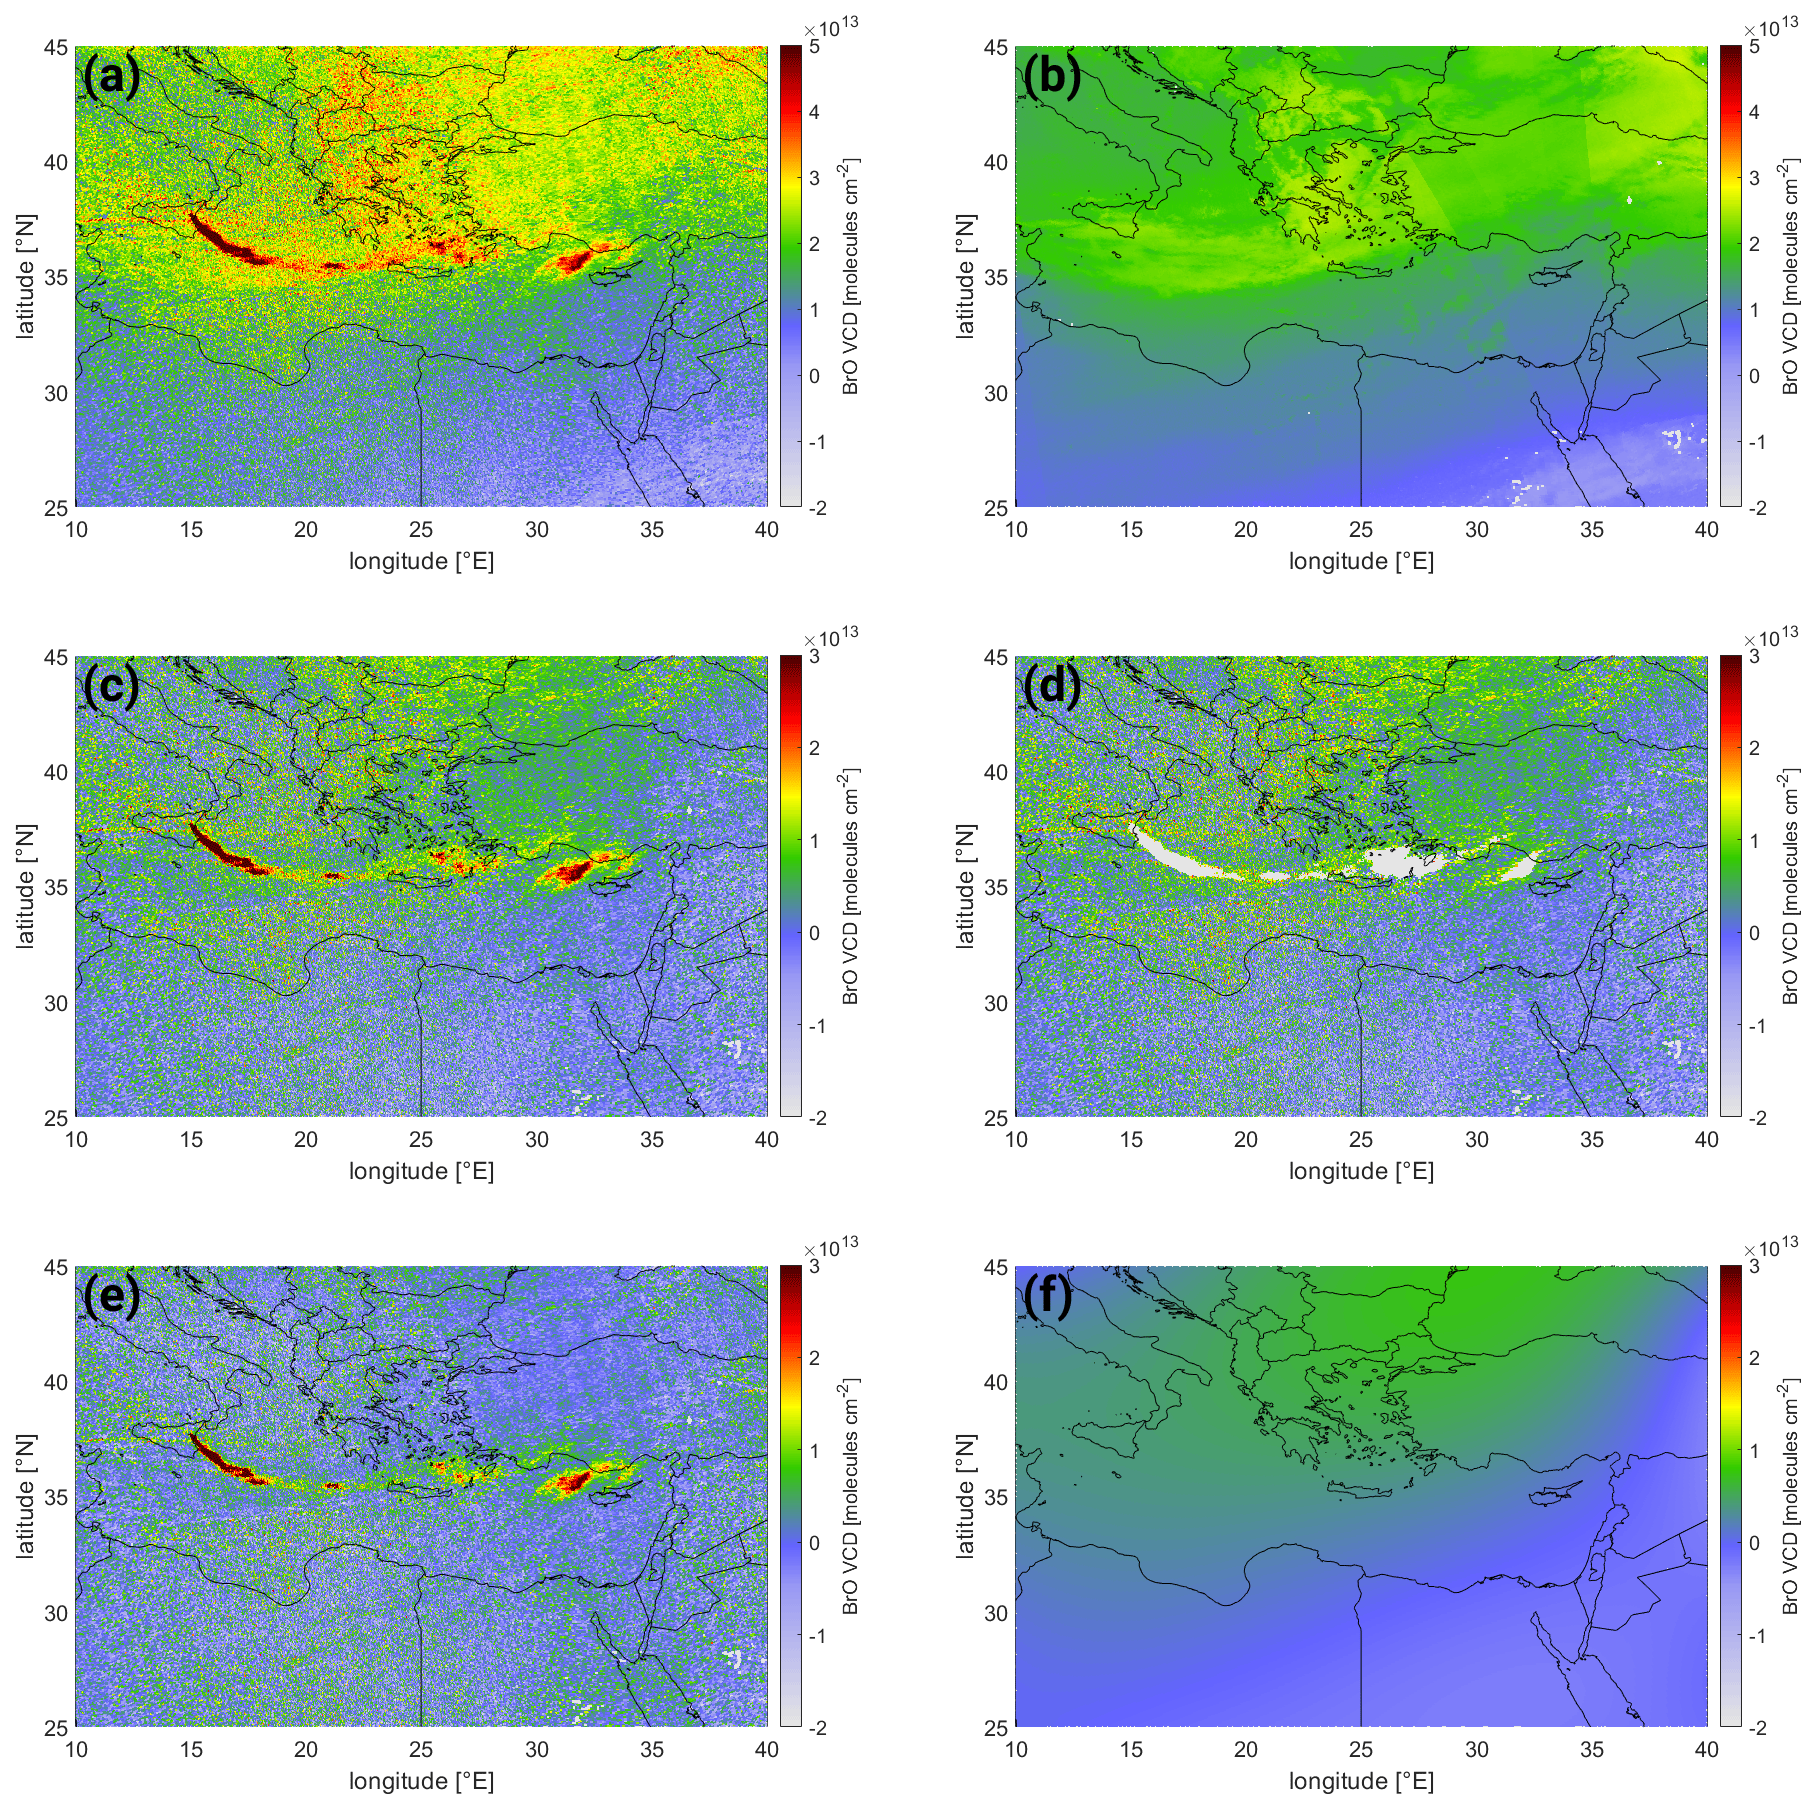
Figure 15Overview of the processing of the BrO VCD for a volcanic event (Mt. Etna, 25 December 2018): (a) the uncorrected data are first corrected using (b) the ozone latitude correction term to yield (c) the ozone-latitude-corrected BrO VCD. For the calculation of (d) the spatial polynomial correction, the masked plume is used and a third-order spatial 2D polynomial term is fitted, yielding (f) the local background correction BrO map. (e) Subtraction from (c) yields the final corrected BrO VCD map.
In order to accurately retrieve BrO inside volcanic plumes, potentially remaining local background gradients have to be additionally accounted for. For this, information on the SO2 signal is used to mask the volcanic plume signal and derive a local background correction. The retrieval steps are as follows: the proposed BrO DOAS SR 323–360 nm fit (see Sect. 5) is performed, and the ozone latitude correction (see Sect. 4.2) is applied. The plume is masked based on the SO2 signal, whose retrieval is explained in Sect. 6.1. This mask is used for a secondary local background correction (see Sect. 6.2). The results of all the different steps are discussed in detail in Sect. 6.3.
6.1 SO2 retrieval
In this study, an SO2 retrieval is employed purely to identify the volcanic plume for an accurate local background correction of BrO (see next section). Thus, only the fit range of 312–324 nm, already sensitive to small SO2 columns, is employed. This fit range is used in the SO2 verification algorithm for TROPOMI (developed by Christoph Hörmann, Max-Planck-Institut für Chemie (MPIC), Mainz), and refined by Simon Warnach, MPIC, within the verification for the upcoming Sentinel-5 mission (van Roozendael et al., 2021) as well as for synthetic spectra within the SO2 verification for the upcoming Sentinel-4 mission (Wagner et al., 2022). In all these verification exercises very good agreement was found for the operational algorithm of TROPOMI (Theys et al., 2017).
The DOAS fit settings for the SO2 retrieval includes the SO2 absorption cross-sections (203 K, Bogumil et al., 2003) and two O3 absorption cross-sections (223 and 243 K, Serdyuchenko et al., 2014). The other fit parameters (pseudo absorbers) and the Fraunhofer reference are identical to those of the BrO fit. All the fit parameters included are noted in Table 1 in the column “Incl. in SO2 fit”. A detailed description of the SO2 retrieval can be found in Warnach (2022).
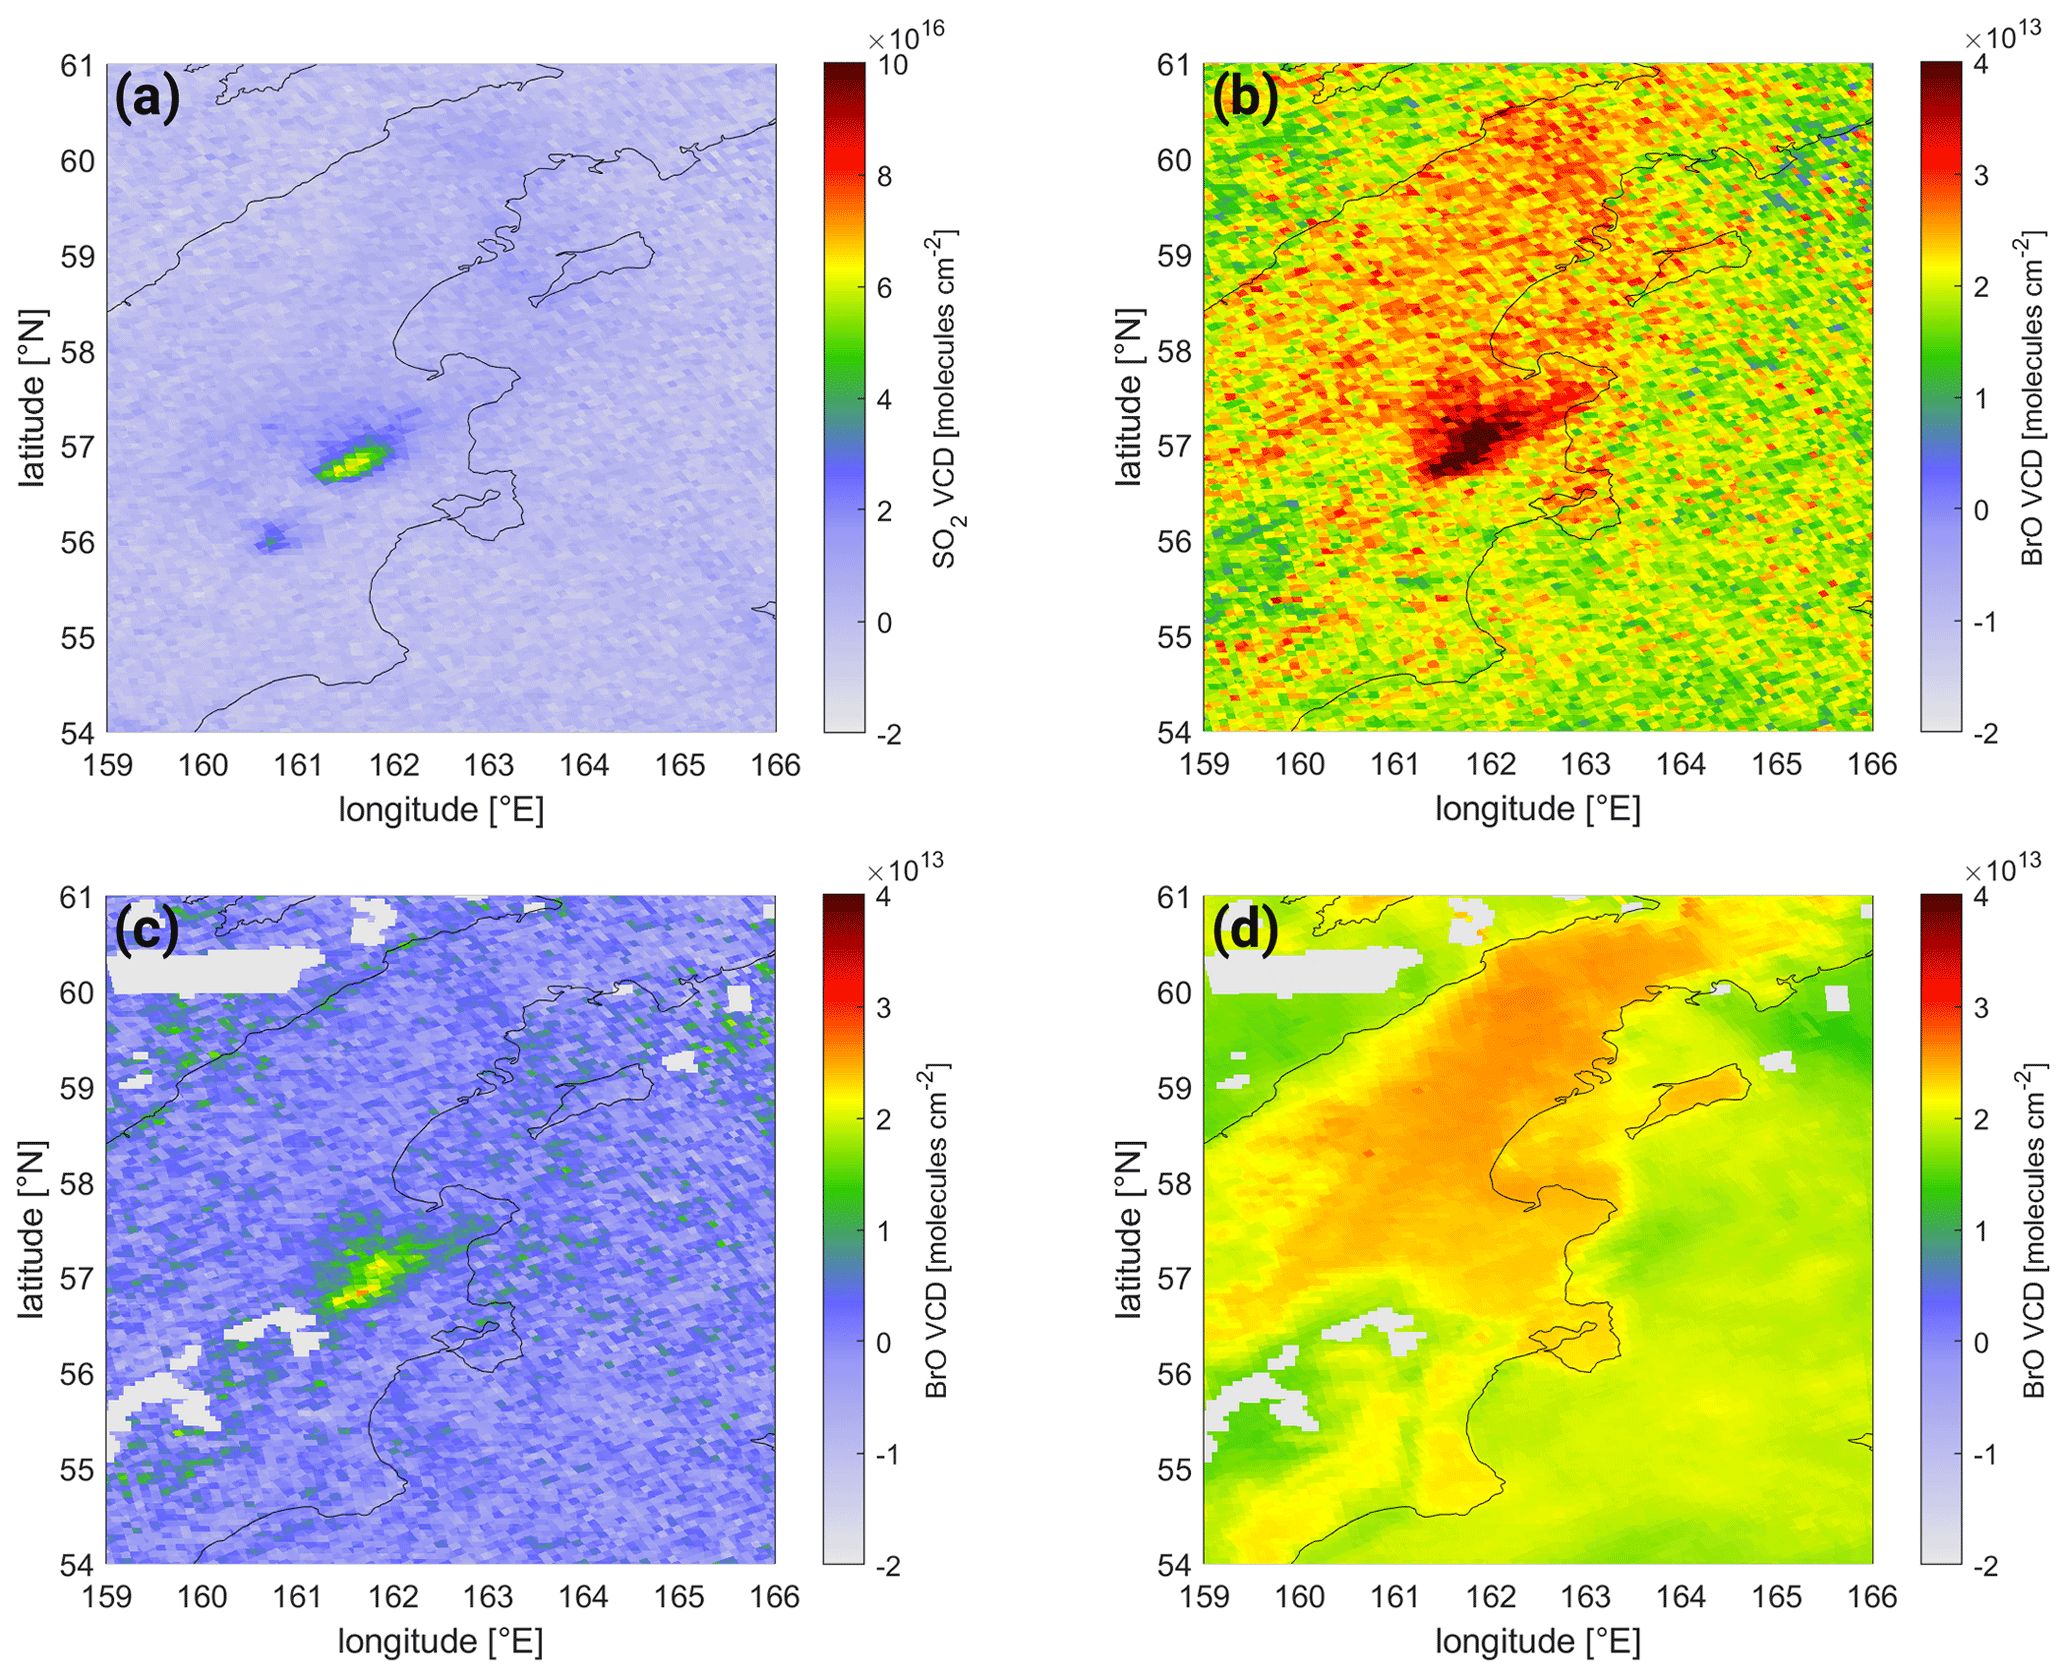
Figure 16Eruption of Sheveluch, Kamchatka, Russia, on 18 April 2019. (a) The SO2 VCD map, (b) the original BrO VCD map, (c) the corrected BrO VCD map, and (d) the BrO correction term consisting of the ozone latitude BrO correction and the local background correction.
6.2 Local background correction
In order to correct for a potentially remaining spatial pattern in the background distribution of SO2 as well as BrO, a spatial polynomial correction is applied. This spatial polynomial has already been successfully implemented as a local background correction in Hörmann (2013). Even though the BrO and SO2 retrieval and correction schemes presented in this study are much less affected by background gradients due to the inclusion of Puķīte terms for O3 and the aforementioned cloud ozone correction scheme, there are still potentially small spatial patterns remaining, which should be further reduced.
The retrieved VCD Vm can be decomposed into the background VCD Vb and the volcanic VCD Vv:
The spatial polynomial correction scheme makes use of the fact that volcanic plumes can usually be considered a localized phenomenon with an extent of several hundred kilometers within a large-scale background distribution pattern on the scale of 1000 km for both BrO and SO2. Furthermore, both volcanic and background distributions are independent of each other, and it can be assumed that the background is smooth with respect to the scale of the volcanic plume and background information gathered spatially around the plume can be interpolated over the plume region.
The background VCD Vb for each pixel k is modeled by 2D polynomial of the third degree:
where x is the pixel latitude and y is the longitude corrected by a latitude-dependent squeeze yielding
In order to calculate the polynomial, first the volcanic plume is masked. For this a SO2 VCD threshold is chosen, above which a pixel is masked as influenced by the volcanic plume. This is chosen in this study as 4 times the standard deviation of the SO2 background distribution (for TROPOMI the standard deviation is typically in the range of ; i.e., the threshold is in the range of ; cf. Warnach, 2022). The polynomial coefficients ci,j are then determined for this subset of data for both BrO and SO2 independently and applied to each pixel of the complete data set, leading to the background VCD. The resulting (volcanic) VCD is obtained by subtracting the background VCD Vb from the retrieved VCD Vm.
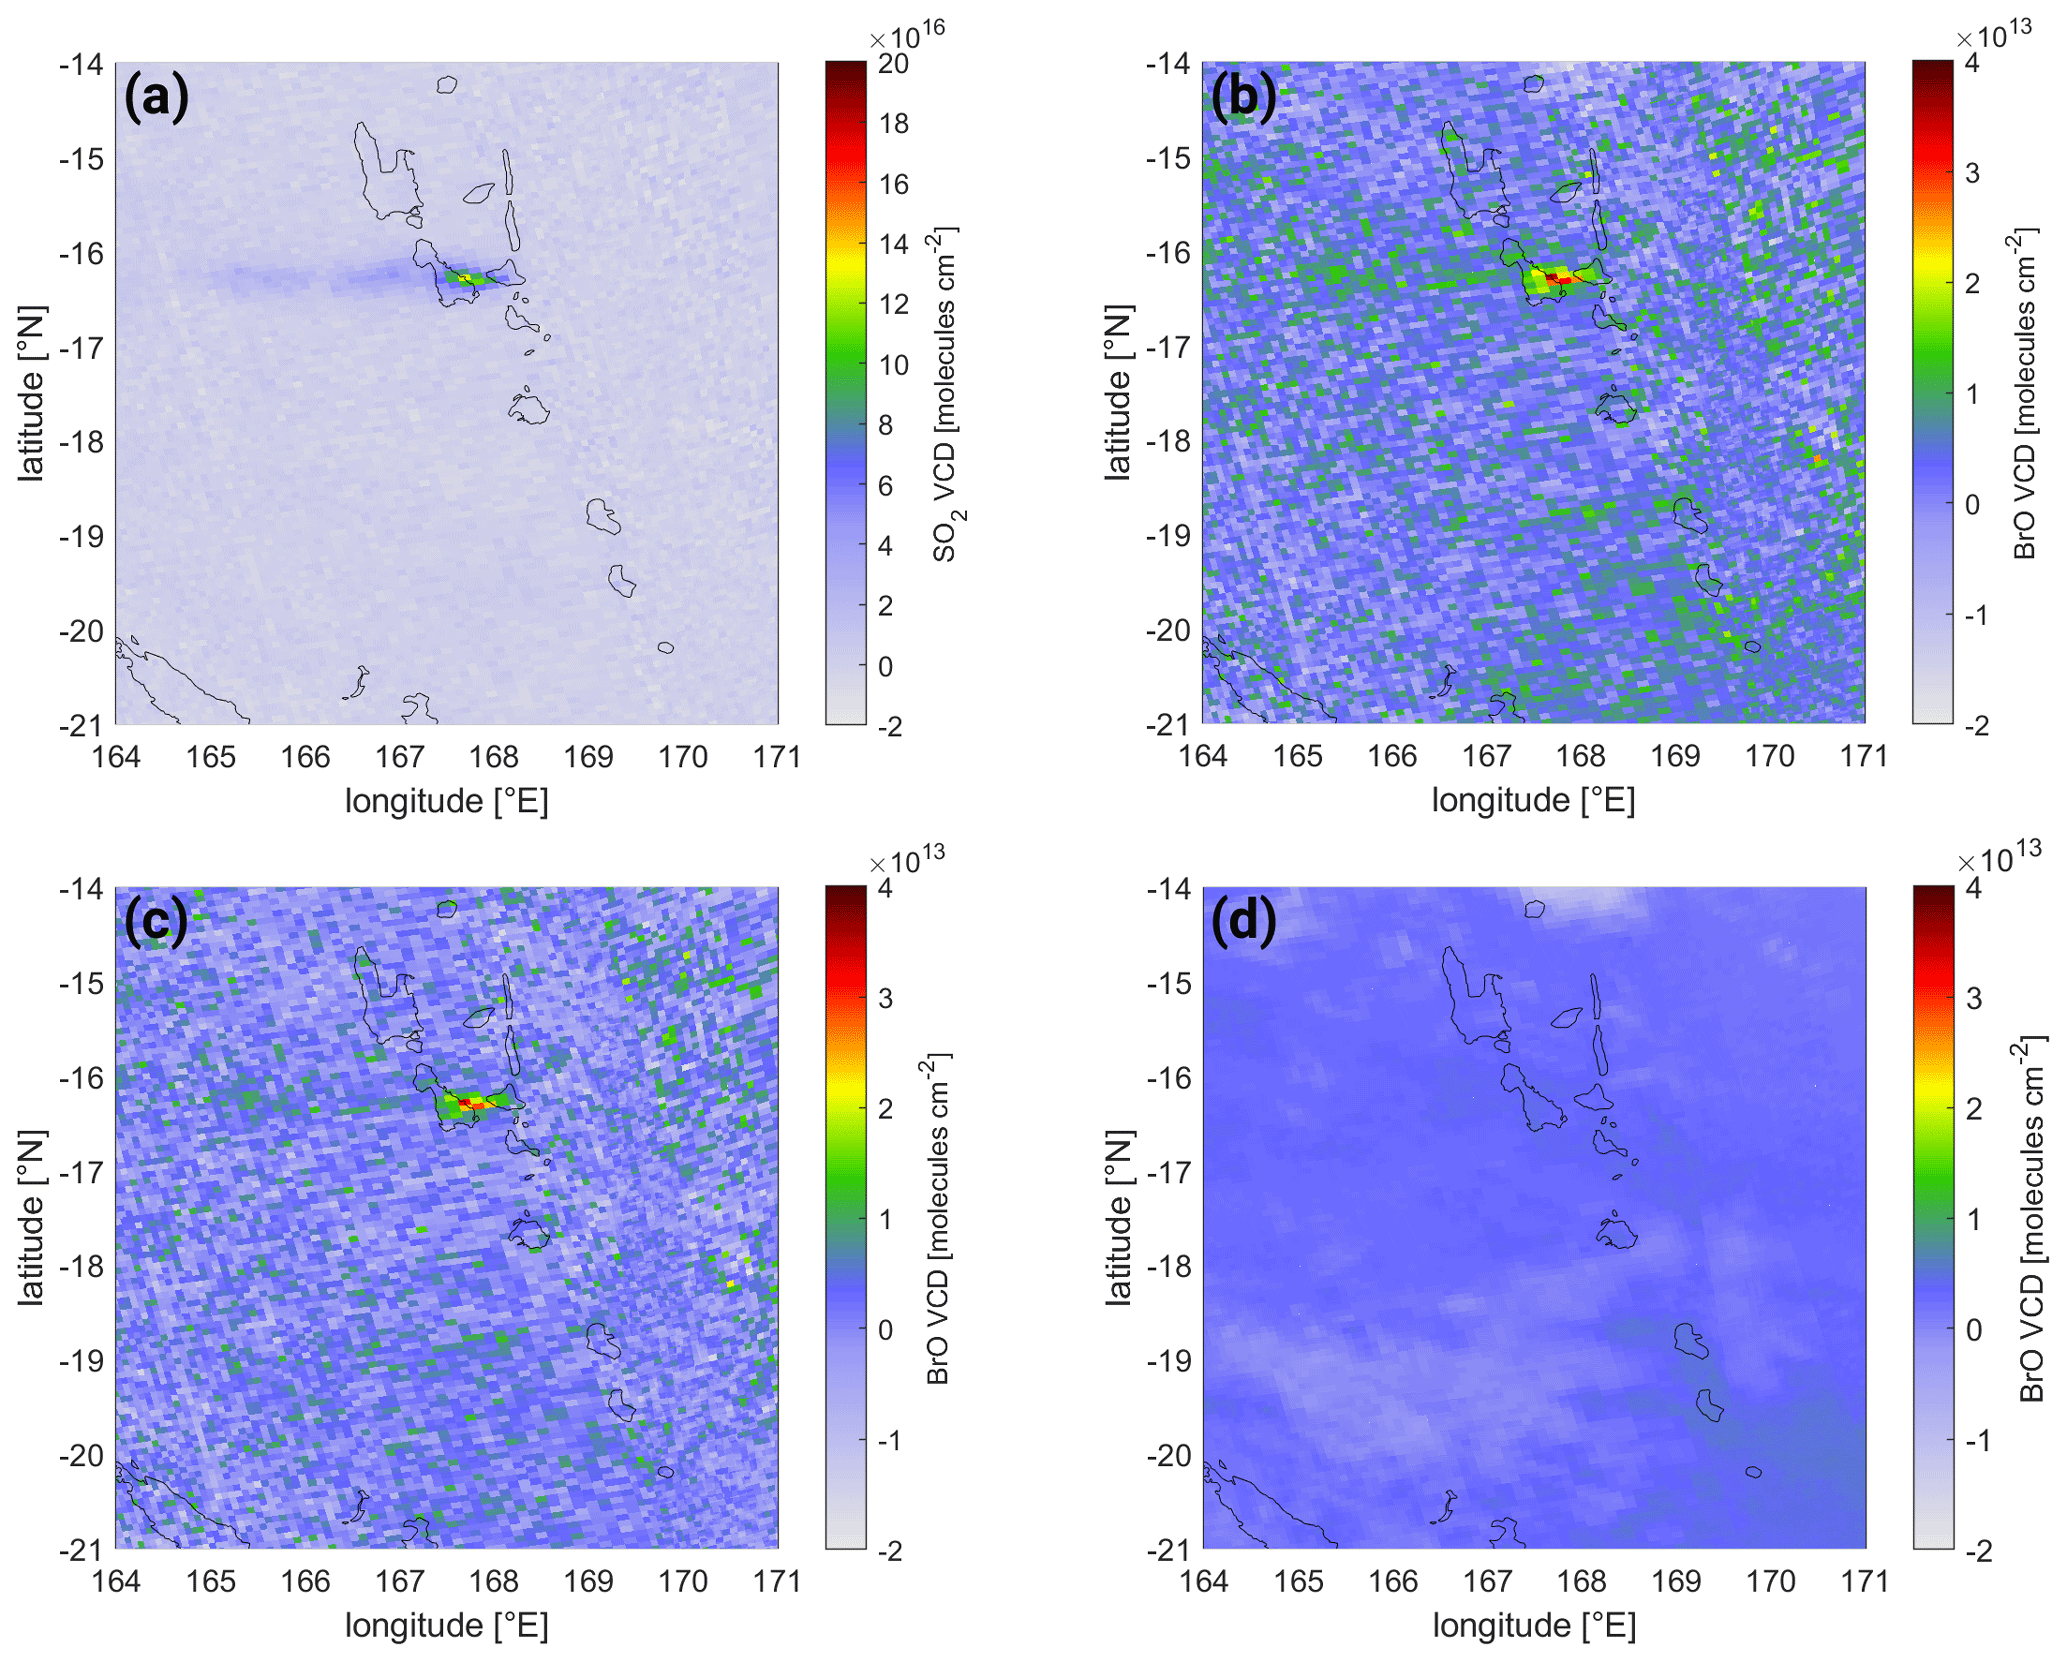
Figure 17Eruption of Ambrym, Vanuatu, on 30 September 2018. (a) The SO2 VCD map, (b) the original BrO VCD map, (c) the corrected BrO VCD map, and (d) the BrO correction term consisting of the ozone latitude BrO correction and the local background correction.
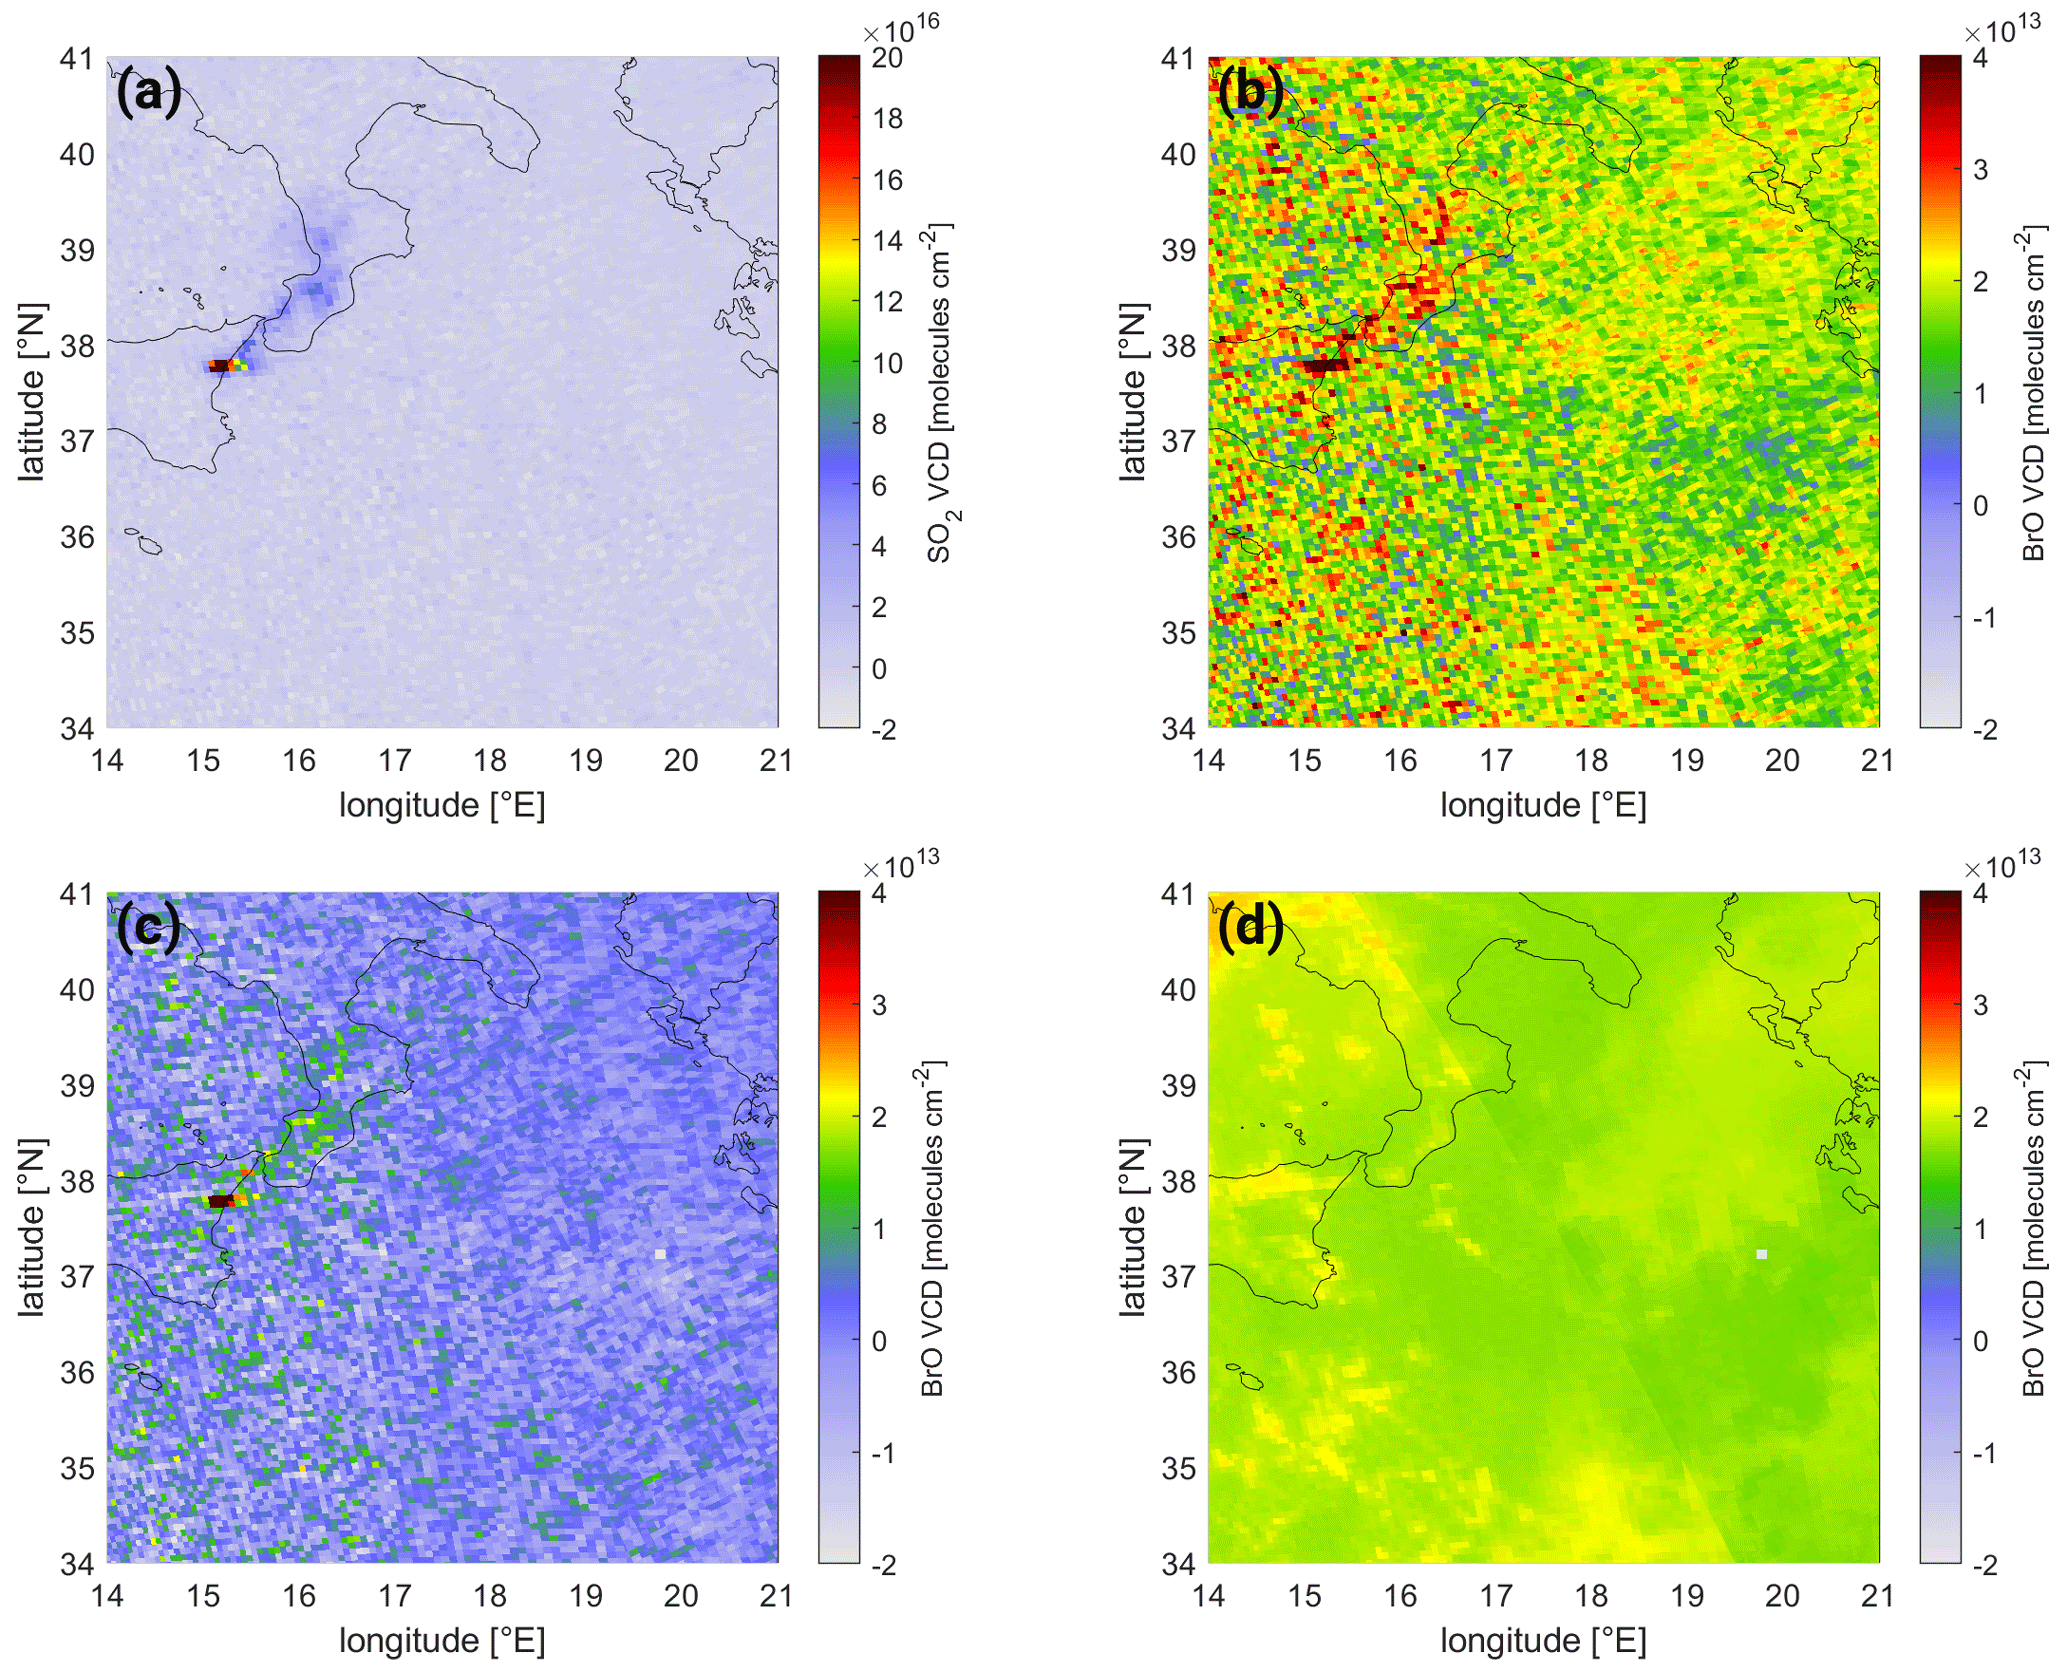
Figure 18Eruption of Mt. Etna, Italy, on 29 January 2019. (a) The SO2 VCD map, (b) the original BrO VCD map, (c) the corrected BrO VCD map, and (d) the BrO correction term consisting of the ozone latitude BrO correction and the local background correction.
6.3 Results
The complete sequence of processing steps for the retrieval of BrO for a volcanic plume is shown for the example of the plume of Mt. Etna, Italy, on 25 December 2018. The BrO and SO2 VCD maps derived from the respective DOAS retrievals and the calculated O3 VCD and the FRESCO cloud fraction are depicted in Fig. 14a–d respectively. The volcanic plume is clearly visible in the SO2 map. This is also the case for BrO, but there are also large gradients visible on the scale of , which is on the order of the volcanic BrO signal itself. The processing steps of the BrO correction scheme is shown in Fig. 15. The uncorrected BrO VCD (shown in panel a) is first corrected using the cloud ozone correction term (whose correction BrO VCD is shown in panel b), which is derived using the BrO VCDs from the 20∘ latitude band around encompassing the volcano (in this case 25–45∘ N). This correction term removes not only most of the large-scale biases in the BrO map but also fine structures originating from cloud shielding, resulting in the ozone-latitude-corrected BrO VCD map (shown in panel c). Lastly, the volcanic plume is masked based on the SO2 signal (using a 3σ threshold, panel d) and the remaining pixel in the region used for a local background correction (the correction term is shown in panel f), resulting in the final BrO VCD (shown in panel e). There, the systematic background features are well reduced.
In the following, several examples of different BrO VCD strengths at different latitudes are displayed and discussed in order to show the efficacy of the retrieval in different circumstances.
6.3.1 The plume of Sheveluch, Kamchatka, Russia, on 18 April 2019
An example of a small-scale eruption at high latitudes is the plume of Sheveluch, Kamchatka, on 18 April 2019. While only low SO2 VCDs are observed – not exceeding (see Fig. 16a) – there are still clearly enhanced BrO VCDs visible coinciding with the SO2 pattern (see Fig. 16b) on the order of several tens of trillions of molecules per square centimeter (). However, there is also elevated background BrO of up to visible north of the plume over the island. These background structures are clearly identified by the correction term (see Fig. 16d), and the resulting BrO VCD map (see Fig. 16c) shows a smooth background of roughly 0.
It is noteworthy that this is an example where the correction term actually shows a large gradient at the location of the plume (at 57∘ N, 161–162∘ E) where the correction term varies by more than . This gradient is caused by a cloud edge in this area (see Fig. C1c and d).
6.3.2 The plume of Ambrym, Vanuatu, on 30 September 2018
Another minor eruption where a BrO signal is detected is the eruption of Ambrym on 30 September 2018 (see Fig. 17). While the SO2 signal can be detected over several hundred kilometers, maximum SO2 columns do not exceed (see Fig. 17a). Nevertheless, BrO VCDs exceed , indicating that the volcanic emissions are relatively BrO-rich (see Fig. 17b). In contrast to the high-latitude Sheveluch eruption (see Sect. 6.3.1, the BrO background in this case is much weaker (see Fig. 17b), since the plume is located close to the Equator, where the reference spectrum is taken. Furthermore, there are only low clouds in the area (see Fig. C2d); hence cloud influence is low. Nevertheless, the correction term applies minor corrections for cloudy regions, e.g., for the high cloud at 14∘ S, 168∘ E (see Fig. C2d), where the correction factor accounts for the negative BrO VCD (see Fig. 17d) and slightly homogenizes the background (see Fig. 17c).
6.3.3 The eruption of Mt. Etna, Italy, on 29 January 2019
An example of a medium eruption with a very localized volcanic plume is the Mt. Etna eruption on 29 January 2019 (see Fig. 18). This eruption is part of a phase of eruptive activity which started with weak degassing in December 2018 and culminated in an explosive VEI 2 (volcanic explosivity index) eruption on 24 December 2018 (Calvari et al., 2020) accompanied by lava flows (GVP, 2019). Activity subsided to strombolian activity throughout January and February 2019 (GVP, 2019). The eruptive event on 29 January 2019 falls within a week of increased activity during the last week of January (GVP, 2019). The event is a medium eruption, with a maximum SO2 VCD of but with a very localized plume (see Fig. 18a). SO2 VCDs exceeding only occur within the first 50 km downwind from the volcano. A clear BrO signal of up to is also only observed in this area around the volcano (see Fig. 18b, exceeding the upper boundary of the color map scale). Further downwind only a very faint positive BrO signal can be seen. The background signal on the order of is matched by the correction term well (see Fig. 18d), yielding the corrected BrO VCD map (see Fig. 18c), where both the strong signal at the volcano and the weaker outflow are visible.
We present a new retrieval scheme designed specifically for the accurate detection of BrO inside minor volcanic plumes from satellite spectra. Expanding the DOAS fit wavelength range to a lower wavelength of 323 nm and thus a fit range of 323–360 nm reduces the statistical uncertainty, without increasing any systematic influences. This is made possible by the introduction of so-called Puķīte terms (Puķīte et al., 2010), which account for second-order effects of the strong absorption of O3 at lower wavelengths. In addition, this wavelength range was shown to be least susceptible for a systematic influence caused by interference due to HCHO. While no systematic bias is found for HCHO columns of , HCHO columns between 2 and could introduce a positive BrO VCD bias of roughly .
Secondly, we propose a sophisticated, empirical correction scheme for the non-volcanic BrO background, based on cloud fraction, cloud altitude, and the O3 VCD, all correlating with spatially distinct patterns in the BrO VCD map. The origin of the cloud effect is not clear. Possible effects can be (1) partial shielding of the tropospheric BrO column and also (2) non-linear spectroscopic effects. O3 is indicative of a change in the BrO stratospheric column. A combined empirical multi-dimensional polynomial including cloud fraction, cloud height, and the measured O3 VCD applied to the latitude band of the volcanic plume location proves to best account for these structures. This correction scheme reduces the systematic influence at the Equator by 1 order of magnitude from 1×10¹³ to .
The statistical uncertainty in the retrieved BrO VCD is found to be roughly , thus larger by at least a factor of 2 than the systematic effects. Compared to other recent BrO DOAS fitting schemes (Sihler et al., 2012; Hörmann et al., 2013) the statistical noise is reduced by a factor of up to 1.8, mainly due to the use of the larger fit wavelength range of 323–360 nm. It is noteworthy that averaging over longer periods of time could further reduce the statistical variation.
In several example volcanic plumes we show that the developed background correction scheme successfully removes BrO background gradients. In combination with the precise BrO DOAS retrieval, this leads to a more accurate detection of BrO than for previous retrievals even in volcanic plumes during minor eruptive activity.
The algorithm developed here will allow for much more detailed investigation of volcanic BrO and the volcanic ratio on a global scale.
Even though our BrO retrieval algorithm is designed for TROPOMI observations, the improvements proposed here are in principle applicable to the BrO observations inside volcanic plumes from any hyperspectral satellite observations. However, satellite-specific adjustments might be required.
In order to quantify the influence of the presence of volcanic plumes within the equatorial reference spectra region on the BrO VCDs, we selected 2 example days: 2 October 2021, where only several, small plumes are present (see Fig. A1a, red areas), representative of normal conditions, and 30 July 2018, where a very large plume stretched over a large portion of the equatorial region (see Fig. A2a, red areas), representative of exceptionally strong volcanic activity within the equatorial region. For both days we identified areas affected by a volcanic plume based on the SO2 signal (as done in Warnach, 2022; see their Sect. 5.2), marked as red areas. Lastly, we calculated the mean BrO VCD within the equatorial region independently for each across-track detector, both including and excluding the affected volcanic areas. The difference between both should be equivalent to the contamination of the earthshine reference spectrum.
For 2 October 2020, there is no difference in the BrO visible, and for SO2 there is only a small difference for a few detectors (see Fig. A1c and d). Our interpretation is that typical signals are too weak to exceed the noise of the BrO retrieval (as the signal-to-noise ratio is 2 orders of magnitudes larger than for SO2) and that typically only a very small fraction of pixels are affected by volcanic plumes. On 30 July 2018, which is representative of an exceptionally strong volcanic plume, there is only a contamination of the SO2 SCD of (see Fig. A2a), which is more than 1 order of magnitude lower than typical volcanic SO2 SCDs (which are on the order of ). For BrO, the difference is even smaller and several hundreds of billions of molecules per square centimeter () which is also at least 1.5 orders of magnitude lower than typical volcanic BrO SCDs (which are on the order of ).
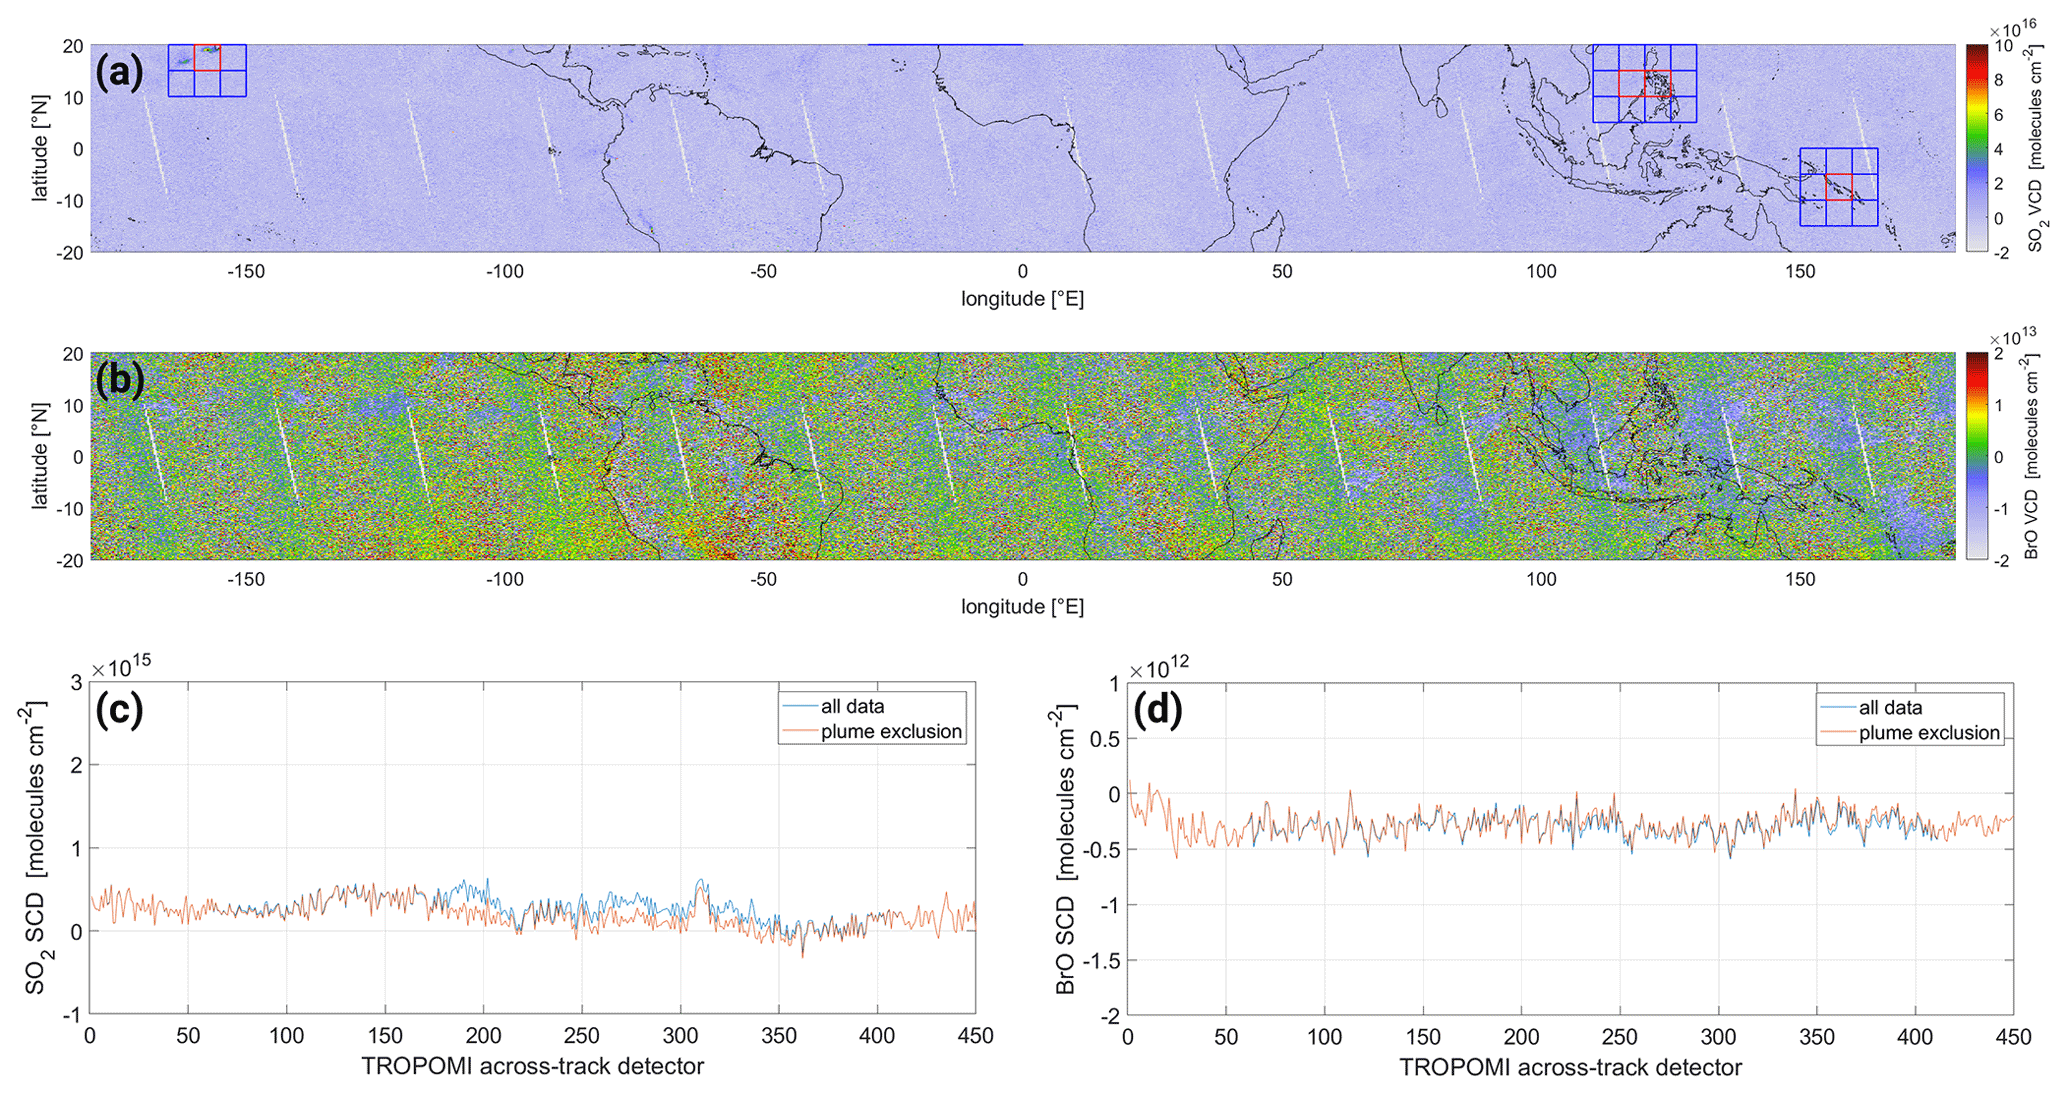
Figure A1(a) Map of the SO2 VCD for the equatorial region on 2 October 2021. The areas of enhanced volcanic signals are marked in red squares. (b) Map of the BrO VCD for the equatorial region on 2 October 2021. (c) Mean SO2 SCD for each across-track detector considering all pixels (blue) and excluding pixels with volcanic gas columns (red). (d) Same plot for the across-track-dependent mean BrO SCD.
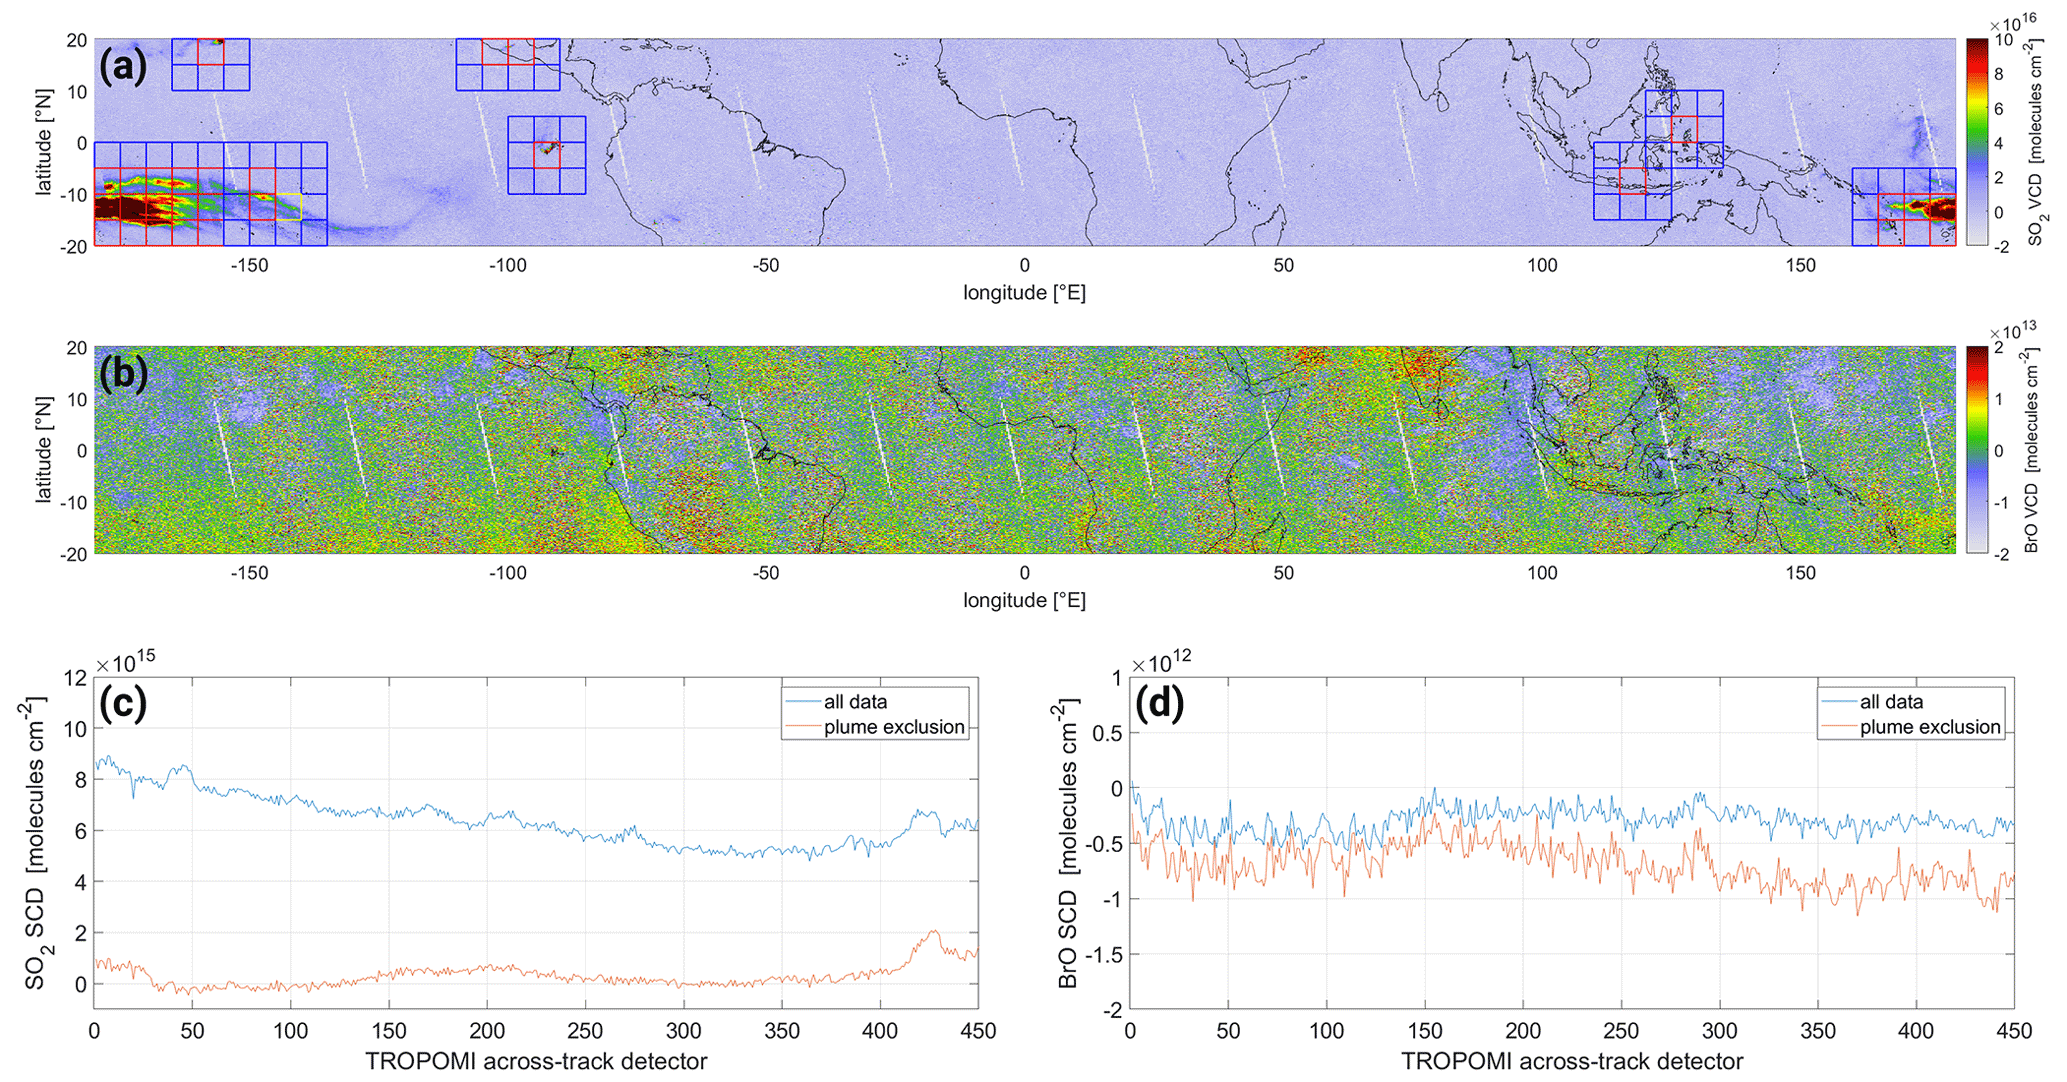
Figure A2(a) Map of the SO2 VCD for the equatorial region on 30 July 2018. The areas of enhanced volcanic signals are marked in red squares. (b) Map of the BrO VCD for the equatorial region on 30 July 2018. (c) Mean SO2 SCD for each across-track detector considering all pixels (blue) and excluding pixels with volcanic gas columns (red). (d) Same plot for the across-track-dependent mean BrO SCD.
B1 High-latitude air mass influence on BrO and O3
In order to interpret the coinciding gradients of O3 and BrO in Fig. 5 with respect to meteorology, we look at the location of the jet stream estimated as a band of strong wind speed at 9 km altitude and the tropopause height estimated as the height where the potential vorticity is 2 PVU (potential vorticity unit). The corresponding data are taken from ECMWF ERA5 model data at 18:00 UTC for the respective region and are depicted in Fig. B1.
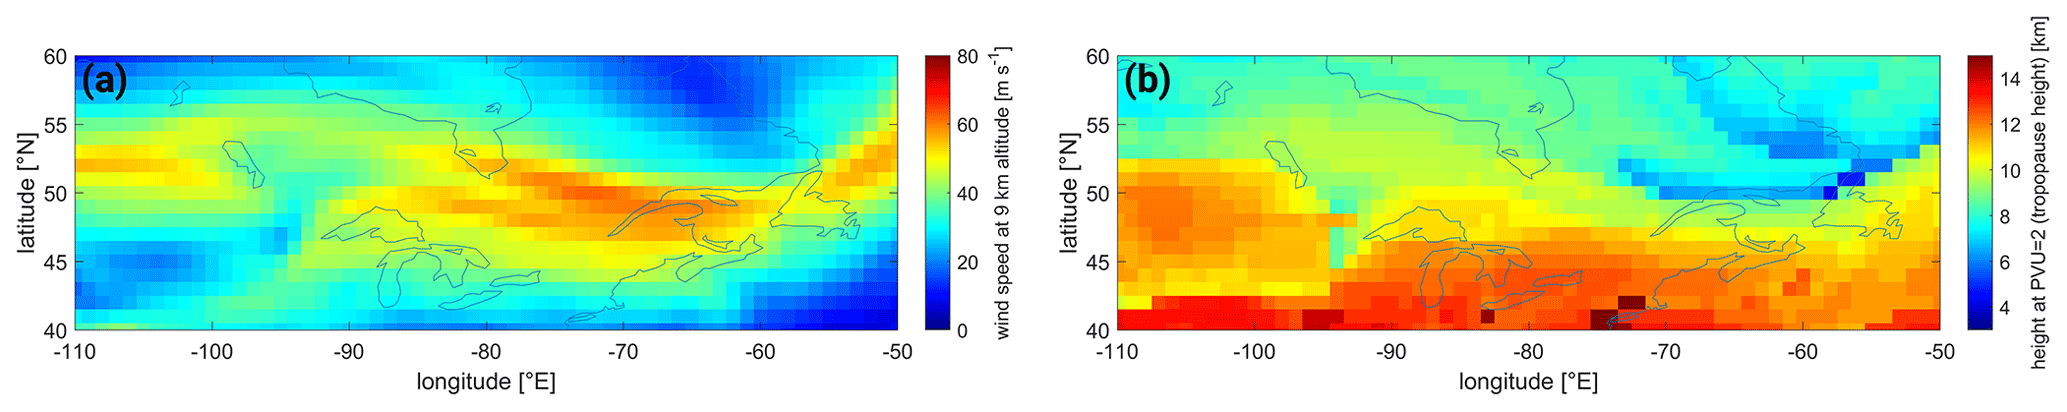
Figure B1Meteorological conditions for the high-latitude case (see Fig. 5) on 1 October 2018, taken from ECMWF ERA5 data at 18:00 UTC: (a) the wind speed at 9 km indicating the presence of the jet stream and (b) the tropopause height indicated by the height where the potential vorticity is equal to 2 PVU.
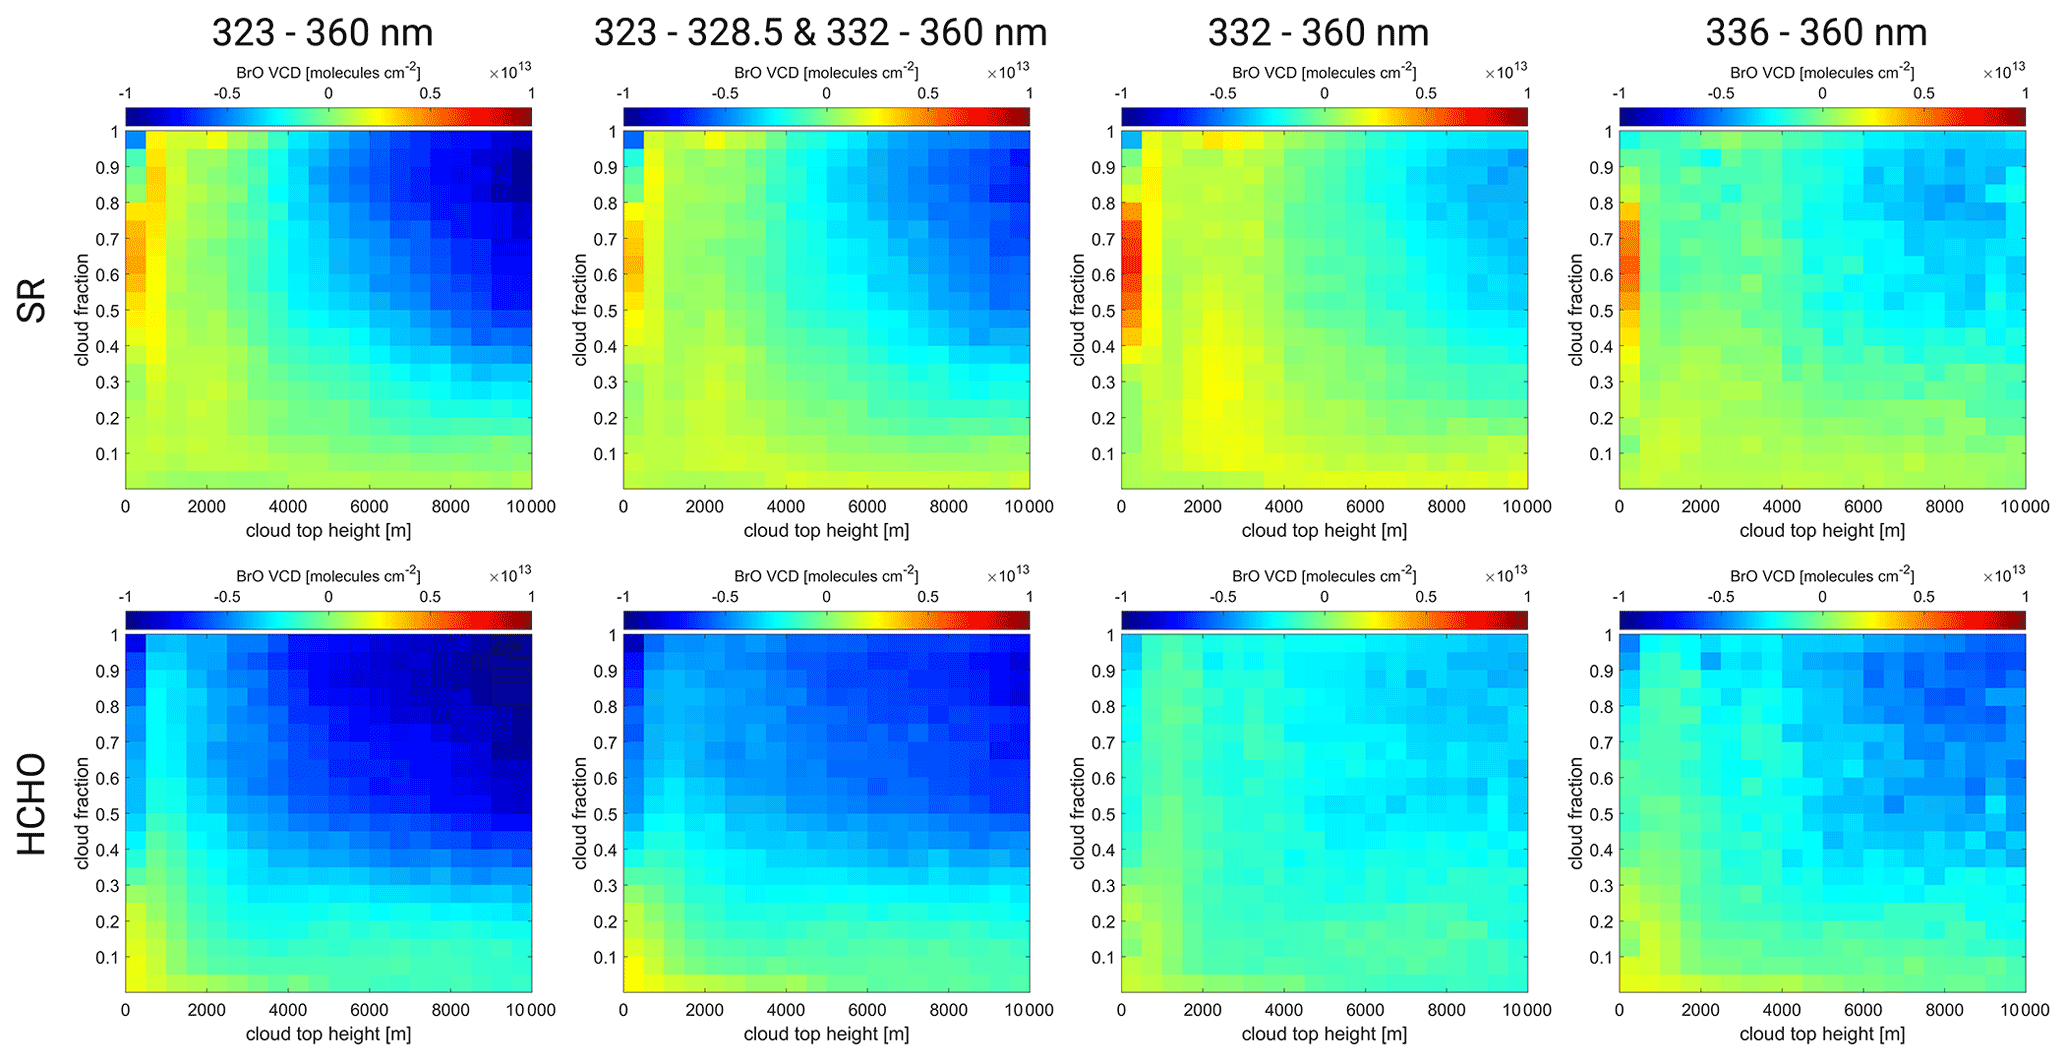
Figure B2Mean BrO VCD dependency on the cloud height–cloud fraction bins for the equatorial region [ N, E] for the eight different BrO fits. Top row contains fits not including the HCHO absorption cross-section (SR), with fit ranges of 323–360 nm, 323–328.5 and 332–360 nm, 332–360 nm, and 336–360 nm (from left to right). Bottom row contains fits including the HCHO absorption cross-section (HCHO) for each fit range from the top row.
B2 Cloud and O3 influences
The BrO VCD is a function of CF and CH at the equatorial region on 1 October 2018 for all eight fit settings (see Fig. B2). The relation is stronger for larger fit wavelength ranges (left side) and also seems slightly increased for fits including HCHO (bottom row). The response is weakest for the fits with a wavelength range of 332–360 nm both for SR and HCHO fits.
B3 Cloud and O3 correction scheme
Figure B3 shows the correction terms for the three different ozone cloud correction schemes. The corresponding corrected BrO VCD maps are shown in Fig. 7.
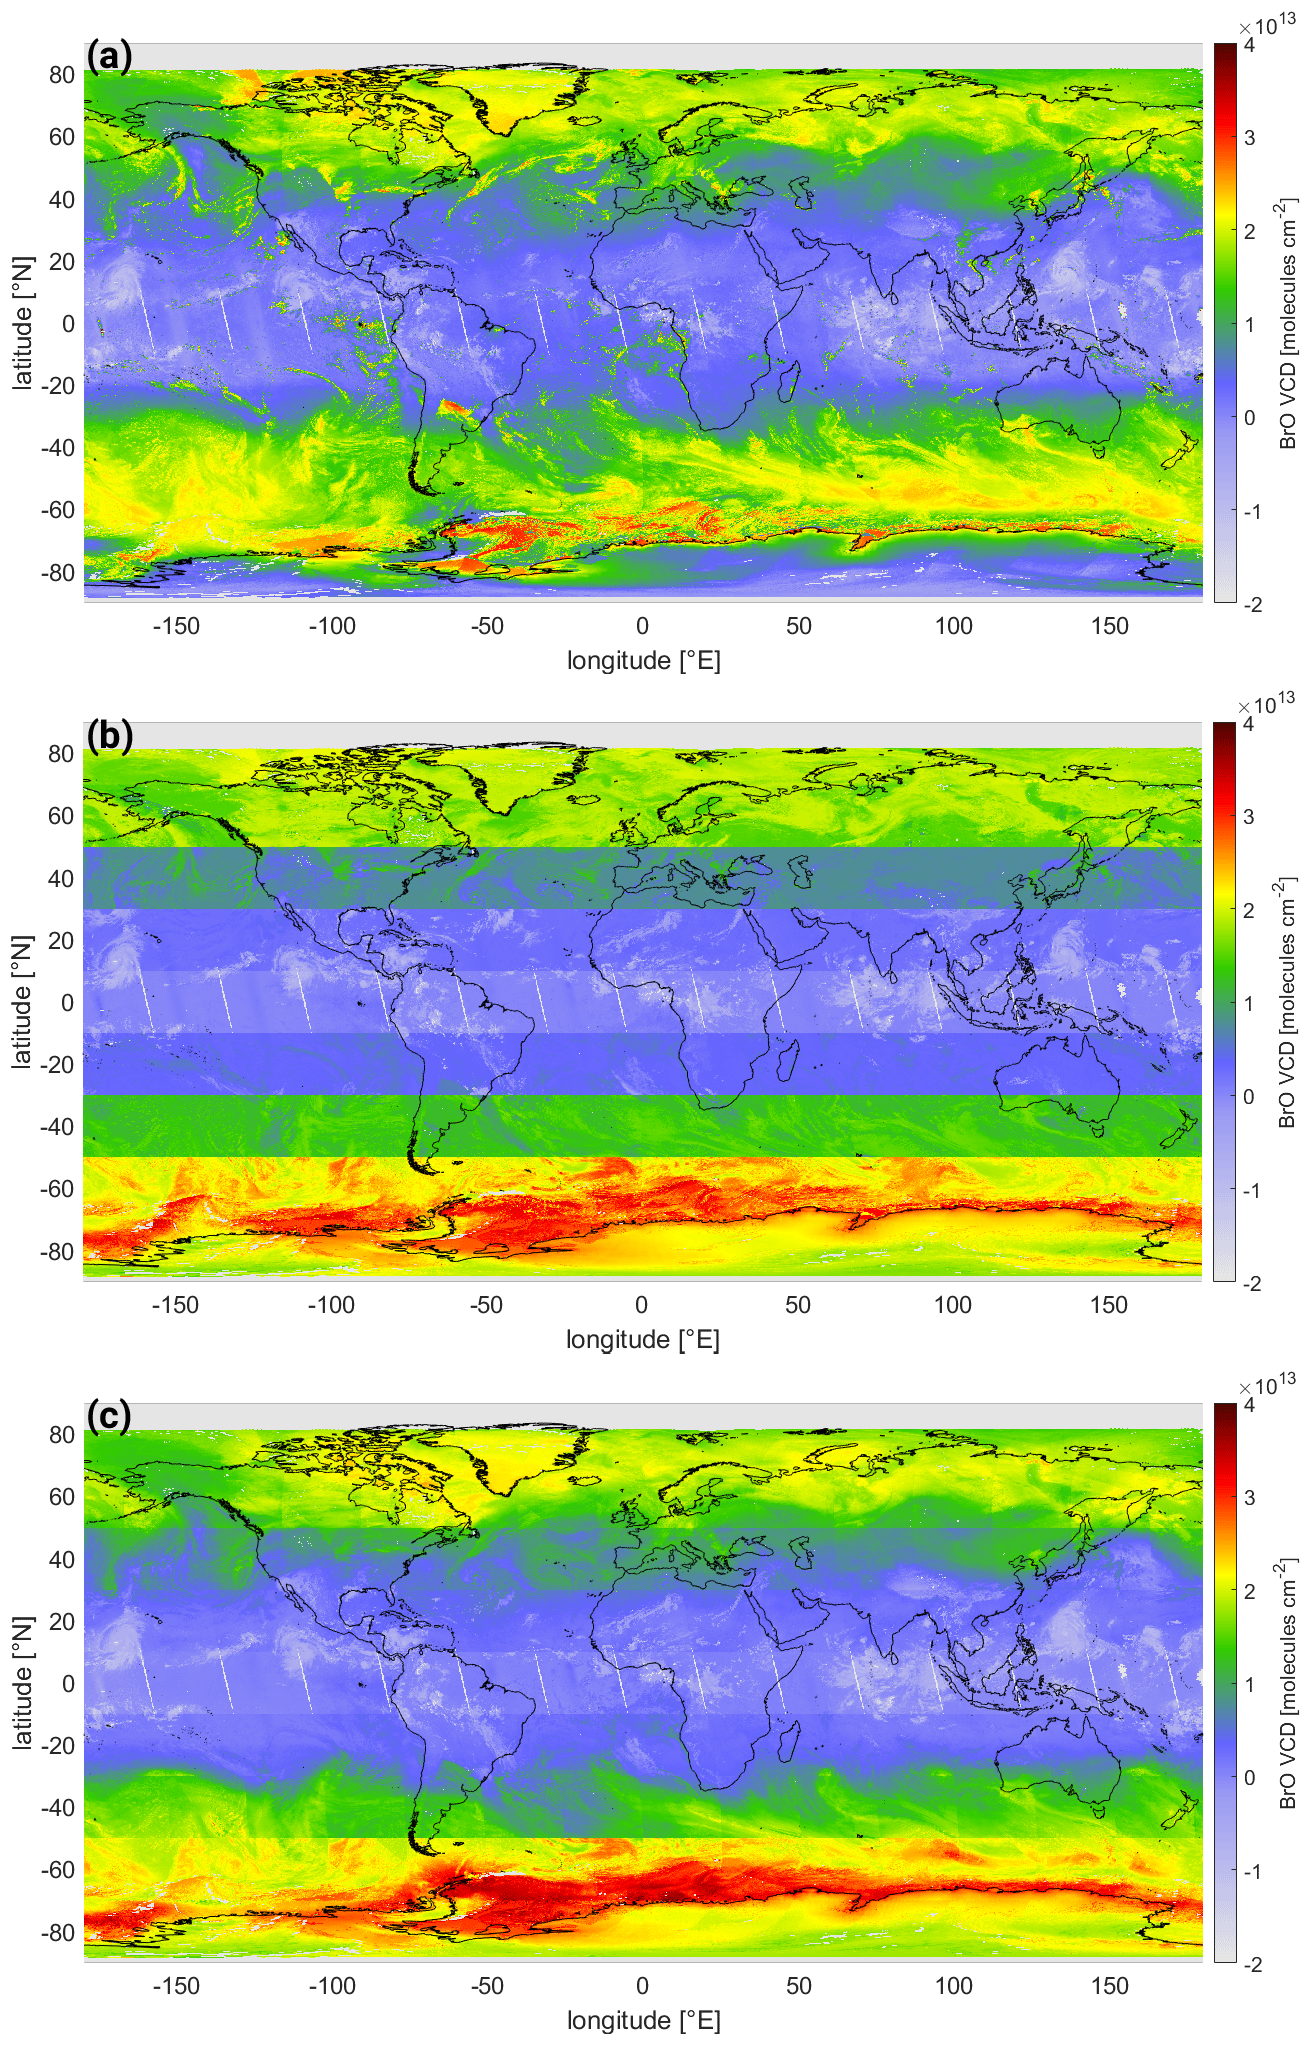
Figure B3Global map of the correction term of the three correction schemes for the SR 323–360 nm fit: (a) ozone, (b) latitude, and (c) ozone latitude correction schemes. The BrO VCD map prior to correction is plotted in Fig. 3, and the corresponding corrected maps for all three schemes are plotted in Fig. 7.
B4 Influence of formaldehyde
Figure B4 shows the mean BrO SCD separated by the HCHO–CF bins for each of the eight fit settings of the African biomass burning region.
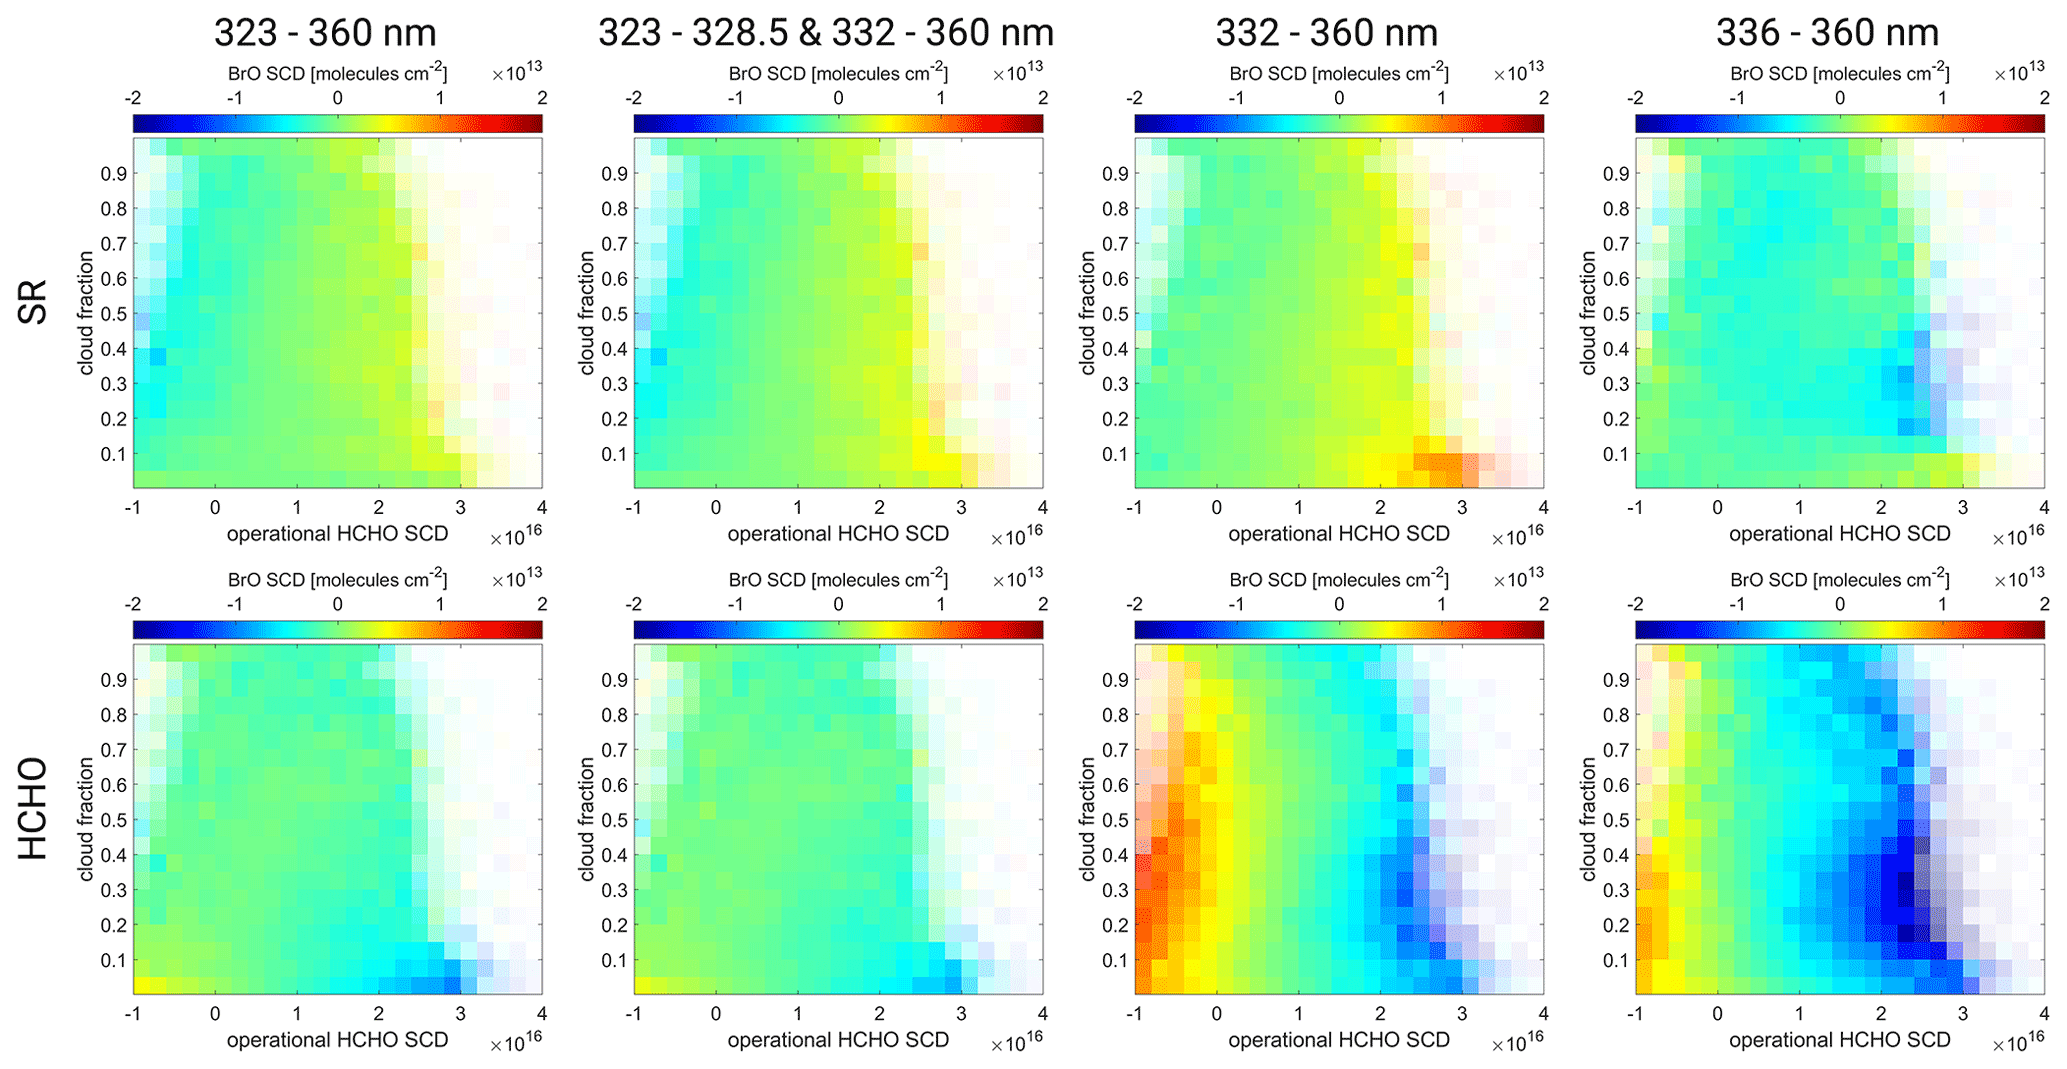
Figure B4Mean BrO SCD as a function of the cloud fraction and HCHO SCD bins for the African biomass region on 1 October 2018 for the four different fit ranges (from left to right): 323–360 nm, 323–328.5 and 332–360 nm, 332–360 nm, and 336–360 nm. Upper row contains fits excluding HCHO (SR); lower row contains fits including HCHO (HCHO).
In this section the auxiliary data used for the cloud ozone correction scheme are shown for every example eruption detailed in Sect. 6.3. All plots include the SO2 map to indicate the plume dispersion pattern. Additionally, the plots include the O3 VCD, the FRESCO cloud height, and the FRESCO cloud fraction, all three of which are used as input for the cloud ozone correction scheme.
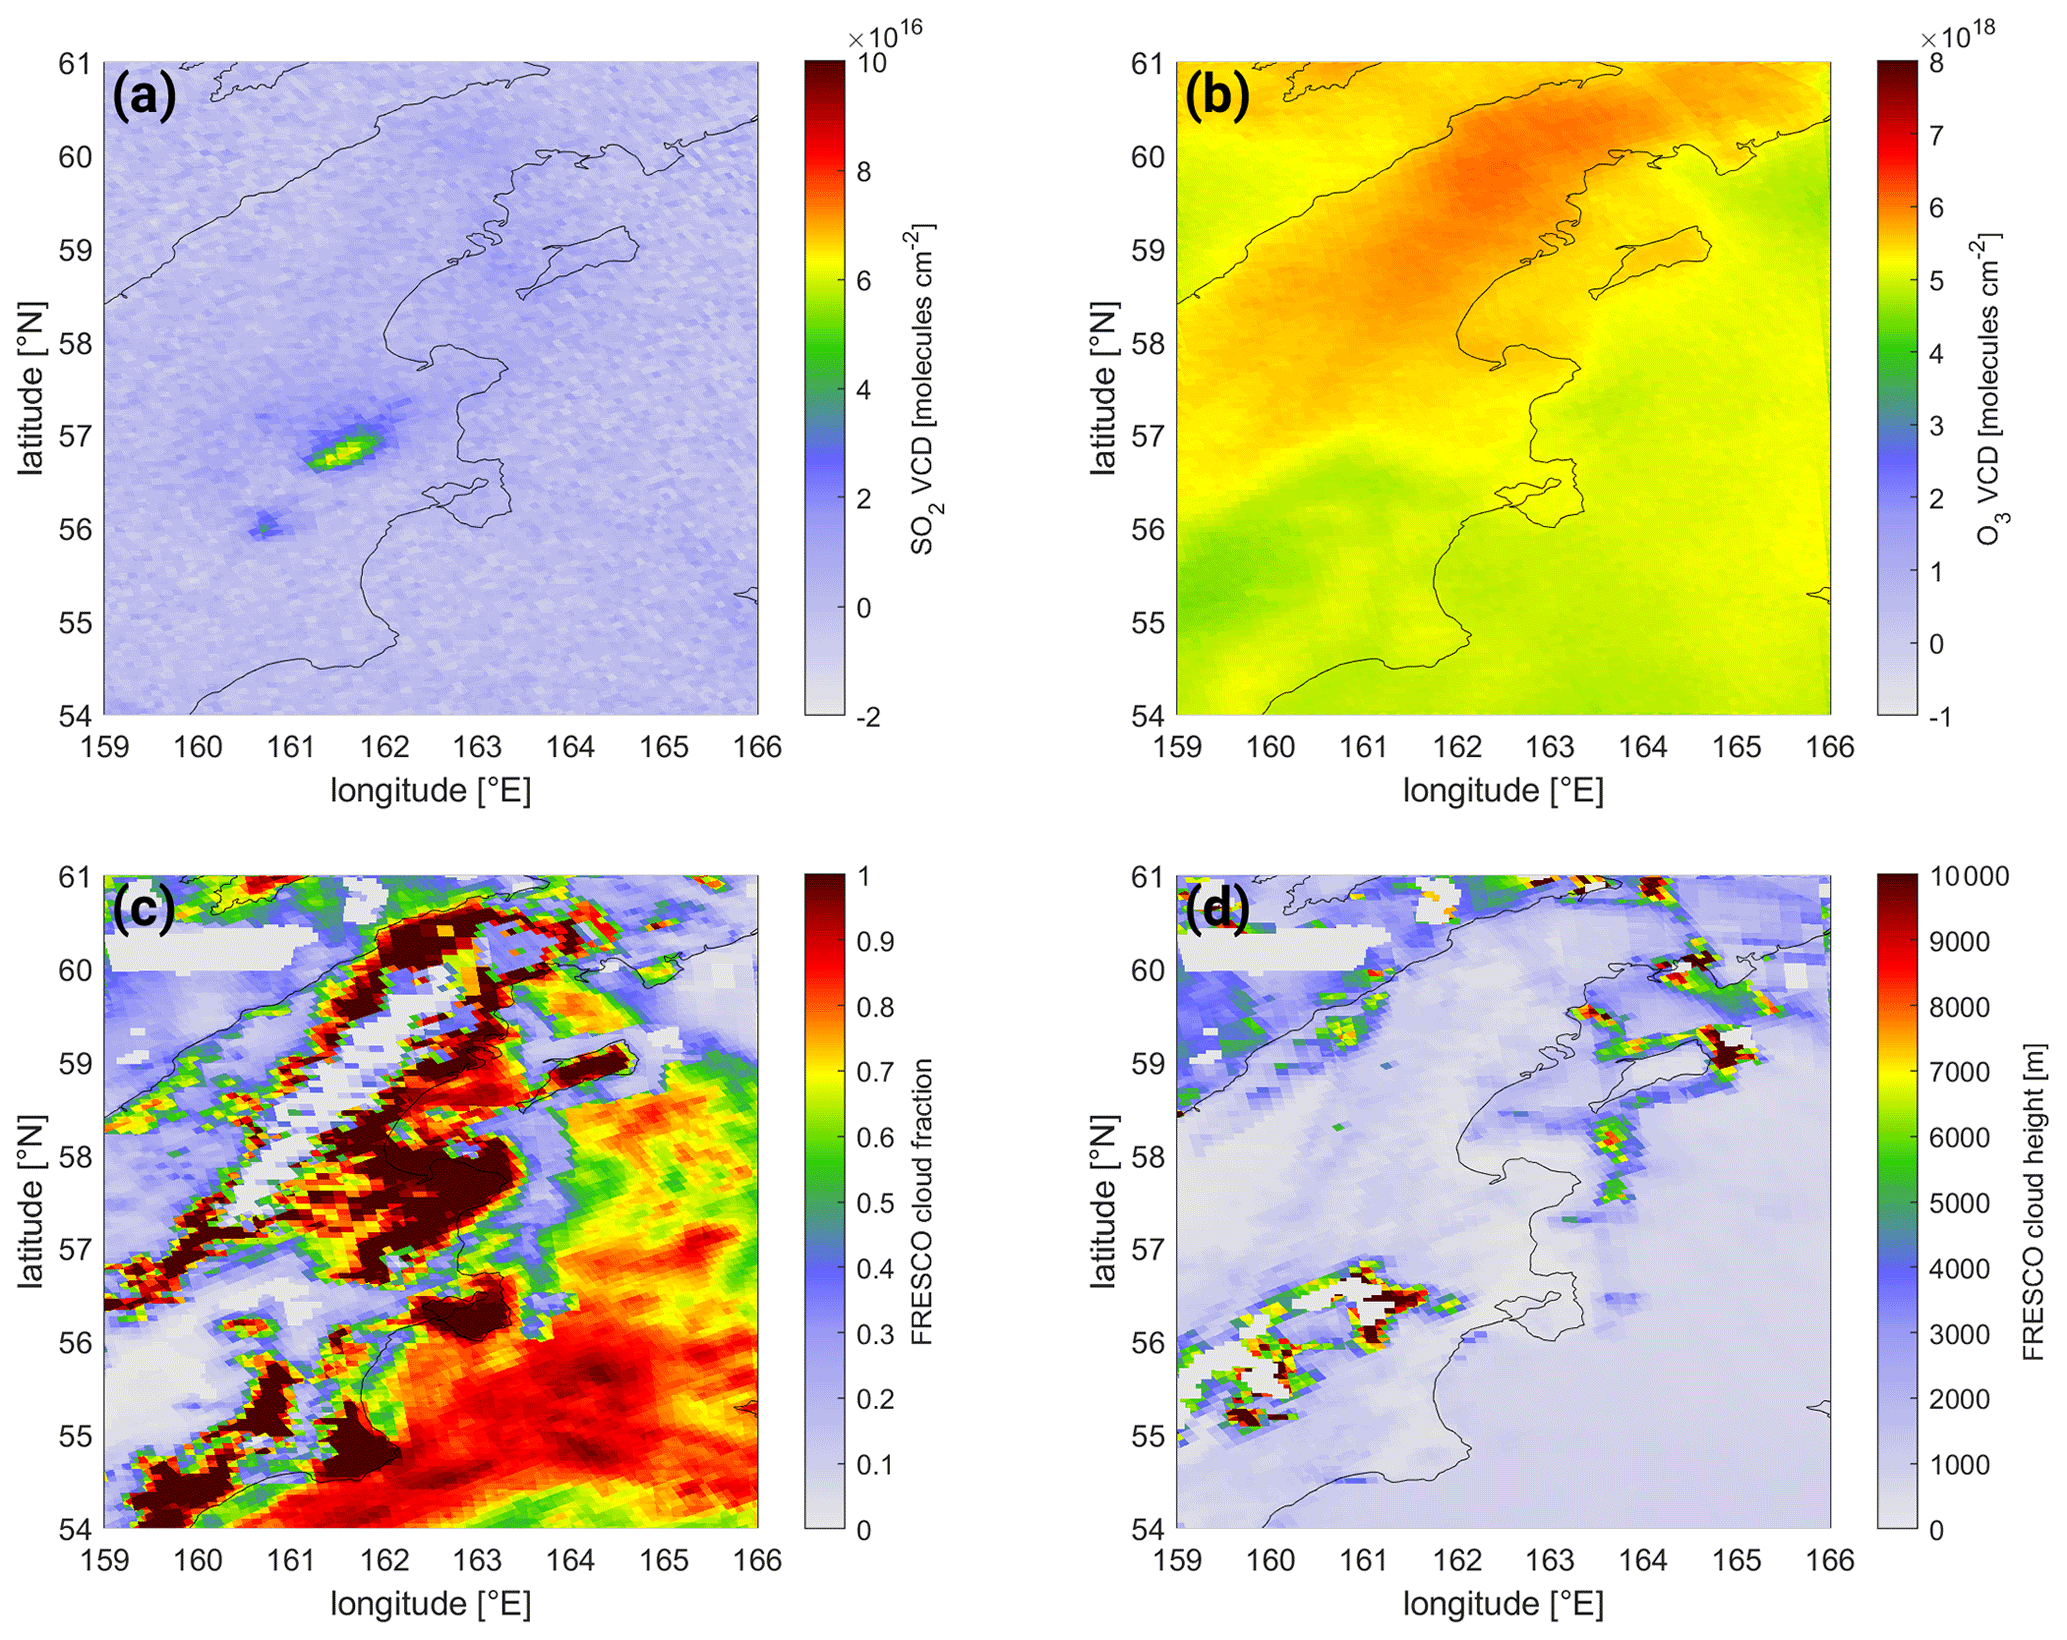
Figure C1Auxiliary data used for the correction scheme for the eruption of Sheveluch, Kamchatka, Russia, on 18 April 2019. Maps of (a) the SO2 VCD, (b) the O3 VCD, (c) the FRESCO cloud fraction, and (d) the FRESCO cloud height. The corresponding uncorrected and corrected BrO VCD map and the BrO background correction map can be found in Fig. 16.
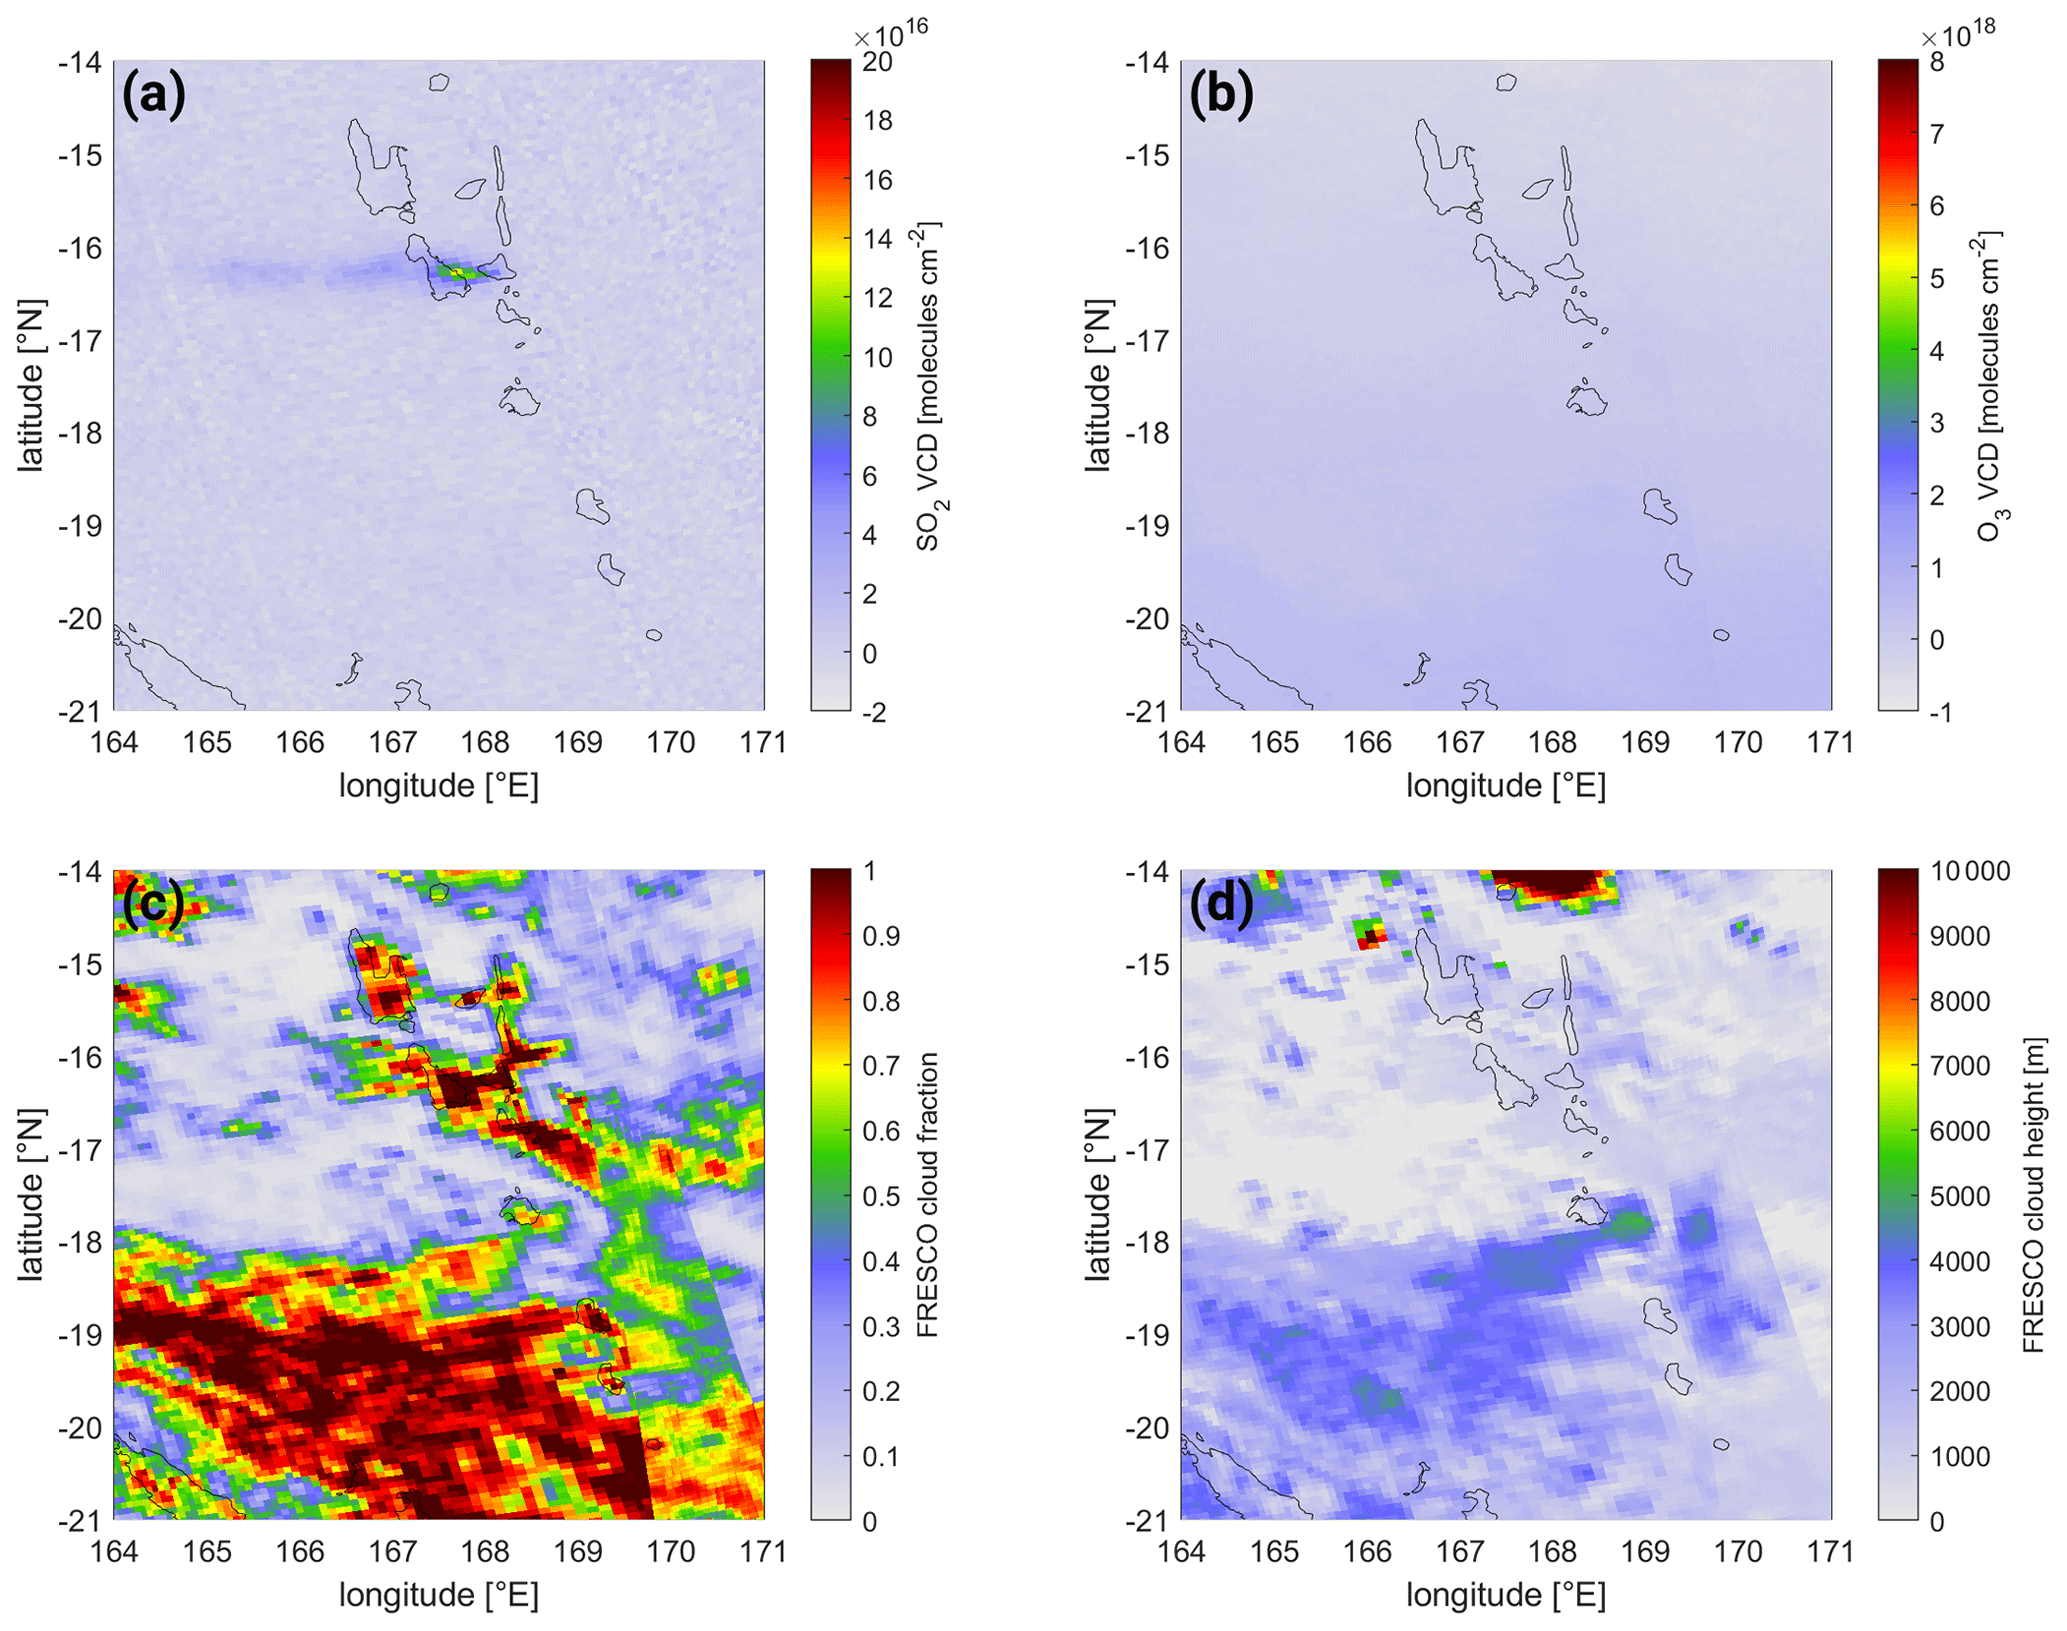
Figure C2Auxiliary data used for the correction scheme for the eruption of Ambrym, Vanuatu, on 30 September 2018. Maps of (a) the SO2 VCD, (b) the O3 VCD, (c) the FRESCO cloud fraction, and (d) the FRESCO cloud height. The corresponding uncorrected and corrected BrO VCD map and the BrO background correction map can be found in Fig. 17.
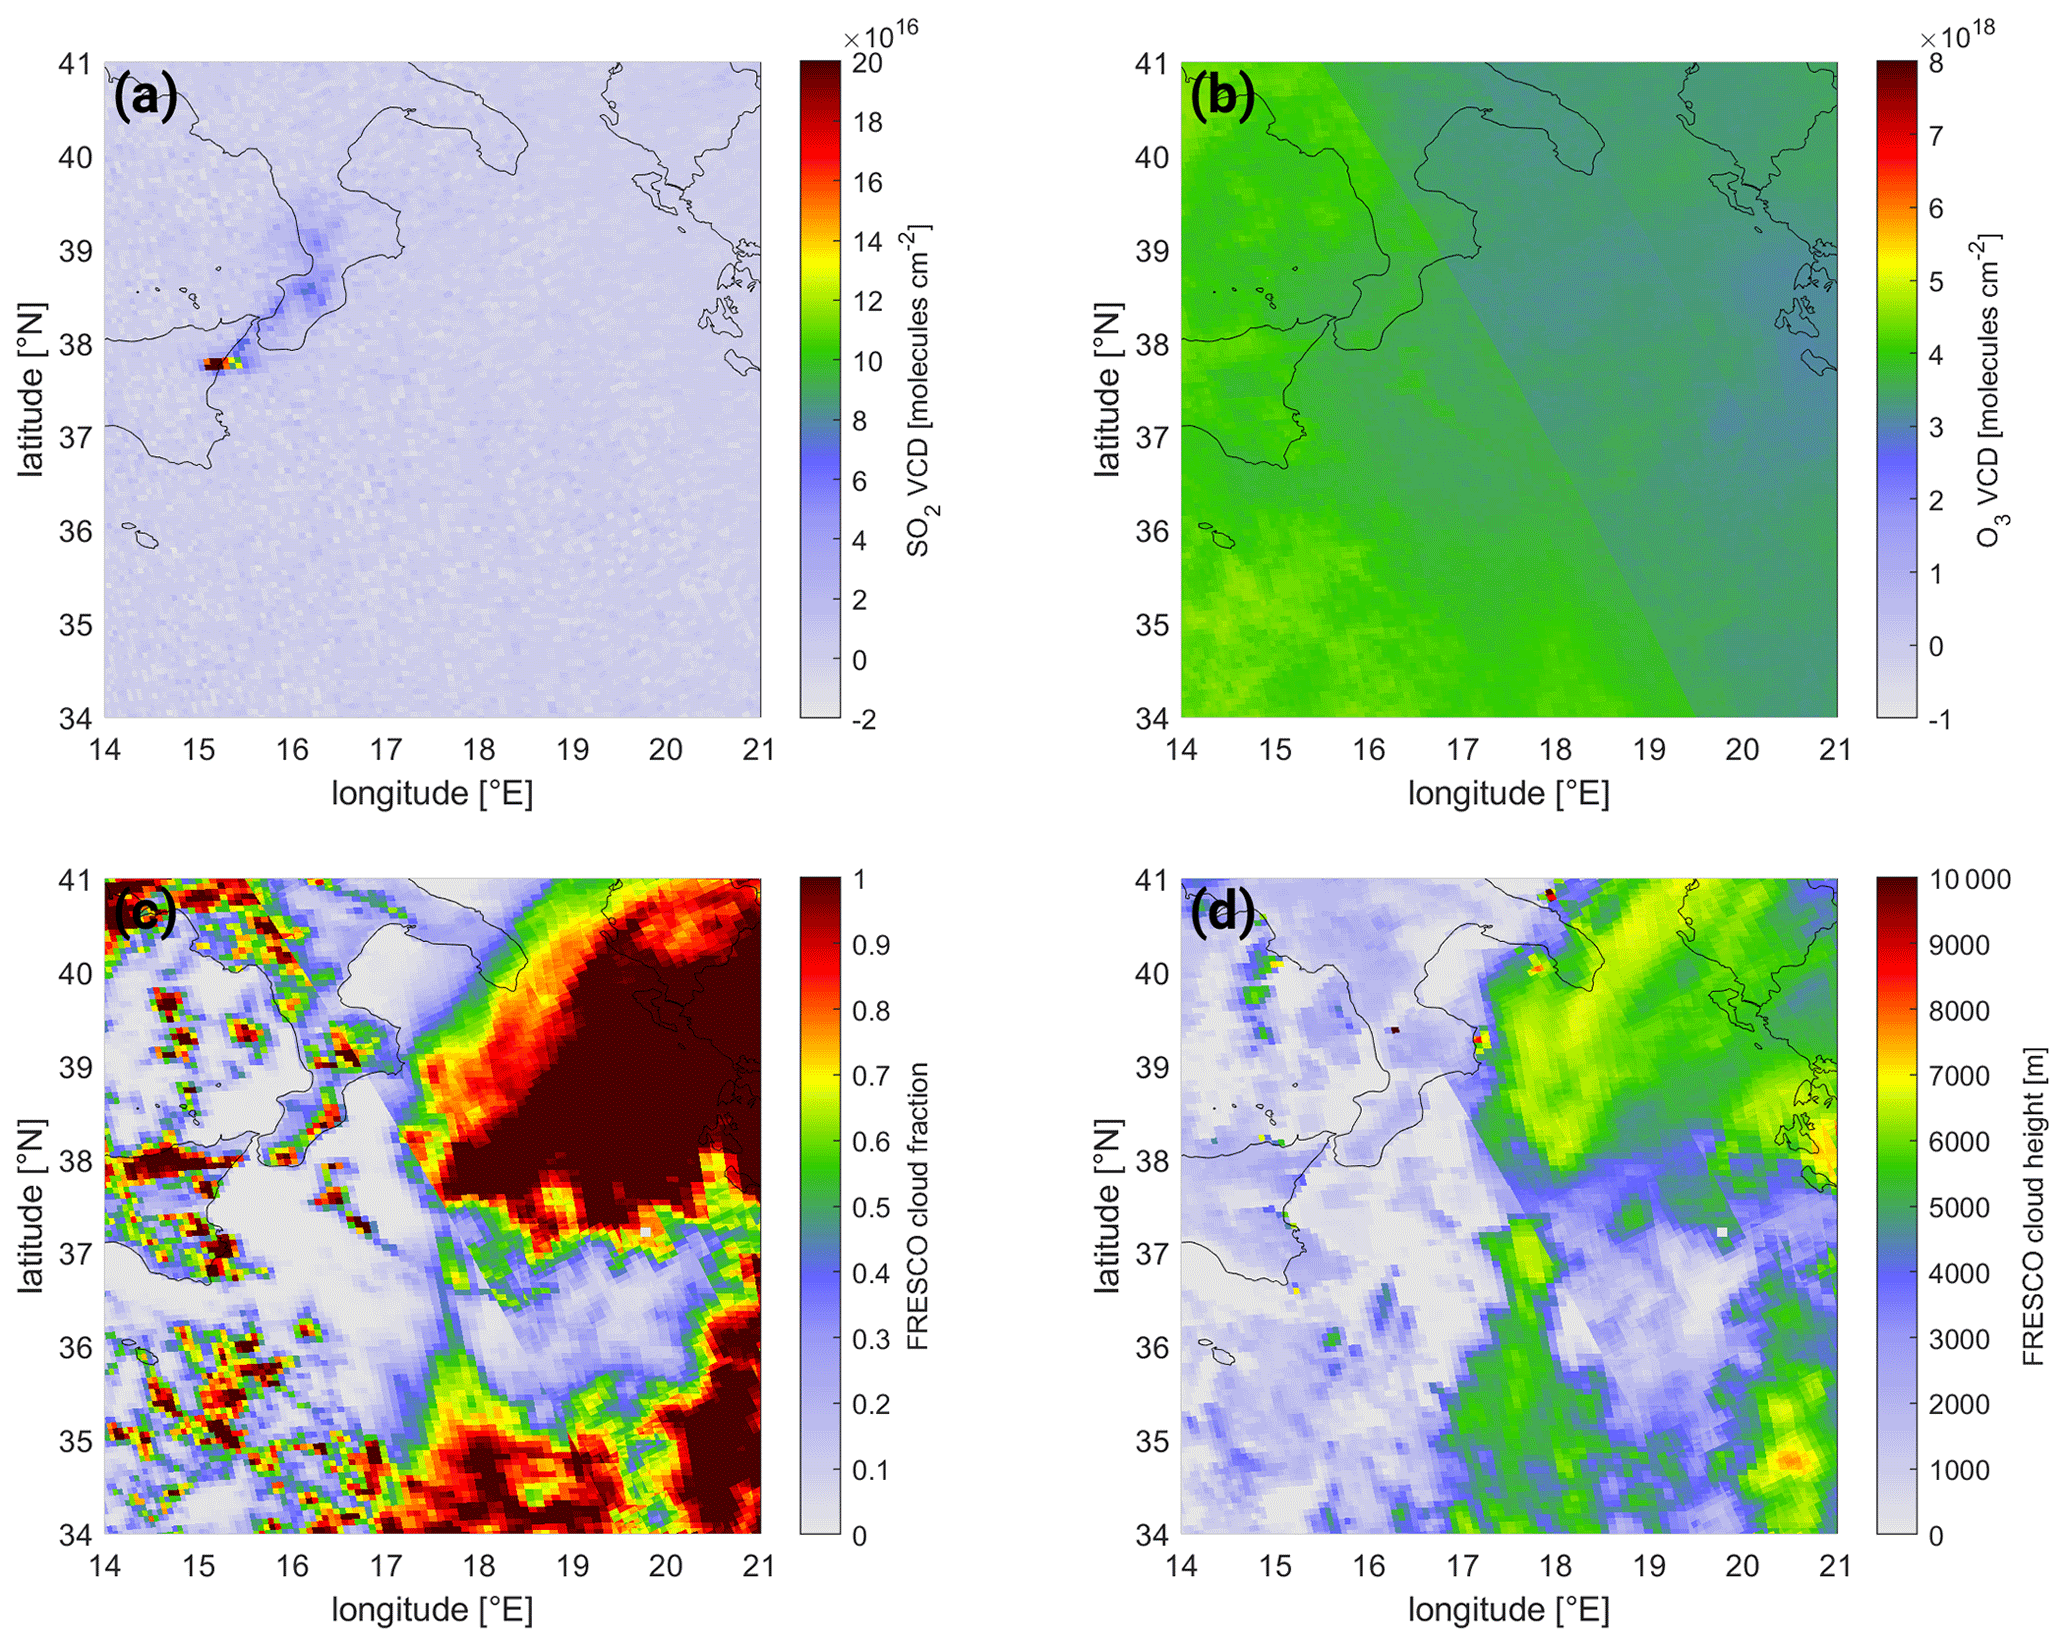
Figure C3Auxiliary data used for the correction scheme for the eruption of Mt. Etna, Italy, on 29 January 2019. Maps of (a) the SO2 VCD, (b) the O3 VCD, (c) the FRESCO cloud fraction, and (d) the FRESCO cloud height. The corresponding uncorrected and corrected BrO VCD map and the BrO background correction map can be found in Fig. 18.
The TROPOMI BrO VCDs (uncorrected, corrected, and the correction terms) and the SO2 VCDs are available upon request.
SW, SB, and TW contributed to the conception and design of the study. SW performed the data evaluation and all the calculations. CB provided the code base and infrastructure for the DOAS retrieval. SW prepared the manuscript in collaboration with SB and TW and all the other co-authors. All authors approved the submitted version.
At least one of the (co-)authors is a member of the editorial board of Atmospheric Measurement Techniques. The peer-review process was guided by an independent editor, and the authors also have no other competing interests to declare.
Publisher's note: Copernicus Publications remains neutral with regard to jurisdictional claims made in the text, published maps, institutional affiliations, or any other geographical representation in this paper. While Copernicus Publications makes every effort to include appropriate place names, the final responsibility lies with the authors.
We thank ESA and the S-5P TROPOMI Level-1 and Level-2 team for providing the L1B spectra and the NO2 L2 data. Moreover, we would like to thank them for the achieved high data quality of TROPOMI and its products. We thank the Deutsches Zentrum für Luft- und Raumfahrt (DLR) for financial support (funding no. 50EE1811B).We thank the Max Planck Computing and Data Facility (MPCDF) for providing access to the high-performance computing cluster used for the DOAS evaluation and post-processing calculations. We thank Jonas Kuhn and Moritz Schöne, both at the Institut für Umweltphysik (IUP) at Heidelberg University, and Steffen Ziegler, MPIC, for valuable discussions about the BrO DOAS retrieval. We thank Natural Earth (https://www.naturalearthdata.com, last access: 2 November 2023) for making their 10 m coastline and borders publicly available, which were used to create the coastline and borders in Earth's maps included in this paper.
This research has been supported by the Deutsches Zentrum für Luft- und Raumfahrt (DLR, grant no. 50EE1811B).
The article processing charges for this open-access publication were covered by the Max Planck Society.
This paper was edited by Michel Van Roozendael and reviewed by two anonymous referees.
Afe, O. T., Richter, A., Sierk, B., Wittrock, F., and Burrows, J. P.: BrO emission from volcanoes: A survey using GOME and SCIAMACHY measurements, Geophys. Res. Lett., 31, L24113, https://doi.org/10.1029/2004GL020994, 2004. a, b, c
Barrie, L. A., Bottenheim, J. W., Schnell, R. C., Crutzen, P. J., and Rasmussen, R. A.: Ozone destruction and photochemical reactions at polar sunrise in the lower Arctic atmosphere, Nature, 334, 138–141, https://doi.org/10.1038/334138a0, 1988. a
Begoin, M., Richter, A., Weber, M., Kaleschke, L., Tian-Kunze, X., Stohl, A., Theys, N., and Burrows, J. P.: Satellite observations of long range transport of a large BrO plume in the Arctic, Atmos. Chem. Phys., 10, 6515–6526, https://doi.org/10.5194/acp-10-6515-2010, 2010. a
Beirle, S., Sihler, H., and Wagner, T.: Linearisation of the effects of spectral shift and stretch in DOAS analysis, Atmos. Meas. Tech., 6, 661–675, https://doi.org/10.5194/amt-6-661-2013, 2013. a, b
Beirle, S., Lampel, J., Lerot, C., Sihler, H., and Wagner, T.: Parameterizing the instrumental spectral response function and its changes by a super-Gaussian and its derivatives, Atmos. Meas. Tech., 10, 581–598, https://doi.org/10.5194/amt-10-581-2017, 2017. a
Bobrowski, N. and Giuffrida, G.: Bromine monoxide / sulphur dioxide ratios in relation to volcanological observations at Mt. Etna 2006–2009, Solid Earth, 3, 433–445, https://doi.org/10.5194/se-3-433-2012, 2012. a
Bobrowski, N. and Platt, U.: ratios studied in five volcanic plumes, J. Volcanol. Geoth. Res., 166, 147–160, https://doi.org/10.1016/j.jvolgeores.2007.07.003, 2007. a
Bobrowski, N., Hönniger, G., Galle, B., and Platt, U.: Detection of bromine monoxide in a volcanic plume, Nature, 423, 273–276, https://doi.org/10.1038/nature01625, 2003. a, b
Boersma, K. F., Eskes, H. J., Dirksen, R. J., van der A, R. J., Veefkind, J. P., Stammes, P., Huijnen, V., Kleipool, Q. L., Sneep, M., Claas, J., Leitão, J., Richter, A., Zhou, Y., and Brunner, D.: An improved tropospheric NO2 column retrieval algorithm for the Ozone Monitoring Instrument, Atmos. Meas. Tech., 4, 1905–1928, https://doi.org/10.5194/amt-4-1905-2011, 2011. a
Bogumil, K., Orphal, J., Homann, T., Voigt, S., Spietz, P., Fleischmann, O. C., Vogel, A., Hartmann, M., Kromminga, H., Bovensmann, H., Frerick, J., and Burrows, J. P.: Measurements of molecular absorption spectra with the SCIAMACHY pre-flight model: instrument characterization and reference data for atmospheric remote-sensing in the 230–2380 nm region, J. Photoch. Photobio. A, 157, 167–184, https://doi.org/10.1016/S1010-6030(03)00062-5, 2003. a, b, c
Borger, C., Beirle, S., Dörner, S., Sihler, H., and Wagner, T.: Total column water vapour retrieval from S-5P/TROPOMI in the visible blue spectral range, Atmos. Meas. Tech., 13, 2751–2783, https://doi.org/10.5194/amt-13-2751-2020, 2020. a
Bougoudis, I., Blechschmidt, A.-M., Richter, A., Seo, S., Burrows, J. P., Theys, N., and Rinke, A.: Long-term time series of Arctic tropospheric BrO derived from UV–VIS satellite remote sensing and its relation to first-year sea ice, Atmos. Chem. Phys., 20, 11869–11892, https://doi.org/10.5194/acp-20-11869-2020, 2020. a
Bräutigam, E.: Construction of an airborne chemiluminescence ozone monitor for volcanic plumes, Bachelor thesis, Heidelberg University, https://doi.org/10.11588/heidok.00032085, 2022. a
Brenna, H., Kutterolf, S., and Krüger, K.: Global ozone depletion and increase of UV radiation caused by pre-industrial tropical volcanic eruptions, Sci. Rep., 9, 9435, https://doi.org/10.1038/s41598-019-45630-0, 2019. a
Burrows, J. P., Borrell, P., and Platt, U. (Eds.): The Remote Sensing of Tropospheric Composition from Space, Springer Berlin Heidelberg, https://doi.org/10.1007/978-3-642-14791-3, 2011. a
Calvari, S., Bilotta, G., Bonaccorso, A., Caltabiano, T., Cappello, A., Corradino, C., Negro, C. D., Ganci, G., Neri, M., Pecora, E., Salerno, G. G., and Spampinato, L.: The VEI 2 Christmas 2018 Etna Eruption: A Small But Intense Eruptive Event or the Starting Phase of a Larger One?, Remote Sens.-Basel, 12, 905, https://doi.org/10.3390/rs12060905, 2020. a
Carn, S. A., Fioletov, V. E., McLinden, C. A., Li, C., and Krotkov, N. A.: A decade of global volcanic SO2 emissions measured from space, Sci. Rep., 7, 44095, https://doi.org/10.1038/srep44095, 2017. a
Chance, K.: Analysis of BrO measurements from the Global Ozone Monitoring Experiment, Geophys. Res. Lett., 25, 3335–3338, https://doi.org/10.1029/98GL52359, 1998. a
Chance, K.: Algorithm Theoretical Basis Document – Volume IV, Tech. rep., Smithsonian Astrophysical Observatory, Cambridge, MA, USA, https://eospso.gsfc.nasa.gov/sites/default/files/atbd/ATBD-OMI-04.pdf (last access: 2 November 2023), 2002. a
Chance, K.: OMBRO–OMHCHO–OMOCLO De-Striping README FILE, Tech. rep., https://lweb.cfa.harvard.edu/atmosphere/Instruments/OMI/PGEReleases/READMEs/OMSAO_DeStriping_README.pdf (last access: 2 November 2023), 2007. a, b
Compernolle, S., Argyrouli, A., Lutz, R., Sneep, M., Lambert, J.-C., Fjæraa, A. M., Hubert, D., Keppens, A., Loyola, D., O'Connor, E., Romahn, F., Stammes, P., Verhoelst, T., and Wang, P.: Validation of the Sentinel-5 Precursor TROPOMI cloud data with Cloudnet, Aura OMI O2–O2, MODIS, and Suomi-NPP VIIRS, Atmos. Meas. Tech., 14, 2451–2476, https://doi.org/10.5194/amt-14-2451-2021, 2021. a
Copernicus Sentinel-5P NO2 L2 product (processed by ESA): TROPOMI Level 2 Nitrogen Dioxide total column products. Version 02, European Space Agency, https://sentinels.copernicus.eu/web/sentinel/data-products/-/asset_publisher/fp37fc19FN8F/content/sentinel-5-precursor-level-2-nitrogen-dioxide (last access: 2 November 2023), 2021. a, b
De Smedt, I., Theys, N., Yu, H., Danckaert, T., Lerot, C., Compernolle, S., Van Roozendael, M., Richter, A., Hilboll, A., Peters, E., Pedergnana, M., Loyola, D., Beirle, S., Wagner, T., Eskes, H., van Geffen, J., Boersma, K. F., and Veefkind, P.: Algorithm theoretical baseline for formaldehyde retrievals from S5P TROPOMI and from the QA4ECV project, Atmos. Meas. Tech., 11, 2395–2426, https://doi.org/10.5194/amt-11-2395-2018, 2018. a, b, c, d, e, f
Dinger, F., Bobrowski, N., Warnach, S., Bredemeyer, S., Hidalgo, S., Arellano, S., Galle, B., Platt, U., and Wagner, T.: Periodicity in the molar ratios in the volcanic gas plume of Cotopaxi and its correlation with the Earth tides during the eruption in 2015, Solid Earth, 9, 247–266, https://doi.org/10.5194/se-9-247-2018, 2018. a
Eisinger, M. and Burrows, J. P.: Tropospheric sulfur dioxide observed by the ERS-2 GOME instrument, Geophys. Res. Lett., 25, 4177–4180, https://doi.org/10.1029/1998GL900128, 1998. a
Fioletov, V. E., McLinden, C. A., Krotkov, N., Li, C., Joiner, J., Theys, N., Carn, S., and Moran, M. D.: A global catalogue of large SO2 sources and emissions derived from the Ozone Monitoring Instrument, Atmos. Chem. Phys., 16, 11497–11519, https://doi.org/10.5194/acp-16-11497-2016, 2016. a
Fleischmann, O. C., Hartmann, M., Burrows, J. P., and Orphal, J.: New ultraviolet absorption cross-sections of BrO at atmospheric temperatures measured by time-windowing Fourier transform spectroscopy, J. Photoch. Photobio. A, 168, 117–132, https://doi.org/10.1016/j.jphotochem.2004.03.026, 2004. a, b
Global Volcanism Program: Report on Etna (Italy), edited by: Crafford, A. E. and Venzke, E., Bulletin of the Global Volcanism Network, 44:4, Smithsonian Institution, https://doi.org/10.5479/si.GVP.BGVN201904-211060, 2019. a, b, c
Gutmann, A., Bobrowski, N., Roberts, T. J., Rüdiger, J., and Hoffmann, T.: Advances in Bromine Speciation in Volcanic Plumes, Front. Earth Sci., 6, 213, https://doi.org/10.3389/feart.2018.00213, 2018. a
Hegels, E., Crutzen, P. J., Klüpfel, T., Perner, D., and Burrows, J. P.: Global distribution of atmospheric bromine-monoxide from GOME on Earth Observing Satellite ERS-2, Geophys. Res. Lett., 25, 3127–3130, https://doi.org/10.1029/98GL02417, 1998. a
Herrmann, M., Schöne, M., Borger, C., Warnach, S., Wagner, T., Platt, U., and Gutheil, E.: Ozone depletion events in the Arctic spring of 2019: a new modeling approach to bromine emissions, Atmos. Chem. Phys., 22, 13495–13526, https://doi.org/10.5194/acp-22-13495-2022, 2022. a
Heue, K.-P., Brenninkmeijer, C. A. M., Baker, A. K., Rauthe-Schöch, A., Walter, D., Wagner, T., Hörmann, C., Sihler, H., Dix, B., Frieß, U., Platt, U., Martinsson, B. G., van Velthoven, P. F. J., Zahn, A., and Ebinghaus, R.: SO2 and BrO observation in the plume of the Eyjafjallajökull volcano 2010: CARIBIC and GOME-2 retrievals, Atmos. Chem. Phys., 11, 2973–2989, https://doi.org/10.5194/acp-11-2973-2011, 2011. a
Hörmann, C.: Space-based monitoring of volcanic emissions using the GOME-2 instrument, PhD thesis, Heidelberg University, https://doi.org/10.11588/HEIDOK.00014536, 2013. a
Hörmann, C., Sihler, H., Bobrowski, N., Beirle, S., Penning de Vries, M., Platt, U., and Wagner, T.: Systematic investigation of bromine monoxide in volcanic plumes from space by using the GOME-2 instrument, Atmos. Chem. Phys., 13, 4749–4781, https://doi.org/10.5194/acp-13-4749-2013, 2013. a, b, c, d, e, f, g, h, i, j, k, l
Hörmann, C., Sihler, H., Beirle, S., Penning de Vries, M., Platt, U., and Wagner, T.: Seasonal variation of tropospheric bromine monoxide over the Rann of Kutch salt marsh seen from space, Atmos. Chem. Phys., 16, 13015–13034, https://doi.org/10.5194/acp-16-13015-2016, 2016. a, b, c
Khokhar, M. F., Frankenberg, C., Van Roozendael, M., Beirle, S., Kühl, S., Richter, A., Platt, U., and Wagner, T.: Satellite observations of atmospheric SO2 from volcanic eruptions during the time-period of 1996–2002, Adv. Space Res., 36, 879–887, https://doi.org/10.1016/j.asr.2005.04.114, 2005. a
Latsch, M., Richter, A., Eskes, H., Sneep, M., Wang, P., Veefkind, P., Lutz, R., Loyola, D., Argyrouli, A., Valks, P., Wagner, T., Sihler, H., van Roozendael, M., Theys, N., Yu, H., Siddans, R., and Burrows, J. P.: Intercomparison of Sentinel-5P TROPOMI cloud products for tropospheric trace gas retrievals, Atmos. Meas. Tech., 15, 6257–6283, https://doi.org/10.5194/amt-15-6257-2022, 2022. a
Loyola, D. G., Gimeno García, S., Lutz, R., Argyrouli, A., Romahn, F., Spurr, R. J. D., Pedergnana, M., Doicu, A., Molina García, V., and Schüssler, O.: The operational cloud retrieval algorithms from TROPOMI on board Sentinel-5 Precursor, Atmos. Meas. Tech., 11, 409–427, https://doi.org/10.5194/amt-11-409-2018, 2018. a
Lübcke, P., Bobrowski, N., Arellano, S., Galle, B., Garzón, G., Vogel, L., and Platt, U.: molar ratios from scanning DOAS measurements in the NOVAC network, Solid Earth, 5, 409–424, https://doi.org/10.5194/se-5-409-2014, 2014. a
Meller, R. and Moortgat, G. K.: Temperature dependence of the absorption cross sections of formaldehyde between 223 and 323 K in the wavelength range 225–375 nm, J. Geophys. Res.-Atmos., 105, 7089–7101, https://doi.org/10.1029/1999JD901074, 2000. a, b
Perner, D. and Platt, U.: Detection of nitrous acid in the atmosphere by differential optical absorption, Geophys. Res. Lett., 6, 917–920, https://doi.org/10.1029/GL006i012p00917, 1979. a, b
Platt, U. and Bobrowski, N.: Quantification of volcanic reactive halogen emissions, Cambridge University Press, 115–132, https://doi.org/10.1017/CBO9781107415683.011, 2015. a
Puķīte, J. and Wagner, T.: Quantification and parametrization of non-linearity effects by higher-order sensitivity terms in scattered light differential optical absorption spectroscopy, Atmos. Meas. Tech., 9, 2147–2177, https://doi.org/10.5194/amt-9-2147-2016, 2016. a
Puķīte, J., Kühl, S., Deutschmann, T., Platt, U., and Wagner, T.: Extending differential optical absorption spectroscopy for limb measurements in the UV, Atmos. Meas. Tech., 3, 631–653, https://doi.org/10.5194/amt-3-631-2010, 2010. a, b, c, d, e
Richter, A. and Wagner, T.: Diffuser plate spectral structures and their influence on GOME slant columns, Technical Note to ESA, https://www.iup.uni-bremen.de/gome/data/diffuser_gome.pdf (last access: 2 November 2023), 2001. a
Richter, A., Wittrock, F., Eisinger, M., and Burrows, J. P.: GOME observations of tropospheric BrO in northern hemispheric spring and summer 1997, Geophys. Res. Lett., 25, 2683–2686, https://doi.org/10.1029/98GL52016, 1998. a, b
Richter, A., Wittrock, F., Ladstätter-Weißenmayer, A., and Burrows, J. P.: Gome measurements of stratospheric and tropospheric BrO, Adv. Space Res., 29, 1667–1672, https://doi.org/10.1016/S0273-1177(02)00123-0, 2002. a, b
Rix, M., Valks, P., Hao, N., Loyola, D., Schlager, H., Huntrieser, H., Flemming, J., Koehler, U., Schumann, U., and Inness, A.: Volcanic SO2, BrO and plume height estimations using GOME-2 satellite measurements during the eruption of Eyjafjallajökull in May 2010, J. Geophys. Res.-Atmos., 117, D00U19, https://doi.org/10.1029/2011JD016718, 2012. a
Rüth, M.: Characterisation of a chemiluminescence ozone monitor for volcanic applications, Bachelor thesis, University Heidelberg, https://doi.org/10.11588/heidok.00029947, 2021. a
Schöne, M.: Tropospheric BrO plumes in Arctic spring – A comparison of TROPOMI satellite observations and model results, PhD thesis, Heidelberg University, https://doi.org/10.11588/HEIDOK.00032838, 2023. a
Seo, S., Richter, A., Blechschmidt, A.-M., Bougoudis, I., and Burrows, J. P.: First high-resolution BrO column retrievals from TROPOMI, Atmos. Meas. Tech., 12, 2913–2932, https://doi.org/10.5194/amt-12-2913-2019, 2019. a, b, c, d, e, f, g, h, i, j
Serdyuchenko, A., Gorshelev, V., Weber, M., Chehade, W., and Burrows, J. P.: High spectral resolution ozone absorption cross-sections – Part 2: Temperature dependence, Atmos. Meas. Tech., 7, 625–636, https://doi.org/10.5194/amt-7-625-2014, 2014. a, b, c
Sihler, H., Platt, U., Beirle, S., Marbach, T., Kühl, S., Dörner, S., Verschaeve, J., Frieß, U., Pöhler, D., Vogel, L., Sander, R., and Wagner, T.: Tropospheric BrO column densities in the Arctic derived from satellite: retrieval and comparison to ground-based measurements, Atmos. Meas. Tech., 5, 2779–2807, https://doi.org/10.5194/amt-5-2779-2012, 2012. a, b, c, d, e, f, g, h, i, j, k, l, m, n, o
Sihler, H., Beirle, S., Dörner, S., Gutenstein-Penning de Vries, M., Hörmann, C., Borger, C., Warnach, S., and Wagner, T.: MICRU: an effective cloud fraction algorithm designed for UV–vis satellite instruments with large viewing angles, Atmos. Meas. Tech., 14, 3989–4031, https://doi.org/10.5194/amt-14-3989-2021, 2021. a
Simpson, W. R., von Glasow, R., Riedel, K., Anderson, P., Ariya, P., Bottenheim, J., Burrows, J., Carpenter, L. J., Frieß, U., Goodsite, M. E., Heard, D., Hutterli, M., Jacobi, H.-W., Kaleschke, L., Neff, B., Plane, J., Platt, U., Richter, A., Roscoe, H., Sander, R., Shepson, P., Sodeau, J., Steffen, A., Wagner, T., and Wolff, E.: Halogens and their role in polar boundary-layer ozone depletion, Atmos. Chem. Phys., 7, 4375–4418, https://doi.org/10.5194/acp-7-4375-2007, 2007. a
Surl, L., Donohoue, D., Aiuppa, A., Bobrowski, N., and von Glasow, R.: Quantification of the depletion of ozone in the plume of Mount Etna, Atmos. Chem. Phys., 15, 2613–2628, https://doi.org/10.5194/acp-15-2613-2015, 2015. a
Surl, L., Roberts, T., and Bekki, S.: Observation and modelling of ozone-destructive halogen chemistry in a passively degassing volcanic plume, Atmos. Chem. Phys., 21, 12413–12441, https://doi.org/10.5194/acp-21-12413-2021, 2021. a
Textor, C., Graf, H.-F., Timmreck, C., and Robock, A.: Emissions from volcanoes, in: Emissions of Atmospheric Trace Compounds, edited by: Granier, C., Artaxo, P., and Reeves, C., Advances in Global Change Research, vol. 18, Springer Netherlands, 269–303, https://doi.org/10.1007/978-1-4020-2167-1_7, 2004. a
Thalman, R. and Volkamer, R.: Temperature dependent absorption cross-sections of O2–O2 collision pairs between 340 and 630 nm and at atmospherically relevant pressure, Phys. Chem. Chem. Phys., 15, 15371–15381, https://doi.org/10.1039/C3CP50968K, 2013. a
Theys, N., Roozendael, M. V., Dils, B., Hendrick, F., Hao, N., and Mazière, M. D.: First satellite detection of volcanic bromine monoxide emission after the Kasatochi eruption, Geophys. Res. Lett., 36, L03809, https://doi.org/10.1029/2008GL036552, 2009. a, b
Theys, N., Van Roozendael, M., Hendrick, F., Yang, X., De Smedt, I., Richter, A., Begoin, M., Errera, Q., Johnston, P. V., Kreher, K., and De Mazière, M.: Global observations of tropospheric BrO columns using GOME-2 satellite data, Atmos. Chem. Phys., 11, 1791–1811, https://doi.org/10.5194/acp-11-1791-2011, 2011. a, b, c, d, e, f, g, h, i, j
Theys, N., De Smedt, I., van Gent, J., Danckaert, T., Wang, T., Hendrick, F., Stavrakou, T., Bauduin, S., Clarisse, L., Li, C., Krotkov, N., Yu, H., Brenot, H., and Van Roozendael, M.: Sulfur dioxide vertical column DOAS retrievals from the Ozone Monitoring Instrument: Global observations and comparison to ground-based and satellite data, J. Geophys. Res.-Atmos., 120, 2470–2491, https://doi.org/10.1002/2014JD022657, 2015. a, b
Theys, N., De Smedt, I., Yu, H., Danckaert, T., van Gent, J., Hörmann, C., Wagner, T., Hedelt, P., Bauer, H., Romahn, F., Pedergnana, M., Loyola, D., and Van Roozendael, M.: Sulfur dioxide retrievals from TROPOMI onboard Sentinel-5 Precursor: algorithm theoretical basis, Atmos. Meas. Tech., 10, 119–153, https://doi.org/10.5194/amt-10-119-2017, 2017. a, b, c, d, e
Thomas, W., Erbertseder, T., Ruppert, T., Roozendael, M. V., Verdebout, J., Balis, D., Meleti, C., and Zerefos, C.: On the Retrieval of Volcanic Sulfur Dioxide Emissions from GOME Backscatter Measurements, J. Atmos. Chem., 50, 295–320, https://doi.org/10.1007/s10874-005-5544-1, 2005. a
Valks, P., Loyola, D., Hao, N., Hedelt, P., Slijkhuis, S., Grossi, M., Begoin, M., Gimeno Garcia, S., and Lutz, R.: Algorithm Theoretical Basis Document for GOME-2 Total Column Products of Ozone, NO2, BrO, HCHO, SO2, H2O and Cloud Properties (GDP 4.8), techreport, Deutsches Zentrum für Luft und Raumfahrt, Oberpfaffenhofen, Germany, https://atmos.eoc.dlr.de/app/docs/DLR_GOME-2_ATBD.pdf (last access: 2 November 2023), 2015. a
van Geffen, J., Eskes, H. J., Boersma, K. F., and Veefkind, J. P.: TROPOMI ATBD of thetotal and tropospheric NO2 data products, resreport, KNMI, report S5P-KNMI-L2-0005-RP, https://sentinel.esa.int/documents/247904/2476257/Sentinel-5P-TROPOMI-ATBD-NO2-data-products (last access: 2 November 2023), 2021. a, b
van Roozendael, M. and the Sentinel 5 Verification team: Sentinel 5 L2 Prototype Processors – Scientific Verification Report, 2021. a
Vandaele, A. C., Hermans, C., Simon, P. C., Carleer, M., Colin, R., Fally, S., Merienne, M. F., Jenouvrier, A., and Coquart, B.: Measurements of the NO2 absorption cross-section from 42 000 cm−1 to 10 000 cm−1 (238–1000 nm) at 220 K and 294 K, J. Quant. Spectrosc. Ra., 59, 171–184, https://doi.org/10.1016/S0022-4073(97)00168-4, 1998. a
Veefkind, J. P., Aben, I., McMullan, K., Förster, H., de Vries, J., Otter, G., Claas, J., Eskes, H. J., de Haan, J. F., Kleipool, Q., van Weele, M., Hasekamp, O., Hoogeveen, R., Landgraf, J., Snel, R., Tol, P., Ingmann, P., Voors, R., Kruizinga, B., Vink, R., Visser, H., and Levelt, P. F.: TROPOMI on the ESA Sentinel-5 Precursor: A GMES mission for global observations of the atmospheric composition for climate, air quality and ozone layer applications, Remote Sens. Environ., 120, 70–83, https://doi.org/10.1016/j.rse.2011.09.027, 2012. a, b, c
Vogel, L., Sihler, H., Lampel, J., Wagner, T., and Platt, U.: Retrieval interval mapping: a tool to visualize the impact of the spectral retrieval range on differential optical absorption spectroscopy evaluations, Atmos. Meas. Tech., 6, 275–299, https://doi.org/10.5194/amt-6-275-2013, 2013. a, b
von Glasow, R.: Atmospheric chemistry in volcanic plumes, P. Natl. Acad. Sci. USA, 107, 6594–6599, https://doi.org/10.1073/pnas.0913164107, 2010. a
Wagner, T. and Platt, U.: Satellite mapping of enhanced BrO concentrations in the troposphere, Nature, 395, 486–490, https://doi.org/10.1038/26723, 1998. a, b, c
Wagner, T. and the Sentinel 4 Verification team: Sentinel-4 Geophysical Algorithm Verification Report v3.1, 2022. a
Wagner, T., Beirle, S., and Deutschmann, T.: Three-dimensional simulation of the Ring effect in observations of scattered sun light using Monte Carlo radiative transfer models, Atmos. Meas. Tech., 2, 113–124, https://doi.org/10.5194/amt-2-113-2009, 2009. a, b
Warnach, S.: Bromine monoxide in volcanic plumes – A global survey of volcanic plume composition and chemistry derived from Sentinel-5 Precursor/TROPOMI data, PhD thesis, Heidelberg University, https://doi.org/10.11588/HEIDOK.00031910, 2022. a, b, c, d, e
Warnach, S., Bobrowski, N., Hidalgo, S., Arellano, S., Sihler, H., Dinger, F., Lübcke, P., Battaglia, J., Steele, A., Galle, B., Platt, U., and Wagner, T.: Variation of the Molar Ratio in the Plume of Tungurahua Volcano Between 2007 and 2017 and Its Relationship to Volcanic Activity, Front. Earth Sci., 7, 132, https://doi.org/10.3389/feart.2019.00132, 2019. a
- Abstract
- Introduction
- Methods
- Fit test setup
- Investigation of systematic effects
- Proposed fit settings for the retrieval of BrO in volcanic plumes
- Retrieval of BrO inside volcanic plumes
- Conclusions
- Appendix A: Influence of volcanic plumes on an earthshine reference spectrum
- Appendix B: Detailed data for systematic influences
- Appendix C: Additional data for the example eruptions
- Data availability
- Author contributions
- Competing interests
- Disclaimer
- Acknowledgements
- Financial support
- Review statement
- References