the Creative Commons Attribution 4.0 License.
the Creative Commons Attribution 4.0 License.
 | 06 Jan 2023
TROPOMI/S5P Total Column Water Vapor validation against AERONET ground-based measurements
Katerina Garane
Ka Lok Chan
Maria-Elissavet Koukouli
Dimitris Balis
Water vapor plays an important role in the greenhouse effect, rendering it an atmospheric constituent that requires continuous and global monitoring by different types of remote sensing instruments. The TROPOspheric Monitoring Instrument Sentinel-5 Precursor (TROPOMI/S5P) Total Column Water Vapor (TCWV) is a new product retrieved from the visible blue spectral range (435–455 nm), using an algorithm that was originally developed for the GOME-2/MetOp sensors. For the purposes of this work, 2.5 years of continuous satellite observations at high spatial resolution are validated against co-located (in space and in time) precipitable water Level 2.0 (quality-assured) ground-based measurements from the NASA AERONET (AErosol RObotic NETwork). The network uses Cimel Sun photometers located at approximately 1300 stations globally to monitor precipitable water among other products. Based on data availability, 369 of the stations were used in this study. The two datasets, satellite- and ground-based, were co-located, and the relative differences of the comparisons were calculated and statistically analyzed. The Pearson correlation coefficient of the two products is found to be 0.91, and the mean bias of the overall relative percentage differences is of the order of −2.7 %. For the Northern Hemisphere midlatitudes (30–60∘ N), where the density of the ground-based stations is high, the mean relative bias was found to be −1.8 %, while in the tropics (±15∘) the TROPOMI TCWV product has a relative dry bias of up to −10 %. The effect of various algorithm and geophysical parameters, such as air mass factor, solar zenith angle, clouds and albedo, is also presented and discussed. It was found that the cloud properties affect the validation results, leading the TCWV to a dry bias of −20 % for low cloud heights (cloud top pressure (CTP) >800 hPa). Moreover, cloud albedo introduces a wet bias of 15 % when it is below 0.3 and a dry bias up to −25 % when the clouds are more reflective. Overall, the TROPOMI/S5P TCWV product, on a global scale and for moderate albedo and cloudiness, agrees well at % with the AERONET observations but probably within about −8 % to −13 % with respect to the “truth”.
- Article
(6686 KB) - Full-text XML
- BibTeX
- EndNote


The greenhouse effect, i.e., the infrared radiation energy trapped within the Earth–atmosphere system by atmospheric gases and clouds, is found to be highly dependent on the amount of water vapor in the atmosphere (Raval and Ramanathan, 1989). Water vapor is a natural greenhouse gas that originates from the evaporation of the Earth's water and absorbs the heat radiated by the Earth. It is transported by the atmospheric circulation, and part of the water vapor follows a cycle that consists of cloud formation via condensation, transportation and return to the Earth's surface by precipitation, as rain or snow. It has a major positive feedback, ranging from 1.1 to 2.4 W m−2 K−1, with a mean value of 1.7 W m−2 K−1; hence its effect on global warming can be double the CO2 contribution (Colman, 2003). The way that water vapor affects the climate's energy balance is described, among others, by Inamdar and Ramanathan (1998): following the warming of the Earth's surface and troposphere by the increasing levels of CO2 and other greenhouse gases, the water vapor content of the atmosphere also increases and further contributes to the greenhouse effect and hence to the atmosphere's warming. Therefore, water vapor strongly determines the atmosphere's response to surface warming. Nevertheless, under certain circumstances it is conceivable that negative feedback could result from the increase of the water vapor content and hence an increase in cloudiness that could lead to the cooling of the atmosphere. Furthermore, the stratospheric water vapor load is significantly determined by methane and its oxidation within the stratosphere (Le Texier et al., 1988; Oman et al., 2008). It is evident that the net effect that water vapor changes can have on the climate is not clear yet. Additionally, water vapor as a chemical compound has another crucial role in the atmosphere since it is the origin of the tropospheric hydroxyl radical, which is a significant oxidant in the troposphere, and affects the ozone depletion in the stratosphere over high-latitude areas (Dlugokencky et al., 2016).
Being such an important factor for the evolution of the greenhouse effect and the projection of future climate change, water vapor is an atmospheric constituent that requires continuous and global monitoring by different types of remote sensing instruments and in individual spectral bands, such as microwave, shortwave infrared and visible bands. We mention here the spaceborne Medium Resolution Imaging Spectrometer (MERIS) retrievals in the near-infrared (NIR) over land surfaces and coastal areas with the Special Sensor Microwave Imager (SSM/I) TCWV retrievals in the microwave spectra over ocean surfaces (Lindstrot et al., 2014); the TCWV retrieval in the visible blue spectral band for the Global Ozone Monitoring Experience 2 (GOME-2) instruments on board the European Organization for the Exploitation of Meteorological Satellites (EUMETSAT) MetOp satellites (Chan et al., 2020); the EOS Aura Microwave Limb Sounder (MLS) for the water vapor product (Lambert et al., 2015); the MODIS (Moderate-resolution Imaging Spectroradiometer) on board Terra and Aqua for total column water vapor (Diedrich et al., 2015); and the Japanese Space Agency Greenhouse Gases Observing SATellite (GOSAT) column-averaged dry-air mole fraction water vapor (Dupuy et al., 2016), etc. Furthermore, long-term ground-based observations also exist, such as by the Total Carbon Column Observing Network (TCCON) of ground-based, high-spectral-resolution Fourier transform spectroscopy instruments (Wunch et al., 2011); by the ground-based Global Navigation Satellite System (GNSS; Gendt et al., 2004); by the GCOS Upper Air Network (GUAN) radiosondes (Turner et al., 2003); and by the AErosol RObotic NETwork (AERONET) Sun photometers (Pérez-Ramírez et al., 2014).
The TROPOspheric Monitoring Instrument Sentinel-5 Precursor (TROPOMI/S5P) Total Column Water Vapor (TCWV) is a new global product retrieved from the blue wavelength band (435–455 nm). The retrieval algorithm was developed by the German Aerospace Center (DLR) within the framework of the European Space Agency's (ESA) Sentinel 5 Precursor Product Algorithm Laboratory (S5P-PAL), using as a basis the algorithm that was originally developed for the GOME-2 (Global Ozone Monitoring Experiment-2) TCWV products. The GOME-2 algorithm (Chan et al., 2020) was adjusted for the TROPOMI/S5P instrument in terms of spectral analysis, updated air mass factor calculations and a new surface albedo retrieval approach and is comprehensively described in Chan et al. (2022).
Borger et al. (2020) also retrieved TCWV from the same spectral band of TROPOMI/S5P measurements using the two-step differential optical absorption spectroscopy (DOAS) approach. The product was intercompared to the Special Sensor Microwave Image/Sounder (SSMIS) on board NOAA's f16 and f17, the European Centre for Medium-Range Weather Forecasts (ECMWF) reanalysis model ERA-5 TCWV data and ground-based GPS data from the SuomiNet network. It was found that over ocean and under clear-sky conditions, the retrieved TROPOMI/S5P TCWV captures the global water vapor distribution well. Over land, the retrieved TCWV was found to be underestimated by about 10 %, especially during boreal summer, which was attributed to the uncertainty of the external input data; hence some recommendations are given for the use of the product (effective cloud fraction <20 % and air mass factor (AMF) >0.1). The methods of Borger et al. (2020) and Chan et al. (2022) are similar in principal, but they differ in some important aspects, such as the following: (i) Chan et al. (2022) fit for the 435–455 nm spectral range, while Borger et al. (2020) use a slightly different wavelength range, 430–450 nm; (ii) for the AMF calculation, the algorithm of Borger et al. (2020) assumes an exponential decay profile with empirical parameterization of the water vapor scale height, while Chan et al. (2020) use an a priori profile from the statistical analysis of historical data, and they dynamically pick the most appropriate one; (iii) for the surface albedo parameter, Chan et al. (2020) use the TROPOMI/S5P GE_LER (geometry-dependent effective Lambertian equivalent reflectivity), which is derived at the same spectral fitting range (435–455 nm), while Borger et al. (2020) use the Ozone Monitoring Instrument (OMI) surface albedo retrieved at 442 nm. The comparison of the two surface albedo products is extensively discussed in Chan et al. (2022).
Schneider et al. (2020) also introduced the retrieval of a clear-sky TCWV product retrieved from a different TROPOMI/S5P wavelength band, namely from its shortwave infrared (2305–2385 nm) observations. The product retrieval was further developed by Schneider et al. (2022) to also cover cloudy scenes and was validated against co-located ground-based Fourier transform infrared (FTIR) observations by the Total Carbon Column Observing Network (TCCON). The validation results showed that under clear-sky conditions the satellite product has a 2.9 % bias with respect to TCCON, which becomes 11 % for cloudy scenes. Compared to Chan et al. (2022), the Schneider et al. (2020, 2022) algorithm employed a completely different technique, and due to the differences in the spectral range of the measurement, the final water vapor product has a different vertical sensitivity.
Another TCWV product, retrieved by the air-mass-corrected DOAS (AMC-DOAS) scheme based on TROPOMI/S5P data in the spectral area 688 to 700 nm, was presented by Küchler et al. (2022). After the retrieval, the product was post-processed to correct for surface albedo, cloud and across-track features. It was compared to ECMWF ERA-5, SSMIS data and the two scientific S5P/TROPOMI TCWV products that were mentioned above, i.e., the TCWV products described and validated by Borger et al. (2020) and Schneider et al. (2020, 2022). These comparisons showed that over sea, AMC-DOAS underestimates TCWV with respect to ERA-5 TCWV by about 2 kg m−2, while its agreement to the TROPOMI/S5P TCWV from Borger et al. (2020) is within 1 kg m−2 over both land and ocean. Finally, with respect to the TCWV from Schneider et al. (2020, 2022), averaged differences of around 1.2 kg m−2 were found.
The objective of this work is to validate the TROPOMI/S5P TCWV product retrieved from the blue band from the algorithm that was developed by DLR (Chan et al., 2022). For our validation purposes, the co-located precipitable water Level 2.0 (cloud screened, quality-assured and calibrated) ground-based measurements from the NASA AERONET (https://aeronet.gsfc.nasa.gov/, last access: 20 May 2022; Giles et al., 2019) were used. The network uses Cimel spectral Sun photometers, which are automatic, solar-powered and self-calibrating instruments that robotically scan the Sun and the sky and measure atmospheric aerosol optical properties and precipitable water (Holben et al., 1998). The AERONET database provides precipitable water observations at approximately 1300 stations globally.
In Sect. 2, the characteristics of the available satellite- and ground-based data used in this work are given. Section 3 describes the co-location methodology as well as the ground-based dataset quality control protocols. Section 4 presents the global validation results of TROPOMI/S5P TCWV and a discussion about the dependence of the satellite product on various parameters. Finally, a summary and the conclusions are given in Sect. 5.
2.1 TROPOMI/S5P Total Column Water Vapor
The TROPOspheric Monitoring Instrument (TROPOMI; http://www.tropomi.eu/, last access: 3 November 2022) on board the Copernicus Sentinel-5 Precursor (S5P) was launched in October 2017, monitoring the Earth's atmosphere using four spectrometers with spectral bands in the ultraviolet (UV), the visible (UVIS), the near-infrared (NIR) and the shortwave infrared (SWIR) wavelengths (Veefkind et al., 2012). The observations are performed in a Sun-synchronous low-Earth orbit with a local equatorial crossing time of 13:30 LT and daily global coverage with 14 orbits per day. Its spatial resolution was 3.5 km (across-track) by 7.0 km (along-track) up to 6 August 2019, when it was modified to 3.5 km (across-track) by 5.5 km (along-track). Its swath width is 2600 km, consisting of 450 ground pixels across-track, which provides daily global coverage. The TROPOMI instrument and its pre-launch calibration techniques are thoroughly described by Kleipool et al. (2018), while the in-flight calibration is analyzed in Ludewig et al. (2020).
The TROPOMI/S5P Total Column Water Vapor (TCWV) is a new product retrieved from the sensor's observations in the visible blue band (435–455nm). The retrieval algorithm, thoroughly described in Chan et al. (2022), is based on the GOME-2 TCWV algorithm (Chan et al., 2020), which utilizes the differential optical absorption spectroscopy (DOAS) technique (Platt and Stutz, 2008). In short, a two-step approach is followed: first retrieving slant columns through the spectral analysis of the TROPOMI measurements in the blue band and then converting the slant columns to vertical columns using an iterative air mass factor (AMF) calculation. Compared to the GOME-2 algorithm, some improvements were applied concerning the spectral retrieval, the air mass factor calculations and the surface albedo input parameter, for which the GE_LER (geometry-dependent effective Lambertian equivalent reflectivity) that is produced by TROPOMI (Loyola et al., 2020) is used. Finally, the cloud information (e.g., cloud fraction, cloud top pressure and cloud albedo) is taken from the TROPOMI operational cloud product (Loyola et al., 2018). According to Chan et al. (2022), TROPOMI/S5P reports lower TCWV values by 1.24 kg m−2 over land compared to ERA-5 TCWV reanalysis data and by 1.74 kg m−2 with respect to GOME-2 observations. Additionally, they report that the uncertainty of TCWV observations over the tropics is 10 %–19 % under clear skies (effective cloud fraction <0.5). The TCWV products from TROPOMI/S5P and GOME-2 were also validated against GNSS data from 235 European stations, by Vaquero-Martinez et al. (2022). They found that the correlation coefficient of the scatter plot comparing TROPOMI/S5P to GNSS TCWV co-located data is 0.93 and showed that TROPOMI underestimates TCWV by about −3 % for water vapor content above 10 kg m−2.
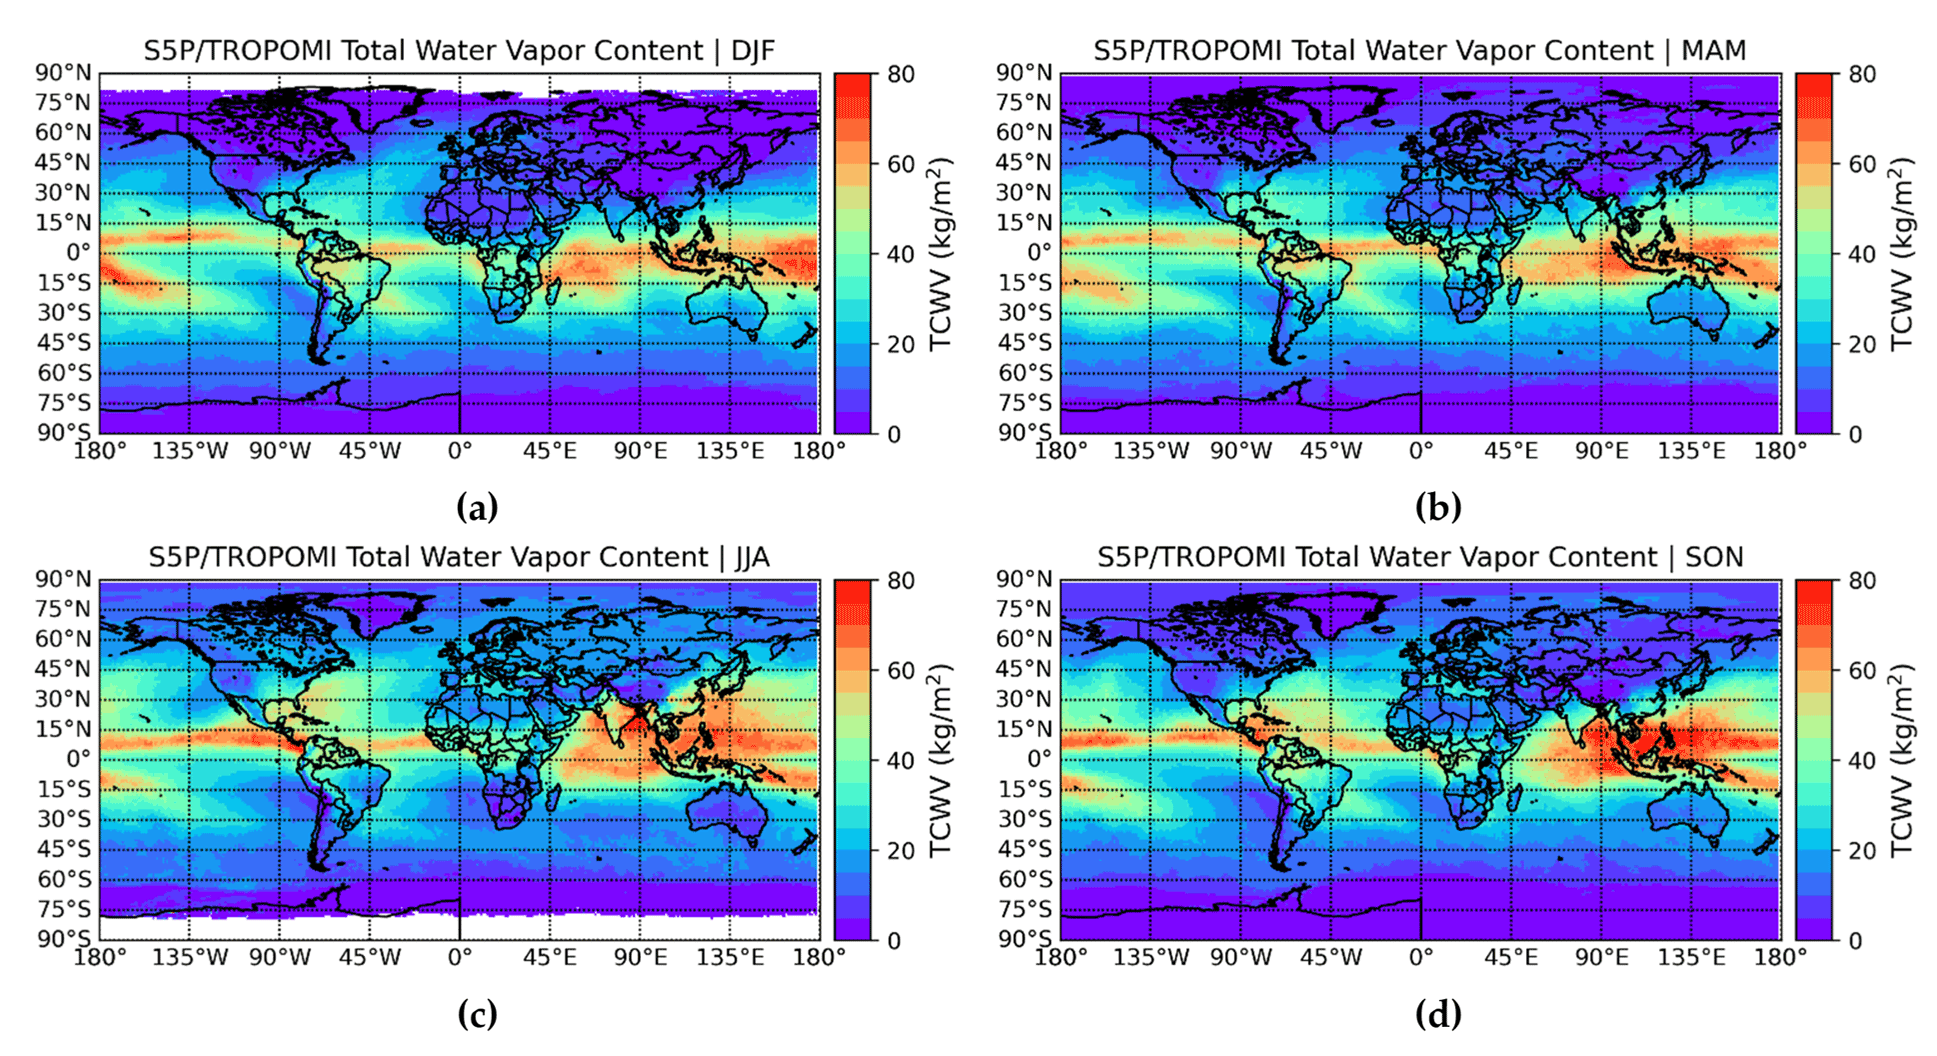
Figure 1Seasonal global maps of the TROPOMI/S5P TCWV product (in kg m−2). (a) December–February, (b) March–May, (c) June–August and (d) September–November.
For this work, 2.5 years (May 2018 to December 2020) of continuous TCWV satellite observations were made available. The dataset was filtered according to Chan et al. (2022), following these criteria: (a) solar zenith angle <85∘, (b) effective cloud fraction <0.5, (c) root mean square fit residual <0.002 and (d) air mass factor >0.1. Figure 1 shows four seasonal global maps of the TROPOMI/S5P TCWV: panel (a) depicts December to February, panel (b) March to May, panel (c) June to August and panel (d) September to November. Throughout the year, the tropics hold the higher TCWV content, up to 80 kg m−2, occurring mainly during summer and autumn. Over land in the Northern Hemisphere, where most of the ground-based stations are located, the TCWV is below 50 kg m−2, decreasing to less than 5–10 kg m−2 closer to the poles.
2.2 Ground-based observations
The database used as ground truth for the S5P TCWV validation consists of archived Cimel precipitable water observations that were downloaded from the AERONET website (https://aeronet.gsfc.nasa.gov/, last access: 20 May 2022). The network uses Cimel Sun photometers located at about 1300 stations globally to monitor precipitable water, among other products, every 15 min. The Cimel instruments perform direct Sun measurements when the optical path between the instrument and the Sun is cloud-free. The AERONET processing algorithm was presented by Smirnov et al. (2004). Currently, Version 3 (Giles et al., 2019) of the algorithm is used for the retrieval, and it is stated within the archived data files that “the data are automatically cloud cleared and quality assured with pre-field and post-field calibration applied”. AERONET data are provided in three quality levels, namely 1.0, 1.5 and 2.0 (https://aeronet.gsfc.nasa.gov/new_web/aot_levels_versions.html, last access: 20 May 2022):
-
Level 1.0 data use the pre-field deployment Sun calibration.
-
Level 1.5 data use Level 1.0 data and apply cloud-screening and automatic quality control procedures.
-
Data are raised to Level 2.0 after applying the final post-field deployment Sun calibration to Level 1.5 data.
Here, Level 2 precipitable water observations were used to achieve the best possible quality for the ground truth.
The AERONET dataset covers about 25–30 years of measurements, depending on the station, and it was extensively used for the MODIS water vapor product validation (Bennouna et al., 2013; Diedrich et al., 2015; Bright et al., 2018; Shi et al., 2018; Martins et al., 2019). Schneider et al. (2010) found that Cimel instruments have a clear-sky dry bias, which is larger in winter (25.5 %), decreases during spring (11.5 %) and becomes a minor wet bias (2 %) in the summer months. The seasonality in the dry bias of the Cimel observations is caused by their restriction to clear-sky measurements. The AERONET precipitable water vapor product was evaluated by Pérez-Ramírez et al. (2014), where it was compared to water vapor retrievals from radiosonde observations and other ground-based retrieval techniques, such as microwave radiometry (MWR) and GPS for a few sites. It was found that the AERONET precipitable water has a dry bias of approximately 5 %–6 % in the retrievals and a total estimated uncertainty of 12 %–15 %. Weaver et al. (2017) also intercompared water vapor measurements performed by different types of instruments, namely radiosondes, Sun photometers, FTIR spectrometers and a microwave radiometer, at the Eureka (Nunavut) site. They showed that the Sun photometers that operate at two nearby sites report lower water vapor observations compared to co-located FTIR or atmospheric emitted radiance interferometer (AERI) instruments, by 15 % or 3.3 %, respectively. An approximate mean bias for the AERONET TCWV product that results from all these studies, that are based on various stations, temporal coverages and reference measurements, is −5 % to −10 %.
Campanelli et al. (2018) validated precipitable water vapor content from ESR/SKYNET radiometers against GNSS/GPS and AERONET over three different sites in Europe and found that the agreement was within the reported uncertainties. The total uncertainty of Sun photometer retrievals was estimated to be less than 10 % (Smirnov et al., 2004; Alexandrov et al., 2009; Pérez-Ramírez et al., 2014). According to Martins et al. (2019), this percentage was expected to be improved with the implementation of version 3 of the retrieval algorithm (Giles et al., 2019).
The extended network of automatic and quality-controlled observations provides very dense (spatially and temporally) coverage of North and South America, Europe and Southeast Asia, as well as western Africa. This fact, in addition to the use of a single standardized retrieval algorithm and the consistency in instruments' calibration, shows a strong advantage in favor of using the AERONET for this validation work.
The data files retrieved from AERONET are available in ASCII format in daily, monthly or instantaneous (i.e., measurements performed every 15 min) temporal analysis. Here, the instantaneous precipitable water observations were used, for the time period May 2018 to December 2020, depending on the availability of data for each individual station. Out of the 1304 stations, only 596 reported Level 2 precipitable water measurements after 2017. An in-house quality control based on the visual and statistical analysis of the available datasets per station ensured that only stations with data that cover fully the time period of our study, or cover at least 20 out of the 32 months of the TROPOMI/S5P dataset, are contributing to the ground-based reference dataset. As a result, the final number of stations to be used for the validation of TROPOMI/S5P TCWV was reduced to 369. Figure 2 shows their geographical distribution.
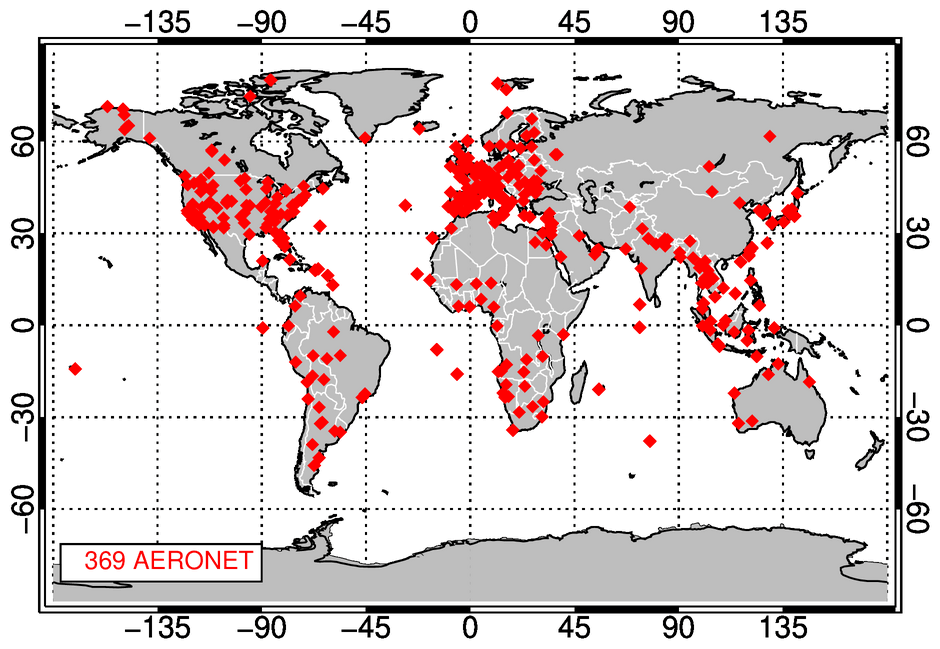
Figure 2Spatial distribution of the 369 AERONET ground-based stations used for the comparisons to the TROPOMI/S5P TCWV product.
As a first step in the analysis, a dataset of overpass files was created whereupon all TROPOMI/S5P pixels within a 10 km radius from the AERONET stations were extracted from the original orbital files. The use of the 10 km radius was based on the high spatial resolution of TROPOMI/S5P observations (3.5×7 km2 until August 2019 and 3.5×5.5 km2 thereafter). Moreover, other studies, such as Borger et al. (2020) and Xie et al. (2021), used a similar distance for their validation work with respect to ground-based measurements. It has to be noted that our methodology uses only the satellite- and ground-based observation co-locations that are closest in space within the 10 km radius for the statistical analysis. In practice, this led to a maximum spatial difference between each ground-based station and the respective satellite pixel of up to 5 km.
The next step was to apply the co-location methodology according to which pairs of co-located satellite-based and instantaneous ground-based measurements were formed, and their relative percentage difference was calculated as per 100× (TROPOMI-AERONET)AERONET (%). TROPOMI/S5P passes over most stations once a day, but the ground-based information is instantaneous, meaning that all its observations during each day are available. From the total of available pairs resulting for 1 d (within a maximum of 10 km in radius), only the one providing the minimum temporal difference, if this temporal difference was up to ±30 min, was kept. The criterion of up to ±30 min temporal difference between the satellite- and ground-based observation time is quite strict and is a much smaller time window than what other studies have used (for example, Chan et al., 2020, and Borger et al., 2020, allow up to 2 h, while Xie et al., 2021, also use a 30 min temporal difference). Its adoption was based on the fact that the AERONET dataset provides clear-sky measurements only, resulting in rather invariable temporally observation fields as far as water vapor is concerned. Still, the number of co-locations resulting from the selection of our criteria is considered adequate to provide solid validation conclusions.
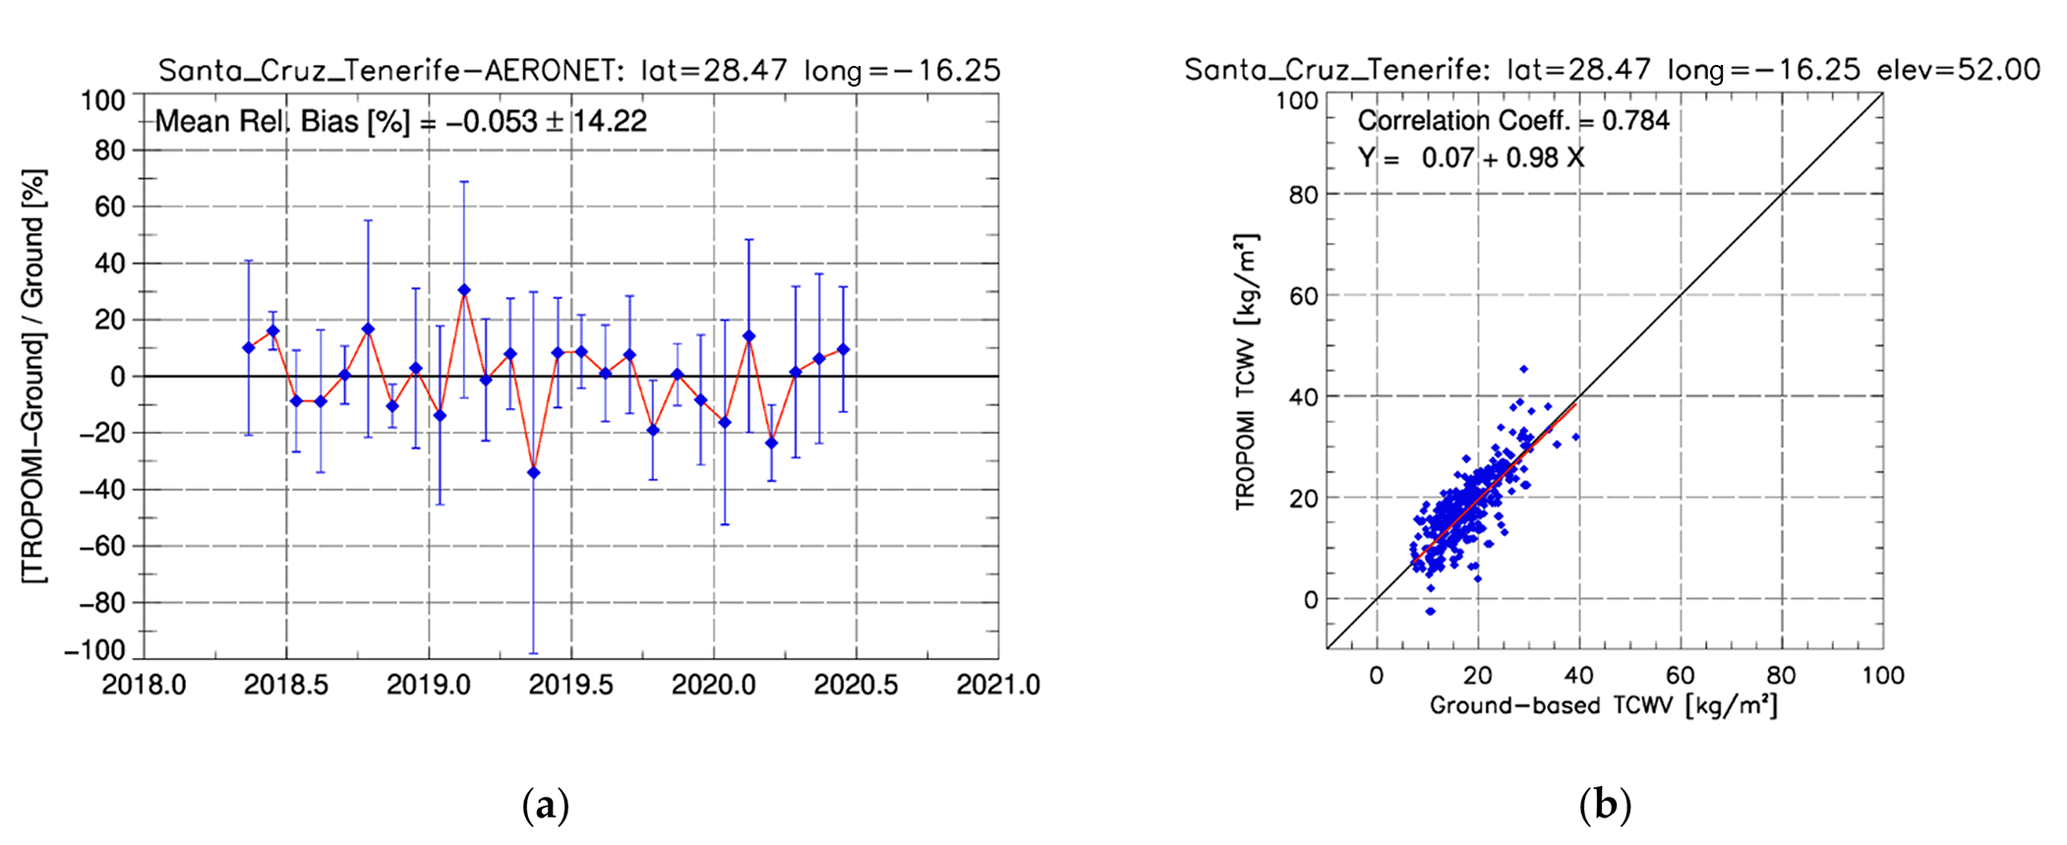
Figure 3The monthly mean relative differences between satellite- and ground-based observations (a) and the respective scatter plot (b) for an indicative Northern Hemisphere station, Santa Cruz, Tenerife. The error bars in panel (a) show the 1σ standard deviations of the means.
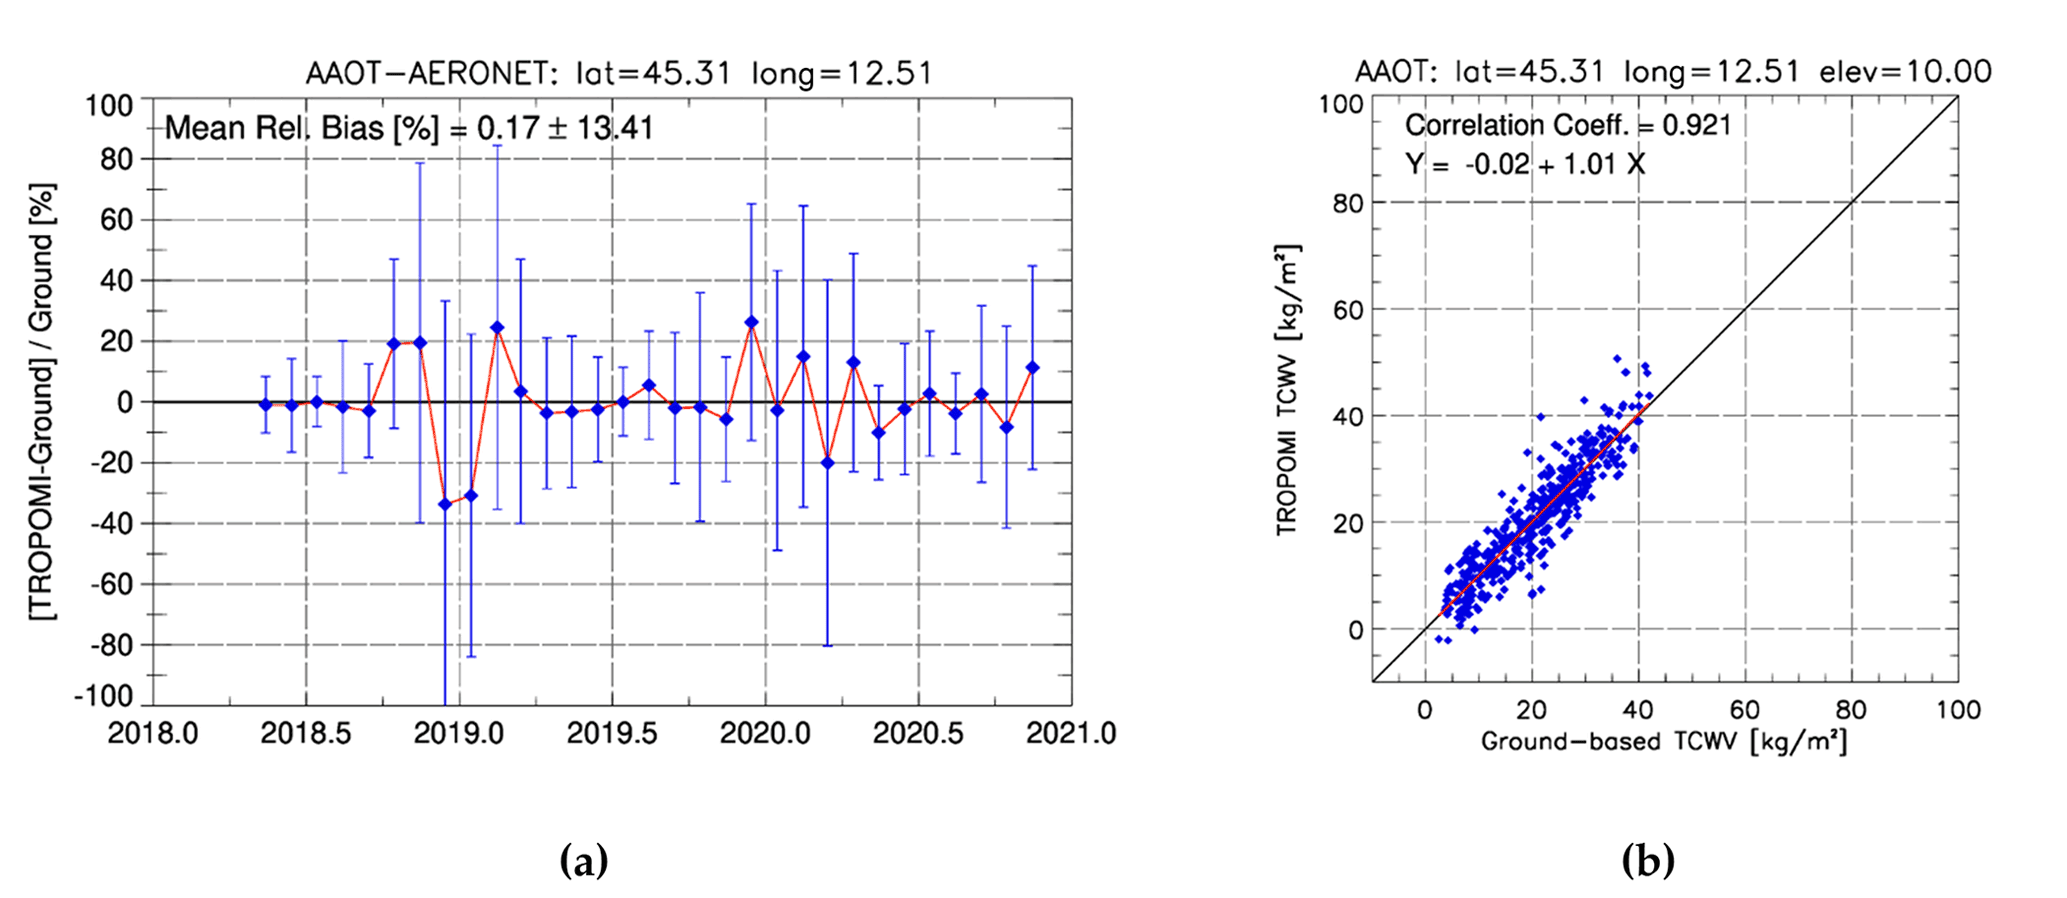
Figure 4The same as Fig. 3 but for the Northern Hemisphere tower station AAOT, located in the northern Adriatic Sea.
After co-locating the two datasets, a per-station analysis was performed, so as to confirm the choice of the stations to be used for this work depending on the quality and quantity of their data. As an example, the validation results for two individual stations located at different latitudes are shown in Figs. 3 and 4. Panel (a) in both figures shows the monthly mean relative differences between satellite- and ground-based observations for the two indicative stations, namely Santa Cruz, Tenerife (Fig. 3), and the Acqua Alta Oceanographic Tower (AAOT), northern Adriatic Sea (Fig. 4). The error bars represent the 1σ standard deviation of the means. Panel (b) in both figures shows the respective scatter plots per station. These two are nice examples of continuous ground-based measurements. It can already be seen from these figures that the Pearson correlation coefficient, R, between ground-based and satellite TCWV observations is above 0.78. The slopes of the linear fits are 0.98 and 1.01 respectively, while the offsets are +0.07 (Fig. 3) and −0.02 kg m−2 (Fig. 4), respectively. The monthly mean relative biases per station (panels a) for the example stations shown here are within ±0.2 %, demonstrating the good agreement between satellite- and ground-based observations, as well as a good temporal stability of both sources of measurement for the available dataset spanning 2.5 years. The variability of the biases, depicted as error bars, may be due to both the ground-based and spaceborne instrument observational accuracy, as well as algorithm- and/or meteorology-related effects.
The distribution of the approximately 70 000 co-locations in space and in time is shown in Fig. 5. The Level 2 data for most stations are uploaded with some delay after observation to the AERONET database, which is the reason for the limited number of available co-locations for the most recent months of the validation period. This is even more pronounced in the Southern Hemisphere, where the number of available stations is smaller, and they extend down to 50∘ S. There was only one station below that latitude, namely the South Pole Observatory (latitude 90∘ S), with available measurements that covered only a very short time period of 2 months during 2018, so it was decided not to be used due to lack of representativeness. Therefore, concerning the Southern Hemisphere, we can only draw conclusions for the latitude belt from the Equator down to 50∘ S. The northern high-latitude co-locations (above 75∘ N) are available for the summer months of 2018 and 2019, and there are only a few observations for the summer months of 2020.
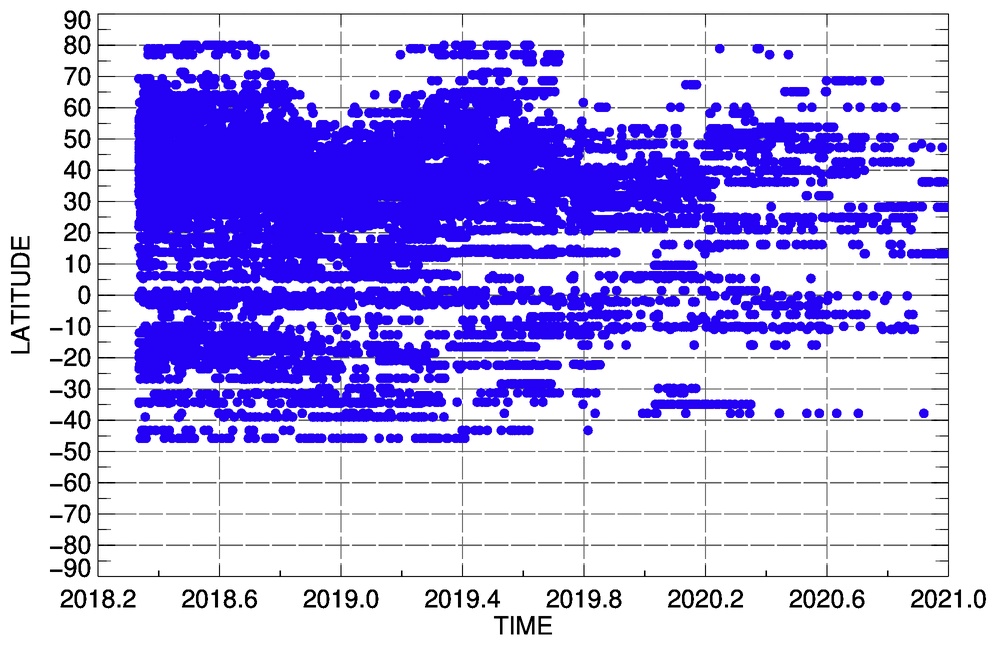
Figure 5Spatial and temporal representation of the co-location data used for the validation with ground-based measurements for the time period of the TROPOMI/S5P TCWV data availability (May 2018 to December 2020).
The monthly means that are shown in the respective time series plots in this work are calculated by averaging the total number of available instantaneous co-locations per month. The same stands for every averaged parameter plotted here: the mean values are always computed by averaging all individual co-locations that fall within the bin in question. Henceforward, the error bars in the plots (where they are shown) stand for the standard error of the mean with a confidence interval (CI) of 99.7 % for each mean value. As expected, since there is a plethora of co-locations, the standard error frequently results in an extremely small value, showing the good accuracy of the averaging.
4.1 Global comparisons between TROPOMI/S5P TCWV and AERONET ground-based observations
In this section, the archived and quality-controlled AERONET water vapor observations, for the period May 2018–December 2020, are used for the validation of TROPOMI/S5P TCWV on a global scale. Figure 6 shows the global statistics of the approximately 70 000 co-located data. The histogram to the left (panel a) shows that the overall mean relative percentage difference between satellite- and ground-based measurements is −2.7 %, the 1σ standard deviation is 47.7 % and the standard error is 0.5 %. The distribution of the relative differences around the mean value is a normal Gaussian distribution. Panel (b) shows the density scatter plot of the co-located datasets. The majority of co-locations have a TCWV content that spans from 0 to 20 kg m−2. The dotted lines show two different approaches for the statistical analysis: the red line is the ordinary least-squares (OLS) method (also used in Figs. 3 and 4), and the resulting equation and Pearson correlation coefficient R values are shown in the bottom right of the figure; the cyan line represents the total least-squares (TLS) method and the respective equation, and R values are shown in the upper left corner of the plot. Both methods result in a Pearson correlation coefficient of slightly above 0.9, which evidences the good overall agreement between the two datasets. The slope of the linear fit is 0.9 (for the OLS; 1.0 for the TLS), and the overall offset between satellite- and ground-based observations is +0.9 kg m−2 (for the OLS; −0.6 kg m−2 for the TLS).
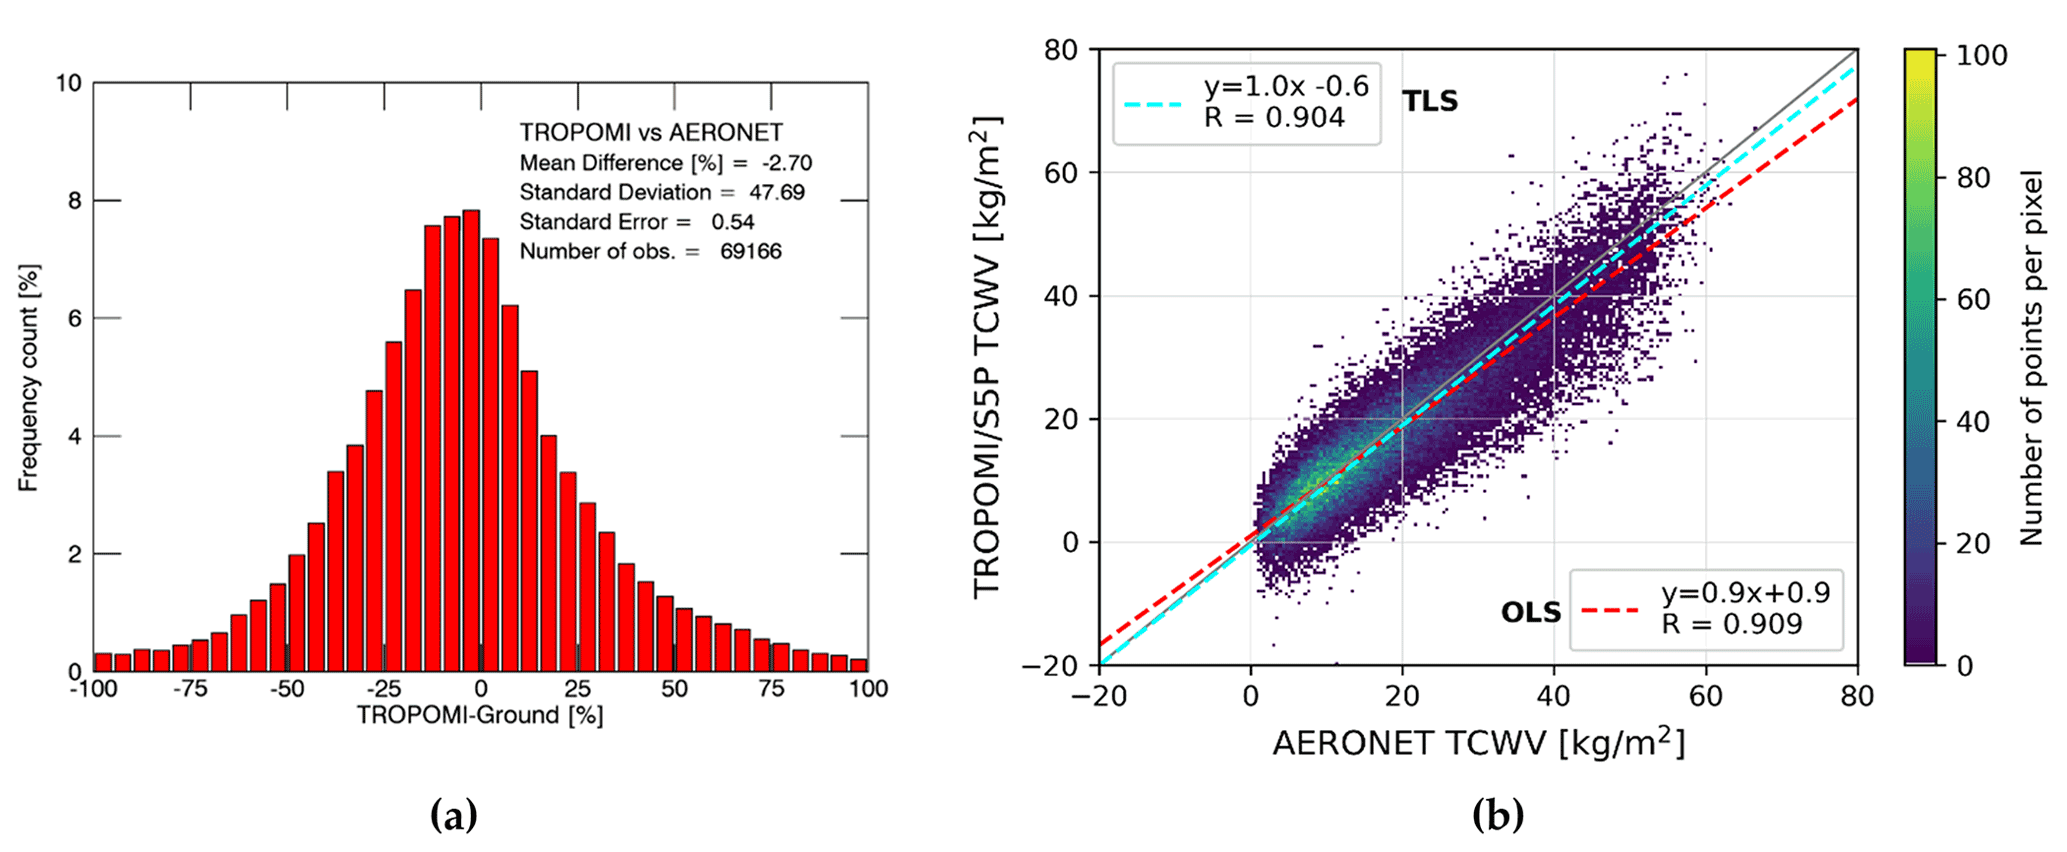
Figure 6(a) The distribution of the satellite- and ground-based co-location relative differences. (b) The density scatter plot showing the correlation between TROPOMI/S5P TCWV and the AERONET observations. The statistical analysis was performed using the ordinary least-squares (OLS – dotted red line) and the total least-squares (TLS – dotted cyan line) methods.
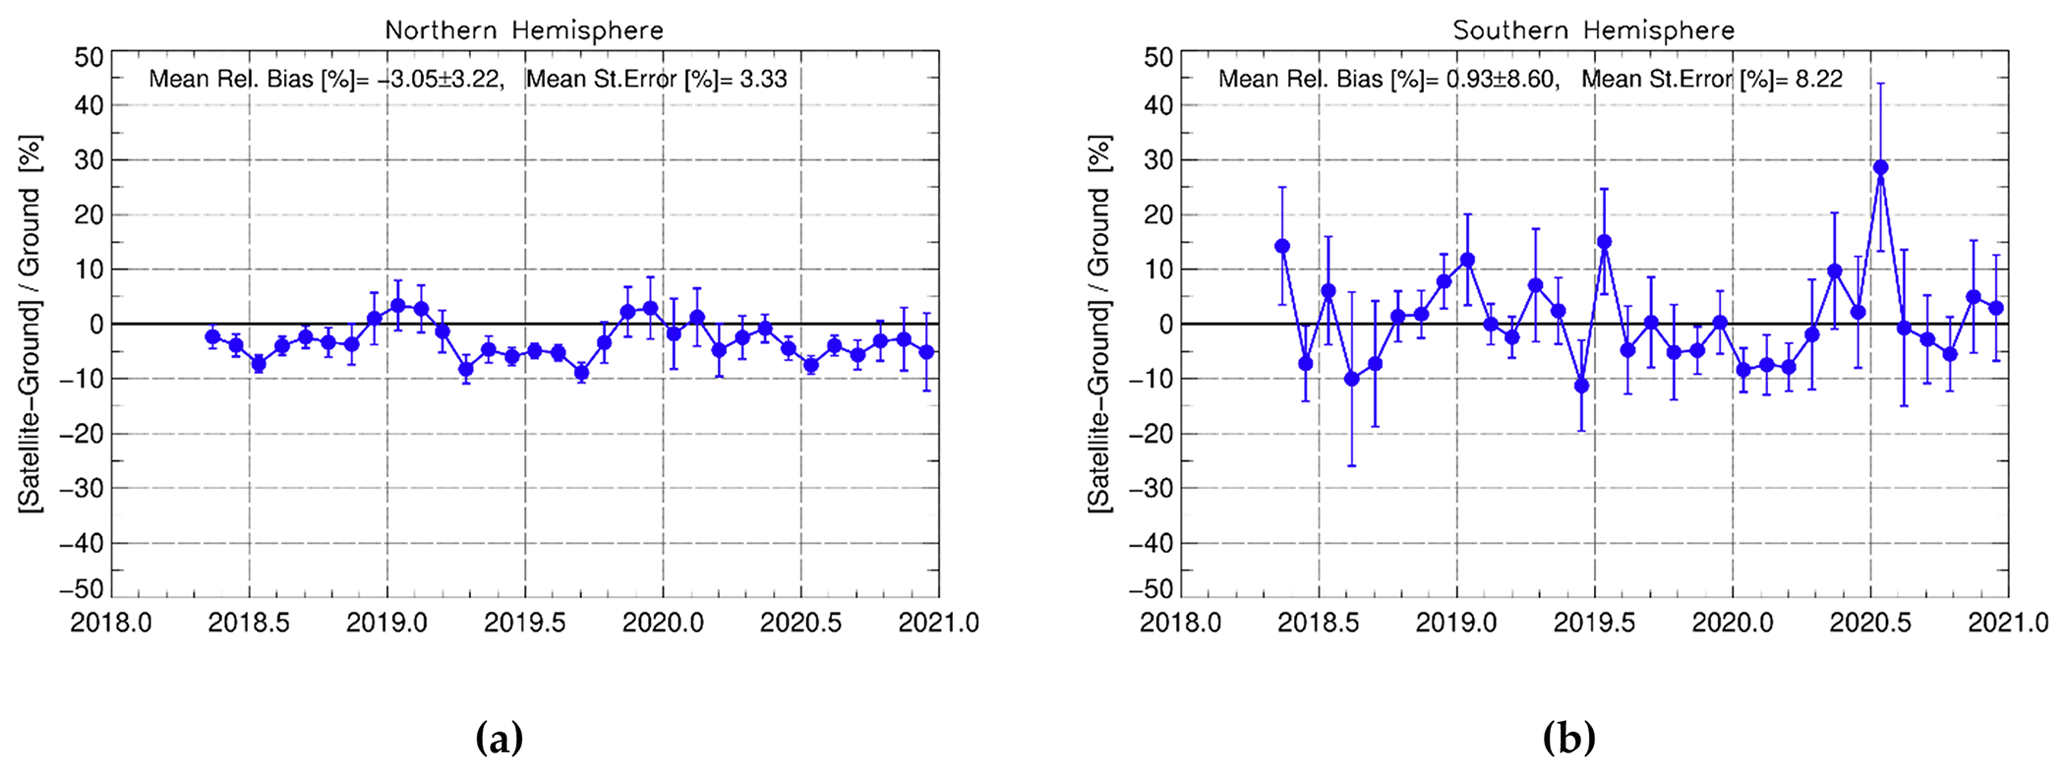
Figure 7The time series of the monthly mean relative differences between TROPOMI/S5P TCWV and ground-based AERONET measurements, shown for the Northern (a) and the Southern Hemisphere (b). The error bars stand for the standard error of the mean with a confidence interval (CI) of 99.7 %.
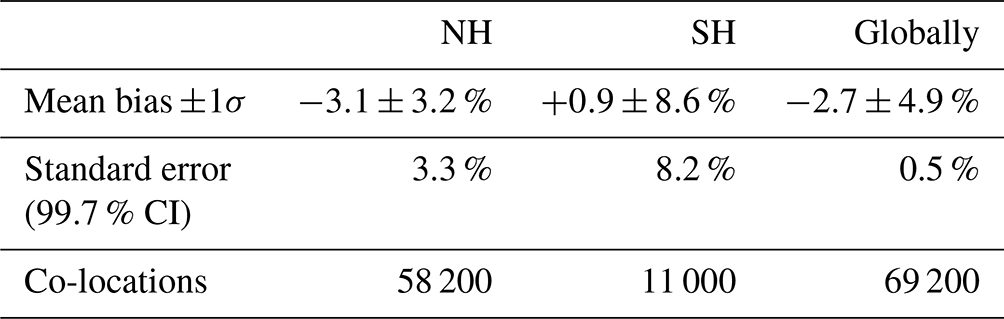
To study the temporal evolution of the comparisons, the co-located data are divided into two time series, depending on the station's latitude. Figure 7 shows the time series of the monthly mean relative differences between satellite-based and instantaneous co-located (in space and in time) ground-based measurements: panel (a) shows the Northern Hemisphere (NH) time series, while in panel (b) the respective comparisons for the Southern Hemisphere (SH) are depicted, with their standard errors shown as error bars at the 99.7 % CI. The illustration of the time series in the form of monthly means was adopted because it allows us to easily detect any seasonal variability in the comparisons. The NH curve is continuous with no abrupt changes, showing the temporal stability of both sources of measurement, satellite- and ground-based, for the 2.5 years of available data. The SH time series has a higher variability due to the lower number of co-locations (see Table 1). The number of available AERONET data for this part of the Earth during 2020 is further reduced, causing the increase of the variability and the standard error of the means. The mean relative bias of the percentage differences for the NH, where the stations density is high, was found to be %, and the respective mean standard error of the available monthly means is 3.3 %. In the SH, the mean bias is slightly positive and more variable, %, representing the latitude belt 0 to 50∘ S. The reduced number of co-locations results in a higher overall mean standard error of 8.2 %. Table 1 summarizes the global and hemispheric statistics of the monthly mean analysis.
Table 1The monthly mean global and hemispheric statistics of the co-located satellite- and ground-based observations.
The per-station statistical analysis that was performed is shown in the form of a world map in Appendix A, Fig. A1, upper panel, where the mean relative bias in percent for each station is represented by a dot colored depending on the magnitude of its bias. The bottom panels show Europe and North America, respectively, in greater detail. It is evident that the vast majority of the stations have a negative mean relative bias that reaches −30 % in very few cases, such as L'Aquila, Italy, and Pinehurst, Idaho, USA. On the other hand, there is also a limited number of stations with very high positive biases, up to +30 %, like Andenes, Norway, and Etna, Italy. Nevertheless, no particular pattern is seen in the midlatitude and high-latitude stations of either hemisphere. Within the tropics, the mean relative bias per station is mainly negative, ranging between −5 % and −25 %. Further statistical analysis on the latitudinal dependence of the mean relative bias between the TROPOMI/S5P TCWV and the respective ground-based data is provided in the following paragraphs.

Figure 8The seasonal and latitudinal variability of (a) the mean relative differences between satellite- and ground-based TCWV observations and (b) the respective standard deviations (in %).
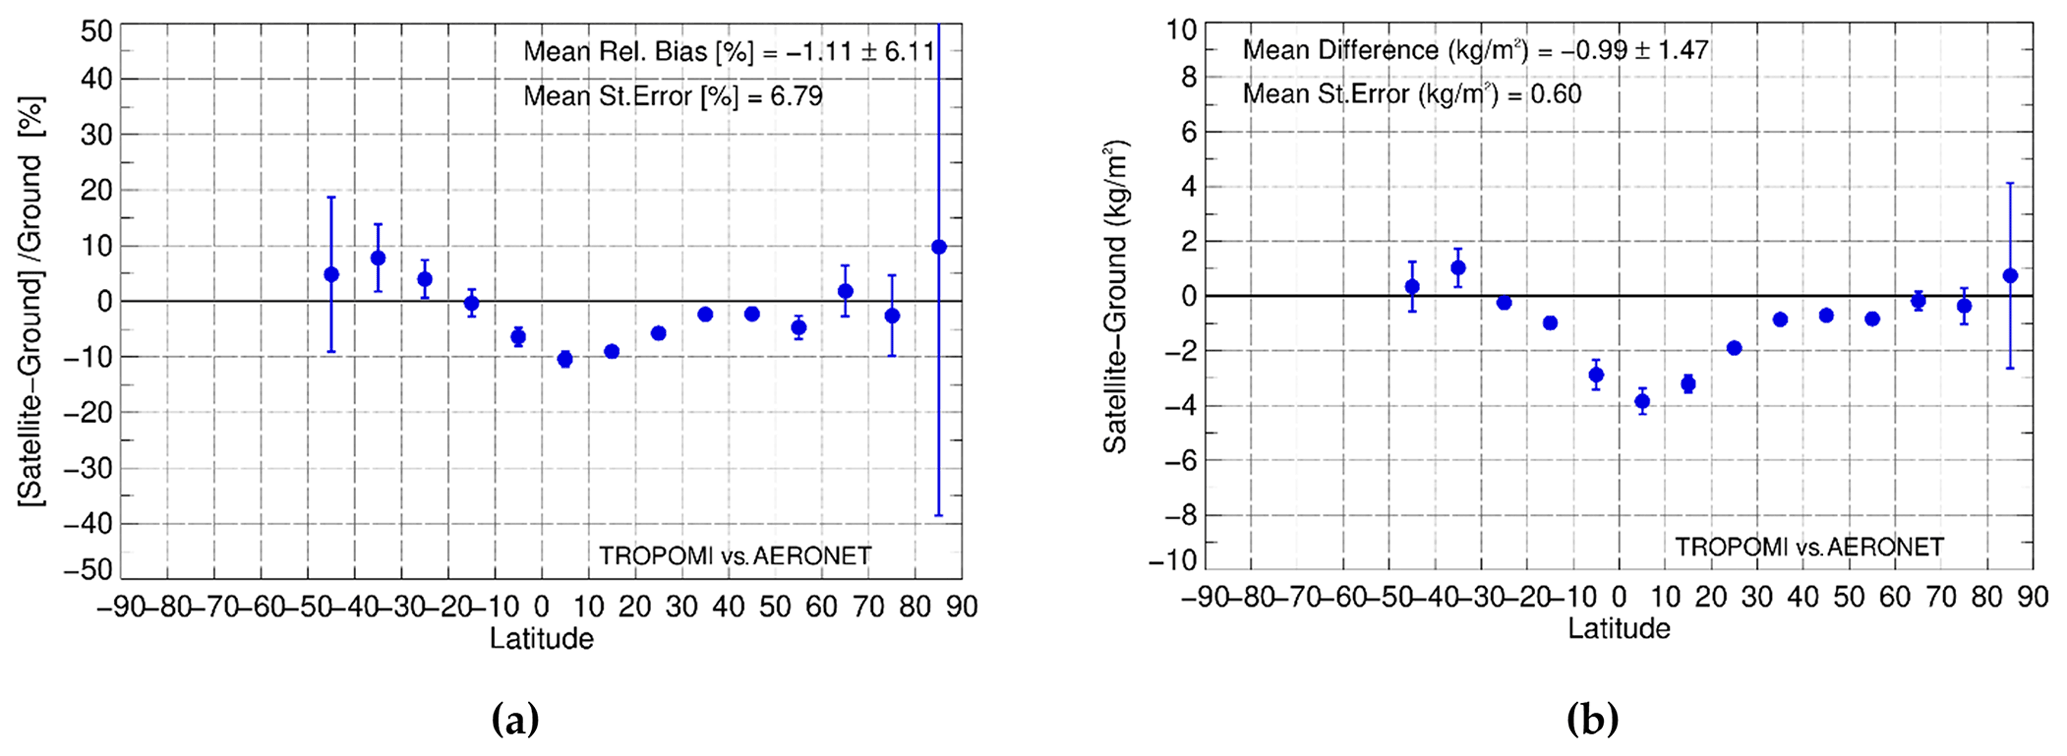
Figure 9(a) The relative percentage differences between co-located TROPOMI/S5P TCWV measurements and ground-based observations from AERONET instruments plotted versus latitude. (b) As in panel (a) but for the differences between satellite- and ground-based observations (in kg m−2). In both panels, the error bars show the standard error of the mean with a confidence interval (CI) of 99.7 %.
The contour plots in Fig. 8 show the mean relative percentage differences (panel a) and the respective standard deviations (panel b) of the satellite- and ground-based co-locations, with respect to latitude and season. Panel (a) shows that for the midlatitude winter months of each hemisphere, when the water vapor content of the atmosphere is below ∼20 kg m−2 (see Fig. 1a), the mean relative bias for the respective stations is positive, between 0 and +15 or +20 % (January). During the summer months, when the highest values of water vapor occur for the midlatitudes, up to 40 kg m−2 (see Fig. 1c), the mean relative bias is within ±5 %. In the tropics, where the TCWV content is higher throughout the year (40–80 kg m−2), the mean relative bias is constantly negative, ranging between −5 % and −20 %. Panel (b) depicts the strong seasonality of the comparisons' standard deviations, i.e., of their variability, which is high during the midlatitudes winter months of both hemispheres (up to ∼90 %), and lower (10 %–30 %) during summer, when the number of ground-based AERONET measurements (i.e., the number of co-locations) and their accuracy is much higher (Fragkos et al., 2019). Additionally, as shown in Fig. 1, for latitudes higher than the tropics of both hemispheres, the water vapor content is lower and has a stronger temporal variability, explaining the higher standard deviations of the relative differences. It is also interesting to see that the variability of the comparisons for the tropics (Fig. 8; 15∘ N–15∘ S) is much lower (up to 20 %) compared to the other latitude belts, showing that the negative mean relative bias of our comparisons is temporally invariable in this part of the globe, where the water vapor content is higher than ∼40 kg m−2.
To further investigate the latitudinal patterns of our comparisons, the mean relative percentage differences per station with available ground-based data are averaged in 10∘ latitude belts and are shown versus latitude in Fig. 9a. The same is also shown in panel (b), but the averaged parameter per latitude bin is the difference between satellite- and ground-based observations (in kg m−2). The overall mean relative percentage bias for the latitudinal dependency is % and has a mean standard error of 6.8 %. The agreement between satellite- and ground-based observations remains within ±10 % for individual belts of the NH and the belt northwards 50∘ of the SH. The latitude bins −30∘ S to 30∘ N form a U-shaped curve, showing that the satellite instrument reports lower TCWV up to ∼10 % with respect to ground-based observations close to the Equator and reaching ∼0 % at ±30∘. This result, which corresponds to a difference between satellite- and ground-based observations up to −4 kg m−2 (panel b), is in agreement with Chan et al. (2022), where the dry bias is attributed to albedo effects in the visible band over vegetation and to the presence of aerosol and/or clouds in the measurement field. For the NH high-latitude stations, above 70∘ N, the discrepancy becomes positive up to 10 % and has a very large standard error due to the limited number of co-locations (panel a). In terms of difference (panel b), this percentage accounts for a small overestimation of less than 1 kg m−2 by TROPOMI/S5P occurring close to the poles where the amount of water vapor is less than 20 kg m−2 (see Fig. 1). Considering that the uncertainty of both types of measurement is ∼10 %, the comparison of the satellite- and ground-based observations is regarded as satisfactory. The performance of the TROPOMI/S5P TCWV retrieval algorithm with respect to the surface albedo parameter which significantly changes with latitude is currently adequate but could be further improved in the future, as is also shown further on in this work (Fig. 12b).
Table 2The zonal statistics of the co-located satellite- and ground-based observations.
a Satellite–ground. b 99.7 % CI.
The statistics per latitude belt in terms of mean difference (satellite − ground, in kg m−2), mean relative bias ± standard deviation and mean standard error of the comparisons (in %) are shown in Table 2 for 15∘ latitude belts up to ±30∘ N and S. The belts 0 to 15∘ N and 0 to 15∘ S represent the tropics. Above 30∘, the binning is doubled because due to the low water vapor content and its low variability, the differences in the statistics between belts 60–75 and 75–90∘ N would be negligible.
It is worth noting that the mean relative bias of each latitude bin and the respective mean standard deviation, and thus the variability (not shown in Fig. 9), should not be attributed to the satellite product only, since it is well known that some ground-based stations may overestimate or underestimate their observational constituent systematically due to the meteorological conditions occurring at the station site. Moreover, when such a station does not provide a continuous record of observations, there is a high possibility that it will introduce an artificial and nonrepresentative bias to the validation. Most of these stations that did not fully cover the time period of our study were filtered out of the ground-truth database used in this work. Nevertheless, for some latitude bins, like 40 to 50∘ S, where the station density or the temporal coverage is low, the respective stations were considered with the remark that the statistics resulting from their co-locations should be interpreted with caution.
4.2 Discussion on the dependence of TROPOMI/S5P TCWV on various geophysical parameters
In this section, the dependence of the validation results on different variables is investigated. These quantities can be parameters that are used as inputs for the TCWV retrieval algorithm, such as cloud and surface information, or algorithm-related parameters, like the air mass factor. To inspect any possible dependences, all available co-locations are averaged in bins regarding the parameter in question. Note that, in the following figures, when the number of co-locations that are averaged for each bin is less than 3 % of the total, the respective data point is shown in grey (instead of blue). This is a way to distinguish the data points in terms of relative importance.
4.2.1 Viewing geometry dependency
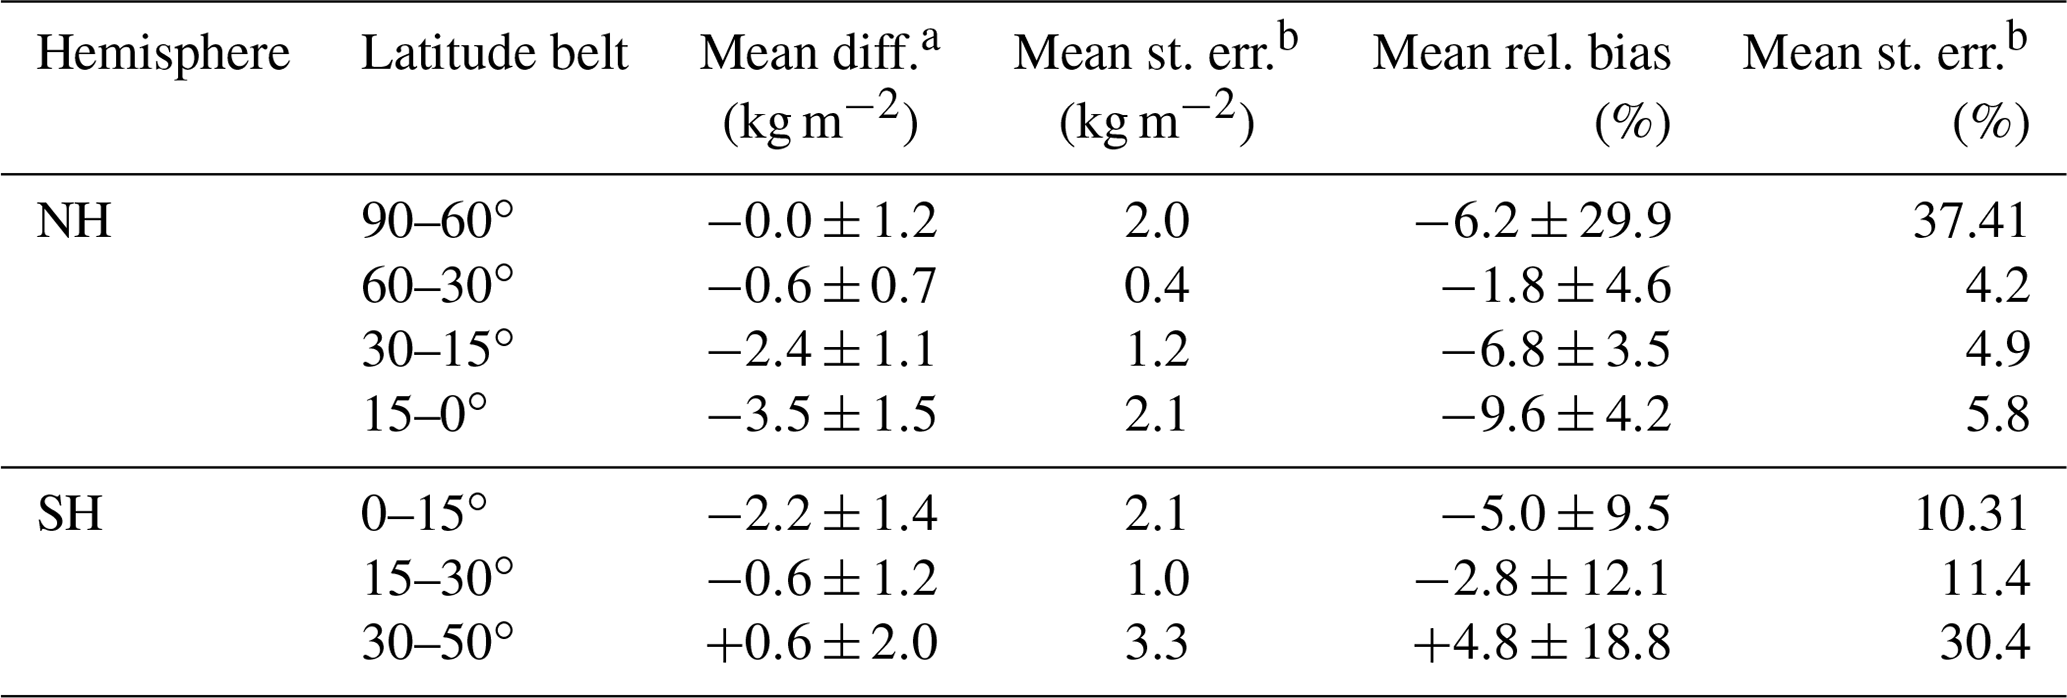
Figure 10 shows the dependency of the relative differences on solar zenith angle (SZA; panel a) as provided by TROPOMI/S5P and the satellite pixel number (panel b). Regarding the dependency on SZA (panel a), TROPOMI/S5P reports lower TCWV than the AERONET observations by up to −7 % for SZAs below 45∘, where more than half of the co-locations are contained. Their difference is eliminated for SZAs 45–70∘ and slightly increases with SZA, reaching +9 % above 70∘ for a limited number of co-locations. Overall, the dependence of the relative differences on SZA is ∼16 % peak to peak, or ∼7 % if only SZAs below 70∘ are considered. As expected, the standard error of the means increases for larger SZAs because of the increase in the uncertainty of the measurements and the lower number of co-locations and of course due to the strong effect of the winter midlatitude co-locations.
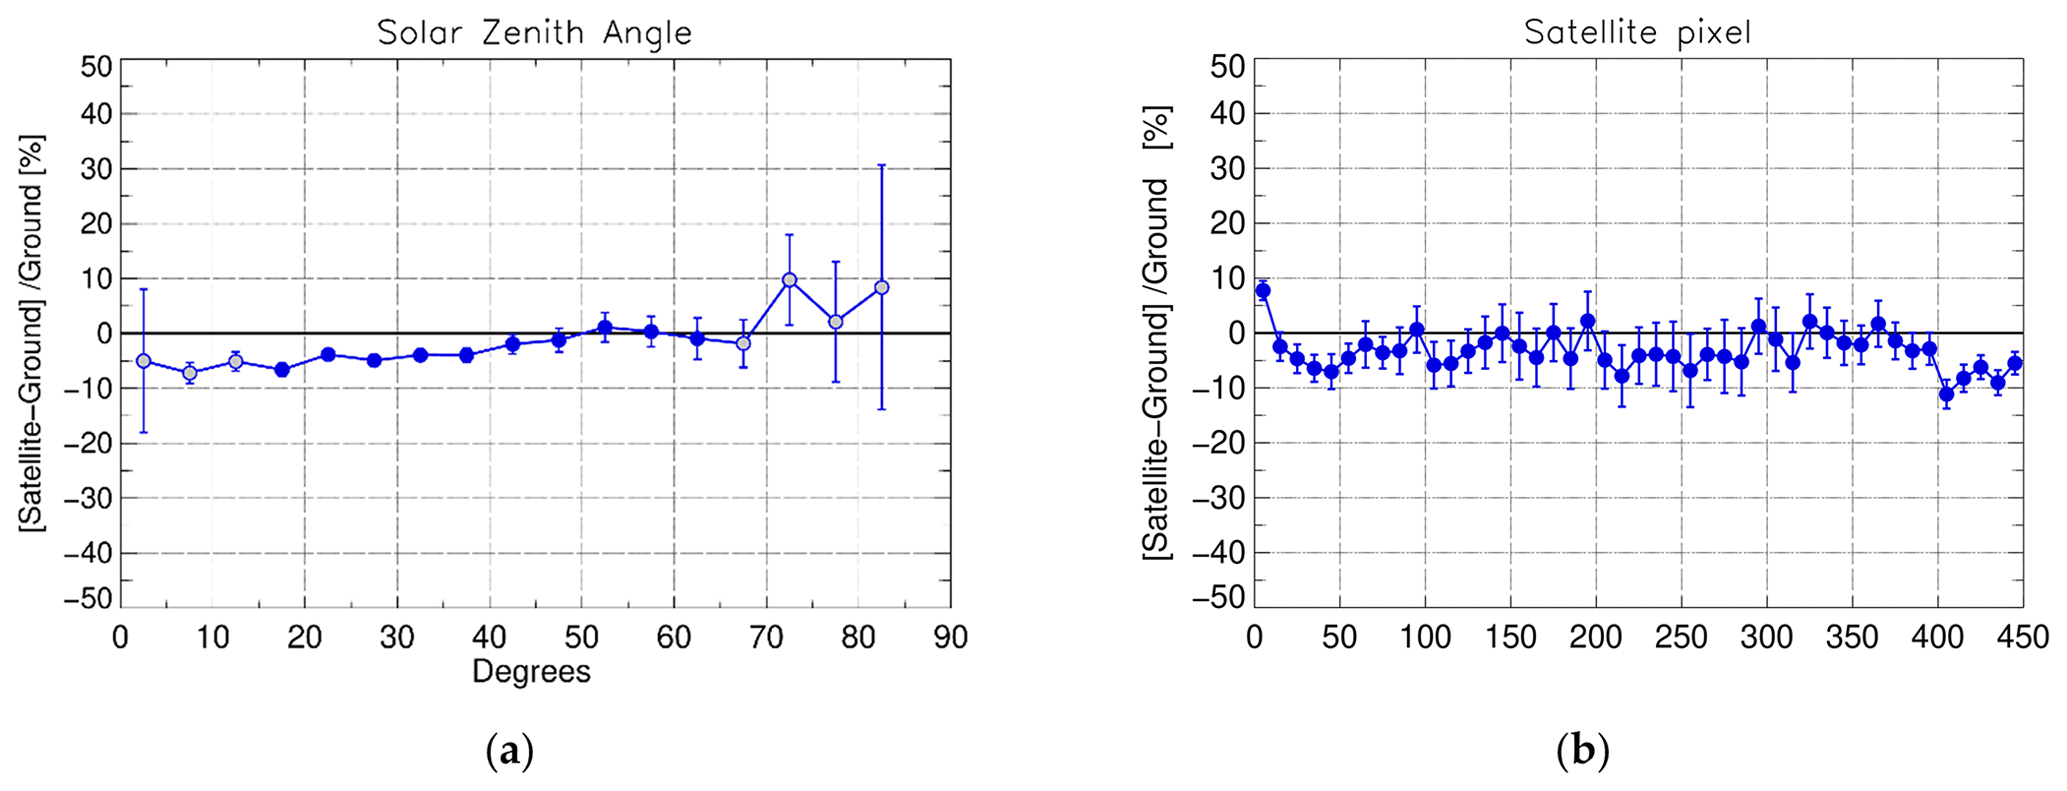
Figure 10The dependence of the mean relative differences between satellite- and ground-based TCWV observations on solar zenith angle (a) and the satellite pixel number (b). In both panels, the error bars show the standard error of the mean with a confidence interval (CI) of 99.7 %. Grey dots represent bins containing <3 % of the total co-location pairs.
As for the dependence of the comparisons on satellite pixels (panel b), pixels 0–10 have a positive mean relative bias of +7 %, and pixels 400–450 have a systematic negative mean relative bias of 8.2 %. Except for these two areas of pixels, the illustration of the dependence shows a variability within 0 % and −10 %, so there is no evident overall systematic east–west dependence in the TROPOMI/S5P swath.
4.2.2 Input data dependency
The TCWV retrieval algorithm requires two categories of input data that are simultaneously retrieved from TROPOMI/S5P measurements: the cloud properties and the surface properties.
Concerning the cloud properties retrieved with the OCRA/ROCINN algorithms (Loyola et al., 2018), Fig. 11 shows the dependence of the comparisons on cloud top pressure (panel a), cloud albedo (panel b) and cloud fraction (panel c). As is indicated from the figures, the satellite TCWV has a noticeable dependence on cloud pressure and cloud albedo:
-
For cloud top pressures (panel a) up to 800 hPa, the data bins with a relatively high number of co-locations have a positive bias of % to +10 %, which decreases to −20 % when the pressure increases to ∼900 or 1000 hPa; hence for clouds of lower height, that may also affect the ground-based measurements. Borger et al. (2020), who validated their TCWV product against the Special Microwave Imager Sounder (SMISS) on board f16 and f17, ERA-5 and GPS data, examined the dependence of their comparisons on cloud height. They also found that low clouds, located below 3–4 km, cause an underestimation in the retrieved TCWV of about −13 %. Typically, the cloud top pressure of 800 hPa that we found to be the turning point corresponds to ∼ 2–3 km; therefore our results are very consistent with Borger et al. (2020), especially considering the fact that they are based on a different retrieval algorithm.
-
Panel (b) shows that the comparisons have a strong overall dependence of 40 % peak to peak on cloud albedo, i.e., on the fraction of solar radiation that is reflected directly by clouds in the atmosphere (AMS, 2022). The bias of the comparisons is positive, +15 % maximum, for cloud albedo values below 0.3 and becomes negative, up to −25 %, for increasing cloud albedo, thus for brighter clouds.
-
The cloud fraction figure (panel c) shows that the vast majority of the co-locations have cloud fraction values below 0.3, which is expected since both satellite- and ground-based observations are filtered for cloudiness (satellite data are filtered for cloud fraction <0.5). Within the cloud fraction range of 0 to 0.3, no particular dependence is seen. The co-locations that are characterized with cloud fraction values between 0.3 and 0.5 are very few in population, but they introduce high positive mean relative biases. Excluding the co-locations with cloud fraction over 0.3 was also investigated, resulting in no major differences in the overall validation results due to the limited contribution of the relatively low number of co-locations with cloud fraction values in the range 0.3–0.5. Nevertheless, it is advisable not to use this small portion of TCWV data for future scientific studies.
Overall, the dependence of the relative percentage differences on cloud fraction and cloud albedo could also be an issue of the ghost total column, i.e., the water vapor that may be present beneath the clouds but not properly measured by the satellite instrument when even a part of the sky is cloudy. The fact that the ground-based measurements are screened for cloudiness, and the satellite observations are allowed to have a part of the measurement field covered with clouds, can be another cause for the differences found between them.

Figure 11The dependency of the comparisons of satellite- to ground-based TCWV measurements on three different cloud parameters, namely (a) cloud top pressure, (b) cloud albedo and (c) cloud fraction. The error bars show the standard error of the mean with a confidence interval (CI) of 99.7 %. Grey dots represent bins containing <3 % of the total co-location pairs.
The surface properties used for the TROPOMI/TCWV product, namely surface pressure and surface albedo, were retrieved with the GE_LER algorithm (Loyola et al., 2020). The dependence of the comparisons on these properties is shown in Fig. 12:
-
Surface pressure (panel a). For the typical range of surface pressures i.e., 900–1050 hPa, no systematic dependence is seen in the comparisons. As expected, the bins with pressures less than 900 hPa have a limited number of co-locations, and the curve represents mostly noise data.
-
Surface albedo (panel b). As the density of ground-based stations is much higher at the midlatitudes of both hemispheres, very few co-locations have surface albedo above 0.2, and since they showed no apparent systematic dependence on surface albedo, they are not included in the figure. For surface albedo values below 0.2, the relative differences range within ±10 %, but no systematic dependence is detected.
Figure 12The dependence of the comparisons of satellite- to ground-based TCWV measurements on two surface parameters, namely (a) surface pressure and (b) surface albedo. In both panels, the error bars show the standard error of the mean with a confidence interval (CI) of 99.7 %. Grey dots represent bins containing <3 % of the total co-location pairs.
4.2.3 Dependency on algorithm-related parameters
The following parameters are related to the retrieval algorithm of the TROPOMI/S5P TCWV data:
-
Air mass factor (AMF). The dependence of the relative differences of co-located data on AMF is shown in Fig. 13a. For the well-populated bins with AMF ranging between 1 and 2, the bias is negligible, up to −5 %, which is expected since the measurements acquired under low SZAs also have a bias of 0 % to −5.5 % (Fig. 10a). For AMF values between 2 and 3, the bias becomes negative, up to −20 %, probably affected by cloudiness, while for AMFs greater than 3 the number of co-locations per averaged bin is very low, and their variability is not considered statistically important.
-
Root mean square error of fit (rms). Figure 13b shows no systematic dependence on rms, even for the bins with a low number of co-locations.
-
Water vapor slant column density (SCD). Figure 13c shows the dependence on the water vapor SCD. No dependence of the comparisons on the specific parameter is seen when the algorithm retrieves values above 10 kg m−2. The limited number of co-locations with positive SCD values below 10 kg m−2 have a relative percentage difference of −32 %. Negative SCDs are mainly due to measurement noise. When the spectral fit residual is analyzed, the random uncertainty of SCD retrieval is typically less than 1 kg m−2. Although this error is small, it could cause a significant impact over areas with low atmospheric water vapor content and result in negative values. In addition, this effect can be further amplified when the AMF is small (below 1). Even though very few retrievals are based on an AMF value of less than 1, we note that comparisons to these pixels result in extremely high relative differences with respect to ground-based measurements, up to 100 %.

Figure 13The dependence of the comparisons of satellite- to ground-based TCWV measurements on three parameters, namely TROPOMI/S5P (a) air mass factor, (b) rms and (c) water vapor slant column density. Grey dots represent bins containing <3 % of the total co-location pairs.
The main purpose of this work is to examine the performance of the new TCWV product retrieved from the blue band of the TROPOMI/S5P observations and their consistency with AERONET ground-based measurements. About 70 000 instantaneous co-located data were available during the time period May 2018 to December 2020, originating from 369 ground-based stations and the respective satellite overpasses. The relative percentage differences that were calculated from the co-located pairs of data with a temporal difference of up to ±30 min and a maximum search radius up to 10 km correspond to clear-sky observations (satellite cloud fraction <0.5) and were statistically analyzed in terms of temporal and latitudinal dependences. Furthermore, their dependence on various parameters was investigated. The validation results can be summarized as follows:
-
The overall mean relative difference between TROPOMI/S5P and AERONET TCWV observations is −2.7 %, while the Pearson correlation coefficient is 0.91. When the two hemispheres are studied separately, their mean bias results in −3.1 % for the NH and +0.9 % for the SH. Considering that the uncertainty of the satellite TCWV product is ∼ 10 %–19 % (tropics), and the ground-based measurements' uncertainty is reported to be ∼10 %, the agreement between the two datasets is deemed very satisfactory. The mean standard error of the comparisons at a 99.7 % CI is 0.5 %, highlighting the good consistency of the results. Additionally, considering the dry bias of the AERONET observations that was discussed in Sect. 2.2, which is about −5 % to −10 % (depending on the study and its reference) and varies with season and latitude, it can be concluded that the satellite TCWV observations have a dry bias with respect to the “absolute” truth of about −8 % to −13 %, respectively.
-
A zonal analysis of the monthly mean relative differences and their standard deviations showed that for midlatitudes, where water vapor is low (10–20 kg m−2) and more variable with season, TROPOMI/S5P overestimates TCWV by ∼ 5 %–10 % (i.e., 1–2 kg m−2) during winter months of each hemisphere. The variability (standard deviation) of these overestimations is very high, up to 90 %. During summer months, when the water vapor content over midlatitude stations is higher (up to ∼40 kg m−2), the availability of the ground-based measurements is increased, and their uncertainty is lower, the relative differences between TROPOMI/S5P and AERONET are within ±5 % (i.e., up to ±2 kg m−2) and have a rather limited variability (∼ 10 %–30 %). In the tropics (15∘ N–15∘ S), where the bulk of the water vapor is concentrated and is quite stable annually, our analysis confirmed that TROPOMI/S5P has a dry bias of up −10 % (or up to −4 kg m−2) with respect to the ground-based measurements (see Table 2), which is temporally stable, with a variability of less than 20 % (Fig. 8b).
-
Finally, many parameters influencing the satellite retrievals were studied, and no particular dependences were found, except for a dependency on cloud top pressure (CTP) and cloud albedo. Specifically, it was shown that for low cloud top height (CTP >800 hPa), the satellite reports lower TCWV by up to −20 % compared to the ground-based measurements. The dependency on cloud albedo is also strong, about 40 % peak to peak, showing a wet bias of 15 % when the cloud albedo is below 0.3 and a dry bias up to −25 % when the clouds are more reflective (albedo >0.3).
To conclude, as shown from the validation of 2.5 years of available satellite observations, with respect to ground-based observations from AERONET, the TROPOMI/S5P TCWV product retrieved from the blue spectral range is a temporally stable product of high quality and precision, especially in the tropics. Also, it is not significantly affected by any other parameters, except by clouds when and if some cloudiness at lower atmospheric layers is present in the measurement field. This product is expected to substantially contribute to a long time series of total column water vapor climate data record achieved by utilizing other blue band satellites, such as GOME (Global Ozone Monitoring Experience; Burrows et al., 1999), GOME-2 (Global Ozone Monitoring Experience 2; Callies et al., 2000), SCIAMACHY (SCanning Imaging Absorption SpectroMeter for Atmospheric CHartographY; Bovensmann et al., 1999) and OMI (Ozone Monitoring Instrument; Levelt et al., 2006), along with TROPOMI/S5P.
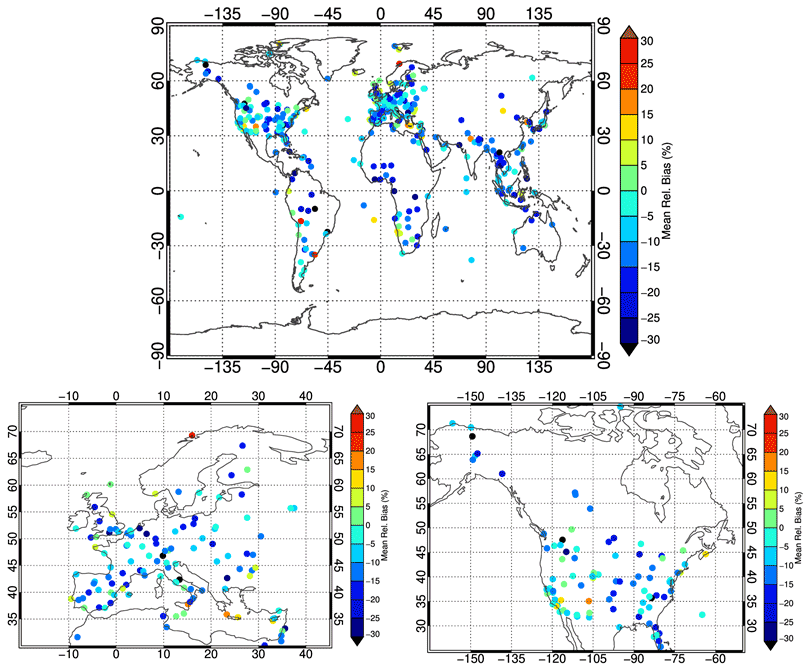
Figure A1The mean relative bias (in %) between satellite- and ground-based observations per station in the form of a world map (above). The two panels below show the areas that are very well populated with stations in Europe (left panel) and North America (right panel) in greater detail.
The TROPOMI/S5P TCWV data were retrieved using the algorithm described in Chan et al. (2022; https://doi.org/10.1016/j.scitotenv.2022.153232). The dataset is foreseen to be available through the ESA Sentinel 5 Precursor Product Algorithm Laboratory (S5P-PAL) framework. The AERONET ground-based Level 2.0 Version 3 (Giles et al., 2019) precipitable water measurements were downloaded from the AERONET website (https://aeronet.gsfc.nasa.gov/new_web/download_all_v3_aod.html, last access: 20 May 2022; AERONET, 2022). The data are freely available to the public.
KG and DB conceptualized the study. The validation methodology was defined by KG and MEK. The scripts used for the analysis were written by KG and MEK. The data analysis and validation were performed by KG, MEK and DB. KLC and DL provided the satellite data. KG wrote the manuscript. MEK, DB, DL and KLC reviewed and edited the manuscript. The project was administered by DL. Funding was acquired by DL and DB. All authors have read and agreed to the published version of the manuscript.
At least one of the (co-)authors is a member of the editorial board of Atmospheric Measurement Techniques. The peer-review process was guided by an independent editor, and the authors also have no other competing interests to declare.
Publisher’s note: Copernicus Publications remains neutral with regard to jurisdictional claims in published maps and institutional affiliations.
This article is part of the special issue “Analysis of atmospheric water vapour observations and their uncertainties for climate applications (ACP/AMT/ESSD/HESS inter-journal SI)”. It is not associated with a conference.
We thank the AERONET PI(s) and Co-I(s) and their staff for establishing and maintaining the 369 sites used in this investigation. We thank the European Space Agency (ESA) for supporting the TROPOMI/S5P TCWV optimization within the framework of the Sentinel 5 Precursor Product Algorithm Laboratory (S5P-PAL) project.
This research was funded by the German Aerospace Center (DLR) in coordination with the DLR Innovative Products for Analyses of Atmospheric Composition (INPULS) project.
The article processing charges for this open-access publication were covered by the German Aerospace Center (DLR).
This paper was edited by Marloes Penning de Vries and reviewed by two anonymous referees.
AERONET: AERONET ground-based Level 2.0 Version 3, AERONET [data set], (https://aeronet.gsfc.nasa.gov/new_web/download_all_v3_aod.html, last access: 20 May 2022.
Alexandrov, M. D., Schmid, B., Turner, D. D., Cairns, B., Oinas, V., Lacis, A. A., Gutman, S. I., Westwater, E. R., Smirnov, A., and Eilers, J.: Columnar water vapor retrievals from multifilter rotating shadowband radiometer data, J. Geophys. Res., 114, D02306, https://doi.org/10.1029/2008JD010543, 2009.
AMS (American Meteorological Society): Glossary of Meteorology, AMS, https://glossary.ametsoc.org/wiki/Cloud_albedo, last access: 20 November 2022.
Bennouna, Y. S., Torres, B., Cachorro, V. E., Ortiz de Galisteo, J. P., and Toledano, C.: The evaluation of the integrated water vapour annual cycle over the Iberian Peninsula from EOS-MODIS against different ground-based techniques, Q. J. Roy. Meteor. Soc., 139, 1935–1956, https://doi.org/10.1002/qj.2080, 2013.
Borger, C., Beirle, S., Dörner, S., Sihler, H., and Wagner, T.: Total column water vapour retrieval from S-5P/TROPOMI in the visible blue spectral range, Atmos. Meas. Tech., 13, 2751–2783, https://doi.org/10.5194/amt-13-2751-2020, 2020.
Bovensmann, H., Burrows, J., Buchwitz, M., Frerick, J., Noël, S., Rozanov, V., Chance, K., and Goede, A.: SCIAMACHY: Mission objectives and measurement modes, J. Atmos. Sci., 56, 127–150, https://doi.org/10.1175/1520-0469(1999)056<0127:SMOAMM>2.0.CO;2, 1999.
Bright, J. M., Gueymard, C. A., Killinger, S., Lingfors, D., Sun, X., Wang, P., and Engerer, N. A.: Climatic and global validation of daily MODIS precipitable water data at AERONET sites for clear-sky irradiance modelling, in: Proceedings of the EuroSun 2018 Conference on Solar Energy and Buildings, Rapperswil, Switzerland, 10–13 September 2018, https://doi.org/10.18086/eurosun2018.09.07, 2018.
Burrows, J. P., Weber, M., Buchwitz, M., Rozanov, V., Ladstätter-Weißenmayer, A., Richter, A., DeBeek, R., Hoogen, R., Bramstedt, K., Eichmann, K., Eisinger, M., and Perner, D.: The global ozone monitoring experiment (GOME): mission concept and first scientific results, J. Atmos. Sci., 56, 151–175, https://doi.org/10.1175/1520-0469(1999)056<0151:TGOMEG>2.0.CO;2, 1999.
Callies, J., Corpaccioli, E., Eisinger, M., Hahne, A., and Lefebvre, A.: GOME-2-Metop's second-generation sensor for operational ozone monitoring, ESA Bull.-Eur. Space, 102, 28–36, 2000.
Campanelli, M., Mascitelli, A., Sanò, P., Diémoz, H., Estellés, V., Federico, S., Iannarelli, A. M., Fratarcangeli, F., Mazzoni, A., Realini, E., Crespi, M., Bock, O., Martínez-Lozano, J. A., and Dietrich, S.: Precipitable water vapour content from ESR/SKYNET sun–sky radiometers: validation against GNSS/GPS and AERONET over three different sites in Europe, Atmos. Meas. Tech., 11, 81–94, https://doi.org/10.5194/amt-11-81-2018, 2018.
Chan, K. L., Valks, P., Slijkhuis, S., Köhler, C., and Loyola, D.: Total column water vapor retrieval for Global Ozone Monitoring Experience-2 (GOME-2) visible blue observations, Atmos. Meas. Tech., 13, 4169–4193, https://doi.org/10.5194/amt-13-4169-2020, 2020.
Chan, K. L., Xu, J., Slijkhuis, S., Valks, P., and Loyola, D.: TROPOspheric Monitoring Instrument observations of total column water vapour: Algorithm and validation, Sci. Total Environ., 821, 153232, https://doi.org/10.1016/j.scitotenv.2022.153232, 2022.
Colman, R.: A comparison of climate feedbacks in general circulation models, Clim. Dynam., 20, 865–873, https://doi.org/10.1007/s00382-003-0310-z, 2003.
Diedrich, H., Preusker, R., Lindstrot, R., and Fischer, J.: Retrieval of daytime total columnar water vapour from MODIS measurements over land surfaces, Atmos. Meas. Tech., 8, 823–836, https://doi.org/10.5194/amt-8-823-2015, 2015.
Dlugokencky, E., Houweling, S., Dirksen, R., Schröder, M., Hurst, D., Forster, P., and WMO Secretariat: Observing Water Vapour, World Meteorological Organization (WMO), Bulletin no.: Vol. 65 (2)-2016, https://public.wmo.int/en/resources/bulletin/observing-water-vapour (last access: 23 February 2022), 2016.
Dupuy, E., Morino, I., Deutscher, N. M., Yoshida, Y., Uchino, O., Connor, B. J., De Mazière, M., Griffith, D. W. T., Hase, F., Heikkinen, P., Hillyard, P. W., Iraci, L. T., Kawakami, S., Kivi, R., Matsunaga, T., Notholt, J., Petri, C., Podolske, J. R., Pollard, D. F., Rettinger, M., Roehl, C. M., Sherlock, V., Sussmann, R., Toon, G. C., Velazco, V. A., Warneke, T., Wennberg, P. O., Wunch, D., and Yokota, T.: Comparison of XH2O Retrieved from GOSAT Short-Wavelength Infrared Spectra with Observations from the TCCON Network, Remote Sensing, 8, 414, https://doi.org/10.3390/rs8050414, 2016.
Fragkos, K., Antonescu, B., Giles, D. M., Ene, D., Boldeanu, M., Efstathiou, G. A., Belegante, L., and Nicolae, D.: Assessment of the total precipitable water from a sun photometer, microwave radiometer and radiosondes at a continental site in southeastern Europe, Atmos. Meas. Tech., 12, 1979–1997, https://doi.org/10.5194/amt-12-1979-2019, 2019.
Gendt, G., Dick, G., Reigber, C., Tomassini, M., Liu, Y., and Ramatschi, M.: Near real time GPS water vapor monitoring for numerical weather prediction in Germany, J. Meteorol. Soc. Jpn., 82, 361–370, https://doi.org/10.2151/jmsj.2004.361, 2004.
Giles, D. M., Sinyuk, A., Sorokin, M. G., Schafer, J. S., Smirnov, A., Slutsker, I., Eck, T. F., Holben, B. N., Lewis, J. R., Campbell, J. R., Welton, E. J., Korkin, S. V., and Lyapustin, A. I.: Advancements in the Aerosol Robotic Network (AERONET) Version 3 database – automated near-real-time quality control algorithm with improved cloud screening for Sun photometer aerosol optical depth (AOD) measurements, Atmos. Meas. Tech., 12, 169–209, https://doi.org/10.5194/amt-12-169-2019, 2019.
Holben, B. N., Eck, T. F., Slutsker, I., Tanré, D., Buis, J. P., Setzer, A., Vermote, E., Reagan, J. A., Kaufman, Y. J., Nakajima, T., Lavenu, F., Jankowiak, I., and Smirnov, A.: AERONET – A Federated Instrument Network and Data Archive for Aerosol Characterization, Remote Sens. Environ., 66, 1–16, https://doi.org/10.1016/S0034-4257(98)00031-5, 1998.
Inamdar, A. K. and Ramanathan, V.: Tropical and global scale interactions among water vapor, atmospheric greenhouse effect, and surface temperature, J. Geophys. Res., 103, 32177–32194, https://doi.org/10.1029/1998JD900007, 1998.
Kleipool, Q., Ludewig, A., Babić, L., Bartstra, R., Braak, R., Dierssen, W., Dewitte, P.-J., Kenter, P., Landzaat, R., Leloux, J., Loots, E., Meijering, P., van der Plas, E., Rozemeijer, N., Schepers, D., Schiavini, D., Smeets, J., Vacanti, G., Vonk, F., and Veefkind, P.: Pre-launch calibration results of the TROPOMI payload on-board the Sentinel-5 Precursor satellite, Atmos. Meas. Tech., 11, 6439–6479, https://doi.org/10.5194/amt-11-6439-2018, 2018.
Küchler, T., Noël, S., Bovensmann, H., Burrows, J. P., Wagner, T., Borger, C., Borsdorff, T., and Schneider, A.: Total water vapour columns derived from Sentinel 5P using the AMC-DOAS method, Atmos. Meas. Tech., 15, 297–320, https://doi.org/10.5194/amt-15-297-2022, 2022.
Lambert, A., Read, W., and Livesey, N.: MLS/Aura Level 2 Water Vapor (H2O) Mixing Ratio V004, Greenbelt, MD, USA, Goddard Earth Sciences Data and Information Services Center (GES DISC), https://doi.org/10.5067/Aura/MLS/DATA2009, 2015.
Le Texier, H., Solomon, S., and Garcia, R. R.: The role of molecular hydrogen and methane oxidation in the water vapour budget of the stratosphere, Q. J. Roy. Meteor. Soc., 114, 281–295, 1998.
Levelt, P., Van den Oord, G. H. J., Dobber, M., Malkki, A., Visser, H., de Vries, J., Stammes, P., Lundell, J., and Saari, H.: The ozone monitoring instrument, IEEE T. Geosci. Remote, 44, 1093–1101, https://doi.org/10.1109/TGRS.2006.872333, 2006.
Lindstrot, R., Stengel, M., Schröder, M., Fischer, J., Preusker, R., Schneider, N., Steenbergen, T., and Bojkov, B. R.: A global climatology of total columnar water vapour from SSM/I and MERIS, Earth Syst. Sci. Data, 6, 221–233, https://doi.org/10.5194/essd-6-221-2014, 2014.
Loyola, D. G., Gimeno García, S., Lutz, R., Argyrouli, A., Romahn, F., Spurr, R. J. D., Pedergnana, M., Doicu, A., Molina García, V., and Schüssler, O.: The operational cloud retrieval algorithms from TROPOMI on board Sentinel-5 Precursor, Atmos. Meas. Tech., 11, 409–427, https://doi.org/10.5194/amt-11-409-2018, 2018.
Loyola, D. G., Xu, J., Heue, K.-P., and Zimmer, W.: Applying FP_ILM to the retrieval of geometry-dependent effective Lambertian equivalent reflectivity (GE_LER) daily maps from UVN satellite measurements, Atmos. Meas. Tech., 13, 985–999, https://doi.org/10.5194/amt-13-985-2020, 2020.
Ludewig, A., Kleipool, Q., Bartstra, R., Landzaat, R., Leloux, J., Loots, E., Meijering, P., van der Plas, E., Rozemeijer, N., Vonk, F., and Veefkind, P.: In-flight calibration results of the TROPOMI payload on board the Sentinel-5 Precursor satellite, Atmos. Meas. Tech., 13, 3561–3580, https://doi.org/10.5194/amt-13-3561-2020, 2020
Martins, V. S., Lyapustin, A., Wang, Y., Giles, D. M., Smirnov, A., Slutsker, I., and Korkin, S.: Global validation of columnar water vapor derived from EOS MODIS-MAIAC algorithm against the ground-based AERONET observations, Atmos. Res., 225, 181–192, https://doi.org/10.1016/j.atmosres.2019.04.005, 2019.
Oman, L., Waugh, D. W., Pawson, S., Stolarski, R. S., and Nielsen, J. E.: Understanding the changes of stratospheric water vapor in coupled chemistry-climate model simulations, J. Atmos. Sci., 65, 3278–3291, https://doi.org/10.1175/2008JAS2696.1, 2008.
Pérez-Ramírez, D., Whiteman, D. N., Smirnov, A., Lyamani, H., Holben, B. N., Pinker, R., Andrade, M., and Alados-Arboledas, L.: Evaluation of AERONET precipitable water vapor versus microwave radiometry, GPS, and radiosondes at ARM sites, J. Geophys. Res.-Atmos., 119, 9596–9613, https://doi.org/10.1002/2014JD021730, 2014.
Platt, U. and Stutz, J.: Differential Optical Absorption Spectroscopy, Springer, Berlin, Heidelberg, https://doi.org/10.1007/978-3-540-75776-4, 2008.
Raval, A. and Ramanathan, V.: Observational determination of the greenhouse effect, Nature, 342, 758–761, https://doi.org/10.1038/342758a0, 1989.
Schneider, A., Borsdorff, T., aan de Brugh, J., Aemisegger, F., Feist, D. G., Kivi, R., Hase, F., Schneider, M., and Landgraf, J.: First data set of H2O/HDO columns from the Tropospheric Monitoring Instrument (TROPOMI), Atmos. Meas. Tech., 13, 85–100, https://doi.org/10.5194/amt-13-85-2020, 2020.
Schneider, A., Borsdorff, T., aan de Brugh, J., Lorente, A., Aemisegger, F., Noone, D., Henze, D., Kivi, R., and Landgraf, J.: Retrieving H2O/HDO columns over cloudy and clear-sky scenes from the Tropospheric Monitoring Instrument (TROPOMI), Atmos. Meas. Tech., 15, 2251–2275, https://doi.org/10.5194/amt-15-2251-2022, 2022.
Schneider, M., Romero, P. M., Hase, F., Blumenstock, T., Cuevas, E., and Ramos, R.: Continuous quality assessment of atmospheric water vapour measurement techniques: FTIR, Cimel, MFRSR, GPS, and Vaisala RS92, Atmos. Meas. Tech., 3, 323–338, https://doi.org/10.5194/amt-3-323-2010, 2010.
Shi, F., Xin, J., Yang, L., Cong, Z., Liu, R., Ma, Y., Wang, Y., Lu, X., and Zhao, L.: The first validation of the precipitable water vapor of multisensor satellites over the typical regions in China, Remote Sens. Environ., 206, 107–122, https://doi.org/10.1016/j.rse.2017.12.022, 2018.
Smirnov, A., Holben, B. N., Lyapustin, A., Slutsker, I., and Eck, T. F.: AERONET Processing Algorithms Refinement, Proceedings of AERONET Workshop, NASA/GSFC Aeronet project, El Arenosillo, Spain, 10–14 May 2004, https://aeronet.gsfc.nasa.gov/new_web/spain2004/spain_presentations.html) (last access: 16 November 2022), 2004.
Turner, D. D., Lesht, B. M., Clough, S. A., Liljegren, J. C., Revercomb, H. E., and Tobin, D. C.: Dry Bias and Variability in Vaisala RS80-H Radiosondes: The ARM Experience, J. Atmos. Ocean. Tech., 20, 117–132, 2003.
Vaquero-Martinez, J., Anton, M., Chan, K. L., and Loyola, D.: Evaluation of Water Vapor Product from TROPOMI and GOME-2 Satellites against Ground-Based GNSS Data over Europe, Atmosphere, 13, 1079, https://doi.org/10.3390/atmos13071079, 2022.
Veefkind, J. P., Aben, I., McMullan, K., Förster, H., de Vries, J., Otter, G., Claas, J., Eskes, H. J., de Haan, J. F., Kleipool, Q., van Weele, M., Hasekamp, O., Hoogeveen, R., Landgraf, J., Snel, R., Tol, P., Ingmann, P., Voors, R., Kruizinga, B., Vink, R., Visser, H., and Levelt, P. F.: TROPOMI on the ESA Sentinel-5 Precursor: A GMES mission for global observations of the atmospheric composition for climate, air quality and ozone layer applications, Remote Sens. Environ., 120, 70–83, https://doi.org/10.1016/j.rse.2011.09.027, 2012.
Weaver, D., Strong, K., Schneider, M., Rowe, P. M., Sioris, C., Walker, K. A., Mariani, Z., Uttal, T., McElroy, C. T., Vömel, H., Spassiani, A., and Drummond, J. R.: Intercomparison of atmospheric water vapour measurements at a Canadian High Arctic site, Atmos. Meas. Tech., 10, 2851–2880, https://doi.org/10.5194/amt-10-2851-2017, 2017.
Wunch, D., Toon, G. C., Blavier, J.-F. L., Washenfelder, R. A., Notholt, J., Connor, B. J., Griffith, D. W. T., Sherlock, V., and Wennberg, P. O.: The Total Carbon Column Observing Network, Philos. T. Roy. Soc. A, 369, 2087–2112, https://doi.org/10.1098/rsta.2010.0240, 2011.
Xie, Y., Li, Z., Hou, W., Guang, J., Ma, Y., Wang, Y., Wang, S., and Yang, D.: Validation of FY-3D MERSI-2 Precipitable Water Vapor (PWV) Datasets Using Ground-Based PWV Data from AERONET, Remote Sens., 13, 3246, https://doi.org/10.3390/rs13163246, 2021.
- Abstract
- Introduction
- Data sources
- Co-location methodology and AERONET stations quality control
- Discussion on the validation analysis
- Summary and conclusions
- Appendix A
- Data availability
- Author contributions
- Competing interests
- Disclaimer
- Special issue statement
- Acknowledgements
- Financial support
- Review statement
- References