the Creative Commons Attribution 4.0 License.
the Creative Commons Attribution 4.0 License.
 | 29 Nov 2023
Obtaining accurate non-methane hydrocarbon data for ambient air in urban areas: comparison of non-methane hydrocarbon data between indirect and direct methods
Song Gao
Yong Yang
Xiao Tong
Linyuan Zhang
Yusen Duan
Guigang Tang
Qiang Wang
Changqing Lin
Qingyan Fu
Lipeng Liu
Lingning Meng
Since non-methane hydrocarbons (NMHCs) include numerous species of volatile organic compounds (VOCs), they are the only indicators that can characterize the total amount of VOCs in ambient air. More than 90 % of NMHC instruments in the market use the indirect method for NMHC determination, utilizing a gas chromatograph to determine the concentrations of total hydrocarbons (THCs) and methane in air. However, we found indirect NMHC measurements incorrectly characterized the low NMHC concentrations in the urban air. These measurements were hindered by the uncertain changes in the errors associated with low THC concentrations, humidity and macroscopic substances (oxygen) in the atmosphere. In this study, we conducted intercomparisons between 10 instruments in the market using different operation principles; among these, two used the direct method, and eight used the indirect method. For the indirect method, experiments showed that when the NMHC concentration was 50 ppb C, the errors in the measurement results were 32 % (CH4) and 98 % (THC) when compared to theoretical values. The oxygen content in the sample gas directly affected the response of the THC. The effect of increased oxygen content on the analysis of oxygen-containing substances was more significant than that of the increase in hydrocarbon substances. The response of dry zero was blank, and the response value increased non-linearly with relative humidity (RH). RH had a great impact on low NMHC concentrations of nearly 50 %. For the direct method, although various flow designs were applied for different instruments, the results indicated that they generally showed lower interference and higher accuracy for the ambient NMHC measurements. With the online direct methods, we obtained more reliable data and characteristics for low-concentration NMHCs in downtown Shanghai. The median of hourly data was 163.1 ppb C, and the highest ratio of the maximum and minimum concentrations of NMHCs reached 9.56 in a single day.
- Article
(2153 KB) - Full-text XML
- BibTeX
- EndNote


High concentrations of methane and non-methane hydrocarbons (NMHCs) in the air affect the atmospheric environment. NMHCs are the sum of all other gaseous organic compounds other than methane that respond to the hydrogen flame ionization detector (FID) (Baker et al., 2008; Wang et al., 2015; Wen-qi, 2009). Under sunlight, NMHCs exceed a specific concentration and react to form secondary pollutants (peroxyacetyl nitrate (PAN), secondary organic aerosols (SOA) and O3), which affects the environment and human health (Huang et al., 2014; Liu et al., 2017; Shen et al., 2013; Ahmed et al., 2015; Thoma et al., 2022). Methane causes environmental problems, such as global warming (Panopoulou et al., 2018; Song et al., 2012). NMHC monitoring needs to be strengthened to improve air quality and reduce ozone pollution, and the volatile organic compound (VOC) emission reduction assessment for cities and industrial parks requires NMHC monitoring data as an important reference. NMHCs have become the most widely used comprehensive evaluation factor for organic pollutants, exhibiting the highest monitoring frequency and emission standards. They are used to macroscopically characterize the VOC pollution status of the air. Over 100 countries have conducted NMHC monitoring worldwide, including the United States, those in the European Union and Japan. In China, NMHCs were measured in 300 cities that had more than 500 sets of online devices (Coelho et al., 2021; Panopoulou et al., 2018; Fan, 2019). Additionally, Shanghai has listed NMHCs as one of the evaluation factors for comprehensive environmental remediation in 2015. Therefore, there is an urgent need to ensure the quality and technical specifications of the NMHC real-time monitoring system and the reliability of NMHC real-time monitoring data. However, we evaluated whether the existing methods used for measuring NMHCs were accurate and scientific.
Existing NMHC analysis methods, derived from pollution source monitoring, have proven to be suitable for the measurement of high pollutant concentrations according to many environmental standards. However, studies and data associated with direct NMHC measurements are scarce, especially in urban districts with low levels of NMHCs. The majority of studies are concerned with the NMHC concentration after some regional or industrial park accidents. There are other studies that calculate the sum of each VOC, except for methane, which ranges from 50.23 to 127.35 ppbv; these values are considered to be the NMHC concentration (Atkinson, 2000; Baker et al., 2008). Thus, we believe that the accurate NMHC value is within this range.
At present, scientific research on the type of instrument mainly focuses on the mutual comparison between improved instruments, the advantages and disadvantages, and the concentration trend characteristics of NMHCs in ambient air over a period of time. Most countries currently use gas chromatography with a double-column dual-hydrogen FID (GC-FID) to determine the NMHC values (the NMHC content is equal to the total hydrocarbon content minus the methane content (Panopoulou et al., 2021; Hoerger et al., 2015)). To avoid the difference in sensitivity, the GC-FID was improved to a single FID. Bai (2010) proposed that the oxygen peak in the instrument based on subtraction represents the oxygen in the experimental environment, which is different from the oxygen in the actual monitoring environment and can cause a monitoring error. Wang et al. (2009) found that the GDX-502 packed column could not completely separate the oxygen and methane peaks, and the oxygen component values obtained by integration are quite different in certain situations. Chang et al. (2015) showed that volatile compounds containing Cl, O and S also have varying degrees of response when measuring NMHCs, which affects the final total hydrocarbon concentration. Li and Pan (2013) discussed the categories of substances that should be included in the measurement of NMHCs. However, measuring low concentrations of atmospheric NMHCs with instruments based on subtraction may increase the error. The influence of air humidity in different regions is usually not considered.
The lockdown during the COVID-19 pandemic provided a good opportunity to identify problems with analytical methods and to observe the performance of instrumental measurements. There are three stations for environmental-air real-time monitoring near Shanghai Chemical Industry Park: Zhelin, Caojing and Shanyang. The distribution of the three sites is shown in Fig. 1. Among them, the NMHC concentrations at the Zhelin and Caojing sites were measured with instruments using the subtraction method. The NMHC concentrations at the Shanyang site were measured with an instrument using the direct method. The variation trends in the NMHC concentrations exhibited significant fluctuations. At the beginning of 2020, owing to the sudden and severe epidemic situation, there was a complete shutdown of production and human activities. However, we found that the NMHC concentration measured with the instrument using the subtraction method during the Spring Festival period was above 450 ppb C and was sometimes even as high as 800–900 ppb C (shown in Figs. 6 and 7a–c). The NMHC concentrations measured with the instrument using the direct method were almost less than 100 ppb C. We aimed to understand why atmospheric NMHC concentrations were so different at nearby locations in such an exceptional period. Therefore, we continued to analyze the sum of concentrations of the real-time VOC-monitoring components and the sum of VOC concentrations converted to carbon based on the number of carbon responses of different functional groups (shown in Figs. 6 and 7b and c). The total VOC (TVOC) concentrations obtained at photochemical assessment monitoring stations (PAMSs, including 56 components) and at facilities with PAMSs and TO15 (including 106 components) were separately measured using online GC-MS and GC-FID and mainly ranged between 10 and 20 ppb. The calculated total NMHC concentrations (below 100 ppb C) were considerably lower than those calculated with the NMHC instrument using the indirect method (by more than 10-fold). This result was consistent with the concentration trend of the NMHC instrument using the direct method. Such a huge difference caused us to suspect the accuracy of the NMHC instrument using the indirect method. The measured value was clearly on the high side, and we examined the cause of this measurement error.
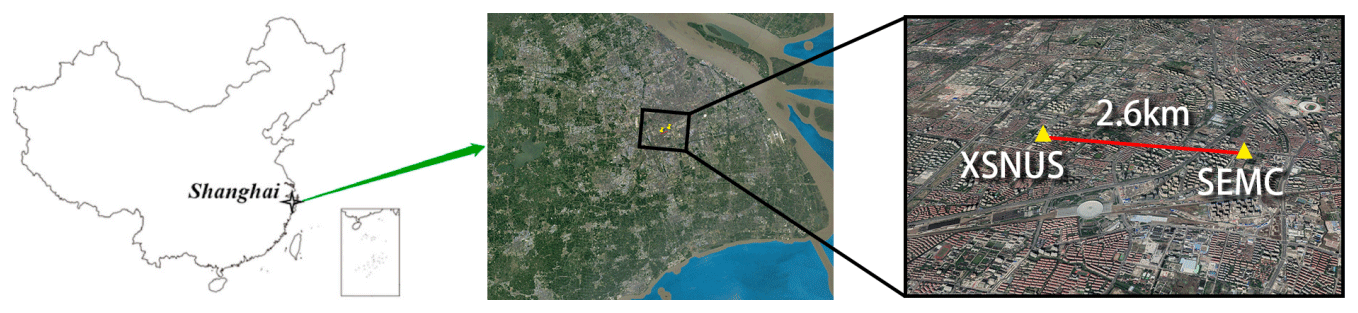
Figure 1Geographical map of the observation site at Shanghai Environmental Monitoring Center (SEMC), Xuhui Shanghai Normal University Station (XSNUS). All maps are from © Google Maps.
According to the response principle of the FID, the total NMHC content is the sum of the carbon concentration, which is the product of the VOC species concentration and the corresponding number of carbon responses of different functional groups. The TVOC concentrations of 106 and 56 VOC species ranged between 10 and 20 ppb approximately while exhibiting occasionally high values such as 100 ppb. The total NMHC concentrations calculated using 106 and 56 VOC species were approximately 40 ppb C, which is only 1/10 of the value measured with the instrument using the indirect method. The following factors need to be considered when determining the actual concentrations of the total NMHCs in ambient air: the accuracy associated with determining the total NMHC concentration sufficient for actual ambient air concentration levels and the ability of the mainstream indirect method in distinguishing the concentration difference of 10 ppb between two sites.
At present, several international countries and China have issued a series of standards, such as GB 16297, DB31/933 and EPA TO12, that stipulate the emission limit of NMHCs in ambient air. However, there is no mature standard associated with real-time monitoring technologies used for NMHCs; thus, a standard test for assessing instrument practicability is required. The detection principles, key component types and technical parameters of real-time monitoring instruments for NMHCs differ considerably, which causes specific difficulties in data quality controlling. As we observed the data during the COVID-19 pandemic, we doubted the accuracy of NMHC data for low-concentration atmospheric measurements using the subtraction method. We studied the accuracy of the instruments using subtraction or direct methods to measure the low-concentration NMHCs along with the influence of humidification. Therefore, we provided a scientific basis for determining the actual concentration of the total NMHCs in ambient air.
For a long time in the past, dry methane and propane standard gas were used in quantitative curves of the NMHC instrument. The atmospheric NMHC concentration was slightly different, although there was a good linearity of NMHCs. Among the NMHCs, besides propane, there are alkanes with less carbon and lower boiling points and those with more carbon and higher boiling points. In addition to alkanes, a variety of substances such as oxygen-containing hydrocarbons, chlorinated hydrocarbons and benzene series also exist. The adsorption and desorption of these substances and their response values to the FID are different. Moreover, while considering NMHCs, except for alkanes, we also tested whether the FID could respond well to the other main components of VOCs (such as benzene, halogenated hydrocarbons and ethyl acetate). Therefore, we referred to the method promulgated by Japan, wherein the ratio of the actual value to the theoretical concentration of the three representative substances should be within a certain range. Additionally, a difference in humidity exists between the actual ambient air and the dry standard gas. The humidity may affect the quantitative accuracy. We also considered whether low-level NMHC concentrations could be measured accurately. Therefore, to ensure qualitative and quantitative accuracy, the simulation must represent the actual air as much as possible. Moisture can also change the column efficiency and affect the shape of the peak. The following experimental plan was designed based on the aforementioned ideas.
2.1 Instruments
2.1.1 Introduction for principles of and differences between direct and indirect methods
The total NMHCs are defined as the sum of all volatile organic compounds that can respond to the FID. There are two common measurement methods, the direct method and the indirect method. The direct method refers to the method of separating non-methane hydrocarbons from total hydrocarbon and directly determining the concentration of the NMHCs. The indirect method refers to the method of measuring total hydrocarbon and methane and obtaining non-methane concentrations by deducting methane from total hydrocarbon. The indirect method is also known as differential subtraction.
2.1.2 Experimental sites and instruments
To solve the problem of qualitative and quantitative accuracy, we selected some instruments in the market according to market shares and technical principles. In summary, 10 instruments (including domestic and foreign brands) jointly participated in the verification test, among which the first two used the indirect method. Detailed information regarding the instruments is presented in Table 1. The subsequent description was not a one-to-one correspondence but only reflected the overall technique level. The sampling site for P1 was located at No. 55 Sanjiang Road, Shanghai Environmental Monitoring Center (SEMC; 31.1746∘ N, 121.44∘ E) and was set up at a height of 35 m. Site P2 is Xuhui Shanghai Normal University Station (XSNUS; 31.1654∘ N, 121.412∘ E), which is about 2.6 km to the west of SEMC. The two sites are located in the downtown area and are near one another to ensure that the data are correlated.
Table 1Information about the instruments involved in the test.
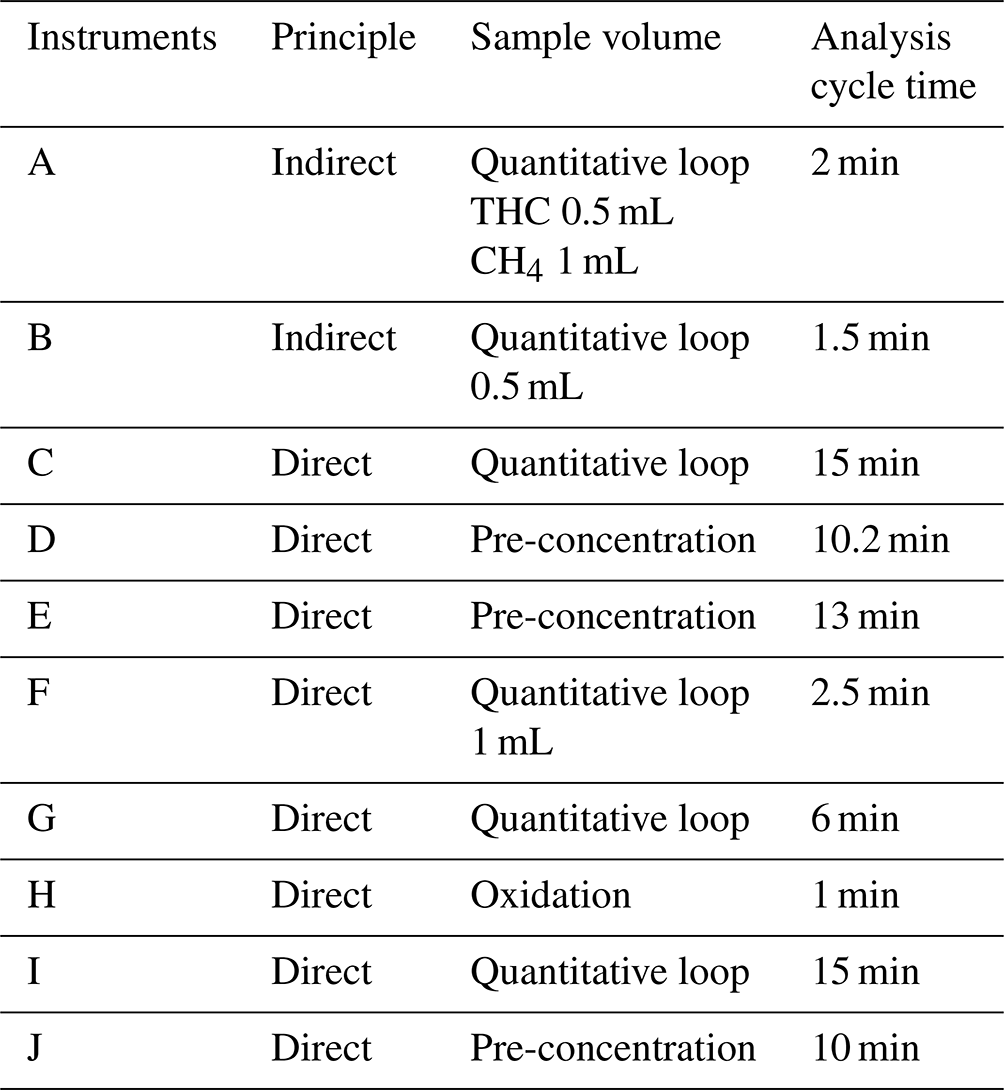
A to J – 10 letters for 10 brands, including Puyu (subtraction method), Thermo Fisher Scientific, XuanYi, Puyu (direct method), Nutech, Lengshan, DKK, Envea, Chromatotec and Synspec. Among them, B, E, G, H, I and J are foreign brands.
In addition to the gas required in the experiment, we used two other pieces of auxiliary equipment. The dynamic dilution calibrator (D3000) is an online dilution gas device equipped with four flow meters with different ranges and a glass mixing pool. The flow meter and mixing tank are connected by inert pipelines to avoid material absorption. When it is being operated, the mixing tank is heated to promote better mixing and avoid high-carbon precipitation. Therefore, the proper concentration of standard gas can be obtained.
The other instrument was a humidity meter to add different humidities to the dry standard gases, aiming to simulate real ambient air. A moisture-resistant melamine faced chipboard (MFC) was used to control the flow of water vapor, and the added water volume per hour was calculated using the following equation:
Q is the water content added to the dilution gas at a certain temperature and humidity (g h−1), p is the moisture content per cubic meter at a certain temperature and relative humidity (g m−3), and q is the dilution gas flow (mL).
2.2 Laboratory testing
Laboratory evaluations were conducted in Shanghai. The concentrations of the target standard gases were controlled and mixed using a dynamic dilution calibrator (D3000). The concentrations involved in the test were converted into the concentration of carbon according to HJ/T38-1999 (stationary source emission – determination of non-methane hydrocarbons – gas chromatography). All devices were warmed up for 24 h and remained stable before conducting the test.
First, we used an external standard method to quantify methane and NMHCs by diluting the standard gas of methane and propane with highly pure nitrogen. The average of three stable values for each concentration was selected, and the corresponding concentration standard curve was obtained based on the mean value of the peak area (methane: 0.5, 1, 2, 3 and 4 ppm; propane: 0.05, 0.2, 0.4, 1 and 4 ppm C). To ensure the qualitative and quantitative accuracy of subsequent experiments, we needed to ensure that R2 was >0.999 and that the peak was normal. In the second step, we tested the FID with ethyl acetate, trichloroethylene and toluene (representing different components of VOCs) to determine whether there can be a normal response to FIDs. Third, humidity experiments were conducted to examine whether the instruments could be qualitatively and quantitatively accurate under highly humid conditions. The concentration of the calibration gas was constant, and the measurements were conducted under 40 %, 60 % and 80 % humidity conditions. Each standard gas was measured thrice, and the peak area and concentration were recorded separately. A humidification blank (zero gas) for each instrument was also measured. As the spectrogram of the indirect instrument contains an oxygen peak, we studied the effect of different oxygen contents (10 %, 20 % and 30 %) on the accuracy of NMHC concentrations. Finally, all the instruments monitored atmospheric NMHC concentrations for a long time under the same conditions to evaluate the comparability and consistency of the results. The real-time monitoring of NMHC values is considered to be credible only after the consistency of the measured atmospheric NMHC concentration meets the stipulated requirement.
According to the results of the indirect instruments, their accuracies were improved with the principle of direct measurement. Five low concentrations of gases (methane: 1, 1.5, 2, 3, and 4 ppm; propane: 0.05, 0.1, 0.2, 0.5 and 1 ppm C) were used to conduct calibrations, which was in line with the characteristics of NMHCs in the ambient air. The same experiments were conducted for the response factor and the impact of humidification.
In light of the laboratory results, four sets of equipment were used for the long-term operation of ambient air through the same glass sampling manifold under the same conditions to check the consistency of the atmospheric NMHC data. The relative standard deviation (RSD) was calculated to compare the data.
S is the standard deviation of the data, and is the average of the data.
3.1 Test results of instruments using the subtraction method
3.1.1 Low concentration
Figure 2a and b present the curves of CH4 and total hydrocarbons (THCs) for A and B. The R2 values of linear regression values were all above 0.999, indicating that the integral areas of the peaks were proportional to the concentrations of the target compounds for A and B. Figure 2c shows that, as the propane concentration increased, the accuracy of NMHCs measured by A and B also increased. When the propane concentration was 50 ppb C, the errors were 32 % (A) and 98 % (B). The concentration of NMHC in the instrument using the subtraction method was obtained from the measured THC concentration after subtracting the methane concentration. Assuming that there was 1 % random error in the 2050 ppb C and 2000 ppb of THC and methane measured using an instrument after subtraction, the extreme error of 50 ppb C NMHC was 40 ppb C. The error presented by low NMHC concentrations will inevitably be larger than that presented by high NMHC concentrations based on the principle of subtraction. This indicates that the instrument using the subtraction method is unsuitable for ambient air with low NMHC concentrations and is more suitable for areas with high NMHC concentrations, such as industrial parks.
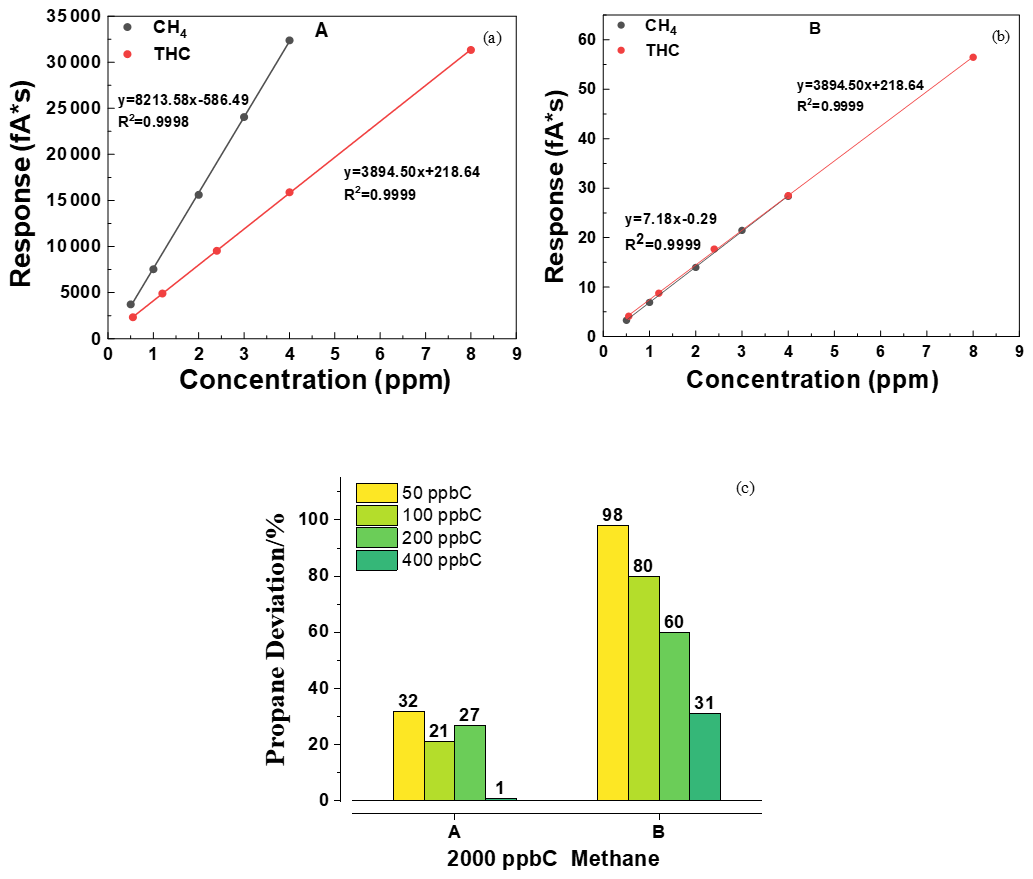
Figure 2(a) Calibration curves of CH4 and (b) THC. (c) Deviation of different concentrations of propane for A and B.
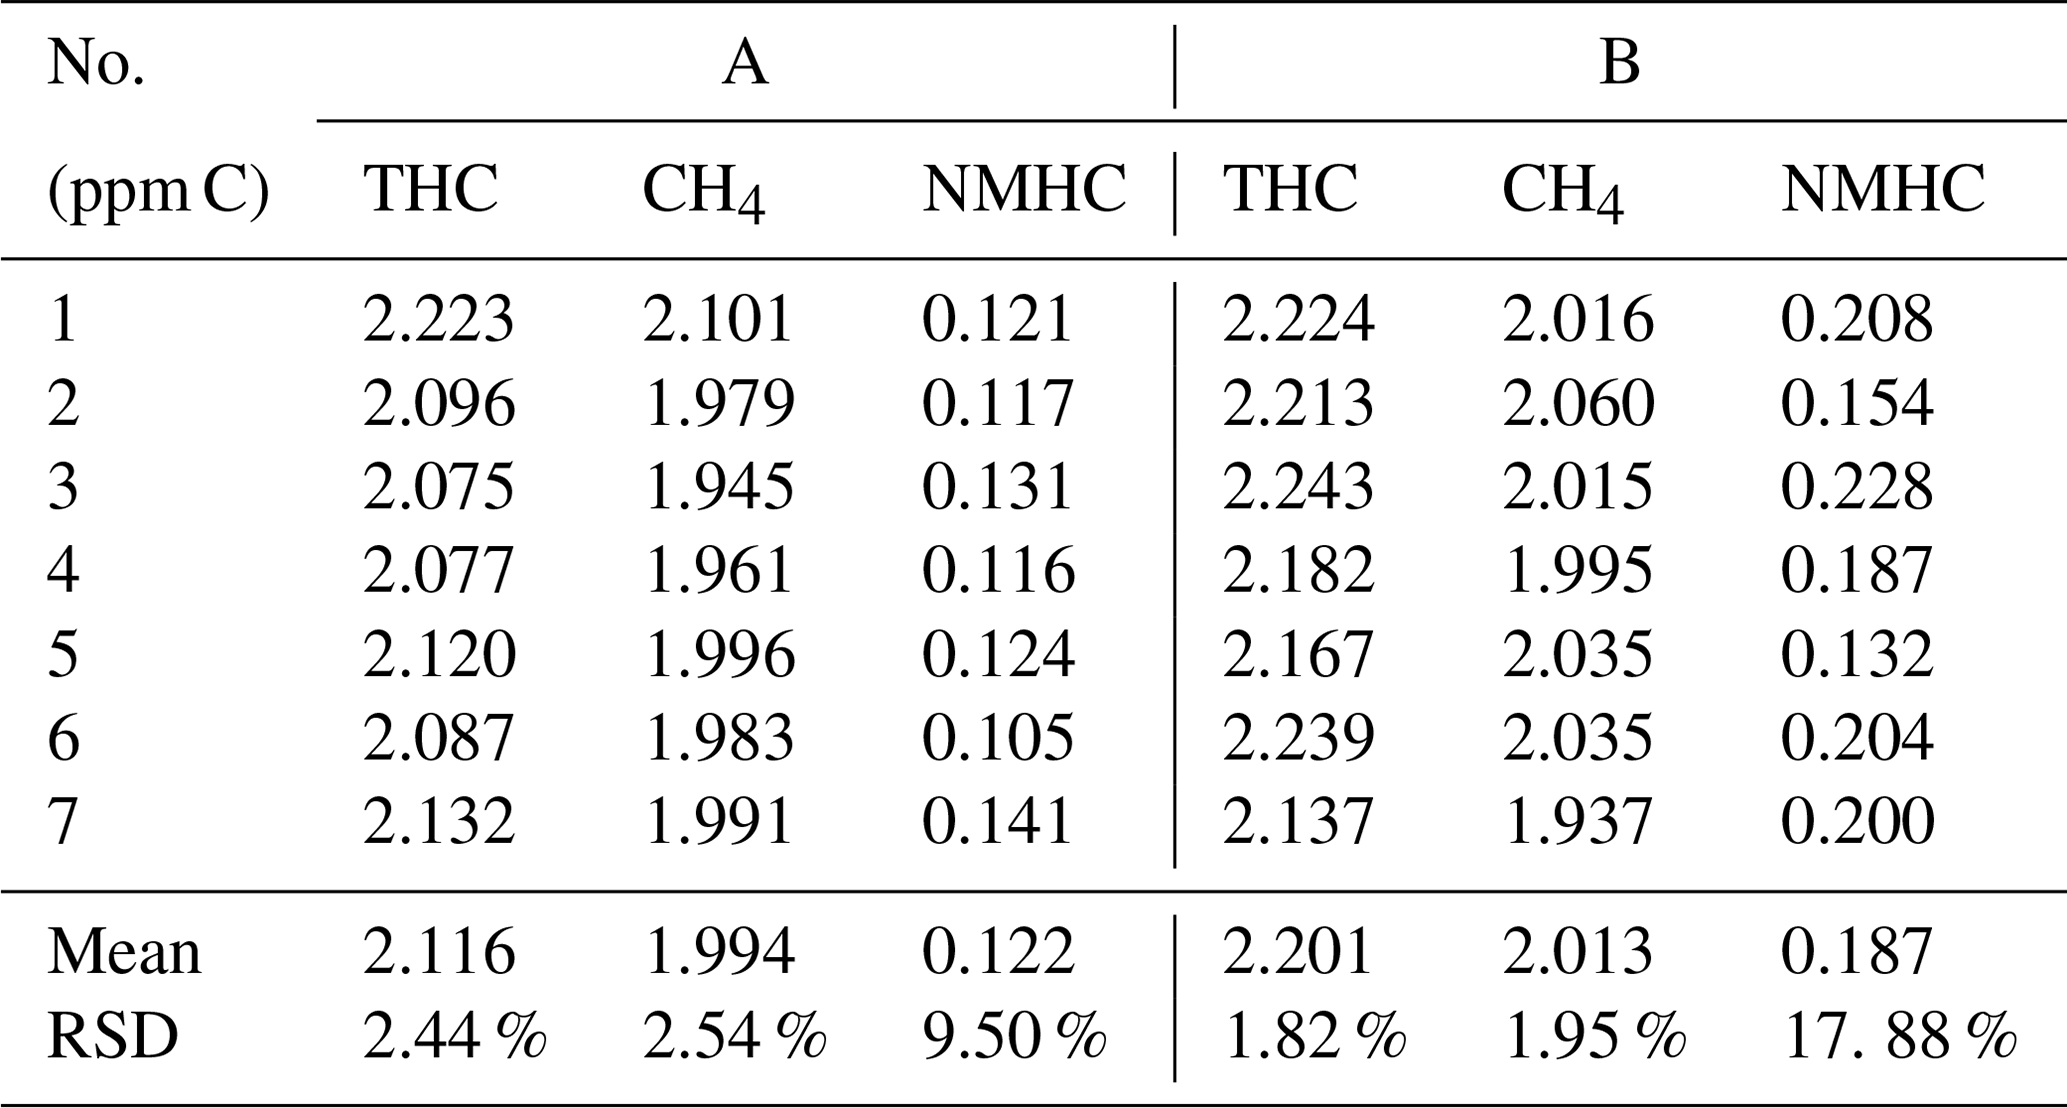
We selected the stable seven-group data and calculated the mean and RSD. At the beginning of the standard gas, because the gas enters the system to reach the detector for a certain amount of time, the data obtained are unstable and do not represent an accurate test value. For this purpose, we select the stable data at the beginning of the third cycle after passing the standard gas as the basis for statistical calculations. Generally, when the response concentration is close to the standard concentration (such as within the range of 2200 ± 100), seven consecutive data items are taken for calculation. As presented in Table 2, the repeatability of the THC and CH4 of A and B was approximately 2 %. However, the RSD of NMHC was greater than 9.5 %, which was caused by the instability of THC and CH4 and the principle of subtraction error. This is consistent with the results shown in Fig. 2c.
Table 2Repeatability results of instruments based on the subtraction method.
3.1.2 Oxygen interference
The concentrations of THC and CH4 were measured on the THC (with all substances) and methane columns, and the difference represented the concentration of NMHCs. An oxygen peak appeared when the carrier and diluent gases were nitrogen and air, respectively. Oxygen did not respond to the FID. While the chromatographic column sundered oxygen and methane from air, oxygen molecules entering the detector destroyed the original balance of the flame, causing an interference peak. Owing to the different carrier gas types, oxygen in the zero and sample gases on the THC column had a response, which could allow us to deduce the interference of the oxygen in the sample in determining the THC concentration.
We assumed that the measured THC concentration in the zero gas was fixed and used it as the intercept; it was subtracted from the THC concentration sample gas to obtain the accurate THC concentration. We conducted an experiment to investigate the above. For the same concentration of calibration gas, the oxygen content increased, and the response of the instrument using the subtraction method to NMHCs also increased. Wang et al. (2009) found that the area of the oxygen peak is directly proportional to the oxygen content in the gas sample. We found that the increase in oxygen content had a more significant impact on the measurement of oxygen-containing substances than on that of hydrocarbon substances (Fig. 3). The response with 30 % oxygen content was as high as 36 % compared to that with 10 % oxygen content. These results indicate that the THC value in the zero and sample gas was not fixed, causing an error as a fixed intercept in the subtraction method.
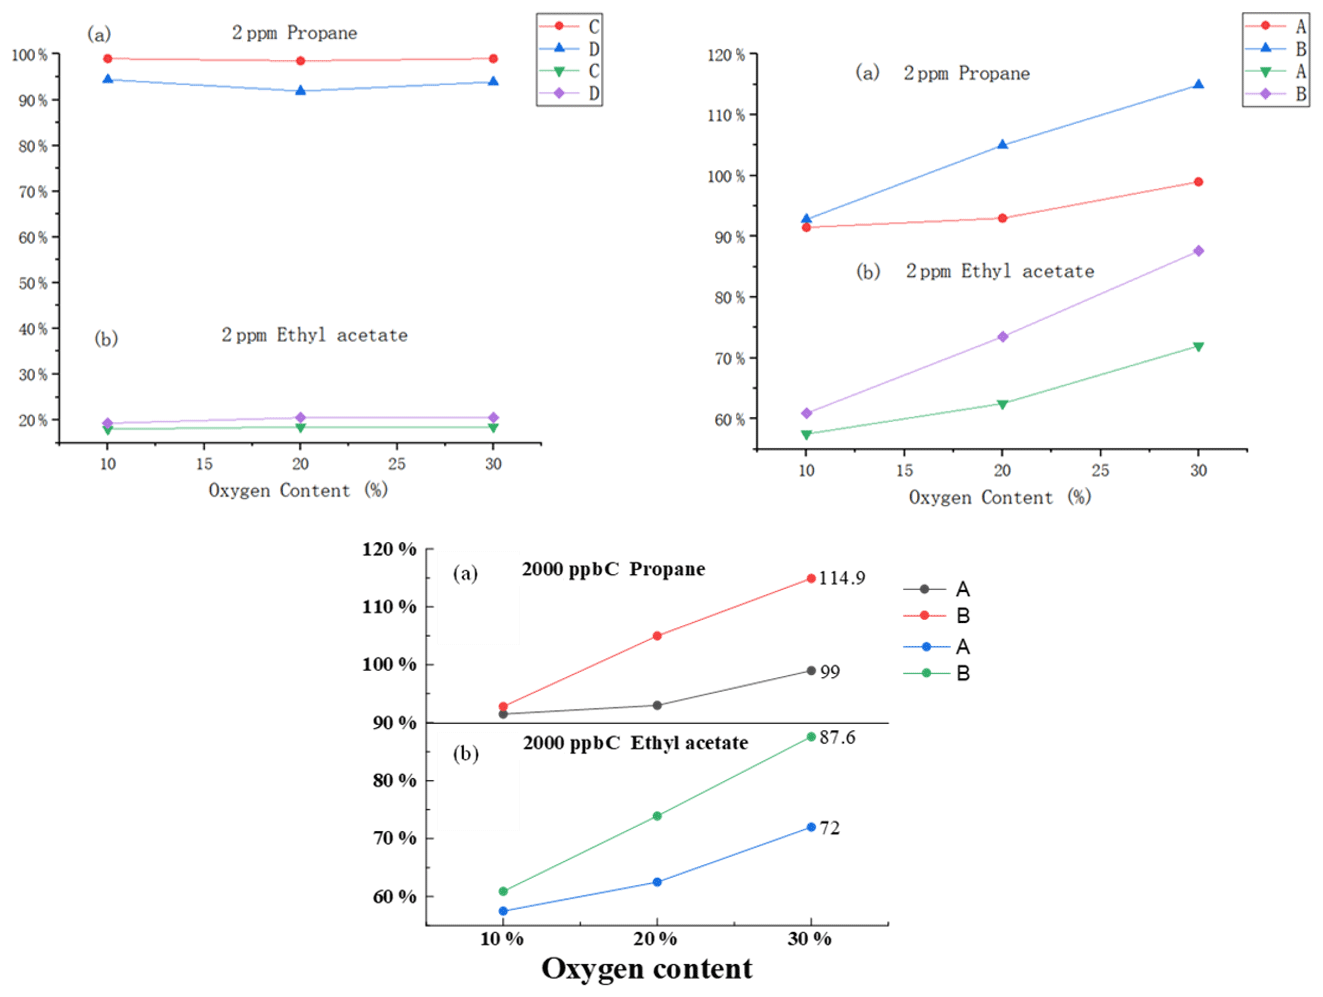
Figure 3The effect of different oxygen contents on (a) propane and (b) ethyl acetate for A, B, C and D.
In view of the effect of oxygen content in the sample gas on the determination, we carried out the following experiments (for the difference subtraction method and the direct test method, the test was carried out simultaneously): different oxygen content and the same concentration of 2 ppm propane in the instrument and different oxygen content and the same concentration of 2 ppm ethyl acetate in the instrument. The results showed that the direct-measurement method is basically not affected by oxygen content, and the difference subtraction method is greatly affected by oxygen content and has poor consistency. With the increase of oxygen content, the recovery rate of the difference subtraction measurement value increased, and the two were not proportional. Some instrument test results have increased more, and the recovery rate exceeds 100 %. The specific reason is unknown. The preliminary judgment is that, after a large amount of oxygen enters the FID, the oxidation of the flame is improved, resulting in more complete combustion of organic matter, improving the response of the assay and leading to an increase in recovery. As presented in Table 3, this table shows the recovery rates for each instrument with different oxygen levels of 2 ppm propane and ethyl acetate. With the increase in oxygen content, the results of the two subtractive instruments increased, while the results of the two direct-measurement instruments were basically not affected by the change in oxygen content. With the increase in oxygen content, the consistency of the two subtraction instruments decreased, while the data of the two direct-measurement instruments were basically consistent. There are many methods for deducting oxygen peaks by subtraction instruments, mainly including deduction of the fixed peak area and deduction of the oxygen peak area on the current circulating methane column; there is also the direct use of zero gas as the carrier gas to eliminate oxygen peaks. At present, there is not much data on the difference subtraction method; in addition, we believe that, after a large amount of oxygen enters the FID, the oxidation of the flame is improved, resulting in more complete combustion of organic matter, and this will also improve the response. Although oxygen levels vary around the world, they are small and stable over a small area and can be removed as systematic errors as long as they are calibrated.
Table 3The recovery rates for each instrument with different oxygen levels of 2 ppm propane and ethyl acetate.
A and B are the subtraction method, and C and D are the direct method.
Oxygen has a significant effect on FID determination. The FID uses air as an auxiliary gas in which oxygen is theoretically unresponsive. The oxygen peak occurs because, when the chromatographic column separates the air, oxygen and methane are separated. Oxygen molecules enter the detector before methane, destroying the original balance of the FID flame and producing signals, which is actually an interference peak. In the process of the differential subtraction, the oxygen peak in the sample is included in the peak of the total hydrocarbon. At the same time, the oxygen in the sample formed an oxygen-rich combustion environment in the FID, which improved the total hydrocarbon response. Therefore, the value of the oxygen peak must be deducted. In terms of different instrument manufacturers, the differential subtraction method to subtract oxygen peak is inconsistent, which reduces the comparability and accuracy of data. However, the direct-measurement method is not interfered from oxygen in the sample gas in principle.
3.1.3 Influence of humidity and response factor
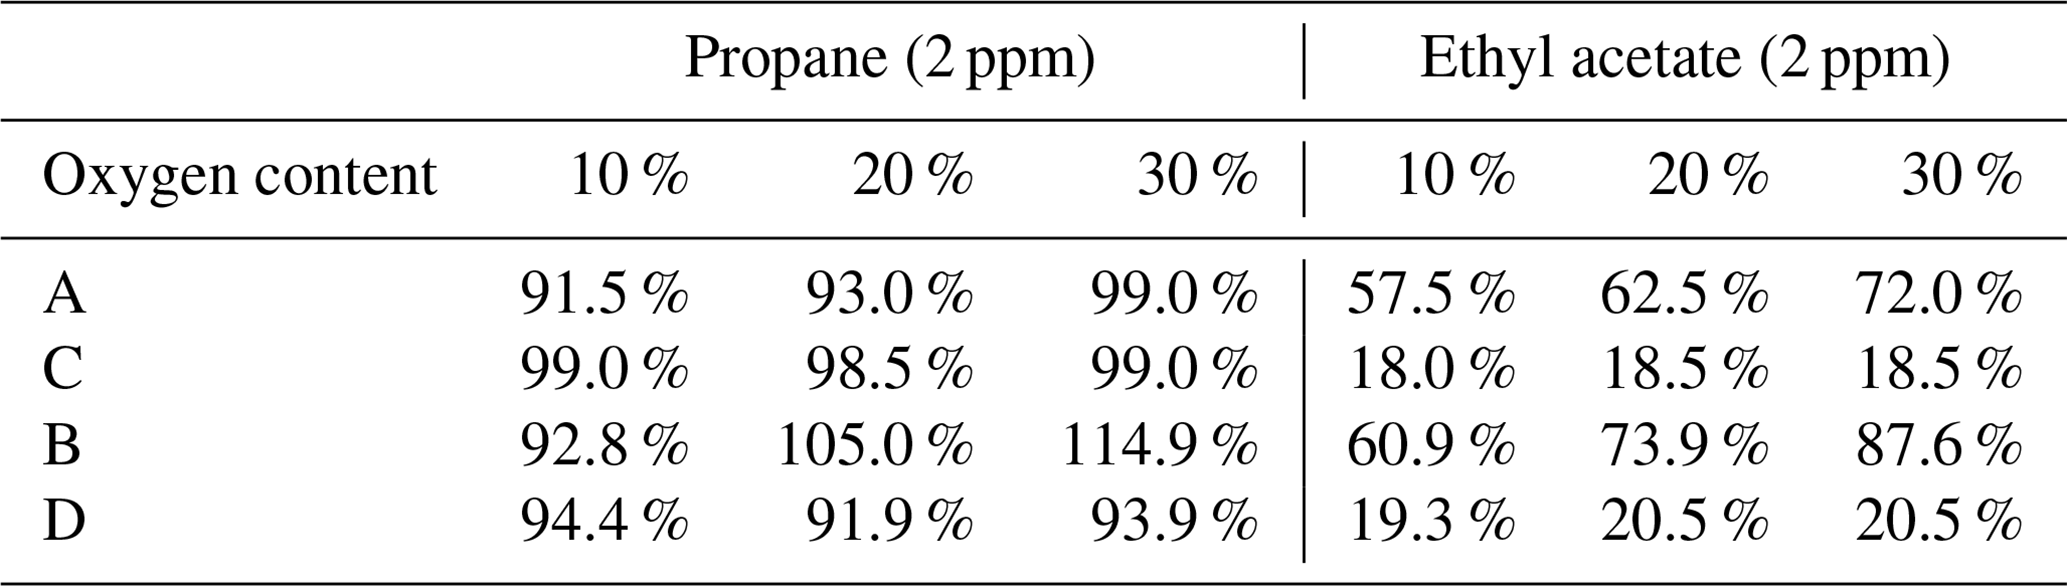
Figure 4 shows the effects of different water contents in zero, low and high standard gas on FID. Although instruments A and B did not respond for dry zero gas, instrument A had a response of 90 ppb C in terms of NMHCs when a certain amount of moisture was introduced. The blank value increased simultaneously but not linearly as the RH increased, indicating that humidity could affect instrument A. For the southern regions, where the air humidity is relatively high, the NMHC concentrations in ambient air measured with instruments using subtraction are not inaccurate. There was a certain difference in the responses of A and B to the high- or low-concentration standard gas containing humidity, indicating that RH had a significant and different influence on the measurement of low-concentration NMHCs for days, up to a response of nearly 50 %. This resulted in a huge error. In comparison, RH had a relatively small influence on the measurement of high-concentration NMHCs, mostly within ±8 %. Therefore, for ambient air, the RH is another possible cause of error. Additionally, we also analyzed the influence of humidity on the FID response of different kinds of substances. RH had little effect on the measurement of propane and trichloroethylene but a significant effect on that of ethyl acetate, and it reduced the response by up to 30 %, indicating that oxygen-containing substances would be affected more. Therefore, it had a greater impact on hydrophilic substances rather than hydrophobic substances.
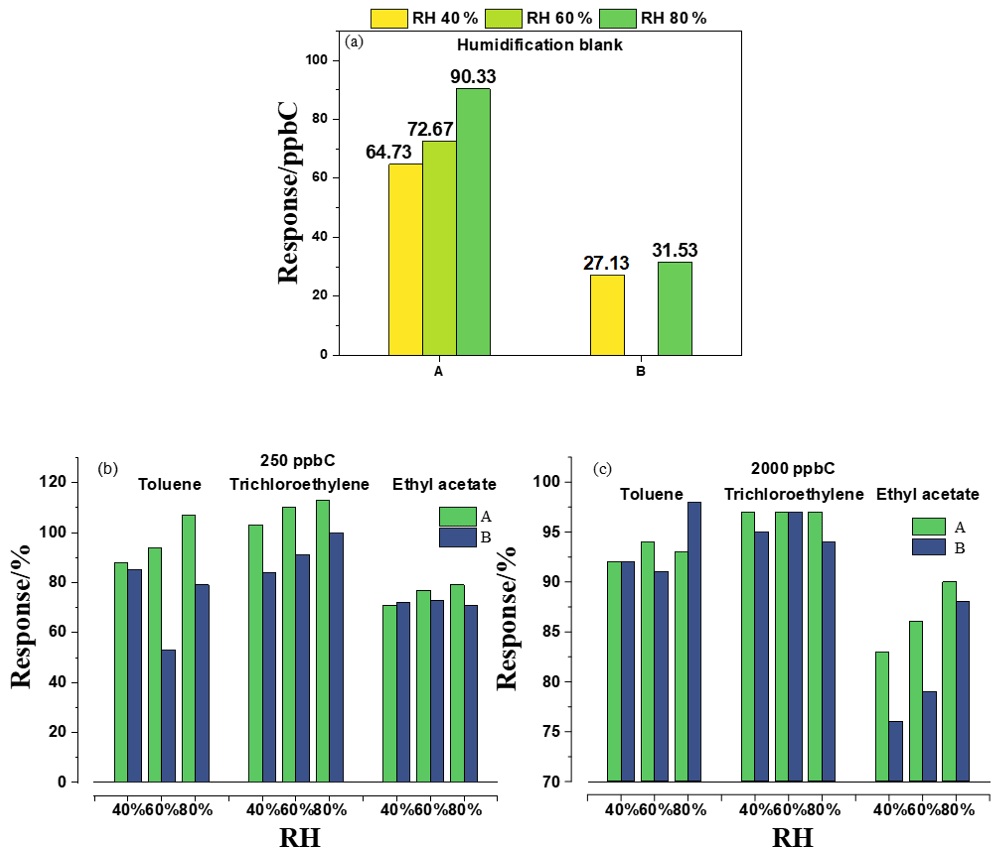
Figure 4The effect of different RHs on (a) zero gas, (b) 250 ppb C standard gas and (c) 2000 ppb C standard gas for A and B.
Humidity, the water in the air, also has a great influence on the accuracy of non-methane hydrocarbon determination. Water is the product of FID combustion. Small amounts of water generally do not respond to the FID, but large amounts do. Water also changes column efficiency and the peak shape of other substances. Due to the existence of moisture in the actual air, the use of dry standard gas calibration will affect the measurement effect of the actual sample. The accuracy of non-methane determination can be improved by applying humidification standard gas. If only considering the measurement effect, the direct-measurement method using low-temperature preconcentration is a better solution.
3.1.4 Accuracy analysis and evaluation of the uncertainty of measurements
The total NMHC concentration using the indirect method was obtained by subtracting the methane concentration from the measured THC concentration. The concentrations of THCs and methane were 1 order of magnitude higher relative to those of NMHCs. Small errors in the determination of THC and methane concentrations had a significant impact on the NMHC concentration. Based on the actual concentration levels in the urban air, assuming a THC concentration of 2.5 ppm, the standard instrumental measurement error was 2 %, with an error value of ±40 ppb. Additionally, with a methane concentration of 2 ppm, if the measurement error was also 2 %, the error value would also be ±40 ppb. The two numbers were subtracted, and an error of ±80 ppb was obtained, which is approximately at the same level as that in the NMHC concentration in ambient air. Therefore, the method of subtracting big data from big data does not provide accurate NMHC concentration data. To verify the principal error of the instrument, we evaluated the measurement uncertainty of the calculation model based on some standards. However, the results showed that the relative uncertainty (17.2 %, k=2) of the NMHCs far exceeded one-third of the technical requirements for the accuracy of methane measurements (10 %). According to the requirements of the measurement technical specifications, the uncertainty of the measurement results should be less than one-third of the accuracy of the measuring instrument. This indicates that the indirect-measurement method has great uncertainty and should not be recommended as the optimal method for measuring NMHC concentrations.
3.2 Test results of instruments using the direct method
According to the monitoring demand of low concentrations of NMHC in urban environments, the indirect method is affected by oxygen peaks, water vapor and calculation rules, and it is not possible to obtain accurate measurements and lower detection limits. For this purpose, technology research and development focus on the direct-measurement methods. All instrument manufacturers have carried out the development and upgrading of novel technical routes. Through years of efforts, a total of three categories and five technical routes have emerged.
-
The first category is based on the NMHC airflow counter blowing technology (Trubyanov et al., 2016; Wang et al., 2002), including two paths: single- and multiple-column adsorption methods. The system is simple, and the analysis speed is fast with a single column of the direct method. Because of the presence of the damping column, the chromatogram has no obvious valve-switching peak, and the data are accurate and stable. However, the NMHC components flow forwards and then backwards in the column, resulting in peak broadening (secondary broadening) affecting the integration. The detection limits of both methods are not low.
-
The second category is adsorbent pre-concentration technology (Chowdhury et al., 2022), which meets the need for a progressively decreasing NMHC concentration that can be monitored in ambient air with a lower detection limit. The technical route includes two methods: normal-temperature preconcentration and low-temperature preconcentration. In terms of the normal-temperature preconcentration method, adsorbent containing a thermal desorption device is connected to the FID detector. Methane is not adsorbed during sampling, and the adsorbed NMHC components during desorption are directly burned in the FID to form NMHC peaks for measurement. The advantages are that the structure is simple, and no column is required. However, it is necessary to strengthen the study of the influence of adsorbent on the adsorption efficiency, thermal desorption temperature and flow rate of different substances. In order to improve the adsorption of C2, the low-temperature-preconcentration method adds a cold trap to improve the adsorption effect of the sample gas through the low-temperature adsorbent. The advantage is that the detection limit is lower, and the disadvantage is that the analysis time is longer.
-
The third category is in a cryogenic environment (Wang et al., 2012); the vacuum sampling tube for the preconcentration of direct-measurement method is adopted. The enrichment temperature is 130 ∘C below zero. The advantage of this method is that the adsorption effect and peak shape are ideal, but the disadvantages are that water is easy to freeze, which will block the flow path at low temperatures, and the cutting valve in different states affects the baseline so it is necessary to optimize the design of the system.
Four different instruments from four manufacturers completed the improvement in time. The four instruments used the first and second categories of the methods described above. Through the field test of about 2 months, from October to December 2020 (Fig. 8), it is shown that the mean values of the four products are basically the same, and the statistical values of the test data are basically similar. The hourly average RSD for the four instruments was 0.0199, and the daily average was 0.0313.
3.2.1 Lower concentration, accuracy and detection limit
Similarly to Fig. 2, Fig. 5 shows the curves of CH4 and NMHCs for C–J. The R2 values of the linear regression were all above 0.995, providing a good foundation for subsequent quantitative testing. H is based on the principle of catalytic oxidation, which can solve the problem of inconsistent response coefficients of different groups to the FID, and is introduced into a low- and high-concentration standard gas to check and standardize the H value of the instrument before the test.
Figure 5Calibration curves of (a–e) CH4 and (f, g) THC. Accuracy of different concentrations of propane for C–J.
The calculated detection limits are listed in Table 4, where the detection limit of all instruments using the direct method was reduced to 20 ppb C, and some were even lower than 10 ppb C. This indicates that the instruments using the direct method are more suitable for NMHC measurements in ambient air.
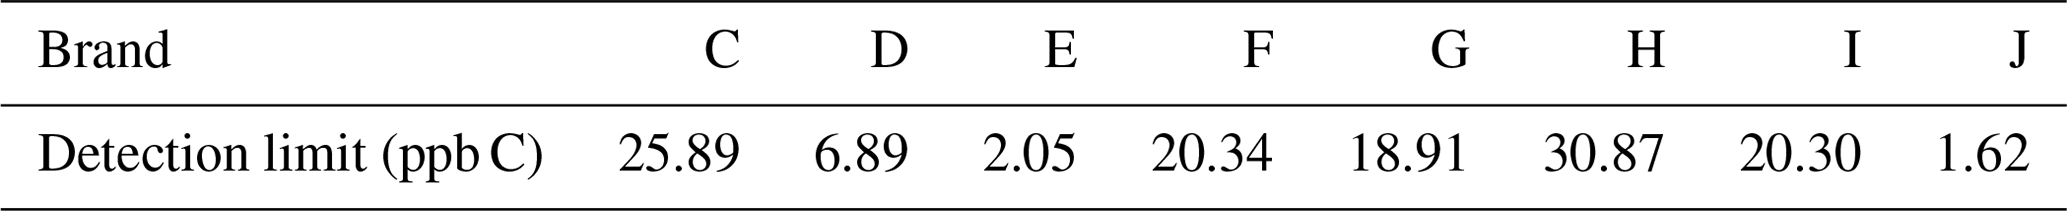
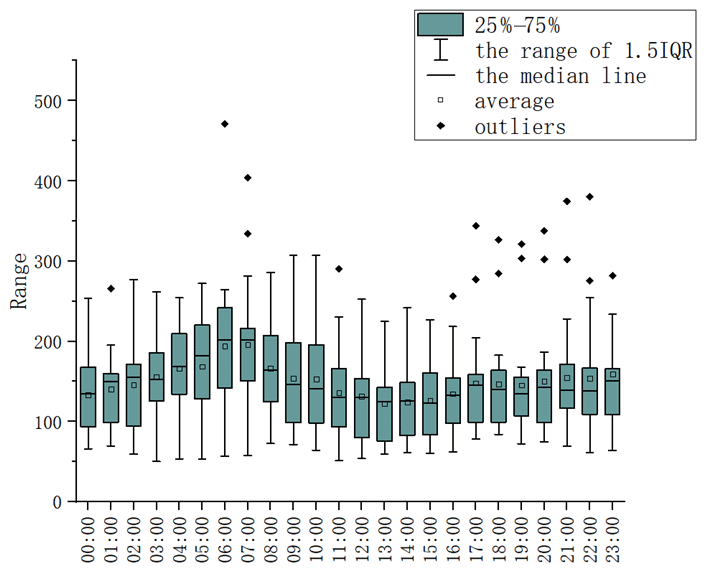
Figure 6The daily variation of NMHC in the context of meteorological characteristics under normal undisturbed and polluted conditions.
3.2.2 Response factor
Figure 7 shows the responses of the zero gas, the different concentrations of standard gas with 60 % RH and the dry standard gas to the FID. Except for instruments G and I, the response of the zero gas with 60 % RH to other instruments was less than 25 ppb C. The influence of humidity in this instrument was greatly reduced compared to that in instruments A and B. The result of the standard gas was the same, and it was significantly different compared to that of instruments based on subtraction. For C–J, the response of the FID did not change much based on whether the standard gas was humidified or not.
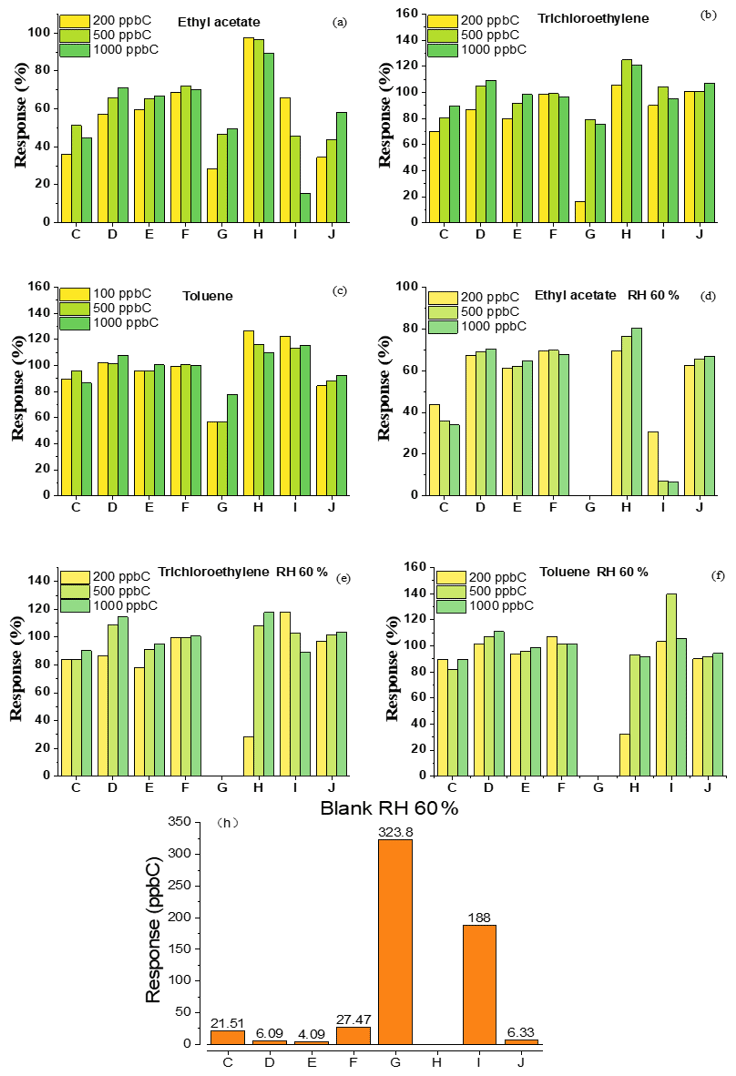
Figure 7Response of different concentrations of (a–c) dry standard gas, (d–f) wet (RH 60 %) standard gas, (h) wet blank (RH 60 %) for C–J.
3.3 Analysis of NMHC in the ambient air
Based on a series of problems found in the above experiments, such as large number minus large number, the interference of oxygen determination and the interference of water vapor determination, and to ensure the accuracy of measurements, we excluded the equipment of the indirect method at first. Subsequently, due to the catalytic method, the catalyst for the low concentration of the non-methane catalytic efficiency instability was also excluded. The direct-method instrument entered our second round of testing and mainly experienced two types of technical optimization. The first was to change the enrichment and limiting holes and to improve the determination accuracy. In the second process, the columns were specially designed to meet the needs of low-concentration determination. Through method optimization, the test effect was further improved.
The data for the concentration of NMHC in the Shanghai urban area during the winter of 2020 are shown in Figs. 8e, f and 9, measured by the equipment that showed the best performance in our test. The observation equipment used in Shanghai Caojing Station has a time resolution of 1.5 min, and the observation equipment used in Shanghai Zhelin Station has a time resolution of 1 min. The technology used by the equipment is adsorbent pre-concentration technology with a low temperature. The average of the hourly data was 163.1 ppb C, and the median value was 149.2 ppb C; the average of NMHC every 15 min was 124.3 ppb C, and the median value was 102.6 ppb C. Notably, the minimum value of 42.8 ppb C occurred at 12:15:28 local time (LT; the time zone for all instances in the text is LT) on 15 November 2020, when the air quality index (AQI) was 37, which was described as excellent. The maximum value in the entirety of the data was 562.3 ppb C, which occurred at 14:20:14 on 23 November 2020; however, the AQI at that time was 32. The ratio of the maximum and minimum value in one day reached 9.56 on 23 November 2020. On this day, the maximum (562.3 ppb C) and minimum (58.9 ppb C) values occurred at 12:15:28 and 00:40:00, respectively. The absolute value of the difference between the maximum and minimum data was 503.4. Thus, high precision of NMHC measurements is necessary. According to meteorological data from the national urban air quality real-time release platform, the average values of PM2.5, O3, NO2 and AQI at the Xuhui Shanghai Normal University Station from 12:00 to 13:00 were 15, 58, 23 and 29 mg m−3, which were basically within the normal range. We considered it to be the case that the occurrence of nearby short-time emissions at that period of time, such as from painting, led to the abnormal fluctuation of NMHCs. The majority of results for NMHCs in the ambient air were between 60 and 240 ppb C, and the lowest value that could be recorded by instruments was 42.8 ppb C in the results collected every 15 min. The hourly value above 300 ppb C in the hourly data occurred only 56 times, implying that a daily average concentration over 300 ppb C was rare. This indicates that the direct-measurement method is completely suitable for measuring low-concentration atmospheric NMHCs. The NMHC data of several instruments were consistent when the NMHC concentration in the air was relatively high. The statistical analysis of NMHC data during this period shows that the hourly and daily average values of NMHCs were similar (Fig. 6).
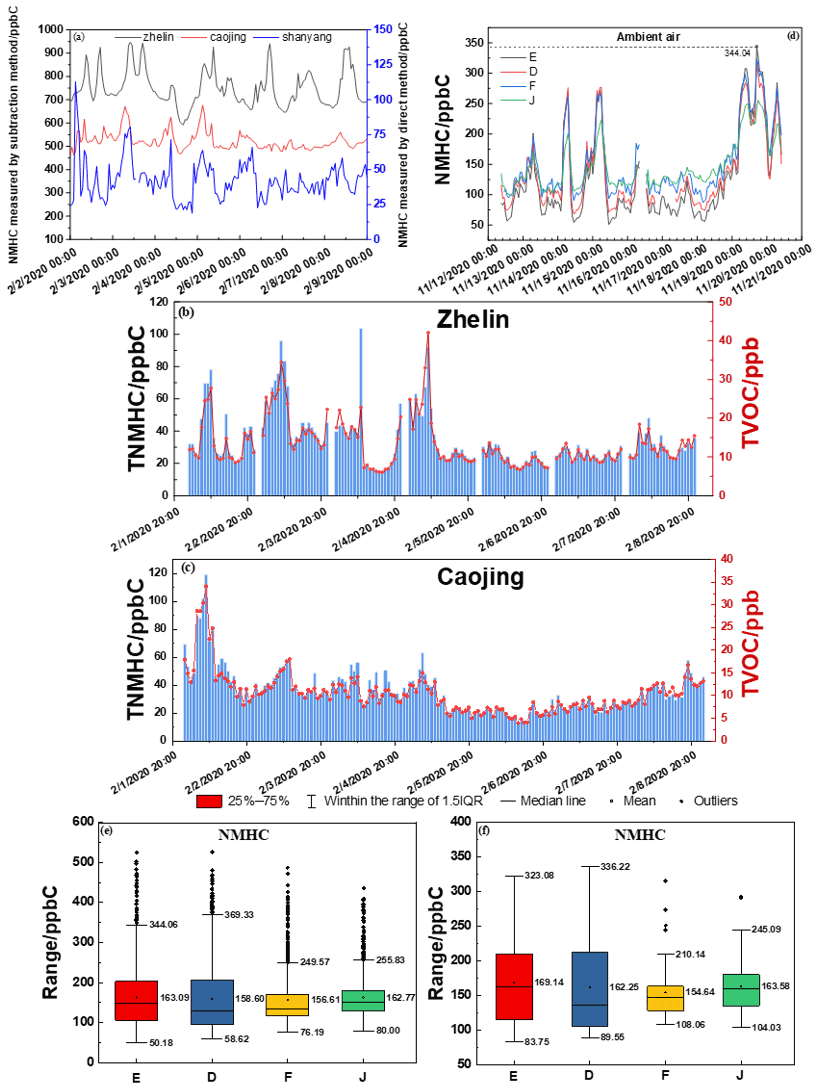
Figure 8Hourly time series diagram of NMHCs in the ambient air measured with instruments using (a) the subtraction method at three sites and (d) the direct method during the 2020 Spring Festival. Hourly time series diagram of TVOCs and the total NMHCs calculated by (b) 106 kinds of VOCs and (d) 56 kinds of VOCs (PAMS) in online GC-MS; statistical analysis of the (e) hourly averages and (f) daily averages of NMHCs in the ambient air using the direct method.
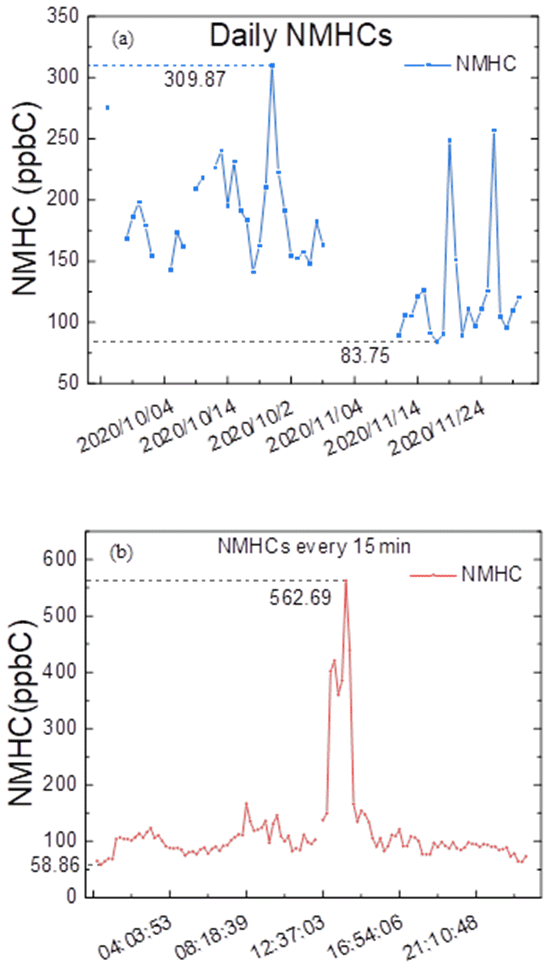
Figure 9Daily average concentration of NMHCs and that every 15 min on 23 November 2020 measured using the direct method.
NMHCs contain a large number of VOCs, and systematically measuring them is difficult. As C2 is difficult to capture, high-carbon substances are easily adsorbed. Further studies are required to evaluate the response of C2 and high-carbon substances to the FID based on the principle of the direct method.
The definition of NMHCs has been expanded to determine whether the original design of NMHC instruments can be applied to measure the sum of the concentrations of more VOC components. The market is dominated by instruments using the indirect method, and we evaluated whether the principle of the indirect method was affected by the quantity of gas. We also found that the dry standard gases were used for all calibrations; these gases differed from the actual air content in the environment, thereby causing quantification errors. Based on the above problems, we tested existing instruments available in the current market.
In summary, 10 real-time monitoring NMHC instruments were tested, and the main problems in the experimental results were carefully analyzed by mainly focusing on the low concentration error, oxygen interference, humidity impact and response factor. The low concentration error and humidity affected the accuracy of the results, and the response factor sometimes did not meet the theoretical value. Therefore, we optimized and conducted an experimental program for the real-time monitoring of the NMHC instrument using the direct method. Moreover, changing the enrichment and specially designed columns further improved the test effect.
The observation in Shanghai continued for about 2 months. The average daily NMHC concentration was 162.6 ppb C, and daily NMHC values ranged from 83.8 to 309.9 ppb C. The hourly NMHCs over 300 ppb C only occurred 56 times in a total of 1035 results; meanwhile, the lowest and highest NMHC values reached 42.8 and 562.3 ppb C, respectively. The majority of the values ranged from 60 to 300 ppb C when the AQI was excellent. Through lab tests and field observations, we found that the results of all the indicators of instruments using the direct method were better than those using the subtraction method, and the instruments using the direct method could obtain scientific data. Therefore, the direct method was proven to be suitable for monitoring NMHCs in the ambient air.
The results of this study correct the measurement errors that have prevailed for many years. This study can lay a foundation for the evaluation of VOCs in the regional ambient air and provide a direction for the measurement of low-concentration ambient air pollutants. Due to many influencing factors, in the case of low concentrations of pollution, direct measurement is probably the best way to obtain data on the concentration of many complex pollutants in the ambient air and not just NMHCs.
All raw data can be provided by the corresponding authors upon request.
SG performed the conceptualization. YY, XT, YD and LL performed the investigation. SG performed the formal analysis. SG, YY, XT and CL performed the methodology. SG and LZ wrote the original draft. CL and QF performed the supervision. LM reviewed the paper draft. GT and QW participated in establishing the methodology and reviewed the paper draft.
The contact author has declared that none of the authors has any competing interests.
Publisher's note: Copernicus Publications remains neutral with regard to jurisdictional claims made in the text, published maps, institutional affiliations, or any other geographical representation in this paper. While Copernicus Publications makes every effort to include appropriate place names, the final responsibility lies with the authors.
The authors thank Weihao Wang, Chuanming Wei and Yuxin Xi for providing the text retouching and drawings.
This work was supported by the funding of the Shanghai Science Technology Plan Project (grant no. 22SQBS01000). This work was sponsored by the Belt and Road Initiatives International Cooperation Project of China (grant no. 20640770300). This research has been supported by the National Key Research and Development Program of China (grant no. 2022YFC3700400).
This paper was edited by Keding Lu and reviewed by two anonymous referees.
Ahmed, E., Kim, K. H., Jeon, E. C., and Brown, R. J.: Long term trends of methane, non methane hydrocarbons, and carbon monoxide in urban atmosphere, Sci. Total Environ., 518–519, 595–604, https://doi.org/10.1016/j.scitotenv.2015.02.058, 2015.
Atkinson, R.: Atmospheric chemistry of VOCs and NOx, Atmos. Environ., 34, 2063–2101, https://doi.org/10.1016/s1352-2310(99)00460-4, 2000.
Bai, W. T.: Discussion on Determination of Non-methane Source of Ambient Air and Fixed Contamination Source in Gas Chromatography, Science and Technology Consulting Herald, 13, 150–152, https://doi.org/10.16660/j.cnki.1674-098x.2010.13.072, 2010.
Baker, A. K., Beyersdorf, A. J., Doezema, L. A., Katzenstein, A., Meinardi, S., Simpson, I. J., Blake, D. R., and Rowland, F. S.: Measurements of nonmethane hydrocarbons in 28 United States cities, Atmos. Environ., 42, 170–182, https://doi.org/10.1016/j.atmosenv.2007.09.007, 2008.
Chang, M., Song, C., Liu, B. X., and Wu, H.: Inquiry of dual-channel double capillary column determination of non-methane total hydrocarbon analysis, Environ. Chem., 34, 1223–1226, 2015.
Chowdhury, A. R., Lee, T., Day, C., and Hutter, T.: A Review of Preconcentrator Materials, Flow Regimes and Detection Technologies for Gas Adsorption and Sensing, Adv. Mater. Interfaces, 9, 2200632, https://doi.org/10.1002/admi.202200632, 2022.
Coelho, M. S., Dominutti, P. A., Boian, C., dos Santos, T. C., Nogueira, T., de Sales Oliveira, C. A. V. B., and Fornaro, A.: Non-methane hydrocarbons in the vicinity of a petrochemical complex in the Metropolitan Area of Sao Paulo, Brazil, Air Qual. Atmos. Hlth., 14, 967–984, https://doi.org/10.1007/s11869-021-00992-1, 2021.
Fan, M.: Problems and Countermeasures of Determining the Non-Methane Total Hydrocarbons in Waste Gas by Gas Chromatography, Management and Technology of SME, 6, 140–141, https://doi.org/10.3969/j.issn.1673-1069.2019.06.072, 2019.
Hoerger, C. C., Claude, A., Plass-Duelmer, C., Reimann, S., Eckart, E., Steinbrecher, R., Aalto, J., Arduini, J., Bonnaire, N., Cape, J. N., Colomb, A., Connolly, R., Diskova, J., Dumitrean, P., Ehlers, C., Gros, V., Hakola, H., Hill, M., Hopkins, J. R., Jäger, J., Junek, R., Kajos, M. K., Klemp, D., Leuchner, M., Lewis, A. C., Locoge, N., Maione, M., Martin, D., Michl, K., Nemitz, E., O'Doherty, S., Pérez Ballesta, P., Ruuskanen, T. M., Sauvage, S., Schmidbauer, N., Spain, T. G., Straube, E., Vana, M., Vollmer, M. K., Wegener, R., and Wenger, A.: ACTRIS non-methane hydrocarbon intercomparison experiment in Europe to support WMO GAW and EMEP observation networks, Atmos. Meas. Tech., 8, 2715–2736, https://doi.org/10.5194/amt-8-2715-2015, 2015.
Huang, R.-J., Zhang, Y., Bozzetti, C., Ho, K.-F., Cao, J.-J., Han, Y., Daellenbach, K. R., Slowik, J. G., Platt, S. M., Canonaco, F., Zotter, P., Wolf, R., Pieber, S. M., Bruns, E. A., Crippa, M., Ciarelli, G., Piazzalunga, A., Schwikowski, M., Abbaszade, G., Schnelle-Kreis, J., Zimmermann, R., An, Z., Szidat, S., Baltensperger, U., El Haddad, I., and Prevot, A. S. H.: High secondary aerosol contribution to particulate pollution during haze events in China, Nature, 514, 218–222, https://doi.org/10.1038/nature13774, 2014.
Li, X. F. and Pan, N. M.: Discussion on similarity and difference between volatile organic compounds and non-methane hydrocarbons in atmospheric environmental impact assessment, Industrial Water & Wastewater, 44, 6–9, 2013.
Liu, C., Ma, Z., Mu, Y., Liu, J., Zhang, C., Zhang, Y., Liu, P., and Zhang, H.: The levels, variation characteristics, and sources of atmospheric non-methane hydrocarbon compounds during wintertime in Beijing, China, Atmos. Chem. Phys., 17, 10633–10649, https://doi.org/10.5194/acp-17-10633-2017, 2017.
Panopoulou, A., Liakakou, E., Gros, V., Sauvage, S., Locoge, N., Bonsang, B., Psiloglou, B. E., Gerasopoulos, E., and Mihalopoulos, N.: Non-methane hydrocarbon variability in Athens during wintertime: the role of traffic and heating, Atmos. Chem. Phys., 18, 16139–16154, https://doi.org/10.5194/acp-18-16139-2018, 2018.
Panopoulou, A., Liakakou, E., Gros, V., Sauvage, S., Locoge, N., Bonsang, B., Psiloglou, B. E., Gerasopoulos, E., and Mihalopoulos, N.: Variability and sources of non-methane hydrocarbons at a Mediterranean urban atmosphere: The role of biomass burning and traffic emissions, Sci. Total Environ., 800, 149389, https://doi.org/10.1016/j.scitotenv.2021.149389, 2021.
Shen, X., Zhao, Y., Chen, Z., and Huang, D.: Heterogeneous reactions of volatile organic compounds in the atmosphere, Atmos. Environ., 68, 297–314, https://doi.org/10.1016/j.atmosenv.2012.11.027, 2013.
Song, P., Geng, F.-H., Sang, X.-F., Chan, C.-Y., Chan, L.-Y., and Yu, Q.: Characteristics and sources of non-methane hydrocarbons and halocarbons in wintertime urban atmosphere of Shanghai, China, Environ. Monit. Assess., 184, 5957–5970, https://doi.org/10.1007/s10661-011-2393-z, 2012.
Thoma, M., Bachmeier, F., Gottwald, F. L., Simon, M., and Vogel, A. L.: Mass spectrometry-based Aerosolomics: a new approach to resolve sources, composition, and partitioning of secondary organic aerosol, Atmos. Meas. Tech., 15, 7137–7154, https://doi.org/10.5194/amt-15-7137-2022, 2022.
Trubyanov, M. M., Mochalov, G. M., Vorotyntsev, I. V., Vorotyntsev, A. V., Suvorov, S. S., Smirnov, K. Y., and Vorotyntsev, V. M.: An improved back-flush-to-vent gas chromatographic method for determination of trace permanent gases and carbon dioxide in ultra-high purity ammonia, J. Chromatogr. A., 1447, 129–134, https://doi.org/10.1016/j.chroma.2016.04.020, 2016.
Wang, C., Ji, X. T., Yan, X. M., Li, S. W., and Shang, Z.: Research on the Oxygen's Disturbance to the Analysis of Methane and Total Hydrocarbon, GuangZhou Chemical Industry and Technology, 37, 164–168, 2009.
Wang, H., Xu, H., and Guan, Y.: Column switching–back flushing technique for the analysis of aromatic compounds in gasoline, J. Chromatogr. A., 972, 253–258, https://doi.org/10.1016/S0021-9673(02)01090-7, 2002.
Wang, J. L., Chang, C. C., and Lee, K. Z.: In-line sampling with gas chromatography-mass spectrometry to monitor ambient volatile organic compounds, J. Chromatogr. A., 1248, 161–168, https://doi.org/10.1016/j.chroma.2012.05.091, 2012.
Wang, M., Shao, M., Chen, W., Lu, S., Liu, Y., Yuan, B., Zhang, Q., Zhang, Q., Chang, C.-C., Wang, B., Zeng, L., Hu, M., Yang, Y., and Li, Y.: Trends of non-methane hydrocarbons (NMHC) emissions in Beijing during 2002–2013, Atmos. Chem. Phys., 15, 1489–1502, https://doi.org/10.5194/acp-15-1489-2015, 2015.
Wen-qi, Q. I.: Determination Methods and Result Presentations of Nonmethane Hydrocarbon, Environmental Monitoring in China, 25, 30–31, 2009.