the Creative Commons Attribution 4.0 License.
the Creative Commons Attribution 4.0 License.
 | 05 Dec 2023
Thundercloud structures detected and analyzed based on coherent Doppler wind lidar
Kenan Wu
Tianwen Wei
Jinlong Yuan
Xin Huang
Gaopeng Lu
Yunpeng Zhang
Feifan Liu
Baoyou Zhu
Weidong Ding
The studies of intracloud discharges may shed light on the microphysical structure of thunderclouds, as both the magnitude and the sign of charge separation due to graupel collides with ice crystals within the strong updrafts are influenced by the surrounding environment. Here, a compact all-fiber coherent Doppler wind lidar (CDWL) working at the 1.5 µm wavelength is applied for probing the dynamics and microphysics structure of thunderstorms. Thanks to the precise spectrum measurement, multi-component spectra signals of thunderstorms can be analyzed by the CDWL. The spectrum width, skewness, and Doppler velocity of CDWL is used to separate and identify the particle composition and polarity. In the experiment, the thundercloud properties are detected by the CDWL, 10.6 cm Doppler weather radar (DWR), and Advanced Geosynchronous Radiation Imager (AGRI) onboard Fengyun-4 satellites. In particular, the spectrum width and skewness of the thundercloud below the 0 ∘C isotherm are increased, and when a cloud-ground lightning occurs, there is additional graupel with a velocity greater than 5 m s−1. It indicates that this region is a melting layer, and lightning activity changes the motion characteristics of graupel, affecting the charge structure of the whole thundercloud. In general, our findings provide details on the velocity, phase, and composition of particles in the outside updraft region of the thunderstorm. The identification and analysis of graupel is particularly important. It is proved that the precise spectrum of CDWL is a promising indicator for studying the charge structure of thunderstorms.
- Article
(4773 KB) - Full-text XML
- BibTeX
- EndNote


The co-development of precipitation particles and electric charge during the initial electrification of thunderstorms has been investigated for more than a century. Graupel particles are critically important in this process (Goodman et al., 1988). The electrification of thunderstorms first requires the existence of a mixed-phase updraft inside, resulting in ice–graupel collisions. Graupel gains charge in the presence of liquid water, which is called the non-inductive charging (NIC) mechanism (Jayaratne et al., 1983; Saunders, 2008; Takahashi et al., 2017). Larger cloud particles (graupel or hail) fall under gravity whereas smaller particles (ice crystals or small water drops) are transported in the updraft. These particles could affect thunderstorm structure, microphysics, and lightning activity under different environmental conditions (Carey and Rutledge, 2000; Carey and Buffalo, 2007; Fuchs et al., 2018; Bruning et al., 2007; Dye et al., 1989).
The NIC mechanism is thought to be primarily responsible for the thunderstorm discharges. The theory is based on experiments conducted in Japan by Takahashi (1978) and in the UK by Jayaratne et al. (1983). Observations revealed that the magnitude and polarity of the charging process depend on the water content of the cloud and the ambient temperature. During collisions graupel charges positively at higher temperatures, at both low and high water content, and it charges negatively at low temperatures and at intermediate water content (Takahashi, 1978). Consider a typical cloud with a liquid water content of approximately 1 g m−3, the positive charge center is located above the negative one, and the negative one is very shallow, approximately 1 km in thickness, and located in a region of −15 to −10 ∘C isotherm. Below the negative charge center is a small positive charge pocket (Cooray, 2015). As the graupel particles fall from greater heights through the clouds, they collide with ice crystals that are being carried upward in updrafts (Low and List, 1982; Hallett et al., 1978; Beard, 1976). If the temperature is below approximately −15 to −10 ∘C, the graupel particles charge negatively and the ice crystals positively. The light positively charged ice crystals travel upward along the updraft, leaving the positive charge at a higher location in comparison with the negatively charged falling graupel particles (Williams, 1989, 1988). As the graupel particles fall further, the temperature increases and the graupel particles start to charge positively. Thus, there is a region below the height of the isotherms −15 to −10 ∘C where graupel particles are positively charged. This is the basis of the positive charge pocket located below the negative charge center. This creates the observed tripolar structure of the cloud (Bruning et al., 2014, 2010; Williams, 1989, 2001). It also explains why the main negative charge center is located in the region of the −15 and −10 ∘C isotherm (Cooray, 2015).
The dependence of charge structures on cloud water content and ambient temperatures has sparked interest in detecting cloud environment changes in the mixed phase regions during whole storm processes (Bruning et al., 2010; Fuchs et al., 2018). In both observations and simulations, the supercell produced a complex evolution of charge structure, with six to seven different layers frequently existing to a relatively larger horizontal extent at different cloud water content and ambient temperatures (Calhoun et al., 2014). Some severe storms have a consistent dominant upper-level inverted dipole charge structure near the updraft, which has a low cloud liquid water content (Coquillat et al., 2022; Lang et al., 2004). Bruning et al. (2014) analyzed inverted polarity thunderstorms and showed that the variability in the NIC generation mechanism could continuously alter the electrification and charge structure in a strong updraft.
Lightning activity is closely related to thunderstorm structural parameters (Cheng et al., 2022; Sun et al., 2021). The spatial and temporal details of the area participating in lightning discharges in the cloud are still being revealed. For example, most of the stratiform lightning are closely related to the melting layer (F. Wang et al., 2019). During the Mei-yu period, strong updrafts transport supercooled liquid water into the mixed phase region between 0 and −10 ∘C levels and produce cloud-ground (CG) lightning (Yang et al., 2022). The distribution of lightning relative to altitude and radar reflectivity varies with lightning and storm type (Mecikalski and Carey, 2018).
However, knowledge of the electrification process and life cycle in thunderstorms is still limited. Using the very high-frequency source emissions detected by the lightning mapping array, the polarity, height, and thickness of vertical charge distribution are estimated (Medina et al., 2021; Fuchs et al., 2015, 2016; Lang and Rutledge, 2011; Zhang et al., 2022; Figueras i Ventura et al., 2019a; Erdmann et al., 2020). Satellites are widely used to study the effects of ice processes on the microphysical, dynamic, and thermodynamic development in mixed-phase clouds and their interactions with aerosols (Chen et al., 2020; Zhang et al., 2022; Sassen and Wang, 2008; Khanal and Wang, 2018). Radars play an essential role in hydrometeor identification and calculation of microphysical properties in all storms (Fan et al., 2018; Stough et al., 2021; Li et al., 2020; H. Wang et al., 2022). At present, high-resolution severe storm observations obtained by vehicle-mounted mobile X-band dual-polarization radar are widely used in severe storm structure and dynamics studies (Zhao et al., 2020; Stolzenburg et al., 2015; Qie et al., 2021; Figueras i Ventura et al., 2019b). Moreover, the combination of polarization lidar and other radar has been employed to investigate classification methods for clouds and precipitation particles (Baars et al., 2017; Bian et al., 2023; Wang et al., 2020). Observed thunderstorm charge structures are often varied and complex in time and space. More detection methods need to be developed to obtain details of the cloud phase transformation, ice crystal evolution, and charge transfer with high spatial and temporal resolution.
In this study, a coherent Doppler wind lidar (CDWL) system is used to detect and analyze the development of thunderstorms over Hefei, China. The CDWL, as an active optical remote sensing instrument, measures the radial velocity accurately. It has been applied for research on the atmospheric boundary layer height (C. Wang et al., 2019b; Wang et al., 2021), gravity waves (Jia et al., 2019), turbulence (L. Wang et al., 2022; Smalikho and Banakh, 2017; Banakh et al., 2021), wind shear (Yuan et al., 2020, 2022a), precipitation (Wei et al., 2019, 2021), air pollution (Yuan et al., 2022b), and bioaerosol transport (Tang et al., 2022). Recently, the CDWL has been extended to simultaneously detect the aerosol and melting snow signals of a melting layer (Wei et al., 2022) and the cloud water/ice signals during cloud seeding (Yuan et al., 2021). It provides high spatial and temporal resolution results of atmospheric composition by the deep analysis of the power spectrum. The CDWL can detect cloud environments, reflect cloud phases and has the potential to detect the intracloud (IC) charge structure in the thunderstorm through accurate spectral measurements; thus, it can be developed as a new instrument for thunderstorm detection.
This article is organized as follows: the instruments and datasets are described in Sect. 2. Section 3 introduces the CDWL products derived from power spectrum. It also provides a detailed description of the composition identification algorithm for particles inside thunderclouds. Section 4 presents the observation results from CDWL, FY-4, and DWR. Through the deep analysis of the power spectrum, the distribution of different particles in the thundercloud and the velocity change of graupel during the lightning detected by CDWL are discussed. Finally, a conclusion is drawn in Sect. 5.
2.1 Ground-based instruments
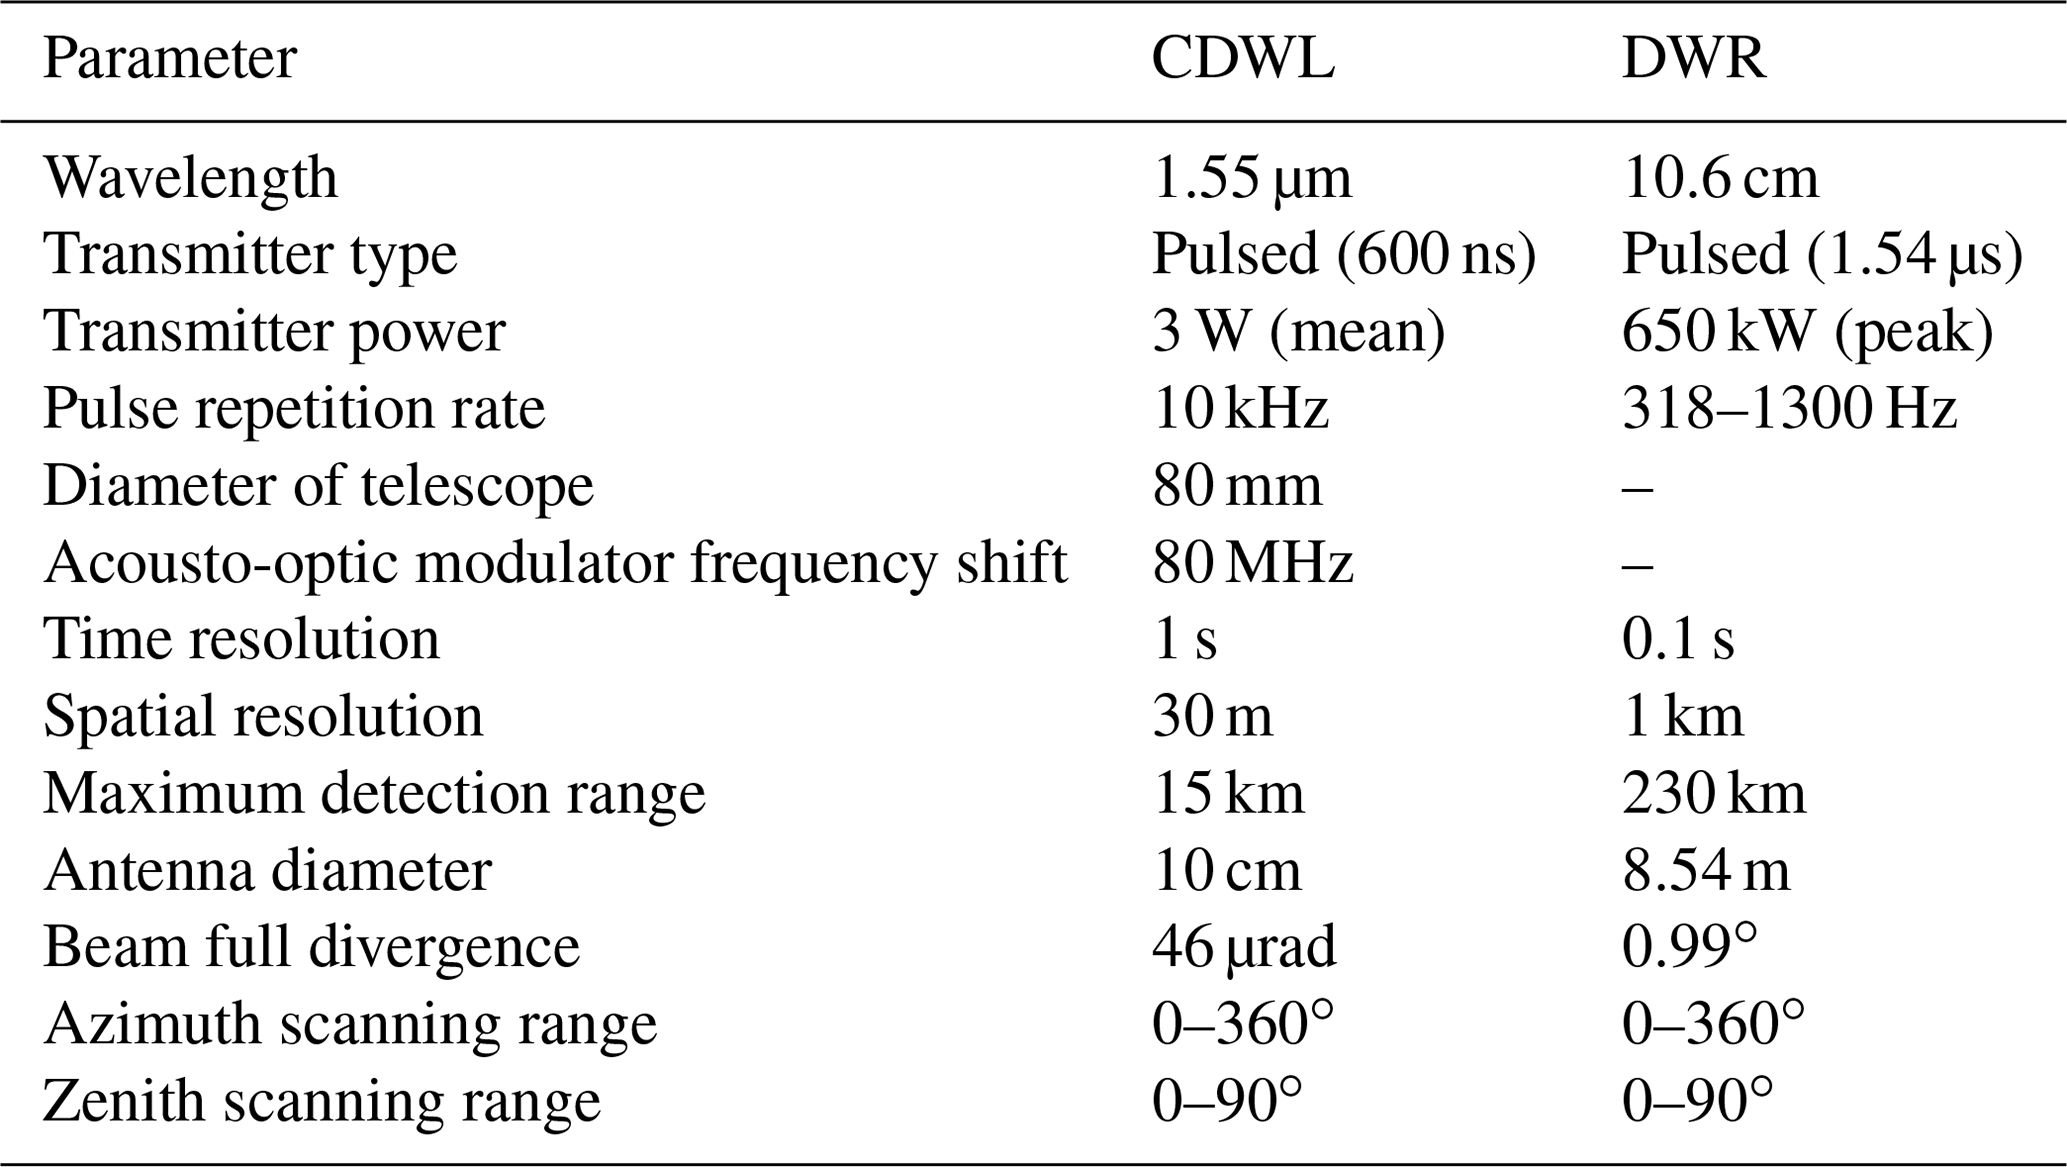
The datasets from two ground-based remote sensing instruments are utilized in the study. The CDWL is installed on the roof of a 63.8 m-high building (31.841∘ N, 117.270∘ E) on the campus of the University of Science and Technology of China (USTC). The Doppler weather radar (DWR) is located 3.5 km away in the northwest. The two instruments are shown on the right of Fig. 1. The key parameters are listed in Table 1. More detailed parameters and applications of the CDWL are introduced in previous work (Wei et al., 2020; C. Wang et al., 2019a). On addition, a ground-based optical disdrometer (second-generation particle size and velocity, Parsivel-2, Tokay et al., 2014), a Davis weather station (wireless vantage pro2 plus) and a Micro-Electro-Mechanical System (MEMS)-atmospheric ground E-field sensor are also deployed for comparative measurements about 50 m away from the CDWL.
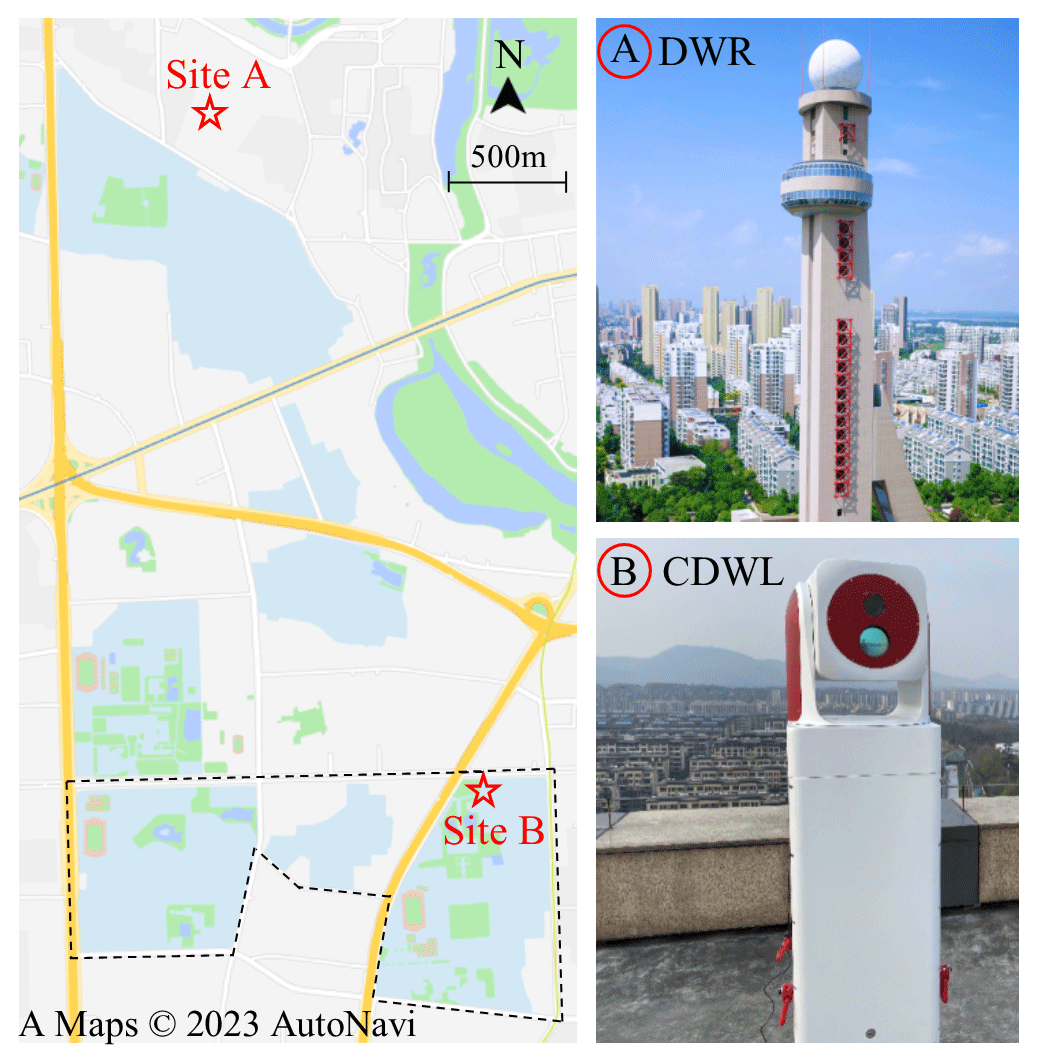
Figure 1The location of the two instruments on the map. The campus of the USTC is located inside the dotted line.
The compact all-fiber CDWL operates with an eye-safe wavelength of 1.5 µm. The pulse duration and pulse energy of the laser are 600 ns and 300 µJ respectively. The radial spatial resolutions are set at 30/60/150 m within the range 0–2.22/2.22–5.22/5.22–12.72 km. The range-varying resolution is designed to improve the probability of detection at heights where the aerosol concentration is low. During the experiments, the CDWL works in velocity-azimuth display (VAD) scanning mode for wind profile detection. It is an extension of a staring mode, where the lidar beam rotates around a vertical axis, thus forming a cone with the base at the measurement of the distance of interest and the apex at the lidar source (Sathe and Mann, 2013; Banakh et al., 2017). The azimuth scanning range is set as 0–300∘ and the elevation angle is 60∘. The scanning interval is 5∘ and a total of 60 radial profiles are obtained for each scanning circle, lasting 135 s. Thanks to VAD scanning technology, aerosol signals and other hydrometeor signals can be identified (Wei et al., 2019). Detailed information about the system has been presented in previous works (Yuan et al., 2020; Wang et al., 2017).
The 10.6 cm S-band Doppler weather radar deployed in Hefei is the first radar of China's New Generation Weather Radar System (CINRAD). It is a CINRAD/SA type radar, developed based on WSR-88D technology (He et al., 2012). It was installed on the roof of a tower (31.867∘ N, 117.258∘ E) with a height of 116.5 m. During this thunderstorm, the CINRAD S-band data have a range gate spacing of 230 m and an azimuth spacing of nearly 1∘. Several preset scanning modes of operations are referred to as volume cover patterns (VCPs). In VCP-21 mode, each radar volume contains nine elevation scans: 0.5, 1.5, 2.4, 3.4, 4.3, 6.0, 9.9, 14.6, and 19.5∘ within 6 min.
In addition, the location of lightning data is obtained by a multi-station E-field sensor array consisting of 13 stations (Liu et al., 2021a, b, 2018). Each station was equipped with a vertical E-field antenna (with 3 dB-bandwidth of 800 Hz to 300 kHz) and recorded the (time derivative of the vertical E-field) for each lightning event. The atmospheric electricity sign convention is used for the E-field sensor. All recordings are synchronized with a GPS clock with a sampling rate of 5 MHz. The location error of the networks is within 1 km and the error of the estimated peak current is about 10 % (Fan et al., 2020).
2.2 Spaceborne instruments
Fengyun-4 (FY-4) is the new generation of Chinese geostationary meteorological satellites with greatly enhanced capabilities for high-impact weather event monitoring, warning, and forecasting. FY-4 carries four new instruments: the Advanced Geosynchronous Radiation Imager (AGRI), the Geosynchronous Interferometric Infrared Sounder (GIIRS), the Lightning Mapping Imager (LMI), and the Space Environment Package (SEP) (Yang et al., 2017). The FY-4 measurements are applied to obtain cloud phase observation and to determine the occurrence of lightning activity in this study.
2.3 ERA5 reanalysis data
ERA5 is the fifth generation of the European Centre for Medium-Range Weather Forecasts (ECMWF) atmospheric reanalysis of the global climate. The ERA5 reanalysis assimilates a variety of observations and models in four dimensions (Hersbach et al., 2020). As temperature changes can affect the phase of the hydrometeor in the atmosphere, the hourly temperature data from the subdaily high-resolution-realization deterministic forecasts of ERA5 are used to infer atmospheric composition and phase in this study.
3.1 Characteristics of the power spectrum
The wideband carrier-to-noise ratio (CNR) is the ratio of signal power to noise power. The accuracy of velocity estimation is mainly determined by the CNR (Wang et al., 2017). The spectrum width is estimated by the ratio of total signal power to the peak power value, and it represents velocity dispersion in a range bin. It can be broadened by wind shear, turbulence, and precipitation. Besides the CNR and spectrum width, normalized skewness is introduced to reveal how adverse weather conditions affect the power spectrum in this work (Yuan et al., 2020, 2021).
In order to improve the inversion probability of the wind vector in the weak signal regime, we apply a robust sine wave fitting method that weights the contribution with a combination of CNR and fitting residual (Wei et al., 2020; Banakh et al., 2010). In addition, as this study is more concerned with changes in the vertical direction within the thundercloud, the power spectrum of CDWL is an equivalent vertical detection spectrum derived from the radial spectra by compensating for the Doppler effect of the horizontal wind (Wei et al., 2021, 2019):
where VLOS is the line of sight (LOS) velocity, V∥ is the horizontal wind speed, φ0 is the elevation angle, θ0 is the horizontal wind direction, and θ is the azimuth angle of the lidar.
3.2 Calculation of turbulence
The turbulence kinetic energy dissipation rate (TKEDR) is a method for the measurement of turbulence using ground-based wind lidars (Sathe and Mann, 2013). The TKEDR can be estimated by fitting the azimuth structure function of radial velocity to a model prediction. In this work, this method is applied to estimate the TKEDR in the VAD scanning mode. The method, including error analysis, is demonstrated in detail (Banakh et al., 2017; Banakh and Smalikho, 2018). Note that the accuracy of the wind and the TKEDR mainly depends on CNR (L. Wang et al., 2022, 2021). The thundercloud atmospheric motion is a complex pattern of combined updrafts and downdrafts, exhibiting continuous turbulence on different scales (Bryan et al., 2003; Feist et al., 2019). Currently, the CDWL is capable of accurately assessing the turbulence changes from the surface to the cloud base of the thunderstorm.
3.3 Thundercloud composition identification algorithm
Under thunderstorm weather conditions, the received backscattering signal by CDWL could contain multiple components: the aerosol signal, the water drop signal, the ice crystal signal, the graupel signal, the raindrop signal, and the hail signal. From the Doppler power spectrum, two or more peaks can be observed if the velocities of mixed components are different. A multi-component Gaussian model is used to fit the multi-peak spectrum (Lottman and Frehlich, 1998; Wei et al., 2019):
where f, I, and σ are Doppler frequency shift, peak intensity, and the spectrum width, the subscript n represents components such as aerosol, water drop, ice crystal, graupel, rain, and hail.
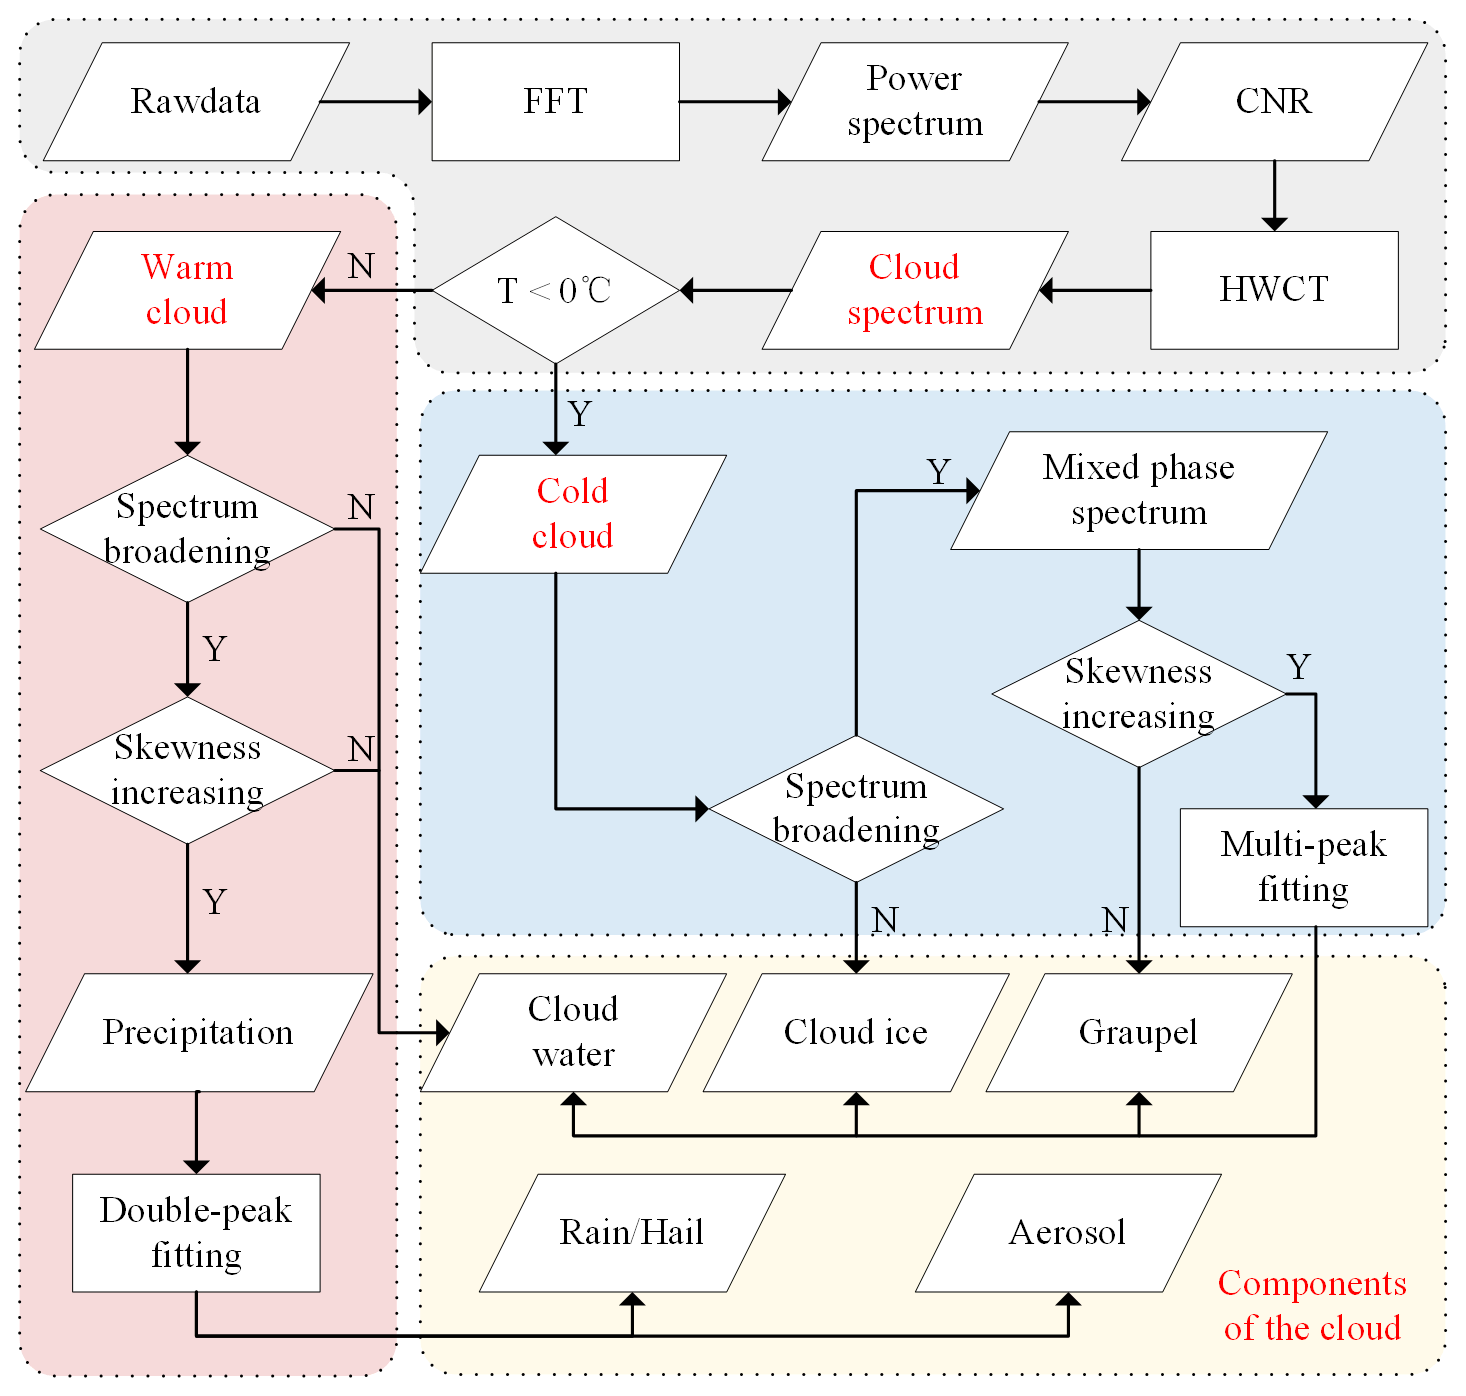
In order to investigate the composition, electrical properties, and motion characteristics of the melting layer in thundercloud, the CDWL power spectrum is separated into these particle spectra following the procedure shown in Fig. 2. The melting layer in the thundercloud is separated as part of the cold cloud. In addition, the CDWL typical spectrum width, skewness and vertical velocity of aerosol, raindrop, water drop, and graupel have been described in Yuan et al. (2021, 2020).
First, the power spectrum is obtained from the CDWL raw data using fast Fourier transform. The CNR, spectrum width, and skewness (Sect. 3.1) are derived from the power spectrum. Then, the cloud is extracted by CNR after range correction, using the Haar wavelet covariance transform method, where the CNR cloud threshold is −25 dB (Wang et al., 2021). In the next part, it is separated into warm and cold cloud spectra by the internal cloud temperature. Finally, Doppler spectra of different components are determined by spectrum width and skewness. Note that the rain and hail are not directly separated in this work, and rain/hail are categorized in the water classification and are shown together in Fig. 9. In the next work, we will further distinguish between the rain and hail spectra.
4.1 Thunderstorm observation
On 30 April 2021, the Hefei region was affected by lightning activity in a thunderstorm. The images of lightning and hail recorded in Hefei are shown in Fig. 3. The cloud-to-air channel had a greater luminosity than the upper channel. It can be clearly seen that this is IC lightning. A little hail fell to the ground with a diameter exceeding 10 mm.
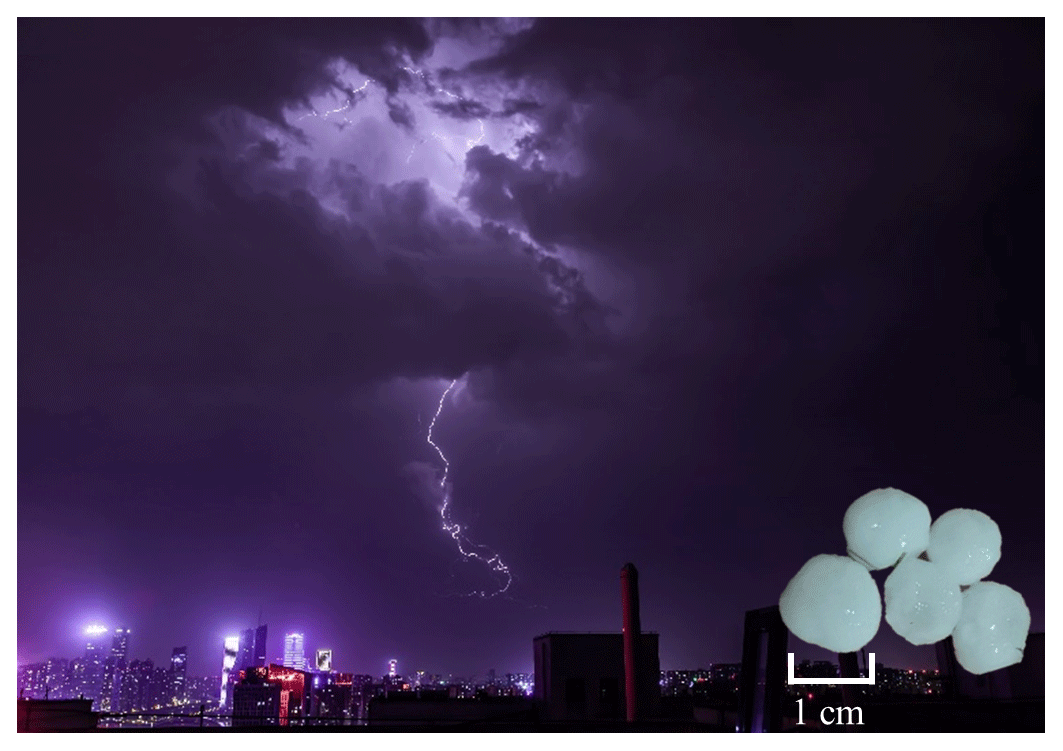
Figure 3Intracloud lightning photograph captured in Hefei (31.817∘ N, 117.222∘ E) at 21:56 LT on 30 April 2021 by Dongting Zhao. The hail particles on the ground are shown lower right.
4.1.1 CDWL
The CDWL monitored the development of thundercloud over USTC from 20:00 to 22:00 local time (LT) (Fig. 4). Figure 4a–g show the wideband CNR, spectrum width, spectrum skewness, horizontal wind speed, horizontal wind direction, vertical wind speed, and TKEDR measured by the CDWL. The 0 and −10 ∘C isotherms are from ERA5 data (Fig. 4a–c). Owing to the influence of updraft, large graupel and water drops are produced in thunderstorms, and the cloud develops rapidly, producing lightning and precipitation activities (Carey and Rutledge, 2000). The thundercloud over USTC occurs from 20:30 to 21:40 LT (Fig. 4). As the laser cannot penetrate the region of the main updraft made up of large particles, the thundercloud detected by CDWL turns into a “V-cloud” (Fig. 4a). Spectrum width broadening and skewness increase below the 0 ∘C isotherm and only spectrum width broadening below the −10 ∘C isotherm are observed during the period (Fig. 4b and c). It means that there is a mixed region composed of multiple particles in the thundercloud below the 0 ∘C isotherm, that is, there is a melting layer. When the thundercloud appears, updrafts are detected near the surface (Fig. 4d–f).
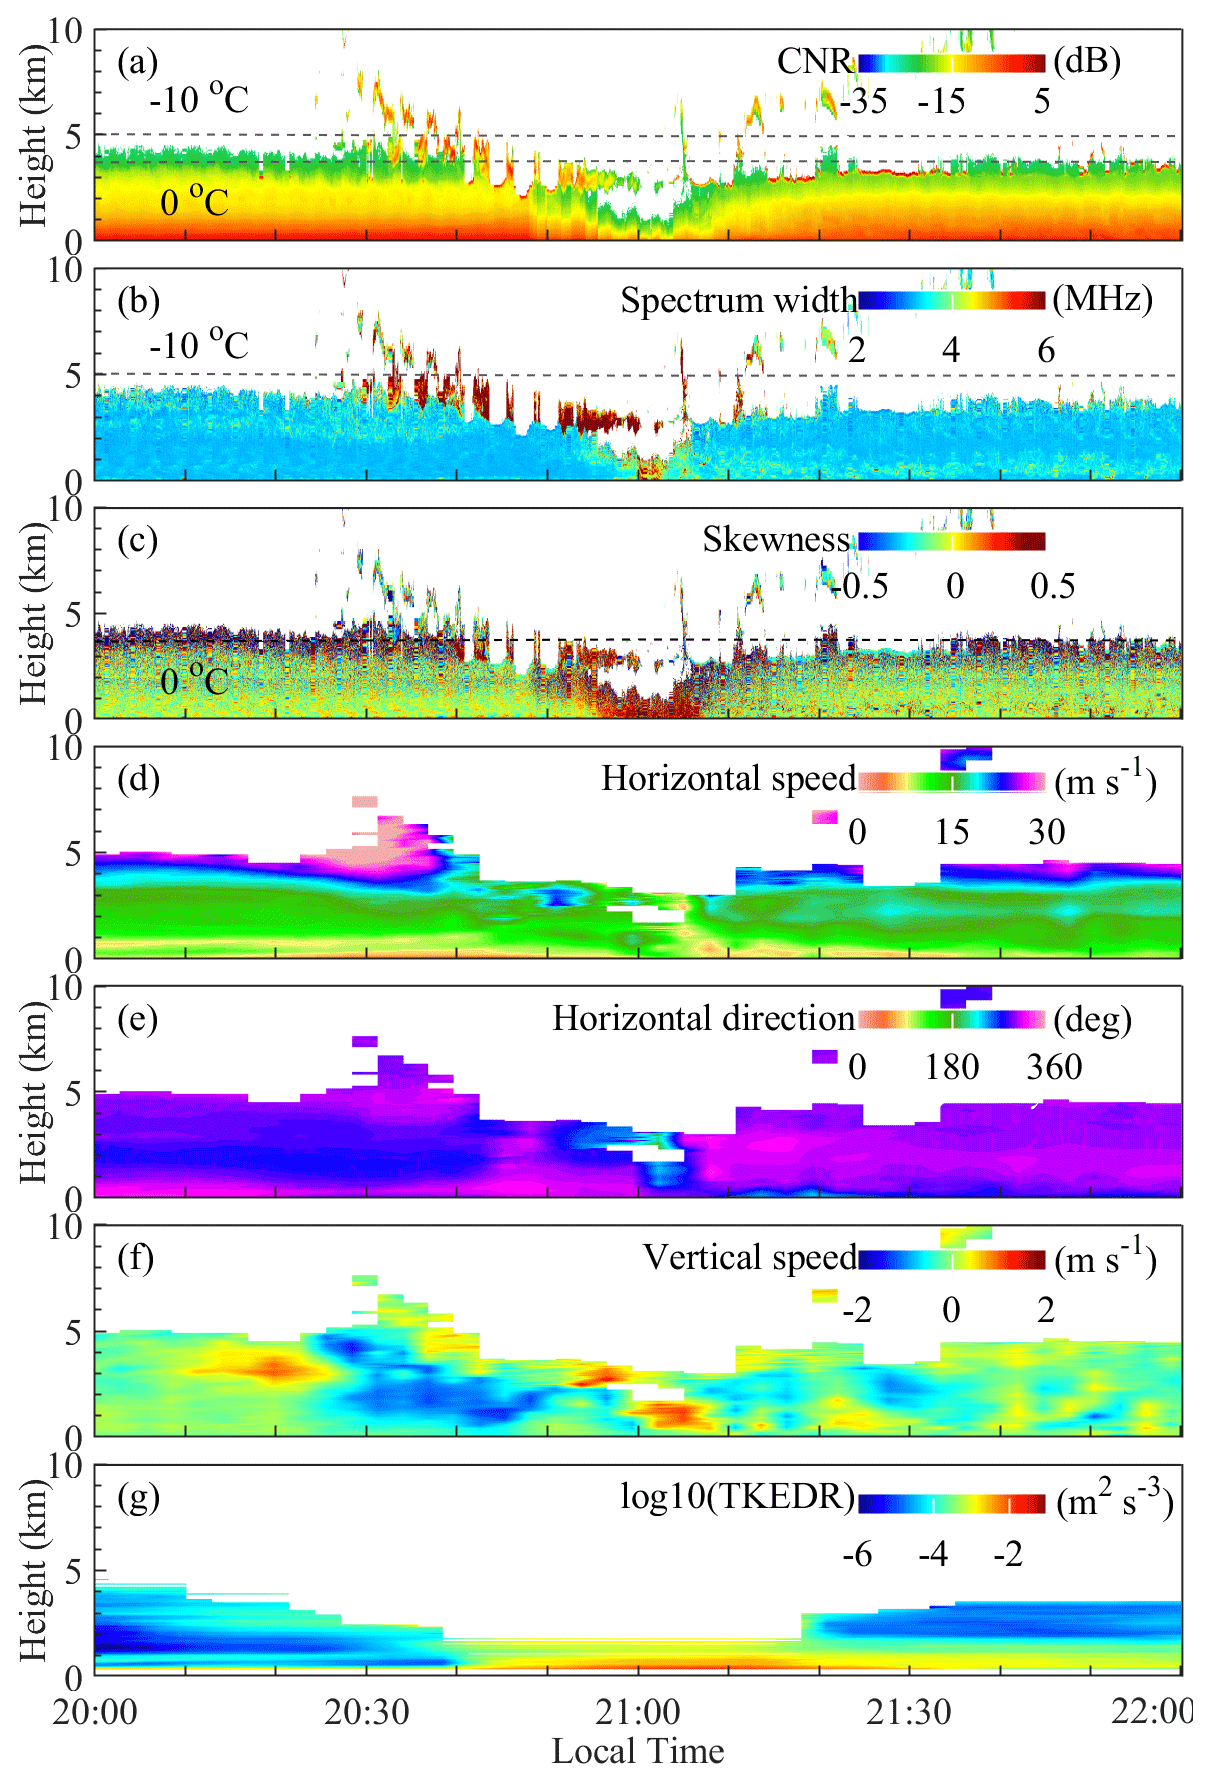
Figure 4Continuous observation results of CDWL, during the lightning activity in a thunderstorm event on 30 April 2021. (a) The wideband CNR, the 0 and −10 ∘C isotherms are from ERA5, (b) spectrum width, (c) spectrum skewness, (d) horizontal wind speed, (e) horizontal wind direction, (f) vertical wind speed, and (g) TKEDR.
Figure 4 shows the results of meteorological data on the ground. The local atmospheric E-field is measured by a MEMS-atmospheric ground E-field sensor (Fig. 5a). It can record the E-field intensity induced by the thunderstorm. The local atmospheric E-field disturbances occur from 20:39 to 21:04 LT. During this period, lightning activities occur within a diameter of 10 km away from USTC measured by a multi-station E-field sensor array consisting of 13 stations. The short-term precipitation caused by the thunderstorm occurs between 20:54 and 21:06 LT (Fig. 5b), accompanied by the hail falling.
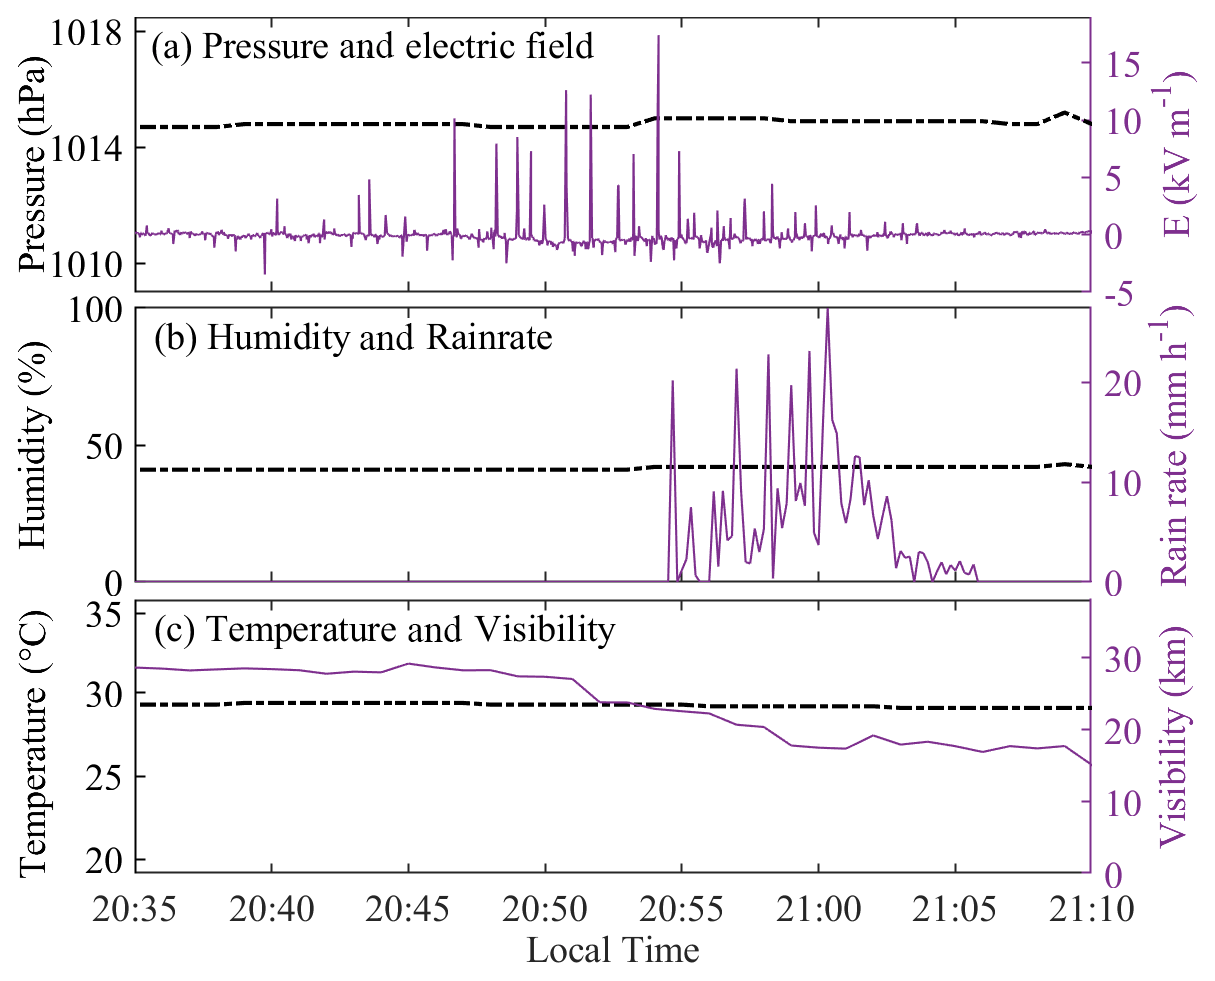
Figure 5Continuous observation results of pressure, local atmospheric E-field, humidity, rain rate, temperature, and visibility on the ground level during the lightning activity in a thunderstorm event on 30 April 2021. Temperature, visibility, humidity, rain rate, and pressure were provided by a Davis weather station. The atmospheric local E-field by MEMS-atmospheric ground E-field sensor.
During the descent of the thunderstorm cloud base, the updrafts occur near the surface (Fig. 4d–f) and the local atmospheric E-field also begins to disturb, reaching a maximum before precipitation (Fig. 5a and b). At this time, the horizontal wind direction of the thundercloud also changes, and the lateral advection bursts at the cloud base (Fig. 4e). Then precipitation occurs, it is should that the rain drops fall with charges (Marshall and Winn, 1982), the local atmospheric E-field gradually recovers to 0 (Fig. 5a), and the TKEDR increases exponentially near the surface (Fig. 4g).
4.1.2 FY-4
The phase type of thunderstorm is provided by AGRI on board FY4 A satellites, with a spatial resolution of 4 km (Fig. 6). Figure 5a is the cloud phase across the region of China at 20:45 LT. The thunderstorm occurs in the target region, which is represented by the white square. The cloud phase distribution of thunderstorm regions at different times is shown in Fig. 6b–g. The white pentagram indicates the location of the USTC. The orange arrows represent the wind vector.
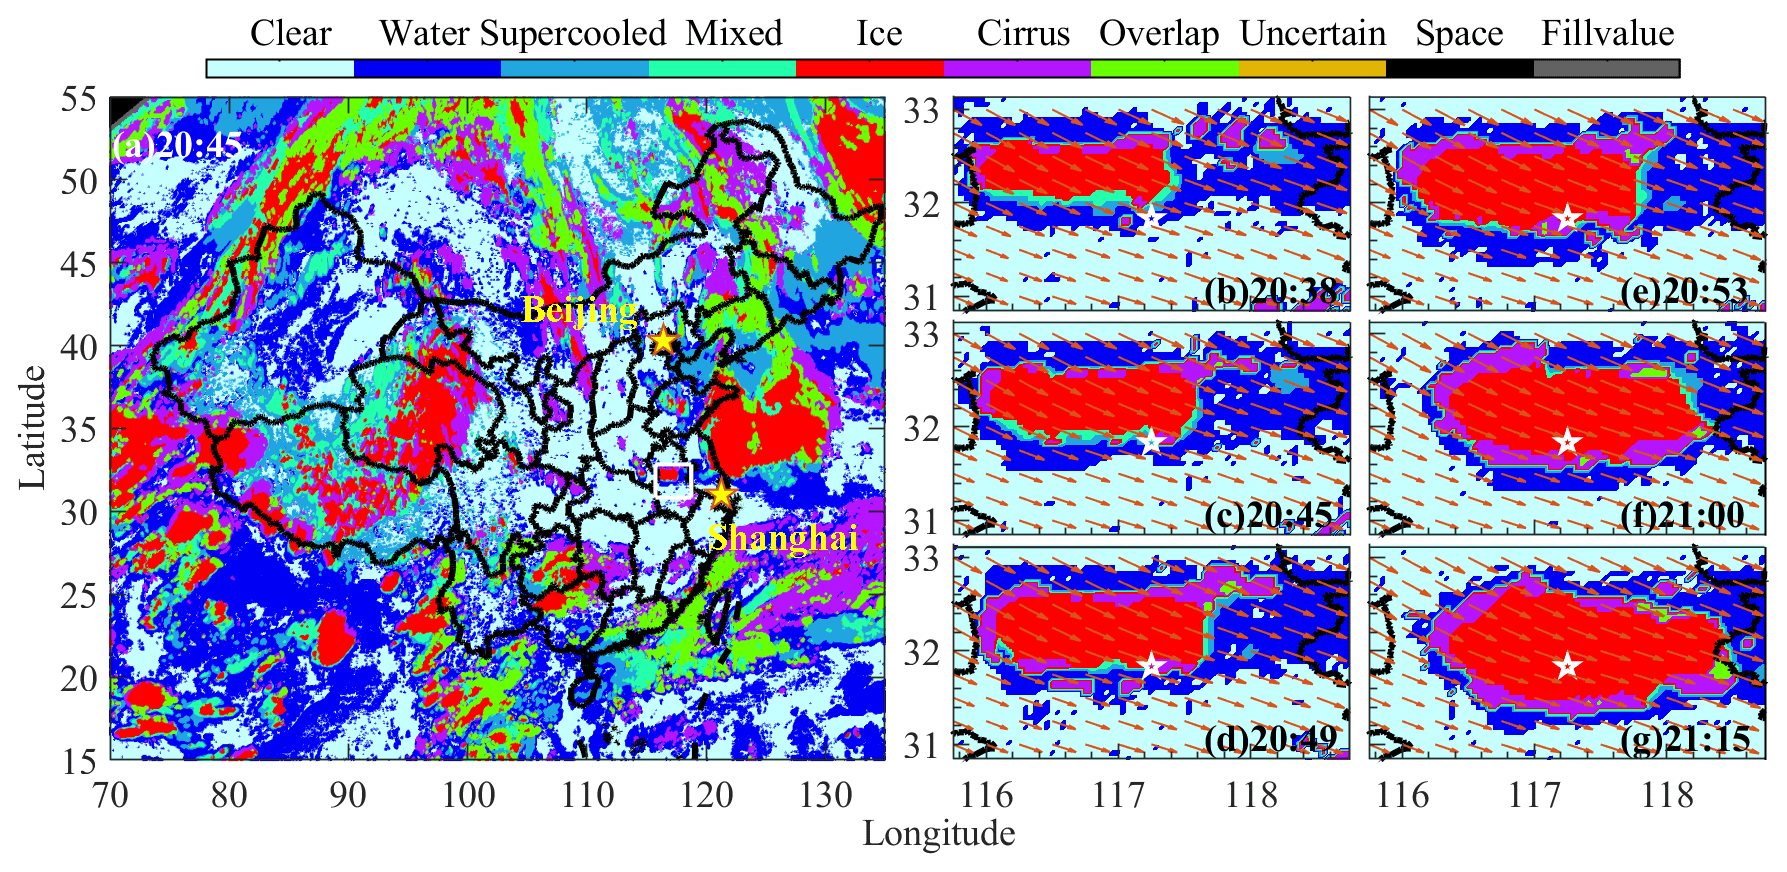
Figure 6The cloud phase type by FY-4 on 30 April 2021, local time. (a) shows the cloud phase across the region of China at 20:45 LT, the white square indicates the thunderstorm region. (b)–(g) show the cloud phase distribution of thunderstorms at different times. The white pentagram and orange arrows represent the location of the USTC and the wind vector respectively.
During this time, the thunderstorm gradually moves southeast. Significant components including the ice phase, water phase, supercooled phase, and mixed phase can be seen in the thunderstorm. The ice phase occupies the center of the whole cloud, the water phase is in the outermost layer, and the supercooled phase and the mixed phase are the products of ice water mixing and exist at the interface of the ice phase and water phase. USTC is located at the boundary of the ice and water phase (Fig. 6b–e). The thundercloud develops mainly vertically and expands less horizontally. The local atmosphere E-field disturbances also occur during this time. Subsequently, there are only ice phase particles in the thundercloud over USTC (Fig. 6f and g), and the thundercloud mainly expands horizontally with the direction of the wind.
4.1.3 DWR
Measurement results of the DWR give a more detailed and broader view of the thunderstorm development process. In addition, owing to the utilization of VAD scanning mode by CDWL to investigate cloud environments from various azimuth angles, the measurement results of the DWR can also indicate changes in the horizontal cloud environment over the USTC.
Figure 7 shows the reflectivity of DWR at each 6 min time step as the thundercloud is forming and developing. The location of USTC is marked with a pentagram. Lightning activity occurs more easily in localized cells with greater reflectivity (Lang et al., 2004; Chmielewski et al., 2018). Consistent with observations from FY-4, the thunderstorm gradually moves to the southeast. At 20:39 LT, the cloud reaches USTC (Fig. 7b); subsequently, the thundercloud continues to develop, and the reflectivity increases to a maximum of more than 55 dBZ (Fig. 7c–e). Most lightning appears during this time. After that, the reflectivity of the thundercloud gradually decreases (Fig. 7e and f). Combined with precipitation data by Parsivel-2, it is indicated that hail is developing and falling at this time. When the hail develops, the reflectivity is greater than 50 dBZ and no longer increases rapidly, but the strong reflectivity region does increase (Williams, 2001). As the hail falls to the ground, the cloud dissipates and the reflectivity decreases rapidly. While this thundercloud is over the USTC, the cloud reflectivity changes less at the same time.
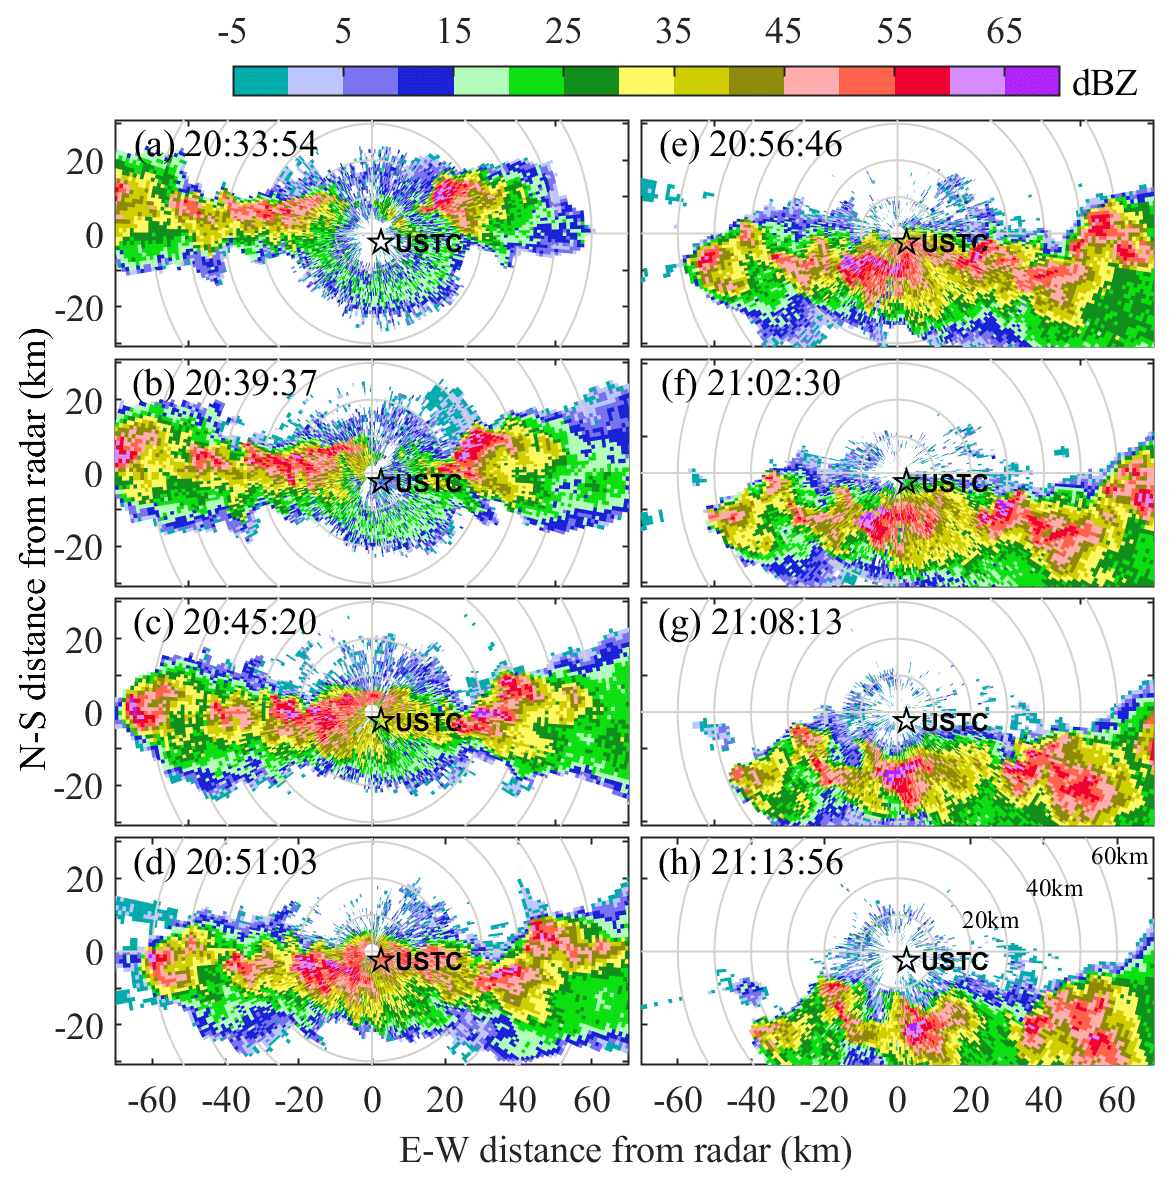
Figure 7Level-II reflectivity from Hefei S-band DWR observed at 6∘ elevation angle for the thunderstorm development process. A black pentagram represents the location of the USTC. The horizontal and vertical distance of 0 km and the diameter range of 10, 20, 30, 40, 50, and 60 km from the radar are drawn with gray lines.
Figure 8a and b show the distance between the lightning occurrence point obtained by the multi-station E-field sensor array and the USTC when the local atmospheric E-field disturbances occur (20:39–20:56 LT). The red solid circle represents the positive cloud lightning, the black circle represents the negative cloud lightning, and the size of the mark represents the magnitude of the peak current. Below the height of 8 km, there is only negative cloud lightning at 3 km and 6 km height; the rest is all positive cloud lightning. Figure 8c is a vertical slice of the thundercloud over the USTC detected by DWR, where the black line represents the cloud boundary detected by CDWL, and blue and red lines represent the updraft and downdraft boundaries detected by CDWL respectively.
It can be seen that CDWL can only detect the outside region with the lower reflectivity of the thunderstorm. Updrafts below the cloud exist in areas of apparently enhanced reflectivity, and downdrafts in areas of decreased reflectivity. The main updraft region within the thundercloud undetected by CDWL with a reflectivity greater than 40 dBZ.
Stolzenburg et al. (1998) shows that there are differences in the charge structure between the updraft region and the outside updraft region of the thundercloud. In general, within the convective updraft, the basic charge structure has four charge regions, alternating in polarity, and the lowest one is positive. The charge structure outside the convective updraft is more complex; there are typically at least six charge regions, alternating in polarity, and the lowest one is again positive. Therefore, the outside region of the thundercloud detected by CDWL will be more electrically active (Stolzenburg et al., 2002).
4.2 Further Discussion
Stolzenburg et al. (1998) shows that there are differences in the charge structure between the updraft region and the outside updraft region of the thundercloud. The charge structure outside the convective updraft is more complex. Additional electric field complexity and additional charge regions were found in the non-updraft sounding (Stolzenburg et al., 2002). Therefore, a depth analysis of the power spectrum is performed to explore the structure outside the convective updraft regions of thunderclouds detected by CDWL.
4.2.1 Distribution and motion characteristics
Figure 9 shows the wideband CNR, spectrum width, horizontal speed, horizontal direction, and vertical speed of different particles. The separation of aerosols is based on Yuan et al. (2020), whereas other particles are separated using the identification method shown in Fig. 2. The cloud ice spectrum width is slightly larger than cloud water and aerosol spectrum width owing to the ice crystals being more prone to multiple scattering (Fig. 9b, g, and l). Cloud ice mainly occurs above a height of 5 km; owing to the action of horizontal pressure-gradient force, its horizontal velocity is much faster than cloud water at low heights (Fig. 9h and m). After the initial disturbance of the E-field (at 20:40 LT), the ice around 5 km has a significant decline in speed (Fig. 9j).
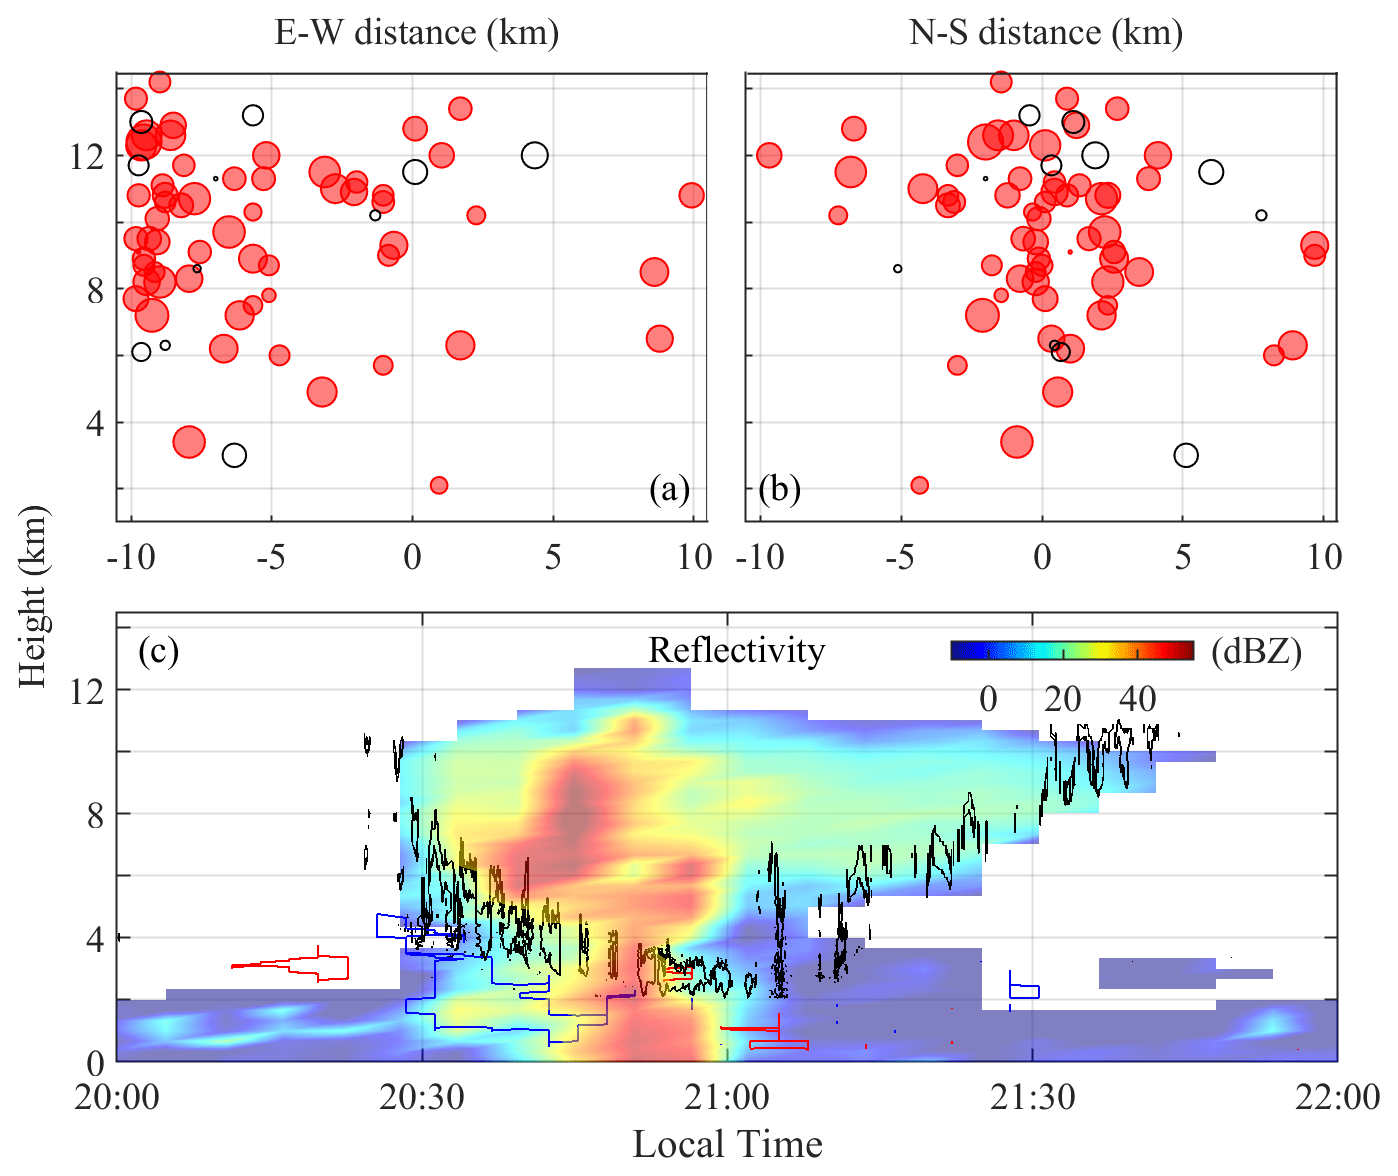
Figure 8During E-field disturbances, (a) the east–west distance and (b) the north–south distance between the lightning position detected by the multi-station E-field sensor array and the USTC, in which the red solid circle represents the positive cloud lightning, the black circle represents the negative cloud lightning, and the size of the mark represents the magnitude of the peak current. (c) The vertical slice of the thundercloud detected by DWR and the boundary of the thundercloud detected by CDWL. The region by the red line represents the area of strong downdrafts detected by CDWL, whereas the region by the blue line represents the area of strong updrafts detected by CDWL. The black line denotes the boundary of the thundercloud detected by CDWL.
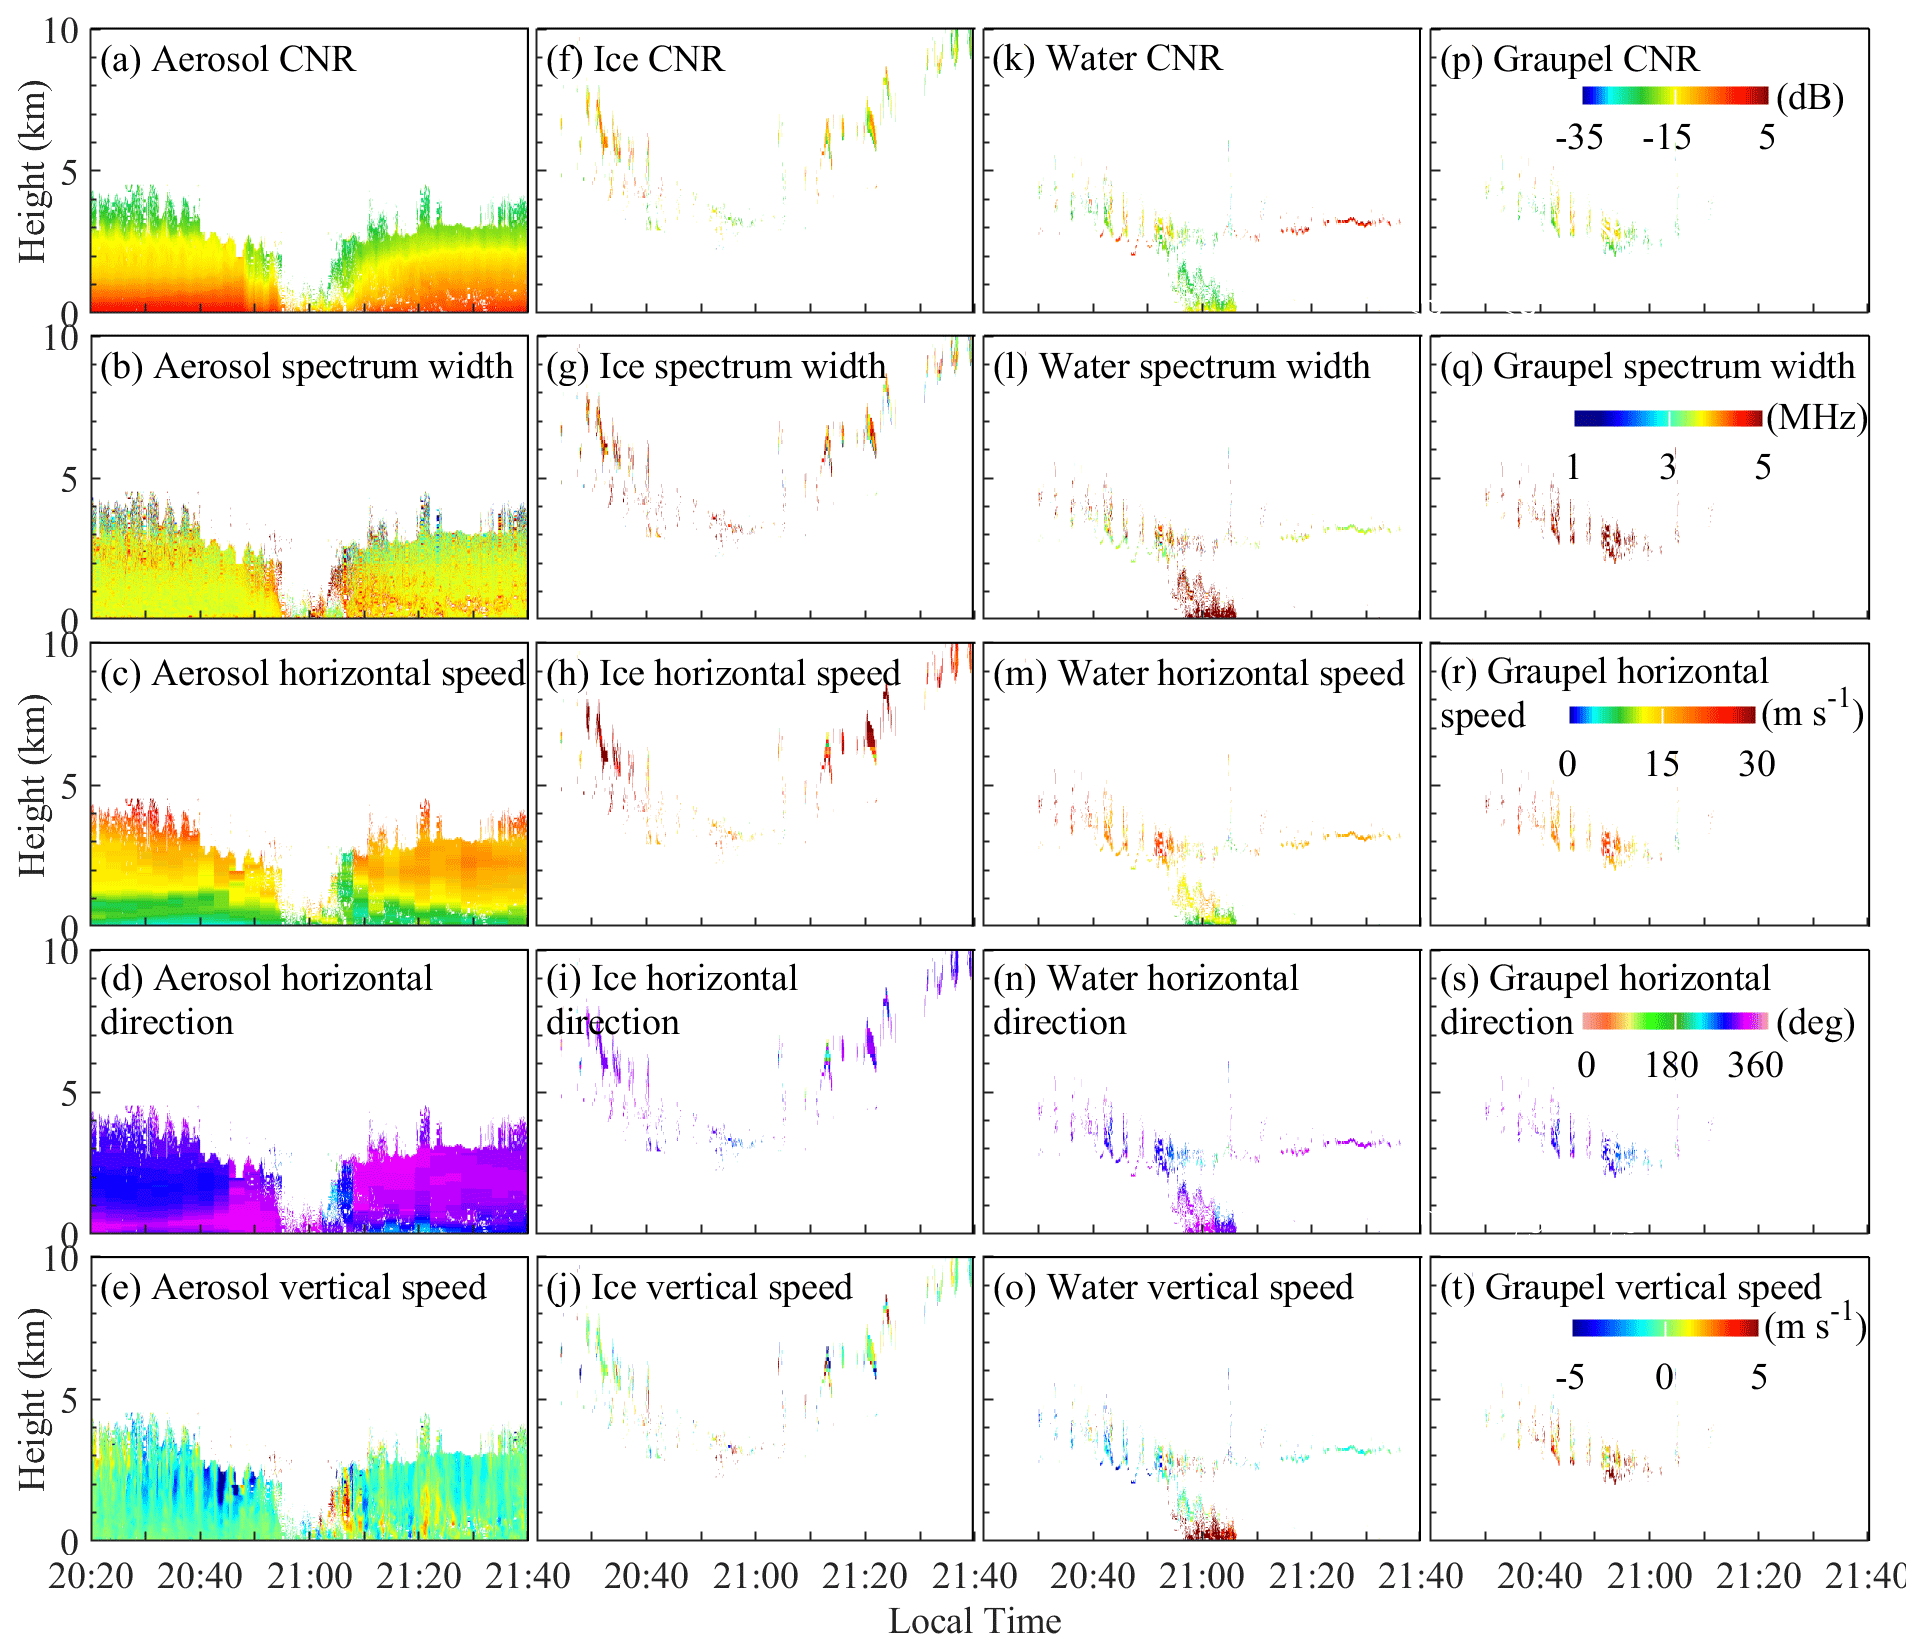
Figure 9Separation results of aerosol, ice, water, and graupel. (a) Aerosol CNR. (b) Aerosol spectrum width. (c) Aerosol horizontal speed. (d) Aerosol horizontal direction. (e) Aerosol vertical speed. (f) Ice CNR. (g) Ice spectrum width. (h) Ice horizontal speed. (i) Ice horizontal direction. (j) Ice vertical speed. (k) Water CNR. (l) Water spectrum width. (m) Water horizontal speed. (n) Water horizontal direction. (o) Water vertical speed. (p) Graupel CNR. (q) Graupel spectrum width. (r) Graupel horizontal speed. (s) Graupel horizontal direction. (t) Graupel vertical speed.
Before precipitation, the spectrum width of cloud water above 3 km (Fig. 9l), which is inside the melting layer, is broadened, and the water drops are mixed with the melted graupel, resulting in the separated cloud water spectra being broader than the typical cloud water spectra. At this time, cloud water also has a small rising speed (Fig. 9o). During precipitation, the precipitation particles carry charges and form lower positive charge centers (Marshall and Winn, 1982; Reynolds et al., 1957). There is a slight disturbance in the atmospheric E-field (Fig. 5a). The spectrum width of the precipitation particle is much greater than 5 MHz (Fig. 9l), and has a distinct downward speed (Fig. 9o). After precipitation, the CNR of cloud water around 3 km becomes higher (Fig. 9k) because the cloud layer is thicker, the laser cannot fully penetrate, and the received backscattering signal is superimposed.
Graupel mainly appeared in 20:40–21:05 LT, which is consistent with the disturbance period of the local atmospheric E-field, indicating that graupel is the main reason for E-field changes. During precipitation, the spectrum width of the graupel is much greater than 5 MHz (Fig. 9q), has a distinct downward speed within the thundercloud, and during precipitation, the hail and the raindrops fall together (Fig. 9o).
4.2.2 The effects caused by the lightning
In order to investigate the effect of lightning on the surrounding thundercloud environment, the CDWL power spectrum is selected when the lightning number is greater than 2 detected by the multi-station E-field sensor array (Fig. 10). Positive velocities represent downward motion and negative velocities represent upward motion. It is noted that this velocity has removed the influence of horizontal wind and can be approximately regarded as vertical velocity.
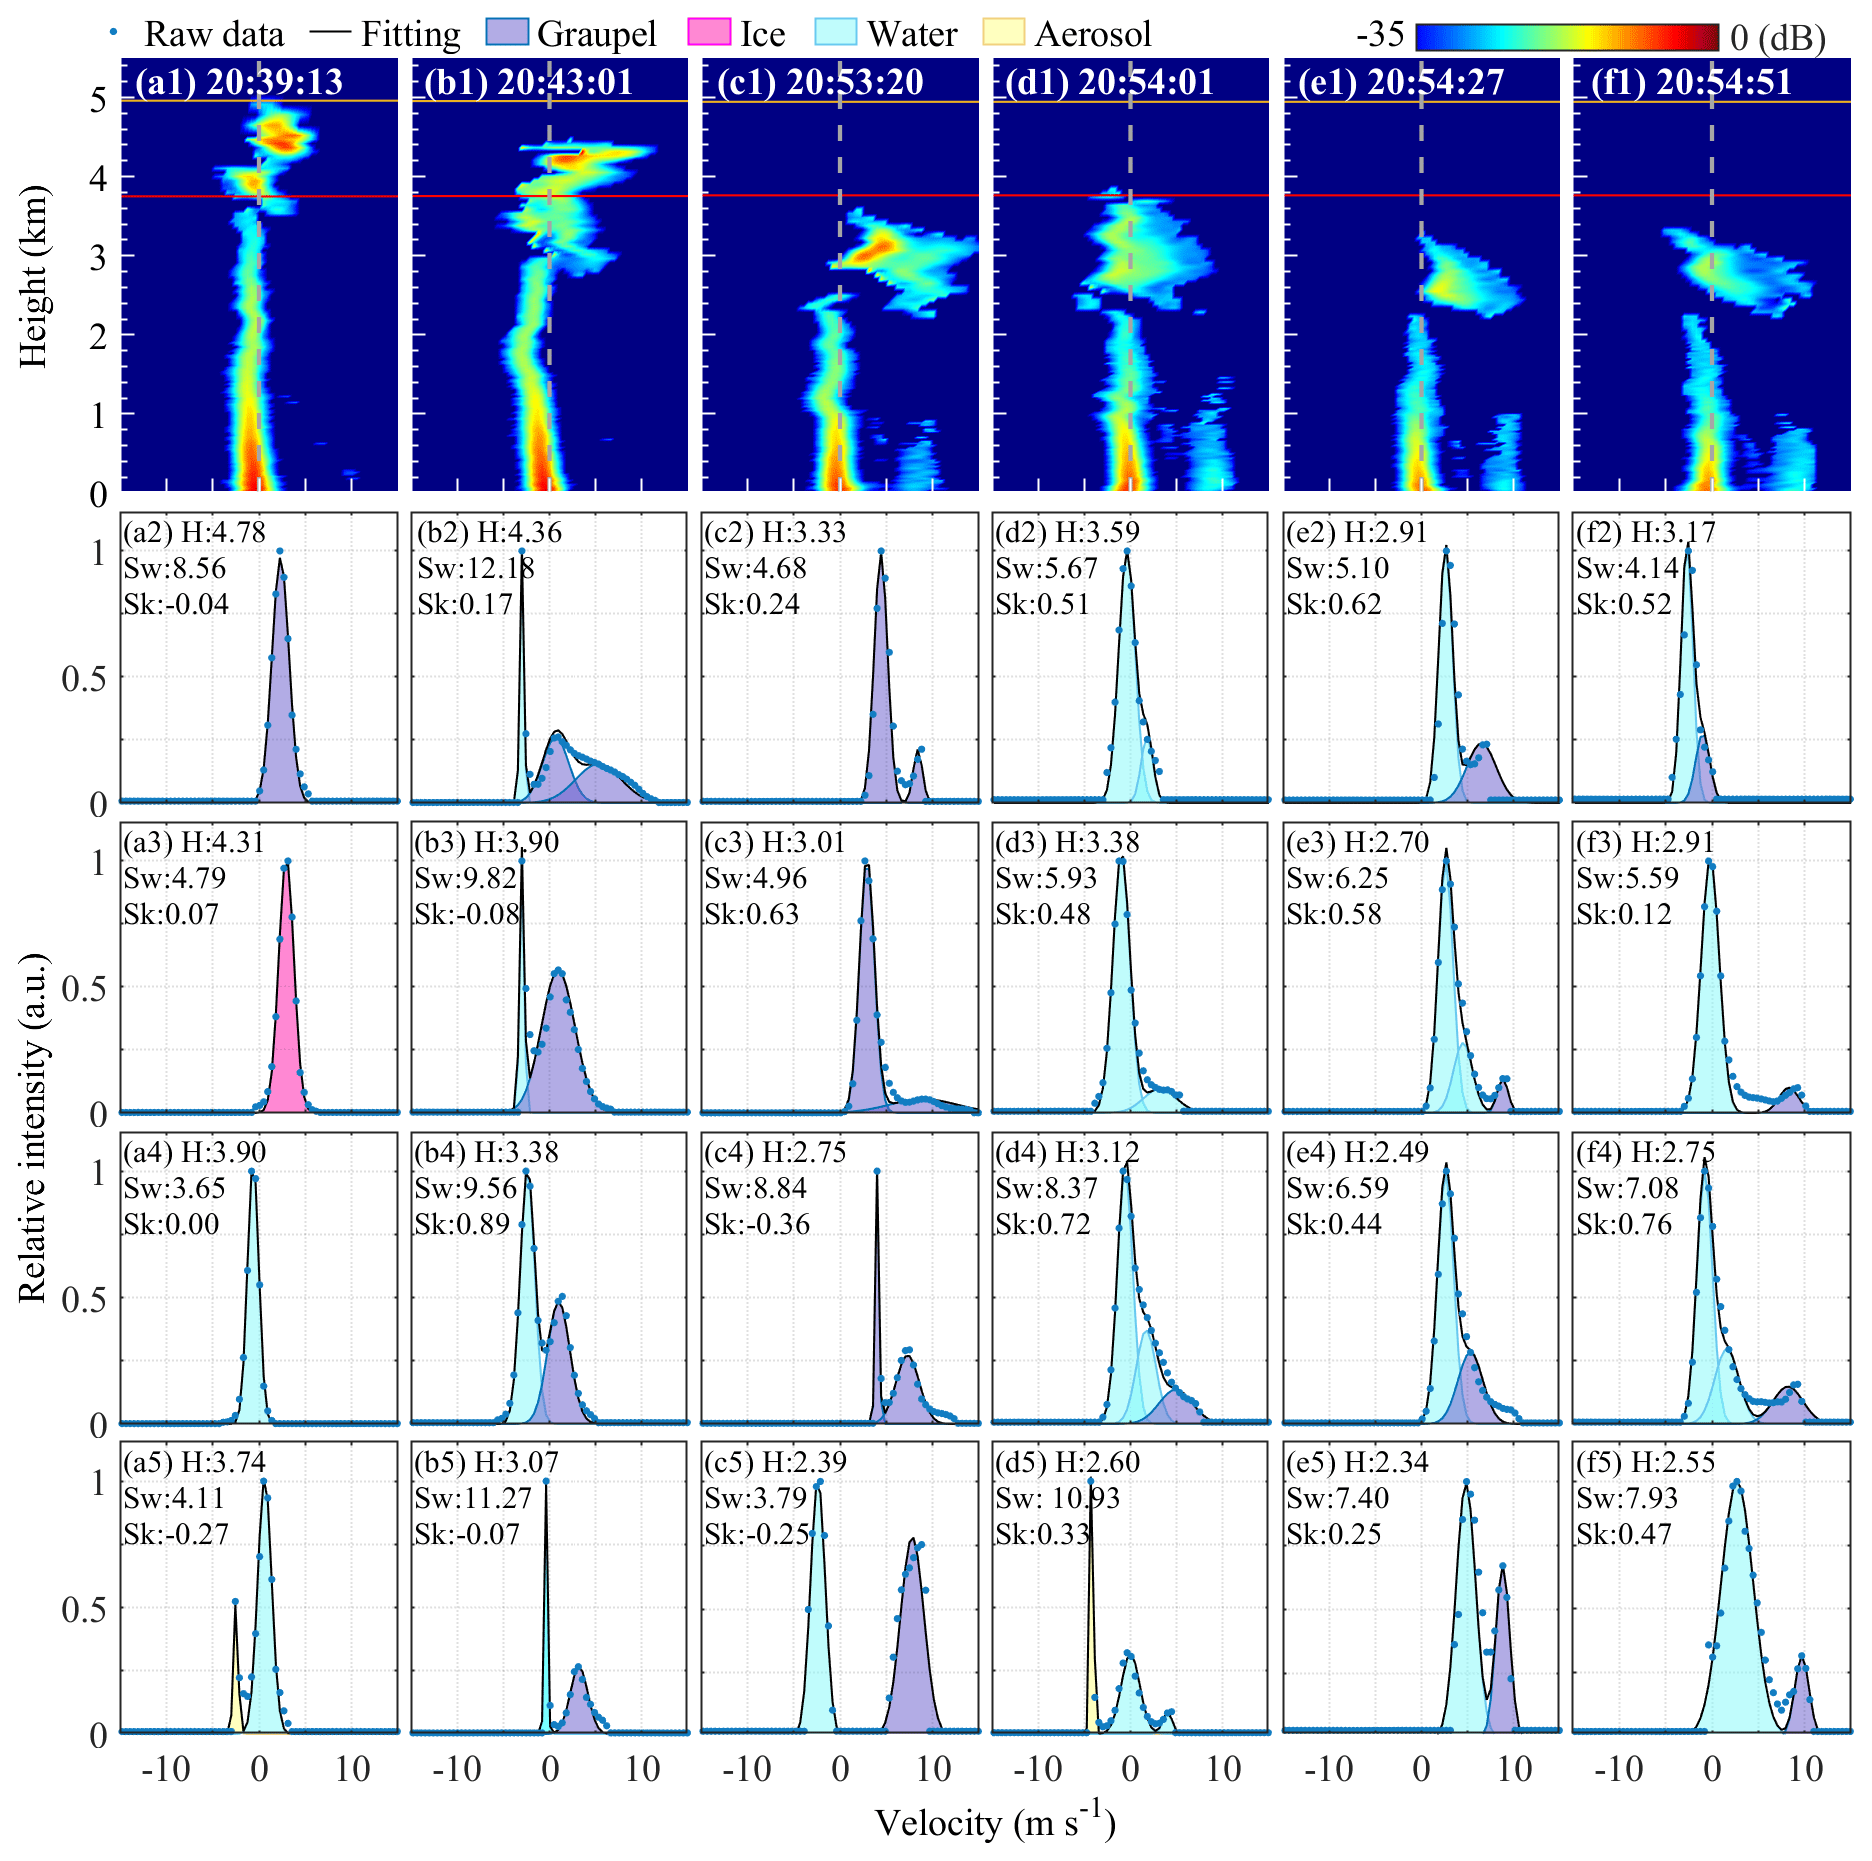
Figure 10(a1)–(f1) are the Doppler power spectrum intensities at different times by lightning in the thundercloud detected by CDWL. The gray dotted line indicates that the vertical speed is 0 m s−1. The orange and red lines represent the −10 and 0 ∘C isotherms respectively. Positive velocities represent downward motion and negative velocities upward motion. (a2)–(f5) are the specific spectra and multi-component Gaussian fitting curves at different heights. It is normalized to the peak of the power spectrum as the maximum, the H, Sw, and Sk are the height, spectrum width, and skewness of the raw spectrum. The blue dot markers stand for the raw data of the spectra. Black lines represent fitting results. The purple shadow and pink shadow represent separated graupel and ice crystal components respectively. The blue shadow and yellow shadow represent separated liquid water and aerosol components respectively.
Figure 10a1 shows the power spectrum at 20:39:13 LT with a slight local atmospheric E-field disturbance. The thundercloud is in the initial electrification stage. The cloud below the −10 ∘C isotherm has a significantly broadened spectrum, and there is a graupel with downward speed, as shown in Fig. 10a2, which is a typical graupel power spectrum. Figure 10a3 and a4 show the typical power spectrum of ice crystal and liquid water in a cloud respectively that should be the ice crystals that were formed when falling graupel collided with rising supercooled liquid water (Wei et al., 2019). Figure 10a5 shows the double-peak power spectrum when liquid water is mixed with aerosol. The cloud below the 0 ∘C isotherm borders the aerosols, the spectrum has not broadened, and there is no melting layer.
Figure 10b1 and c1 show the power spectrum when CG lightning occurs. The highest cloud detected by CDWL is greater than 0, and according to the movement trend here, there is likely to be a balance layer of vertical velocity = 0 m s−1 above the height of 5 km (Yuan et al., 2021). The spectrum width of the cloud is very broad, and there is an obvious melting layer. As shown in Fig. 10b2, the spectrum width >12 MHz, in addition to the existing graupel and liquid water drops in this region, there is also a graupel vertical velocity >5 m s−1. This graupel is separated from the cold cloud particle (Fig. 2) and melts below the 0 ∘C isotherm. Then, this graupel is mixed with liquid water, and the velocity shifts downward as the whole cloud moves down (Fig. 10b3–b5). Figure 9c1 shows the power spectrum before surface precipitation. It can be clearly seen that there is also graupel with a speed >5 m s−1 in the melting layer (Fig. 10c2–5). At the same time, there is graupel with a velocity of <5 m s−1, which is gradually melted during the falling process and the speed decreases.
Figure 10d1 is also the power spectrum of IC lightning before surface precipitation. The cloud below the 0 ∘C isotherm has a significant broadening spectrum, but owing to the imminent surface precipitation, there is graupel with a high velocity on the right side of the power spectrum, which gradually melts into droplets during the falling process; the speed decreases, and then falls to the surface to form precipitation (Fig. 10d2–5).
Figure 10e1 and f1 show the power spectrum during precipitation. A significant difference in velocity between the upper and lower of the detected cloud can be seen owing to the broadening of the spectrum due to raindrops during precipitation. The typical IC precipitation spectrum with hail, which is formed by liquid cloud droplets, liquid raindrops, and graupel, is shown in Fig. 10e3.
Yuan et al. (2020) has shown that lightning causes Doppler spectrum broadening, both in the balance layer and in the melting layer. It can be seen in Fig. 10 that CG lightning has a broader spectrum than IC lightning, and there is graupel with a velocity >5 m s−1 during CG lightning. Thus, the additional graupel particles with a velocity >5 m s−1 should be caused by lightning, rather than the particle in the melting layer being formed after the IC channel is heated. Moreover, most of the IC lightning occurs at a greater height, and has less of an impact on the cloud environment below a height of 5 km height. However, the CG lightning has an impact on the whole thundercloud environment.
In the absence of lightning occurrence, the melting layer is detected by CDWL. Furthermore, identifying and separating different particles in the thundercloud provides a new way of studying the electrical process of the thundercloud and the impact of the surrounding environment. Meanwhile, the detection of graupel in the melting layer and precipitation also provides more detailed information on the development process of the thunderstorm.
In this article, a novel method for identifying thundercloud particles based on CDWL power spectrum analysis was proposed. Observations of the thunderstorm were reported based on the CDWL, DWR, FY-4, and other ground instruments. The formation, rapid growth, and dissipation of thunderclouds were monitored and analyzed. Although CDWL did not completely penetrate the cloud, it successfully detected a broadened spectrum width and increased skewness below the 0 ∘C isotherm, outside the convective updraft region of the thunderstorm. Moreover, this region exhibited significant variations in particle velocity, phase, and composition. Combined with the lightning detected by multiple sensors, it was found that CG lightning occurs within a 10 km radius when there is additional graupel with a speed greater than 5 m s−1 in the thundercloud. These findings validate the capacity of CDWL to observe the composition and motion characteristics of thunderstorms. At present, we cannot detect the main updraft region of the thundercloud. In future work, we will try to improve the cloud penetration ability by increasing the power of the laser. This will enable us to study the composition and motion characteristics of particles in the upper thundercloud, as well as the velocity changes in the cloud when IC lightning occurs. Additionally, we aim to conduct comprehensive observations of the electrification process and lifecycle of thunderstorms. We also plan to integrate polarization detection into the lidar system (Qiu et al., 2017), and perform more detailed observations of particle phase changes and charge structure in thunderclouds.
The ERA5 data sets are publicly available from the ECMWF website at https://doi.org/10.24381/cds.143582cf (Simmons et al., 2020). The Fengyun-4 satellites data are available on the National Satellite Meteorological Center (NSMC) website at http://satellite.nsmc.org.cn/portalsite/default.aspx (FengYun Satellite Data Center, 2023). The CDWL and DWR data can be downloaded from https://doi.org/10.6084/m9.figshare.20326350.v2 (Wu, 2022a), https://doi.org/10.6084/m9.figshare.21590433.v3 (Wu, 2022d) and https://doi.org/10.6084/m9.figshare.20326377.v1 (Wu, 2022b). The lightning location detected by a Micro-Electro-Mechanical System (MEMS)-atmospheric ground E-field sensor data can be downloaded from https://doi.org/10.6084/m9.figshare.20588385.v4 (Wu, 2022c). The precipitation data by second-generation particle size and velocity, Parsivel-2 can be downloaded from https://doi.org/10.6084/m9.figshare.22256617.v1 (Wu, 2023).
HX, KW, and TW planned the campaign; KW, TW, XH, FL, YZ, and WD performed the measurements; KW, TW, JY, and XH analyzed the data; KW wrote the manuscript draft; GL, BZ, and HX reviewed and edited the manuscript. All authors have read and agreed to the published version of the manuscript.
The contact author has declared that none of the authors has any competing interests.
Publisher's note: Copernicus Publications remains neutral with regard to jurisdictional claims made in the text, published maps, institutional affiliations, or any other geographical representation in this paper. While Copernicus Publications makes every effort to include appropriate place names, the final responsibility lies with the authors.
We thank photographer Zhao Dongting, who took the pictures of IC lightning and hail particles falling to the ground; The National Satellite Meteorological Center of the China Meteorological Administration for providing support with the observational data; The European Centre for Medium-Range Weather Forecasts for providing support with atmospheric reanalysis data.
This paper was edited by Daniel Perez-Ramirez and reviewed by two anonymous referees.
Baars, H., Seifert, P., Engelmann, R., and Wandinger, U.: Target categorization of aerosol and clouds by continuous multiwavelength-polarization lidar measurements, Atmos. Meas. Tech., 10, 3175–3201, https://doi.org/10.5194/amt-10-3175-2017, 2017.
Banakh, V. A. and Smalikho, I. N.: Lidar Studies of Wind Turbulence in the Stable Atmospheric Boundary Layer, Remote Sens.-Basel, 10, 1219, https://doi.org/10.3390/rs10081219, 2018.
Banakh, V. A., Brewer, A., Pichugina, E. L., and Smalikho, I. N.: Measurements of wind velocity and direction with coherent Doppler lidar in conditions of a weak echo signal, Atmospheric and Oceanic Optics, 23, 381–388, https://doi.org/10.1134/S1024856010050076, 2010.
Banakh, V. A., Smalikho, I. N., and Falits, A. V.: Estimation of the turbulence energy dissipation rate in the atmospheric boundary layer from measurements of the radial wind velocity by micropulse coherent Doppler lidar, Opt. Express, 25, 22679–22692, https://doi.org/10.1364/OE.25.022679, 2017.
Banakh, V. A., Smalikho, I. N., and Falits, A. V.: Estimation of the height of the turbulent mixing layer from data of Doppler lidar measurements using conical scanning by a probe beam, Atmos. Meas. Tech., 14, 1511–1524, https://doi.org/10.5194/amt-14-1511-2021, 2021.
Beard, K. V.: Terminal Velocity and Shape of Cloud and Precipitation Drops Aloft, J. Atmos. Sci., 33, 851–864, https://doi.org/10.1175/1520-0469(1976)033<0851:TVASOC>2.0.CO;2, 1976.
Bian, Y., Liu, L., Zheng, J., Wu, S., and Dai, G.: Classification of Cloud Phase Using Combined Ground-Based Polarization Lidar and Millimeter Cloud Radar Observations Over the Tibetan Plateau, IEEE T. Geosci. Remote, 61, 1–13, https://doi.org/10.1109/TGRS.2023.3313798, 2023.
Bruning, E. C., Rust, W. D., Schuur, T. J., MacGorman, D. R., Krehbiel, P. R., and Rison, W.: Electrical and Polarimetric Radar Observations of a Multicell Storm in TELEX, Mon. Weather Rev., 135, 2525–2544, https://doi.org/10.1175/MWR3421.1, 2007.
Bruning, E. C., Rust, W. D., MacGorman, D. R., Biggerstaff, M. I., and Schuur, T. J.: Formation of Charge Structures in a Supercell, Mon. Weather Rev., 138, 3740–3761, https://doi.org/10.1175/2010mwr3160.1, 2010.
Bruning, E. C., Weiss, S. A., and Calhoun, K. M.: Continuous variability in thunderstorm primary electrification and an evaluation of inverted-polarity terminology, Atmos. Res., 135–136, 274–284, https://doi.org/10.1016/j.atmosres.2012.10.009, 2014.
Bryan, G. H., Wyngaard, J. C., and Fritsch, J. M.: Resolution Requirements for the Simulation of Deep Moist Convection, Mon. Weather Rev., 131, 2394–2416, https://doi.org/10.1175/1520-0493(2003)131<2394:RRFTSO>2.0.CO;2, 2003.
Calhoun, K. M., Mansell, E. R., MacGorman, D. R., and Dowell, D. C.: Numerical Simulations of Lightning and Storm Charge of the 29–30 May 2004 Geary, Oklahoma, Supercell Thunderstorm Using EnKF Mobile Radar Data Assimilation, Mon. Weather Rev., 142, 3977–3997, https://doi.org/10.1175/mwr-d-13-00403.1, 2014.
Carey, L. D. and Buffalo, K. M.: Environmental Control of Cloud-to-Ground Lightning Polarity in Severe Storms, Mon. Weather Rev., 135, 1327–1353, https://doi.org/10.1175/MWR3361.1, 2007.
Carey, L. D. and Rutledge, S. A.: The Relationship between Precipitation and Lightning in Tropical Island Convection: A C-Band Polarimetric Radar Study, Mon. Weather Rev., 128, 2687–2710, https://doi.org/10.1175/1520-0493(2000)128<2687:TRBPAL>2.0.CO;2, 2000.
Chen, Z., Sun, J., Qie, X., Zhang, Y., Ying, Z., Xiao, X., and Cao, D.: A Method to Update Model Kinematic States by Assimilating Satellite-Observed Total Lightning Data to Improve Convective Analysis and Forecasting, J. Geophys. Res.-Atmos., 125, e2020JD033330, https://doi.org/10.1029/2020JD033330, 2020.
Cheng, S., Wang, J., Cai, L., Zhou, M., Su, R., Huang, Y., and Li, Q.: Characterising the dynamic movement of thunderstorms using very low- and low-frequency (VLF/LF) total lightning data over the Pearl River Delta region, Atmos. Chem. Phys., 22, 10045–10059, https://doi.org/10.5194/acp-22-10045-2022, 2022.
Chmielewski, V. C., Bruning, E. C., and Ancell, B. C.: Variations of Thunderstorm Charge Structures in West Texas on 4 June 2012, J. Geophys. Res.-Atmos., 123, 9502–9523, https://doi.org/10.1029/2018JD029006, 2018.
Cooray, V.: Charge Generation in Thunderclouds and Different Forms of Lightning Flashes, in: An Introduction to Lightning, Springer Netherlands, Dordrecht, 79–89, https://doi.org/10.1007/978-94-017-8938-7_6, 2015.
Coquillat, S., Pont, V., Lambert, D., Houel, R., Pardé, M., Kreitz, M., Ricard, D., Gonneau, E., de Guibert, P., and Prieur, S.: Six years of electrified convection over the island of Corsica monitored by SAETTA: General trends and anomalously electrified thunderstorms during African dust south flow events, Atmos. Res., 275, 106227, https://doi.org/10.1016/j.atmosres.2022.106227, 2022.
Dye, J. E., Winn, W. P., Jones, J. J., and Breed, D. W.: The electrification of New Mexico thunderstorms: 1. Relationship between precipitation development and the onset of electrification, J. Geophys. Res.-Atmos., 94, 8643–8656, https://doi.org/10.1029/JD094iD06p08643, 1989.
Erdmann, F., Defer, E., Caumont, O., Blakeslee, R. J., Pédeboy, S., and Coquillat, S.: Concurrent satellite and ground-based lightning observations from the Optical Lightning Imaging Sensor (ISS-LIS), the low-frequency network Meteorage and the SAETTA Lightning Mapping Array (LMA) in the northwestern Mediterranean region, Atmos. Meas. Tech., 13, 853–875, https://doi.org/10.5194/amt-13-853-2020, 2020.
Fan, J., Rosenfeld, D., Zhang, Y., Giangrande, S. E., Li, Z., Machado, L. A. T., Martin, S. T., Yang, Y., Wang, J., Artaxo, P., Barbosa, H. M. J., Braga, R. C., Comstock, J. M., Feng, Z., Gao, W., Gomes, H. B., Mei, F., Pöhlker, C., Pöhlker, M. L., Pöschl, U., and Souza, R. A. F. D.: Substantial convection and precipitation enhancements by ultrafine aerosol particles, Science, 359, 411–418, https://doi.org/10.1126/science.aan8461, 2018.
Fan, Y., Lu, G., Zhang, Y., Lyu, W., Zheng, D., Fan, X., Li, X., and Zhang, Y.: Characterizing Radio Frequency Magnetic Radiation of Initial Upward Leader Stepping in Triggered Lightning With Interferometric Lightning Mapping, Geophys. Res. Lett., 47, e2020GL089392, https://doi.org/10.1029/2020GL089392, 2020.
Feist, M. M., Westbrook, C. D., Clark, P. A., Stein, T. H. M., Lean, H. W., and Stirling, A. J.: Statistics of convective cloud turbulence from a comprehensive turbulence retrieval method for radar observations, Q. J. Roy. Meteor. Soc., 145, 727–744, https://doi.org/10.1002/qj.3462, 2019.
FengYun Satellite Data Center: http://satellite.nsmc.org.cn/portalsite/default.aspx (last access: 30 November 2023), 2023.
Figueras i Ventura, J., Pineda, N., Besic, N., Grazioli, J., Hering, A., van der Velde, O. A., Romero, D., Sunjerga, A., Mostajabi, A., Azadifar, M., Rubinstein, M., Montanyà, J., Germann, U., and Rachidi, F.: Analysis of the lightning production of convective cells, Atmos. Meas. Tech., 12, 5573–5591, https://doi.org/10.5194/amt-12-5573-2019, 2019a.
Figueras i Ventura, J., Pineda, N., Besic, N., Grazioli, J., Hering, A., van der Velde, O. A., Romero, D., Sunjerga, A., Mostajabi, A., Azadifar, M., Rubinstein, M., Montanyà, J., Germann, U., and Rachidi, F.: Polarimetric radar characteristics of lightning initiation and propagating channels, Atmos. Meas. Tech., 12, 2881–2911, https://doi.org/10.5194/amt-12-2881-2019, 2019b.
Fuchs, B. R., Rutledge, S. A., Bruning, E. C., Pierce, J. R., Kodros, J. K., Lang, T. J., MacGorman, D. R., Krehbiel, P. R., and Rison, W.: Environmental controls on storm intensity and charge structure in multiple regions of the continental United States, J. Geophys. Res.-Atmos., 120, 6575–6596, https://doi.org/10.1002/2015JD023271, 2015.
Fuchs, B. R., Bruning, E. C., Rutledge, S. A., Carey, L. D., Krehbiel, P. R., and Rison, W.: Climatological analyses of LMA data with an open-source lightning flash-clustering algorithm, J. Geophys. Res.-Atmos., 121, 8625–8648, https://doi.org/10.1002/2015JD024663, 2016.
Fuchs, B. R., Rutledge, S. A., Dolan, B., Carey, L. D., and Schultz, C.: Microphysical and Kinematic Processes Associated With Anomalous Charge Structures in Isolated Convection, J. Geophys. Res.-Atmos., 123, 6505–6528, https://doi.org/10.1029/2017JD027540, 2018.
Goodman, S. J., Buechler, D. E., Wright, P. D., and Rust, W. D.: Lightning and precipitation history of a microburst-producing storm, Geophys. Res. Lett., 15, 1185–1188, https://doi.org/10.1029/GL015i011p01185, 1988.
Hallett, J., Sax, R. I., Lamb, D., and Murty, A. S. R.: Aircraft measurements of ice in Florida cumuli, Q. J. Roy. Meteor. Soc., 104, 631–651, https://doi.org/10.1002/qj.49710444108, 1978.
He, G., Li, G., Zou, X., and Ray, P. S.: Applications of a Velocity Dealiasing Scheme to Data from the China New Generation Weather Radar System (CINRAD), Weather Forecast., 27, 218–230, https://doi.org/10.1175/WAF-D-11-00054.1, 2012.
Hersbach, H., Bell, B., Berrisford, P., Hirahara, S., Horányi, A., Muñoz-Sabater, J., Nicolas, J., Peubey, C., Radu, R., Schepers, D., Simmons, A., Soci, C., Abdalla, S., Abellan, X., Balsamo, G., Bechtold, P., Biavati, G., Bidlot, J., Bonavita, M., De Chiara, G., Dahlgren, P., Dee, D., Diamantakis, M., Dragani, R., Flemming, J., Forbes, R., Fuentes, M., Geer, A., Haimberger, L., Healy, S., Hogan, R. J., Hólm, E., Janisková, M., Keeley, S., Laloyaux, P., Lopez, P., Lupu, C., Radnoti, G., de Rosnay, P., Rozum, I., Vamborg, F., Villaume, S., and Thépaut, J.-N.: Complete ERA5 from 1940: Fifth generation of ECMWF atmospheric reanalyses of the global climate, Copernicus Climate Change Service (C3S) Data Store (CDS), https://doi.org/10.24381/cds.143582cf, 2017.
Hersbach, H., Bell, B., Berrisford, P., Hirahara, S., Horányi, A., Muñoz-Sabater, J., Nicolas, J., Peubey, C., Radu, R., Schepers, D., Simmons, A., Soci, C., Abdalla, S., Abellan, X., Balsamo, G., Bechtold, P., Biavati, G., Bidlot, J., Bonavita, M., De Chiara, G., Dahlgren, P., Dee, D., Diamantakis, M., Dragani, R., Flemming, J., Forbes, R., Fuentes, M., Geer, A., Haimberger, L., Healy, S., Hogan, R. J., Hólm, E., Janisková, M., Keeley, S., Laloyaux, P., Lopez, P., Lupu, C., Radnoti, G., de Rosnay, P., Rozum, I., Vamborg, F., Villaume, S., and Thépaut, J.-N.: The ERA5 global reanalysis, Q. J. Roy. Meteor. Soc., 146, 1999–2049, https://doi.org/10.1002/qj.3803, 2020.
Jayaratne, E. R., Saunders, C. P. R., and Hallett, J.: Laboratory studies of the charging of soft-hail during ice crystal interactions, Q. J. Roy. Meteor. Soc., 109, 609–630, https://doi.org/10.1002/qj.49710946111, 1983.
Jia, M., Yuan, J., Wang, C., Xia, H., Wu, Y., Zhao, L., Wei, T., Wu, J., Wang, L., Gu, S.-Y., Liu, L., Lu, D., Chen, R., Xue, X., and Dou, X.: Long-lived high-frequency gravity waves in the atmospheric boundary layer: observations and simulations, Atmos. Chem. Phys., 19, 15431–15446, https://doi.org/10.5194/acp-19-15431-2019, 2019.
Khanal, S. and Wang, Z.: Uncertainties in MODIS-Based Cloud Liquid Water Path Retrievals at High Latitudes Due to Mixed-Phase Clouds and Cloud Top Height Inhomogeneity, J. Geophys. Res.-Atmos., 123, 11154–11172, https://doi.org/10.1029/2018JD028558, 2018.
Lang, T. J. and Rutledge, S. A.: A Framework for the Statistical Analysis of Large Radar and Lightning Datasets: Results from STEPS 2000, Mon. Weather Rev., 139, 2536–2551, https://doi.org/10.1175/mwr-d-10-05000.1, 2011.
Lang, T. J., Miller, L. J., Weisman, M., Rutledge, S. A., Barker, L. J., Bringi, V. N., Chandrasekar, V., Detwiler, A., Doesken, N., Helsdon, J., Knight, C., Krehbiel, P., Lyons, W. A., MacGorman, D., Rasmussen, E., Rison, W., Rust, W. D., and Thomas, R. J.: The Severe Thunderstorm Electrification and Precipitation Study, B. Am. Meteorol. Soc., 85, 1107–1126, https://doi.org/10.1175/bams-85-8-1107, 2004.
Li, Y., Zhang, G., and Zhang, Y.: Evolution of the Charge Structure and Lightning Discharge Characteristics of a Qinghai-Tibet Plateau Thunderstorm Dominated by Negative Cloud-to-Ground Flashes, J. Geophys. Res.-Atmos., 125, e2019JD031129, https://doi.org/10.1029/2019JD031129, 2020.
Liu, F., Zhu, B., Lu, G., Qin, Z., Lei, J., Peng, K.-M., Chen, A. B., Huang, A., Cummer, S. A., Chen, M., Ma, M., Lyu, F., and Zhou, H.: Observations of Blue Discharges Associated With Negative Narrow Bipolar Events in Active Deep Convection, Geophys. Res. Lett., 45, 2842–2851, https://doi.org/10.1002/2017GL076207, 2018.
Liu, F., Lu, G., Neubert, T., Lei, J., Chanrion, O., Østgaard, N., Li, D., Luque, A., Gordillo-Vázquez, F. J., Reglero, V., Lyu, W., and Zhu, B.: Optical emissions associated with narrow bipolar events from thunderstorm clouds penetrating into the stratosphere, Nat. Commun., 12, 6631, https://doi.org/10.1038/s41467-021-26914-4, 2021a.
Liu, F., Zhu, B., Lu, G., Lei, J., Shao, J., Chen, Y., Huang, A., Ma, M., Qin, Z., Zhong, J., Ren, H., Wang, Z., Wan, Z., Liu, G., Peng, C., Peng, K.-M., and Zhou, H.: Meteorological and Electrical Conditions of Two Mid-latitude Thunderstorms Producing Blue Discharges, J. Geophys. Res.-Atmos., 126, e2020JD033648, https://doi.org/10.1029/2020JD033648, 2021b.
Lottman, B. T. and Frehlich, R.: Extracting vertical winds from simulated clouds with ground-based coherent Doppler lidar, Appl. Optics, 37, 8297–8305, https://doi.org/10.1364/AO.37.008297, 1998.
Low, T. B. and List, R.: Collision, Coalescence and Breakup of Raindrops. Part I: Experimentally Established Coalescence Efficiencies and Fragment Size Distributions in Breakup, J. Atmos. Sci., 39, 1591–1606, https://doi.org/10.1175/1520-0469(1982)039<1591:CCABOR>2.0.CO;2, 1982.
Marshall, T. C. and Winn, W. P.: Measurements of charged precipitation in a New Mexico thunderstorm: lower positive charge centers, J. Geophys. Res., 87, 7141–7157, https://doi.org/10.1029/JC087iC09p07141, 1982.
Mecikalski, R. M. and Carey, L. D.: Radar Reflectivity and Altitude Distributions of Lightning as a Function of IC, CG, and HY Flashes: Implications for LNOx Production, J. Geophys. Res.-Atmos., 123, 12796–12813, https://doi.org/10.1029/2018JD029263, 2018.
Medina, B. L., Carey, L. D., Lang, T. J., Bitzer, P. M., Deierling, W., and Zhu, Y.: Characterizing Charge Structure in Central Argentina Thunderstorms During RELAMPAGO Utilizing a New Charge Layer Polarity Identification Method, Earth and Space Science, 8, e2021EA001803, https://doi.org/10.1029/2021EA001803, 2021.
Qie, X., Yuan, S., Chen, Z., Wang, D., Liu, D., Sun, M., Sun, Z., Srivastava, A., Zhang, H., Lu, J., Xiao, H., Bi, Y., Feng, L., Tian, Y., Xu, Y., Jiang, R., Liu, M., Xiao, X., Duan, S., Su, D., Sun, C., Xu, W., Zhang, Y., Lu, G., Zhang, D.-L., Yin, Y., and Yu, Y.: Understanding the dynamical-microphysical-electrical processes associated with severe thunderstorms over the Beijing metropolitan region, Sci. China Earth Sci., 64, 10–26, https://doi.org/10.1007/s11430-020-9656-8, 2021.
Qiu, J., Xia, H., Shangguan, M., Dou, X., Li, M., Wang, C., Shang, X., Lin, S., and Liu, J.: Micro-pulse polarization lidar at 1.5 µm using a single superconducting nanowire single-photon detector, Opt. Lett., 42, 4454–4457, https://doi.org/10.1364/OL.42.004454, 2017.
Reynolds, S. E., Brook, M., and Gourley, M. F.: THUNDERSTORM CHARGE SEPARATION, J. Atmos. Sci., 14, 426–436, https://doi.org/10.1175/1520-0469(1957)014<0426:Tcs>2.0.Co;2, 1957.
Sassen, K. and Wang, Z.: Classifying clouds around the globe with the CloudSat radar: 1 year of results, Geophys. Res. Lett., 35, L04805, https://doi.org/10.1029/2007GL032591, 2008.
Sathe, A. and Mann, J.: A review of turbulence measurements using ground-based wind lidars, Atmos. Meas. Tech., 6, 3147–3167, https://doi.org/10.5194/amt-6-3147-2013, 2013.
Saunders, C.: Charge Separation Mechanisms in Clouds, Space Sci. Rev., 137, 335, https://doi.org/10.1007/s11214-008-9345-0, 2008.
Smalikho, I. N. and Banakh, V. A.: Measurements of wind turbulence parameters by a conically scanning coherent Doppler lidar in the atmospheric boundary layer, Atmos. Meas. Tech., 10, 4191–4208, https://doi.org/10.5194/amt-10-4191-2017, 2017.
Stolzenburg, M., Rust, W. D., and Marshall, T. C.: Electrical structure in thunderstorm convective regions: 3. Synthesis, J. Geophys. Res.-Atmos., 103, 14097–14108, https://doi.org/10.1029/97JD03545, 1998.
Stolzenburg, M., Marshall, T. C., Rust, W. D., and Bartels, D. L.: Two simultaneous charge structures in thunderstorm convection, J. Geophys. Res.-Atmos., 107, ACL 5-1–ACL 5-12, https://doi.org/10.1029/2001JD000904, 2002.
Stolzenburg, M., Marshall, T. C., and Krehbiel, P. R.: Initial electrification to the first lightning flash in New Mexico thunderstorms, J. Geophys. Res.-Atmos., 120, 11253–11276, https://doi.org/10.1002/2015JD023988, 2015.
Stough, S. M., Carey, L. D., Schultz, C. J., and Cecil, D. J.: Examining Conditions Supporting the Development of Anomalous Charge Structures in Supercell Thunderstorms in the Southeastern United States, J. Geophys. Res.-Atmos., 126, e2021JD034582, https://doi.org/10.1029/2021JD034582, 2021.
Sun, M., Liu, D., Qie, X., Mansell, E. R., Yair, Y., Fierro, A. O., Yuan, S., Chen, Z., and Wang, D.: Aerosol effects on electrification and lightning discharges in a multicell thunderstorm simulated by the WRF-ELEC model, Atmos. Chem. Phys., 21, 14141–14158, https://doi.org/10.5194/acp-21-14141-2021, 2021.
Takahashi, T.: Riming electrification as a charge generation mechanism in thunderstorms, J. Atmos. Sci., 35, 1536–1548, https://doi.org/10.1175/1520-0469(1978)035<1536:REAACG>2.0.CO;2, 1978.
Takahashi, T., Sugimoto, S., Kawano, T., and Suzuki, K.: Riming Electrification in Hokuriku Winter Clouds and Comparison with Laboratory Observations, J. Atmos. Sci., 74, 431–447, https://doi.org/10.1175/JAS-D-16-0154.1, 2017.
Tang, D., Wei, T., Yuan, J., Xia, H., and Dou, X.: Observation of bioaerosol transport using wideband integrated bioaerosol sensor and coherent Doppler lidar, Atmos. Meas. Tech., 15, 2819–2838, https://doi.org/10.5194/amt-15-2819-2022, 2022.
Tokay, A., Wolff, D. B., and Petersen, W. A.: Evaluation of the New Version of the Laser-Optical Disdrometer, OTT Parsivel2, J. Atmos. Ocean. Tech., 31, 1276–1288, https://doi.org/10.1175/jtech-d-13-00174.1, 2014.
Wang, C., Xia, H., Shangguan, M., Wu, Y., Wang, L., Zhao, L., Qiu, J., and Zhang, R.: 1.5 µm polarization coherent lidar incorporating time-division multiplexing, Opt. Express, 25, 20663–20674, https://doi.org/10.1364/oe.25.020663, 2017.
Wang, C., Xia, H., Wu, Y., Dong, J., Wei, T., Wang, L., and Dou, X.: Meter-scale spatial-resolution-coherent Doppler wind lidar based on Golay coding, Opt. Lett., 44, 311–314, https://doi.org/10.1364/OL.44.000311, 2019a.
Wang, C., Jia, M., Xia, H., Wu, Y., Wei, T., Shang, X., Yang, C., Xue, X., and Dou, X.: Relationship analysis of PM2.5 and boundary layer height using an aerosol and turbulence detection lidar, Atmos. Meas. Tech., 12, 3303–3315, https://doi.org/10.5194/amt-12-3303-2019, 2019b.
Wang, D., Stachlewska, I. S., Delanoë, J., Ene, D., Song, X., and Schüttemeyer, D.: Spatio-temporal discrimination of molecular, aerosol and cloud scattering and polarization using a combination of a Raman lidar, Doppler cloud radar and microwave radiometer, Opt. Express, 28, 20117–20134, https://doi.org/10.1364/OE.393625, 2020.
Wang, F., Liu, H., Dong, W., Zhang, Y., Yao, W., and Zheng, D.: Radar Reflectivity of Lightning Flashes in Stratiform Regions of Mesoscale Convective Systems, J. Geophys. Res.-Atmos., 124, 14114–14132, https://doi.org/10.1029/2019JD031238, 2019.
Wang, H., Liu, Y., Duan, J., Shi, Y., Lou, X., and Li, J.: Assimilation of Radar Reflectivity Using a Time-Lagged Ensemble Based Ensemble Kalman Filter With the “Cloud-Dependent” Background Error Covariances, J. Geophys. Res.-Atmos., 127, e2021JD036207, https://doi.org/10.1029/2021JD036207, 2022.
Wang, L., Qiang, W., Xia, H., Wei, T., Yuan, J., and Jiang, P.: Robust Solution for Boundary Layer Height Detections with Coherent Doppler Wind Lidar, Adv. Atmos. Sci., 38, 1920–1928, https://doi.org/10.1007/s00376-021-1068-0, 2021.
Wang, L., Yuan, J., Xia, H., Zhao, L., and Wu, Y.: Marine Mixed Layer Height Detection Using Ship-Borne Coherent Doppler Wind Lidar Based on Constant Turbulence Threshold, Remote Sens.-Basel, 14, 745, https://doi.org/10.3390/rs14030745, 2022.
Wei, T., Xia, H., Hu, J., Wang, C., Shangguan, M., Wang, L., Jia, M., and Dou, X.: Simultaneous wind and rainfall detection by power spectrum analysis using a VAD scanning coherent Doppler lidar, Opt. Express, 27, 31235–31245, https://doi.org/10.1364/oe.27.031235, 2019.
Wei, T., Xia, H., Wu, Y., Yuan, J., Wang, C., and Dou, X.: Inversion probability enhancement of all-fiber CDWL by noise modeling and robust fitting, Opt. Express, 28, 29662–29675, https://doi.org/10.1364/oe.401054, 2020.
Wei, T., Xia, H., Yue, B., Wu, Y., and Liu, Q.: Remote sensing of raindrop size distribution using the coherent Doppler lidar, Opt. Express, 29, 17246–17257, https://doi.org/10.1364/OE.426326, 2021.
Wei, T., Xia, H., Wu, K., Yang, Y., Liu, Q., and Ding, W.: Dark/bright band of a melting layer detected by coherent Doppler lidar and micro rain radar, Opt. Express, 30, 3654–3664, https://doi.org/10.1364/oe.450714, 2022.
Williams, E. R.: The Electrification of Thunderstorms, Sci. Am., 259, 88–99, https://www.jstor.org/stable/24989265 (last access: 30 November 2023), 1988.
Williams, E. R.: The tripole structure of thunderstorms, J. Geophys. Res.-Atmos., 94, 13151–13167, https://doi.org/10.1029/JD094iD11p13151, 1989.
Williams, E. R.: The Electrification of Severe Storms, in: Severe Convective Storms, edited by: Doswell, C. A., American Meteorological Society, Boston, MA, 527–561, https://doi.org/10.1007/978-1-935704-06-5_13, 2001.
Wu, K.: A thundercloud lidar results during the experiment, figshare [data set], https://doi.org/10.6084/m9.figshare.20326350.v2, 2022a.
Wu, K.: A thundercloud rader results during the experiment, figshare [data set], https://doi.org/10.6084/m9.figshare.20326377.v1, 2022b.
Wu, K.: Lightning data detected by lightning location array, figshare [data set], https://doi.org/10.6084/m9.figshare.20588385.v4, 2022c.
Wu, K.: raw data and Converted data video of CDWL during this experiment, figshare [data set], https://doi.org/10.6084/m9.figshare.21590433.v3, 2022d.
Wu, K.: raindrop spectrometer data, figshare [data set], https://doi.org/10.6084/m9.figshare.22256617.v1, 2023.
Yang, J., Zhang, Z., Wei, C., Lu, F., and Guo, Q.: Introducing the New Generation of Chinese Geostationary Weather Satellites, Fengyun-4, B. Am. Meteorol. Soc., 98, 1637–1658, https://doi.org/10.1175/bams-d-16-0065.1, 2017.
Yang, J., Zhao, K., Zheng, Y., Chen, H., and Chen, G.: Microphysical Structure of Thunderstorms and Their Lightning Activity During the mei-yu and Post-mei-yu Periods Over Nanjing, Yangtze River Delta, Geophys. Res. Lett., 49, e2022GL100952, https://doi.org/10.1029/2022GL100952, 2022.
Yuan, J., Xia, H., Wei, T., Wang, L., Yue, B., and Wu, Y.: Identifying cloud, precipitation, windshear, and turbulence by deep analysis of the power spectrum of coherent Doppler wind lidar, Opt. Express, 28, 37406–37418, https://doi.org/10.1364/oe.412809, 2020.
Yuan, J., Wu, K., Wei, T., Wang, L., Shu, Z., Yang, Y., and Xia, H.: Cloud Seeding Evidenced by Coherent Doppler Wind Lidar, Remote Sens.-Basel, 13, 3815, https://doi.org/10.3390/rs13193815, 2021.
Yuan, J., Su, L., Xia, H., Li, Y., Zhang, M., Zhen, G., and Li, J.: Microburst, Windshear, Gust Front, and Vortex Detection in Mega Airport Using a Single Coherent Doppler Wind Lidar, Remote Sens.-Basel, 14, https://doi.org/10.3390/rs14071626, 2022a.
Yuan, J., Wu, Y., Shu, Z., Su, L., Tang, D., Yang, Y., Dong, J., Yu, S., Zhang, Z., and Xia, H.: Real-Time Synchronous 3-D Detection of Air Pollution and Wind Using a Solo Coherent Doppler Wind Lidar, Remote Sens.-Basel, 14, 2809, https://doi.org/10.3390/rs14122809, 2022b.
Zhang, Y., Zhang, Y., Zou, M., Wang, J., Li, Y., Tan, Y., Feng, Y., Zhang, H., and Zhu, S.: Advances in Lightning Monitoring and Location Technology Research in China, Remote Sens.-Basel, 14, 1293, https://doi.org/10.3390/rs14051293, 2022.
Zhao, C., Zhang, Y., Zheng, D., Zhou, Y., Xiao, H., and Zhang, X.: An improved hydrometeor identification method for X-band dual-polarization radar and its application for one summer Hailstorm over Northern China, Atmos. Res., 245, 105075, https://doi.org/10.1016/j.atmosres.2020.105075, 2020.