the Creative Commons Attribution 4.0 License.
the Creative Commons Attribution 4.0 License.
 | 07 Dec 2023
Performance assessment of state-of-the-art and novel methods for remote compliance monitoring of sulfur emissions from shipping
Jörg Beecken
Andreas Weigelt
Simone Griesel
Johan Mellqvist
Alexander V. Conde Jacobo
Daniëlle van Dinther
Jan Duyzer
Jon Knudsen
Bettina Knudsen
Leonidas Ntziachristos
The fuel sulfur content (FSC) of ocean-going and inland vessels was measured simultaneously by eight different state-of-the-art and novel monitoring systems during a 6-week campaign at the Elbe River, at a distance of about 10 km to the port of Hamburg, Germany. Both stationary and airborne systems on unoccupied aerial vehicles (UAVs) were operated by four participating partners in a side-by-side measurement setup to measure the emission factors of the same emission sources. A novel laser spectrometer, with significantly better-precision specifications as compared with the other instruments, was used for the first time for emission monitoring regarding the International Convention for the Prevention of Pollution from Ships (MARPOL) Annex VI regulations.
The comparison took place in the North Sea sulfur emission control area (SECA), where the allowed FSC is limited to 0.10 %S. The unit %S relates to the percentage of mass sulfur per mass combusted fuel. In total, 966 plumes that originated from 436 different vessels were analysed in this study. At the same time, fuel samples obtained from 34 different vessels and bunker delivery notes (BDNs) from five frequently monitored vessels were used as a reference to assess the uncertainties of the different systems. Seven of the eight measurement systems tended to underestimate the FSC found from fuel samples and BDNs. A possible relation between underestimation and high relative humidities (above 80 %) was observed. The lowest systematic deviations were observed for the airborne systems and the novel laser spectrometer. The two UAV-borne systems showed total uncertainties of 0.07 %S and 0.09 %S (confidence level: 95 %). The novel laser spectrometer showed the lowest total uncertainty of 0.05 %S compared with other stationary sniffer systems, whose total uncertainties range from 0.08 %S to 0.09 %S. It was concluded that non-compliant vessels, with an actual FSC of the combusted fuel above 0.15 %S to 0.19 %S, can be detected by the compared systems with 95 % confidence.
- Article
(1849 KB) - Full-text XML
- BibTeX
- EndNote


The International Maritime Organization (IMO) has recognized the impact of shipping emissions to the atmosphere on health, the environment, and the climate. In 1997, the IMO amended its International Convention for the Prevention of Pollution from Ships (MARPOL, 1973) in MARPOL Annex VI, regulation 13 and regulation 14, by introducing measures to gradually decrease the emissions of air pollutants, including sulfur oxides (SOx), particulate matter, and nitrogen oxides (NOx= NO + NO2).
The emission of SOx is directly related to the sulfur content of the fuel which is oxidized during the engine combustion process and is emitted to the air as part of the exhaust gas. To limit the emission of SOx, the IMO defined the upper limits for the content of sulfur in fuel, as defined in MARPOL Annex VI, regulation 14. Ships are also allowed to bunker fuels with higher fuel sulfur content (FSC) if they are equipped with exhaust gas cleaning systems to remove sulfur compounds (MEPC.340(77), 2021). Such systems are commonly known as scrubbers. The allowed emission of SOx when using scrubbers must not exceed the equivalent levels of compliant fuels. The regulation came into force in 2005 (MARPOL, 2005). Since then, the global FSC cap was gradually reduced from 4.50 %S, i.e. percent mass of sulfur per mass of fuel, to 0.50 %S in 2020. The European Union adopted the IMO regulation in the following EU directives: 1999/32/EC, 2012/33/EC, and (EU) 2016/802 (EU, 1999, 2012, 2016). The regulation also established special sulfur emission control areas (SECAs) with more stringent rules on FSC. This includes the Baltic Sea and the North Sea, including the English Channel. The Baltic and North seas' SECAs came into effect on 19 May 2006 and 22 November 2007, respectively (MEPC.1/Circ.778/Rev.3, 2008). The maximum level of the allowed FSC was reduced in a stepwise manner until 2015 and is currently limited to 0.10 %S.
The EU directive 2015/253/EC requires that at least 10 % of the total number of individual vessels that are calling the relevant member state per year need to be inspected on board, which includes taking fuel samples. The total number of vessels is derived from the average number of ships of the 3 preceding years (EU, 2015). The fraction of the fuel samples that needs to be analysed for sulfur depends on the location of the called state. If the state is outside the SECA, partly within the SECA, or entirely within the SECA, the percentage of the samples that needs to be analysed is 20 %, 30 %, and 40 % respectively. The number can be reduced by 50 % if remote sensing methods or quick sampling methods, e.g. X-ray fluorescence (XRF), are used to monitor the FSC of individual vessels.
The compliance of vessels with regulated sulfur requirements can be remotely assessed by analysis of the chemical composition of the emitted exhaust gases (Mellqvist and Berg, 2010). Section 2.1 describes in detail how the measured ratio of sulfur dioxide (SO2) to carbon dioxide (CO2) in the emitted plume is directly linked to the FSC. The analysed plumes can be allocated to individual nearby vessels using simultaneously measured data on wind direction and speed in combination with the identity, location, and speed data received from the automatic identification system (AIS) information transmitted by each vessel.
Meanwhile, several countries have implemented their own remote compliance monitoring strategies. They are mostly based on in situ systems that extract air samples of the ship exhaust plumes, which are probed using gas analysers. The volume mixing ratio (VMR) of pollutants changes as the exhaust plume reaches the monitoring station. The contribution of the vessels' exhaust gas to the pollutant's concentration is estimated by comparing the respective VMRs in the exhaust plume with the background levels of the ambient air when the exhaust plume is not present. The in situ systems are commonly referred to as sniffers and are used around the world in different configurations (Beecken et al., 2019). Several states, such as Germany, the Netherlands, and Sweden, currently apply onshore stationary systems near shipping lanes at rivers, harbour entrances, or bridges (Alföldy et al., 2013; Balzani Lööv et al., 2014; Kattner et al., 2015; Mellqvist et al., 2017b). Similarly, mobile platforms equipped with sniffers, such as patrol vessels, can be used to monitor bypassing vessels (Beecken et al., 2015). Stationary systems are usually applied to monitor nearshore vessels and are fully automatized to run continuously. Sniffer systems can also be used to actively trace the exhaust plumes using airborne platforms such as drones (Explicit, 2016), helicopters (Explicit, 2018), or crewed aircraft (Berg, 2011; Beecken et al., 2014; Mellqvist et al., 2017b, a; Van Roy et al., 2022a, b). Measurements by aircraft and unoccupied aerial vehicle (UAV) systems can be conducted for the monitoring of vessels at any reachable location.
The Shipping Contributions to Inland Pollution Push for the Enforcement of Regulations (SCIPPER) project started in 2019 with one of the objectives being to provide evidence on the operational performance and capacity of different techniques for ship emissions monitoring to contribute to the enforcement of the relevant regulations.
This study focuses on the performance of different sniffer systems in characterizing their ability to remotely monitor vessels' compliance with sulfur limits within the SECA region, where the FSC is limited to 0.10 %S. An elaborate measurement campaign took place at the Elbe River in Germany, near the port of Hamburg, as part of the SCIPPER project. During this campaign, five state-of-the-art sniffer systems monitoring highly diluted ship emissions at distances of several hundred metres were compared with a novel system using laser spectroscopy of high sensitivity and compact-sized, UAV-borne mini-sniffer systems that typically sample much less diluted ship plumes at a range of around 50 m from the ship's funnel. The results of the measurements from these systems are compared with analysed fuel samples and bunker delivery notes of monitored vessels.
Eight different sniffer systems for the remote monitoring of ship emissions were compared in the field between 7 September and 15 October 2020 at the Elbe River, about 10 km downstream of the port of Hamburg. The tested systems are normally deployed by the participating groups in different locations, supporting local authorities in targeting suspiciously operating vessels with respect to MARPOL Annex VI. For this study, these systems were benchmarked by sampling the same vessels in the same location. The remotely assessed FSCs were further compared with the analysis of fuel samples taken as a reference on board selected, measured vessels or bunker delivery notes that were provided by shipping companies.
The participating groups that provided their instrumentation for this intercomparison study were Chalmers University of Technology from Sweden, Explicit ApS from Denmark, the German Federal Maritime and Hydrographic Agency (BSH), and the Netherlands Organization for Applied Scientific Research (TNO).
2.1 Remote assessment of fuel sulfur content
The FSC is expressed as the percent of sulfur mass over the mass of fuel in the unit %S. Using remote measurements, the FSC is calculated according to Eq. (1) (Balzani Lööv et al., 2014):
where [ΔSO2] and [ΔCO2] are the VMRs above their background levels for SO2 and CO2 respectively in the ship exhaust plume. The baseline, which is used for subtracting the background, was obtained from the ambient VMR levels before and after the plume appears in the sensor's signals. The VMRs of SO2 and CO2 are each integrated in time for the whole plume; therefore, the differences in instrument response times of the individual gas analysers are compensated for. The factor 0.232 relates to the molecular masses M(S) and M(C) of sulfur and carbon respectively as well as an assumed carbon content in fuel of 87 % (MEPC/Circ. 471, 2005). A conversion factor of 10 is also considered to express the FSC as %S when [ΔSO2] is expressed in parts per billion (ppb) and [ΔCO2] is expressed in parts per million (ppm).
For this calculation, it is assumed that all sulfur emissions in the fuel are emitted as SO2 after combustion and that other emitted sulfur species can be neglected. Grigoriadis et al. (2021) showed that sulfur to sulfate conversion is not more than 0.8 % for distillate fuels, with an expected value of around 0.5 % for the slow-cruising loads at the Elbe River, and this is the maximum bias expected from such an approximation. Likewise, it is assumed that the carbon in the fuel is nearly completely converted to CO2 in the combustion process (Moldanova et al., 2009); hence, with the measured VMR of CO2, the emitted SO2 can be directly related to the amount of fuel being used.
The exact implementations of the FSC calculation vary between the different groups according to their instrumentations and corrections for instrumental cross-sensitivities to other gas species, but they all follow the principle described above. A detailed description of the instrument's individual data analysis can be found in SCIPPER deliverable D2.3, Sect. 2 (Beecken et al., 2019).
Some groups also reported negative results for the estimated FSC. This could happen after a baseline correction for very low SO2 signals or an overcompensation for the NO cross-sensitivity by the SO2 instrument. Any estimated negative FSCs were set to zero for the comparison.
2.2 Measurement systems
All eight systems that are compared in this study estimate the FSC of passing vessels by analysing air samples from the emitted exhaust plumes and are therefore denoted as sniffers. In this study, six shore-based stationary sniffers and two compact UAV-borne mini-sniffers were compared with each other.
The systems are individually abbreviated depending on the team that operates them, i.e. BSH (bsh), Chalmers (cha), TNO (tno), and Explicit (exp). Additionally, the systems are distinguished by their type, i.e. standard sniffer (std), laser spectrometer (las), or unoccupied aerial system (uas). The three systems operated by BSH are all standard sniffers; therefore, these are further denoted by their make, i.e. Airpointer (ap) and Horiba (hor), or their deployment type as for the mobile measurement system (mms).
2.2.1 Stationary systems
Stationary monitoring systems near the waterways collect, analyse, and sniff the exhaust plumes that are transported from bypassing vessels to the sniffers by wind. Their locations are generally selected to suit the local prevailing wind conditions to increase the chances of measuring ship plumes. The operational distance to the vessel is usually several hundred metres. Therefore, the sulfur dioxide detection limit of these systems needs to be able to detect the comparably low VMR differences with respect to the background levels, which are commonly in the range of only a few parts per billion of SO2 and a few parts per million of CO2, and sensitive enough to capture the variance in the highly diluted plumes.
The allocation of the measured plumes with individual vessels is achieved through simultaneous wind and AIS data recording. Measurements are discarded in cases where several sources cannot be distinguished, such as from potentially mixed plumes of two vessels passing the sampling site at the same time.
Table 1 provides an overview of the specifications of the instrumentation used by the individual stationary systems.
Table 1Instrumentation specifications of stationary systems. The systems bsh.ap and bsh.mms use the same instrumentation but are individual systems on different physical platforms.
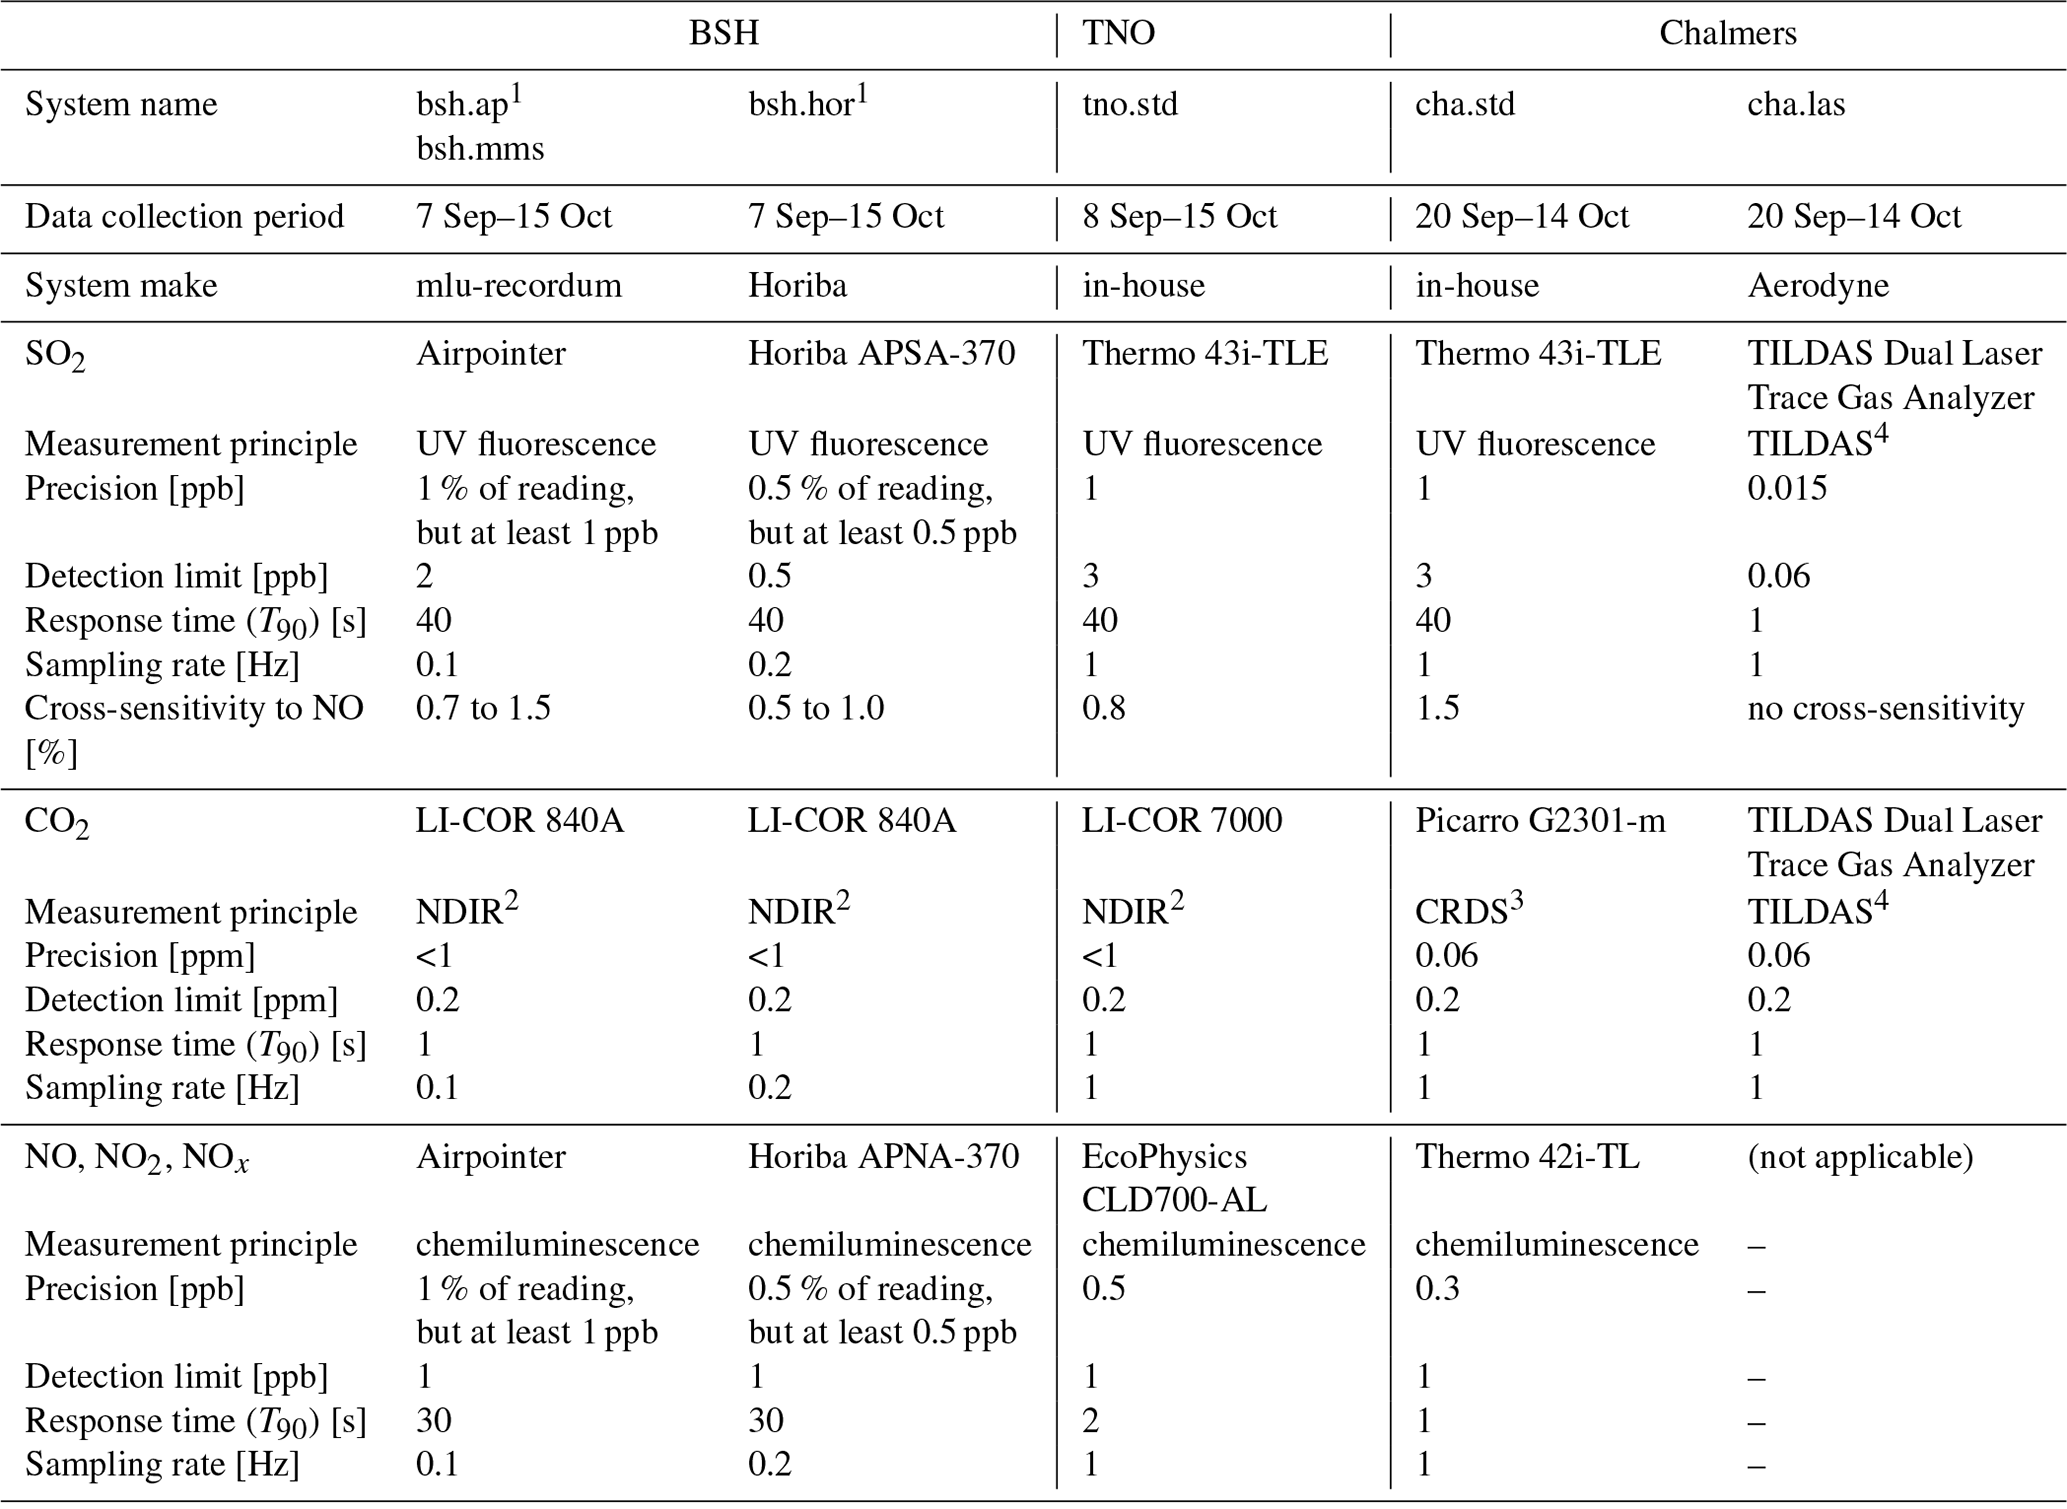
1 The systems bsh.ap and bsh.hor are permanently operated at this site. 2 NDIR: non-dispersive infrared spectroscopy. 3 CRDS: cavity ring-down spectroscopy. 4 TILDAS: tunable infrared laser direct absorption spectroscopy.
During this campaign, a novel SO2 and CO2 analyser based on tunable infrared laser direct absorption spectroscopy (TILDAS), with a particularly high sensitivity to SO2, operated by Chalmers was used for the first time for compliance monitoring. Its detection limit is about 10 to 50 times below that of the state-of-the-art stationary instruments. It is also characterized by its fast response time of 1 s, and SO2 and CO2 are analysed synchronously. The other stationary systems do not significantly differ from each other in their underlying measurement principles. The stationary instruments are henceforth divided into two groups: standard sniffers composed of the bsh.ap, bsh.hor, bsh.mms, cha.std, and tno.std systems and the highly sensitive sniffer with the cha.las system.
2.2.2 Airborne mini-sniffer systems
Airborne mini-sniffer systems are flown directly into the vessel's plume. Hence, plume samples can be collected much closer to the funnel exit, with much less dilution as compared with stationary systems. Typical sampling distances for these systems are in the range of 50 to 100 m from the funnel's exit, and the UAVs are piloted into sweet spots within the plume. Here, the sweet spot describes a plume region where the expected VMRs of the species of interest can be well quantified according to the sensor specifications. The guiding species is CO2, with its VMR targeted to be 100 to 200 ppm above the background. Carbon dioxide is measured using a compact non-dispersive infrared (NDIR) sensor, while other species such as SO2, NO, and NO2 are measured using electrochemical (EC) sensors. Typical VMRs in the sweet spots are in the range of a few tens of parts per billion for SO2, depending on the vessels' fuel and the presence of any abatement systems, and are of the order of single-digit parts per million for NO and several hundred parts per billion for NO2 respectively. Typical residence times in the sweet spots are between 30 s and several minutes.
Two mini-sniffer systems on board drones were employed in this study. One drone was equipped with the commercial Explicit mini-sniffer system, in this study named exp.uas. This integrated sensor system is used for emission monitoring on a regular basis (Explicit, 2016, 2018). A second UAS, applied by Chalmers, was used for the first time as an experimental system, herein named cha.uas. Both drones were deployed between 13 and 16 September 2020.
The specifications of both systems are similar. The compact NDIR sensors provide precision and detection limits below 10 ppm for CO2 and a T90 response time of about 20 s. The precision of the SO2 sensors is around 7 ppb, and their detection limit is around 20 ppb with a T90 response time of 20 s. The SO2 sensors show a strong negative response to NO2 by 120 %, which is corrected for by using simultaneous NO2 measurements. The NO sensors in both UASs have a precision and detection limit below 40 ppb and a T90 response time of about 25 s. The NO2 sensors have a precision and detection limit below 20 ppb and a T90 response time of below 80 s.
It was observed that the response times of the EC sensors depend on the actual VMR and are of the order of a few seconds to about 20 s faster for the typically observed VMR ranges during the ship emission monitoring operations mentioned earlier. The sampling rate is 1 Hz for both exp.uas and cha.uas.
2.3 Calibration
The calibration of each stationary system was conducted in a similar way by the different groups. Dry zero gas, which is free of any of the targeted species, and dry calibration gas at known VMR levels were successively fed to the instruments for a certain amount of time until the instrument's response had stabilized. However, the calibration schemes and applied gas VMRs for the different systems differed depending on the group; see Table 2.
Table 2Calibration parameters for autonomously operated stationary systems by group.
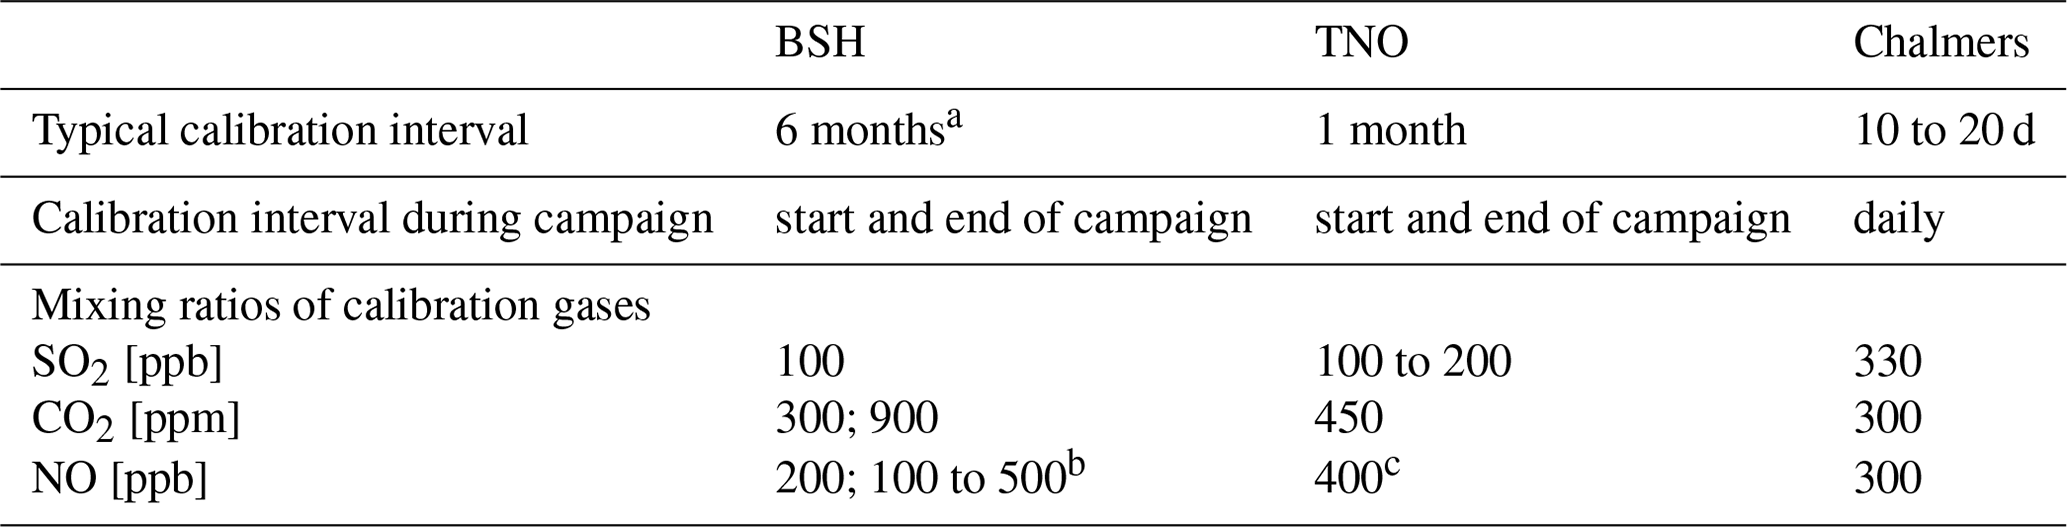
a Additional regular automatic validation with internal VMR standards supplied by permeation tubes at a 25 h interval. b Adjustable dilution with a gas mixing chamber from 40 ppm to 5 VMR levels between 100 and 500 ppb. Used for cross-sensitivity evaluation. c The Sonimix 6000 C2 dilution system was used to vary the NO concentration during calibration between 0 and 90 ppb.
The exp.uas was found to be stable and reliable for more than 100 h of operation through drift and performance tests conducted by a reference laboratory according to International Organization for Standardization (ISO) standard EN ISO 6145-1. New sensors are calibrated before in-field deployment by a reference laboratory to ensure that the units work within the given uncertainties. The EC sensors have a lifetime of at least 100 h of operation and can be operated for at least 1 year after production, without the effects of sensor deterioration impacting the measurements (Explicit, 2018), and they are replaced accordingly.
Chalmers calibrated its mini-sniffer system before the campaign against reference analysers in the laboratory by simultaneously exposing the systems to gas mixtures of different VMRs.
2.4 Uncertainty
The groups used individual approaches to assess the uncertainty of their measurements, which they reported along with the estimated FSC. For the outcome of this study, the results are shown in a harmonized representation based on an expended uncertainty developed from the intercomparison with collected reference data.
2.4.1 Reported uncertainty
So far, the different measurement groups have used their own calculation and reporting processes, which are presented in detail in Beecken et al. (2019) and Mellqvist et al. (2022). Hence, any reported uncertainties in the FSCs are based on uncertainty calculation procedures that may differ between the various teams. In the current study, two alternative approaches were followed to determine the uncertainty in the measurements of each system.
In the first approach (type A), the uncertainty is estimated only based on the characteristics of the measurement of each plume. It is based on an error budget, which generally includes the standard deviations of the individual signals of the target species, i.e. CO2 and SO2, as well as individually observed uncertainties from the calibration and due to any cross-sensitivities. On top of this, BSH considers the uncertainty in the assumption of the complete conversion of sulfur to SO2 and carbon to CO2 and the influence of relative humidity by estimated impact factors. Chalmers also considers the differences in the background levels before and after the detected plume and the variability between successive calibrations.
Explicit, on the other hand, reports their uncertainties according to a predetermined scheme (type B). The uncertainties of the sensors are characterized according to ISO 61451 and ISO/International Electrotechnical Commission (IEC) Guide 98-3:2008 (2008) at a reference laboratory and are validated by comparisons with fuel samples during field measurements. The tests were conducted under different representative environmental conditions and different mixing gas ratios, corresponding to different FSCs and distances to the emission stack. Sensor cross-sensitivities were also characterized in this manner. It was found that the observed uncertainties only showed a significant dependence on the calculated SO2 to CO2 ratio and hence FSC. Therefore, the reported uncertainty for exp.uas is only a function of the calculated FSC of the measured plumes.
Currently, there is a difference between the confidence levels of the reported uncertainties, which are also used to report results to authorities. While Chalmers reports uncertainties at a confidence level of 95 %, the other groups report the uncertainty as 1 standard deviation, which corresponds to a confidence level of about 68 %. The analysis intentionally uses the reported values to show the potential and need for harmonization.
2.4.2 Expanded uncertainty
The method of expanded uncertainty is used to describe the performance of the systems based on the results from the comparison of the estimated FSC of the plume measurements with the expected FSC, and it is expressed according to ISO/IEC 98-3:2008 (2008) and Magnusson and Ellison (2008). The total uncertainty can be calculated by using the following equation:
where Urandom describes the random uncertainty, which corresponds to the standard deviation found as a result of the comparison. The contribution of the bias to the total uncertainty is calculated based on an assumed rectangular distribution as a conservative estimate of the probability distribution function for the bias. Hence, the observed mean deviation in the bias term, , is accordingly divided by for the calculation of its standard deviation. The overall distribution of the total uncertainty is assumed to follow a t distribution. The factor k depends on the confidence level, which in this study is chosen to be 95 %, and the number of observations. In this study, k was found to be in the range between 1.99 and 2.07, depending on the total number of comparisons of the respective system.
2.5 Location
This SCIPPER campaign took place in Wedel near Hamburg at the Elbe River waterway connecting the port of Hamburg with the North Sea. According to IMO's regulation, the maximum FSC that ocean-going ships are allowed to use here is 0.10 %S. The measurement site at 53.5696∘ N and 9.6917∘ E has been in use by BSH for ship emission monitoring since September 2014 with about 40 000 vessels passing by that site annually. During the campaign, ships passed by with an average speed over ground of 10.5 ± 2.7 kts. Figure 1 shows that the site is located at the northern banks of the river, considering the predominant wind from the south-west. The distance from the stationary measurement systems and the launch site of the exp.uas system to the shipping lane was approximately 500 m. The cha.uas system was launched near the river about 2.7 km north-west of the main campaign site to avoid interferences between the two drone operations. There are no further sources in that area that interfere with the plume measurements.
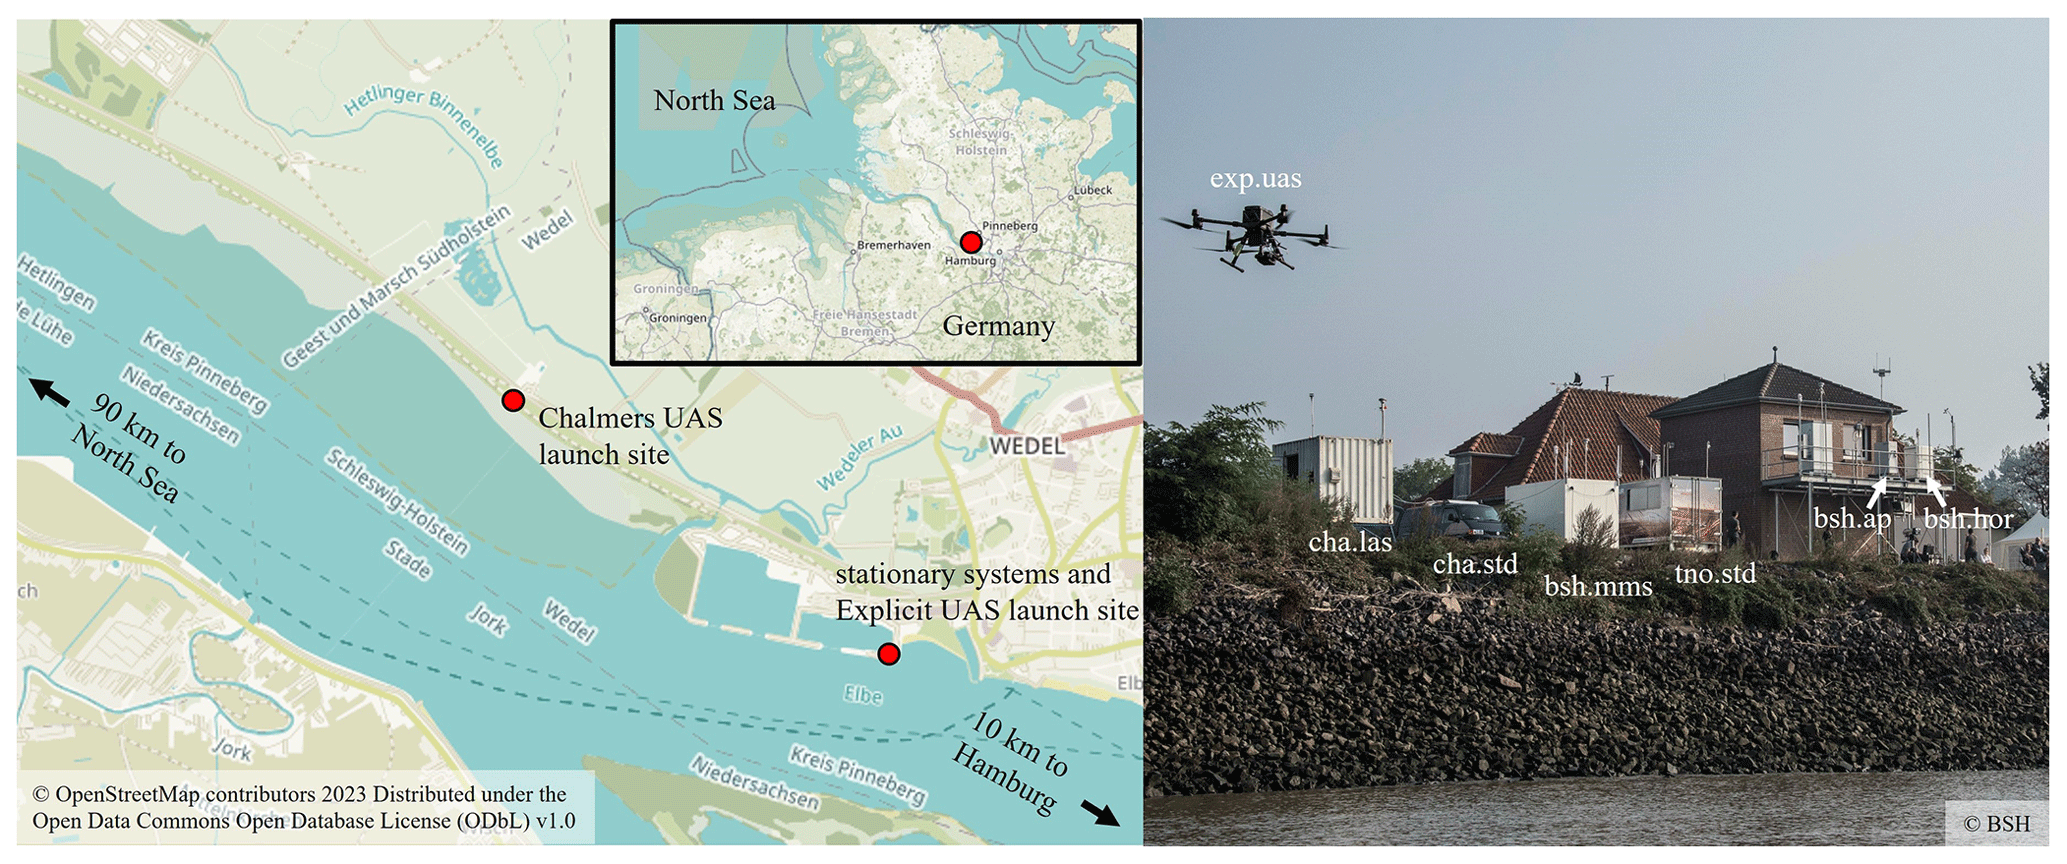
Figure 1Left panel: location of the measurement site at the northern banks of the Elbe River in Wedel near Hamburg (© OpenStreetMap contributors 2023. Distributed under the Open Data Commons Open Database License (ODbL) v1.0). Right panel: picture of the positioning of the stationary systems as seen from river (© BSH).
BSH permanently operates two stationary standard sniffer systems on this site: bsh.ap and bsh.hor. The other systems were located within a 20 m perimeter to the west of BSH's permanent installation, unobstructed along the waterline with similar distance to passing vessels. The inlet height of each system was between 7 and 8 m above the mean water level. This varied during the measurements with the local tidal range of about 3 m.
2.6 Fuel samples and bunker delivery notes
The measurements were complemented by fuel samples obtained by the Hamburg water police from ships that had passed the measurement site when they were at berth in the Hamburg port area. The fuel samples that were used for comparison were all taken from the fuel lines to the main engine. They were analysed in BSH's own ISO 17025 certified laboratory for their sulfur content. In total, 33 fuel samples could be related to plumes measured by at least one of the systems.
Some vessels were frequently observed during the measurement period, but a fuel sample could not be obtained from them. Instead, the shipping company of five frequently measured dredger vessels voluntarily shared all relevant bunker delivery notes (BDNs) that were used as the basis for comparison.
The measured FSC from the fuel samples and the FSC data retrieved from the BDNs are assumed to be representative, with respect to the true FSC at the time that the remote measurement took place, and are used as the expected FSC in the comparison.
The distribution of the FSCs from the fuel samples and the bunker delivery notes showed a median of 0.082 %S with nearly 70 % of all the values being in the tight range between 0.075 %S and 0.010 %S.
3.1 Comparison
The overall campaign period lasted from 7 September to 15 October 2020. As presented in Table 1, the autonomous stationary systems measured nearly continuously throughout this period. The UAV-borne mini-sniffers that were actively piloted into the plumes were operated for 4 consecutive days from 13 to 16 September 2020.
Altogether, 966 plumes from 436 unique vessels were measured. Of these, both UAVs captured 70 individual plumes from 58 different vessels. The different systems did not always capture the same plumes, but 724 individual cases were measured by at least two systems. However, only a few plumes were simultaneously measured by at least one stationary and at least one UAV-borne system due to unfavourable wind conditions that impacted the transport of the exhaust plumes to the shore-based stationary systems at the time of the UAV flights. Nevertheless, due to the available fuel samples and frequently passed vessels, whose exhaust was captured on many occasions by the different systems, a comparison was still feasible.
An intercomparison of the calibration standards by TNO's laboratory showed a deviation of up to 40 % from the manufacturers' specifications. In this case, the deviation significantly exceeded the specified uncertainty. This highlights the need to validate the VMRs of the calibration gases. Possible ways to conduct such a validation are by testing them against the preceding calibration gases or accredited reference laboratories, with higher accuracy. Further, round-robin tests can be used to validate the instrument calibration using reference gases or gas blends simulating different FSCs (Van Roy et al., 2023). The affected data were corrected afterwards through recalculation using an updated calibration curve.
To benchmark all the systems on the same basis, the estimated FSCs for individual plume measurements of the systems were compared with corresponding FSCs measured from fuel sampling or retrieved from the BDNs. For the fuel samples, the remote measurements of each vessel throughout the entire campaign period were compared with the FSC of the fuel samples to increase the number of comparisons; this was done under the assumption that the true FSC of the measured vessels did not change significantly within the observation period. For the comparison of the estimated FSCs with FSC data from BDNs, the reported FSC data of the most recent BDN for each specific vessel were considered. In total, 145 individual plumes that were measured by at least one of the systems corresponded to the measured FSCs from fuel sampling or BDNs.
It should be noted that there is a possibility that the FSC of the fuel that was combusted at the time of the remote measurement differs from the FSC of the fuel sample taken at another point in time. However, this is assumed to be unlikely because the ships were operated within the SECA for at least a couple of days before the plume measurements.
The results of the FSCs from the fuel sample analyses and the BDNs were not made available to the participating teams to keep the comparison unbiased in the form of a blind comparison.
In Fig. 2, the absolute deviation of the individual plume observations from the fuel sample results is presented as a function of the reported uncertainty by each system. This figure helps by summarizing how well the estimated FSC from each system matches the expected FSC from the fuel sampling, considering the individually reported uncertainties. Three distinct cases can be identified. The estimates that lie in the unshaded area match the expected FSC of the respective vessel within the range of the individually reported uncertainty. Those estimates that lie in the upper grey-shaded area are higher than the measured FSC of the fuel sample plus the reported uncertainty and correspond to overestimates with respect to the expected FSC. In the opposite case, values in the lower shaded area underestimate the expected FSC.
The high number of data points in the lower shaded area shows that stationary systems mostly seem to underestimate the FSC beyond uncertainty. Even if one neglected the bias, the reported uncertainty for the standard sniffer systems (bsh.hor, bsh.ap, bsh.mms, cha.std, and tno.std) appears to be too small when compared with the spread of the estimations for each individual system along the y axis. This is particularly apparent for reported uncertainties below 0.02 %S. The distribution of the reported uncertainties also reflects the differences in the chosen confidence levels between the different groups. BSH, Explicit, and TNO reported their uncertainties as 1 standard deviation corresponding to a confidence level of about 68 %, while Chalmers reported their results with 95 % confidence. This becomes particularly obvious for the cha.std and cha.uas estimates, which spread over a wider range along the x axis compared with other systems. However, Table 1 shows that, apart from the apparent bias, the absolute deviation of the novel laser spectrometer, cha.las, exhibits a comparatively small spread, reflecting the higher precision of this system. And unlike the other compared systems, cha.las shows no strong cross-sensitivity to other gases, e.g. NO.
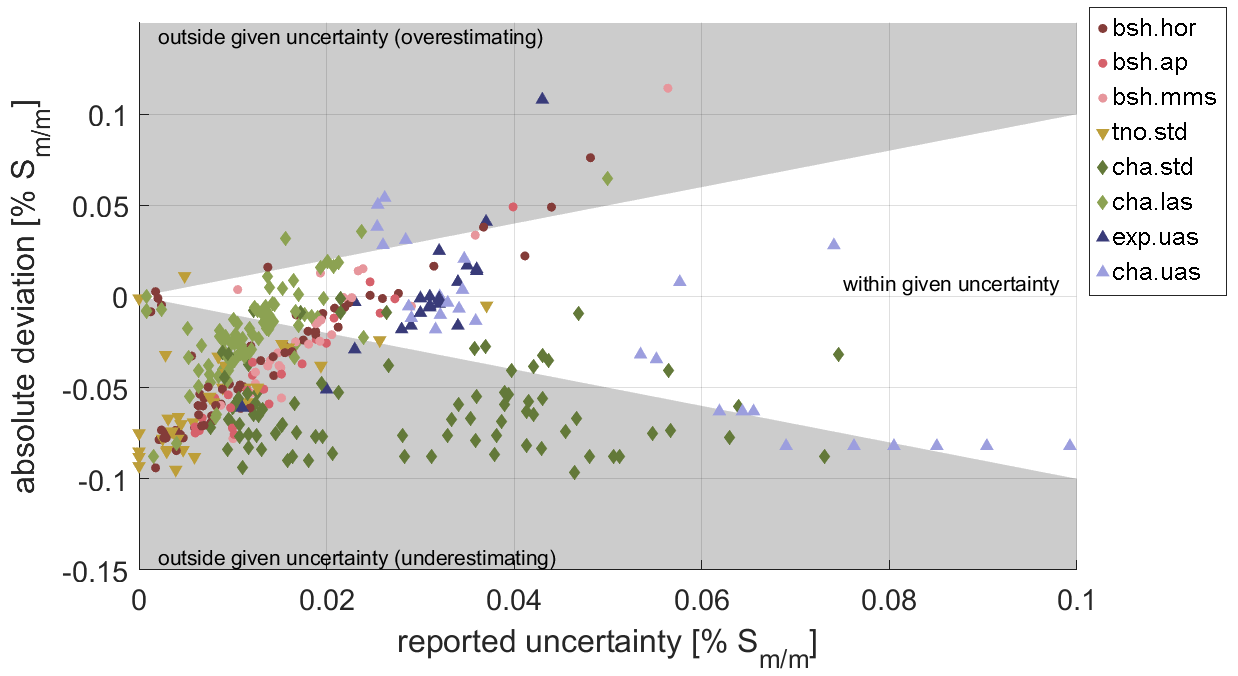
Figure 2Comparison of individual estimates per system to the expected FSC from fuel sampling and BDN as a function of the reported uncertainty. The shade of the areas is indicative of whether a measurement matches (unshaded area), overestimates (upper grey-shaded area), or underestimates (lower grey-shaded area) the expected FSC.
The exp.uas system correctly estimated the FSC in 78 % of the cases, with an uncertainty corresponding to a confidence level of about 68 %. There is no apparent tendency for exp.uas to overestimate or underestimate. With the cha.uas system, the FSC was correctly quantified in 68 % of the cases using a broader confidence interval of 95 %, with a tendency towards lower values for the rest. All stationary systems appeared to experience a systematic negative bias and matched within the uncertainty ranges only from 6 % to 41 % of all cases. For these systems, there are only a few cases of overestimation, while underestimation is obvious from 56 % to 91 % of the cases.
Figure 3 summarizes the deviations of the estimates per system from the fuel sample and BDN results. The mean values of the underestimation of the systems operated by BSH range between −0.017 %S and −0.040 %S. This deviation is −0.057 %S and −0.062 %S for the tno.std and cha.std systems respectively. For the highly sensitive cha.las, the deviation is −0.020 %S. While there is no systematic deviation for exp.uas, the deviation is −0.020 %S for cha.uas. Section 3.2A discusses the potential cause of the underestimation of the FSC by most systems.
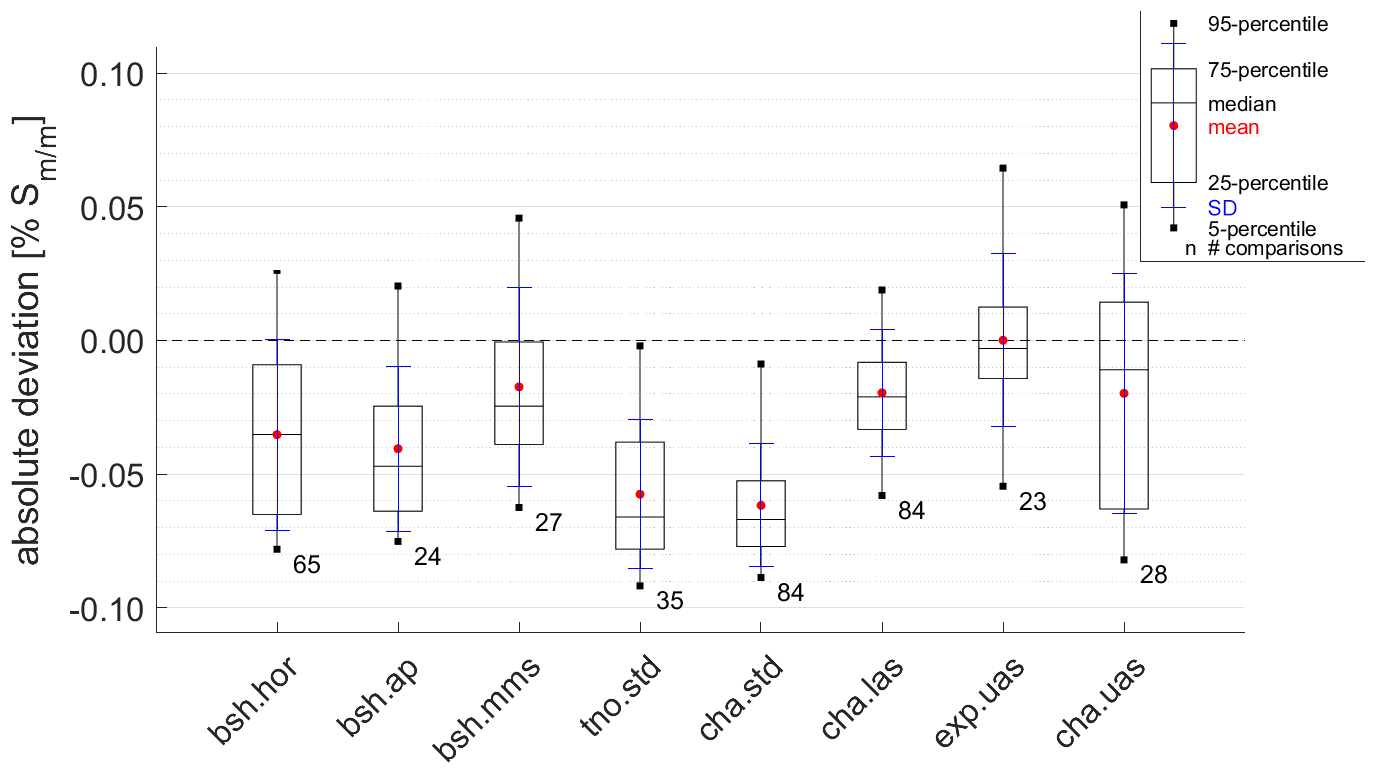
Figure 3Comparison of the deviations per system with the expected FSC determined by fuel sampling or BDN. The number next to each bar corresponds to the number of observations.
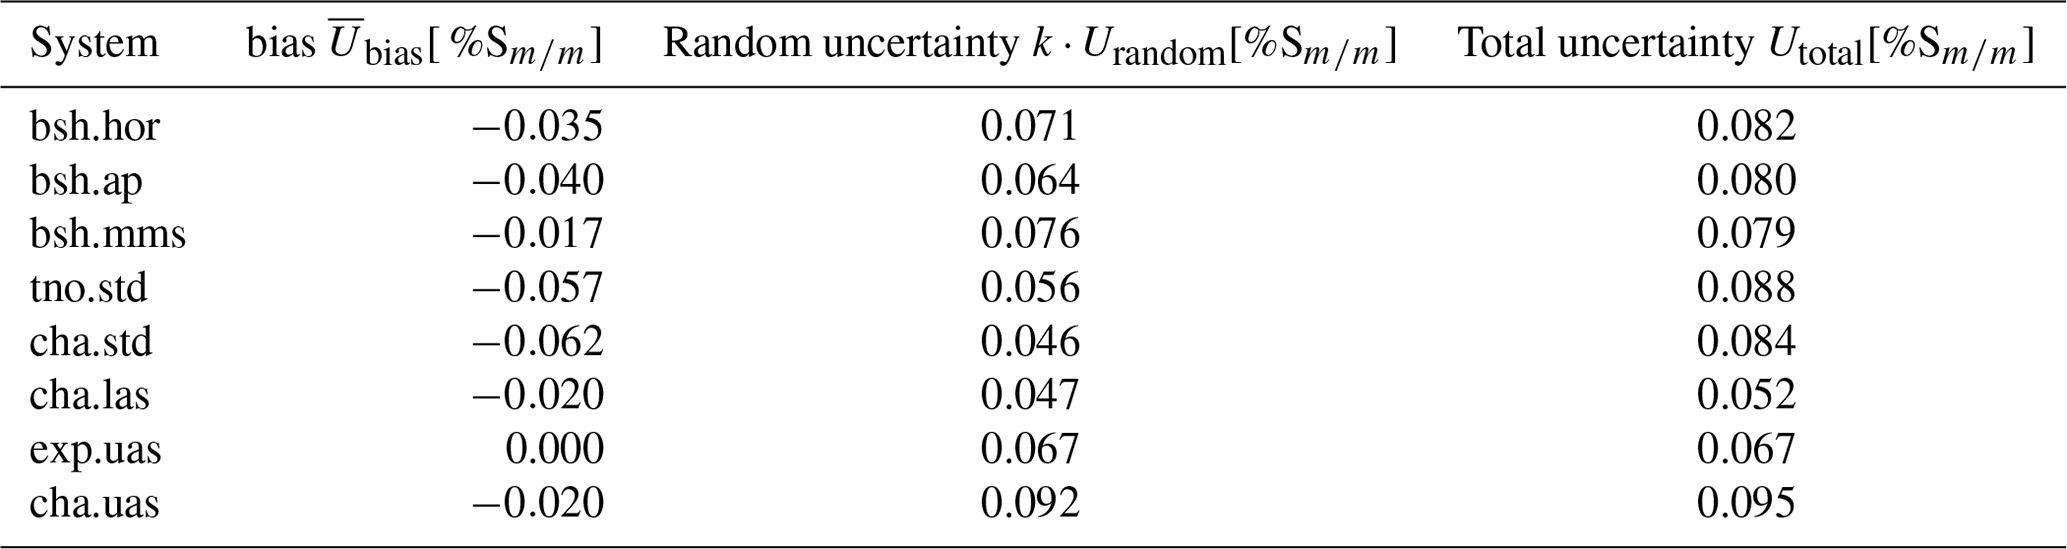
Table 3 shows the benchmarking of the systems based on the comparison with the fuel samples. Grouping the results into the underlying technologies gives the following results. The total uncertainties of the standard sniffers, which are calculated according to Eq. (2), are in a range between 0.079 %S and 0.088 %S. The cha.las shows a total uncertainty of 0.052 %S. The lower uncertainty of the cha.las compared with the standard sniffers reflects the higher precision, especially towards SO2, at VMRs which are typically of the order of only a few parts per billion for stationary systems, given the typical range of distances of several hundred metres to the vessels. These VMRs are close to the detection limits of the SO2 monitors in the standard sniffers but significantly higher than the detection limit of 0.06 ppb for cha.las; see Table 1.
While the monitors in all stationary systems are made for analysing pollutants at trace gas levels, the mini-sniffer systems aim for higher sample-gas VMRs. The total uncertainty for exp.uas of 0.067 %S is between those of cha.las and the stationary systems, while cha.uas showed a significantly higher total uncertainty of 0.095 %S. The deviation in the total uncertainty between the two UAV-borne mini-sniffers could be related to a reportedly longer distance to the emission source of 100 to 200 m for cha.uas compared with around 50 m for exp.uas. At such distances, the plume is more diluted; consequently the VMR ranges are much lower, leading to a large uncertainty. Moreover, the quality of the sample collection, i.e. the pilot's capability to find and remain at the sweet spot within the plume, is another factor influencing the uncertainty. Considering the response characteristics of the sensors, a certain residence time at sufficiently stable mixing ratios in the plume improves the quality of the measurements.
Table 3Re-evaluated uncertainties for the systems based on the fuel sample comparison. The presented random and total uncertainties correspond to a 95 % confidence level assuming a normal distribution.
3.2 Possible causes for the negative bias in FSC estimates
As gaseous SO2 dissolves in water (Terraglio and Manganelli, 1967), the absorption of SO2 on wet surfaces in the inlet section of the systems is seen as one possible cause of the prominent negative bias, most prevalent in the cases of the stationary systems.
For this comparison, continuously recorded meteorological data at the location of bsh.mms were used. Over the time of the campaign, the relative humidity varied between 50 % and 100 %. The absolute deviation of the individual estimates from the expected values of the fuel sampling and BDNs is plotted in relation to the relative humidity present at the time of the plume measurements in Fig. 4. Most measurements were conducted while the relative humidity was above 70 %; hence the statistically relevant range is limited. For most systems, i.e. bsh.hor, cha.std, cha.las, and tno.std, a relation between deviation and relative humidity was observed. The results show that such an effect is increasingly prominent when the relative humidity exceeds 80 %. However, these results can only be considered suggestive of associations, and other meteorological and operational parameters are needed for a proper analysis and potential correction. The actual effect might differ between the instruments. It can be expected that the surface area, flow characteristics, and residence time of sampling lines could be important parameters. Also, the dew point in the inlet section is not only dependent on the relative humidity but also on other parameters such as the air pressure in the sampling line and the temperature along its surfaces.
Separate testing of each individual system under controlled laboratory conditions would be required to describe the influence of these parameters and to develop an algorithm to correct measured values according to humidity. This hypothesis is strengthened by the observation of a significantly lower, to even no apparent, bias of the exp.uas, where there is only a little surface area and low residence times due to short tube lengths of the order of a few decimetres, and no filter presence, where condensation could take place. For example, in the case of the more strongly affected cha.std and cha.las, the inlet tubes already exceeded a length of 3 m. On the other hand, heating the inlet section might prevent condensation and make a mathematical correction unnecessary.
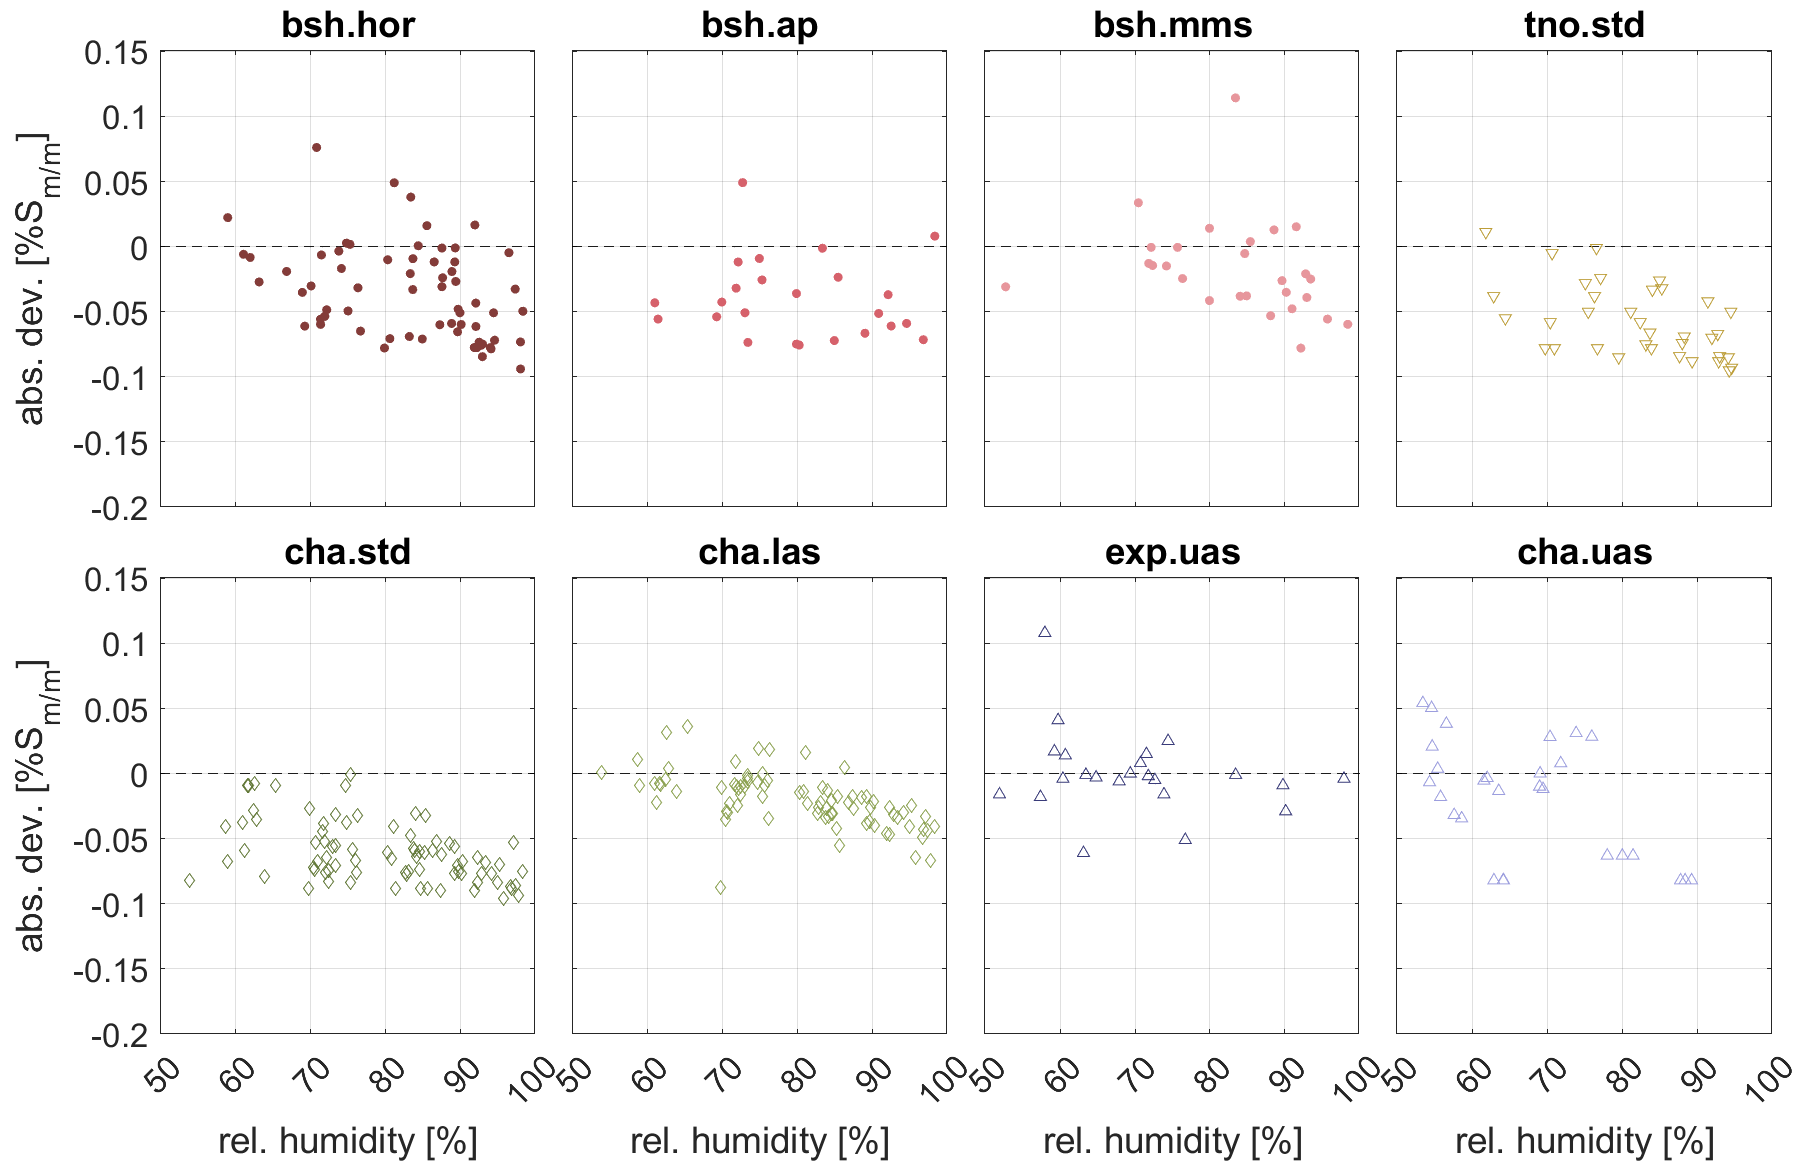
Figure 4Dependence of absolute deviation of each system from the expected FSC on relative humidity at the time of the measurement.
The bias could also be influenced by a wrong estimation of cross-sensitivities. The UV fluorescence instrument for the analysis of SO2 in the standard sniffers is also sensitive to NO and volatile organic compounds (VOCs). These instruments were tested for the influence of NO, and the correction factors were applied accordingly to minimize this effect. An overcorrection of NO could cause negative deviations if the correction factor is assumed to be too high. The variations of the correction factors may vary with the respective instrumentation. Table 1 shows the span of cross-sensitivities for the different UV fluorescence instruments which were applied in this study to be between 0.7 % and 1.5 %. In an experiment, Van Roy et al. (2022b) found a cross-sensitivity of 0.45 % in their system, which is even below that range. Further, the cha.std system was set to measure NOx instead of NO during most of the time of the campaign period. In this case, a constant fraction of NO in NOx was assumed and used for correction. This causes some additional uncertainty as this fraction varies with plume age depending on the ambient conditions.
Different state-of-the-art and novel instruments were assessed as measurement systems to remotely measure the FSC of individual vessels by analysing the emitted exhaust in a side-by-side study. The measurements were carried out as part of a campaign conducted in Germany along the Elbe River in 2020 in the framework of the European Commission project SCIPPER.
The compared systems were grouped into three different classes. Firstly, the five stationary sniffer systems which use similar measurement principles, i.e. UV fluorescence and, in most cases, NDIR for the quantification of SO2 and CO2 respectively, are regarded as one class. Secondly, a novel, highly sensitive system based on laser spectroscopy was used for the first time in the field of ship emission monitoring. Finally, two UAV-borne mini-sniffer systems were employed, and these systems were actively piloted into the plume that was closer to the ships funnel, where the concentration of species is higher than in the case of the remote stationary systems.
In total, 966 individual exhaust plumes have been analysed on different occasions. The measured ships were sailing in SECA when they were measured. They were, hence, obliged to use fuel that contains 0.10 %S or less or alternatively run scrubber systems to limit their sulfur content in the exhaust. So, the performance of the instrumentation is assessed considering the lowest IMO limit, which is currently in place worldwide.
Measured FSC data from fuel samples taken by the water police at the port of Hamburg during the campaign period and FSC data retrieved from BDNs were used as a reference to evaluate the absolute deviations of the results from the monitoring from the actual FSC of the fuels used. All the systems, except for the UAV-borne exp.uas, underestimated the evaluated reference in most cases. On average, the standard sniffers underestimated the references by a mean of 0.02 %S to 0.07 %S, the cha.las by 0.02 %S, and the cha.uas by 0.02 %S, while the average deviation of the exp.uas was zero.
The reported uncertainties based on each groups' own uncertainty estimation underestimated the deviations from the fuel samples, except for the mini-sniffer systems. Considering the reported uncertainties, the standard and highly sensitive sniffer systems match the analysed FSC from the fuel sample in 6 % to 41 % of the cases, with a tendency to underestimate the FSC in 56 % to 91 % of the cases. The drone-borne mini-sniffers, on the other hand, matched the expected FSCs in 78 % of the cases for exp.uas and in 68 % of the cases for cha.uas.
High relative humidities during the measurements tend to correlate with this underestimation of the FSC for most systems. This observation might be explained by the condensation of water vapour on the walls of the tube or on the filter surfaces in which SO2 could dissolve. These effects might be mitigated by reduced tube lengths and heating of the tubes to prevent condensation. However, further research is needed to be able to provide stronger conclusions for this humidity effect and to evaluate the significance of it compared with other potential reasons.
Total uncertainties were calculated based on the comparison with the fuel samples. These include the bias and random error corresponding to a 95 % confidence level for FSCs from the fuel samples and BDNs at 0.075 ± 0.025 %S. For the standard sniffers, the total uncertainty is in the range of 0.08 %S to 0.09 %S, 0.05 %S for cha.las, 0.07 %S for exp.uas, and 0.09 %S for cha.uas. This means that the currently applied systems are capable of reliably detecting non-compliantly operated vessels in SECAs where the FSC is limited to 0.10 %S. The certainty in the assessment is at least 95 % if the observed vessel is operated with fuel that contains 0.15 %S to 0.19 %S or more, depending on the total uncertainties of the individual systems.
A comparison of the applied calibration standards showed deviations from the individual manufacturer certificates of the gas VMRs in the cylinders. The actual value of the SO2 VMR was 40 % less than what was specified by the manufacturer, while the manufacturer evaluated the uncertainty of the VMR in the delivered gases to be 5 %. Any deviation of calibration values has an effect proportional to the observed FSC results. To maintain and ensure a high measurement quality, it is, therefore, recommended to cross-check the expected VMRs of new gas cylinders with their predecessors and with the standards in reference laboratories. Also, round-robin tests between different application groups are deemed helpful to detect and correct for any deviations.
Concluding our findings above, all the presented methods are suitable for the remote monitoring of FSC of vessels sailing according to MARPOL Annex VI regulations, in particular in SECAs. The findings and results of this study can be used to further improve the systems and the quality assurance of procedures for emission monitoring, and appropriate suggestions are presented herein.
The collected data contain legally sensitive information. An anonymized version can be supplied upon request.
JB: campaign administration, data collection and curation, data analysis, visualization, writing (original draft), writing (review and editing). AW: campaign administration, resources, data collection, writing (review and editing). SG: resources, writing (review and editing). JM: resources, data collection, writing (review and editing). AVCJ: resources, data collection, writing (review and editing). DvD: resources, data collection, writing (review and editing). JD: resources, writing (review and editing). JK: resources, data collection, writing (review and editing). BK: resources, writing (review and editing). LN: project administration, writing (review and editing).
The contact author has declared that none of the authors has any competing interests.
Publisher’s note: Copernicus Publications remains neutral with regard to jurisdictional claims made in the text, published maps, institutional affiliations, or any other geographical representation in this paper. While Copernicus Publications makes every effort to include appropriate place names, the final responsibility lies with the authors.
We would like to express our gratitude to the Wasserstraßen- und Schifffahrtsamt Elbe-Nordsee for providing their facilities and their highly appreciated service during the conduction of this campaign. We thank the water police of Hamburg for their excellent work in taking numerous fuel samples. We also thank the participating ship operators and responsible personnel on board the sampled vessels, especially the Jan de Nul Group, for supporting this project by supplying fuel samples and by providing bunker delivery notes.
This project has received funding from the European Union’s Horizon 2020 research and innovation programme under grant agreement no. 814893.
This paper was edited by Andreas Richter and reviewed by Ward Van Roy and one anonymous referee.
Alföldy, B., Lööv, J. B., Lagler, F., Mellqvist, J., Berg, N., Beecken, J., Weststrate, H., Duyzer, J., Bencs, L., Horemans, B., Cavalli, F., Putaud, J.-P., Janssens-Maenhout, G., Csordás, A. P., Van Grieken, R., Borowiak, A., and Hjorth, J.: Measurements of air pollution emission factors for marine transportation in SECA, Atmos. Meas. Tech., 6, 1777–1791, https://doi.org/10.5194/amt-6-1777-2013, 2013.
Balzani Lööv, J. M., Alfoldy, B., Gast, L. F. L., Hjorth, J., Lagler, F., Mellqvist, J., Beecken, J., Berg, N., Duyzer, J., Westrate, H., Swart, D. P. J., Berkhout, A. J. C., Jalkanen, J.-P., Prata, A. J., van der Hoff, G. R., and Borowiak, A.: Field test of available methods to measure remotely SOx and NOx emissions from ships, Atmos. Meas. Tech., 7, 2597–2613, https://doi.org/10.5194/amt-7-2597-2014, 2014.
Beecken, J., Mellqvist, J., Salo, K., Ekholm, J., and Jalkanen, J.-P.: Airborne emission measurements of SO2 , NOx and particles from individual ships using a sniffer technique, Atmos. Meas. Tech., 7, 1957–1968, https://doi.org/10.5194/amt-7-1957-2014, 2014.
Beecken, J., Mellqvist, J., Salo, K., Ekholm, J., Jalkanen, J.-P., Johansson, L., Litvinenko, V., Volodin, K., and Frank-Kamenetsky, D. A.: Emission factors of SO2, NOx and particles from ships in Neva Bay from ground-based and helicopter-borne measurements and AIS-based modeling, Atmos. Chem. Phys., 15, 5229–5241, https://doi.org/10.5194/acp-15-5229-2015, 2015.
Beecken, J., Irjala, M., Weigelt, A., Conde, V., Mellqvist, J., Proud, R., Deakin, A., Knudsen, B., Timonen, H., Sundström, A.-M., Louie, P., Smyth, T., and Duyzer, J.: Review of available remote systems for ship emission measurements, The SCIPPER Project (European Commission – Horizon 2020 No. 814893), https://www.scipper-project.eu/wp-content/uploads/2020/01/scipper_d2_1_20191220.pdf (last access: 29 September 2023), 2019.
Berg, N.: Remote measurements of ship emissions, Lic. Thesis, Optical Remote Sensing, Chalmers University of Technology, Gothenburg, Sweden, 2011.
EU: Council Directive 1999/32/EC of 26 April 1999 Relating to a Reduction in the Sulphur Content of Certain Liquid Fuels and Amending Directive 93/12/EEC, Official Journal of the European Communities L 121, Council of the European Union, L 121, 11.5.1999, 13–18, CELEX number: 31999L0032, 1999.
EU: Directive 2012/33/EU of the European Parliament and of the Council of 21 November 2012 amending Council Directive 1999/32/EC as Regards the Sulphur Content of Marine Fuels, Official Journal of the European Communities L 327, 27.11.2012, 1–13, CELEX number: 32012L0033, 2012.
EU: Commission Implementing Decision (EU) 2015/253 of 16 February 2015 Laying Down the Rules Concerning the Sampling and Reporting under Council Directive 1999/32/EC as Regards the Sulphur Content of Marine Fuels, Official Journal of the European Union L 41, 17.2.2015, 55–59, CELEX number: 32015D0253, 2015.
EU: Directive (EU) 2016/802 of the European Parliament and of the Council of 11 May 2016 Relating to a Reduction in the Sulphur Content of Certain Liquid Fuels, (codification), Official Journal of the European Communities 132/58, The European Parliament and the Council of the European Union, 2016.
Explicit: A Method and an Unmanned Aerial Vehicle for Determining Emissions of a Vessel, European Patent Office (EP 3100022, US 10416672, CN 106170685), https://data.epo.org/gpi/EP3100022B1 (last access: 29 September 2023), 2016.
Explicit: Airborne Monitoring of Sulphur Emissions from Ships in Danish Waters – 2017 Campaign Results, Ministry of Environment and Food of Denmark, https://www2.mst.dk/Udgiv/publications/2018/04/978-87-93710-00-9.pdf (last access: 29 September 2023), 2018.
Grigoriadis, A., Mamarikas, S., Ioannidis, I., Majamäki, E., Jalkanen, J.-P., and Ntziachristos, L.: Development of exhaust emission factors for vessels: A review and meta-analysis of available data, Atmos. Environ., 12, 100142, https://doi.org/10.1016/j.aeaoa.2021.100142, 2021.
ISO/IEC 98-3:2008: Uncertainty of measurement – Part 3: Guide to the expression of uncertainty in measurement (GUM:1995), 2008.
Kattner, L., Mathieu-Üffing, B., Burrows, J. P., Richter, A., Schmolke, S., Seyler, A., and Wittrock, F.: Monitoring compliance with sulfur content regulations of shipping fuel by in situ measurements of ship emissions, Atmos. Chem. Phys., 15, 10087–10092, https://doi.org/10.5194/acp-15-10087-2015, 2015.
Magnusson, B. and Ellison, S. L. R.: Treatment of uncorrected measurement bias in uncertainty estimation for chemical measurements, Anal. Bioanal. Chem., 390, 201–213, https://doi.org/10.1007/s00216-007-1693-1, 2008.
MARPOL: International Convention for the Prevention of Pollution from Ships 1973, as modified by the Protocol of 1978 relating thereto (adopted 17 February 1978 (MARPOL), in force 2 October 1983) 1340 UNTS 61, as amended, 1973.
MARPOL: Protocol of 1997 to amend the International Convention for the Prevention of Pollution from Ships of 2 November 1973, as modified by the Protocol of 17 February 1978, London, 1997, into force on 19 May 2005 and amended, 2005.
Mellqvist, J. and Berg, N.: Identification of gross polluting ships, RG Report No. 4, ISSN 1653 333X, Chalmers University of Technology, https://publications.lib.chalmers.se/records/fulltext/248358/local_248358.pdf (last access: 29 September 2023), 2010.
Mellqvist, J., Conde, V., Beecken, J., and Ekholm, J.: CompMon: Certification of an aircraft and airborne surveillance of fuel Sulphur content in ships at the SECA border, Chalmers University of Technology, https://research.chalmers.se/publication/500250/file/500250_Fulltext.pdf (last access: 29 September 2023), 2017a.
Mellqvist, J., Beecken, J., Conde, V., and Ekholm, J.: Surveillance of Sulfur Emissions from Ships in Danish Waters, Chalmers University of Technology, https://research.chalmers.se/publication/500251/file/500251_Fulltext.pdf (last access: 29 September 2023), 2017b.
Mellqvist, J., Conde, V., Weigelt, A., Griesel, S., Schopmann, H., Knudsen, B., Knudsen, J., Beecken, J., van Dinther, D., Moerman, M., Duyzer, J., and Irjala, M.: Quality assurance of remote monitoring systems and harmonised reporting, The SCIPPER Project (European Commission – Horizon 2020 No. 814893), https://www.scipper-project.eu/wp-content/uploads/2023/02/scipper-d2.3_s.pdf (last access: 29 September 2023), 2022.
MEPC.1/Circ.778/Rev.3: List of Special Areas, Emission Control Areas and Particularly Sensitive Sea Areas, 2008.
MEPC.340(77): 2021 Guidelines for Exhaust Gas Cleaning Systems, Resolution MEPC.340(77), 2021.
MEPC/Circ. 471: Marine Environment Protection Committee: Interim Guidelines for Voluntary Ship CO2 Emission Indexing for Use in Trials, 2005.
Moldanova, J., Fridell, E., Popovicheva, O., Demirdjian, B., Tishkova, V., Faccinetto, A., and Focsa, C.: Characterisation of particulate matter and gaseous emissions from a large ship diesel engine, Atmos. Environ., 43, 2632–2641, https://doi.org/10.1016/j.atmosenv.2009.02.008, 2009.
Terraglio, F. P. and Manganelli, R. M.: The Absorption of Atmospheric Sulfur Dioxide by Water Solutions, JAPCA J. Air Waste Ma., 17, 403–406, https://doi.org/10.1080/00022470.1967.10468999, 1967.
Van Roy, W., Schallier, R., Van Roozendael, B., Scheldeman, K., Van Nieuwenhove, A., and Maes, F.: Airborne monitoring of compliance to sulfur emission regulations by ocean-going vessels in the Belgian North Sea area, Atmos. Pollut. Res., 13, 101445, https://doi.org/10.1016/j.apr.2022.101445, 2022a.
Van Roy, W., Van Nieuwenhove, A., Scheldeman, K., Van Roozendael, B., Schallier, R., Mellqvist, J., and Maes, F.: Measurement of Sulfur-Dioxide Emissions from Ocean-Going Vessels in Belgium Using Novel Techniques, Atmosphere, 13, 1756, https://doi.org/10.3390/atmos13111756, 2022b.
Van Roy, W., Merveille, J.-B., Scheldeman, K., Van Nieuwenhove, A., Schallier, R., Van Roozendael, B., and Maes, F.: Assessment of the Effect of International Maritime Regulations on Air Quality in the Southern North Sea, Atmosphere, 14, 969, https://doi.org/10.3390/atmos14060969, 2023.