the Creative Commons Attribution 4.0 License.
the Creative Commons Attribution 4.0 License.
 | 12 Feb 2024
Ozone and aerosol optical depth retrievals using the ultraviolet multi-filter rotating shadow-band radiometer
Joseph Michalsky
Glen McConville
The ultraviolet multi-filter rotating shadow-band radiometer (UV-MFRSR) is a seven-channel radiometer with narrowband filters centered between wavelengths 300 and 368 nm. Four of the middle wavelengths in this device are near those used in the Dobson spectrometer to retrieve ozone column abundance. In this paper measurements from Mauna Loa Observatory (MLO) were used first to calibrate the instrument using the Langley plot method and subsequently to derive column ozone and aerosol optical depths. The ozone derived from the UV-MFRSR was compared to the ozone measured by a Dobson spectrophotometer that operates daily at the MLO, resulting in column values within about 1 DU on average for 43 d in 2018. The aerosol optical depth (AOD) retrievals are more challenging. Generally, the AOD increases with wavelength between 305 and 332 nm, not what is expected given the typical AOD wavelength dependence at visible wavelengths. An example of this behavior is discussed, and research by others is cited that indicates similar behavior at these wavelengths, at least for the low-aerosol-optical-depth conditions encountered at high-altitude sites.
- Article
(949 KB) - Full-text XML
- BibTeX
- EndNote


Most historical network measurements of column ozone from the surface used Dobson or Brewer spectrometers, and these continue as the predominant ozone measurement instruments today. Brief explanations of these two devices and comparisons of concurrent and collocated measurements of total column ozone are given in Staehelin et al. (2003). Gao et al. (2001) demonstrated that ozone could be retrieved using the ultraviolet multi-filter rotating shadow-band radiometer (UV-MFRSR), which agreed with those values retrieved from either collocated Dobson and/or Brewer spectrophotometers to within 1 %–2 %.
The wavelengths used for ozone retrievals in the UV-MFRSR more closely match wavelengths in the Dobson rather than the Brewer spectrophotometer. Typically, ozone retrieved from the Dobson uses the AD wavelength pairs “A” (305.5 and 325.4) and “D” (317.6 and 339.8). Since there is no filter near 339.8 nm, the UV-MFRSR uses filters near the A pair and the Dobson “C” pair (311.5 and 332.4). The filters in the UV-MFRSR that are used for ozone measurements are nominally the 305 and 325 nm pair and the 311 and 332 nm pair, with carefully measured profiles of these filters used for actual retrievals. Normalized filter profiles for UV-MFRSR 453 are shown in Fig. 1.
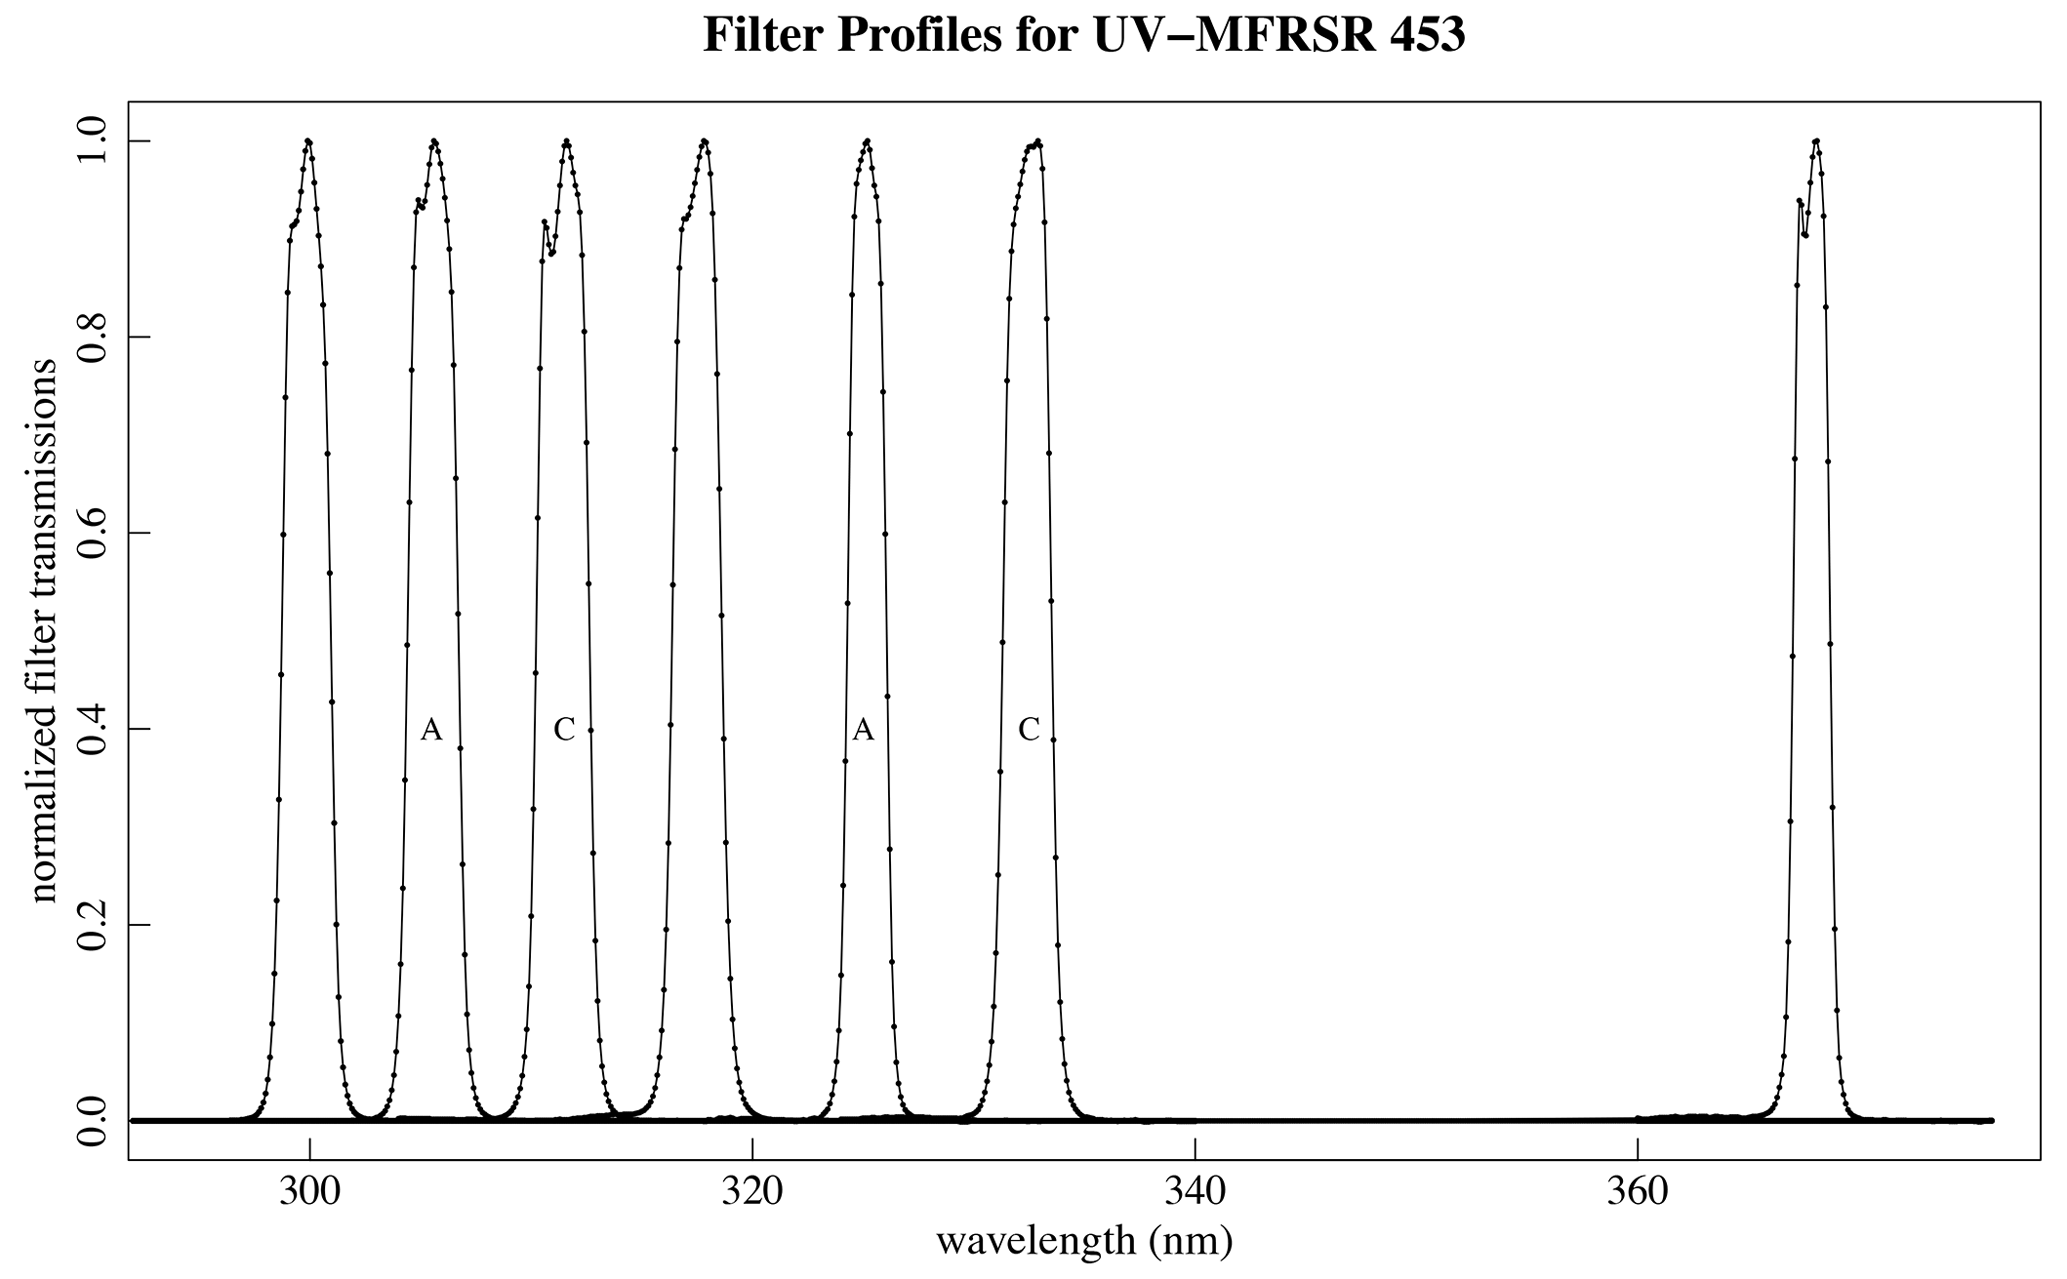
Figure 1Normalized filter profiles of UV-MFRSR 453 used in this study. The wavelength-dependent ozone absorption function and Rayleigh scattering function were convolved with these profiles to produce effective absorption and scattering corrections. “A” and “C” pairs used for ozone retrievals are noted. Central wavelength and full width at half maximum (nm): 299.9 and 2.2, 305.6 and 2.3, 311.4 and 2.4, 317.5 and 2.3, 325.1 and 1.8, 332.4 and 2.2, 367.8 and 1.7.
The basic procedure for ozone retrievals consists of measuring extinction at two wavelengths with one chosen to be more strongly attenuated than the other in the Hartley–Huggins ultraviolet bands. The basic extinction equation can be written
or, equivalently,
since the ratios and are equal.
In these equations, I(λ) = spectral irradiance measured by the instrument at the surface; I0(λ) = spectral irradiance measured by the instrument at the top of the atmosphere; V(λ) = signal (voltage) measured by the instrument at the surface; V0(λ) = signal (voltage) measured by the instrument at the top of the atmosphere; τ = optical depths for Rayleigh scattering (ray), ozone (oz), and aerosol (aer); P and P0 = atmospheric pressure at the measurement site and at sea level, respectively; and m = air masses for Rayleigh (ray), ozone (oz), and aerosol (aer) relative to a vertical path, differing slightly because each has a different distribution with altitude in the atmosphere. The Rayleigh and ozone air masses were calculated using Bodhaine et al. (1999) and Komhyr and Evans (2008), respectively.
If we write ozone optical depth as , where αoz is the ozone absorption coefficient, and ηoz is the abundance of ozone, we can solve for ηoz by rearranging terms in two versions of Eq. (2) representing the two wavelengths in the pair (the longer wavelength is indicated by primes). Therefore, dropping the explicit λ dependence for clarity, we get for ozone abundance
where N is defined as
Since all of the parameters of Eq. (3) are known or can be calculated, one could solve for ηoz if the term , i.e., the aerosol optical depths at the two wavelengths, were known. To curtail this requirement, the A and C wavelength pairs are used, and the assumption is made that since the wavelength separation of each pair is nearly the same, and the wavelength dependence over this small-wavelength region is expected to be nearly linear, subtraction of Eq. (3) applied to each pair will come very close to eliminating the aerosol terms because subtraction of aerosol terms should be near zero if these assumptions hold. The resulting equation used to calculate ozone is
where
and
The Langley calibration of the UV-MFRSR was performed at NOAA's Mauna Loa Observatory ( N, W; 3397 m). The height of the observatory often allows measurements to be made in clean, free-tropospheric air above the marine boundary layer, especially in the morning hours.
UV-MFRSR data were obtained on 242 d in 2018 beginning on 14 February and ending on 15 October. There were 139 successful Langleys during this period that produced estimated Vo, with only 27 of these during the afternoon hours. Looking at the retrieved Vo as a function of time, there is a hint of a decrease, but not one filter indicates a statistically significant decline; therefore, averages of Vo over the entire period are used in the ozone and aerosol retrievals.
The process used to choose acceptable Langleys (Michalsky et al., 2001) eliminates Langleys that are influenced by large changes in ozone during a Langley plot. Further, rarely did the standard deviation of the ozone sampled change by more than 5 DU during a morning or afternoon when Langley plots are sampled. This small change is typical for this low latitude.
Ozone is a standard measurement at NOAA's Mauna Loa Observatory and has been made with near-continuous sampling since 1963. The Dobson spectrophotometer there makes AD-paired measurements to determine ozone using absorption coefficients measured by Bass and Paur (1985). No estimate of the ozone column below the observatory, which could be on the order of 5 % of the column total at sea level, is made. Therefore, the column measurements made using the UV-MFRSR can be directly compared to the Dobson column measurements if one uses the Bass and Paur (1985) absorption cross-sections for the UV-MFRSR channels.
Since the Dobson generally uses the AD pair for the total column ozone calculation, we investigated the difference between AC and AD Dobson retrievals on 2 clear days at Mauna Loa that were used for Langley calibrations of the Dobson, thus giving us more than the operational 10:00, 12:00, and 14:00 LT ozone measurements. It is important to assess any differences since the UV-MFRSR uses wavelengths close to the AC pair for its ozone retrievals. Figure 2 illustrates the difference between Dobson measurements with the two different wavelength pairs. The mean difference in retrieved ozone for the 90 points compared in the plot is less than 0.5 DU, and the standard deviation among the 90 samples is close to 2.5 DU. Therefore, using the AC pair of the UV-MFRSR for ozone retrievals and comparing to AD-paired Dobson ozone should be acceptable.
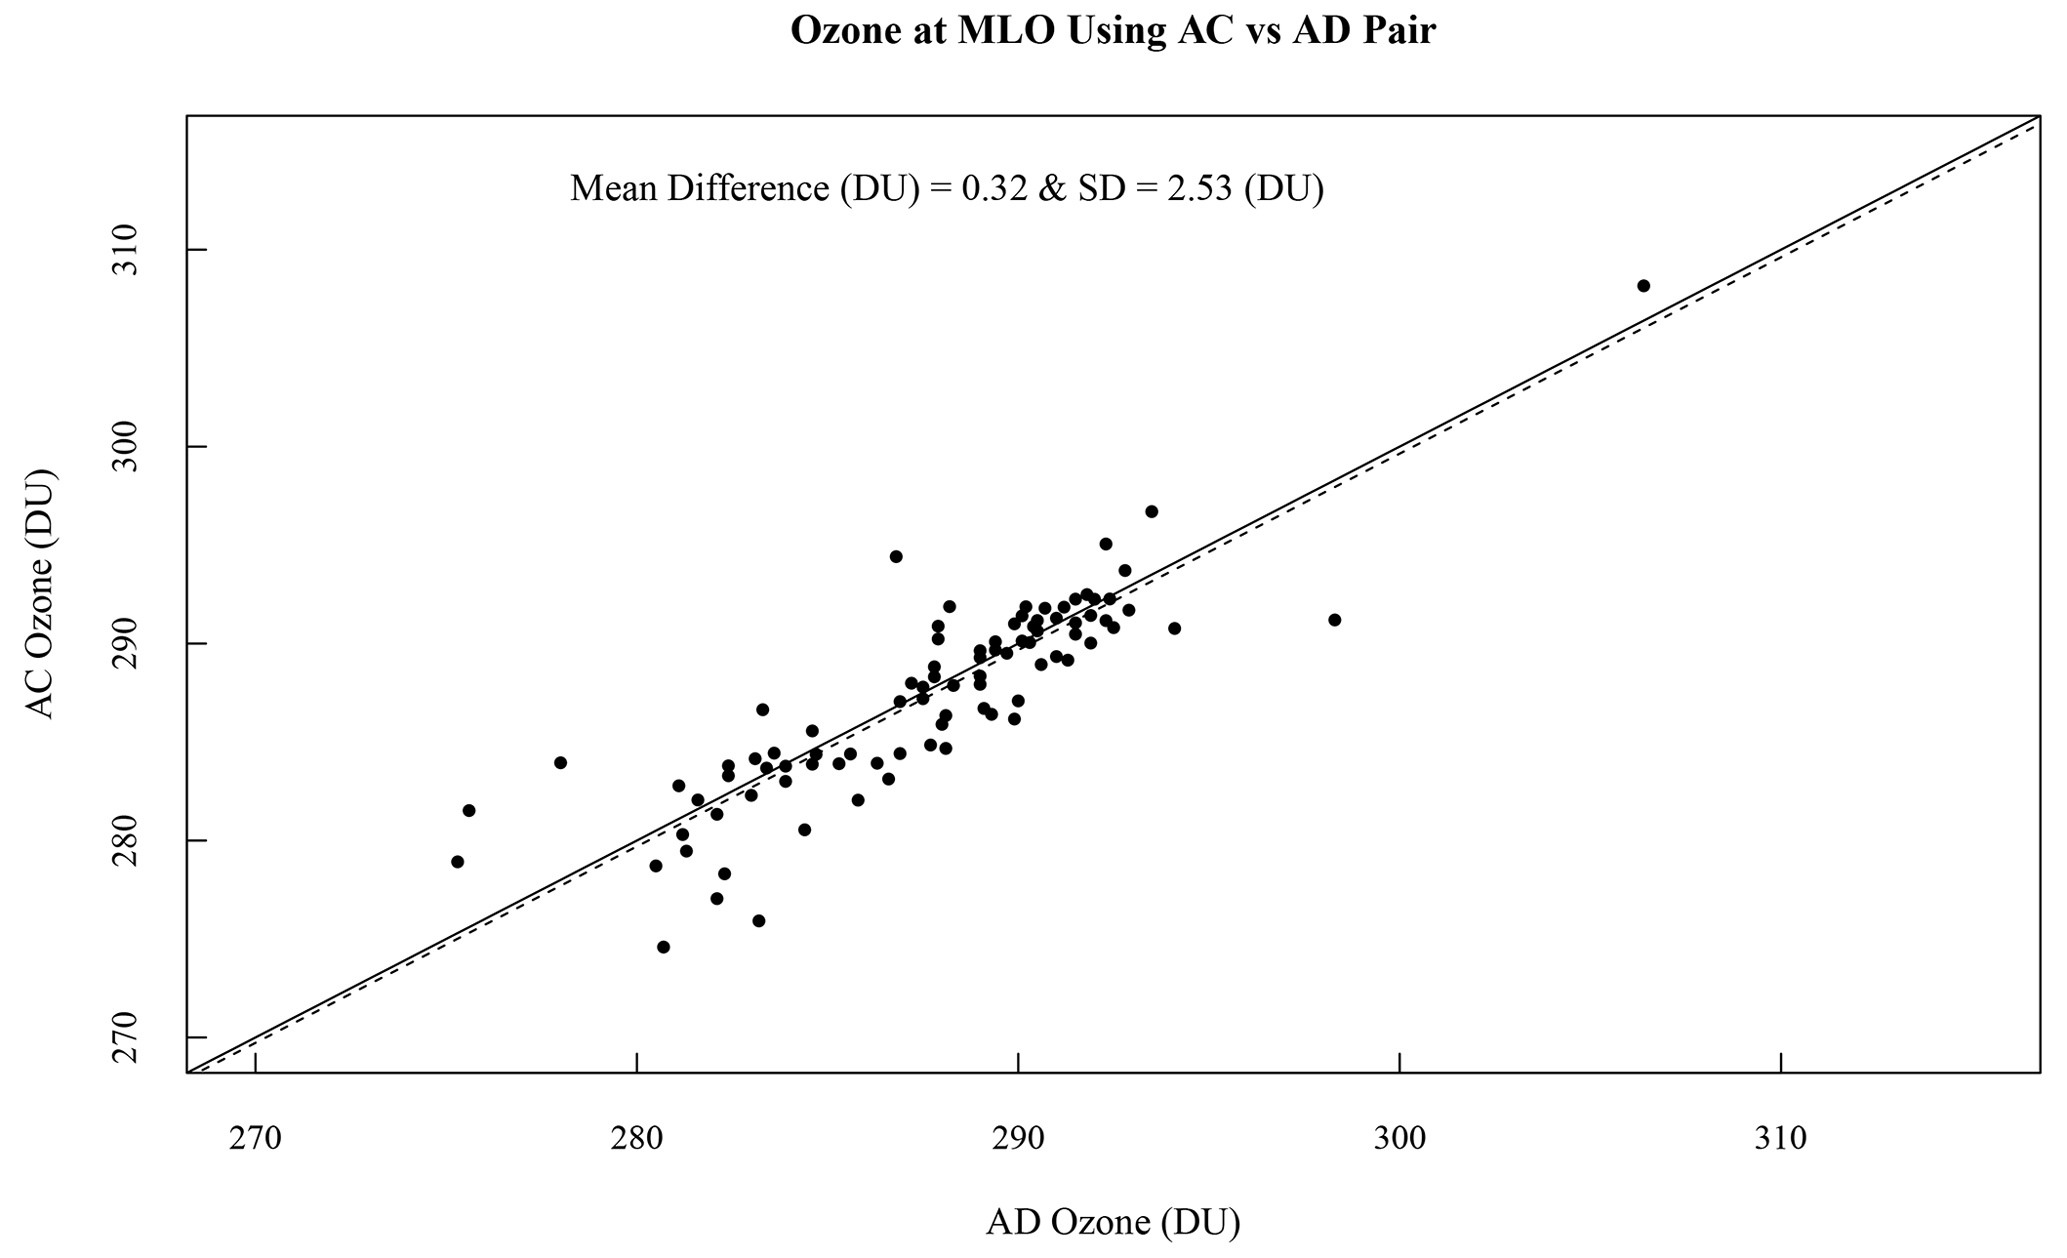
Figure 2Plot of ozone measured by a Dobson unit at Mauna Loa Observatory retrieved using the Dobson AC pair versus the Dobson AD pair. The solid diagonal line is the 1:1 line, and the dashed line is the linear least-squares fit. The mean difference and standard deviation of the samples are given on the plot.
Figure 3 is a plot of the ozone time series retrieved from the Dobson AD pair and the UV-MFRSR AC pair for the 2018 data that were matched by day of year. In the case of the Dobson, one measurement is chosen from the three daily measurements made at 10:00, 12:00, and 14:00 local standard time. Only direct sun measurements made with the Dobson are used for this comparison. For the UV-MFRSR data, which are sampled every 20 s, a median value of all points, which are made at fewer than three air masses and that pass cloud screening (Michalsky et al., 2010), is used. Since measurements from the two instruments are made differently with no attempt to make them coincident, except for those occurring on the same day, there is no expectation of perfect agreement given any diurnal variability. The average difference over the 43 d sample is about 0.10 DU. The LOWESS fits to the two data sets track each other rather closely, matching dips and peaks throughout the measurement period.
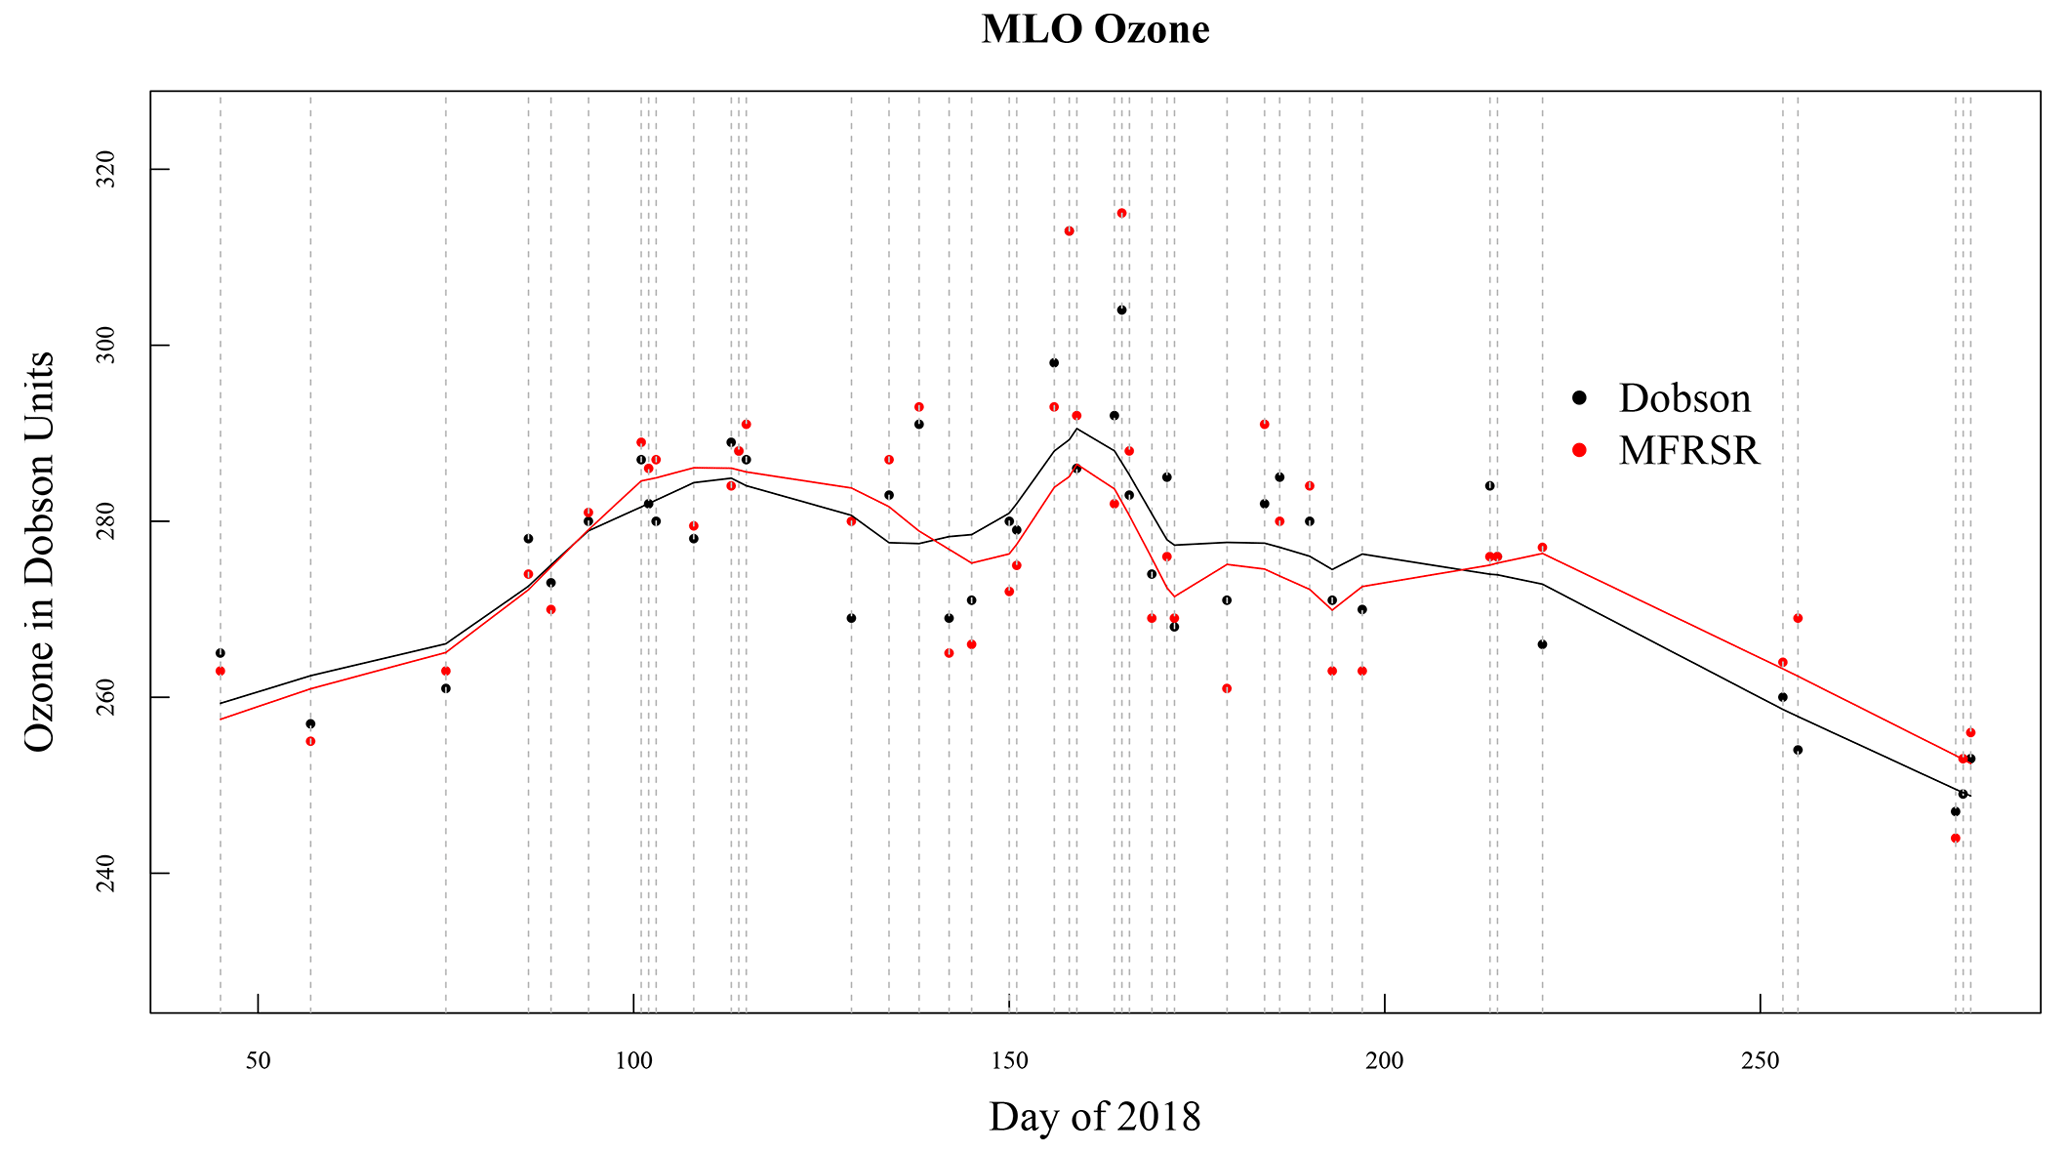
Figure 3Time series plot of Mauna Loa Observatory for 43 d of retrieved ozone for 2018 using the Dobson spectrophotometer (black dots) and the UV-MFRSR (red dots). The lines are LOWESS fits using 25 % of the points for the LOWESS fit at each point. The Dobson uses one of three measured points for the daily value, and the UV-MFRSR uses the median of all 20 s clear-sun data when the path to the sun is smaller than three air masses.
Uncertainties in using a UV-MFRSR for ozone retrievals were discussed thoroughly by Gao et al. (2001). In this paper only data taken at fewer than three air masses (about 71∘ solar-zenith angle) were used because (1) air mass determination is less certain at higher solar-zenith angles, and the cosine response correction for the UV-MFRSR is larger and more difficult to pinpoint and, therefore, more uncertain. The extraterrestrial responses for the four filters used to retrieve ozone were averages for the 242 d period in 2018 as stated earlier. The uncertainties in extraterrestrial responses were between 0.2 % and 0.3 %. The ozone absorption coefficients were those measured by Bass and Paur (1985) adjusted for mid-latitude seasonal variations. The effective ozone absorption coefficients were determined by convolving each of the filter profiles with the wavelength-dependent Bass and Paur (1985) ozone absorption coefficients. Similarly, effective Rayleigh scattering optical depths were determined in the same manner. The effective Rayleigh optical depths were pressure-corrected using on-site measurements of atmospheric pressure.
Always a major concern when working in the ultraviolet is light from outside the band passes contributing to the measured signal. SiC (silicon carbide) is the detector for the 300 and 305 nm filters. GaP (gallium phosphide) is used as the detector in the five longest-wavelength filters. To measure the extent of the possible long-wavelength leakage, we used a Schott glass OG530 placed over the entrance optic, being careful to block light paths from the edges that might reach the entrance diffuser optic. The transmission below 460 nm is 0.00001; therefore no light should reach the detectors with the OG530 completely covering the entrance optic. If higher orders of light from the interference filters would reach the detectors, they would begin to be a problem around 600 nm for the 300 nm filter and at longer wavelengths for the other six filters. The nighttime dark readings and 530 Schott blocking filter readings on a clear, sunny day were compared. These readings agreed within the detection limit for the UV-MFRSR.
After subtracting the large ozone and Rayleigh optical depth contributions to the total optical depth, a residual remains that is assumed to be aerosol extinction. At Mauna Loa Observatory the aerosol optical depths (AODs) are, in most cases, very small in the visible except in the aftermath of volcanic eruptions (Dutton et al., 1994). The current paper examines AODs in the ultraviolet near 305.6, 311.4, 317.5, 325.1, 332.4, and 367.8 nm, where measurements of AOD are infrequently made, especially below 340 nm. These wavelengths are shorter than those measured by most sun photometers, with 340 nm the shortest wavelength measured by AERONET (Holben et al., 2001), for example. Recently, however, López-Solano et al. (2018) used Brewer spectrophotometers to derive AODs at five wavelengths between 306.3 and 320.1 nm. They compared AODs measured in this wavelength range by different collocated Brewers and the ultraviolet precision filter radiometer (UVPFR) (Carlund et al., 2017). In general, there was excellent agreement between the Brewers and good, but less satisfactory, agreement between Brewers and the UVPFR; however, there was no discussion of the wavelength dependence of the Brewer and UVPFR AODs at these low wavelengths, which we consider next.
Figure 4 is typical of the AOD-versus-wavelength plots from the 43 d of measurements plotted in Fig. 3. Typical visible-wavelength-dependent behavior indicates a negative slope on this type of plot; however, the slope is positive from 305 to 332 nm and then becomes negative after that, with the 368 nm wavelength AOD smaller than the 332 nm wavelength. The red point in Fig. 4 is the average of collocated AERONET data at 340.8 nm (Holben et al., 2001) taken during the same time as the average of the UV-MFRSR data plotted here. This plot indicates consistency between the AERONET and UV-MFRSR data beyond 332 nm. A careful, exhaustive analysis of uncertainties in the UVPFR paper by Carlund et al. (2017) that examines this narrowband filter instrument at the shortest ultraviolet wavelengths close to those of our UV-MFRSR could not explain the similar wavelength dependence (see the right-hand side of their Fig. 6) that they measured for low-aerosol-optical-depth days in the autumn at Davos, Switzerland. Their Fig. 7 supports the argument that the Brewer spectrophotometer measurements at similar wavelengths should return a similar wavelength dependence. However, data from Davos in the spring did not show the downturn in AOD at the shortest wavelengths that the autumn data indicated. In summary, Carlund et al. (2017) suggest that the size of the uncertainties cannot completely rule out the possibility of a more typical wavelength dependence with AOD increases with decreasing wavelength.
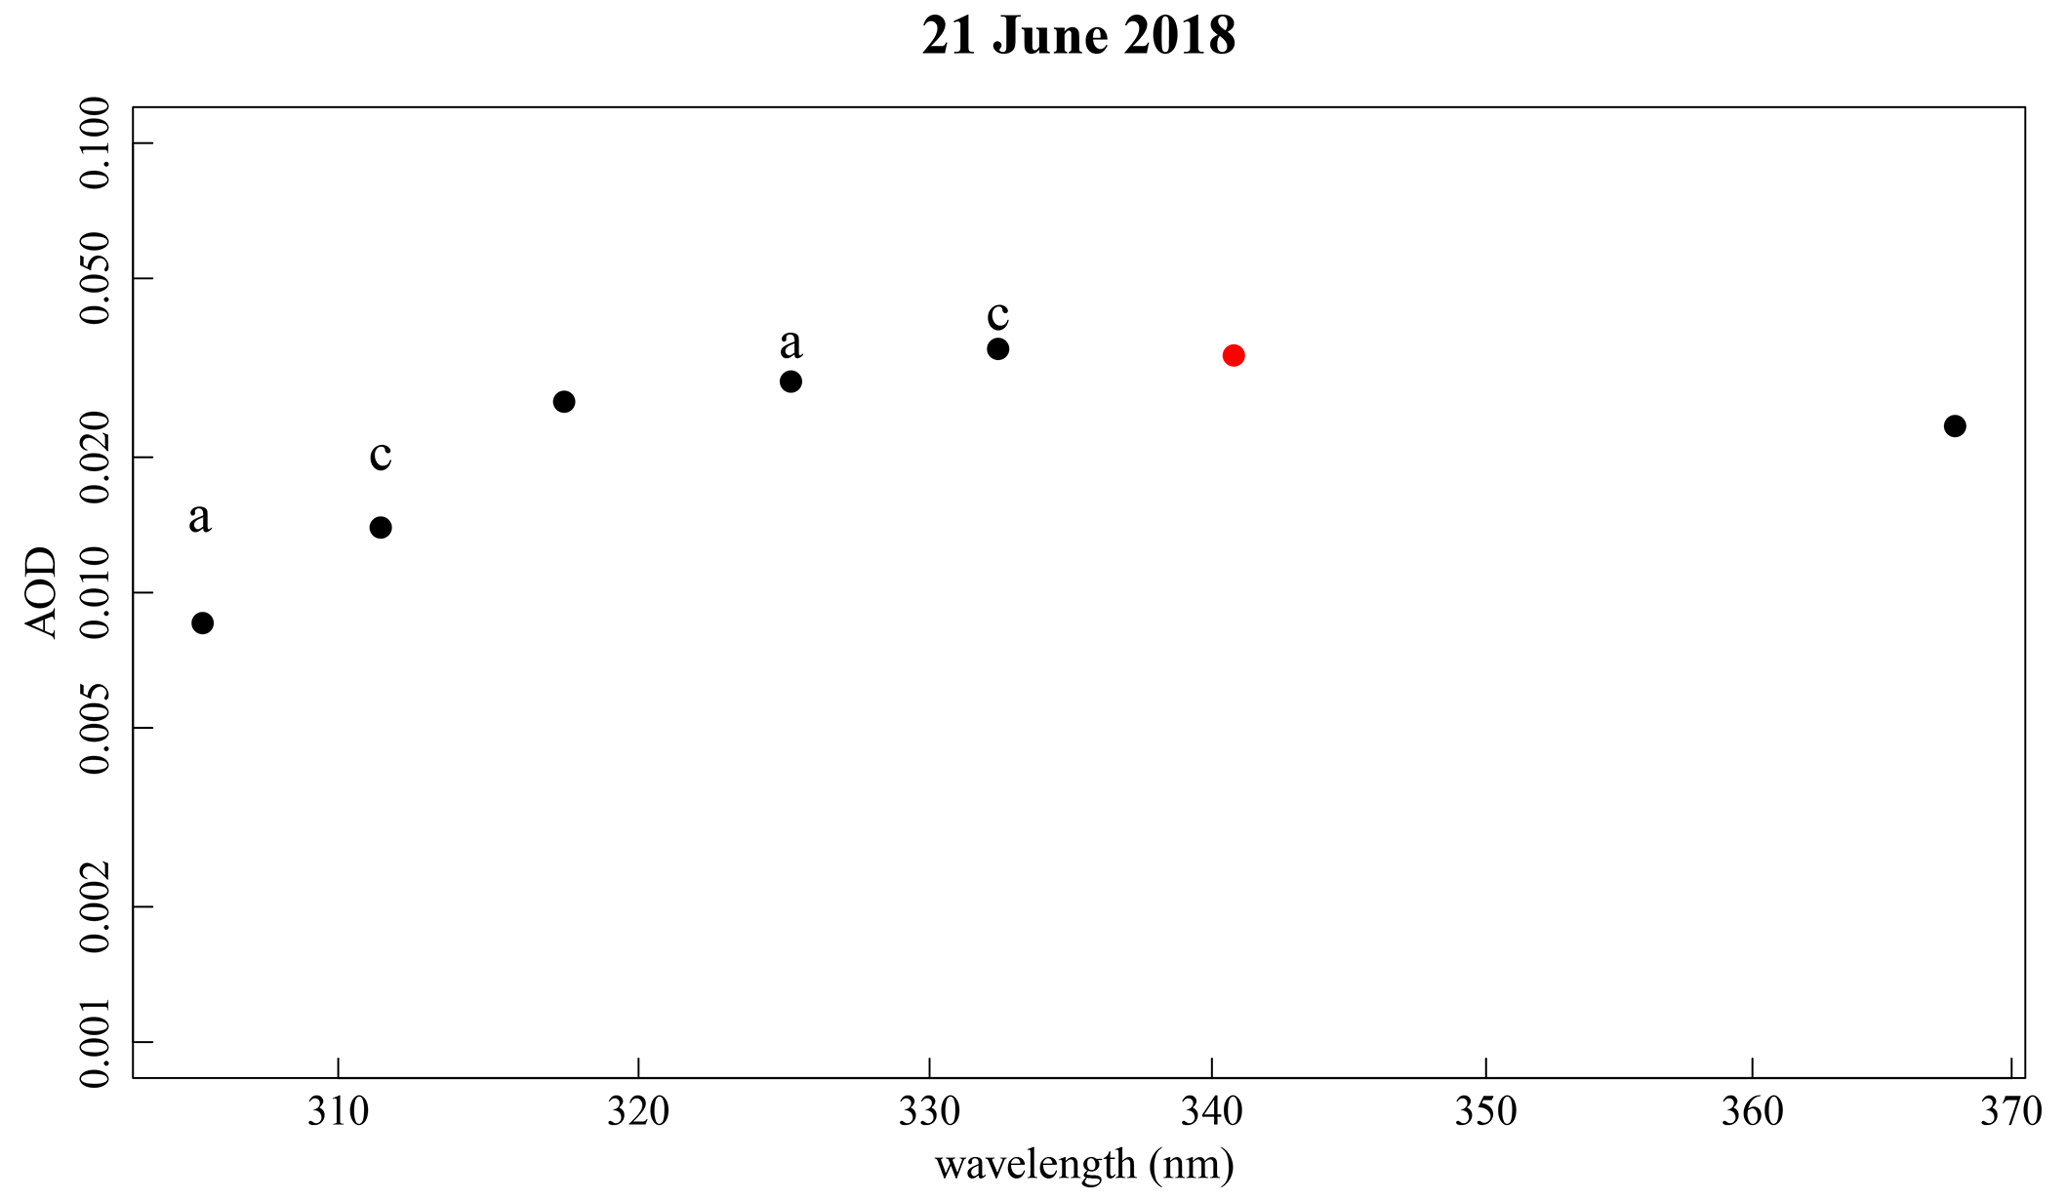
Figure 4This plot indicates the AOD versus wavelength for the UV-MFRSR filter set at Mauna Loa Observatory. Instead of a negative slope, this figure, which is typical of the 43 d in this study, indicates a positive slope, with a negative slope indicated by only the two longest wavelengths. The “a” and “c” labels are included to indicate the wavelength pairs used for the ozone retrievals. The red point is the average of the AERONET points at 340.8 nm that overlap with the UV-MFRSR averaging period.
We looked at nitrogen dioxide (NO2) as a possible contaminant that if not removed could explain this wavelength behavior; however, the typical amount of NO2 in the column above Mauna Loa would necessitate a correction of less than an optical depth of 0.001 at 332 nm, less at the shorter wavelengths, and slightly more at 368 nm. When only considering the 332 nm and 368 aerosol optical depths the plot indicates the typical visible wavelength dependence. Although Fig. 4 is the only plot of AOD shown, all of the 43 d had similar behavior.
This paper focuses on data from the Manua Loa Observatory only. It corroborates results reported by Gao et al. (2001) regarding the UV-MFRSR's ability to retrieve ozone column that is in agreement with the Dobson instrument at Mauna Loa Observatory. Figure 3 demonstrates this agreement even though there was no attempt to synchronize ozone observations other than to have them occur on the same day.
Aerosol optical depths were measured in this very clean environment, with expected low values but an unexpected wavelength dependence. This wavelength dependence is similar to that obtained with an independent, sun-pointed narrowband filter instrument developed and operated at the World Radiation Center (WRC) in Davos, Switzerland. Our and the WRC's attempts to explain this wavelength dependence have yet to yield an understanding of the physics at work here. Systematic biases may be responsible; a better understanding of the very large optical depths associated with ozone absorption and Rayleigh scattering at these wavelengths that have to be subtracted to obtain the small AOD may require more investigation. On the other hand, further study of environments with somewhat larger aerosol optical depths may indicate that this is, perhaps, associated with aerosol size distributions under some conditions.
After the paper was accepted as a preprint in Atmospheric Measurement Techniques we were contacted by Alexander Smirnov of the AERONET team (https://aeronet.gsfc.nasa.gov, last access: 1 January 2023). He made us aware of early Russian papers that measured AODs near the same short UV wavelengths that are plotted in Fig. 4. These are discussed in a book by Rozenberg (1996) that was originally published in Russian in 1963 and translated to English for the 1966 publication in the reference list. Figure 97 in the Rozenberg (1996) book is a reproduction of the figure from the paper by Rodionov et al. (1942) that clearly shows AOD decreasing shortward of 380 nm (dubbed by these authors “anomalous transparency”). The observations were made at a high (3 km) mountain site, explaining the low AOD values. These authors suggested that a specific aerosol size distribution might explain their wavelength dependence. The measurements of Rodionov et al. (1942) and suggested explanation of them were criticized, but a paper by Sakerin et al. (2000) suggesting that this effect and other unusual spectral dependencies of the AOD could be explained theoretically using specific combinations of nucleation, accumulation, and coarse aerosol modes.
Codes used to produced these results were original functions written in the programming language R and are available by contacting Joseph Michalsky (joseph.michalsky@noaa.gov).
Data can be made available by contacting Joseph Michalsky (joseph.michalsky@noaa.gov).
JM drafted the paper and produced the figures. GM produced the data for Fig. 2 and provided details about the Dobson ozone retrievals using the AD and AC pairs.
The contact author has declared that neither of the authors has any competing interests.
Publisher's note: Copernicus Publications remains neutral with regard to jurisdictional claims made in the text, published maps, institutional affiliations, or any other geographical representation in this paper. While Copernicus Publications makes every effort to include appropriate place names, the final responsibility lies with the authors.
This paper benefited from Dobson ozone retrieval discussions with Peter Effertz and Irina Petropavlovskikh. Kathy Lantz provided the UV-MFRSR data from Mauna Loa Observatory and performed the out-of-band rejection studies. Gary Morris and Kathy Lantz provided a careful reading of the draft paper. Thomas Carlund provided useful insight on WRC's efforts at ultraviolet AOD retrievals using the World Radiation Center (WRC) UV-PFR while he was on sabbatical at the WRC in Davos, Switzerland. Alexander Smirnov was very helpful in pointing out and discussing the earlier papers on Russian measurements and possible explanations for the low-UV short-wavelength AODs.
This research has been supported by the Global Monitoring Laboratory of the National Oceanic and Atmospheric Administration (DNA grant).
This paper was edited by Omar Torres and reviewed by two anonymous referees.
Bass, A. M. and Paur, R. J.: The ultraviolet cross sections of ozone: I. The measurements, in: Atmospheric Ozone – Proceedings of the Quadrennial Ozone Symposium 1984, edited by: Zerefos, C. S. and Ghazi, A., Springer, Dordrecht, 606–610, https://doi.org/10.1007/978-94-009-5313-0_120, 1985.
Bodhaine, B. A., Wood, N. B., Dutton, E. G., and Slusser, J. R.: On Rayleigh optical depth calculations, J. Atmos. Ocean. Tech., 16, 1854–1861, https://doi.org/10.1175/1520-0426(1999)016<1854:ORODC>2.0.CO;2, 1999.
Carlund, T., Kouremeti, N., Kazadzis, S., and Gröbner, J.: Aerosol optical depth determination in the UV using a four-channel precision filter radiometer, Atmos. Meas. Tech., 10, 905–923, https://doi.org/10.5194/amt-10-905-2017, 2017.
Dutton, E. G., Reddy, P., Ryan, S., and DeLuisi, J. J.: Features and effects of aerosol optical depth observed at Mauna Loa, Hawaii: 1982–1992, J. Geophys. Res., 99, 8295–8306, https://doi.org/10.1029/93JD03520, 1994.
Gao, W., Slusser, J., Gibson, J., Scott, G., Bigelow, D., Kerr, J., and McArthur, B.: Direct-Sun column ozone retrieval by the ultraviolet multifilter rotating shadow-band radiometer and comparisons with Brewer and Dobson spectrophotometers, Appl. Optics, 40, 3149–3155, https://doi.org/10.1364/AO.40.003149, 2001.
Holben, B. N., Tanre, D., Smirnov, A., Eck, T. F., Slutsker, I., Abuhassan, N., Newcomb, W. W., Schafer, J., Chatenet, B., Lavenue, F., Kaufman, Y. J., Vande Castle, J., Setzer, A., Markham, B., Clark, D., Frouin, R., Halthore, R., Karnieli, A., O'Neill, N. T., Pietras, C., Pinker, R. T., Voss, K., and Zibordi, G.: An emerging ground-based aerosol climatology: Aerosol optical depth from AERONET, J. Geophys. Res., 106, 12067–12097, https://doi.org/10.1029/2001JD900014, 2001.
Komhyr, W. D. and Evans, R. D.: Operations Handbook – Ozone Observations with a Dobson Spectrophotometer, AW No. 183, WMO/TD-No. 1469, 2008.
López-Solano, J., Redondas, A., Carlund, T., Rodriguez-Franco, J. J., Diémoz, H., León-Luis, S. F., Hernández-Cruz, B., Guirado-Fuentes, C., Kouremeti, N., Gröbner, J., Kazadzis, S., Carreño, V., Berjón, A., Santana-Díaz, D., Rodríguez-Valido, M., De Bock, V., Moreta, J. R., Rimmer, J., Smedley, A. R. D., Boulkelia, L., Jepsen, N., Eriksen, P., Bais, A. F., Shirotov, V., Vilaplana, J. M., Wilson, K. M., and Karppinen, T.: Aerosol optical depth in the European Brewer Network, Atmos. Chem. Phys., 18, 3885–3902, https://doi.org/10.5194/acp-18-3885-2018, 2018.
Michalsky, J., Schlemmer, J., Berkheiser III, W., Berndt, J., Harrison, L., Laulainen, N., Larson, N., and Barnard, J.: Multi-year measurements of aerosol optical depth in the Atmospheric Radiation Measurement and Quantitative Links programs, J. Geophys. Res., 106, 12099–12107, https://doi.org/10.1029/2001JD900096, 2001.
Michalsky, J., Denn, F., Flynn, C., Hodges, G., Kiedron, P., Koontz, A., Schlemmer, J., and Schwartz, S. E.: Climatology of aerosol optical depth in north-central Oklahoma: 1992–2008, J. Geophys. Res., 115, D07203, https://doi.org/10.1029/2009JD012197, 2010.
Rodionov, S. F., Pavlova, E. N., Rdultovshaya, E. V., and Reinov, N. T.: The selective transparency of atmospheric aerosols, Izv. Nauk SSSR, Ser. Geogr. Geofiz., 6, 135–147, 1942.
Rozenberg, G. V.: Twilight: A Study in Atmospheric Optics, Plenum Press, New York, 358 pp., ISBN 0608129313, 9780608129310, 1996. (Originally published in Moscow by State Press for Physico Mathematical Literature 1963.)
Sakerin, S. M., Rakhimov, R. F., Makienko, E. V., and Kabanov, D. M.: Interpretation of the anomalous spectral dependence of the aerosol optical depth in the atmosphere. Part 1. Formal analysis of situation, Atmos. Oceanic Opt., 13, 754–758, 2000.
Staehelin, J., Kerr, J., Evans, R., and Vanicek, K.: Comparison of total ozone measurements of Dobson and Brewer spectrophotometers and recommended transfer functions, World Meteorological Organization, WMO/GAW 149 (WMO TD 1147), 39 pp., 2003.
- Abstract
- Ozone retrieval introduction
- Calibration and ozone measurement comparisons
- Sources of ozone uncertainty
- Aerosol optical depth retrievals
- Discussion
- Appendix A
- Code availability
- Data availability
- Author contributions
- Competing interests
- Disclaimer
- Acknowledgements
- Financial support
- Review statement
- References