the Creative Commons Attribution 4.0 License.
the Creative Commons Attribution 4.0 License.
 | 13 Feb 2024
Towards a hygroscopic growth calibration for low-cost PM2.5 sensors
Milan Y. Patel
Pietro F. Vannucci
Jinsol Kim
William M. Berelson
Low-cost particulate matter (PM) sensors continue to grow in popularity, but issues such as aerosol-size-dependent sensitivity drive the need for effective calibration schemes. Here we devise a time-evolving calibration method for the Plantower PMS5003 PM2.5 mass concentration measurements. We use 2 years of measurements from the Berkeley Environmental Air-quality and CO2 Network sensors deployed in San Francisco and Los Angeles in our analysis. The calibration uses a hygroscopic growth correction factor derived from κ-Köhler theory, where the calibration parameters are determined empirically using US Environmental Protection Agency Air Quality System (EPA AQS) reference data at co-location sites during the period from 2021–2022. The parameters are found to vary cyclically through the seasons, and the seasonal cycles match changes in sulfate and elemental carbon PM composition fractions throughout the year. In both regions, the seasonal RH dependence calibration performs better than the uncalibrated data and data calibrated with the EPA's national Plantower calibration algorithm. In the San Francisco Bay Area, the seasonal RH dependence calibration reduces the root mean square error (RMSE) by ∼40 % from the uncalibrated data and maintains a mean bias much smaller than the EPA national calibration scheme (−0.90 vs −2.73 µg m−3). We also find that calibration parameters forecasted beyond those fit with the EPA reference data continue to outperform the uncalibrated data and EPA calibration data, enabling real-time application of the calibration scheme even in the absence of reference data. While the correction greatly improves the data accuracy, non-Gaussian distribution of the residuals suggests that other processes besides hygroscopic growth can be parameterized for future improvement of this calibration.
- Article
(3507 KB) - Full-text XML
-
Supplement
(896 KB) - BibTeX
- EndNote


Particulate matter (PM) is a major air pollutant, presenting a significant human health concern. PM2.5, particulate matter with diameters less than 2.5 µm, has been linked with a number of health outcomes including decreased lung function, premature death, cardiovascular diseases, and cancer (Kim et al., 2015; Cohen et al., 2017). As such, local PM observations are an essential part of a system for monitoring and improving community health and well-being. Additionally, coincident measurements of PM and other pollutants, like CO or NOx (NOx ≡ NO + NO2), can be used to elicit information on urban emissions and atmospheric processes (Fitzmaurice and Cohen, 2022). The increasing availability of low-cost PM sensors has facilitated high-density PM monitoring and widespread use outside the scientific and professional air quality communities.
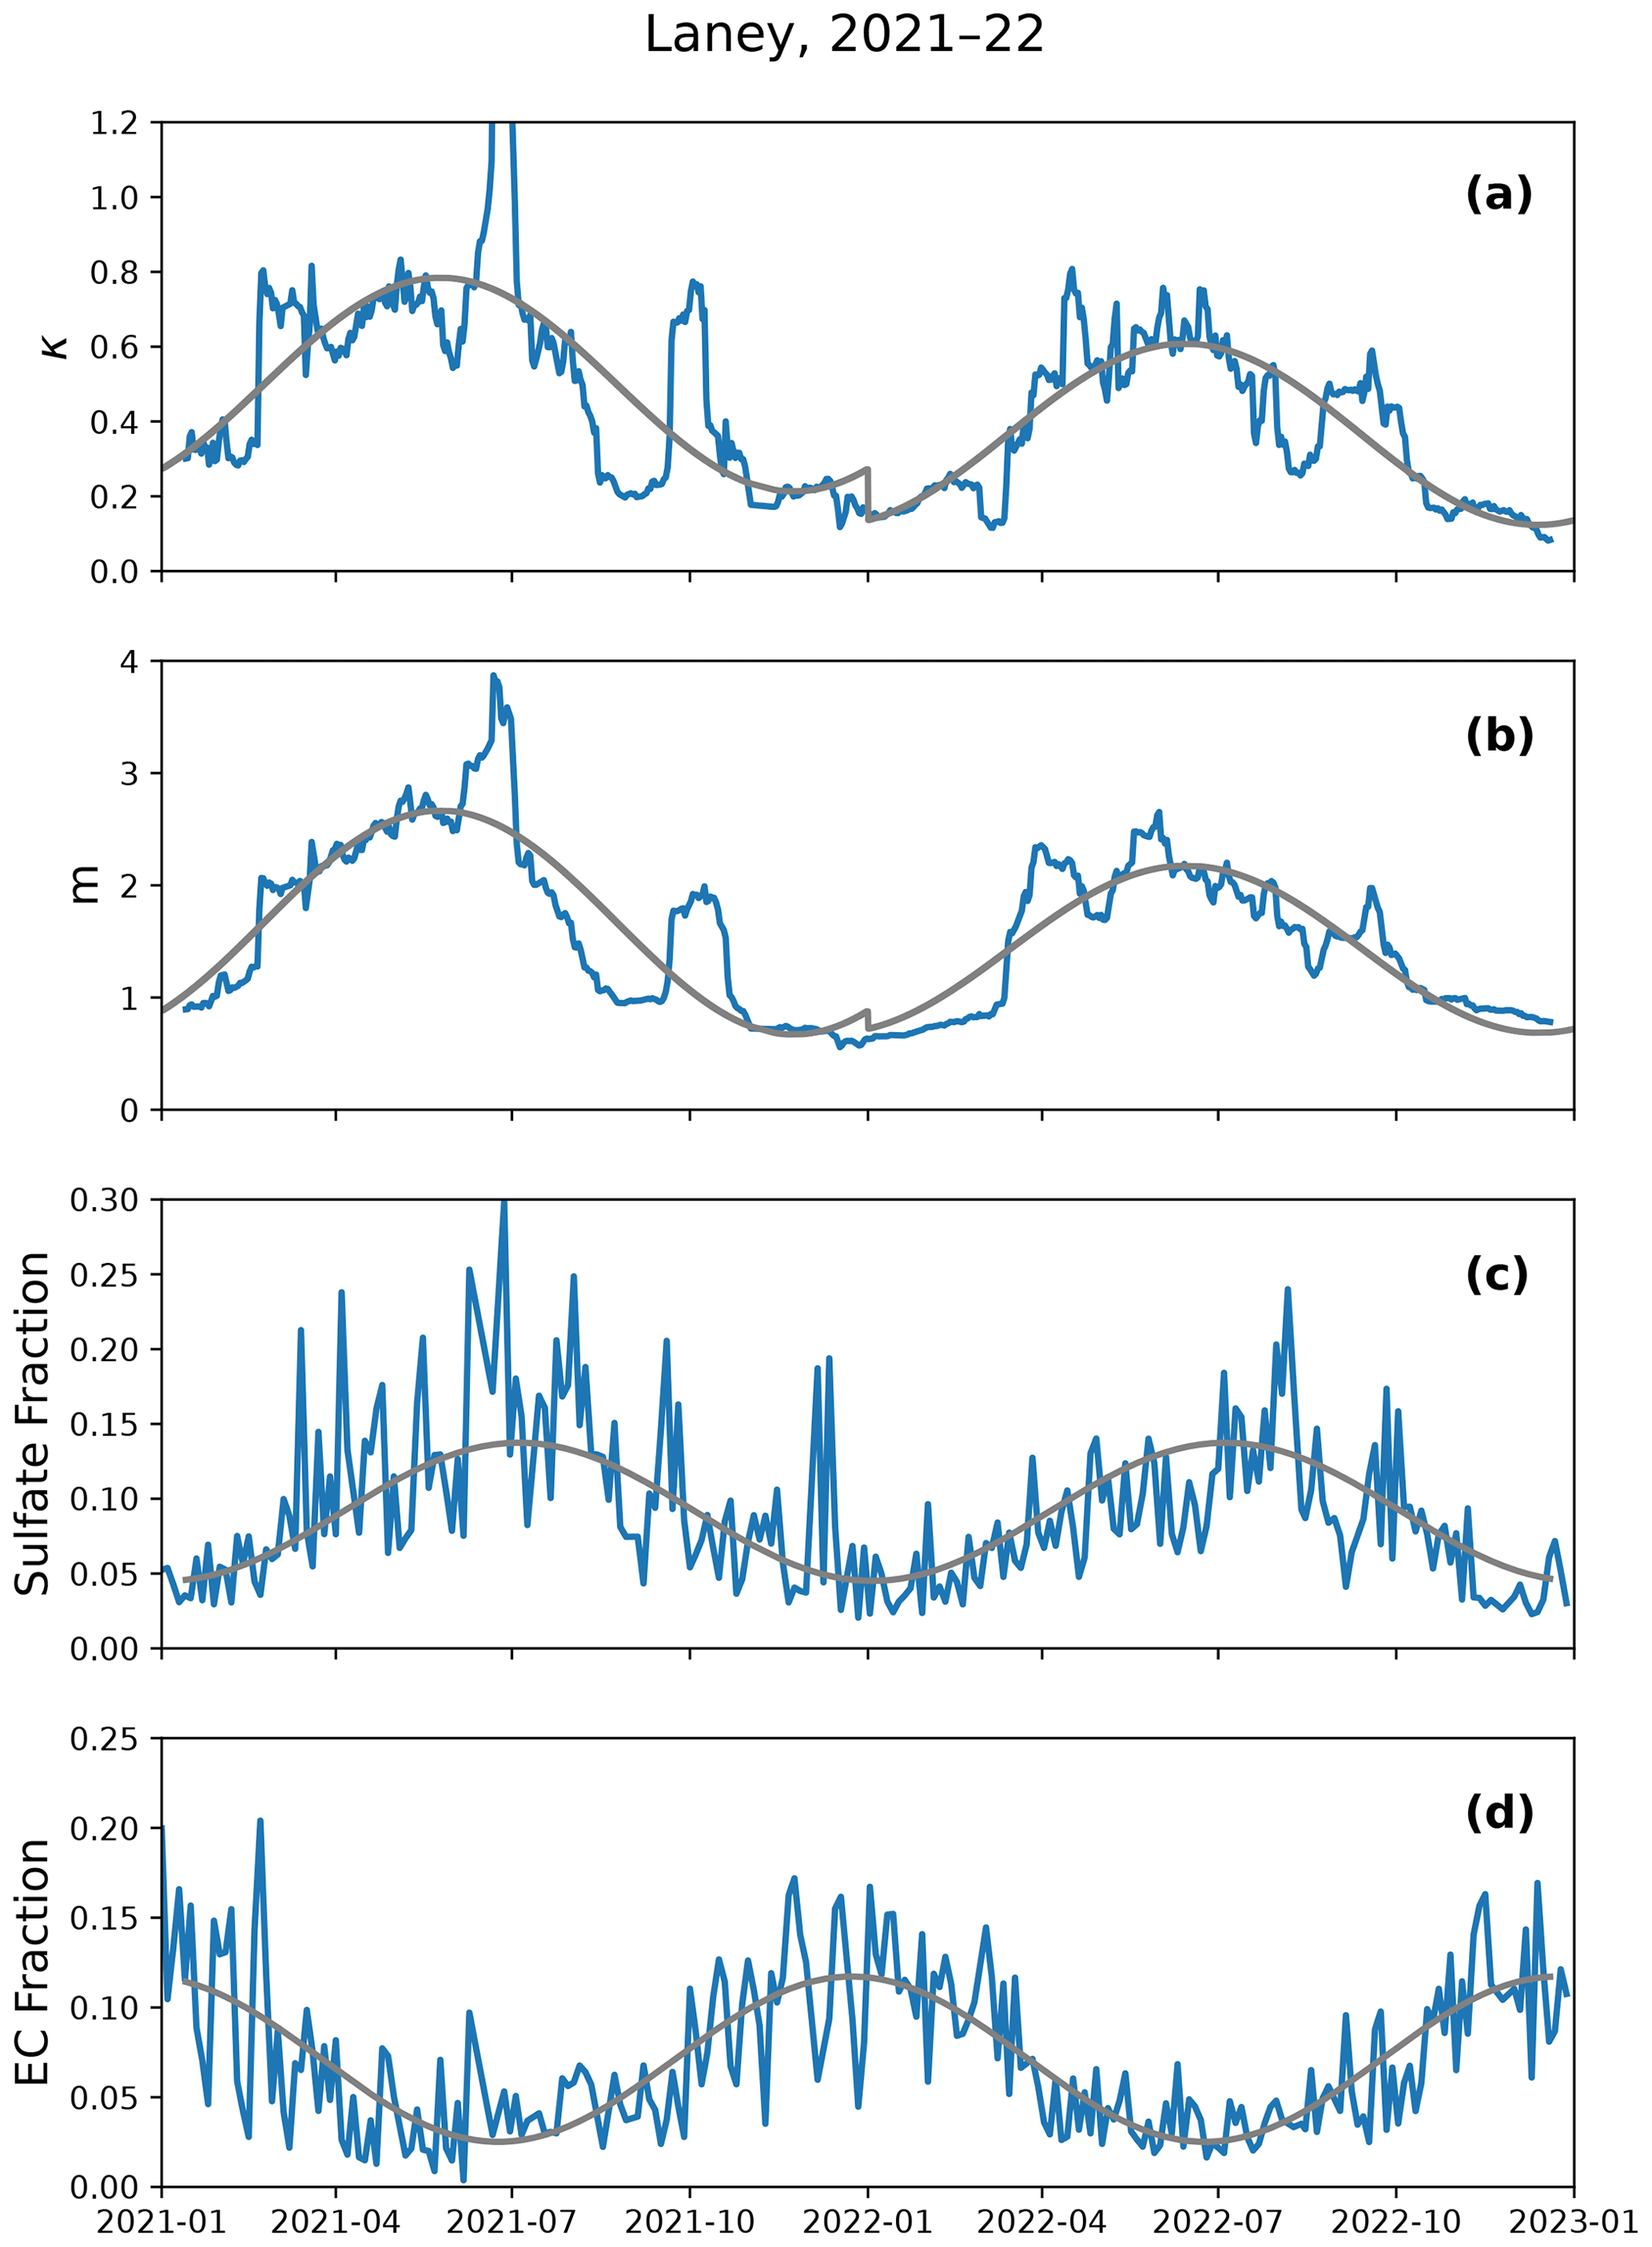
Figure 1(a, b) Calibration parameters generated for the Laney site and (c, d) particle speciation data from the nearest EPA AQS CSN site.
A well-documented issue with low-cost nephelometric PM sensors is their size-dependent sensitivity and sensitivity dependent on the index of refraction. These sensors are imperfect nephelometers. They are most sensitive to submicron particles, and their sensitivity decreases as particles get larger with near-zero detection for particles larger than 2 µm and lower efficiency below 300 nm (Kuula et al., 2020; Molina Rueda et al., 2023; Ouimette et al., 2022). For a constant particle size distribution and composition, a single scale factor can translate the observations to those made with instruments that capture the mass of the entire size distribution. However, fixed calibrations are inadequate for temporally evolving particle size and composition distributions. One of the major drivers of variability in particle size distributions is hygroscopic growth, which is the uptake of atmospheric water onto PM. While reference instruments such as those used in the US Environmental Protection Agency's Air Quality System (EPA AQS) measure particles under controlled, low-humidity conditions, low-cost sensors usually measure particles under ambient atmospheric conditions (Ambient Monitoring Technology Information Center, 2022; Giordano et al., 2021). Fluctuations in the relative humidity (RH) change particle size and refractive index through water uptake, both of which impact particle light scattering and subsequent detection by nephelometers (Petters and Kreidenweis, 2013; Han et al., 2020; Hänel, 1968). On longer timescales, PM size distributions and composition vary depending on primary emissions sources and secondary PM formation pathways (Mackey et al., 2021; Sayahi et al., 2019; Stavroulas et al., 2020). Theoretical calculations show that relative humidity is the largest source of uncertainty for optical particle sensors when the aerosol is hygroscopic (Hagan and Kroll, 2020). An efficient calibration scheme for nephelometric sensors must therefore account for both rapid (hourly) size fluctuations due to changes in humidity and long-term (monthly) variations in particle composition and hygroscopicity.
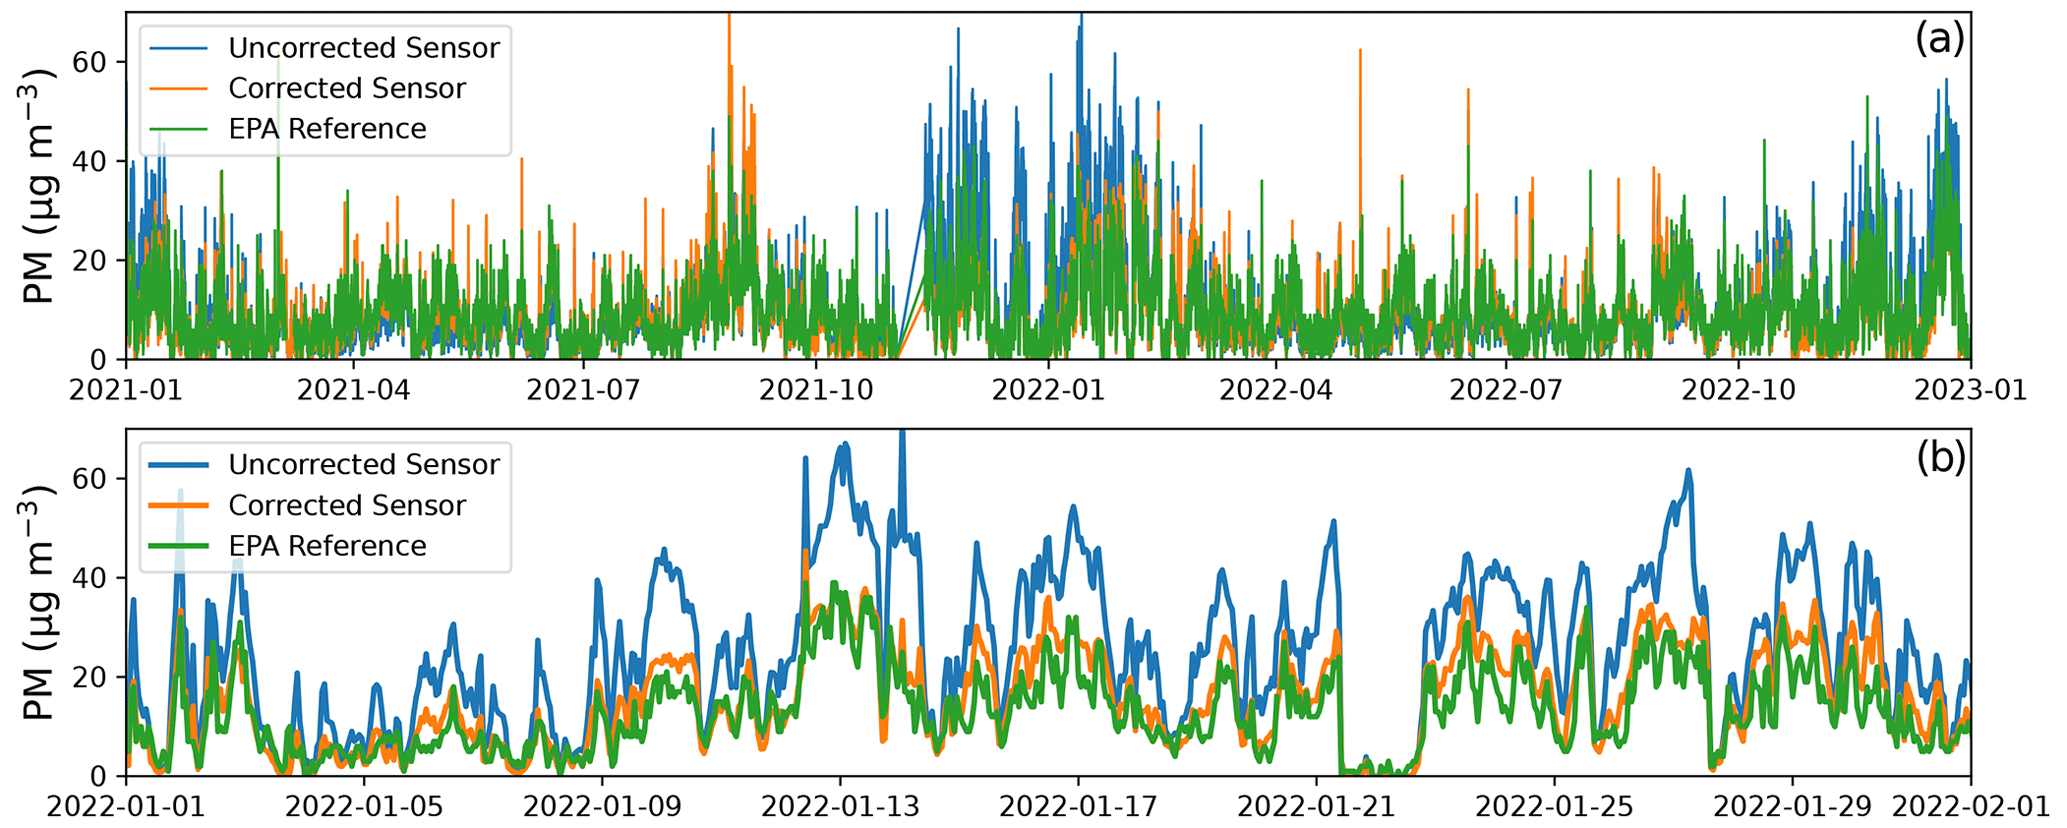
Figure 2Time series of the Laney site Plantower PM2.5 data without and with the seasonal RH dependence calibration compared to the co-located EPA PM2.5 reference data for the whole 2-year study period (a) and for the subset of January 2022 (b).
Several previous studies have reported calibrations to correct for the hygroscopic growth of particles measured with low-cost optical sensors. Crilley et al. noted the high bias of PM2.5 mass concentrations from optical particle counters (OPCs) when the relative humidity was high and used a bias correction scheme derived from κ-Köhler theory, which has subsequently been applied to other low-cost OPC studies (Crilley et al., 2018; Di Antonio et al., 2018). Similar bias correction schemes have also been applied to nephelometric PM sensors. Malings et al. used a hygroscopic growth correction on Plantower PMS5003 in the PurpleAir sensors as well as the Met-One NPM during a field study in Pittsburgh, PA, where separate parameters were set for summer, winter, and transition months to account for seasonal changes in the hygroscopicity of the particles based on measured speciation data (Malings et al., 2020).
Malings et al. recognized the need for seasonally variant parameterization of hygroscopic growth and implemented a piecewise change in hygroscopic growth parameters to account for these seasonal changes. Here, we propose a calibration scheme for the Plantower PMS5003, a low-cost nephelometric PM sensor, whose hygroscopic growth parameters smoothly evolve through the seasons based on smooth evolution of observed composition to represent gradual changes in PM hygroscopicity over time. The Plantower is a widely used low-cost PM sensor (Nilson et al., 2022; Molina Rueda et al., 2023; Barkjohn et al., 2021; Kumar and Sahu, 2021; Sayahi et al., 2019), so the development of regional, easy-to-implement corrections for these instruments is useful to air quality monitoring broadly.
The Berkeley Environmental Air-quality and CO2 Network (BEACO2N) is a high-density network of low-cost sensors spread across multiple urban centers around the globe, monitoring CO2, CO, NOx, O3, and PM2.5 (Shusterman et al., 2016). There are currently 57 active BEACO2N sites in the San Francisco Bay Area, with additional networks in Los Angeles (CA), Providence (RI), and Glasgow (Scotland). Each BEACO2N node enclosure contains a Plantower PMS5003 (Plantower, 2016) for PM measurements as well as an Adafruit BME280 (Adafruit Industries, 2023) for temperature, pressure, and humidity measurements, with fans on either end of the enclosure to cycle air through the node. The Plantower PMS5003 is a nephelometric PM sensor reporting mass concentrations for PM1, PM2.5, and PM10, though for the remainder of this work we will only discuss the PM2.5 output measurement for this sensor. The sensor has internal calibrations, unknown to the user, that convert from scattered light intensity to PM mass concentrations. Here, we use the CF = ATM sensor output, which is recommended for outdoor PM2.5 measurements. The calibration factor described herein is applied to this PM2.5 mass concentration sensor output. Plantower data were recorded every 8 s and averaged to hourly data points, which are used in this analysis.
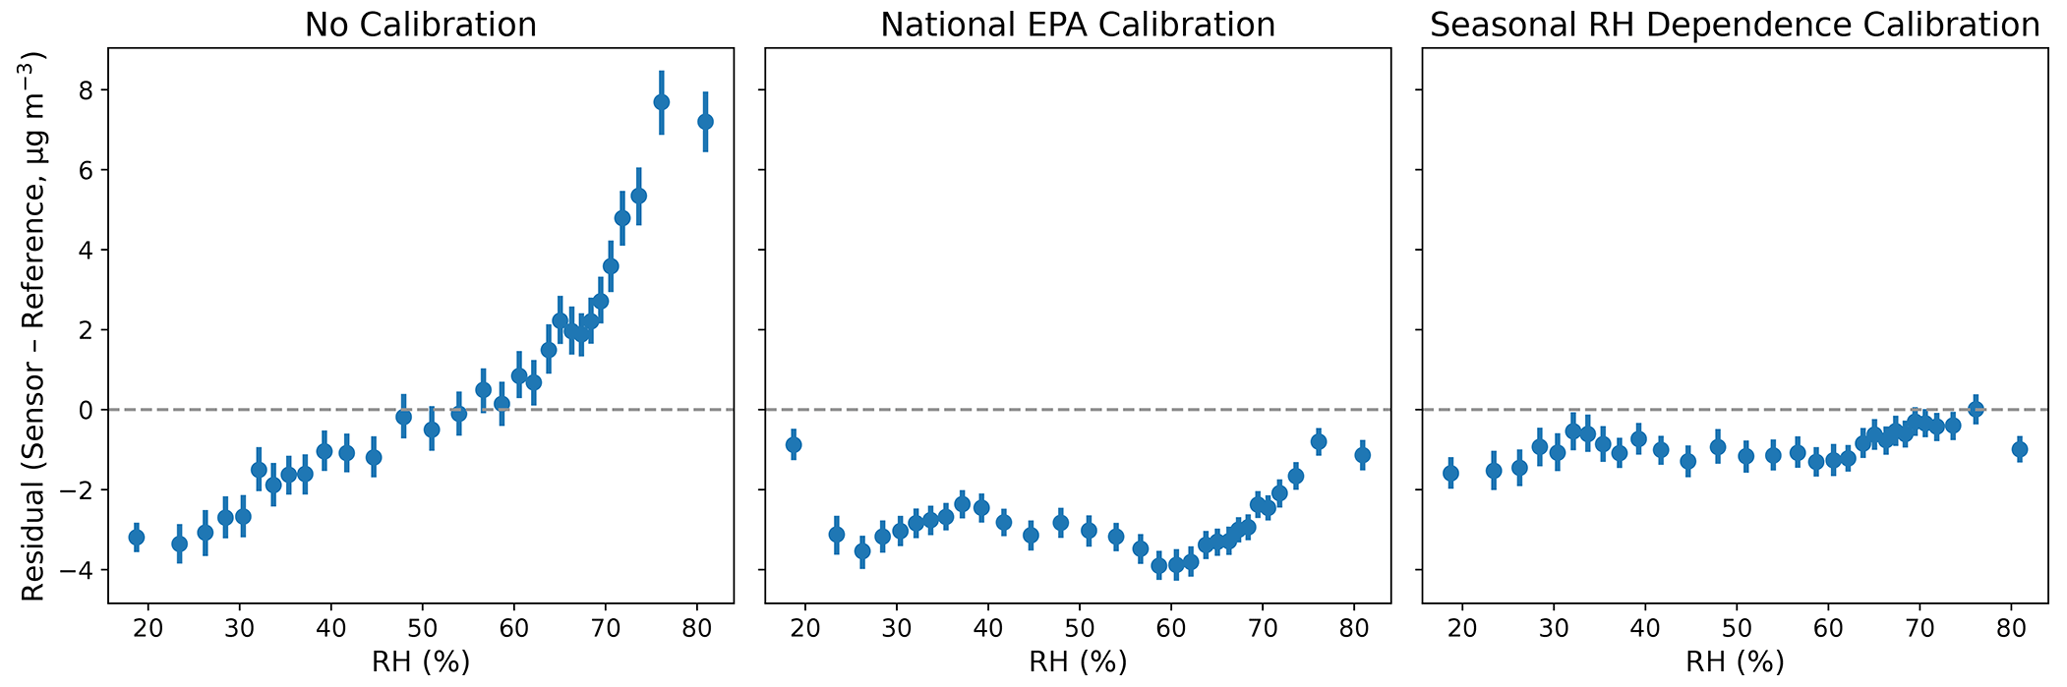
Figure 3Measurement residuals (sensor output – EPA AQS values) for data from the Laney site with different calibration algorithms, binned into 30 RH bins.
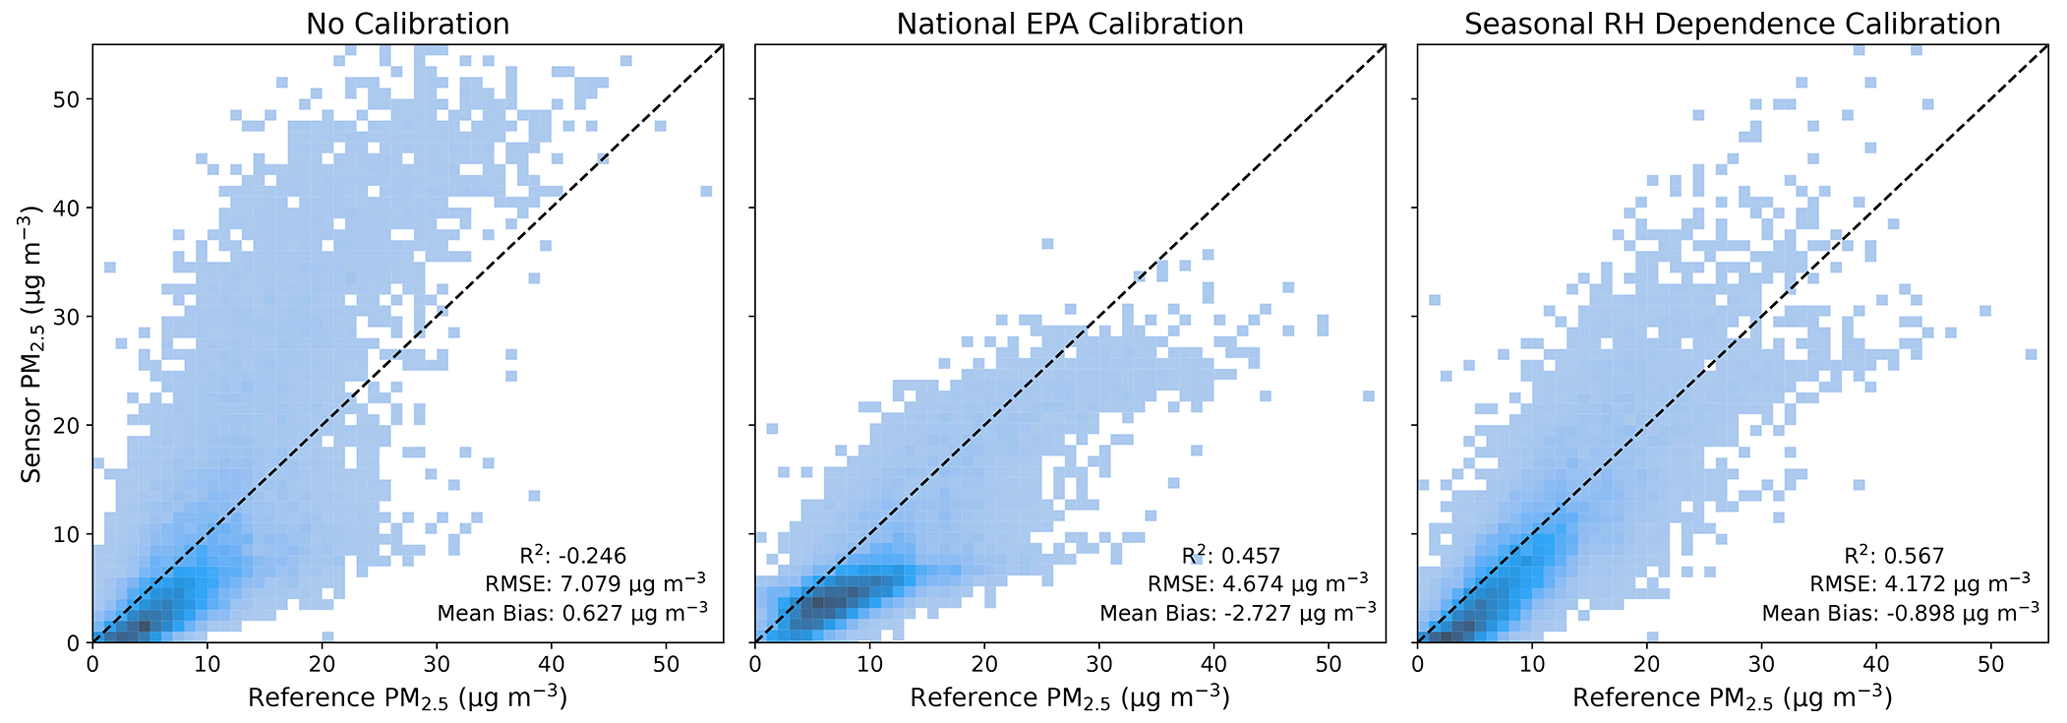
Figure 4Sensor-predicted PM2.5 values versus EPA reference values for the Laney site from 2021–2022 with different correction algorithms. Performance metrics are the coefficient of determination (R2), root mean square error (RMSE), and mean bias.
The humidity-dependent equilibrium water uptake by particles is often parameterized by the hygroscopic growth parameter, κ, which is dependent on particle composition. κ–Köhler theory can be used to derive an RH-dependent factor to account for hygroscopic particle growth (Nilson et al., 2022; Petters and Kreidenweis, 2013; Crilley et al., 2018). This can be supplemented by an additional scaling factor, m, which can account for discrepancies between the assumed particle size distribution in the factory calibration and the true particle size distribution for the particles being measured (Hagan and Kroll, 2020; Malings et al., 2020). This leads to the following calibration algorithm:
which has two parameters, m and κ. For a given particle, κ can be calculated as the weighted average of the hygroscopic growth parameters for all constituents in the particle (Petters and Kreidenweis, 2013). Similarly, one could use the weighted average of this value over a sample of particles to get their collective growth parameter. Since composition information for PM is not as widely available as total PM2.5 mass concentration measurements, we determine κ and m empirically and validate their values over time using seasonal trends in observed PM composition. This empirical approach is more accessible to anyone trying to implement this calibration on sensors in areas with limited speciation data. However, as a point of comparison, we also calculate κ using data from the EPA AQS Chemical Speciation Network. κ values for the major aerosol components are taken from various studies in the literature (Petters and Kreidenweis, 2013; Cerully et al., 2015; Chen et al., 2022).
The empirical parameters m and κ in Eq. (1) are calculated using co-located BEACO2N Plantower PMS5003 and EPA AQS sites, where the EPA AQS PM2.5 provides a reference concentration for the calibration (Table 1). The fitting was performed on hourly Plantower and RH data with the Python package scipy.optimize (Virtanen et al., 2020). We describe application and evaluation of this calibration approach to the BEACO2N networks in the San Francisco Bay Area and Los Angeles, CA, during the years 2021 and 2022. A summary of the datasets used can be found in Table S1.
In the San Francisco Bay Area, we utilize two co-location sites in the 2021–2022 period of study. These are listed in Table 1 along with a co-location site in Los Angeles, CA. Note that the Castelar ES site is located 1.06 km from EPA site 06-037-1103, whereas the two Bay Area BEACO2N sites are on-site with their respective EPA AQS reference instruments. All three EPA AQS sites measured hourly PM2.5 using a Met-One BAM-1020 Mass Monitor w/VSCC.
The EPA has also developed a national Plantower calibration algorithm with the following form:
which they currently apply to PurpleAir Plantower PMS5003 measurements on their AirNow website (Barkjohn et al., 2021). This scheme, herein the “national EPA calibration”, is used throughout the paper as a point of comparison.
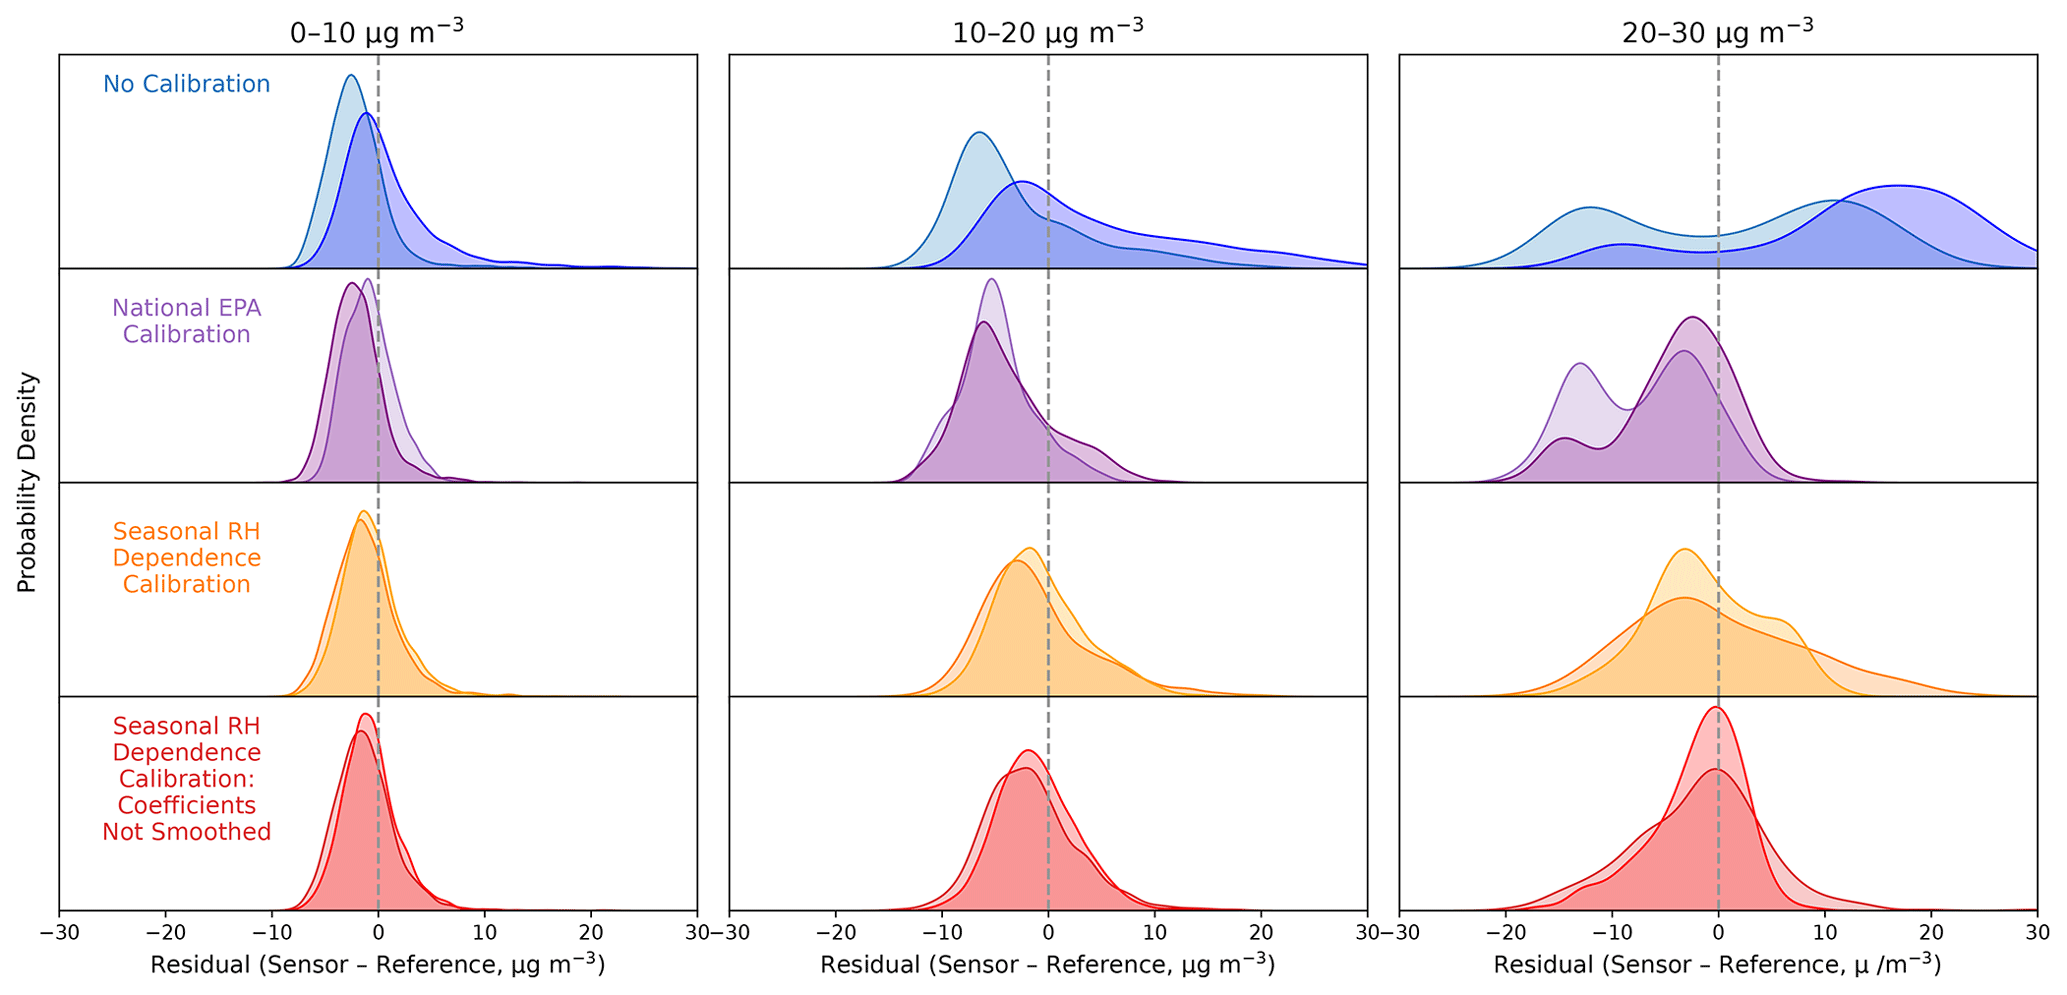
Figure 5Sensor residual distributions for different calibration schemes at different PM2.5 mass concentration bins for RH < 50 % (light color) and RH > 50 % (dark color) conditions. The calibration scheme “seasonal RH dependence calibration: coefficients not smoothed” uses the calculated κ and m values as is, without smoothing to a sine wave.
3.1 RH calibration
Figure 1a and b show the calibration coefficients generated by fitting the observations from the Laney site (Table 1) Plantower sensor to the EPA reference data using a 4-week moving window. A strong seasonal cycle is evident. The EPA AQS Chemical Speciation Network (CSN) (sites used are listed in Table 1) provides measurements for components of PM, including the major aerosol species: ammonium, nitrates, sulfates, organic carbon, and elemental carbon (EC). Figure 1c and d show the sulfate and elemental carbon (EC) fraction observed at the CSN site nearest to Laney. Sulfate is the most hygroscopic of the major components of aerosols, while EC is not hygroscopic (Petters and Kreidenweis, 2013; Wu et al., 2016). For this reason, we will use these species to infer trends on the overall hygroscopicity of PM2.5 across the seasons.
The speciation data from the nearest CSN site show strong seasonal trends where the sulfate fraction is highest in the summers while the EC fraction is highest in the winters. The fitted κ values show an appropriate response, where the particles are most sensitive to RH in the summers and least sensitive in the winters. The scaling factor, m, follows the same seasonal cycle as κ. This can be reasoned by concluding that when κ is large, particles are subject to more hygroscopic growth, and consequently particle size distributions are shifted to larger sizes which are detected with less efficiency by the Plantower sensor. Since κ and m are calculated empirically, they may also respond to factors besides hygroscopic growth, which could account for differences seen between trends in these parameters and trends in the displayed aerosol components. Using the EPA AQS CSN data for all major aerosol components, we construct κ from the speciation data and compare it to the empirically derived κ in Fig. S1. We find reasonably strong agreement in the seasonal trend for the two κ time series, with peaks in κ occurring during the same times of the year.
The calibration coefficients can be smoothed, preventing overfitting, by fitting the coefficients to a sine curve. The gray lines in Fig. 1 show the sine curve fits for 2021 and 2022, where the periods of the curves are set to 1 year. Parameters for the sinusoidal fits can be found in Table S2. Application of Eq. (1) using these smoothed κ and m parameters is herein referred to as the “seasonal RH dependence calibration”. This calibration is applied to the data over 2021 and 2022. Figure 2 shows a time series of the pre- and post-calibration sensor data, along with the EPA AQS reference measurements. Table S3 shows that the calibrated data have a significantly improved Pearson's correlation, r, and NRMSE, especially during the winter months.
3.2 Evaluation
Figure 3 shows that the strong RH-dependent bias in Plantower PMS5003 outputs is removed through the implementation of the seasonal RH dependence calibration scheme. Notably, the national EPA calibration scheme, which assumes a linear RH dependence, does not properly account for the nonlinear RH effects on particle size and detection. Figure S2 shows that the seasonal RH dependence calibration also removes the temperature dependence of the residuals. This was expected since most of the temperature dependence was likely due to covariance of temperature and RH rather than intrinsic temperature effects on sensor measurement or performance. Figure 4 shows the uncalibrated and calibrated Plantower measurements compared to the EPA AQS reference observations for the entire 2-year period. Both the national EPA calibration and the seasonal RH dependence calibration led to reductions of ∼40 % in the RMSE and increases of ∼0.75 in the coefficient of determination (R2), but the EPA national calibration introduces a large negative bias in the measurement. It is worth noting the importance of having κ and m change through time. When the calibration is applied with an optimized but constant κ and m parameter (κ=0.311, m=1.02), the performance of the calibration is sizably worse (R2=0.407, RMSE = 4.884 µg m−3, mean bias −2.296 µg m−3) than the seasonal RH dependence calibration, as apparent in Fig. S3.
There were no major smoke events or other air quality events of substantial nature (e.g., multiday events, significantly high PM concentrations) during the 2021–2022 study period in the Bay Area. In August and September of 2021, there are many days with air quality warnings for smog due to winds carrying smoke from nearby fires and high-temperature events worsening local pollution. If we remove data during this time period from Fig. 4, the figure is virtually unchanged and the statistics are quite similar (Fig. S4). In other time periods, we would expect that significant air quality events could impact the analysis and should be removed from the dataset prior to fitting and applying the calibration.
Analyzing the distribution of errors from each of the calibration types under different mass concentration and humidity levels can help assess the completeness of each of the calibration schemes. We would expect that a complete calibration would produce zero-centered, Gaussian error distributions since all remaining errors would be from random noise in the measurement. Looking at the distribution of errors at different PM2.5 mass concentrations (Fig. 5) it is evident that, while the seasonal RH dependence calibration produces errors more symmetric and centered near zero than the uncalibrated data and the EPA calibration data, the errors are still not perfectly Gaussian, especially when the PM2.5 mass is high. This suggests that there are other processes and aerosol properties at play unaccounted for by this calibration, as discussed further in Sect. 3.5. We also explore the error distributions when κ and m are not smoothed to sine waves and find no meaningful differences between the smoothed and unsmoothed cases when PM2.5 ≤ 20 µg m−3, which accounts for over 95 % of the data (Fig. 5). As such, representing seasonal changes in κ and m throughout the year as sine waves is a valid approximation.
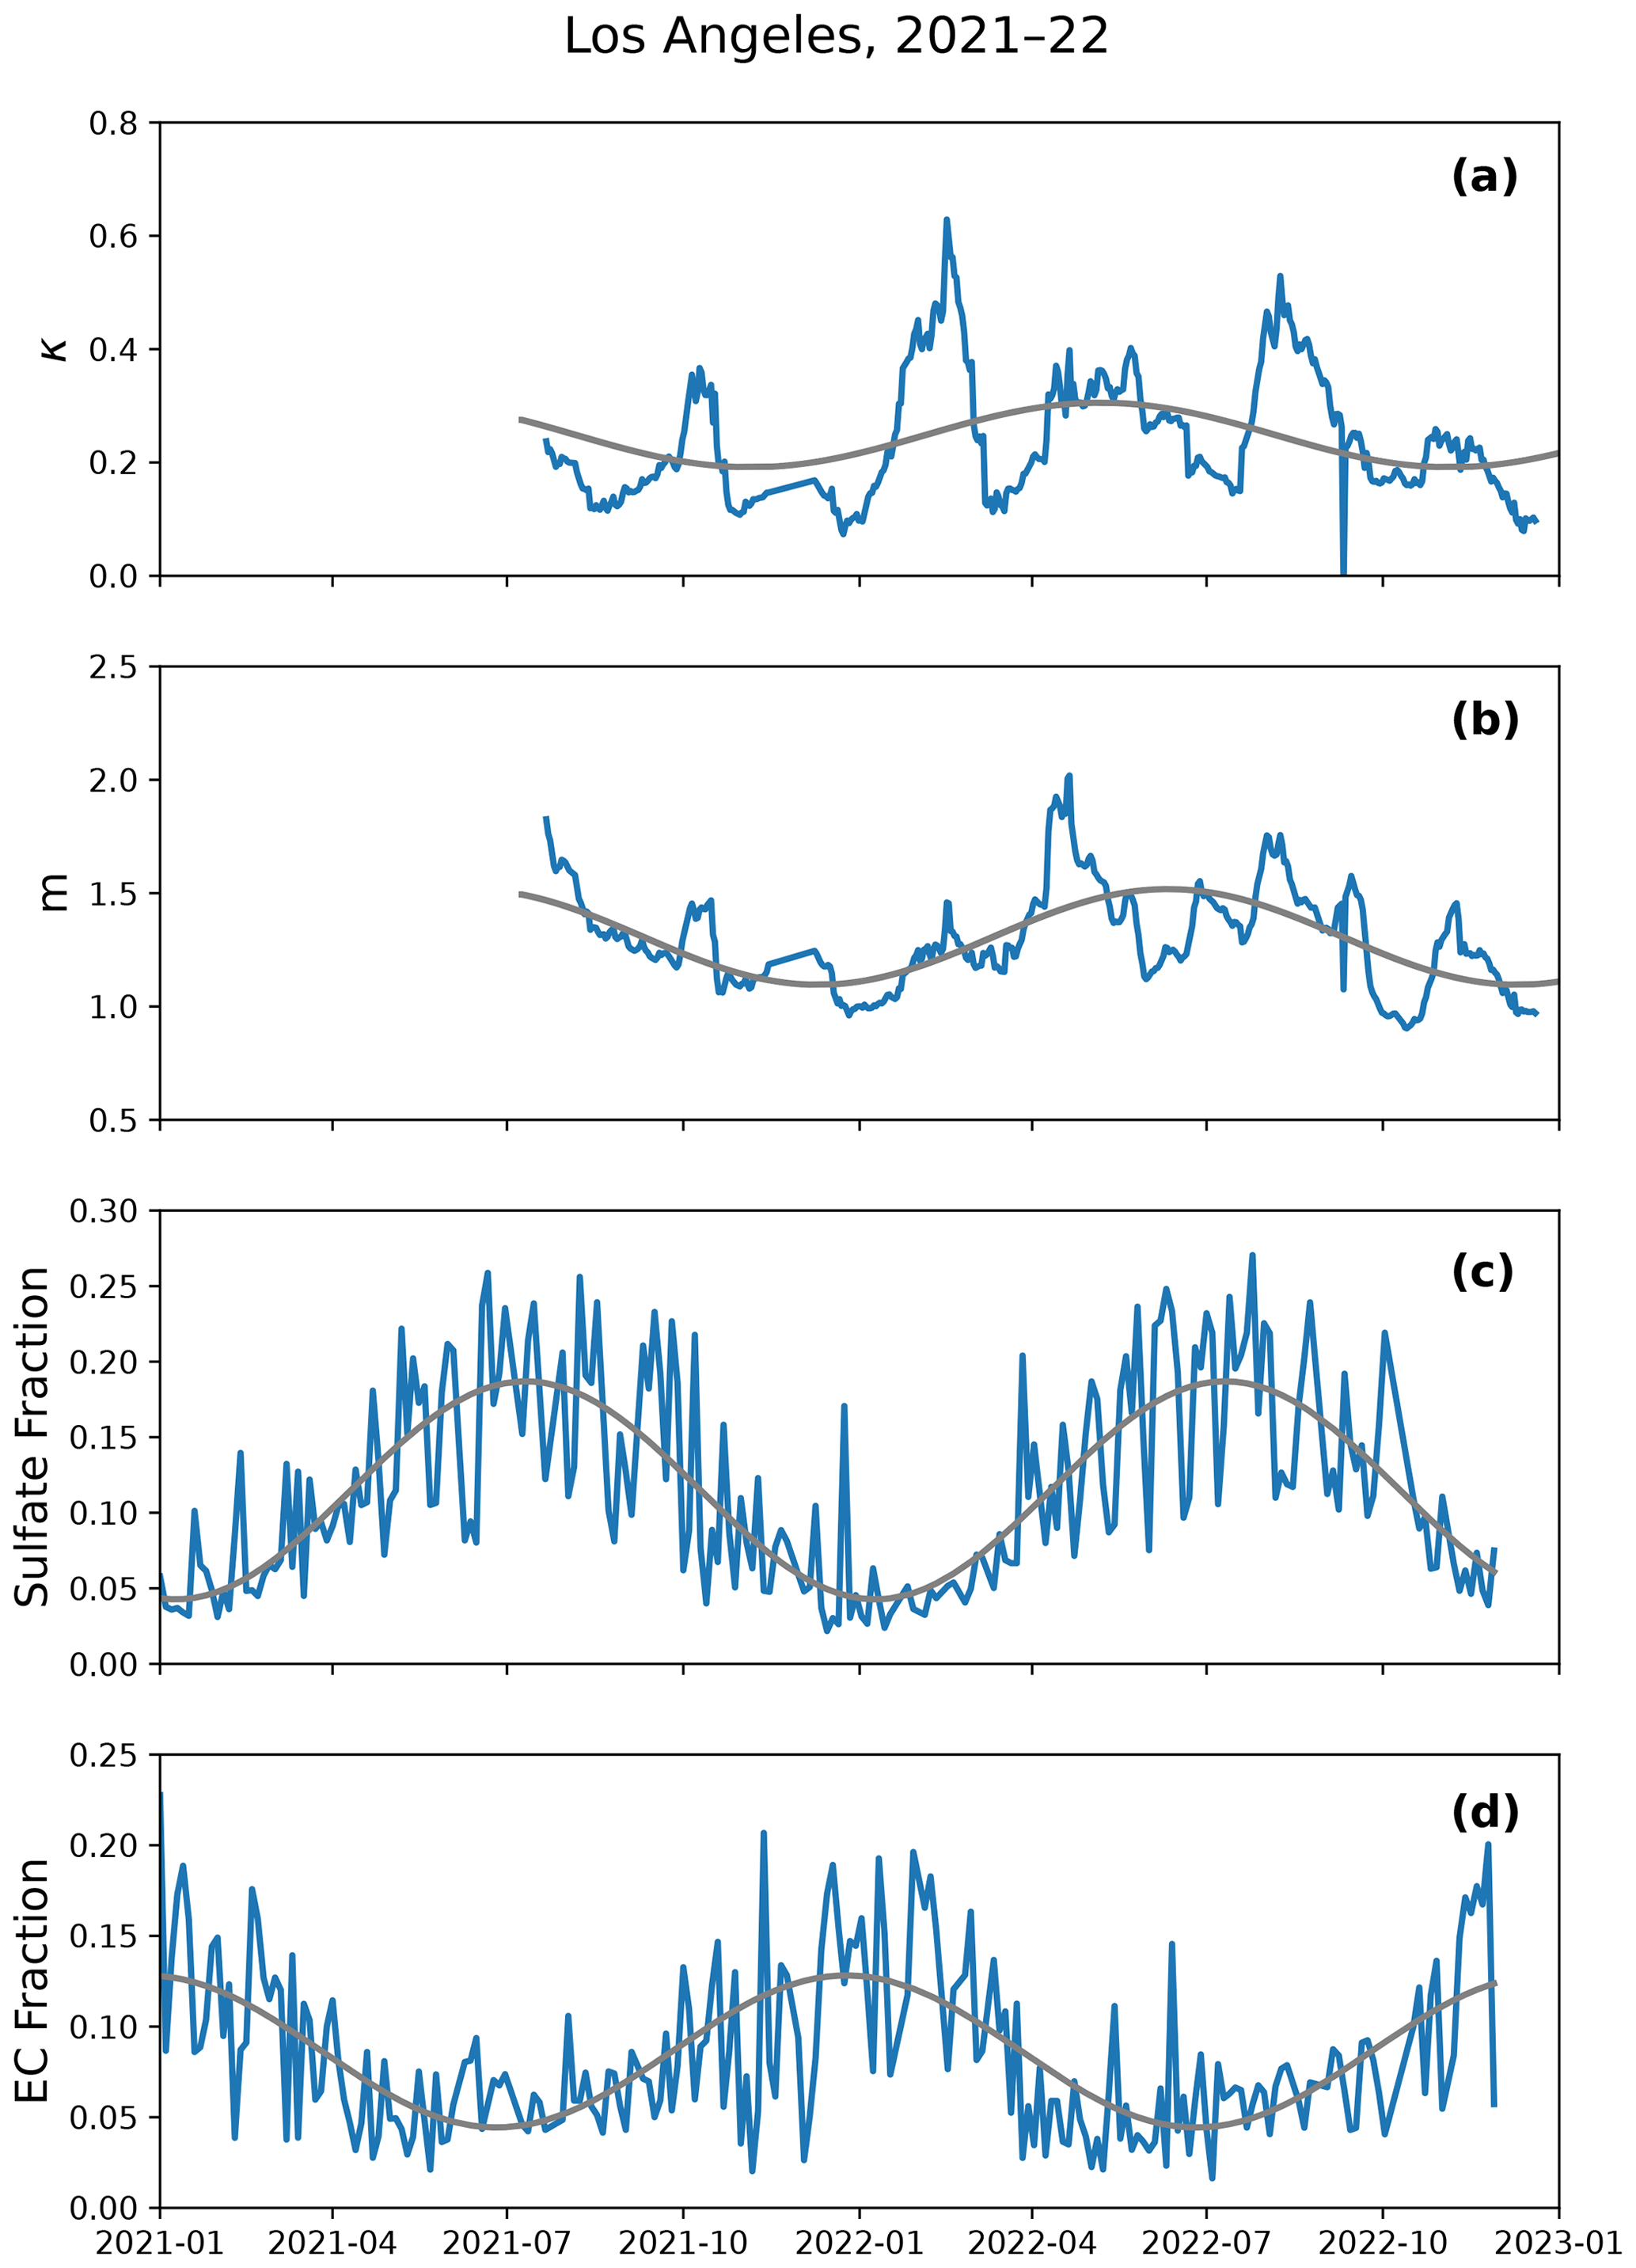
Figure 6(a, b) Calibration parameters generated for the Los Angeles site and (c, d) particle speciation data from the nearest EPA AQS CSN site.
3.3 Inter-region and intra-region comparisons
Given that the κ and m parameters follow trends consistent with PM speciation data, it is reasonable to assume that the parameters generated at one site can be applied to nearby sites if the particle composition is homogenous across the urban area.
To further test this assumption, we independently generate calibration coefficients for another Bay Area co-location pair at the EBMUD site (Table 1). As seen in Fig. S5, the EBMUD and Laney co-location pairs independently reproduce nearly identical calibration coefficients, ensuring that the coefficients are not over-fit on one site but rather reflect regional trends in PM composition. Another concern is the possibility that individual sensors have disparate sensitivities or offsets. We find that uncalibrated measurements from 17 co-located Plantowers show strong agreement with each other (Fig. S6), with differences between sensors generally less than 1 µg m−3, suggesting that there is little sensor-to-sensor variability in sensor performance.
The seasonal RH dependence calibration scheme was tested in another urban area to ensure its generalizability beyond the Bay Area. Using a co-location site in Los Angeles, CA, we find that the aerosol composition again displays seasonality (Fig. 6), with the sulfate fraction highest in the summers and the EC fraction highest in the winters. In Los Angeles, as in the Bay Area, the trends in κ and m match the composition variations. κ and m are largest in the summers when the particles are the most hygroscopic and smallest in the winters when the particles are the least hygroscopic. The κ sine fitting has a sizable phase shift from the fits of the particle composition data, though this might be attributable to the low quality of the sine fitting for the LA data (Table S4). Additionally, there is poorer agreement between this empirical κ and the composition-derived κ (Fig. S7). This could indicate that in Los Angeles, factors unrelated to hygroscopicity are being captured in the empirical calculation of κ. These factors could include sub-seasonal changes in refractive index or particle size distribution, though further study is needed to provide evidence for these. Despite this, the seasonal RH dependence calibration outperforms the national EPA calibration and the uncalibrated data, with a higher coefficient of determination and lower RMSE (Table S5).
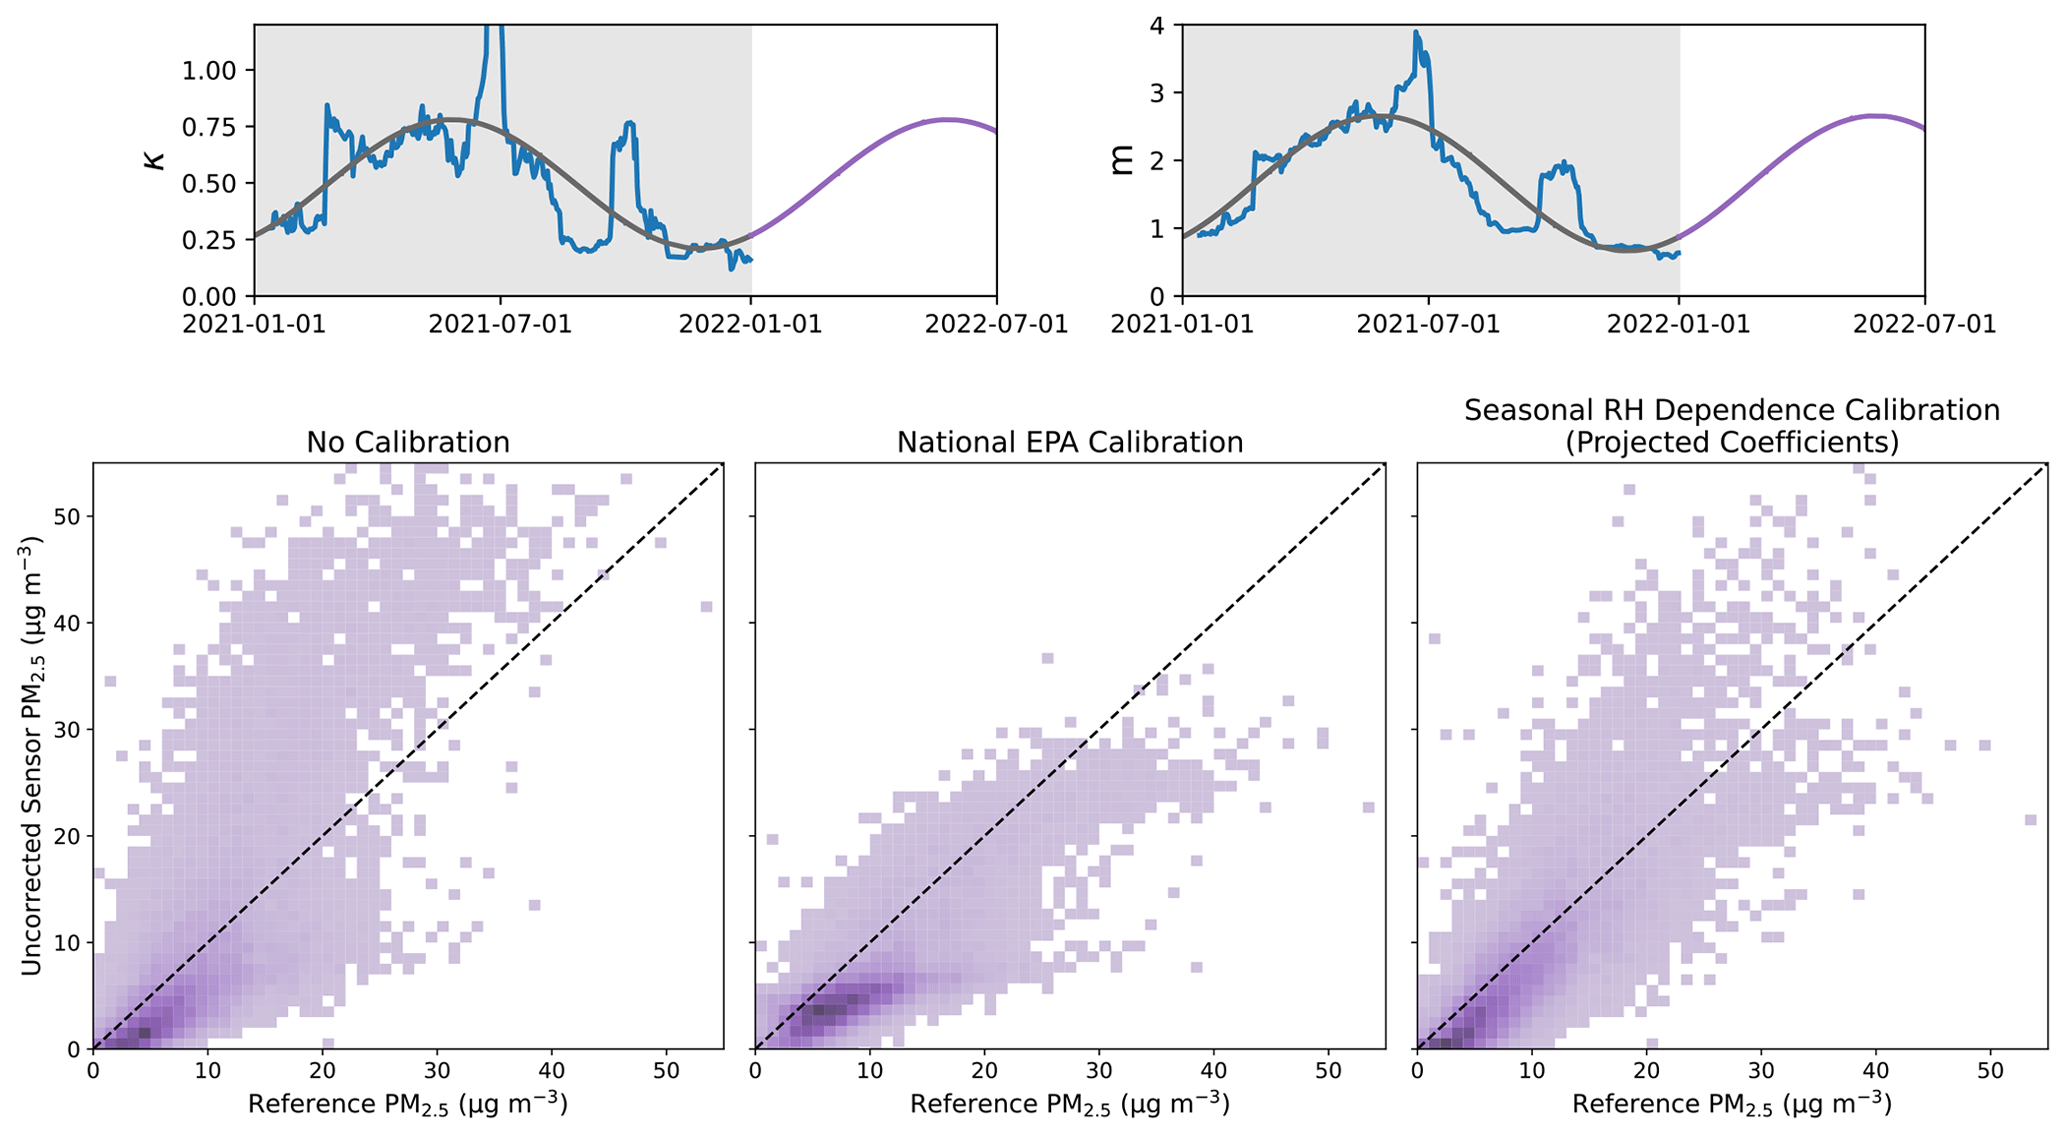
Figure 7κ and m parameters (top) calculated at the Laney co-location site in 2021 with sinusoidal fits projected 6 months into 2022 and sensor-predicted PM2.5 values (bottom) versus co-located EPA reference values for the Laney site for January–June 2022 with different calibration algorithms.
3.4 Real-time application of the calibration
Since the calibration coefficients generated in Figs. 1 and 6 are periodic and aerosol composition and its seasonal variation change slowly from year to year, it is possible to apply the seasonal RH dependence calibration to sensor measurements in real time without the need for EPA reference measurements to be real-time as well. We test the validity of this approach by generating sinusoidal calibration coefficients in 2021 and projecting them forward 6 months into 2022 without using the 2022 reference data, as shown for data at the Laney site in Fig. 7. Like before, both the seasonal RH dependence calibration and the national EPA calibration led to significant reductions in the RMSE (∼40 %), and the national EPA calibration produces a significant negative bias (−2.39 µg m−3 compared to 0.98 µg m−3 in the seasonal RH dependence calibration). Thus, in regions with strong and stable seasonal cycles for PM composition, the sinusoidal parameters can be applied in the months following the period in which they were generated with reasonable accuracy.
3.5 Limitations of the calibration
There are several limitations worth noting in this calibration scheme. First, the calibration focuses on discrepancies arising from hygroscopic growth of particles, and while theoretical calculations show this to be the largest source of error (Hagan and Kroll, 2020), there are several other documented sources of error. Changes in the particle size distribution unrelated to hygroscopic growth, such as from changes in the sources of PM, are partially accounted for by the m parameter, but this is likely incomplete. Changes in particle composition also change the refractive index of the particles, which is ignored by this correction scheme.
Additionally, the method assumes that particle composition is uniform across the domain and changes slowly and smoothly over the course of a year to reflect seasonal changes in particle size and composition. As such, non-seasonal changes in particle size and hygroscopicity are not properly corrected by this method. Isolated extreme events require unique corrections, as is the case when measuring wildfire smoke or dust events (Kaur and Kelly, 2023; Holder et al., 2020). Sensors that are close to unique point sources might be consistently subject to particulate matter of a different composition and size distribution than other sensors in the network and may subsequently experience systematic biases.
There are also potential errors associated with slow drift that can occur over multiple years. Due to changes in PM sources and relative source loadings, PM composition is not expected to be the same year over year, so periodic recalculation of the coefficients is likely necessary. If one sensor in a network is permanently co-located with a regulatory instrument, it can be used to update the coefficients year to year for all sensors within its region. Though sensors can drift and degrade over time, current literature finds that these sensors tend to be stable for at least 3 years (deSouza et al., 2023).
The Plantower seasonal RH dependence calibration is aimed at addressing biases in sensor measurement caused by changes in the size distribution of PM, largely from fluctuations in relative humidity leading to hygroscopic growth and seasonal changes in particle composition that affect hygroscopicity. We provide a physically meaningful calibration scheme that is simple to define and implement for multiple regions in the United States. The seasonal RH dependence calibration utilizes only RH as an additional parameter and has calibration coefficients that reflect seasonal changes in PM speciation. This method provides a time-variant calibration scheme that can be implemented in real time due to the periodic nature of the calibration coefficients. Speciation data provide insight and validation to the calibration parameters but are not needed in creating the calibration. Additionally, analysis of multiple co-location pairs in the Bay Area shows that the calibration parameters are generally uniform within a given region, and as such this calibration can be generated for many sites using limited co-location pairs if there is reasonable confidence that aerosol speciation is uniform across the application area. Future work will be done to explore the stability of this calibration over long periods of time and work towards simple methods for correcting the errors that are unaccounted for, as mentioned in the “Limitations of the calibration” section.
The seasonal RH dependence calibration is being actively applied to the PM2.5 measurements in the BEACO2N network, which are publicly available and can be found on their website (beacon.berkeley.edu).
Data and code used in this paper are available at the following GitHub repository: https://github.berkeley.edu/milan-patel/Plantower-Calibration-Paper. Data from the BEACO2N network (http://beacon.berkeley.edu, last access: 1 October 2023) and the EPA AQS network (https://www.epa.gpv/aqs, last access: 1 October 2023, US EPA, 2023) are also publicly available online.
The supplement related to this article is available online at: https://doi.org/10.5194/amt-17-1051-2024-supplement.
MYP, PFV, and RCC conceptualized the work. MYP completed the formal data analysis and coding. MYP wrote the original draft, and PFV, RCC, JK, and WMB reviewed and edited the draft. RCC provided supervision for the project.
At least one of the (co-)authors is a member of the editorial board of Atmospheric Measurement Techniques. The peer-review process was guided by an independent editor, and the authors also have no other competing interests to declare.
Publisher's note: Copernicus Publications remains neutral with regard to jurisdictional claims made in the text, published maps, institutional affiliations, or any other geographical representation in this paper. While Copernicus Publications makes every effort to include appropriate place names, the final responsibility lies with the authors.
We would like to thank all current and former members of the BEACO2N project for their work establishing and maintaining the networks in the Bay Area and Los Angeles, CA: Alexis A. Shusterman, Virginia Teige, Kaitlyn Lieschke, Catherine Newman, Paul J. Wooldridge, Helen L. Fitzmaurice, Kevin Worthington, Naomi G. Asimow, Yishu Zhu, and Anna R. Winter. We acknowledge the use of data from the Environmental Protection Agency's Air Quality System.
This paper was edited by Albert Presto and reviewed by two anonymous referees.
Adafruit Industries: Adafruit BME280 Humidity + Barometric Pressure + Temperature Sensor Breakout, 1–34, 2023.
Ambient Monitoring Technology Information Center: List of Designated Reference and Equivalent Methods, U. S. Environmental Protection Agency, https://www.epa.gov/amtic/air-monitoring-methods-criteria-pollutants (last access: 20 July 2023), 2022.
Di Antonio, A., Popoola, O. A. M., Ouyang, B., Saffell, J., and Jones, R. L.: Developing a relative humidity correction for low-cost sensors measuring ambient particulate matter, Sensors, 18, 2790, https://doi.org/10.3390/s18092790, 2018.
Barkjohn, K. K., Gantt, B., and Clements, A. L.: Development and application of a United States-wide correction for PM2.5 data collected with the PurpleAir sensor, Atmos. Meas. Tech., 14, 4617–4637, https://doi.org/10.5194/amt-14-4617-2021, 2021.
Cerully, K. M., Bougiatioti, A., Hite Jr., J. R., Guo, H., Xu, L., Ng, N. L., Weber, R., and Nenes, A.: On the link between hygroscopicity, volatility, and oxidation state of ambient and water-soluble aerosols in the southeastern United States, Atmos. Chem. Phys., 15, 8679–8694, https://doi.org/10.5194/acp-15-8679-2015, 2015.
Chen, Y., Wang, Y., Nenes, A., Wild, O., Song, S., Hu, D., Liu, D., He, J., Hildebrandt Ruiz, L., Apte, J. S., Gunthe, S. S., and Liu, P.: Ammonium Chloride Associated Aerosol Liquid Water Enhances Haze in Delhi, India, Environ. Sci. Technol., 56, 7163–7173, https://doi.org/10.1021/acs.est.2c00650, 2022.
Cohen, A. J., Brauer, M., Burnett, R., Anderson, H. R., Frostad, J., Estep, K., Balakrishnan, K., Brunekreef, B., Dandona, L., Dandona, R., Feigin, V., Freedman, G., Hubbell, B., Jobling, A., Kan, H., Knibbs, L., Liu, Y., Martin, R., Morawska, L., Pope, C. A., Shin, H., Straif, K., Shaddick, G., Thomas, M., van Dingenen, R., van Donkelaar, A., Vos, T., Murray, C. J. L., and Forouzanfar, M. H.: Estimates and 25-year trends of the global burden of disease attributable to ambient air pollution: an analysis of data from the Global Burden of Diseases Study 2015, Lancet, 389, 1907–1918, https://doi.org/10.1016/S0140-6736(17)30505-6, 2017.
Cohen Research: Berkeley Environmental Air-quality & CO2 Network (BEACO2N), University of California Berkeley, [data set], available at: http://beacon.berkeley.edu (last access: 1 October 2023), 2023.
Crilley, L. R., Shaw, M., Pound, R., Kramer, L. J., Price, R., Young, S., Lewis, A. C., and Pope, F. D.: Evaluation of a low-cost optical particle counter (Alphasense OPC-N2) for ambient air monitoring, Atmos. Meas. Tech., 11, 709–720, https://doi.org/10.5194/amt-11-709-2018, 2018.
deSouza, P., Barkjohn, K., Clements, A., Lee, J., Kahn, R., Crawford, B., and Kinney, P.: An analysis of degradation in low-cost particulate matter sensors, Environ. Sci. Atmos., 3, 521–536, https://doi.org/10.1039/d2ea00142j, 2023.
Fitzmaurice, H. L. and Cohen, R. C.: A method for using stationary networks to observe long-term trends of on-road emission factors of primary aerosol from heavy-duty vehicles, Atmos. Chem. Phys., 22, 15403–15411, https://doi.org/10.5194/acp-22-15403-2022, 2022.
Giordano, M. R., Malings, C., Pandis, S. N., Presto, A. A., McNeill, V. F., Westervelt, D. M., Beekmann, M., and Subramanian, R.: From low-cost sensors to high-quality data: A summary of challenges and best practices for effectively calibrating low-cost particulate matter mass sensors, J. Aerosol Sci., 158, 105833, https://doi.org/10.1016/j.jaerosci.2021.105833, 2021.
Hagan, D. H. and Kroll, J. H.: Assessing the accuracy of low-cost optical particle sensors using a physics-based approach, Atmos. Meas. Tech., 13, 6343–6355, https://doi.org/10.5194/amt-13-6343-2020, 2020.
Han, J., Liu, X., Chen, D., and Jiang, M.: Influence of relative humidity on real-time measurements of particulate matter concentration via light scattering, J. Aerosol Sci., 139, 105462, https://doi.org/10.1016/j.jaerosci.2019.105462, 2020.
Hänel, G.: The real part of the mean complex refractive index and the mean density of samples of atmospheric aerosol particles, Tellus A, 20, 371–379, https://doi.org/10.3402/tellusa.v20i3.10016, 1968.
Holder, A. L., Mebust, A. K., Maghran, L. A., McGown, M. R., Stewart, K. E., Vallano, D. M., Elleman, R. A., and Baker, K. R.: Field evaluation of low-cost particulate matter sensors for measuring wildfire smoke, Sensors, 20, 4796, https://doi.org/10.3390/s20174796, 2020.
Kaur, K. and Kelly, K. E.: Performance evaluation of the Alphasense OPC-N3 and Plantower PMS5003 sensor in measuring dust events in the Salt Lake Valley, Utah, Atmos. Meas. Tech., 16, 2455–2470, https://doi.org/10.5194/amt-16-2455-2023, 2023.
Kim, K. H., Kabir, E., and Kabir, S.: A review on the human health impact of airborne particulate matter, Environ. Int., 74, 136–143, https://doi.org/10.1016/j.envint.2014.10.005, 2015.
Kumar, V. and Sahu, M.: Evaluation of nine machine learning regression algorithms for calibration of low-cost PM2.5 sensor, J. Aerosol Sci., 157, 105809, https://doi.org/10.1016/j.jaerosci.2021.105809, 2021.
Kuula, J., Mäkelä, T., Aurela, M., Teinilä, K., Varjonen, S., González, Ó., and Timonen, H.: Laboratory evaluation of particle-size selectivity of optical low-cost particulate matter sensors, Atmos. Meas. Tech., 13, 2413–2423, https://doi.org/10.5194/amt-13-2413-2020, 2020.
Mackey, K. R. M., Stragier, S., Robledo, L., Cat, L. A., Xu, X., Capps, S., Treseder, K. K., Czimczik, C. I., and Faiola, C.: Seasonal variation of aerosol composition in Orange County, Southern California, Atmos. Environ., 244, 117795, https://doi.org/10.1016/j.atmosenv.2020.117795, 2021.
Malings, C., Tanzer, R., Hauryliuk, A., Saha, P. K., Robinson, A. L., Presto, A. A., and Subramanian, R.: Fine particle mass monitoring with low-cost sensors: Corrections and long-term performance evaluation, Aerosol Sci. Technol., 54, 160–174, https://doi.org/10.1080/02786826.2019.1623863, 2020.
Molina Rueda, E., Carter, E., L'Orange, C., Quinn, C., and Volckens, J.: Size-Resolved Field Performance of Low-Cost Sensors for Particulate Matter Air Pollution, Environ. Sci. Tech. Lett., 10, 247–253, https://doi.org/10.1021/acs.estlett.3c00030, 2023.
Nilson, B., Jackson, P. L., Schiller, C. L., and Parsons, M. T.: Development and evaluation of correction models for a low-cost fine particulate matter monitor, Atmos. Meas. Tech., 15, 3315–3328, https://doi.org/10.5194/amt-15-3315-2022, 2022.
Ouimette, J. R., Malm, W. C., Schichtel, B. A., Sheridan, P. J., Andrews, E., Ogren, J. A., and Arnott, W. P.: Evaluating the PurpleAir monitor as an aerosol light scattering instrument, Atmos. Meas. Tech., 15, 655–676, https://doi.org/10.5194/amt-15-655-2022, 2022.
Petters, M. D. and Kreidenweis, S. M.: A single parameter representation of hygroscopic growth and cloud condensation nucleus activity – Part 3: Including surfactant partitioning, Atmos. Chem. Phys., 13, 1081–1091, https://doi.org/10.5194/acp-13-1081-2013, 2013.
Sayahi, T., Butterfield, A., and Kelly, K. E.: Long-term field evaluation of the Plantower PMS low-cost particulate matter sensors, Environ. Pollut., 245, 932–940, https://doi.org/10.1016/j.envpol.2018.11.065, 2019.
Shusterman, A. A., Teige, V. E., Turner, A. J., Newman, C., Kim, J., and Cohen, R. C.: The BErkeley Atmospheric CO2 Observation Network: initial evaluation, Atmos. Chem. Phys., 16, 13449–13463, https://doi.org/10.5194/acp-16-13449-2016, 2016.
Stavroulas, I., Grivas, G., Michalopoulos, P., Liakakou, E., Bougiatioti, A., Kalkavouras, P., Fameli, K. M., Hatzianastassiou, N., Mihalopoulos, N., and Gerasopoulos, E.: Field evaluation of low-cost PM sensors (Purple Air PA-II) Under variable urban air quality conditions, in Greece, Atmosphere, 11, 926, https://doi.org/10.3390/atmos11090926, 2020.
US EPA: Air Quality System, [data set], available at: https://www.epa.gpv/aqs (last access: 1 October 2023), 2023.
Virtanen, P., Gommers, R., Oliphant, T. E., Haberland, M., Reddy, T., Cournapeau, D., Burovski, E., Peterson, P., Weckesser, W., Bright, J., van der Walt, S. J., Brett, M., Wilson, J., Millman, K. J., Mayorov, N., Nelson, A. R. J., Jones, E., Kern, R., Larson, E., Carey, C. J., Polat, İ., Feng, Y., Moore, E. W., VanderPlas, J., Laxalde, D., Perktold, J., Cimrman, R., Henriksen, I., Quintero, E. A., Harris, C. R., Archibald, A. M., Ribeiro, A. H., Pedregosa, F., van Mulbregt, P., Vijaykumar, A., Bardelli, A. Pietro, Rothberg, A., Hilboll, A., Kloeckner, A., Scopatz, A., Lee, A., Rokem, A., Woods, C. N., Fulton, C., Masson, C., Häggström, C., Fitzgerald, C., Nicholson, D. A., Hagen, D. R., Pasechnik, D. V., Olivetti, E., Martin, E., Wieser, E., Silva, F., Lenders, F., Wilhelm, F., Young, G., Price, G. A., Ingold, G. L., Allen, G. E., Lee, G. R., Audren, H., Probst, I., Dietrich, J. P., Silterra, J., Webber, J. T., Slavič, J., Nothman, J., Buchner, J., Kulick, J., Schönberger, J. L., de Miranda Cardoso, J. V., Reimer, J., Harrington, J., Rodríguez, J. L. C., Nunez-Iglesias, J., Kuczynski, J., Tritz, K., Thoma, M., Newville, M., Kümmerer, M., Bolingbroke, M., Tartre, M., Pak, M., Smith, N. J., Nowaczyk, N., Shebanov, N., Pavlyk, O., Brodtkorb, P. A., Lee, P., McGibbon, R. T., Feldbauer, R., Lewis, S., Tygier, S., Sievert, S., Vigna, S., Peterson, S., More, S., Pudlik, T., et al.: SciPy 1.0: fundamental algorithms for scientific computing in Python, Nat. Methods, 17, 261–272, https://doi.org/10.1038/s41592-019-0686-2, 2020.
Wu, Z. J., Zheng, J., Shang, D. J., Du, Z. F., Wu, Y. S., Zeng, L. M., Wiedensohler, A., and Hu, M.: Particle hygroscopicity and its link to chemical composition in the urban atmosphere of Beijing, China, during summertime, Atmos. Chem. Phys., 16, 1123–1138, https://doi.org/10.5194/acp-16-1123-2016, 2016.
Yong, Z. and Haoxin, Z.: Plantower: Plantower PMS5003 Data Manual, https://www.aqmd.gov/docs/default-source/aq-spec/resourcespage/plantower-pms5003-manual_v2-3.pdf/ (last access: 20 July 2023), 2016.