the Creative Commons Attribution 4.0 License.
the Creative Commons Attribution 4.0 License.
 | 16 Feb 2024
Impacts of anemometer changes, site relocations and processing methods on wind speed trends in China
Yi Liu
Lihong Zhou
Yingzuo Qin
Cesar Azorin-Molina
Cheng Shen
Zhenzhong Zeng
In situ surface wind observation is a critical meteorological data source for various research fields. However, data quality is affected by factors such as surface friction changes, station relocations and anemometer updates. Previous methods to address discontinuities have been insufficient, and processing methods have not always adhered to World Meteorological Organization (WMO) World Climate Programme guidelines. We analyzed data discontinuity caused by anemometer changes and station relocations in China's daily in situ near-surface (∼ 10 m) wind speed observations and the impact of the processing methods on wind speed trends. By comparing the wind speed discontinuities with the recorded location changes, we identified 90 stations that showed abnormally increasing wind speeds due to relocation. After removing those stations, we followed a standard quality control method recommended by the World Meteorological Organization to improve the data reliability and applied Thiessen polygons to calculate the area-weighted average wind speed. The result shows that China's recent reversal of wind speed was reduced by 41 % after removing the problematic stations, with an increasing trend of 0.017 m s−1 yr−1 (R2 = 0.64, P < 0.05), emphasizing the importance of robust quality control and homogenization protocols in wind trend assessments.
- Article
(6528 KB) - Full-text XML
-
Supplement
(822 KB) - BibTeX
- EndNote


In situ surface wind observation is a key meteorological datum that has been used in various avenues of research, e.g., wind power evaluation (Tian et al., 2019; Zeng et al., 2019; Liu et al., 2022a), extreme wind hazard monitoring and prevention (Liu et al., 2022b) and evapotranspiration analysis (Rayner, 2007; McVicar et al., 2012), to name but a few. The application of robust quality control and homogenization protocols is crucial for generating reliable wind speed time series for further trend and variability analyses (Azorin-Molina et al., 2014, 2019).
Wind data quality is affected by surrounding surface friction change, station location issues and anemometer changes in type and height (Masters et al., 2010; Wan et al., 2010; Cao and Yan, 2012; Hong et al., 2014; He et al., 2014; Azorin-Molina et al., 2018; Camuffo et al., 2020). Surrounding surface friction changes are mainly associated with urbanization (Zhang et al., 2022) and vegetation growth (Vautard et al., 2010), which modify wind speed fields around the stations. Because of these issues, stations are relocated to satisfy observing criteria (Trewin, 2010). Station relocation is quite common in rapidly developing countries. For instance, about 60 % of stations in China have experienced relocation (Sohu, 2004). Some relocation-caused breakpoints have been corrected by parallel observations (i.e., operating observations for an overlapping period at both old and new observing stations; CMA, 2011, 2012; WMO, 2020), but not all (Feng et al., 2004; Fu et al., 2011; Tian et al., 2019; Yang et al., 2021). In addition to relocation caused by rapid urbanization (or vegetation growth), updates to automatic anemographs at the beginning of the 21st century in China also caused discontinuities in wind series (Fu et al., 2011).
Scientists have tried different methods to handle discontinuities. Tian et al. (2019) and Yang et al. (2021) deleted stations with recorded changes in latitudes, longitudes or altitudes, but they omitted to check whether those recorded relocations caused an abrupt discontinuity in the time series or whether parallel observations had corrected them. This results in some stations being mistakenly deleted and significantly reduced the number of available stations. Other research used statistical methods to detect or correct the time series' abnormal breakpoint (Feng et al., 2004; Wang, 2008). However, without examining the causes behind the discontinuity, this may also mistakenly delete stations with natural abrupt climatic changes (Bathiany et al., 2018). Combining those two methods by matching discontinuity with recorded station relocation is needed. Li et al. (2018) manually checked the station histories for nine stations in northwestern China, but an algorithm is required to apply this approach to large datasets.
In addition to data discontinuities, the processing method also affects the wind series. There are two critical steps in the processing: (1) selecting qualified stations and (2) calculating the average value. As for the first step, the World Meteorological Organization (WMO) World Climate Programme suggests deleting stations with either too many missing data or continuous missing data (WMO, 2017). Previous studies only constrained the number of missing values monthly (Zeng et al., 2019), yearly (Tian et al., 2019) or even in the whole period (Yang et al., 2021) but did not check whether the missing values were continuous. As for the second step, most studies used the station average as the mean wind speed (Li et al., 2018; Zeng et al., 2019; Tian et al., 2019; Yang et al., 2021; Shen et al., 2021; Zha et al., 2021). However, given that station distribution and wind speed spatial variation are often inhomogeneous with more wind but fewer stations in the northwest and less wind but more stations in the southeast (Feng et al., 2004; Fu et al., 2011; Liu et al., 2019), the wind variation in the northwest is underrepresented because of the few stations. An improved average method (area-weighted average) to rearrange the weight for each station based on the area it represents is needed, and Thiessen polygons (Thiessen, 1911) are widely used in which the area is only determined by the station locations, while other methods like grids are sensitive to the grids chosen.
Herein, taking stations in China as examples, we analyzed the existing data discontinuities and their potential causes. Furthermore, we propose an improved solution by using an algorithm to compare the statistic breakpoint with the recorded relocation to double-check the discontinuity caused by relocation. Then, using the WMO's quality control criteria and Thiessen polygons (Thiessen, 1911), we generated wind speed time series without temporal bias caused by heterogeneous missing values and spatial biases caused by uneven station distribution.
2.1 WMO quality control method
We used the China Surface Climatic Data Daily Data Set (CSD) (Version 3.0) from the China Meteorological Data Service Center (http://101.200.76.197:91/mekb/?r=data/cdcdetail&dataCode=SURF_CLI_CHN_MUL_DAY_V3.0, last access: 13 February 2024; CMDSC, 2012). The quality control method is recommended by the WMO (2017), which required the following criteria before using the daily mean values in a month as monthly mean values: (1) < 11 missing daily values in a month; (2) < 5 consecutive missing daily values in a month; and (3) complete monthly values for every month during the study period. The station excluded by each criterion can be found in Table S1 in the Supplement.
2.2 Station location changes in record
The CSD provides daily wind speed and location information for 840 stations for 1961–2019. However, there are some mistakes in the daily location records. For example, if the station location changed from A to B and back to A within a month, B is potentially a mistaken record. Therefore, we first use the mode (a statistical term meaning the value that appears most often, here referring to the location with the highest frequency in a month) to resample the daily location to the monthly location. Second, considering that the recorded longitude and latitude have the same spatial resolution of minutes, we defined the threshold of location change as the minimum accuracy of the longitude and latitude record, i.e., 1 min or 1.85 km for longitude and 1.85 km × cos φ for latitude, where φ is the latitude. Third, as for altitude, we allow a 20 m measuring error following Tian et al. (2019). A station with more than 20 m change in altitude will be considered for relocation. It is noteworthy that CSD labels uncertain altitude records by adding 10 km to the raw data (CMA, 2017), which are considered “no observations” in our analysis. In this way, we identified 432 stations as relocations from the 601 qualified stations after applying the WMO quality control (details in Table S2).
2.3 Breakpoint detection and comparison with recorded relocations
We used the pruned exact linear time (PELT) method (Killick et al., 2012) to detect the jumps in the mean level in the monthly wind speed time series (Fig. 4a, c). This method is a wrapped function named findchangepts in MATLAB. PELT is essentially a traversing method. For a time series with N values (x1, x2, … xN), the function uses Eqs. (1) and (2) to calculate the total residual errors (J) for each point (k) assumed to be a breakpoint. The point with the most significant change in the mean (lowest J) is reported as the breakpoint. The breakpoints here can be caused by artificial relocations or natural climate changes.
Then we use relocation records to separate changes brought by artificial relocation from changes in natural climate. If the breakpoint and one of the relocation dates (some stations have more than one relocation record) happened in the same 2 months, we will consider that the time series is significantly affected by the relocation, and the station will be deleted. Stations with natural-climate-caused location changes will be reserved.
The change point in the trend of the annual national average wind speed (Figs. 2b, 5b) is detected following the method used by Wang et al. (2011). All the trends reported are based on the least-square fits.
3.1 Data issue due to anemometer changes
We found a clear decline in the frequency of zeros (zero wind speed) in most CSD stations between 2002 and 2007 (Fig. 1a), from 10–14 d yr−1 to less than 2 d yr−1. This clear drop is not a result of wrongly taking zero values as no observations (NaN) as happened in the Integrated Surface Dataset (ISD, Dunn et al., 2022), as no abrupt increase in NaN frequency was observed (Fig. S1 in the Supplement). Instead, the decline is accompanied by a decrease in measure uncertainty: i.e., the measurement intervals became narrow (from 0, 0.3, 0.5, 0.7, 0.8, 1.0 m s−1, etc., to 0, 0.1, 0.2, 0.3 m s−1, etc.; Figs. 1b and S2). Taking Station Naomaohu in Xinjiang (station ID 57432) as an example, from 2002 to 2003, zero values decreased from more than 30 d yr−1 to less than 5 d yr−1 and wind speed records changed from 0, 0.3, 0.7, 1.0 m s−1, etc., to 0, 0.3, 0.5, 0.8, 1.0 m s−1, etc. Since 2004, the measurement has further improved to 0.1, 0.2, 0.3, … m s−1, and zero values have almost disappeared (Fig. 1b).
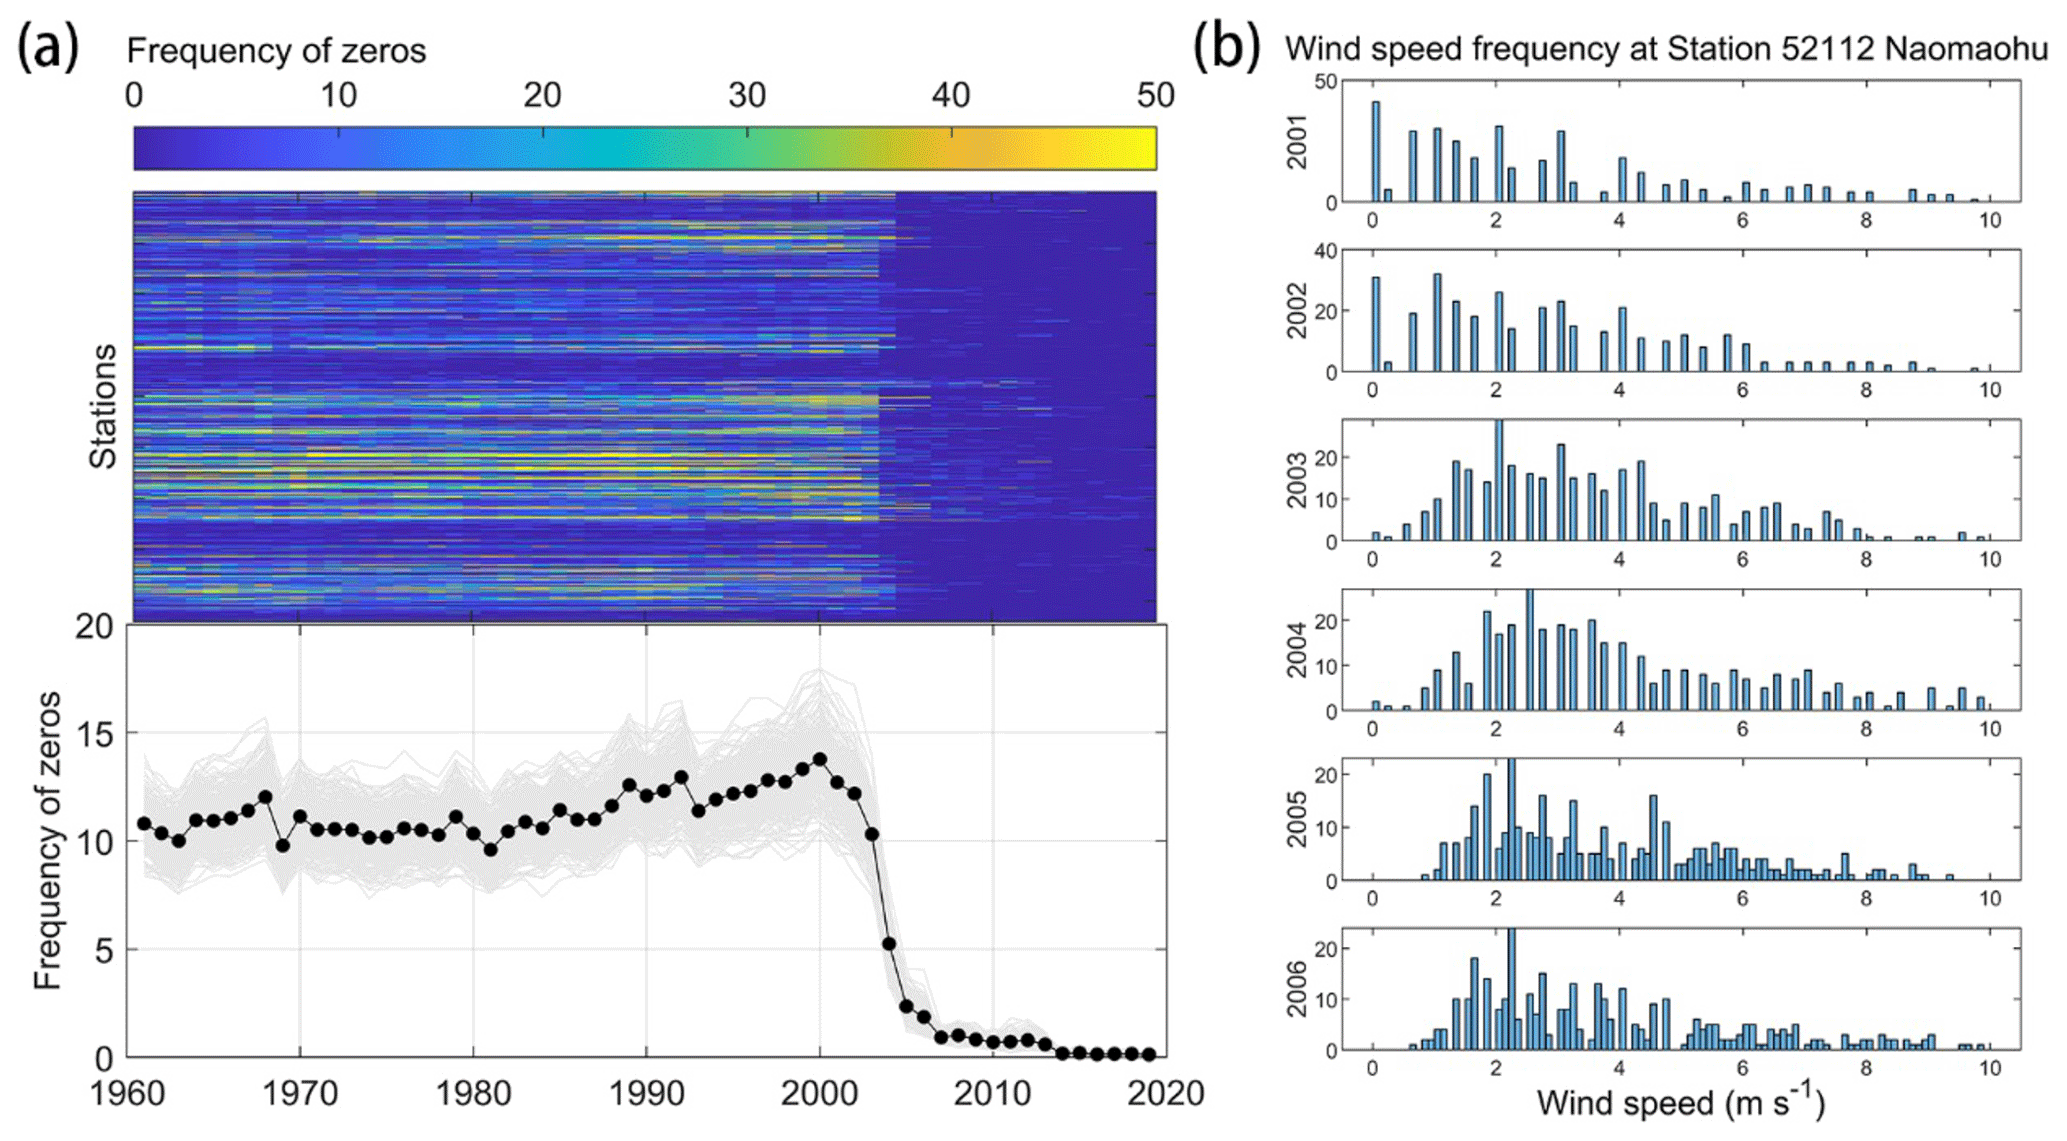
Figure 1Changes in wind speed data caused by anemometer updates. (a) Decrease in the frequency of zeros. Each horizontal bar in the upper figure represents 1 station, and there are 840 stations in total. The color indicates the frequency of zeros (days per year). The black dotted line in the lower figure is the average annual frequency of zeros of all the stations. The 300 grey lines are sample averages, each containing 40 % of the total stations. (b) Frequency (days per year) of daily wind speed measurements between 2001 and 2006 for Station 52112 Naomaohu (43∘45′ N, 94∘59′ E; 479.0 m a.s.l.).
This change is potentially caused by the transformation in measure frequency, anemometer type and data logging, based on the station history recorded by Xin et al. (2012). As for measurement frequency, in 2003, Station Naomaohu changed from three observations per day (i.e., 08:00, 14:00 and 20:00 CST, China Standard Time) to four times per day (02:00, 08:00, 14:00 and 20:00 CST). The increase in the frequency of measurements decreases zeros in daily wind data, as only if all observations report zero wind speeds will the daily data (i.e., the average of all observations in a day; CMA, 2017) be recorded as zero. Then, in 2005, the EL (Electric Logging) contact anemograph (Xin et al., 2012; Zhang et al., 2022), which required manual recording, was replaced by the EC (Electric Coding) photoelectric encoder self-recording type (Xin et al., 2012). Both the EL and EC types of anemographs use cup anemometers to measure wind speed. However, the EL type measures the times of electronic contact (e.g., 200 m rotation distance per contact) in a time period, resulting in discrete records, while the EC type uses the Grey Code encoder rotating with the cup anemometers to obtain a more precise wind speed record. This anemograph change further decreases the likelihood of recording zero daily wind speed because the updated new anemometers are more sensitive, and even very low wind speeds will be measured with a value instead of being recorded as zero (Azorin-Molina et al., 2018). The smooth increasing frequency of zero values from 1960 until 2000 also supports this statement (Fig. 1a): the longer the anemometer is used, the less sensitive it will become, and hence a greater wind speed will be required to record a non-zero value (Azorin-Molina et al., 2018), overall increasing the zero values. As for the change in data accuracy, there are two reasons: (1) an EL-type anemograph only measures the times of electronic contact (200 m rotation distance per contact) in 10 min, and therefore it has discrete records. For example, one contact means 0.3 m s−1 (200 m (600 s)−1) and two contacts mean 0.7 m s−1 (400 m (600 s)−1) (Hu et al., 2009), while the EC type has more accurate records using the Grey Code encoder. (2) The data logging changed from manual reading, calculating and rounding to the instrument automatically calculating and retaining one decimal place. This example shows us the importance of recording siting criteria, required functional specifications of wind sensors and maintenance policy. However, those records are missing for most of the stations, which hindered the quality classification and data processing.
3.2 Quality-controlled series
Following the WMO's criteria, we generated the monthly average wind speed for each station (Fig. 2a). We found that, since January 2016, there have been 126 stations that no longer have records (for the distribution, see Fig. S3). We compared the time series with and without these stations and found that the difference is not significant (t test P < 0.001, Fig. 2b). To obtain a longer time series including recent years' data, we deleted the 126 stations and only used the 601 stations with complete monthly average wind speeds for 1980–2019. The breakpoint was detected in 2011 (P < 0.001) with a decreasing trend of −0.011 m s−1 yr−1 (R2 = 0.84, P < 0.001) before the breakpoint and an increasing trend of +0.022 m s−1 yr−1 (R2 = 0.87, P < 0.001) after.
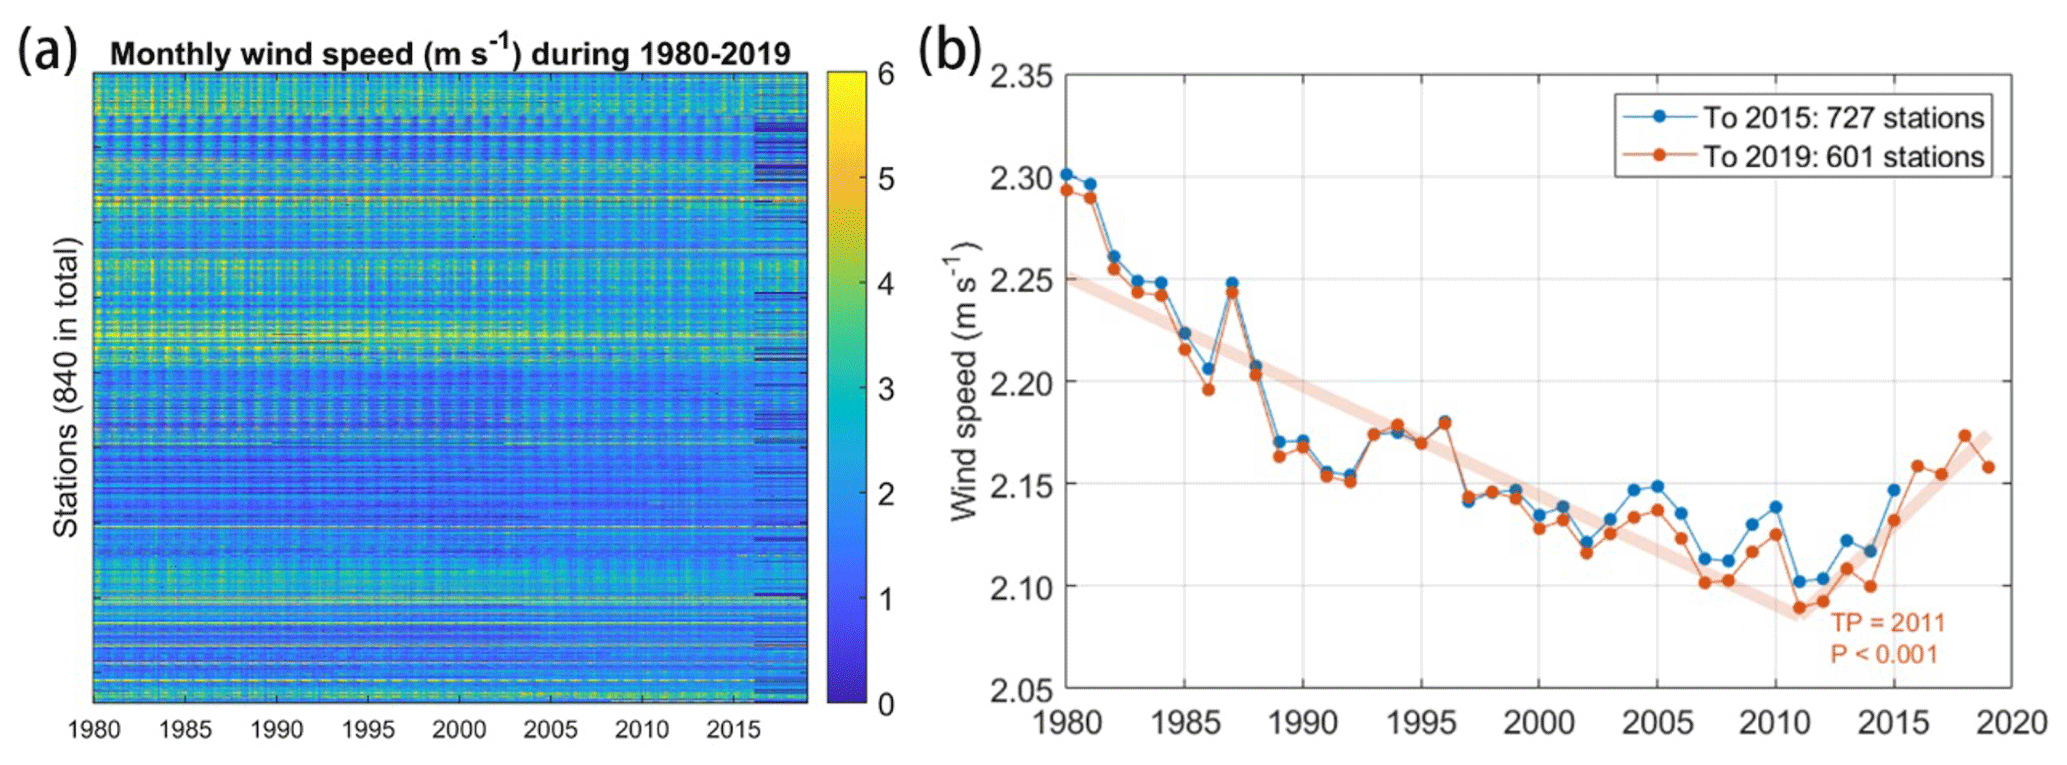
Figure 2Monthly average wind speed after being filtered by the WMO's criteria. (a) Each horizontal bar represents one station. Months with no data (NaNs) are represented by the deepest blue. (b) Comparison of the monthly average wind speed for the short period (1980–2015; 727 stations) and long period (1980–2019; 601 stations).
3.3 Station relocations caused by urbanization
Another key factor influencing wind speed measurements is the relocation of stations. We found that there is a clear data jump caused by relocations in some of the stations. Taking the station located in Qinghai (station ID 52974) as an example, we detected an abrupt jump in wind speed in January 2016. This date coincides with the relocation of the station from 35∘31′ N, 102∘01′ E (ID 52974-1) in December 2015 to 35∘33′ N, 102∘02′ E (ID 52974-2) in January 2016 (Fig. 3c and d). The relocation is potentially attributed to the urban growth around the station. As viewed by satellite images from Google Earth Pro, there is a rapid urban expansion from 2006 (Fig. 3a) to 2012 (Fig. 3b), especially towards the northeast of the station, during which wind speed records also experienced a decrease (Fig. 3c). A similar decrease in both daily mean wind speed and maximum wind speed caused by urbanization was also reported in the Yangtze River region (Zhang et al., 2022). To eliminate the effect of buildings on the wind speed measurements, Station 52974 was moved to 4 km away from its previous location (Fig. 3d) so that wind speed is properly measured without artificial obstacles in the surroundings. However, this estimation of roughness change based on satellite data is rough. A more proper way as required by the World Climate Data and Monitoring Programme is to record the change in the station logbook (WMO, 2018), which will provide more reliable information about the quality of the data. However, most stations do not have such a record. Despite the absence of metadata, we used an established global roughness model through satellite albedo observations to monitor alterations in surface roughness. For the selected station, we employed the roughness estimation technique devised by Chappell and Webb (2016) to analyze changes in roughness across a 5 km × 5 km area encompassing the station's location. Our quantitative examination of roughness alterations aligns with the findings derived from satellite imagery analysis, affirming a pronounced increase in roughness between 2000 and 2010 (Fig. S4). This increase in roughness likely contributed to the observed decline in wind speed and ultimately compelled the relocation of the station.
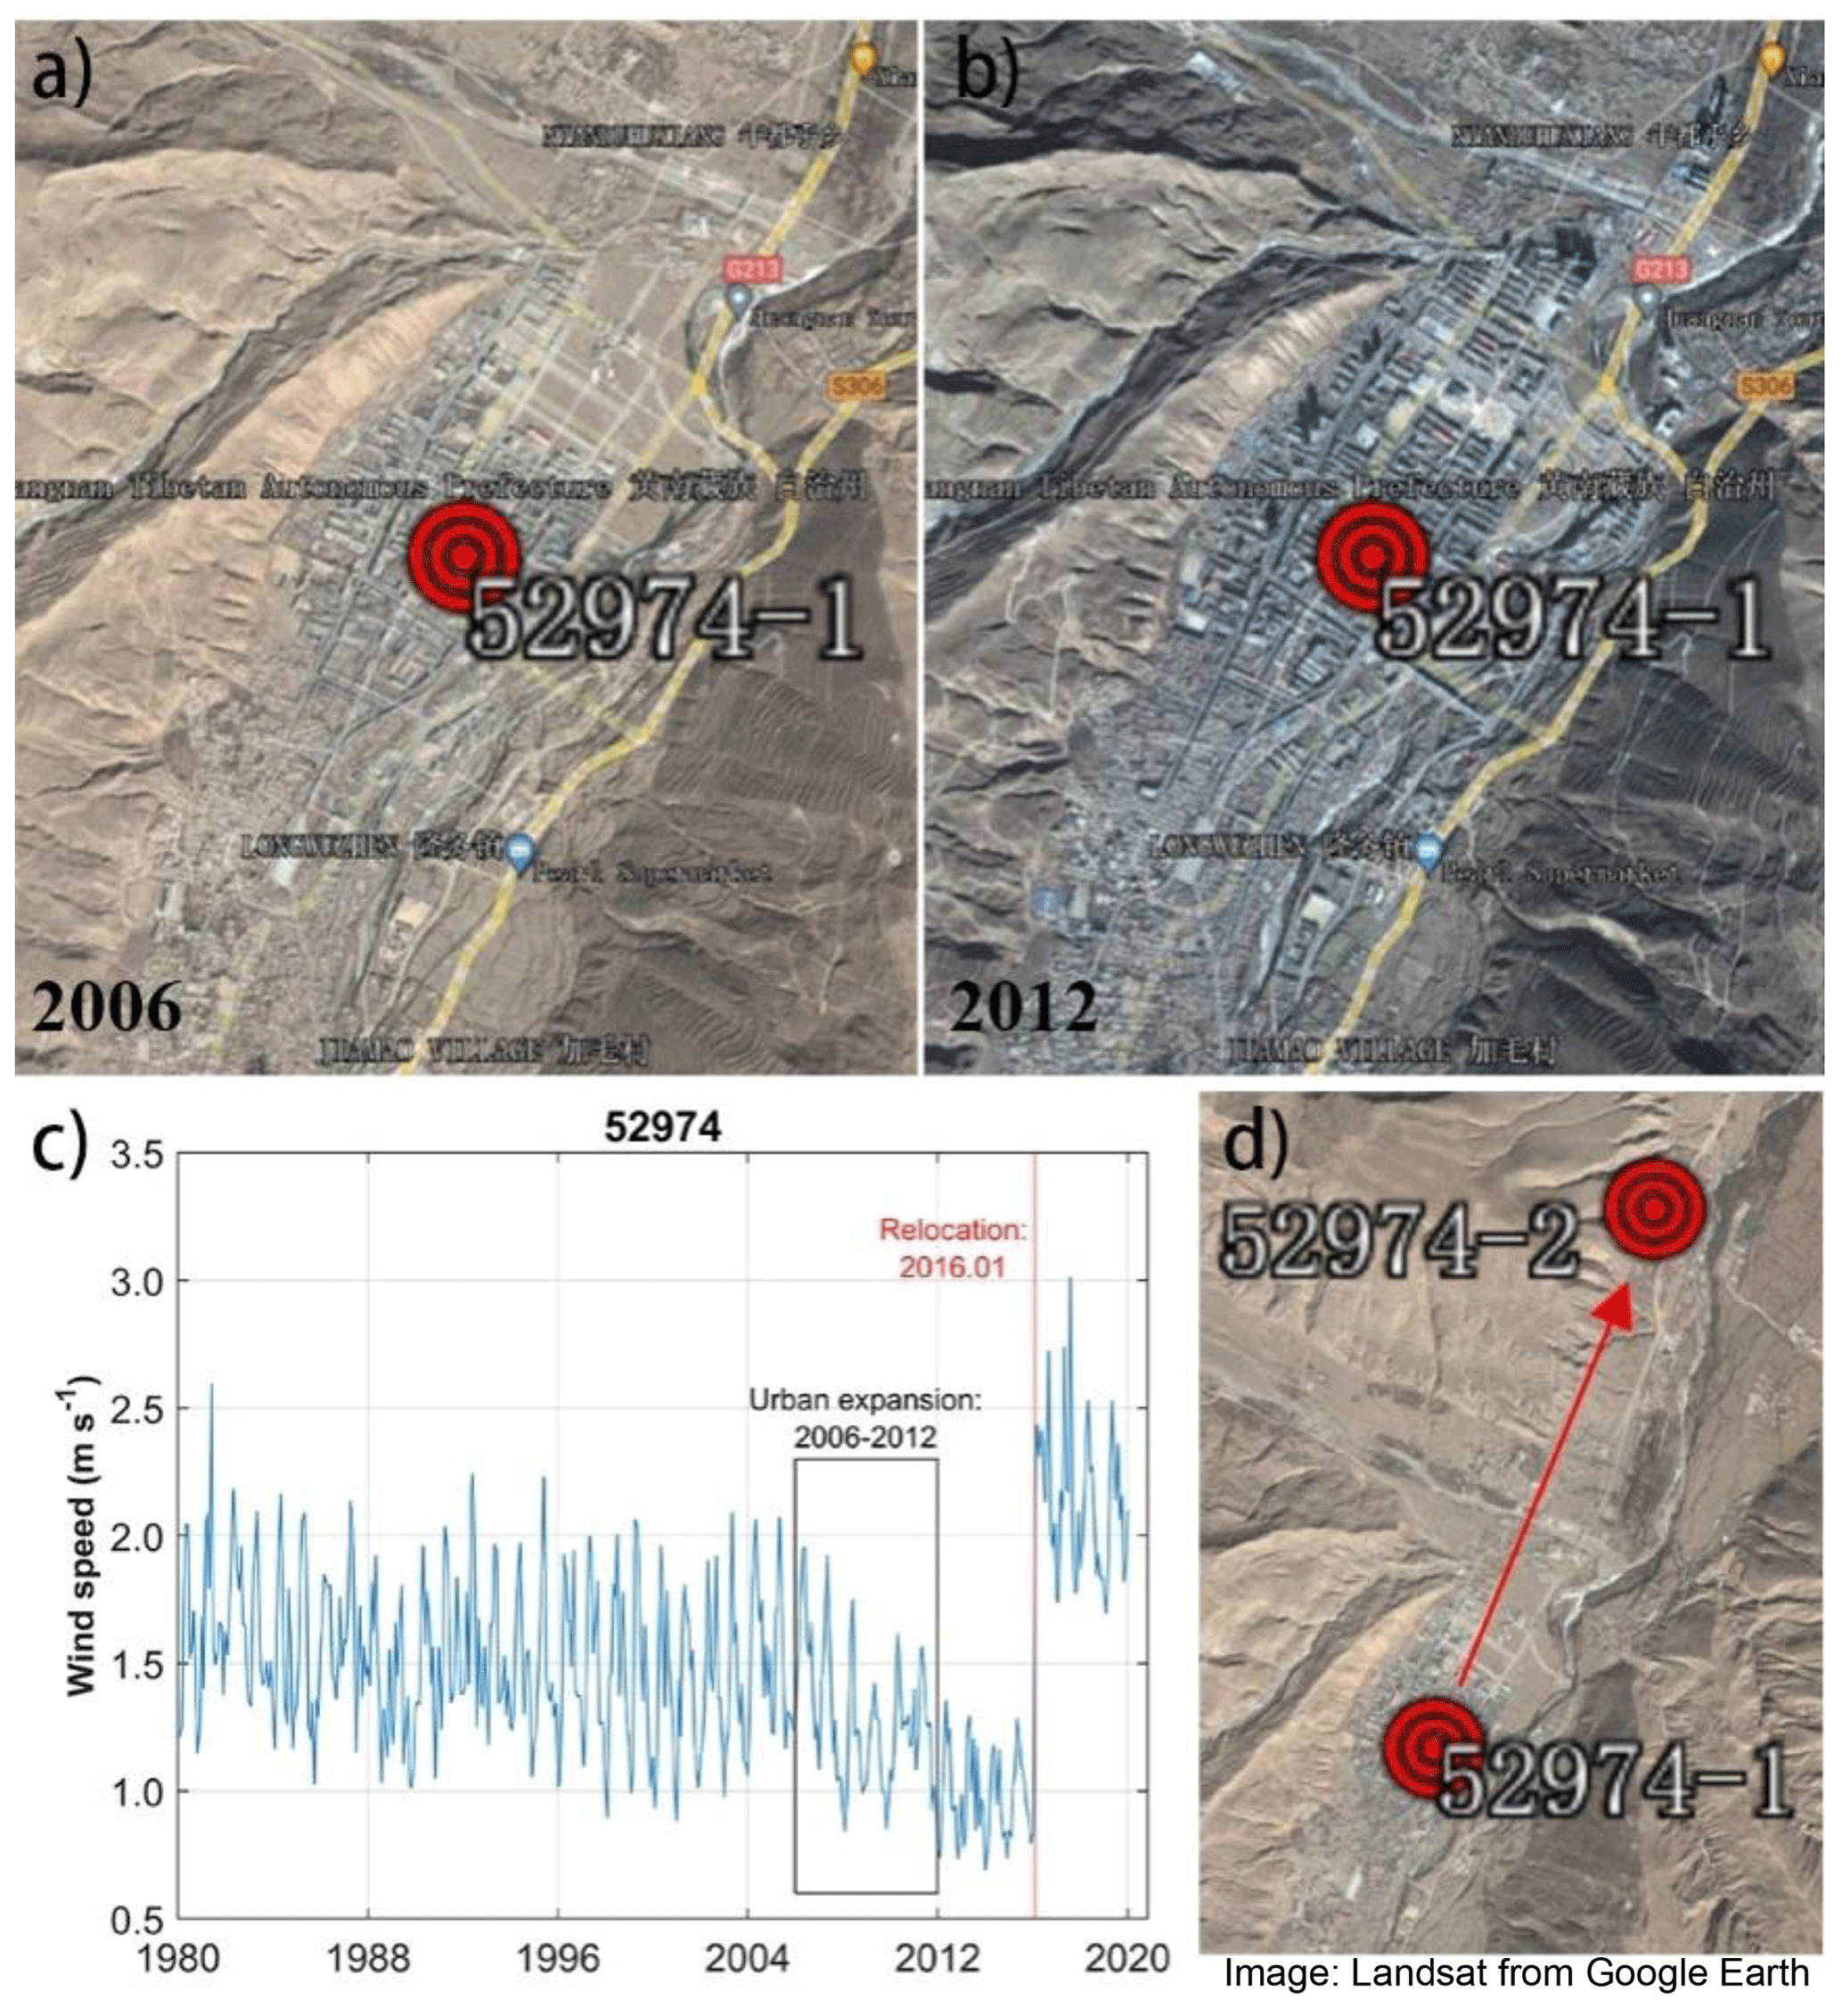
Figure 3Example of station relocation caused by rapid urbanization growth. (a, b) Landsat image crop from © Google Earth near Station 52974 in 2006 and 2012, respectively. (c) The wind speed change with urbanization and relocation. (d) Landsat images of the station relocation crop from © Google Earth.
Though some stations were influenced by station relocation as shown in Fig. 3, a larger fraction (79 %) of stations show no change in wind speed after the relocation. Further checking the raw record of locations for those stations, we find that one reason is that some “relocations” result from wrong location records. For example, Station 52974 is mistakenly detected with three relocations (Fig. 4a). However, only the first relocation is real, and the latter two are results of location-encoding changes from 10202 (interpreted as 102∘02′) to 1022 (interpreted as 10∘22′) and back. Another possible reason is that the relocation did happen but that the data have been corrected. According to the Provisional Regulations on Relocation, Construction and Removal of National Ground Meteorological Observation announced by China's government in 2012, station relocations should have 1–2 years of parallel observations for data correction (CMA, 2012). This process may fix some of those discontinuities, but not all of them (Feng et al., 2004; Fu et al., 2011; Tian et al., 2019; Yang et al., 2021). For example, Station 59287, the only national basic weather station in Guangzhou, experienced two relocations in both 1996 and 2011, which is confirmed by the metadata (CMA, 2011). After correction, the 1996 relocation does not show a sharp breakpoint, but the 2011 one does (Fig. S5).
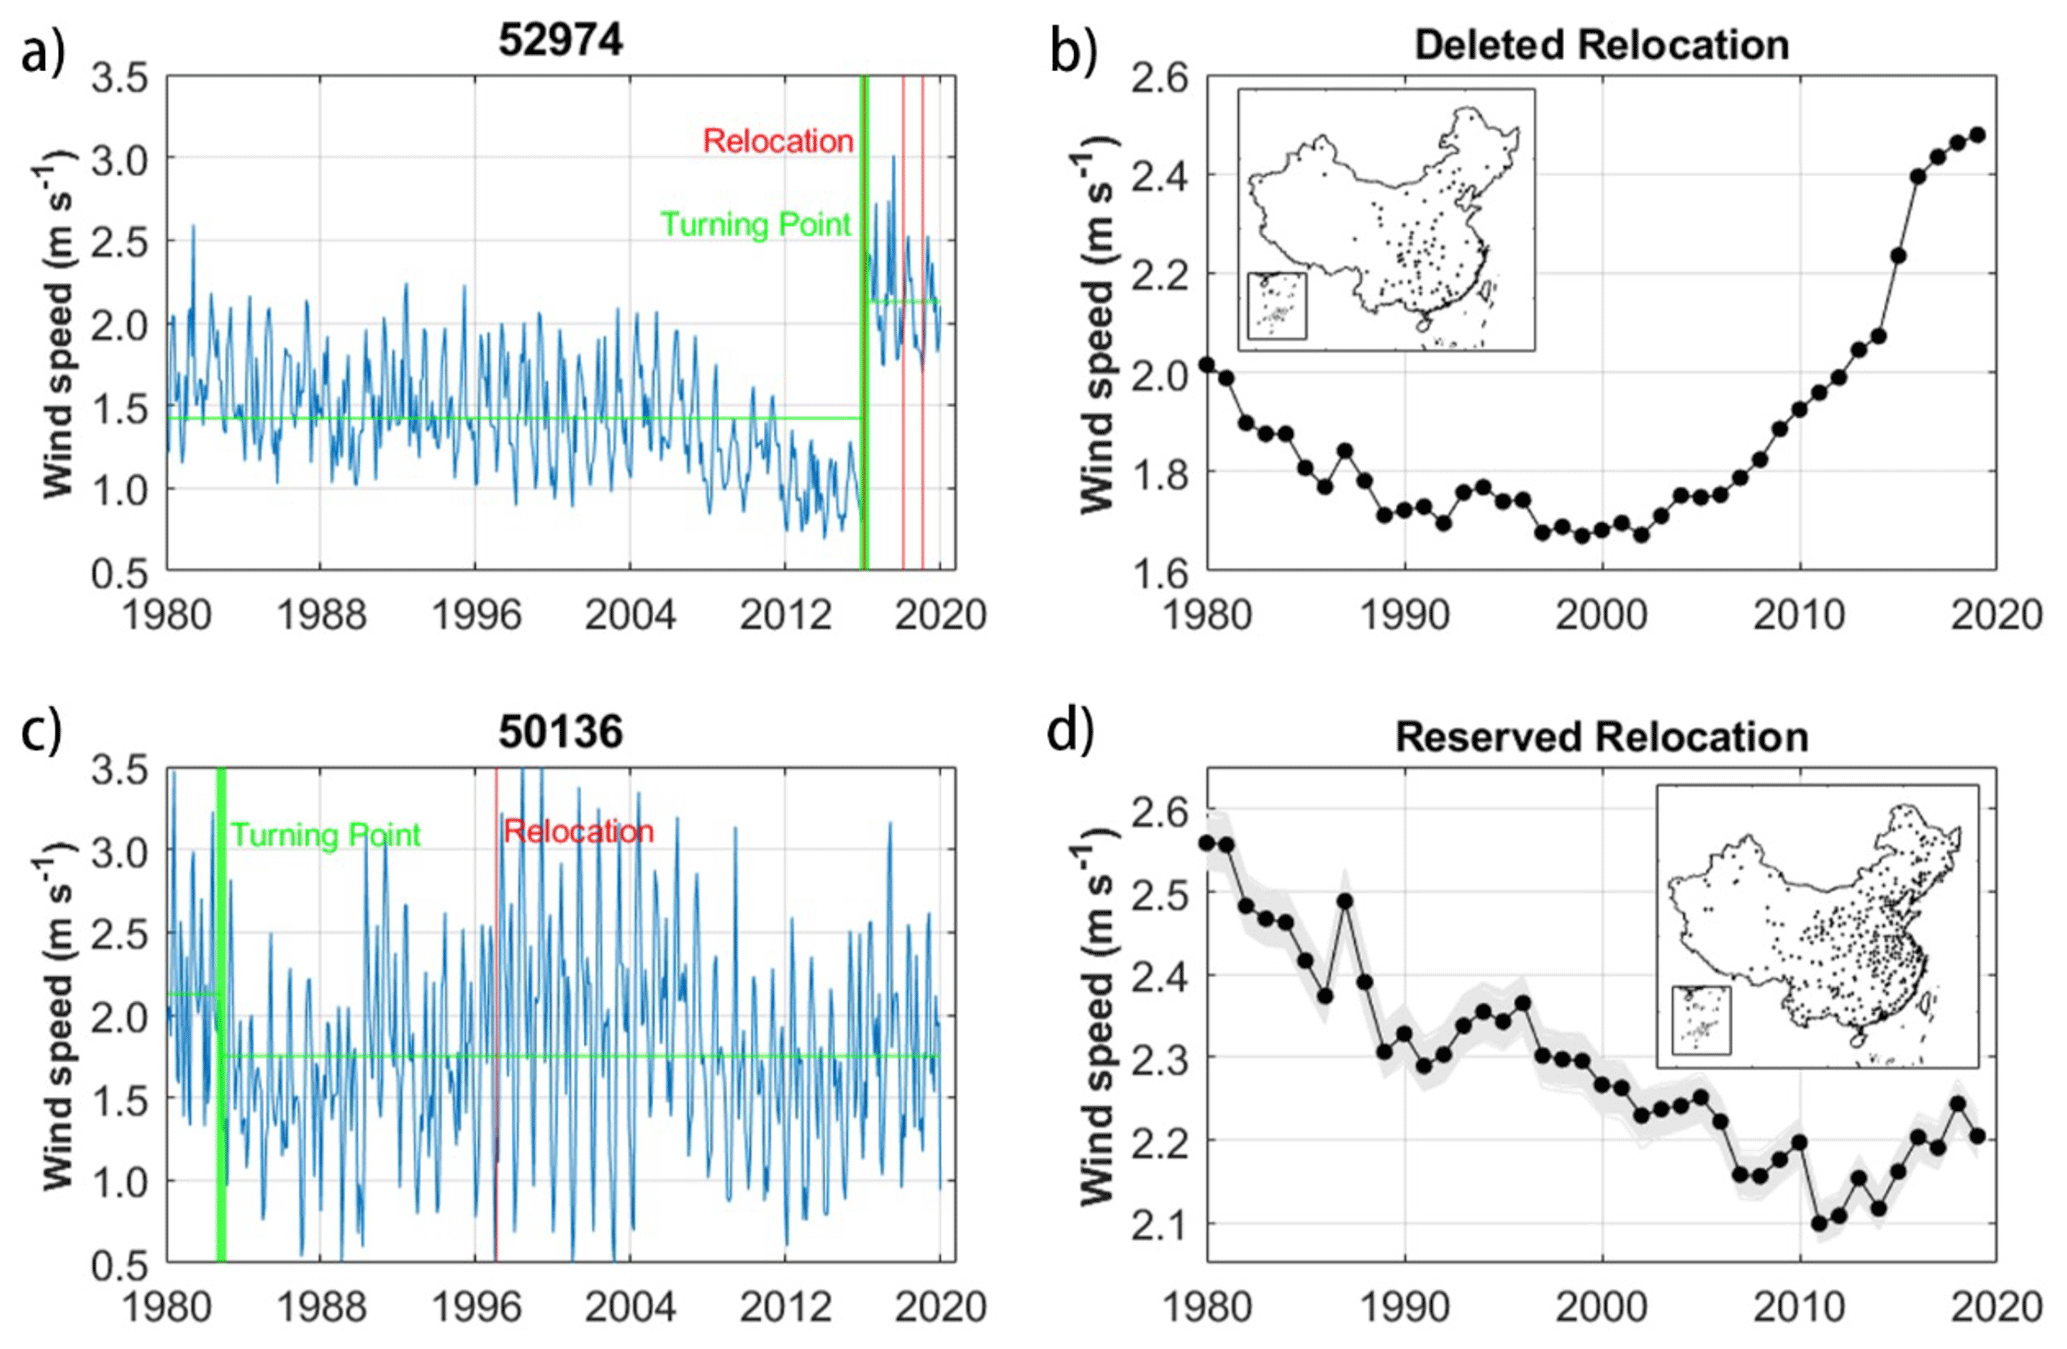
Figure 4Comparison of deleted relocated stations and reserved ones. (a) The wind speed data breakpoint and relocations of one example of deleted relocation, Station 52974. (b) The station average wind speed of 90 deleted relocated stations. The inset shows the station distribution across China. (c) One example of reserved relocation, Station 50136. (d) The station average wind speed of 342 reserved relocated stations. The grey lines are the averages of 300 samples, each with 90 randomly drawn reserved relocated stations. Map information is from the Department of Natural Resources standard map service system of China. Publisher’s remark: please note that the above figure contains disputed territories.
To examine whether the relocation caused a substantial change in the wind speed record, we identified the most abrupt change in the wind speed time series and checked whether a relocation happened near the change point (see the details in Sect. 2.3). Out of the 432 relocated stations, 90 were deleted because the most significant shift in the mean is at the time of the relocation, and hence this is the most likely cause. We then took the average of the “deleted relocation” stations and “reserved relocation” stations separately. The deleted relocation group shows an abnormally rapid increase in the last 2 decades (Fig. 4b), while the reserved relocation group is similar to stations without relocation (Fig. S6). To exclude the impact of different station counts in each category (fewer stations mean higher sensitivity to an individual abnormal station), we took 300 samples using a random draw of 90 stations from the reserved relocation group and showed them in grey lines in Fig. 4d. None of the grey lines shows an abnormal trend as a deleted relocation group. This proves that our method is efficient at identifying problematic stations.
3.4 Average method used to calculate the national average
In the station average time series, the breakpoint was detected in 2012 (P < 0.001) with trends of −0.012 m s−1 yr−1 (R2 = 0.90, P < 0.001) before and +0.013 m s−1 yr−1 (R2 = 0.70, P < 0.01) after (Fig. 5b). The increasing trend decreased by 41 % after deleting those relocation-affected stations compared with the +0.022 m s−1 yr−1 in Fig. 2b (also reported by Liu et al., 2022a). However, the trend is larger than the +0.011 m s−1 yr−1 reported by Yang et al. (2021), with all the recorded location-changed stations deleted without checking whether a station is affected by the relocation.
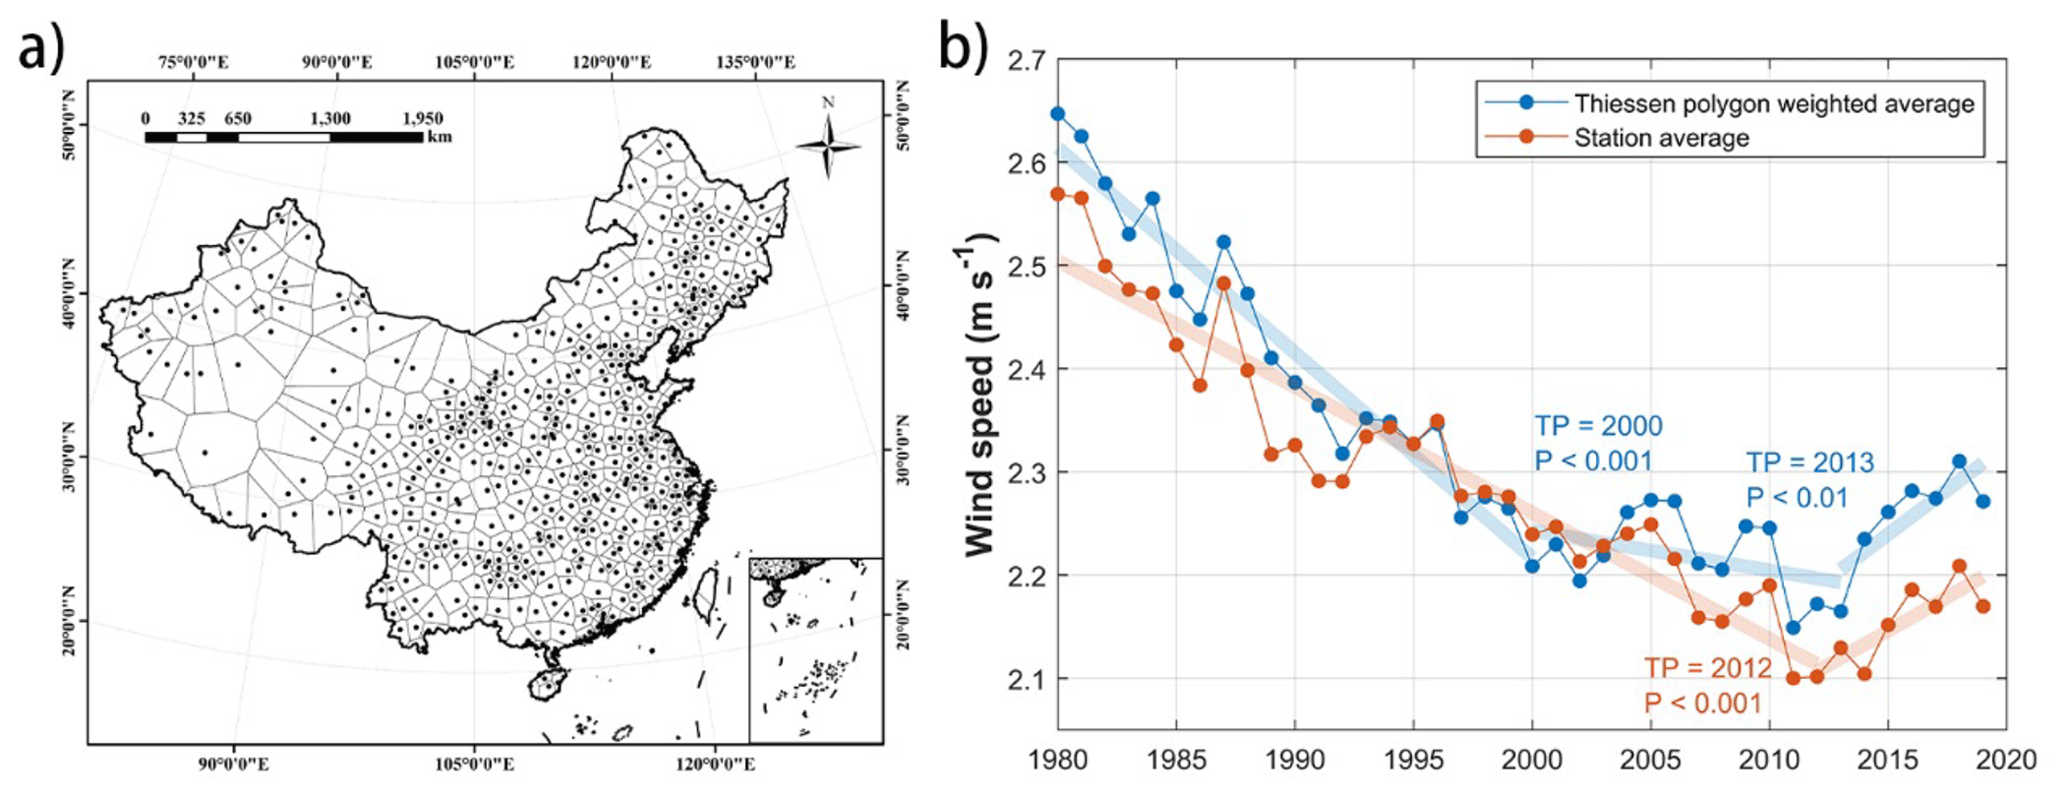
Figure 5Thiessen polygons and the comparison between the Thiessen polygon weighted average and the station average. (a) The Thiessen polygon map of the 511 qualified stations. (b) The comparison of station average wind speed (orange line) and Thiessen polygon weighted average (blue line) across China for 1980–2019. The linear fitting models are shown in translucent thick lines accordingly. The map information is from the Department of Natural Resources standard map service system of China. Publisher’s remark: please note that the above figure contains disputed territories.
We further used Thiessen polygons (Thiessen, 1911) to give different weights to each station according to their representative areas, i.e., large weights for stations located in sparse station areas (Fig. 5a), and to compare the result with the station average (Fig. 5b). The Thiessen polygon method, also known as a Voronoi diagram, is a spatial analysis technique often employed in hydrology and climatology. It involves tessellating a region into polygons based on point data, such that each polygon encompasses only one data point, and every location within a polygon is closer to its associated point than any other. This method is particularly useful for interpolating values across a region when the exact nature of the change between points is unknown or when changes are abrupt. By drawing perpendicular bisectors between adjacent data points, the entire area is divided, with each polygon assuming the value of its associated data point. While straightforward and clear in its delineation, the Thiessen polygon method assumes uniform variation within each polygon. A Thiessen polygon weighted average is overall higher than a station average. This can be explained by the increasing weight of stations in northwestern China with higher wind speeds (Liu et al., 2019), while in the Thiessen polygon weighted average time series there are two breakpoints in 2000 (P < 0.001) and 2013 (P < 0.01). The trend changes from a quick decrease (−0.020 m s−1 yr−1, R2 = 0.94, P < 0.001) to an unstable moderate decrease (−0.004 m s−1 yr−1, R2 = 0.17, P = 0.14) and a quick increase (+0.017 m s−1 yr−1, R2 = 0.64, P < 0.05). The increasing trend in the recent decade increased by 31 % (from +0.013 to +0.017 m s−1 yr−1) after using the Thiessen polygon approach. This is because the weights of stations in the northwest and southwest are higher when calculating the average, and those areas has strong increasing wind speed trends (Fig. S7). Despite the Thiessen polygon approach already utilizing the nearest station observation to represent wind speed in locations lacking direct observations, it remains unsatisfactory due to the intricate spatial variability of wind speed attributed to complex terrain. To enhance the accuracy of wind speed interpolation, a more comprehensive model necessitates additional observations within areas characterized by complex terrain.
Continuity is crucial for meteorological observation data. However, either the updates in the anemograph, the relocation caused by urbanization or the methods of data logging will affect wind speed data continuity. In this study, we comprehensively examined the discontinuity in wind speed data using a Chinese dataset. We found that updates to the automatic anemometer improved the observation frequency and instrument sensitivity, decreasing the zero-value daily wind speed data and increasing the data accuracy. We also propose comparing the discontinuity in time series with the recorded station relocation to check whether a relocation caused a breakpoint. We found that 90 stations were affected by the relocation and show a quickly increasing wind speed in the recent 2 decades. After excluding those problematic stations, the wind speed reversal trend is reduced by 41 % but is still strong (P < 0.001, with an increasing trend of +0.013 m s−1 yr−1). The increasing trend reaches +0.017 m s−1 yr−1 (R2 = 0.64, P < 0.05) after using Thiessen polygons, which gives the stations in northwestern China a larger weight because of their small number but with a large area.
Though many methods (Masters et al., 2010; Wan et al., 2010; Cao and Yan, 2012; Hong et al., 2014; He et al., 2014; Azorin-Molina et al., 2018; Camuffo et al., 2020) have been proposed to handle those problems, a comprehensive summary of them is missing. Also, it is hard for external researchers to provide a better solution without collaboration with national weather services and without access to station data records and/or metadata. Therefore, we hope that national weather services can improve data quality based on these feedbacks and World Climate Data and Monitoring Programme guidelines and complete the process by introducing an R package with open-source code on GitHub and publishing the metadata. In this way, not only are the data easier to get and process, but researchers can also contribute to improving the dataset. One such example is the rnpn package to access and process USA National Phenology Network data (https://github.com/usa-npn/rnpn, last access: 30 January 2024). In any case, all raw data processing has limitations and adds additional uncertainty. As we keep reporting problems in datasets and improving our processing method, we should also pay more attention to increasing the quality and homogeneity of the wind data. This requires raising awareness of the importance of protecting the environment around the observation station and avoiding relocations.
The data that support the findings of this study are available upon request from the authors. The meteorological data can be downloaded from http://101.200.76.197:91/mekb/?r=data/cdcdetail&dataCode=SURF_CLI_CHN_MUL_DAY_V3.0 (CMDSC, 2012).
The supplement related to this article is available online at: https://doi.org/10.5194/amt-17-1123-2024-supplement.
ZZ: conceptualization, methodology. YL: methodology, software, writing – draft. LZ: methodology, data curation. All the other authors: writing – review and editing.
The contact author has declared that none of the authors has any competing interests.
Publisher’s note: Copernicus Publications remains neutral with regard to jurisdictional claims made in the text, published maps, institutional affiliations, or any other geographical representation in this paper. While Copernicus Publications makes every effort to include appropriate place names, the final responsibility lies with the authors.
We thank Robert Dunn (UK Met Office) for discussions and comments on the manuscript. We thank Adrian Chappell for providing the surface roughness data. The authors wish to acknowledge the reviewers for their detailed and helpful comments on the original manuscript.
Cesar Azorin-Molina was supported by the CSIC Interdisciplinary Thematic Platform (PTI) Clima (PTI-CLIMA), the BBVA Foundation and the Unidad Asociada CSIC-Universidad de Vigo: Grupo de Física de la Atmosfera y del Océano. Cheng Shen is supported by Sven Lindqvists Forskningsstiftelse, and Research Fund Adlerbertska Stiftelse.
This research has been supported by the National Natural Science Foundation of China (grant no. 42071022), the Guangdong Basic and Applied Basic Research Fund Project (grant no. 2022A1515240070), the Shenzhen Sustainable Development Science and Technology Special Project (grant no. KCXFZ20230731093403008), VENTS (grant no. GVAAICO/2021/023), the 2021 Leonardo Grant for Researchers and Cultural Creators, the Swedish Research Council (VR, grant no. 2021-02163), and Swedish FORMAS (grant no. 2023-01648).
This paper was edited by Chunlüe Zhou and reviewed by Jitze van der Meulen and one anonymous referee.
Azorin-Molina, C., Vicente-Serrano, S. M., McVicar, T. R., Jerez, S., Sanchez-Lorenzo, A., López-Moreno, J.-I., Revuelto, J., Trigo, R. M., Lopez-Bustins, J. A., and Espírito-Santo, F.: Homogenization and Assessment of Observed Near-Surface Wind Speed Trends over Spain and Portugal, 1961–2011, J. Climate, 27, 3692–3712, https://doi.org/10.1175/JCLI-D-13-00652.1, 2014.
Azorin-Molina, C., Asin, J., McVicar, T. R., Minola, L., Lopez-Moreno, J. I., Vicente-Serrano, S. M., and Chen, D.: Evaluating anemometer drift: A statistical approach to correct biases in wind speed measurement, Atmos. Res., 203, 175–188, https://doi.org/10.1016/j.atmosres.2017.12.010, 2018.
Azorin-Molina, C., Guijarro, J. A., McVicar, T. R., Trewin, B. C., Frost, A. J., and Chen, D.: An approach to homogenize daily peak wind gusts: An application to the Australian series, Int. J. Climatol., 39, 2260–2277, https://doi.org/10.1002/joc.5949, 2019.
Bathiany, S., Scheffer, M., van Nes, E. H., Williamson, M. S., and Lenton, T. M.: Abrupt Climate Change in an Oscillating World, Sci. Rep., 8, 5040, https://doi.org/10.1038/s41598-018-23377-4, 2018.
Camuffo, D., della Valle, A., Becherini, F., and Zanini, V.: Three centuries of daily precipitation in Padua, Italy, 1713–2018: history, relocations, gaps, homogeneity and raw data, Climatic Change, 162, 923–942, https://doi.org/10.1007/s10584-020-02717-2, 2020.
Cao, L. and Yan, Z.: Progress in Research on Homogenization of Climate Data, Advances in Climate Change Research, 3, 59–67, https://doi.org/10.3724/SP.J.1248.2012.00059, 2012.
Chappell, A. and Webb, N. P.: Using albedo to reform wind erosion modelling, mapping and monitoring, Aeolian Res., 23, 63–78, https://doi.org/10.1016/j.aeolia.2016.09.006, 2016.
China Meteorology Administration (CMA): National basic meteorological station in Guangzhou was relocated four times in 62 years, http://www.cma.gov.cn/2011xwzx/2011xmtjj/201110/t20111026_121807.html (last access: 22 December 2023), 2011.
China Meteorology Administration (CMA): Notice of the China meteorological administration on the issuance of provisional regulations on relocation and removal of national ground meteorological observation stations, http://www.gov.cn/gongbao/content/2013/content_2344560.htm (last access: 22 December 2023), 2012.
China Meteorological Administration (CMA): Meteorological data set description document, http://101.200.76.197:91/mekb/?r=data/detail&dataCode=SURF_CLI_CHN_MUL_DAY_V3.0 (last access: 22 December 2023), 2017.
China Meteorological Data Service Center (CMDSC): China Surface Climatic Data Daily Data Set 60 (Version 3.0), China Meteorological Data Service Center [data set], http://101.200.76.197:91/mekb/?r=data/cdcdetail&dataCode=SURF_CLI_CHN_MUL_DAY_V3.0 (last access: 13 February 2024), 2012.
Dunn, R. J. H., Azorin-Molina, C., Menne, M. J., Zeng, Z., Casey, N. W., and Shen, C.: Reduction in reversal of global stilling arising from correction to encoding of calm periods, Environ. Res. Commun., 4, 061003, https://doi.org/10.1088/2515-7620/ac770a, 2022.
Feng, S., Hu, Q., and Qian, W.: Quality control of daily meteorological data in China, 1951–2000: a new dataset, Int. J. Climatol., 24, 853–870, https://doi.org/10.1002/joc.1047, 2004.
Fu, G., Yu, J., Zhang, Y., Hu, S., Ouyang, R., and Liu, W.: Temporal variation of wind speed in China for 1961–2007, Theor. Appl. Climatol., 104, 313–324, https://doi.org/10.1007/s00704-010-0348-x, 2011.
He, Y., Chan, P. W., and Li, Q.: Standardization of raw wind speed data under complex terrain conditions: A data-driven scheme, J. Wind Eng. Ind. Aerod., 131, 12–30, https://doi.org/10.1016/j.jweia.2014.05.002, 2014.
Hong, H. P., Mara, T. G., Morris, R., Li, S. H., and Ye, W.: Basis for recommending an update of wind velocity pressures in Canadian design codes, Can. J. Civ. Eng., 41, 206–221, https://doi.org/10.1139/cjce-2013-0287, 2014.
Hu, W., Kong, L., Zhu, X., and Xue, W.: Accurancy analysis on contact anemometer self – recording records digitization processing system, Jounal of Arid Meteorology, 27, 168-171, http://www.ghqx.org.cn/CN/Y2009/V27/I2/168 (last access: 30 January 2024), 2009 (in Chinese).
Killick, R., Fearnhead, P., and Eckley, I. A.: Optimal Detection of Changepoints With a Linear Computational Cost, J. Am. Stat. Assoc., 107, 1590–1598, https://doi.org/10.1080/01621459.2012.737745, 2012.
Li, Y., Chen, Y., Li, Z., and Fang, G.: Recent recovery of surface wind speed in northwest China, Int. J. Climatol., 38, 4445–4458, https://doi.org/10.1002/joc.5679, 2018.
Liu, F., Sun, F., Liu, W., Wang, T., Wang, H., Wang, X., and Lim, W. H.: On wind speed pattern and energy potential in China, Appl. Energ., 236, 867–876, https://doi.org/10.1016/j.apenergy.2018.12.056, 2019.
Liu, Y., Zeng, Z., Xu, R., Ziegler, A. D., Jerez, S., Chen, D., Azorin-Molina, C., Zhou, L., Yang, X., Xu, H., Li, L., Dong, L., Zhou, F., Cao, R., Liu, J., Ye, B., Kuang, X., and Yang, X.: Increases in China's wind energy production from the recovery of wind speed since 2012, Environ. Res. Lett., 17, 114035, https://doi.org/10.1088/1748-9326/ac9cf4, 2022a.
Liu, Y., Xu, R., Ziegler, A. D., and Zeng, Z.: Stronger winds increase the sand-dust storm risk in northern China, Environ. Sci.-Atmos., 2, 1259–1262, https://doi.org/10.1039/D2EA00058J, 2022b.
Masters, F. J., Vickery, P. J., Bacon, P., and Rappaport, E. N.: Toward Objective, Standardized Intensity Estimates from Surface Wind Speed Observations, B. Am. Meteorol. Soc., 91, 1665–1682, https://doi.org/10.1175/2010BAMS2942.1, 2010.
McVicar, T. R., Roderick, M. L., Donohue, R. J., Li, L. T., Van Niel, T. G., Thomas, A., Grieser, J., Jhajharia, D., Himri, Y., Mahowald, N. M., Mescherskaya, A. V., Kruger, A. C., Rehman, S., and Dinpashoh, Y.: Global review and synthesis of trends in observed terrestrial near-surface wind speeds: Implications for evaporation, J. Hydrol., 416–417, 182–205, https://doi.org/10.1016/j.jhydrol.2011.10.024, 2012.
Rayner, D. P.: Wind Run Changes: The Dominant Factor Affecting Pan Evaporation Trends in Australia, J. Climate, 20, 3379–3394, https://doi.org/10.1175/JCLI4181.1, 2007.
Shen, C., Zha, J., Wu, J., and Zhao, D.: Centennial-Scale Variability of Terrestrial Near-Surface Wind Speed over China from Reanalysis, J. Climate, 34, 5829–5846, https://doi.org/10.1175/JCLI-D-20-0436.1, 2021.
Sohu: Due to lack of sufficient attention, 60 % of the national ground meteorological observation stations were forced to relocate, https://news.sohu.com/20040921/n222160625.shtml (last access: 22 December 2023), 2004 (in Chinese).
Thiessen, A. H.: Precipitation Averages for Large Areas, Mon. Weather Rev., 39, 1082, https://doi.org/10.1175/1520-0493(1911)39<1082b:PAFLA>2.0.CO;2, 1911.
Tian, Q., Huang, G., Hu, K., and Niyogi, D.: Observed and global climate model based changes in wind power potential over the Northern Hemisphere during 1979–2016, Energy, 167, 1224–1235, https://doi.org/10.1016/j.energy.2018.11.027, 2019.
Trewin, B.: Exposure, instrumentation, and observing practice effects on land temperature measurements, WIREs Climate Change, 1, 490–506, https://doi.org/10.1002/wcc.46, 2010.
Vautard, R., Cattiaux, J., Yiou, P., Thépaut, J.-N., and Ciais, P.: Northern Hemisphere atmospheric stilling partly attributed to an increase in surface roughness, Nat. Geosci., 3, 756–761, https://doi.org/10.1038/ngeo979, 2010.
Wan, H., Wang, X. L., and Swail, V. R.: Homogenization and Trend Analysis of Canadian Near-Surface Wind Speeds, J. Climate, 23, 1209–1225, https://doi.org/10.1175/2009JCLI3200.1, 2010.
Wang, X., Piao, S., Ciais, P., Li, J., Friedlingstein, P., Koven, C., and Chen, A.: Spring temperature change and its implication in the change of vegetation growth in North America from 1982 to 2006, P. Natl. Acad. Sci. USA, 108, 1240–1245, https://doi.org/10.1073/pnas.1014425108, 2011.
Wang, X. L.: Accounting for Autocorrelation in Detecting Mean Shifts in Climate Data Series Using the Penalized Maximal t or F Test, J. Appl. Meteorol. Clim., 47, 2423–2444, https://doi.org/10.1175/2008JAMC1741.1, 2008.
World Meteorological Organization (WMO): WMO guidelines on the calculation of climate normals, WMO-No. 1203, https://library.wmo.int/viewer/55797?medianame=1203_en_#page=1&viewer=picture&o=bookmark&n=0&q= (last access: 22 December 2023), 2017.
World Meteorological Organization (WMO): Guide to Instruments and Methods of Observation. Volume V – Quality Assurance and Management of Observing Systems, 2018 edition, World Meteorological Organization, https://doi.org/10.25607/OBP-690, 2018.
World Meteorological Organization (WMO): Guidelines on Homogenization, 2020 edition, World Meteorological Organization, https://doi.org/10.25607/OBP-1920, 2020.
Xin, Y., Chen, H., and Li, Y.: Homogeneity adjustment of annual mean wind speed and elementary calculation of fundamental wind pressure over Xinjiang meteorological stations, Climatic and Environmental Research, 17, 184–196, https://doi.org/10.3878/j.issn.1006-9585.2011.10093, 2012 (in Chinese).
Yang, Q., Li, M., Zu, Z., and Ma, Z.: Has the stilling of the surface wind speed ended in China?, Sci. China Earth Sci., 64, 1036–1049, https://doi.org/10.1007/s11430-020-9738-4, 2021.
Zeng, Z., Ziegler, A., Searchinger, T., Yang, L., Chen, A., Ju, K., Piao, S., Li, L., Ciais, P., Chen, D., Liu, J., Azorin-Molina, C., Chappell, A., Medvigy, D., and Wood, E.: A reversal in global terrestrial stilling and its implications for wind energy production, Nat. Clim. Change, 9, 1–7, https://doi.org/10.1038/s41558-019-0622-6, 2019.
Zha, J., Shen, C., Zhao, D., Wu, J., and Fan, W.: Slowdown and reversal of terrestrial near-surface wind speed and its future changes over eastern China, Environ. Res. Lett., 16, 034028, https://doi.org/10.1088/1748-9326/abe2cd, 2021.
Zhang, G., Azorin-Molina, C., Wang, X., Chen, D., McVicar, T. R., Guijarro, J. A., Chappell, A., Deng, K., Minola, L., Kong, F., Wang, S., and Shi, P.: Rapid urbanization induced daily maximum wind speed decline in metropolitan areas: A case study in the Yangtze River Delta (China), Urban Climate, 43, 101147, https://doi.org/10.1016/j.uclim.2022.101147, 2022.