the Creative Commons Attribution 4.0 License.
the Creative Commons Attribution 4.0 License.
 | 20 Feb 2024
Geometrical and optical properties of cirrus clouds in Barcelona, Spain: analysis with the two-way transmittance method of 4 years of lidar measurements
Cristina Gil-Díaz
Michäel Sicard
Adolfo Comerón
Daniel Camilo Fortunato dos Santos Oliveira
Constantino Muñoz-Porcar
Alejandro Rodríguez-Gómez
Jasper R. Lewis
Ellsworth J. Welton
Simone Lolli
In this paper a statistical study of cirrus geometrical and optical properties based on 4 years of continuous ground-based lidar measurements with the Barcelona (Spain) Micro Pulse Lidar (MPL) is analysed. First, a review of the literature on the two-way transmittance method is presented. This method is a well-known lidar inversion method used to retrieve the optical properties of an aerosol–cloud layer between two molecular (i.e. aerosol and cloud-free) regions below and above, without the need to make any a priori assumptions about their optical and/or microphysical properties. Second, a simple mathematical expression of the two-way transmittance method is proposed for both ground-based and spaceborne lidar systems. This approach of the method allows the retrieval of the cloud optical depth, the cloud column lidar ratio and the vertical profile of the cloud backscatter coefficient. The method is illustrated for a cirrus cloud using measurements from the ground-based MPL and from the spaceborne Cloud-Aerosol Lidar with Orthogonal Polarization (CALIOP). Third, the database is then filtered with a cirrus identification criterion based on (and compared to) the literature using only lidar and radiosonde data. During the period from November 2018 to September 2022, 367 high-altitude cirrus clouds were identified at 00:00 and 12:00 UTC, of which 203 were successfully inverted with the two-way transmittance method. The statistical results of these 203 high-altitude cirrus clouds show that the cloud thickness is 1.8 ± 1.1 km, the mid-cloud temperature is −51 ± 8 ∘C and the linear cloud depolarization ratio is 0.32 ± 0.13. The application of the transmittance method yields an average cloud optical depth (COD) of 0.36 ± 0.45 and a mean effective column lidar ratio of 30 ± 19 sr. Statistical results of the errors associated with the two-way transmittance method retrievals are also provided. The highest occurrence of cirrus is observed in spring and the majority of cirrus clouds (48 %) are visible (0.03 < COD < 0.3), followed by opaque (COD > 0.3) with a percentage of 38 %. Together with results from other sites, possible latitudinal dependencies have been analysed together with correlations between cirrus cloud properties. For example, we noted that in Barcelona the COD correlates positively with the cloud base temperature, effective column lidar ratio and linear cloud depolarization ratio and negatively with the cloud base height.
- Article
(831 KB) - Full-text XML
- BibTeX
- EndNote


The radiative effect of high-altitude cirrus clouds plays a fundamental role in the global radiation budget (Liou, 1986; Lolli et al., 2017). Despite that, they have been designated as poorly understood by IPCC (2023) because of a lack of knowledge of their dynamic, microphysical and radiative properties. Indeed, cirrus clouds' critical role in the climate comes from the facts that (1) they are the only cloud that can readily cool or warm the top of the atmosphere and the surface, during daytime, depending on their properties (Campbell et al., 2016), and that (2) they have a high occurrence frequency globally (Holz et al., 2008). In fact, Campbell et al. (2016) demonstrated through a 1-year long lidar dataset that positive or negative daytime cirrus cloud forcing could occur depending on the cloud optical depth and the solar zenith angle. All these results call for more investigation on the cirrus cloud properties and their 3D spatial distribution at the global scale.
Cirrus clouds are mainly composed of ice crystals and can form through different atmospheric mechanisms, giving rise to cirrus clouds with different physical, geometrical and optical properties. In the mid-latitude regions, the most common atmospheric mechanisms for cirrus cloud formation are the deep convective outflow (Li et al., 2005; Fu et al., 2006; Jin, 2006), the large-scale uplift of humid layers induced by the Asian monsoon (Chen and Liu, 2005) and the cooling associated with the wave activity in the upper troposphere (Spichtinger et al., 2003). Therefore, the atmospheric mechanisms of cirrus formation govern the type of cirrus formed. For example, sub-visible cirrus clouds (COD < 0.03) are formed because of the cooling near tropopause height, while opaque cirrus clouds are generally formed by deep convective outflow at lower heights except during deep overshooting convections (Pandit et al., 2015). Cirrus clouds can also be triggered by aircraft contrails. These contrails are caused by aircraft engine exhaust, primarily water, which turns into ice crystals at low temperature. Cirrus contrails are often formed under persistent humidity conditions (Schumann, 1996; Schumann and Heymsfield, 2007; Schumann et al., 2021; Li et al., 2023). Their lifetimes sometimes reach several hours and their spatial extension may evolve up to 10 km in width and between 0.5 and 1.5 km in depth. Moreover, cirrus contrails from several aircraft may often overlap and form together a larger contrail cirrus cloud, making it more difficult to distinguish from other cirrus.
Ice cloud microphysics and their relationship with optical and radiative properties are complex. Cirrus clouds can be characterized by some key parameters such as the mid-cloud altitude and temperature, cloud extinction coefficient, cloud optical depth, lidar ratio (LR) or linear cloud depolarization ratio (LCDR). While the LR and LCDR are related to the microphysical properties of the ice crystals contained in cirrus clouds, such as their shape and/or orientation, the mid-cloud altitude and temperature as well as the cloud extinction coefficient play an important role in determining the cloud radiative properties. Up to the present date, there has been no exact theoretical solution for scattering and absorption by non-spherical ice particles (Liou and Takano, 1994). Nevertheless, scattering models for cirrus clouds have been developed, such as Baran et al. (2009, 2011a, b), which relates the cirrus ice water content and mid-cloud temperature to their extinction coefficient and radiative properties. Alternatively, Heymsfield et al. (2014) and Dolinar et al. (2022) propose a relationship between the ice water content with the extinction coefficient and the cloud temperature with the effective geometric diameter of ice crystals. From these properties, the cirrus cloud radiative properties can be calculated with the Fu et al. (1998, 1999) parametrizations. These and other ways of obtaining the radiative properties of cirrus clouds have several points in common, such as the need to calculate the cloud extinction, where the application of remote sensing is essential, or the assumption of the ice crystal shape distribution in empirical models, further complicating the results.
Lidar systems are the only remote sensing instruments capable of retrieving simultaneously vertical profiles of extinction and temperature. However, only a few lidar systems are equipped with the technique for temperature detection (in general, the integration lidar technique or the rotational Raman technique; see Behrendt, 2005). In such cases, radiosoundings, when available, can provide the temperature measurements (Sassen, 1991). Although cirrus clouds are not their primary target, many projects, networks and instruments worldwide are capable of retrieving cirrus extinction (or a good guess of it) from the ground: the European Aerosol Research LIdar NETwork (EARLINET) (Pappalardo et al., 2014) now included in the Aerosols, Clouds and Trace gases Research Infrastructure (ACTRIS) (Saponaro et al., 2019) and the Micro Pulse Lidar NETwork (MPLNET) (Welton et al., 2001). From space, there are the Cloud-Aerosol Lidar and Infrared Pathfinder Satellite Observations (CALIPSO) (Winker et al., 2007), AEOLUS (Ingmann and Straume, 2016) and Earth Cloud, Aerosol and Radiation Explorer (EarthCARE) (Eisinger et al., 2017).
The objective of this paper is to show a statistical analysis of cirrus cloud properties based on 4 years of continuous ground-based lidar measurements obtained from NASA (MPLNET; https://mplnet.gsfc.nasa.gov/, last access: 20 December 2023) and meteorological profiles from radiosondes in Barcelona. Specifically, the daytime and nighttime cirrus geometrical (cirrus base and top height and thickness), thermal (temperature at base, middle or top cloud altitude) and optical (cloud optical depth, lidar ratio and linear cloud depolarization ratio) properties are investigated. The instrumentation used is presented in Sect. 2. A review and a new unified formulation of the two-way transmittance method for both ground-based and spaceborne lidar systems are given in Sect. 3. A criterion for cirrus cloud identification is presented and compared to the literature in Sect. 4. Geometrical and optical cirrus properties are analysed in Sect. 5 and conclusions are presented in Sect. 6.
Five years (2018 to 2022) of continuous lidar measurements performed with the MPL in Barcelona, north-eastern Spain, are used in this paper. Co-located radiosoundings launched by the Meteorological Service of Catalonia (Meteocat) at 00:00 and 12:00 UTC are used as well. For the application of the two-way transmittance method for a high-altitude cirrus scene measured from a spaceborne lidar system, data from the CALIPSO satellite have also been used.
2.1 The MPL
The NASA Micro Pulse Lidar network is a federated network of Micro Pulse Lidar systems designed to measure aerosol and cloud vertical structure and boundary layer heights (Welton et al., 2001). All the sites in MPLNET currently use the MPL, which was developed at NASA Goddard Space Flight Center (GSFC) in the early 1990s. The MPL was patented and subsequently licensed to industry for commercial sales beginning in the mid-1990s. The data collected by MPL instruments are continuous, day and night, over long time periods from sites around the world. Most MPLNET sites are co-located with sites in the NASA AErosol RObotic NETwork (AERONET). MPLNET data have contributed to many studies and applications, e.g. domestic and international aerosol and cloud research (Welton et al., 2000, 2002), climate change and air quality studies (Miller et al., 2011) and support for NASA satellite and sub-orbital missions and aerosol modelling and forecasting (Misra et al., 2012).
The lidar system used in this study is a Polarized Micro Pulse Lidar (P-MPL) system that is integrated into the NASA Micro Pulse Lidar network. The Barcelona MPL is located on the roof of the CommSensLab (https://ors.upc.edu/, last access: 3 June 2023) building on Campus Nord of the Universitat Politècnica de Catalunya (41.38∘ N, 2.11∘ E; 115 m a.s.l.), approximately 1 km from the Serra de Collserola and 7 km from the sea.
The MPL system consists of a compact, eye-safe lidar designed for full-time unattended operation (Spinhirne, 1993; Campbell et al., 2002; Flynn et al., 2007; Huang et al., 2010). It uses a pulsed solid-state laser-emitting low laser pulse energy ∼ 6 µJ at a wavelength of 532 nm and a pulse repetition frequency of 2500 Hz. As both transmitting and receiving optics, the system uses a co-axial “transceiver” design with a Cassegrain telescope. The MPL systems use an optical set-up that consists of an actively controlled liquid crystal retarder which makes the system capable of conducting polarization-sensitive measurements by alternating between two retardation states (Flynn et al., 2007), while the polar and cross-polar signals are separately acquired and recorded. Additionally, the MPL systems have a narrow receiver field of view of approximately 100 µrad (Campbell et al., 2002), narrow interference filters, an approximately 0.3 nm full width at half maximum (FWHM) and photon-counting detection.
Data are centrally processed at NASA GSFC with the MPLNET version 3 (V3, released in 2021) algorithm and level-1.5 (L15, near-real-time, quality-assured) data (Welton et al., 2018). In particular, we used the MPLNET Normalized Relative Backscatter (NRB) product provided with 1 min temporal resolution and at 75 m vertical resolution. This product includes correction of dead time, dark count, after-pulse, background, overlap (Campbell et al., 2002; Welton and Campbell, 2002) and polarization calibration (Welton et al., 2018). Cloud base height and cloud top height as well as cloud optical depth and extinction coefficient profiles, linear volume depolarization ratio and cloud phase belong to the MPLNET Cloud (CLD) product described by Lewis et al. (2016, 2020). A multi-temporal averaging scheme is used to improve high-altitude cloud detection under conditions of a weak signal-to-noise ratio by combining NRB signal profiles averaged to short (1 min), medium (5 min) and long (21 min) temporal resolutions into a merged cloud scene.
2.2 Cloud-Aerosol Lidar with Orthogonal Polarization (CALIOP) lidar
The CALIPSO satellite provides new insight into the role that clouds and atmospheric aerosols play in regulating Earth's weather, climate and air quality through the analysis of their vertical structure and properties (Sourdeval et al., 2012; Nohra et al., 2016; Granados-Muñoz et al., 2019). CALIPSO is composed of three co-aligned nadir-viewing instruments: CALIOP, the Imaging Infrared Radiometer (IIR) and the Wide Field Camera (WFC). CALIPSO was launched on 28 April 2006 with the cloud profiling radar system on the CloudSat satellite. They both fly in formation with three other satellites in the A-train constellation to enable an even greater understanding of the climate system from the broad array of sensors on these other spacecraft.
CALIOP is an elastic-backscatter lidar that orbits Earth at a height of 705 km and measures attenuated aerosol backscatter profiles at 532 and 1064 nm, including parallel and perpendicular polarized components at 532 nm, with highly variable horizontal and vertical resolutions for different atmospheric layers (i.e. aerosol, cloud and surface returns) (Kar et al., 2018; Vaughan et al., 2019). The laser has a beam divergence of 100 mrad corresponding to a spot diameter of 70 m at Earth's surface. The receiver field of view of the 1 m telescope is 130 µrad. In order to implement the two-way transmittance method with CALIPSO data, the CALIPSO product used is the “Standard”, with Level 1 (L1) and Version 4.51 (V4.51) available from September 2022. This product has a horizontal (vertical) resolution, depending on the altitude range from to 5 km (30 to 300 m), and includes total and perpendicular attenuated, calibrated backscatter coefficients along with their calibration constants. In particular, it contains a number of corrections to the 1064 nm baseline shape (instrument characterization), polarization gain ratio (used to derive backscatter and depolarization) and the 532 and 1064 nm calibrations to mitigate low energies.
2.3 Radiosoundings
Radiosondes are launched twice every day (at 00:00 and 12:00 UTC) by Meteocat at a distance of less than 1 km from the MPL site. The radiosondes provide measurements of pressure, altitude, temperature, relative humidity, wind speed and direction. Only altitude, pressure and temperature profiles have been used in the present work.
3.1 Literature review
In order to get reliable products of the optical properties of clouds and aerosols, different techniques are currently employed to invert elastic lidar signals. The solution of the inverse problem is not straightforward because there are two unknown parameters in the lidar equation: the backscatter and extinction coefficients. Therefore, over the years, this problem has been approached from several perspectives, such as Fernald et al. (1972), Klett (1981), Fernald (1984) and Klett (1985); the two-way transmittance method (Evans, 1967; Cooke et al., 1972; Platt, 1973; Young, 1995; Elouragini and Flamant, 1996; Del Guasta, 1998; Chen et al., 2002; Platt et al., 2002; Cadet et al., 2005; Yorks et al., 2011; Córdoba-Jabonero et al., 2017); and others (Kovalev, 1993; Elouragini and Flamant, 1996; Chazette and Raut, 2023).
In particular, the two-way transmittance method compares the lidar signals just below and above the cloud, assuming that the lidar signals correctly represent the scattering medium and that the zones below and above the cloud are aerosol-free, cloud-free or molecular (Cooke et al., 1972; Young, 1995; Del Guasta, 1998). On the one hand, the main advantage of this method is that it does not require any a priori optical and/or microphysical hypotheses like knowledge of the cloud lidar ratio, defined as the ratio of the cloud extinction to backscatter coefficients integrated over the cloud (Giannakaki et al., 2007). This parameter is not the same for all cirrus clouds and depends on the ice crystal properties of cirrus clouds, although its value can be assumed to be in a range between 20 and 30 sr for ice clouds (Sassen and Comstock, 2001; Yorks et al., 2011; Lewis et al., 2016). On the other hand, the major disadvantages of this method are that one has to make sure that the regions above and below the aerosol or cloud layer are molecular, and so it depends strongly on the aerosol-free quality of the normalization regions below and above the cirrus cloud. For this reason, it is necessary to select particle-free regions far enough from the cloud layer in order to normalize the signal; otherwise, this method cannot be applied. Another disadvantage is that the retrievals are not accurate for very thin clouds (some studies suggest that the cloud optical depth must be greater than 0.1, Cadet et al., 2005, or 0.05, Chen et al., 2002), for thick clouds because the lidar signal does not penetrate the whole cloud, for very noisy lidar signals or for small lidar signal values.
In spite of all these disadvantages, it is common to find this method combined with other ones, in order to make a first estimation of the cloud optical depth due to its low computational cost. This first estimation of the cloud optical depth is usually used as a constraint in other methods. For example, the CALIPSO algorithm applies the transmittance method in certain situations. When a molecular region is found immediately above and below the cirrus cloud, the Hybrid Extinction Retrieval Algorithm (HERA) implemented with CALIPSO data uses the two-way transmittance method to obtain the cloud optical depth directly from the ratio of the mean attenuated scattering ratios, without multiple scattering correction (Young and Vaughan, 2009). It is also well known that the Fernald method (Young, 1995) can be constrained by values of cloud transmittance determined by the two-way transmittance method. Elouragini and Flamant (1996) combine the backward solution of the Klett method and the two-way transmittance method, and Cadet et al. (2005) show a combination of a method called the particle integration (PI) method and the two-way transmittance method to retrieve the optimal effective lidar ratio.
This method is based on the application of the lidar equation and the consideration of two reference points. For the calculation of the cloud optical depth, these points are placed above and below the cloud and the signal is normalized with the standard atmosphere, assuming molecular conditions in at least one of these regions. In this way, the power attenuation because of the cloud can be computed. There are many approaches of this method applied to certain aerosol and cloud layers. The first works using this technique date back to the 1960s–1970s, in which the authors calculated the transmittance of a smoke plume layer using lidar data (Evans, 1967; Cooke et al., 1972). Over the years, the two-way transmittance method has been used to calculate the cloud optical depth of cirrus clouds, considering different normalization regions or changing the extension of the normalization interval, the distance between the cirrus cloud and the normalization region or the time average applied to the lidar signal to reduce its noise. For example, Chen et al. (2002) normalize the lidar signal on both sides of a cirrus cloud, particularly at the top and base of the cloud, i.e. at only two points of the vertical profile. By contrast, Cadet et al. (2005) only consider a normalization region below the cirrus cloud extending from 0.7 to 0.4 km below the cloud base and use 2 min signal averaging. In one last example, Yorks et al. (2011) only contemplate a normalization region above the cloud extending between 3 and 4 km below the aircraft and the cloud top height (typically between 13 and 16 km in altitude).
In this study, the two-way transmittance method has been applied to a case study, specifically a high-altitude cirrus cloud measured with the MPL and CALIOP at the same time, 11 February 2019 at 02:03:50 UTC, in Barcelona. CALIPSO is at a distance of 78 km from the Barcelona station at that moment, and to illustrate this cirrus case study, the CALIPSO signal that has been analysed has a spatial average of 5 km.
3.2 For ground-based lidars
Following the notation of Campbell et al. (2002), we call NRB(z) the normalized relative backscatter or range-corrected signal at height z, and it can be written as
where C is the system calibration constant (for the method of solving C, see Welton et al., 2001) and β and T are the atmospheric backscatter and transmittance profiles, respectively. The molecular and effective particle contributions are denoted by the “m” and “ef” subscripts, respectively, as shown in Eq. (1). The effective particle transmittance can be expressed as an exponential term as follows:
where is the volume particle extinction coefficient, i.e. the volume effective particle extinction coefficient (the one measured) corrected from multiple scattering effects. The molecular extinction has been neglected with respect to the particle extinction component. The multiple scattering factor, η, was introduced by Platt (1973, 1979). The multiple scattering effect depends on the laser beam divergence, receiver field of view and distance between the light source and the scattering volume (Wandinger, 1998; Wandinger et al., 2010; Shcherbakov et al., 2022). In this study the multiple scattering effect is considered negligible for the lidar signal measured by the MPL system (η=1) due to its narrow field of view, the mean distance between cirrus clouds and the MPL, the small cirrus cloud optical depth (generally COD < 0.3) and the magnitude of cirrus cloud extinction (αp < 1 km−1) retrieved (Campbell et al., 2002; Lewis et al., 2016; Shcherbakov et al., 2022).
We first calculate the attenuated molecular backscatter coefficient, which is defined as
where βm and αm are calculated using the equations of McClatchey et al. (1972) with pressure and temperature measurements from radiosondes. Then, we scale down the range-corrected signal to the attenuated molecular backscatter coefficient in the molecular region above the cloud at height zt, where zt is the altitude corresponding to 0.2 km above the cloud top height, also an input from MPLNET. The normalized NRB (NRBnor) has the following expression:
In an aerosol-free atmosphere the vertical profiles of NRB and NRBnor would overlap. In practice, and NRB(zt) are not calculated at a single point zt. To compensate for the noise of NRB at high altitude, each quantity is calculated as the mean value in an interval [] km above the cloud. The vertical extent of the normalization interval above the cloud has been defined by performing different tests. Even though its extension may vary, this is not critical, as the atmospheric region above the cloud is assumed to be aerosol- or cloud-free. Equation (4) can be extended as
zb is the altitude corresponding to 0.2 km below the cloud bottom height, also an input from MPLNET. In practice, the normalization of the attenuated molecular backscatter coefficient at zb is calculated as the ratio of mean quantities calculated in an interval [] km below the cloud. This vertical extension of normalization is shallower than the normalization region above the cloud because it is more likely to find a non-molecular atmospheric layer below the cirrus cloud. Its extension has also been defined by performing different tests.
The ratio between the normalized range square-corrected signal coefficient in zt and the normalized attenuated molecular backscatter coefficient in zb is
where COD is the cloud optical depth defined as COD = . Finally, COD is calculated as
This simplified expression is obtained because the normalized NRB matches the attenuated molecular backscatter coefficient at zt, as can be derived from Eq. (4).
3.3 For spaceborne lidars
In order to follow with the same notation, we continue working with the NRB coefficient. With the attenuated total backscatter coefficient βatt(z) at height z, the product provided by CALIPSO data (Hostetler et al., 2006) is defined as an NRB coefficient with the calibration constant one (C=1; see Eq. 1).
Similarly to Sect. 3.2, we scale down the NRB to the normalized relative backscatter NRBnor, resulting in the following expression:
zt is the altitude corresponding to 0.2 km above the cloud top height and zb is the altitude corresponding to 0.2 km below the cloud bottom height. In practice, neither normalization is calculated at the single points zt and zb, respectively. To compensate for the noise of NRB and at high altitude, each quantity is calculated as the mean value in a wide enough interval above and below the cloud, identically to the ground base case explained previously. The ratio between the normalized attenuated backscatter coefficient in zt and the normalized attenuated molecular backscatter coefficient in zb is
The multiple scattering effect cannot be neglected for spaceborne lidar signals because of the distance between the satellite and the cirrus clouds. For this reason, η is assumed to be constant throughout the cloud layer with a value of 0.6, as in version 3 of the CALIOP algorithm (Garnier et al., 2015). Finally, COD is calculated as
3.4 Unified formulation
Once the mathematical developments for the application of the two-way transmittance method for ground-based lidars (see Sect. 3.2) and spaceborne lidars (see Sect. 3.3) are shown, an example case of cirrus cloud is analysed as shown in Fig. 1a and b, respectively.
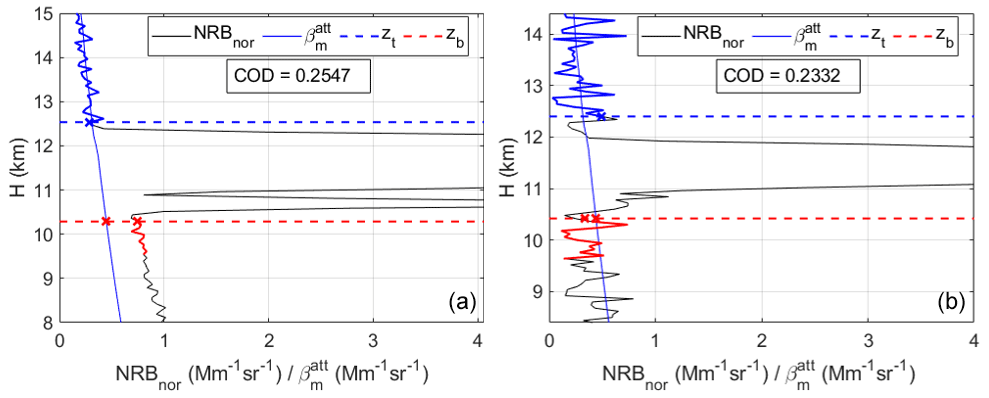
Figure 1Application of the two-way transmittance method for (a) MPLNET and (b) CALIPSO data for the case 11 February 2019 at 02:03:50 UTC. The height zb(zt) is the altitude corresponding to 0.2 km above (below) the cloud top (base) height.
Figure 1a and b show the application of the two-way transmittance method to a cirrus cloud detected in Barcelona with the MPL and CALIOP, respectively, at the same time. It is discerned that the cirrus cloud measured with ground-based lidar has similar base and top heights to the cirrus cloud detected with spaceborne lidar. In spite of this, applying the two-way transmittance method gives different CODs: 0.2547 for the cirrus cloud detected by the MPL and 0.2332 for the cirrus cloud measured by the CALIOP lidar. This small difference can be caused by the measurement of different parts of the same cirrus cloud or simply two different cirrus clouds in close proximity. Thus, the results obtained from the two-way transmittance method for ground-based and spaceborne lidars are equivalent.
Returning to the mathematical development, after COD calculation, we can estimate the lidar ratio of the whole cloud (LRcloud) using the following equation (Chen et al., 2002):
The particle backscatter is solved from Eq. (5):
where
With the aim of calculating the βp(z), in the first iteration (k=1) it is assumed that the extinction coefficient profile in the whole cloud is constant as
where COD is calculated with Eq. (7) or Eq. (11) and CT is the cloud thickness, which is the difference between cloud top height and cloud base height provided by MPLNET. After this first step, a new extinction coefficient profile is calculated as
Afterwards, the new extinction coefficient profile, , is used to calculate the next particle backscatter profile (). From the second iteration onwards, a vertical profile of the lidar ratio is also obtained. This process is continued until successive values of the LRcloud integral and the previous one differ negligibly, i.e. < 1 sr.
In order to study the optical characteristics of the cirrus clouds, we calculate the LCDR, which is defined as the ratio of the perpendicular and parallel lidar signals in the cloud (Chen et al., 2002). This parameter is not directly provided by the CLD MPLNET product. Instead, the volume depolarization ratio (VDR) is given by the CLD MPLNET product.
The vertical profile of the linear cloud depolarization ratio can be calculated by means of the following expression (Freudenthaler et al., 2009):
MDR is the molecular depolarization ratio and R is the backscatter ratio, which is defined as
According to Behrendt and Nakamura (2002), the MDR has a value of 0.00363. Once the vertical profile of the linear cloud depolarization rate has been obtained, the coefficient associated with the whole cloud is determined as the average of a half-cloud vertical profile centred at the maximum peak and shown in Fig. 2.
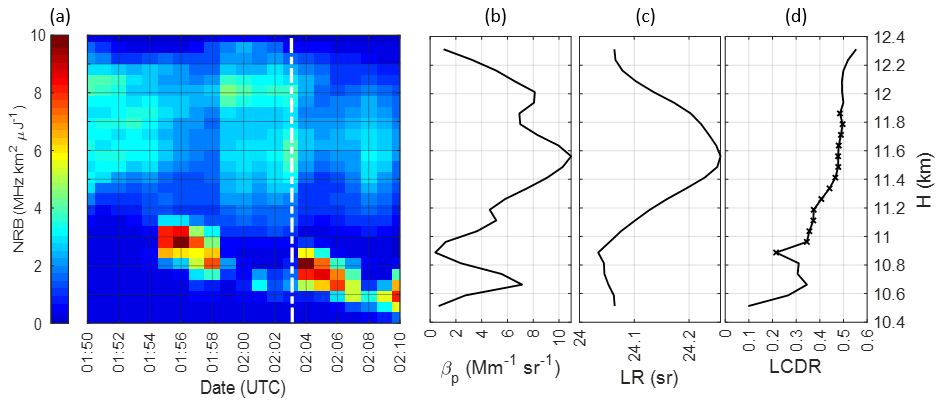
Figure 2Characterization of the cirrus cloud on 11 February 2019 at 02:03 UTC measured in Barcelona. (a) Minute evolution and vertical profiles of (b) the particle backscatter, (c) the lidar ratio and (d) the linear cloud depolarization ratio at 532 nm. The white line indicates the exact cirrus detection time and the black crosses refer to the cirrus zone where it is averaged to obtain the linear cloud depolarization ratio coefficient.
Figure 2 shows a quick look at the NRB within the cirrus cloud together with the associated vertical profiles of particle backscatter, effective column lidar ratio and linear cloud depolarization ratio calculated with the two-way transmittance method for the case study of 11 February 2019 at 02:03 UTC. It is observed that the peaks of the particle backscatter coefficient correspond to the areas of the cloud with the highest NRB values. The LR curve also presents a similar shape to that of the particle backscatter coefficient but smoother, varying its value by only two-tenths over the entire vertical profile of the cloud. In contrast, the LCDR has a flatter shape throughout its vertical profile and has some oscillations in the lowest cloud layer. To avoid these more irregular areas, the average of a half-cloud vertical profile centred at the maximum peak is calculated to obtain a representative value for the whole cirrus cloud.
3.5 Cirrus retrieval errors
After the calculation of the cirrus cloud optical retrievals, their associated errors have been estimated, where the COD, LR and LCDR errors have been calculated for each cirrus cloud scene with the classical error propagation equations (Ku, 1966). Similarly to the calculation of the LR and LCDR, their errors have been estimated by performing the average on half-clouds centred at the maximum peak. In addition, the LR error has been calculated as the maximum possible error, since only the first iteration has been considered in its calculation. As the classical error propagation equations have been used, it has been necessary to establish the errors of some variables such as the temperature and pressure of the radiosondes: ΔT=0.2 ∘C and ΔP=0.5 hPa (Servei Meteorològic de Catalunya, 2005). The MDR error has been quantified as 3.5 % of its value (Behrendt and Nakamura, 2002). The NRB and VDR errors have been assumed to be the NRB and VDR uncertainties from the MPLNET NRB product.
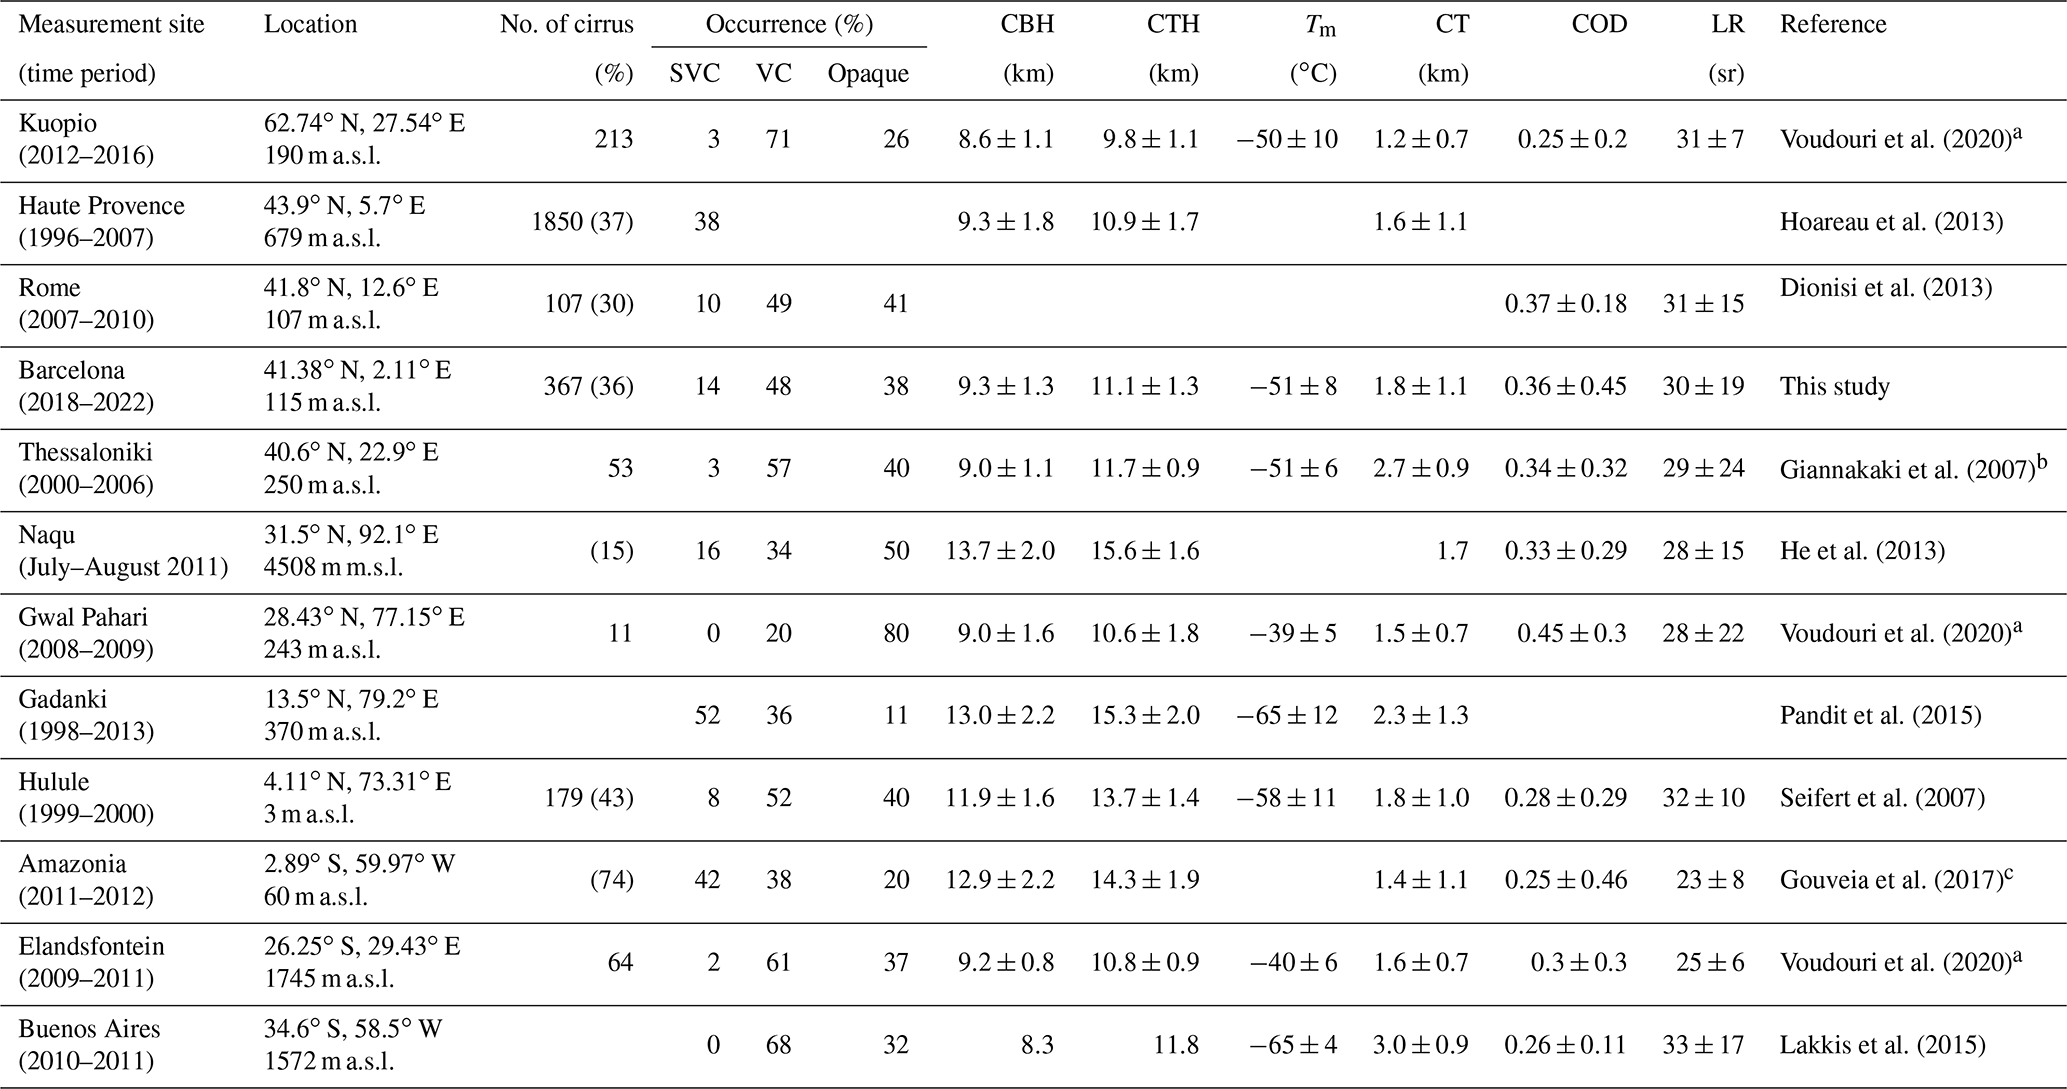
Even though there is no widely criterion accepted for the identification of cirrus clouds, the most common definition of cirrus clouds is that they must be composed mainly of ice crystals. This is because their geometrical and optical properties vary with latitude, as illustrated by the different cirrus identification criteria in Table 1 established in the literature. In this study, the criteria adopted for the identification of high-altitude cirrus clouds in Barcelona are based on two conditions. (1) The temperature at the cloud top height must be lower than −37 ∘C (Sassen and Campbell, 2001; Campbell et al., 2015) and (2) the cloud base height must be higher than 7 km to ensure cirrus clouds, as opposed to other types of clouds.
Campbell et al. (2018)Nohra et al. (2016)Giannakaki et al. (2007)Campbell et al. (2015)Seifert et al. (2007)Yorks et al. (2011)Voudouri et al. (2020)Córdoba-Jabonero et al. (2017)Table 1Summary of the criteria for cirrus cloud identification reported in the literature, where Tmid, Ttop and Tbase are the temperatures at cloud middle, top and base heights, respectively. CH and CBH are the mid-cloud and cloud base heights, respectively, and VDR is the volume depolarization ratio.
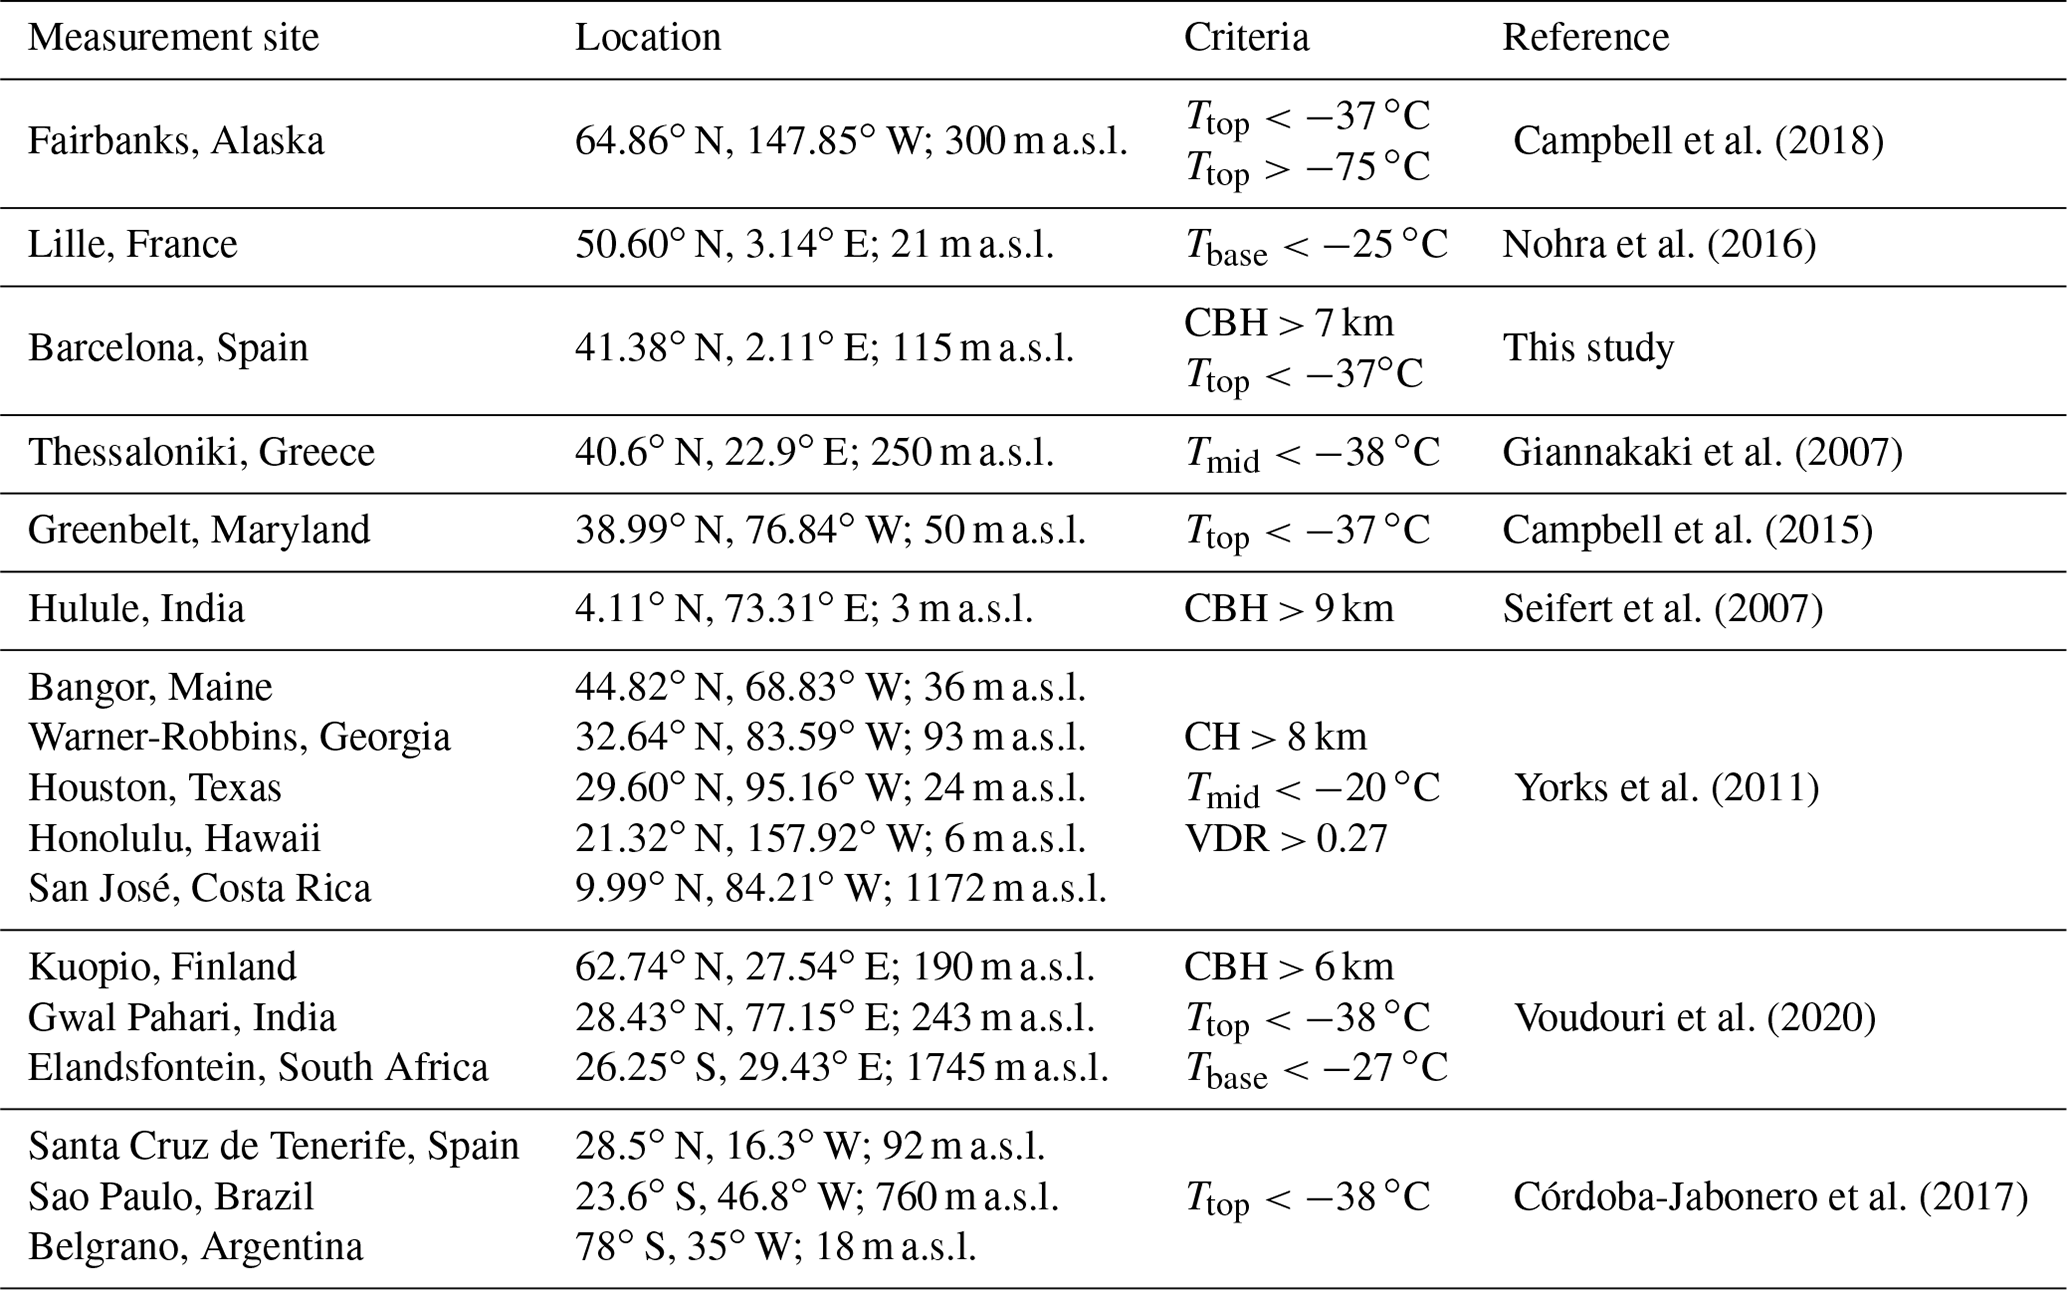
Table 1 shows that most cirrus identification criteria are based on the height or temperature of the cirrus clouds at the base, top or middle altitudes. Many of them even set criteria on both sides of the cloud to ensure that it does not contain liquid water. Although used by some authors, e.g. Yorks et al. (2011), the depolarization criterion is not widely used because of the low LCDR values of horizontally oriented ice (HOI) crystals (Hu et al., 2009), which might lead one to discard erroneously cirrus clouds made of such ice crystals.
In this study, cirrus clouds are considered the highest clouds in a vertical profile. In order to ensure that Rayleigh regions both above and below the cirrus cloud are analysed, if there is another cirrus cloud lower, less than 1 km away, the two cirrus clouds are merged and treated as one cirrus cloud layer. In all the cases, it has also been ensured that the lidar signal is not extinguished behind the cloud. After the classification of cirrus scenes, the two-way transmittance method has been applied to our database composed of 367 cirrus clouds. Of these 367 cases, the two-way transmittance method has only been correctly applied to 203 cases denoted as “successful” cirrus. Of the 164 cases of cirrus clouds for which the two-way transmittance method failed, denoted as “failed” cirrus, in 29 %, the Rayleigh zone above and below the cirrus cloud could not be guaranteed (zb and/or zt are lacking accuracy or another non-cirrus at less than 1 km is present), in 46 % a negative COD was calculated and in 25 % a LR higher than 100 sr was estimated. Of the last two cases (negative COD and LR > 100 sr), in 92 %, the cirrus had a very small lidar signal peak, and in 8 %, although the lidar signal peak associated with the cirrus cloud was noticeable, the signal was excessively noisy. A statistical analysis will be presented and discussed in Sect. 5.1 and 5.2.
5.1 Cirrus geometrical properties
After having carried out the identification of 367 high-altitude cirrus clouds, measured in Barcelona, through MPLNET products and radiosonde data from November 2018 to September 2022 (only at 00:00 and 12:00 UTC, when radiosondes are available), the two-way transmittance method has been applied successfully to 203 of them, i.e. to 55 % of all the cases. Note that 39 % of the 203 high-altitude cirrus cases have another cloud below the cirrus cloud. The elimination of some cases has been carried out on the basis of no possibility of guaranteeing a cloud- or aerosol-free zone both above and below the cirrus cloud (zb and/or zt are lacking accuracy or another non-cirrus at less than 1 km is present) and the calculation of a negative COD or a LR higher than 100 sr, as a consequence of a small peak of the lidar signal associated with the cirrus cloud or just a noisy lidar signal. In this section, the geometrical and optical properties of high-altitude cirrus scenes are presented and discussed.
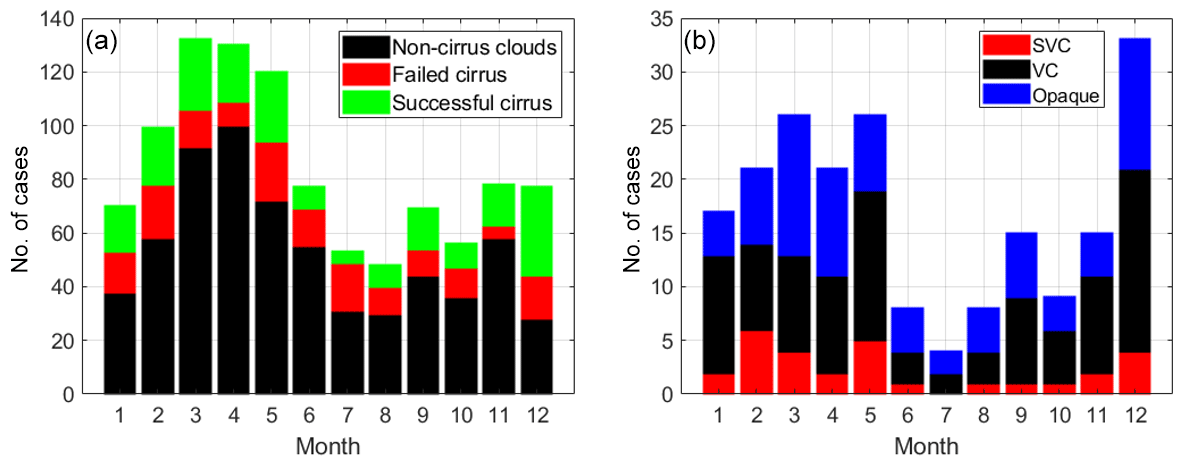
Figure 3Histogram of the number of (a) cases of non-cirrus (black), failed (red) and successful (green) cirrus clouds. (b) All successful cirrus clouds classified as sub-visible (red), visible (black) and opaque (blue) for each month from 2018 to 2022 in Barcelona.
The cirrus occurrences in Barcelona, together with the monthly distribution of cirrus scenes classified as sub-visible (SVC; COD < 0.03), visible (VC; 0.03 < COD < 0.3) and opaque (COD > 0.3) cirrus clouds according to the Sassen and Cho (1992) criteria, have been analysed and are shown in Fig. 3a and b, respectively.
The cloud detection has been performed with the MPLNET CLD product. When in a 1 min vertical profile there was a valid cloud base and cloud top value, it was counted as a cloud case. So, we have strong confidence in MPLNET products and their procedures for both distinguishing between aerosol and cloud and processing the lidar signal to obtain their respective products. The two-way transmittance method has been applied successfully to 203 cirrus clouds, i.e. to 55 % of all cirrus cloud cases. In Fig. 3a it can be observed that the efficiency of the method decreases notably in summer, while in the other seasons it remains relatively stable. Moreover, the percentage of cirrus cases is not negligible: 36 % of 1019 cloud cases at 00:00 and 12:00 UTC during the 5 years. Of this percentage, 39 % of cirrus cases have another cirrus cloud below them, specifically at a distance of lower than 1 km, and both clouds are merged and considered one cloud layer. The maximum cirrus cloud occurrence is in spring due to the fact that this is a time of great synoptic atmospheric instability in the Iberian Peninsula. In the mid-latitude regions, the formation process of cirrus clouds is linked to the deep convective outflow (Li et al., 2005; Fu et al., 2006; Jin, 2006), the synoptic-scale lifting of air leading to the ice nucleation at low temperatures (Das et al., 2010) and the cooling associated with the wave activity in the upper troposphere (Spichtinger et al., 2003). This phenomenon has also been observed in other studies such as Giannakaki et al. (2007) and Nohra et al. (2016), where the highest frequency of mid-latitude cirrus is in autumn and spring.
Figure 3b shows that the most abundant cirrus type is visible cirrus (48 %), followed by opaque (38 %), and the minority are sub-visible cirrus (14 %). The monthly distribution of sub-visible cirrus clouds does not vary considerably, remaining the category with the lowest occurrence over the year. In contrast, the distribution of visible and opaque cirrus varies slightly. It can be said that, in the warmer seasons, opaque cirrus clouds are more frequent than visible cirrus clouds. As shown in Table 4, these observations vary considerably depending on the latitude. The frequency of cirrus detection seems to be highly variable, and a more extended database is needed to state a tendency. It is also observed that, at latitudes close to the one of this study (41.38∘ N, Barcelona), the occurrence of visible cirrus clouds predominates. In general, it can be said that the occurrence of each cirrus depends on the weather pattern of each site.
The probability distribution of cloud base and top heights and the mid-cloud temperature of cirrus clouds are shown in Fig. 4.
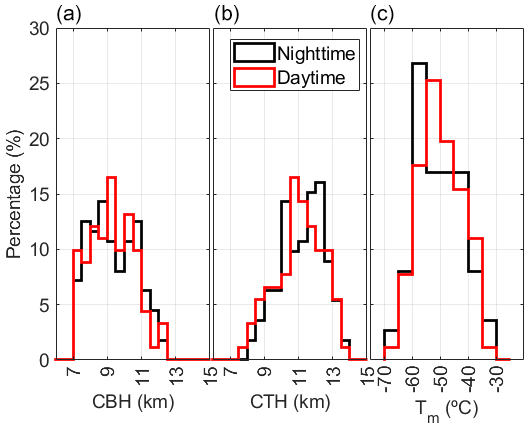
Figure 4Probability distribution of the (a) cloud base height, (b) cloud top height and (c) mid-cloud temperature of cirrus clouds at nighttime (00:00 UTC; black) and daytime (12:00 UTC; red) from 2018 to 2022 in Barcelona.
Ground-based elastic lidars are very sensitive to the solar background noise. For that reason the nighttime and daytime contributions have been separated. Despite that, the efficiency of the two-way transmittance method does not seem to be affected considerably, since the success rates of this method for cirrus clouds during daytime (62 %) and nighttime (51 %) are similar. In Fig. 4, it can be seen that the probability distribution of cloud base and top altitudes, respectively, range from 7 to 12.5 km and from 7.5 to 14 km, with peaks of occurrence at 9 and 10 km, respectively. Daytime and nighttime results are very similar. The mid-cloud temperature ranges between −30 and −70 ∘C and has a maximum around −55 (−50) ∘C during nighttime (daytime). These results fit well with the literature, specifically studies carried out at similar latitudes like Nohra et al. (2016), who obtained a distribution of cloud base (top) altitudes ranging from 5 to 13 (5 to 14) km, with a mean value of 8 (11) km. The mid-cloud temperature ranges between −30 and −80 ∘C and has two maximum peaks of occurrence around −45 and −55 ∘C. Another example is Campbell et al. (2016), who got cloud top altitudes between 6 and 16 km, with a mean top at 11 km and cloud top temperatures between −35 and −75 ∘C, with two maximum peaks of occurrence around −50 and −60 ∘C for daytime cirrus clouds.
Table 2Average and standard deviation values of geometrical properties of cirrus clouds at nighttime (00:00 UTC) and daytime (12:00 UTC) from 2018 to 2022 in Barcelona, where CH is mid-cloud height, N the number of cirrus clouds and % its percentage with respect to the total number of cirrus clouds to which the two-way transmittance method has been applied successfully.
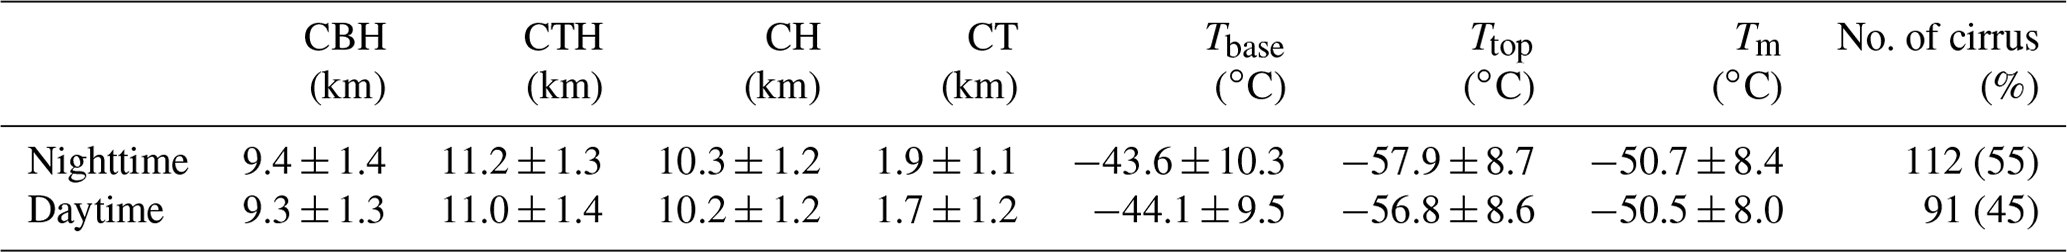
In order to better analyse the geometrical properties of the 203 high-altitude cirrus cases measured in Barcelona from the years 2018 to 2022, mean values and standard deviations have been calculated and are shown in Table 2.
Table 2 shows that the number of cirrus clouds analysed at nighttime is similar to that in the daytime, making the results comparable. Furthermore, the percentage of cirrus cases at nighttime and in the daytime to which the two-way transmittance method has been successfully applied, compared to those identified at these hours, does not differ considerably according to the hour of the day: 51 % for cirrus cases at nighttime and 62 % in the daytime. As a consequence, it can be stated that solar background radiation does not affect the efficiency of the two-way transmittance method.
It can also be observed that the cloud base and top heights together with the cloud thickness are higher at nighttime than in the daytime. Consequently, mid-cloud temperature is lower at nighttime than in the daytime. These differences are negligible due to their values being lower than their standard deviation, a similar result to that obtained in Nohra et al. (2016). It could be said that the macrophysical properties of cirrus clouds do not vary with the time of the day. The distribution of high-altitude cirrus thickness is in the range from 1 to 5 km, with a mean value of 1.9 km, which means that clouds with a large vertical development, characteristic of cloud types other than cirrus clouds, have been correctly discarded.
These results fit well with the literature, in which diverse studies such as Sassen and Campbell (2001) show that the cloud base height is 8.79 km, and Nohra et al. (2016), who, distinguishing between daytime and nighttime measurements, get values of 8.92 ± 1.65 and 8.91 ± 1.60 km, respectively. These values are slightly lower than those obtained in this study carried out in Barcelona but belong to the distribution shown in Fig. 4. Regarding the cloud top height, Sassen and Campbell (2001) obtain a very similar value to that of this study, 11.2 km, together with Campbell et al. (2015), who get 11.15 km, and Nohra et al. (2016), who get lower values of cloud top heights of 10.46 ± 1.59 and 10.62 ± 1.50 km for daytime and nighttime measurements. Instead of analysing cloud base and top heights, other studies like Dowling and Radke (1990) examine typical values of cirrus cloud altitude between 4 and 20 km, with the peak occurrence value of 9 km being lower than the value calculated in this study.
With respect to the thickness of cirrus clouds, Dowling and Radke (1990) show values ranging between 0.1 and 8 km, with a peak occurrence value of the distribution of 1.5 km. Sassen and Campbell (2001) get an averaged value of 1.81 km and Nohra et al. (2016) show values of 1.54 ± 0.91 and 1.71 ± 0.93 km for daytime and nighttime measurements, respectively. These values are also lower than those obtained in this study, indicating that the cirrus clouds measured in this study are thicker. This could be due to the fact that 39 % of the cirrus cases have another cirrus cloud below them, specifically at a distance of less than 1 km, and both are considered to be one.
Continuing with the analysis of the physical and geometrical properties of cirrus clouds, there are studies such as Sassen and Campbell (2001) which show a temperature value at a cloud base of −34.4 ∘C, a value considerably higher than the value obtained in this study. Regarding the temperature at the cloud top, Sassen and Campbell (2001) show a value that is slightly higher than the value of our study, which is −53.9 ∘C. To complete the cirrus temperature analysis, Campbell et al. (2015) get a mid-cloud temperature of −58.47 ∘C forming the difference between daytime and nighttime measurements, Nohra et al. (2016) show values of −49 ± 10 and −50 ± 9 ∘C, respectively, where the values obtained by Nohra et al. (2016) are really much closer to this study than those of Campbell et al. (2015).
5.2 Cirrus optical properties
Probability distributions of the optical properties cloud optical depth, lidar ratio and linear cloud depolarization ratio, calculated using the two-way transmittance method (see Sect. 3), have also been determined for all the cirrus scenes and are shown in Fig. 5.
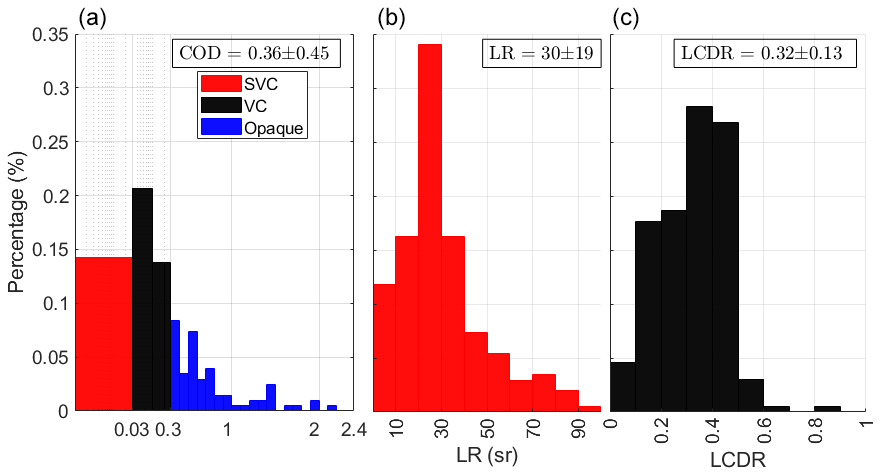
Figure 5Probability distribution of (a) cloud optical depth, (b) effective column lidar ratio and (c) linear cloud depolarization ratio, calculated using the two-way transmittance method, from 2018 to 2022 in Barcelona. The rectangles in the upper right-hand corners show average values and standard deviations of the distributions. Panel (a) has a logarithmic grid to show the sub-visible and visible cloud groups.
In Fig. 5 one observes that the presence of visible cirrus clouds dominates this study, with an occurrence of 48 %, followed by opaque cirrus clouds with a percentage of 38 % and lastly sub-visible cirrus clouds with a 14 % occurrence. Many studies point to the fact that the high-altitude cirrus clouds have an optical depth usually lower than 0.3 (Reichardt, 1999; Sassen and Campbell, 2001; Lee et al., 2009), which is the case in 62 % of the cases analysed in this study. However, this parameter can vary from 0.003 to 3 (Sassen and Comstock, 2001). The mean value of the distribution is 0.36, a value much larger than 0.1 because cirrus clouds with a much larger COD alter the mean, as reflected in the standard deviation of the distribution. The effective column lidar ratio varies mostly between 20 and 30 sr (33 %), in agreement with the literature (Sassen and Comstock, 2001; Yorks et al., 2011; Josset et al., 2012; Garnier et al., 2015; Córdoba-Jabonero et al., 2017), with an average value of 30 sr. The linear cloud depolarization ratio is typically between 0.3 and 0.5 (54 %), with an average of 0.32, which is in agreement with Sassen (2005), Giannakaki et al. (2007), Kim et al. (2018) and Hu et al. (2022). The lowest values of the linear cloud depolarization ratio may be due to a tendency of horizontal orientation of the ice crystals or a very thin or multi-layered cloud (Hu et al., 2009). It is mentioned above that, in this study, if there is another cirrus cloud lower, less than 1 km away, the two cirrus clouds are merged and treated as one cirrus cloud layer.
After having shown the probability distributions and the mean and standard deviation values of the cirrus cloud optical retrievals, the basic statistical values of their associated errors are presented in Table 3.
Table 3Minimum, mean, median, standard deviation and maximum values of the COD, LR and LCDR errors for cirrus cases from 2018 to 2022 in Barcelona.
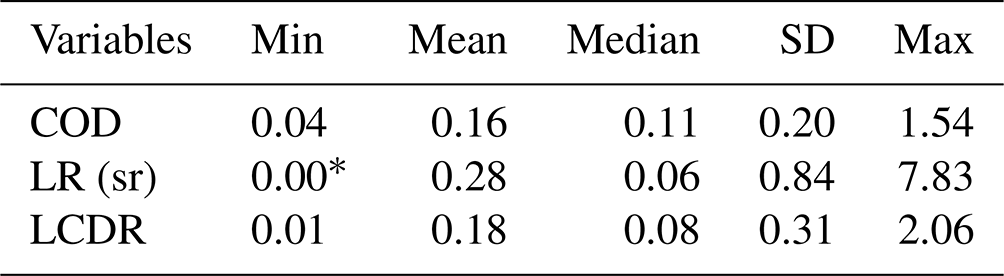
∗ The zero value is not exactly null, but if rounded to the second hundredth, it can be considered null.
Table 3 shows that the error of the COD is 0.16 ± 0.20 with a maximum value of 1.54, considerably high for sub-visible cirrus clouds (COD < 0.03) but reasonable for visible and opaque cirrus clouds. In addition, the maximum COD error found is lower than the maximum COD calculated. The LR error is 0.28 ± 0.84 sr with a maximum value of 7.83 sr. If it is compared to its magnitude (30 ± 19 sr; see Fig. 5), it is negligible in most cases. By contrast, the LCDR error is 0.18 ± 0.31, which is considerable for the lowest values, since the LCDR ranges between 0 and 1. In addition, a maximum LCDR error of 2.06 has been calculated, being greater than unity. This error is so large due to the uncertainty associated with this vertical profile of the volume depolarization ratio.
Voudouri et al. (2020)Hoareau et al. (2013)Dionisi et al. (2013)Giannakaki et al. (2007)He et al. (2013)Voudouri et al. (2020)Pandit et al. (2015)Seifert et al. (2007)Gouveia et al. (2017)Voudouri et al. (2020)Lakkis et al. (2015)Table 4Average and standard deviation values of cirrus cloud characteristics with ground-based lidar observations reported in the literature. The optical properties have been calculated at 532 nm, where N is the number of cirrus clouds identified and % is its percentage with respect to the total number of clouds. The occurrences of SVC, VC and opaque cirrus clouds are made on the number of cirrus N.
a Tm values have been manually calculated from the values of temperature at cloud and top heights shown in the paper. b The geometrical properties shown are from an annual average, and the optical properties are obtained by the two-way transmittance method applying a multiple scattering correction. c The optical properties are calculated at 355 nm.
Table 4 shows that the averages of cloud base (top) height range from 8 (10) to 14 (16) km, approaching the tropopause in some cases. Mid-latitude cirrus clouds are not found at altitudes below 7 km, so the criterion previously established for cirrus identification is correct. It also appears that the cirrus base and top height distributions are not dependent on latitude but rather on cirrus type. Thinner cirrus like SVC are usually found at higher altitudes than opaque cirrus. This relation will be studied in the next sub-section (see Sect. 5.3). Mid-cloud temperatures are in the range of −40 to −65 ∘C and the cloud thickness between 1 and 3 km. The optical properties of the clouds are very similar to those obtained at similar latitudes and the effective column lidar ratio seems to have a generally increasing trend towards the poles, but no conclusion can be drawn, since the variability at different sites appears negligible relative to the variability at each site.
5.3 Cirrus classification
A complementary analysis is carried out in this section, classifying the cirrus according to the criteria of Sassen and Cho (1992). For this purpose, the averages and standard deviations of the geometrical and optical properties of the cirrus clouds are calculated, as shown in Table 5.
Table 5Average and standard deviation of optical properties of cirrus clouds classified with Sassen and Cho (1992) criteria from 2018 to 2022 in Barcelona.
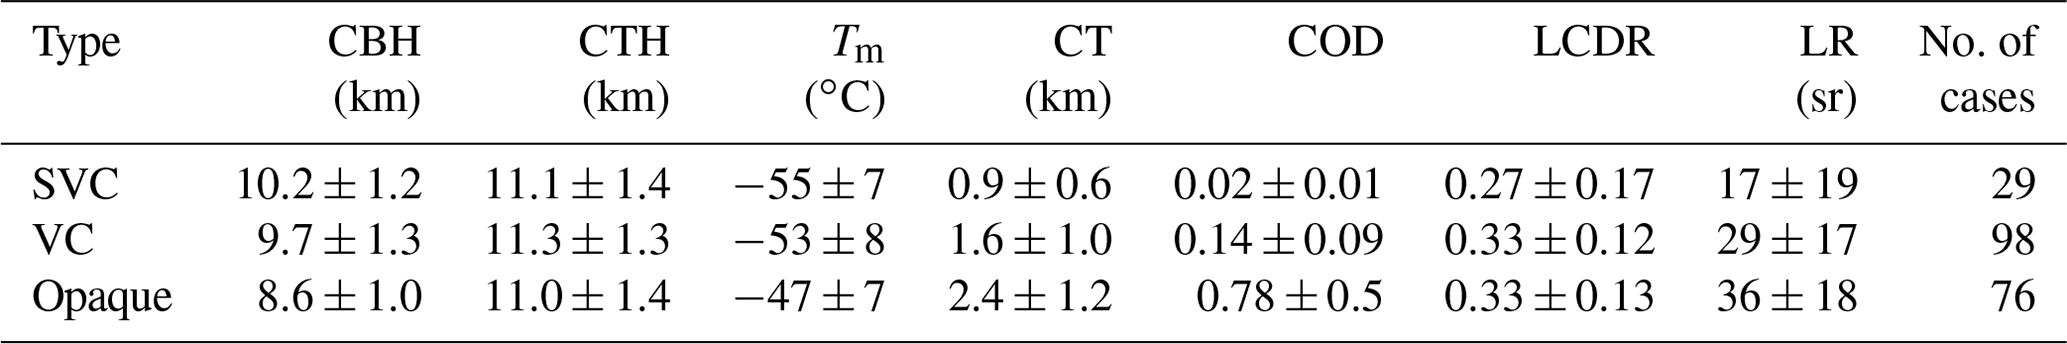
In Table 5, it can be seen that the cloud top height does not vary considerably depending on the type of cloud. The cirrus clouds might reach or be near the tropopause, since the average tropopause height calculated with radiosondes (World Meteorological Organization, 1957) on the days of cirrus scenes analysed is 11 ± 1 km. In contrast, the other geometrical, thermal and optical properties do vary with cloud type. For example, sub-visible clouds are the highest, coldest and thinnest clouds. Also, their thickness is 0.9 km less than the average thickness calculated with the whole cirrus dataset, and its temperature is 4 ∘C colder than the mean temperature. These results are consistent with other studies of SVC cirrus from spaceborne lidar observations (Martins et al., 2011). Their COD is within the value selected to make this classification, the LR is lower than 30 sr and their mean linear cloud depolarization ratio is 0.27, which is the lowest value of all the categories. Visible cirrus clouds are the most predominant type in this study. Their geometrical properties are very similar to those of the whole cirrus dataset, but the averages of the optical properties are slightly lower. Opaque cirrus clouds have the highest value of LR, which may be due to the fact that these clouds contain the greatest richness and variety of ice crystals. On the other hand, opaque clouds contribute the most to the total radiative forcing (Kienast-Sjögren et al., 2016): they are the lowest, warmest and thickest clouds in the whole cirrus dataset. Also, their thickness is 0.6 km higher than the average thickness calculated with the whole cirrus dataset, and its temperature is 4∘C warmer than the mean temperature.
5.4 Discussion
In this section the possible correlations between the different cirrus products obtained with the two-way transmittance method, radiosonde and MPLNET data are discussed. First, the linear correlations between the temperature and height of the cirrus base and the effective column lidar ratio with the logarithm of cloud optical depth are analysed, as shown in Fig. 6. The cirrus clouds have been classified according to the Sassen and Cho (1992) criteria.
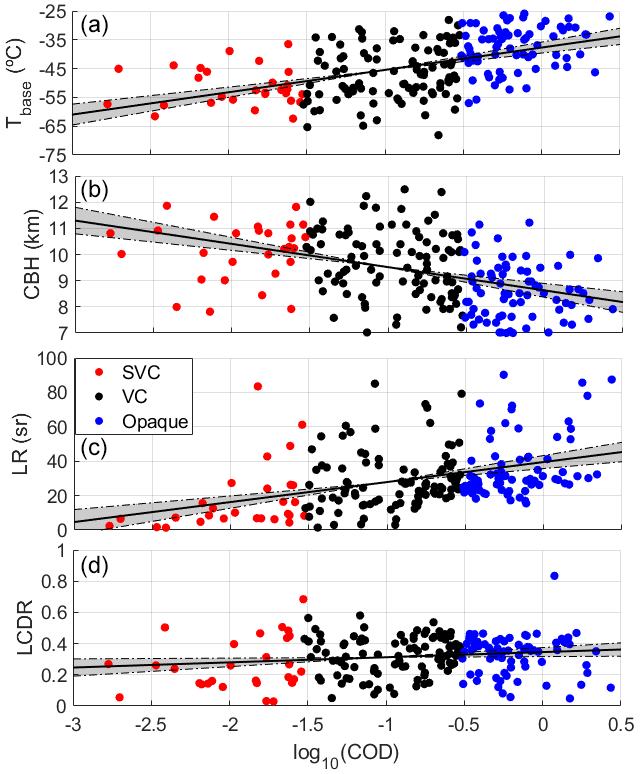
Figure 6Logarithmic dependence of the cloud optical depth with the (a) cloud base temperature, (b) cloud base height, (c) effective column lidar ratio and (d) linear cloud depolarization ratio for cirrus cases from 2018 to 2022 in Barcelona. The solid black line is the linear regression that has been calculated between the variables, and the grey shadings with the dash-dotted black lines are the 95 % confidence limit of the linear regression. The R2 values are (a) 0.26, (b) 0.19, (c) 0.17 and (d) 0.03.
On the one hand, Fig. 6 shows a weak positive linear dependence between the logarithm of the cloud optical depth and the cloud base temperature and, in contrast to this, a negative tendency with the cloud base height. This means that, as the cloud base temperature increases, the cloud base height decreases, which is characteristic of the troposphere. As the cloud base height is lower, it is observed that the cloud optical depth increases. This could be due to the fact that, as an air mass loaded with water vapour ascends vertically, the water vapour gradually condenses. Thus, clouds located at higher altitudes are formed from air masses with a lower water vapour content, and therefore both their geometric and optical thicknesses are smaller. Examples of this phenomenon are sub-visible cirrus clouds, which are the highest, coldest and thinnest clouds and have the lowest COD values.
On the other hand, the effective column lidar ratio increases with increasing cloud optical depth, a fact that has been observed in other studies (Chen et al., 2002; Dionisi et al., 2013). It is known that the effective column lidar ratio indicates the complexity of the ice crystal shape and aspect ratio (Sassen, 1978; Takano and Liou, 1995). When the complexity of the ice crystal shape and diversity increases, the effective column lidar ratio also increases (Seifert et al., 2007). Having clouds with a higher COD implies that the cloud base height is at lower levels, as mentioned above, so that there are larger and more irregular ice particles due to collisions and turbulence, increasing the effective column lidar ratio (He et al., 2013). This phenomenon is also seen, for example, in sub-visible cirrus clouds, which generally have the lowest LR values.
Likewise, the linear cloud depolarization ratio has a slightly positive tendency with the cloud optical depth, which is negligible because of its low R2 of 0.03. Moreover, Chen et al. (2002) found an opposite tendency. Despite that, a positive tendency between the LCDR and COD could make sense due to the fact that, as the COD increases, the number of ice crystals increases and, as a consequence, the random aggregation of ice crystals within the cloud occurs more frequently. As the ice crystals increase in size, they become rougher, and consequently depolarization increases (Yang et al., 2000).
To conclude this section, Fig. 7 shows the relationship between the linear cloud depolarization ratio and the effective column lidar ratio calculated with the two-way transmittance method, classifying the cirrus clouds according to the Sassen and Cho (1992) criteria.
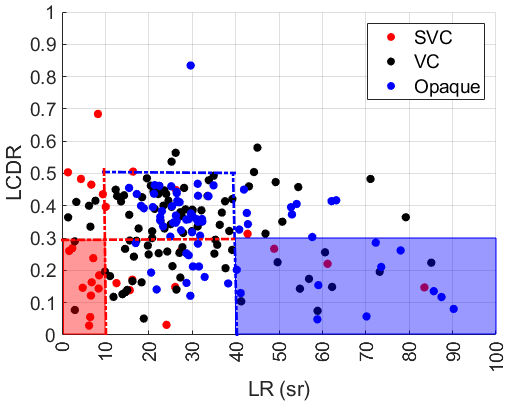
Figure 7Dependence of the linear cloud depolarization ratio with the effective column lidar ratio and the cloud optical depth for cirrus cases from 2018 to 2022 in Barcelona. The rectangles indicate the areas where the LCDR is lower than 0.3 and for effective column lidar ratio values out of the known range for cirrus clouds.
In Fig. 7 it can be seen that there is no linear dependence between the linear cloud depolarization ratio and the effective column lidar ratio of the cirrus clouds. At the same time, all three types of cirrus clouds are found in all sectors of the scatterplot, with more or less frequency. On the one hand, in the red sector, sub-visible cirrus clouds clearly dominate and are the highest, coldest and thinnest clouds. Because of their geometrical and optical properties, the possibility that these cirrus clouds could contain liquid water is ruled out. On the other hand, visible and opaque cirrus clouds control the blue sector. The percentage of cirrus found in this area is 12 %. As one cloud type does not predominate, the geometrical properties of this sub-group have been analysed, showing an average cloud base temperature of −41.32 ± 8.62 ∘C, which is lower than the homogeneous nucleation temperature of −38.15 ∘C (Tanaka and Kimura, 2019) and makes the presence of aqueous content in these cirrus clouds impossible. However, eight cases have been found with a temperature above −38.15∘C and an average cloud base height of 7.91 ± 0.68 km. Therefore, in these eight cases the presence of liquid water cannot be ruled out. Except for these eight cases, the validation of the cloud identification criteria proposed in this study can be successfully concluded.
In this study, the cirrus geometrical and optical properties of 4 years of continuous ground-base lidar measurements with the Barcelona MPL were analysed, applying the two-way transmittance method. First, a review of the literature on the two-way transmittance method which provides cirrus cloud retrievals like the cloud optical depth, the columnar cloud lidar ratio or the vertical profile of the particle backscatter coefficient was presented. The different approaches that have been developed during the year and the main advantages and disadvantages of this method were also explained. For example, one of the major advantages of this new approach of the method was that it is only necessary to assume a Rayleigh zone both above and below the cirrus cloud, without making any a priori optical and/or microphysical hypotheses about the cirrus cloud. Second, a simple mathematical development of the two-way transmittance method for ground-based and spaceborne lidar systems was proposed and was first illustrated for a cirrus cloud in Barcelona, using measurements from the MPL and CALIOP lidars. The results of the two-way transmittance method fitted really well, obtaining a difference in COD for the same cirrus cloud of 0.02. Third, a criterion set for cirrus cloud identification was established that consists of Tbase < −37∘C and CBH > 7 km, and it was compared with the literature. After having carried out the identification of 367 high-altitude cirrus clouds measured with the MPL in Barcelona from November 2018 to September 2022, the two-way transmittance method was applied successfully to 55 % of all the cases. Unsuccessful cases were due to the impossibility of guaranteeing a Rayleigh zone below and above the cirrus cloud, a negative COD and/or a LR higher than 100 sr. Also, it could be observed that the efficiency of the method decreased notably in summer, and during the other seasons it remained relatively stable. The cirrus geometrical, thermal and optical properties were CT = 1.8 ± 1.1 km, Tm = −51 ± 8 ∘C, COD = 0.36 ± 0.45, LR = 30 ± 19 sr and LCDR = 0.32 ± 0.13. An error analysis of the cirrus cloud retrievals was carried out, showing that the mean and standard deviation of the errors were COD = 0.16 ± 0.20, LR = 0.28 ± 0.84 sr and LCDR = LCDR = 0.18 ± 0.31. It was also found that the highest occurrence of cirrus clouds was in spring. Moreover, it was seen that, in the warmer seasons, opaque cirrus clouds were more frequent than visible cirrus clouds. In addition, these properties were compared with the literature, obtaining similar properties at nearby latitudes, with the majority of visible and opaque cirrus clouds being present. Fourth, the efficiency of the two-way transmittance method and the properties of the cirrus clouds proved to be independent of the day and night conditions. The sub-visible cirrus clouds were be the highest, coldest and thinnest clouds; the visible cirrus clouds were predominant and the opaque cirrus clouds were the lowest, warmest and thickest clouds in the whole cirrus dataset. It was also seen that the cloud top height did not vary considerably depending on the type of cloud, since the cirrus clouds might reach the tropopause, with its average height of 11 ± 1 km during the cirrus scenes. The correlations between the different cirrus properties were then analysed and quantified for the first time, with the highest correlation being R2=0.26 between Tbase and COD. The analysis showed that the COD correlates positively with the cloud base temperature, lidar ratio and linear cloud depolarization ratio and negatively with the cloud base height. Finally, the dependence of the LCDR on COD and LR was studied, and it was concluded, on the one hand, that cirrus clouds with LCDR values lower than 0.3 and an LR lower than 10 sr were mostly sub-visible cirrus clouds and, as a consequence, the possibility of liquid water in them was ruled out. On the other hand, the majority of cirrus clouds with LCDR values lower than 0.3 and an LR higher than 40 sr, except for eight cases, had a cloud base temperature lower than the homogeneous nucleation temperature, making the presence of liquid water impossible. Except for these eight cases, the validation of the cloud identification criteria proposed in this study could be successfully concluded. The information presented in this work is of great use for gaining a better understanding of the properties of cirrus clouds, their spatial distribution at the global scale and the key processes which govern cirrus formation and evolution. This study can also help development of new parameterizations of cirrus clouds to obtain their optical, microphysical and radiative properties and parameterizations of new cirrus cloud products obtained with spaceborne or ground-based lidar instruments.
The MPLNET products are publicly available on the MPLNET website (https://mplnet.gsfc.nasa.gov/download_tool/, MPLNET, 2023) in accordance with the data policy statement. The CALIPSO product is provided by the NASA Langley Research Center (LaRC) ASDC DAAC and is managed by the NASA Earth Science Data and Information System (ESDIS) project. NASA data are freely accessible and available on the Atmospheric Science Data Center website (https://opendap.larc.nasa.gov/opendap/CALIPSO/LID_L1-Standard-V4-10/contents.html, NASA, 2023). Radiosounding data are available upon request from the authors or from Meteocat (smc.meteocat@gencat.cat).
CGD prepared the automatic algorithm for the identification of cirrus clouds and the application of the two-way transmittance method for MPL and radiosonde data. CGD prepared the figures of the paper. MS, AC, CMP, ARG SL, JRL and EJW reviewed different parts of the results. DCFdSO took care of the maintenance of the MPL. CGD and MS prepared the paper, with contributions from all the co-authors.
At least one of the (co-)authors is a member of the editorial board of Atmospheric Measurement Techniques. The peer-review process was guided by an independent editor, and the authors also have no other competing interests to declare.
Publisher's note: Copernicus Publications remains neutral with regard to jurisdictional claims made in the text, published maps, institutional affiliations, or any other geographical representation in this paper. While Copernicus Publications makes every effort to include appropriate place names, the final responsibility lies with the authors.
The authors acknowledge the support of the ACTRIS European Research Infrastructure Consortium (ERIC).
This research has been partly funded by the Spanish Agencia Estatal de Investigación (grant no. PID2019-103886RB-I00) and the European Commission through the Horizon 2020 Programme (project ACTRIS IMP, grant agreement no. 871115; ATMO-ACCESS, grant agreement no. 101008004; GRASP-ACE, grant agreement no. 778349) and through the Horizon Europe Programme (project REALISTIC, grant agreement no. 101086690).
This paper was edited by Alexander Kokhanovsky and reviewed by three anonymous referees.
Baran, A. J., Connolly, P. J., and Lee, C.: Testing an ensemble model of cirrus ice crystals using midlatitude in situ estimates of ice water content, volumen extinction coefficient and the total solar optical depth, Q. J. Roy. Meteor. Soc., 110, 1579–1598, 2009. a
Baran, A. J., Bodas-Salcedo, A., Cotton, R., and Lee, C.: Simulating the equivalent radar reflectivity of cirrus at 94 GHz using an ensemble model of cirrus ice crystals: a test of the Met Office global numerical weather prediction model, Q. J. Roy. Meteor. Soc., 137, 1547–1560, 2011a. a
Baran, A. J., Connolly, P. J., Heymsfield, A. J., and Bansemer, A.: Using in situ estimates of ice water content, volume extinction coefficient, and the total solar optical depth obtained during the tropical ACTIVE campaign to test an ensemble model of cirrus ice crystals, Q. J. Roy. Meteor. Soc., 137, 199–218, 2011b. a
Behrendt, A.: Temperature Measurements with Lidar, in: Lidar, Springer Series in Optical Sciences, edited by: Weitkamp, C., vol. 102, Springer, New York, NY, https://doi.org/10.1007/0-387-25101-4_10, 2005. a
Behrendt, A. and Nakamura, T.: Calculation of the calibration constant of polarization lidar and its dependency on atmospheric temperature, Opt. Express, 10, 805–817, 2002. a, b
Cadet, B., Giraud, V., Keckhut, P., Rechou, A., and Baldy, S.: Improved retrievals of the optical properties of cirrus clouds by a combination of lidar methods, Appl. Optics, 44, 1726–1734, https://doi.org/10.1364/ao.44.001726, 2005. a, b, c, d
Campbell, J. R., Hlavka, D. L., Welton, E. J., Flynn, C. J., Turner, D. D., Spinhirne, J. D., Stanley, V., Iii, S., and Hwang, I. H.: Full-Time, Eye-Safe Cloud and Aerosol Lidar Observation at Atmospheric Radiation Measurement Program Sites: Instruments and Data Processing, J. Atmos. Ocean. Tech., 19, 431–442, https://doi.org/10.1175/1520-0426(2002)019<0431:FTESCA>2.0.CO;2, 2002. a, b, c, d, e
Campbell, J. R., Vaughan, M. A., Oo, M., Holz, R. E., Lewis, J. R., and Welton, E. J.: Distinguishing cirrus cloud presence in autonomous lidar measurements, Atmos. Meas. Tech., 8, 435–449, https://doi.org/10.5194/amt-8-435-2015, 2015. a, b, c, d, e
Campbell, J. R., Lolli, S., Lewis, J. R., Gu, Y., and Welton, E. J.: Daytime Cirrus Cloud Top-of-Atmosphere Radiative Forcing Properties at a Midlatitude Site and their Global Consequence, J. Appl. Meteorol. Clim., 55, 1667–1679, https://doi.org/10.1175/JAMC-D-15-0217.1, 2016. a, b, c
Campbell, J. R., Peterson, D. A., Marquis, J. W., FoChesatto, G. J., Vaughan, M. A., Stewart, S. A., Tackett, J. L., Lolli, S., Lewis, J. R., Oyola, M. I., and Welton, E. J.: Unusually deep wintertime cirrus clouds observed over the Alaskan subarctic, B. Am. Meteor. Soc, 99, 27–32, https://doi.org/10.1175/BAMS-D-17-0084.1, 2018. a
Chazette, P. and Raut, J.-C.: Raman lidar-derived optical and microphysical properties of ice crystals within thin Arctic clouds during PARCS campaign, Atmos. Meas. Tech., 16, 5847–5861, https://doi.org/10.5194/amt-16-5847-2023, 2023. a
Chen, B. and Liu, X.: Seasonal migration of cirrus clouds over the Asian Monsoon regions and the Tibetan Plateau measured from MODIS/Terra, Geophys. Res. Lett., 32, L01804, https://doi.org/10.1029/2004GL020868, 2005. a
Chen, W.-N., Chiang, C.-W., and Nee, J.-B.: Lidar ratio and depolarization ratio for cirrus clouds, Appl. Optics, 41, 6470–6476, 2002. a, b, c, d, e, f, g
Cooke, C. S., Bethke, G. W., and Conner, W. D.: Remote measurement of smoke plume transmittance using lidar, Appl. Optics, 8, 1742–1748, 1972. a, b, c
Córdoba-Jabonero, C., Lopes, F. J. S., Landulfo, E., Cuevas, E., Ochoa, H., and Gil-Ojeda, M.: Diversity on subtropical and polar cirrus clouds properties as derived from both ground-based lidars and CALIPSO/CALIOP measurements. Atmos. Res., 183, 151–165, https://doi.org/10.1016/j.atmosres.2016.08.015, 2017. a, b, c
Das, S. K., Nee, J. B., and Chiang, C. W.: A LiDAR study of the effective size of cirrus ice crystals over Chung-Li, Taiwan, J. Atmos. Terr. Phys., 72, 781–788, https://doi.org/10.1016/j.jastp.2010.03.024, 2010. a
Del Guasta, M.: Errors in the retrieval of thin-cloud optical parameters obtained with a two-boundary algorithm, Appl. Optics, 37, 5522–5540, 1998. a, b
Dionisi, D., Keckhut, P., Liberti, G. L., Cardillo, F., and Congeduti, F.: Midlatitude cirrus classification at Rome Tor Vergata through a multichannel Raman–Mie–Rayleigh lidar, Atmos. Chem. Phys., 13, 11853–11868, https://doi.org/10.5194/acp-13-11853-2013, 2013. a, b
Dolinar, E. K., Campbell, J. R., Marquis, J. W., Garnier, A. E., and Karpowicz, B. M.: Novel Parameterization of Ice Cloud Effective Diameter from Collocated CALIOP-IIR and CloudSat Retrievals, J. Appl. Meteorol. Clim., 61, 891–907, https://doi.org/10.1175/JAMC-D-21-0163.1, 2022. a
Dowling, D. R. and Radke, L. F.: A summary of the physical properties of cirrus clouds, J. Appl. Meteorol., 29, 970–978, 1990. a, b
Eisinger, M., Maeusli, D., and Lefebvre, A.: EarthCARE Project Ground Segment EarthCARE Production Model, European Space Agency, Doc. No. EC-TN-ESA-SYS-0380, 1–9, https://earth.esa.int/eogateway/documents/20142/37627/Earth CARE-Production-Model.pdf (last access: 3 June 2023), 2017. a
Elouragini, S. and Flamant, P. H.: Iterative method to determine an averaged backscatter-to-extinction ratio in cirrus clouds, Appl. Optics, 35, 1512–1518, 1996. a, b, c
Evans, W. E.: Final report, Stanford Research Institute Project 6529, 1967. a, b
Fernald, F. G.: Analysis of atmospheric lidar observations: Some comments, Appl. Optics, 23, 652–653, https://doi.org/10.1364/AO.23.000652, 1984. a
Fernald, F. G., Herman, B. M., and Reagan, J. A.: Determination of aerosol height distributions by lidar, J. Appl. Meteorol., 11, 482–489, 1972. a
Flynn, C. J., Mendoza, A., Zheng, Y., and Mathur, S.: Novel polarization-sensitive micropulse lidar measurement technique, Opt. Express, 15, 2785–2790, 2007. a, b
Freudenthaler, V., Esselborn, M., Wiegner, M., Heese, B., Tesche, M., Ansmann, A., Muller, D., Althausen, D., Wirth, M., Fix, A., Ehret, G., Knippertz, P., Toledano, C., Gasteiger, J., Garhammar, M., and Seefeldner, M.: Depolarization ratio profiling at several wavelengths in pure Saharan dust during SAMUM 2006, Tellus B, 61, 165–179, https://doi.org/10.1111/j.1600-0889.2008.00396.x, 2009. a
Fu, Q., Yang, P., and Sun, W. B.: An accurate parameterization of the infrared radiative properties of cirrus clouds for climate models, J. Climate, 11, 2223–2237, https://doi.org/10.1175/1520-0442(1998)011<2223:AAPOTI>2.0.CO;2, 1998. a
Fu, Q., Sun, W. B., and Yang, P.: Modeling of scattering and absorption by nonspherical cirrus ice particles at thermal infrared wavelengths, J. Atmos. Scie., 56, 2937–2947, https://doi.org/10.1175/1520-0469(1999)056<2937:MOSAAB>2.0.CO;2, 1999. a
Fu, R., Hu, Y., Wright, J. S., Jiang, J. H., Dickinson, R. E., Chen, M., Filipiak, M., Read, W. G., Waters, J. W., and Wu, D. L.: Short circuit of water vapor and polluted air to the global stratosphere by convective transport over the Tibetan Plateau, P. Natl. Acad. Sci. USA, 103, 5664–5669, https://doi.org/10.1073/pnas.0601584103, 2006. a, b
Garnier, A., Pelon, J., Vaughan, M. A., Winker, D. M., Trepte, C. R., and Dubuisson, P.: Lidar multiple scattering factors inferred from CALIPSO lidar and IIR retrievals of semi-transparent cirrus cloud optical depths over oceans, Atmos. Meas. Tech., 8, 2759–2774, https://doi.org/10.5194/amt-8-2759-2015, 2015. a, b
Giannakaki, E., Balis, D. S., Amiridis, V., and Kazadzis, S.: Optical and geometrical characteristics of cirrus clouds over a Southern European lidar station, Atmos. Chem. Phys., 7, 5519–5530, https://doi.org/10.5194/acp-7-5519-2007, 2007. a, b, c, d, e
Gouveia, D. A., Barja, B., Barbosa, H. M. J., Seifert, P., Baars, H., Pauliquevis, T., and Artaxo, P.: Optical and geometrical properties of cirrus clouds in Amazonia derived from 1 year of ground-based lidar measurements, Atmos. Chem. Phys., 17, 3619–3636, https://doi.org/10.5194/acp-17-3619-2017, 2017. a
Granados-Muñoz, M. J., Sicard, M., Papagiannopoulos, N., Barragán, R., Bravo-Aranda, J. A., and Nicolae, D.: Two-dimensional mineral dust radiative effect calculations from CALIPSO observations over Europe, Atmos. Chem. Phys., 19, 13157–13173, https://doi.org/10.5194/acp-19-13157-2019, 2019. a
He, Q. S., Li, C. C., Ma, J. Z., Wang, H. Q., Shi, G. M., Liang, Z. R., Luan, Q., Geng, F. H., and Zhou, X. W.: The properties and formation of cirrus clouds over the Tibetan Plateau based on summertime lidar measurements, J. Atmos. Sci., 70, 901–915, https://doi.org/10.1175/JAS-D-12-0171.1, 2013. a, b
Heymsfield, A., Winker, D., Avery, M., Vaughan, M., Diskin, G., Deng, M., Mitev, V., and Matthey, R.: Relationships between ice water content and volume extinction coefficient from in situ observations for temperatures from 0∘ to −86 ∘C: Implications for spacebornelidar retrievals, J. Appl. Meteorol. Clim., 53, 479–505, 2014. a
Hoareau, C., Keckhut, P., Noel, V., Chepfer, H., and Baray, J.-L.: A decadal cirrus clouds climatology from ground-based and spaceborne lidars above the south of France (43.9∘ N–5.7∘ E), Atmos. Chem. Phys., 13, 6951–6963, https://doi.org/10.5194/acp-13-6951-2013, 2013. a
Holz, R. E., Ackerman, S. A., Nagle, F. W., Frey, R., Dutcher, S., Kuehn, R. E., Vaughan, M. A., and Baum, B.: Global Moderate Resolution Imaging Spectroradiometer (MODIS) cloud detection and height evaluation using CALIOP, J. Geophys. Res., 113, D00A19, https://doi.org/10.1029/2008JD009837, 2008. a
Hostetler, C. A., Liu, Z., and Reagan, J.: Calibration and Level 1 Data Products, CALIOP Algorithm and Theoretical Basis Document, Release 1 (April), PC-SCI-201, 1–66, https://ccplot.org/pub/resources/CALIPSO/CALIOP%20 Algorithm%20Theoretical%20Basis%20Document/PC-SCI-201%20Calibration%20and%20Level%201%20Data%20 Products.pdf (last access: 3 June 2023), 2006. a
Hu, Q., Goloub, P., Veselovskii, I., and Podvin, T.: The characterization of long-range transported North American biomass burning plumes: what can a multi-wavelength Mie–Raman-polarization-fluorescence lidar provide?, Atmos. Chem. Phys., 22, 5399–5414, https://doi.org/10.5194/acp-22-5399-2022, 2022. a
Hu, Y., Winker, D., Vaughan, M., Lin, B., Omar, A., Trepte, C., Flittner, D., Yang, P., Nasiri, S. L., Baum, B., Holz, R., Sun, W., Liu, Z., Wang, Z., Young, S., Stamnes, K., Huang, J., and Kuehn, R.: CALIPSO/CALIOP cloud phase discrimination algorithm, J. Atmos. Ocean. Tech., 26, 2293–2309, https://doi.org/10.1175/2009JTECHA1280.1, 2009. a, b
Huang, Z., Huang, J., Bi, J., Wang, G., Wang, W., Fu, Q., Li, Z., Tsay, S.-C., and Shi, J.: Dust aerosol vertical structure measurements using three MPL lidars during 2008 China-U.S. joint dust field experiment, J. Geophys. Res., 115, D00K15, https://doi.org/10.1029/2009JD013273, 2010. a
Ingmann, P. and Straume, A. G.: ADM-Aeolus Mission Requirements Document, European Space Agency, 2, 57, https://esamultimedia.esa.int/docs/EarthObservation/ADM-Aeolus_MRD.pdf (last access: 3 June 2023), 2016. a
IPCC: Climate Change 2021: The Physical Science Basis. Contribution of Working Group I to the Sixth Assessment Report of the Intergovernmental Panel on Climate Change, edited by: Masson-Delmotte, V., Zhai, P., Pirani, A., Connors, S. L., Péan, C., Berger, S., Caud, N., Chen, Y., Goldfarb, L., Gomis, M. I., Huang, M., Leitzell, K., Lonnoy, E., Matthews, J. B. R., Maycock, T. K., Waterfield, T., Yelekçi, O., Yu, R., and Zhou, B., Cambridge University Press, Cambridge, United Kingdom and New York, NY, USA, https://doi.org/10.1017/9781009157896, 2023. a
Jin, M. L.: MODIS observed seasonal and interannual variations of atmospheric conditions associated with hydrological cycle over Tibetan Plateau, Geophys. Res. Lett., 33, L19707, https://doi.org/10.1029/2006GL026713, 2006. a, b
Josset, D., Pelon, J., Garnier, A., Hu, Y.-X., Vaughan, M., Zhai, P., Kuehn, R., and Lucker, P.: Cirrus optical depth and lidar ratio retrieval from combined CALIPSO-CloudSat observations using ocean surface echo, J. Geophys. Res., 117, D05207, https://doi.org/10.1029/2011JD016959, 2012. a
Kar, J., Vaughan, M. A., Lee, K.-P., Tackett, J. L., Avery, M. A., Garnier, A., Getzewich, B. J., Hunt, W. H., Josset, D., Liu, Z., Lucker, P. L., Magill, B., Omar, A. H., Pelon, J., Rogers, R. R., Toth, T. D., Trepte, C. R., Vernier, J.-P., Winker, D. M., and Young, S. A.: CALIPSO lidar calibration at 532 nm: version 4 nighttime algorithm, Atmos. Meas. Tech., 11, 1459–1479, https://doi.org/10.5194/amt-11-1459-2018, 2018. a
Kienast-Sjögren, E., Rolf, C., Seifert, P., Krieger, U. K., Luo, B. P., Krämer, M., and Peter, T.: Climatological and radiative properties of midlatitude cirrus clouds derived by automatic evaluation of lidar measurements, Atmos. Chem. Phys., 16, 7605–7621, https://doi.org/10.5194/acp-16-7605-2016, 2016. a
Kim, M.-H., Omar, A. H., Tackett, J. L., Vaughan, M. A., Winker, D. M., Trepte, C. R., Hu, Y., Liu, Z., Poole, L. R., Pitts, M. C., Kar, J., and Magill, B. E.: The CALIPSO version 4 automated aerosol classification and lidar ratio selection algorithm, Atmos. Meas. Tech., 11, 6107–6135, https://doi.org/10.5194/amt-11-6107-2018, 2018. a
Klett, J. D.: Stable analytical inversion solution for processing lidar returns, Appl. Optics, 20, 211–220, 1981. a
Klett, J. D.: Lidar inversion with variable backscatter/extinction ratios, Appl. Optics, 20, 1638–1645, 1985. a
Kovalev, V. A.: Lidar measurement of the vertical aerosol extinction profiles with range-dependent backscatter-to-extinction ratios, Appl. Optics, 32, 6053–6065, 1993. a
Ku, H. H.: Notes on the use of propagation of error formulas, J. Res. Natl. Bur. Stand. Sect. C Eng. Instrum., 70C, p. 263, 1966. a
Lakkis, S. G., Lavorato, M., Canziani, P., and Lacomi, H.: Lidar observations of cirrus clouds in Buenos Aires, J. Atmos. Sol.-Terr. Phy., 130–131, 89–95, https://doi.org/10.1016/j.jastp.2015.05.020, 2015. a
Lee, J., Yang, P., Dessler, A. E., Gao, B. C., and Platnick, S.: Distribution and radiative forcing of tropical thin cirrus clouds, J. Atmos. Sci., 66, 3721–3731, https://doi.org/10.1175/2009JAS3183.1, 2009. a
Lewis, J. R., Campbell, J. R., Welton, E. J., Stewart, S. A., and Haftings, P. C.: Overview of MPLNET version 3 cloud detection, J. Atmos. Ocean. Tech., 33, 2113–2134, https://doi.org/10.1175/JTECH-D-15-0190.1, 2016. a, b, c
Lewis, J. R., Campbell, J. R., Stewart, S. A., Tan, I., Welton, E. J., and Lolli, S.: Determining cloud thermodynamic phase from the polarized Micro Pulse Lidar, Atmos. Meas. Tech., 13, 6901–6913, https://doi.org/10.5194/amt-13-6901-2020, 2020. a
Li, Q., Jiang, J. H., Wu, D. L., Read, W. G., Livesey, N. J., Waters, J. W., Zhang, Y., Wang, B., Filipiak, M. J., Davis, C. P., Turquety, S., Wu, S., Park, R. J., Yantosca, R. M., and Jacob, D. J.: Convective outflow of South Asian pollution: A global CTM simulation compared with EOS MLS observations, Geophys. Res. Lett., 32, 1–4, https://doi.org/10.1029/2005GL022762, 2005. a, b
Li, Y., Mahnke, C., Rohs, S., Bundke, U., Spelten, N., Dekoutsidis, G., Groß, S., Voigt, C., Schumann, U., Petzold, A., and Krämer, M.: Upper-tropospheric slightly ice-subsaturated regions: frequency of occurrence and statistical evidence for the appearance of contrail cirrus, Atmos. Chem. Phys., 23, 2251–2271, https://doi.org/10.5194/acp-23-2251-2023, 2023. a
Liou, K. N.: The influence of cirrus on weather and climate processes: A global perspective, Mon. Weather Rev., 114, 1167–1199, https://doi.org/10.1175/1520-0493(1986)114<1167:IOCCOW>2.0.CO;2, 1986. a
Liou, K. N. and Takano, Y.: Light scattering by nonspherical particles: Remote sensing and climate implications, Atmos. Res., 31, 271–298, 1994. a
Lolli, S., Campbell, J. R., Lewis, J. R., Gu, Y., Marquis, J. W., Chew, B. N., Liew, S., Salinas, S. V., and Welton, E. J.: Daytime Top-of-the-Atmosphere Cirrus Cloud Radiative Forcing Properties at Singapore, J. Appl. Meteorol. Clim., 56, 1249–1257, https://doi.org/10.1175/JAMC-D-16-0262.1, 2017. a
Martins, E., Noel, V., and Chepfer, H.: Properties of cirrus and subvisible cirrus from nighttime Cloud-Aerosol Lidar with Orthogonal Polarization (CALIOP), related to atmospheric dynamics and water vapor, J. Geophys. Res., 116, D02208, https://doi.org/10.1029/2010JD014519, 2011. a
McClatchey, R. A., Fenn, R. W., Shelby, J. E. A., Voltz, F. E., and Garing, J. S.: Optical properties of the atmosphere, Hanscom Air Force Base, Bedford, Research paper AFCRF-72-0497, 108 pp., 1972. a
Miller, D. J., Sun, K., Zondlo, M. A., Kanter, D., Dubovik, O., Welton, E. J., Winker, D. M., and Ginoux, P.: Assessing boreal forest fire smoke aerosol impacts on U.S. air quality: a case study using multiple datasets, J. Geophys. Res., 116, D22209, https://doi.org/10.1029/2011JD016170, 2011. a
Misra, A., Tripathi, S. N., Kaul, D., and Welton, E. J.: Study of MPLNET-Derived Aerosol Climatology over Kanpur, India, and Validation of CALIPSO Level 2 Version 3 Backscatter and Extinction Products, J. Atmos. Ocean. Tech., 29, 1285–1294, 2012. a
MPLNET: The NASA Micro-Pulse Lidar Network products publication, Goddard Space Flight Center [data set], https://mplnet.gsfc.nasa.gov/download_tool (last access: 8 June 2023), 2023. a
NASA/LARC/SD/ASDC: CALIPSO Lidar Level 1 Standard, V4-10, NASA Langley Atmospheric Science Data Center DAAC [data set], https://opendap.larc.nasa.gov/opendap/CALIPSO/LID_L1-Standard-V4-10/contents.html (last access: 8 June 2023), 2023. a
Nohra, R., Parol, F., and Dubuisson, P.: Comparison of Cirrus Cloud Characteristics as Estimated by A Micropulse Ground-Based Lidar and A Spaceborne Lidar CALIOP Datasets Over Lille, France (50.60∘ N, 3.14∘ E), EPJ Web Conf., 119, 16005, https://doi.org/10.1051/epjconf/201611916005, 2016. a, b, c, d, e, f, g, h, i, j
Pandit, A. K., Gadhavi, H. S., Venkat Ratnam, M., Raghunath, K., Rao, S. V. B., and Jayaraman, A.: Long-term trend analysis and climatology of tropical cirrus clouds using 16 years of lidar data set over Southern India, Atmos. Chem. Phys., 15, 13833–13848, https://doi.org/10.5194/acp-15-13833-2015, 2015. a, b
Pappalardo, G., Amodeo, A., Apituley, A., Comeron, A., Freudenthaler, V., Linné, H., Ansmann, A., Bösenberg, J., D'Amico, G., Mattis, I., Mona, L., Wandinger, U., Amiridis, V., Alados-Arboledas, L., Nicolae, D., and Wiegner, M.: EARLINET: towards an advanced sustainable European aerosol lidar network, Atmos. Meas. Tech., 7, 2389–2409, https://doi.org/10.5194/amt-7-2389-2014, 2014. a
Platt, C. M. R.: Lidar and radiometric observations of cirrus clouds, J. Atmos. Sci., 30, 1191–1204, 1973. a, b
Platt, C. M. R.: Remote sounding of high clouds: I. Calculation of visible and infrared optical properties from lidar and radiometer measurements, J. Appl. Meteorol., 18, 1130–1143, https://doi.org/10.1175/1520-0450(1979)018<1130:RSOHCI>2.0.CO;2, 1979. a
Platt, C. M. R., Young, S. A., Austin, R. T., Patterson, G. R., Mitchell, D. L., and Miller, S. D.: LIRAD observations of trop- ical cirrus clouds in MCTEX. Part I: Optical properties and detection of small particles in cold cirrus, J. Atmos. Sci, 59, 3145–3162, 2002. a
Reichardt, J.: Optical and geometrical properties of northern mid-latitude cirrus clouds observed with a UV Raman lidar, Phys. Chem. Earth B, 24, 255–260, 1999. a
Saponaro, G., Tukiainen, S., and Sorvari, S.: Deliverable 1.5 ACTRIS Stakeholder Handbook 2018 (Issue 2019), ACTRIS (Aerosol, Clouds and Trace Gases Research Infrastructure), ISBN 978-952-336-066-2, 2019. a
Sassen, K.: Backscattering cross sections for hydrometeors: Measurements at 6328 A, Appl. Optics, 17, 804–806, 1978. a
Sassen, K.: The polarization lidar technique for cloud research: A review and current assessment, B. Am. Meteorol. Soc., 72, 1848–1866, 1991. a
Sassen, K.: Polarization in lidar, Lidar, Springer Series in Optical Sciences, edited by: Weitkamp, C., Springer, New York, NY, USA, vol. 102, https://doi.org/10.1007/0-387-25101-4_2, 2005. a
Sassen, K. and Campbell, J. R.: A midlatitude cirrus cloud climatology from the Facility for Atmospheric Remote Sensing. Part I: Macrophysical and synoptic properties, J. Atmos. Sci., 58, 481–496, 2001. a, b, c, d, e, f, g
Sassen, K. and Cho, B. S.: Subvisual-thin cirrus lidar dataset for satellite verification and climatological research, J. Appl. Met., 31, 1275–1285, 1992. a, b, c, d, e
Sassen, K. and Comstock, J. M.: A midlatitude cirrus cloud climatology from the facility for atmospheric remote sensing. Part III: Radiative properties, J. Atmos. Sci., 58, 2113–2127, https://doi.org/10.1175/1520-0469(2001)058<2113:AMCCCF>2.0.CO;2, 2001. a, b, c
Schumann, U.: On conditions for contrail formation from aircraft exhausts, Meteorol. Z., 5, 4–23, https://doi.org/10.1127/metz/5/1996/4, 1996. a
Schumann, U. and Heymsfield, A.: On the lifecycle of individual contrails and contrail cirrus, Meteor. Monogr., 58, 3.1–3.24, https://doi.org/10.1175/AMSMONOGRAPHS-D-16-0005.1, 2017. a
Schumann, U., Poll, I., Teoh, R., Koelle, R., Spinielli, E., Molloy, J., Koudis, G. S., Baumann, R., Bugliaro, L., Stettler, M., and Voigt, C.: Air traffic and contrail changes over Europe during COVID-19: a model study, Atmos. Chem. Phys., 21, 7429–7450, https://doi.org/10.5194/acp-21-7429-2021, 2021. a
Seifert, P., Ansmann, A., Mu, D., Wandinger, U., Althausen, D., and Heymsfield, A. J.: Cirrus optical properties observed with lidar, radiosonde, and satellite over the tropical Indian Ocean during the aerosol-polluted northeast and clean maritime southwest monsoon, J. Geophys. Res., 112, 1–14, https://doi.org/10.1029/2006JD008352, 2007. a, b, c
Servei Meteorològic de Catalunya: El radiosondatge 3: una anàlisi de l'atmosfera, Valant 2003, S. L., 1st edn., Servei Meteorològic de Catalunya, Departament de Medi Ambient i Habitatge, Generalitat de Catalunya, https://static-m.meteo.cat/wordpressweb/wp-content/uploads/2014/11/18120559/Radiosondatge.pdf (last access: 3 June 2023), 2005. a
Shcherbakov, V., Szczap, F., Alkasem, A., Mioche, G., and Cornet, C.: Empirical model of multiple-scattering effect on single-wavelength lidar data of aerosols and clouds, Atmos. Meas. Tech., 15, 1729–1754, https://doi.org/10.5194/amt-15-1729-2022, 2022. a, b
Sourdeval, O., Brogniez, G., Pelon, J., Labonnote, L. C., Dubuisson, P., Parol, F., Josset, D., Garnier, A., Faivre, M., and Minikin, A.: Validation of IIR/CALIPSO Level 1 Measurements by Comparison with Collocated Airborne Observations During “CIRCLE-2” and “BISCAY 08” Campaigns, J. Atmos. Ocean. Tech., 29, 653–667, https://doi.org/10.1175/JTECH-D-11-00143.1, 2012. a
Spichtinger, P., Gierens, K., Leiterer, U., and Dier, H.: Ice supersaturation in the tropopause region over Lindenberg, Germany, Meteorol. Z., 12, 143–156, 2003. a, b
Spinhirne, J. D.: Micro pulse lidar, IEEE T. Geosci. Remote Sens., 31, 48–55, 1993. a
Takano, Y. and Liou, K. N.: Solar radiative transfer in cirrus clouds. Part III: Light scattering by irregular ice crystals, J. Atmos. Sci., 52, 818–837, 1995. a
Tanaka, K. K. and Kimura, Y.: Theoretical analysis of crystallization by homogeneous nucleation of water droplets, Phys. Chem. Chem. Phys., 21, 2410–2418, https://doi.org/10.1039/C8CP06650G, 2019. a
Vaughan, M., Garnier, A., Josset, D., Avery, M., Lee, K.-P., Liu, Z., Hunt, W., Pelon, J., Hu, Y., Burton, S., Hair, J., Tackett, J. L., Getzewich, B., Kar, J., and Rodier, S.: CALIPSO lidar calibration at 1064 nm: version 4 algorithm, Atmos. Meas. Tech., 12, 51–82, https://doi.org/10.5194/amt-12-51-2019, 2019. a
Voudouri, K. A., Giannakaki, E., Komppula, M., and Balis, D.: Variability in cirrus cloud properties using a PollyXT Raman lidar over high and tropical latitudes, Atmos. Chem. Phys., 20, 4427–4444, https://doi.org/10.5194/acp-20-4427-2020, 2020. a, b, c, d
Wandinger, U.: Multiple-scattering influence on extinction and backscatter coefficient measurements with Raman and high-spectral-resolution lidars, Appl. Optics, 37, 417, https://doi.org/10.1364/ao.37.000417, 1998. a
Wandinger, U., Tesche, M., Seifert, P., Ansmann, A., Müller, D., and Althausen, D.: Size matters: Influence of multiple scattering on CALIPSO light-extinction profiling in desert dust, Geophys. Res. Lett., 37, 1–5, https://doi.org/10.1029/2010GL042815, 2010. a
Welton, E. J. and Campbell, J. R.: Micro-pulse Lidar Signals: Uncertainty Analysis, J. Atmos. Ocean. Tech., 19, 2089–2094, 2002. a
Welton, E. J., Voss, K. J., Gordon, H. R., Maring, H., Smirnov, A., Holben, B., Schmid, B., Livingston, J. M., Russell, P. B., Durkee, P. A., Formenti, P., and Andreae, M. O.: Ground-based Lidar Measurements of Aerosols During ACE-2: Instrument Description, Results, and Comparisons with other Ground-based and Airborne Measurements, Tellus B, 52, 635–650, 2000. a
Welton, E. J., Campbell, J. R., Spinhirne, J. D. and Scott, V. S.: Global monitoring of clouds and aerosols using a network of micro-pulse lidar systems, Proc. SPIE, 4153, 151–158, https://doi.org/10.1117/12.417040, 2001. a, b, c
Welton, E. J., Voss, K. J., Quinn, P. K., Flatau, P. J., Markowicz, K., Campbell, J. R., Spinhirne, J. D., Gordon, H. R., and Johnson, J. E.: Measurements of aerosol vertical profiles and optical properties during INDOEX 1999 using micro-pulse lidars, J. Geophys. Res., 107, 8019, https://doi.org/10.1029/2000JD000038, 2002. a
Welton, E. J., Stewart, S. A., Lewis, J. R., Belcher, L. R., Campbell, J. R., and Lolli, S.: Status of the NASA Micro Pulse Lidar Network (MPLNET): Overview of the network and future plans, new Version 3 data products, and the polarized MPL, EPJ Web Conf., 176, 09003, https://doi.org/10.1051/epjconf/201817609003, 2018. a, b
Winker, D. M., Hunt, W. H., and McGill, M. J.: Initial performance assessment of CALIOP, Geophys. Res. Lett., 34, L19803, https://doi.org/10.1029/2007GL030135, 2007. a
World Meteorological Organization: Definition of the tropopause, WMO Bull., 6, 136–137, 1957. a
Yang, P., Liou, K. N., Wyser, K., and Mitchell, D.: Parameterization of the scattering and absorption properties of individual ice crystals, J. Geophys. Res.-Atmos., 105, 4699–4718, https://doi.org/10.1029/1999JD900755, 2000. a
Yorks, J. E., Hlavka, D. L., Hart, W. D., and McGill, M. J.: Statistics of cloud optical properties from airborne lidar measurements, J. Atmos. Ocean. Tech., 28, 869–883, https://doi.org/10.1175/2011JTECHA1507.1, 2011. a, b, c, d, e, f
Young, S. A.: Analysis of lidar backscatter profiles in optically thin clouds, Appl. Optics, 34, 7019–7031, https://doi.org/10.1364/AO.34.007019, 1995. a, b, c
Young, S. A. and Vaughan, M. A.: The retrieval of profiles of particulate extinction from Cloud-Aerosol Lidar Infrared Pathfinder Satellite Observations (CALIPSO) data: algorithm description, J. Atmos. Ocean. Tech., 26, 1105–1119, 2009. a