the Creative Commons Attribution 4.0 License.
the Creative Commons Attribution 4.0 License.
 | 26 Feb 2024
Exploiting the entire near-infrared spectral range to improve the detection of methane plumes with high-resolution imaging spectrometers
Javier Roger
Luis Guanter
Javier Gorroño
Itziar Irakulis-Loitxate
Remote sensing emerges as an important tool for the detection of methane plumes emitted by so-called point sources, which are common in the energy sector (e.g., oil and gas extraction and coal mining activities). In particular, satellite imaging spectroscopy missions covering the shortwave infrared part of the solar spectrum are very effective for this application. These instruments sample the methane absorption features at the spectral regions around 1700 and 2300 nm, which enables the retrieval of methane concentration enhancements per pixel. Data-driven retrieval methods, in particular those based on the matched filter concept, are widely used to produce maps of methane concentration enhancements from imaging spectroscopy data. Using these maps enables the detection of plumes and the subsequent identification of active sources. However, retrieval artifacts caused by particular surface components may sometimes appear as false plumes or disturbing elements in the methane maps, which complicates the identification of real plumes. In this work, we use a matched filter that exploits a wide spectral window (1000–2500 nm) instead of the usual 2100–2450 nm window with the aim of reducing the occurrence of retrieval artifacts and background noise. This enables a greater ability to discriminate between surface elements and methane. The improvement in plume detection is evaluated through an analysis derived from both simulated data and real data from areas including active point sources, such as the oil and gas (O&G) industry from San Joaquin Valley (US) and the coal mines from the Shanxi region (China). We use datasets from the Precursore IperSpettrale della Missione Applicativa (PRISMA) and the Environmental Mapping and Analysis Program (EnMAP) satellite imaging spectrometer missions and from the Airborne Visible/Infrared Imaging Spectrometer – Next Generation (AVIRIS-NG) instrument. We find that the interference with atmospheric carbon dioxide and water vapor is generally almost negligible, while co-emission or overlapping of these trace gases with methane plumes leads to a reduction in the retrieved concentration values. Attenuation will also occur in the case of methane emissions situated above surface structures that are associated with retrieval artifacts. The results show that the new approach is an optimal trade-off between the reduction in background noise and retrieval artifacts. This is illustrated by a comprehensive analysis in a PRISMA dataset with 15 identified plumes, where the output mask from an automatic detection algorithm shows an important reduction in the number of clusters not related to CH4 emissions.
- Article
(9910 KB) - Full-text XML
- BibTeX
- EndNote


Since pre-industrial times, the concentration of methane (CH4) in the atmosphere has increased by more than 150 % to a globally averaged value of 1920 parts per billion (ppb) in early 2023 (Lan et al., 2023). CH4 is the second most important anthropogenic greenhouse gas and has been estimated as being responsible for almost a third of the warming of the planet so far (Masood et al., 2021). In addition, because of its short lifetime and its relatively fast mitigation potential (Ocko et al., 2021), reducing atmospheric CH4 concentration is the most efficient way to curb global warming (Ming et al., 2022).
A great portion of the increase in CH4 concentration in the atmosphere is due to the growth of anthropogenic emissions from sectors such as agriculture, waste management, coal mining, and the oil and gas (O&G) industry. The O&G industry produces approximately 33 % of total anthropogenic emissions and has been identified as one of the sectors with the highest potential to reduce emissions (UNEP, 2021), which is also generally considered cost-effective (Mayfield et al., 2017).
An important fraction of the emissions from fossil fuels comes from CH4 point sources (Duren et al., 2019). In this context, satellites have proven to be instrumental in detecting CH4 plumes that originated in this manner. Satellite imaging spectrometers in particular can leverage the CH4 absorption features in the shortwave infrared (SWIR) region, where there is a weak and strong absorption window around the 1700 and 2300 nm spectral wavelengths (λ), respectively (see Fig. 1). Spaceborne measurements of the solar radiation reflected by the Earth's surface can be used to derive CH4 concentration enhancements from these features.
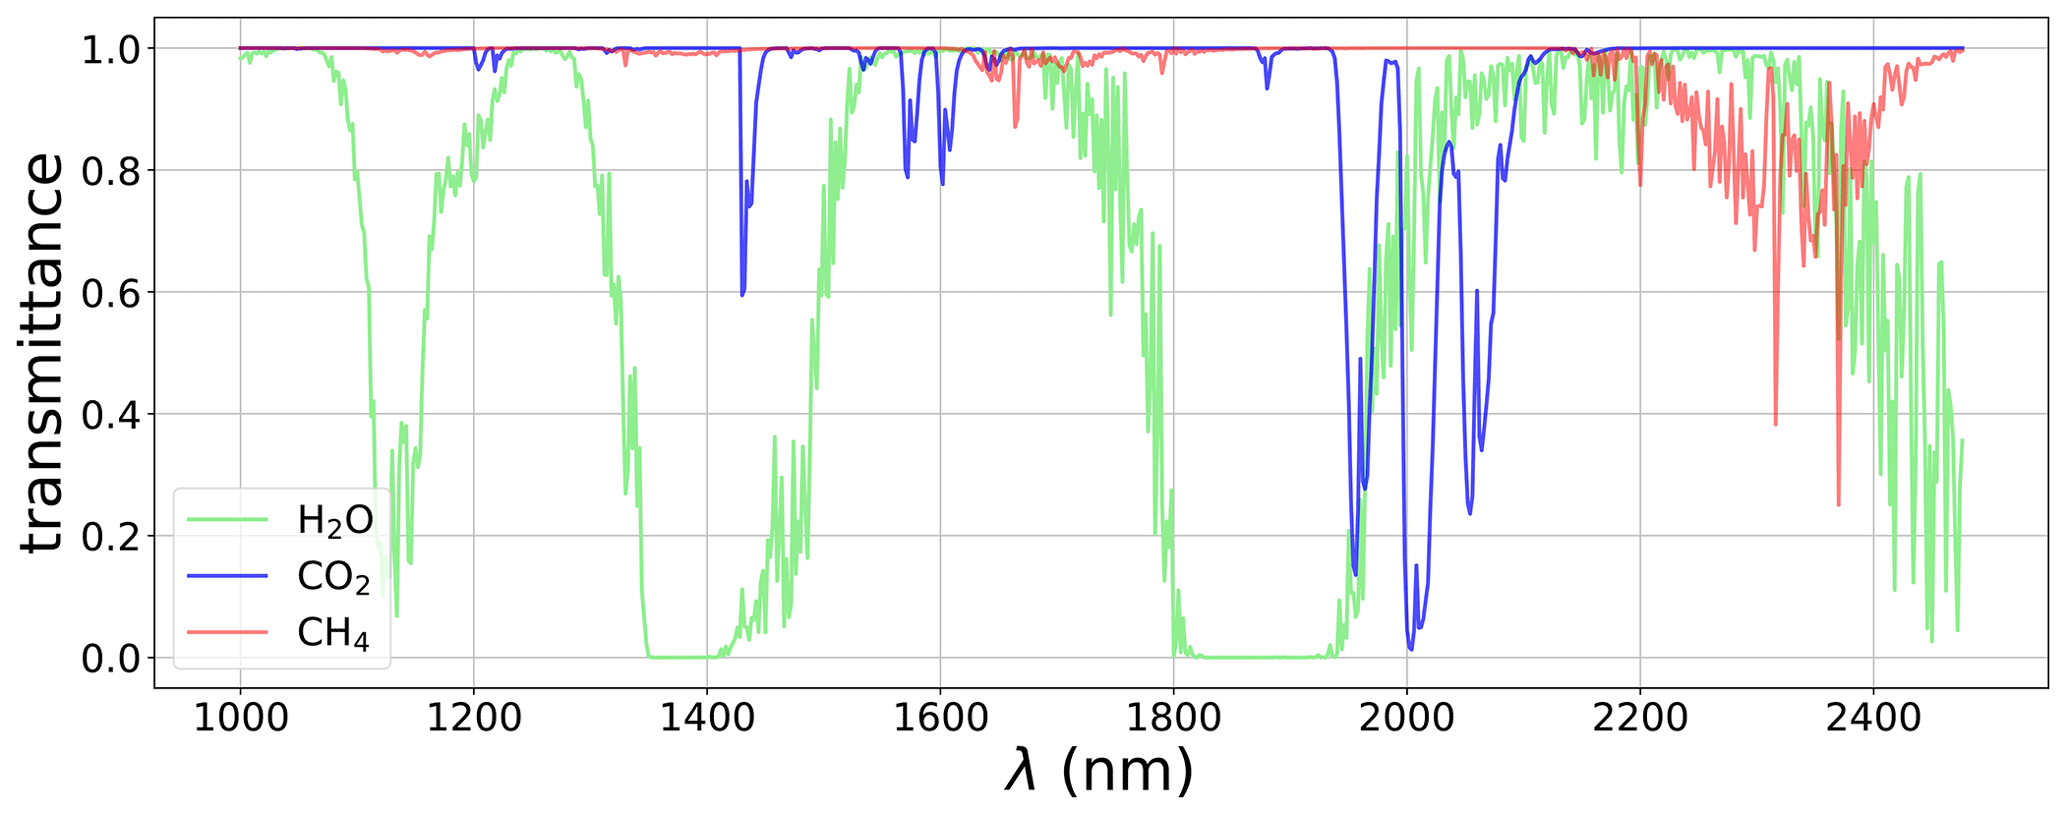
Figure 1MODerate resolution atmospheric TRANsmission (MODTRAN-)derived transmittance spectra of atmospheric H2O (green), CO2 (blue), and CH4 (red) resampled to 2 nm spectral resolution.
Imaging spectrometers, also known as hyperspectral imagers, have a coarse temporal resolution but offer a spatial and spectral resolution able to resolve a large range of point sources (Irakulis-Loitxate et al., 2021). Among these, we highlight the Italian Precursore IperSpettrale della Missione Applicativa (PRISMA) mission (Loizzo et al., 2018) and the German Environmental Mapping and Analysis Program (EnMAP) mission (Guanter et al., 2015), both with a 30 m spatial resolution, a ∼ 10 nm spectral resolution, and a spectral coverage of 400–2500 nm. We also acknowledge the constellation of GHGSat, which has a spatial resolution varying between 25 and 50 m (depending on the satellite). These satellites have built-in Fabry–Pérot spectrometers that operate only in the 1700 nm CH4 absorption window with a spectral resolution of 0.1 nm (Jervis et al., 2021).
In the existing literature, two types of methodologies have been employed for deriving CH4 concentration maps. The first category consists of physically based methods, which require a comprehensive understanding of radiation, its interactions, and the properties of the medium through which it propagates. On the other hand, data-driven methods extract information statistically from the image, offering advantages such as reduced computational time and partial compensation for radiometric and spectral errors (Thompson et al., 2015; Guanter et al., 2021). Among the possible methods of this class, we highlight the matched filter.
The matched filter applied to the CH4 case maximizes the score on the pixels that most strongly match the CH4 absorption spectrum (Manolakis et al., 2007) convolved to the spectral response of the satellite sensor, and the bands selected from the dataset are usually those covering the 2300 nm absorption window (2100–2450 nm). Unfortunately, the matched filter is prone to disturbing enhancements caused by measurement noise and sensitivity to the surface. Specifically, surface elements with similar absorptive features to CH4 may lead to systematic errors (Thorpe et al., 2013; Ayasse et al., 2018; Guanter et al., 2021). These can be abundantly present in heterogeneous scenes and can complicate or mislead the detection of CH4 plumes. We show an example in Fig. 2. The identification of real CH4 plumes is complicated because of the large number of these disturbing elements across the scene. Therefore, it is necessary to develop new procedures that are able to remove them and, consequently, improve the ability to detect CH4 emissions.
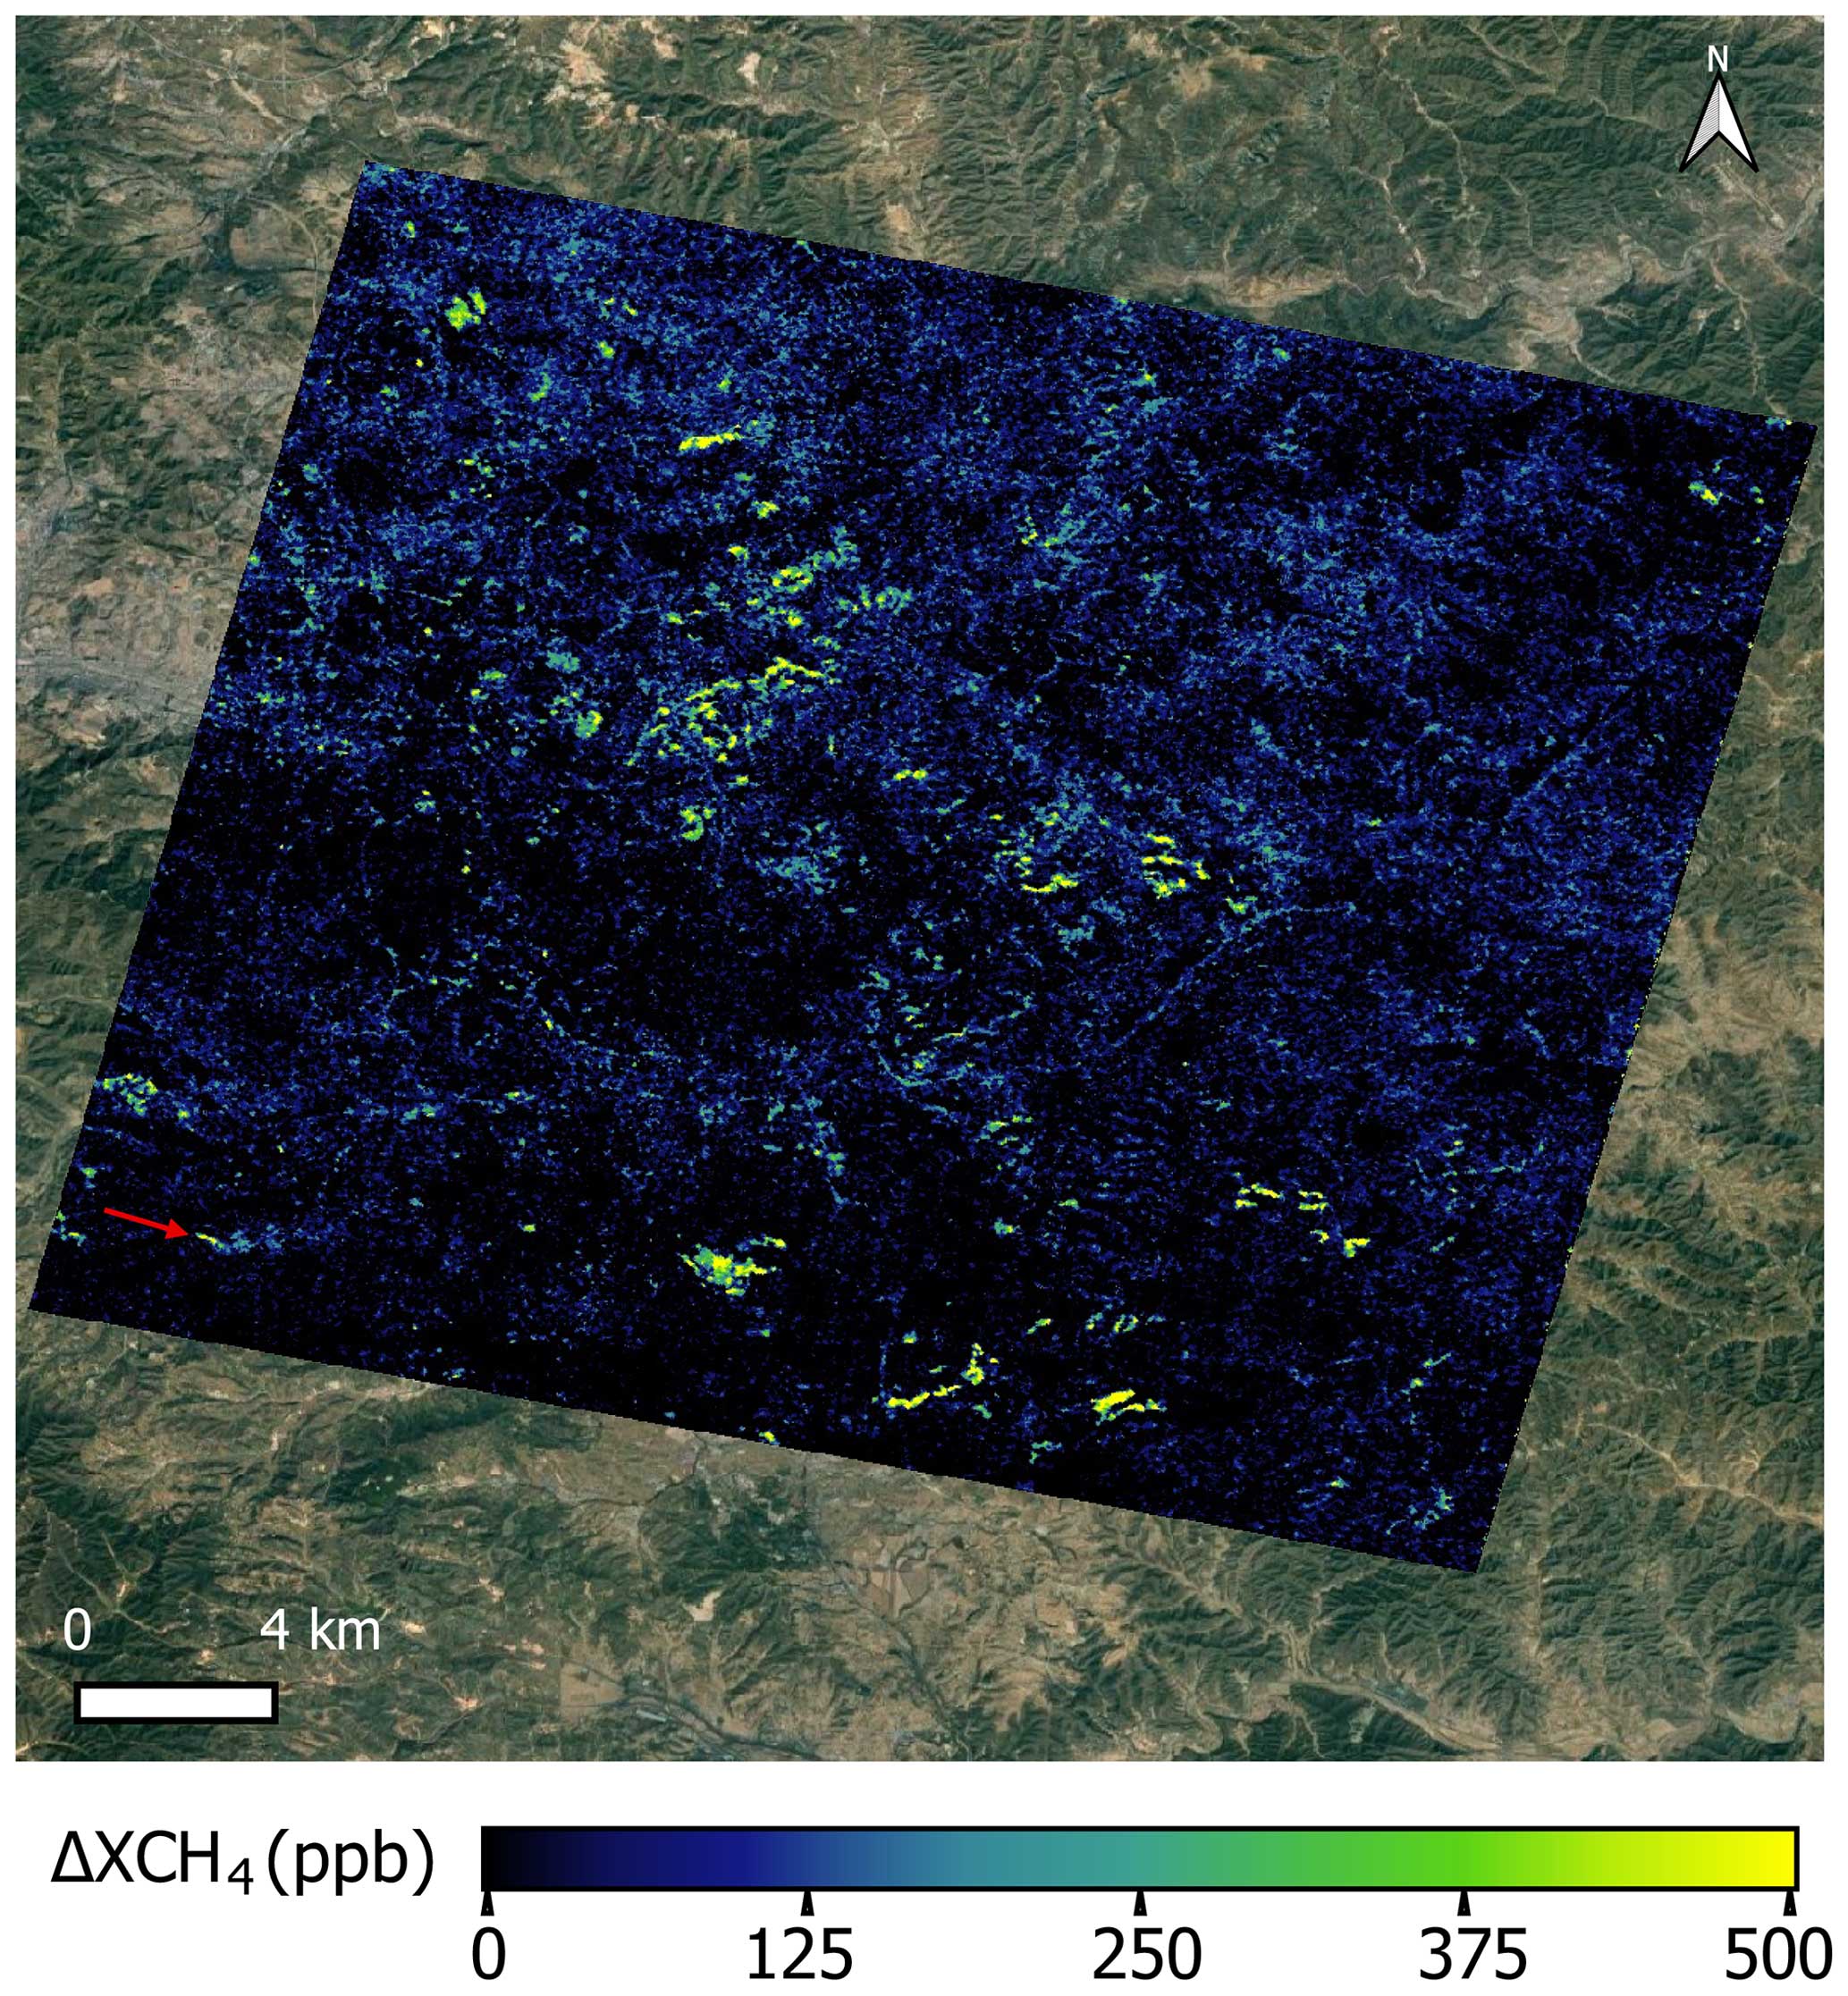
Figure 2Example of a CH4 concentration enhancement (ΔXCH4) map derived from a PRISMA dataset that covers an area of coal mines in the Shanxi region (China). The only detected plume, originating from a venting shaft, is pointed out with a red arrow. The retrieval is derived from a matched filter formulation using the 2100–2450 nm CH4 absorption window. The original image source is © Google Earth.
In this work, we present a matched-filter-based retrieval that exploits the whole SWIR spectral region with the aim of improving the detection of CH4 plumes emitted from point sources. We implement end-to-end simulations from trace gases to test if atmospheric carbon dioxide (CO2) and water vapor (H2O) disturb the CH4 retrieval when expanding the spectral range. Moreover, we present CH4 concentration enhancement maps derived from both simulated and real data. These maps are compared with other state-of-the-art retrieval methods, and the plume detection capability is analyzed.
2.1 Matched filter for CH4 enhancement concentration mapping
If radiation arrives at the detector without CH4 absorption from an emission (LNoAbs) and also with CH4 absorption (LAbs), according to Beer–Lambert’s law, the radiance spectrum LAbs will be characterized by
where ΔXCH4 is the CH4 column concentration enhancement in parts per billion, and is the CH4 unit absorption spectrum, which characterizes CH4 absorption features. Note that italicized bold font is used to denote vectors. Moreover, is calculated using a lookup table adapted to the angular configuration of the scene that relates CH4 transmittance spectra from the MODTRAN (Spectral Sciencies, Inc., 2016) radiative transfer code to CH4 column concentration values. We do not consider atmospheric scattering in the calculation of transmittance for the SWIR spectral range, assuming a pristine atmosphere. Nevertheless, in certain cases, such as in the presence of dust particles or in dark surfaces with low solar zenith angles, the influence of scattering can be significant (Thorpe et al., 2014). Note that in satellite-based missions is calculated considering the integration of CH4 over an 8 km high column such as in Thompson et al. (2016), while in airborne missions it is calculated over the specific flight height. Then, the exponential of Eq. (1) can be expanded as a Taylor series of infinite terms, and it can be simplified to the second term if we assume a sufficiently small argument of the exponential. This implies that the approximation will generate more accurate results for lower ΔXCH4. Then, assuming this simplification, radiance can be approximated to a linear function of ΔXCH4, which will be used for the matched filter method.
The matched filter models a scene radiance data cube as a multivariate Gaussian, where each spectral band is considered to follow a Gaussian distribution. The spectral mean vector (μ) and the covariance matrix (Σ) are retrieved from the data cube and characterize the whole image, while assuming enough homogeneity and CH4 emission sparsity throughout the scene. Then, the radiance spectrum of each pixel (L) can be assessed following two different hypotheses: the null hypothesis (H0), where radiance is simply assessed as background radiance, and the alternative hypothesis (H1), where it is assessed as the background radiance plus a term that represents CH4 absorption (Thompson et al., 2016). These hypotheses are represented as follows:
where 𝒩 represents a multivariate Gaussian distribution with the mean vector and covariance matrix located in its first and second arguments, respectively. The CH4 absorption term from H1 is given by the linear term ΔXCH4 ⋅t that comes from linearizing the exponential function from Eq. (1), and t is the target signature that spectrally characterizes the absorption of CH4 per unit of concentration and is obtained by an element-wise multiplication between the μ and the arrays, where is first convolved to the instrument’s spectral response.
In order to obtain the ΔXCH4 values, the probability of H1 occurring is maximized following the maximum likelihood estimation (Eismann, 2012). As a result, we obtain the following expression:
Datasets used in this study come from push-broom imaging spectrometer missions (AVIRIS-NG, EnMAP, and PRISMA) that scan the swath of the scene with a 2-D detector array. Differences in the central wavelength and spectral resolution can exist among detectors from the same array because of optical aberrations (Guanter et al., 2009), which compromise the uniformity between the data cube columns in the across-track direction. Therefore, the matched filter is applied for each along-track column separately.
Along the SWIR spectral window there are two CH4 absorption windows, namely a weaker one around 1700 nm and a stronger one around 2300 nm. The 2300 nm window (roughly 2100–2450 nm) is typically chosen for CH4 mapping (Thompson et al., 2015; Foote et al., 2020; Guanter et al., 2021; Irakulis-Loitxate et al., 2021) because the more intense absorption and spectral sampling allow one to better characterize CH4 in comparison to the other window. Hereinafter we refer to this spectral range selection as 2300-MF. There are usually elements from the scene, such as roads, solar panels, and buildings, that present absorption features similar to CH4 in the 2300 nm window. Therefore, we find retrieval artifacts, i.e., pixels with positive ΔXCH4 values related to these structures. Retrieval artifacts usually present higher ΔXCH4 values than background noise and can disturb CH4 plume detection. In fact, they complicate the identification of the real plumes and can even lead to false positives. In this paper, we examine the functionality of the matched filter with respect to minimizing the presence of retrieval artifacts.
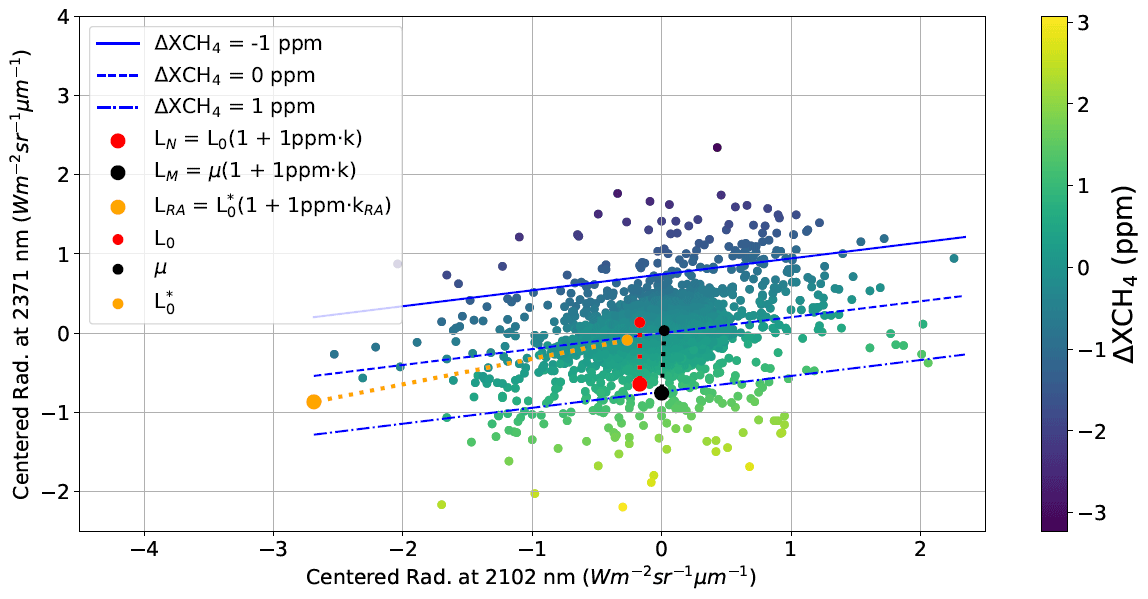
Figure 3Scatterplot between the centered radiance data points from the spectral band with no CH4 absorption (2102 nm) and with CH4 absorption (2371 nm) from a PRISMA dataset. The corresponding ΔXCH4 values result from the matched filter applied to the two spectral bands and are plotted following the color bar on the right. The blue lines indicate the domain in which the data points have ΔXCH4 values of −1 (top), 0 (center), and 1 (bottom) parts per million. The small dots from the legend are the original data points before the effective absorption of 1 ppm (big dots) for the natural (red), modeled (black), and retrieval artifact (orange) cases.
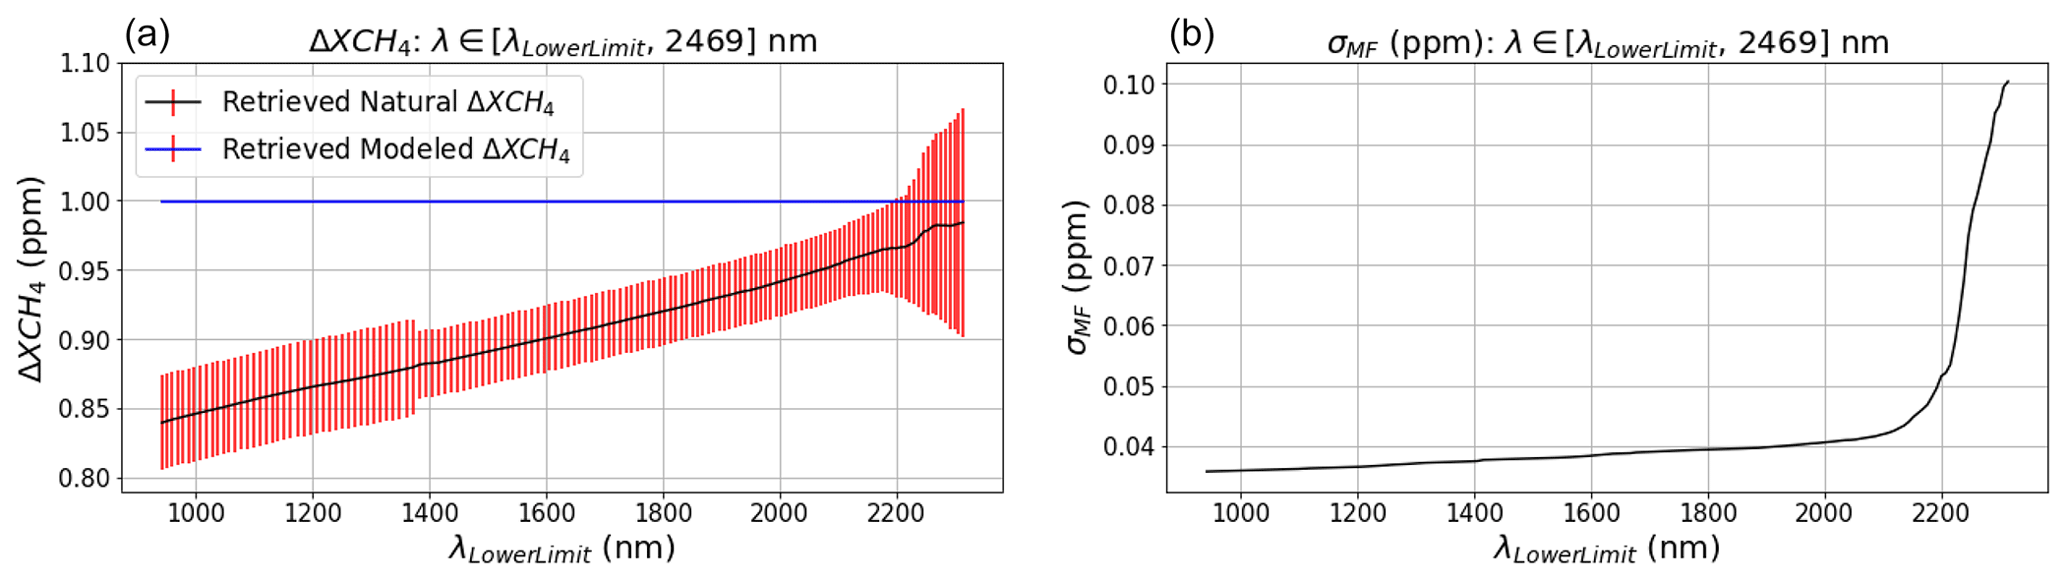
Figure 4(a) The mean ΔXCH4 values related to the retrieved natural (black) and modeled (blue) artificial absorptions applied to 1000 different pixels from a PRISMA dataset and their associated error bars (red). (b) A standard deviation, σMF, resulting from the Gaussian distribution that is followed by the dataset's retrieved values. The matched filter spectral range of application ranges from a variable wavelength value (λLowerLimit) to 2469 nm.
In Fig. 3, we show a scatterplot between two spectral bands with CH4 absorption (2371 nm) and with no CH4 absorption (2102 nm) from a PRISMA dataset covering a homogeneous arid area in Sudan. The ΔXCH4 values resulting from applying the matched filter using only these two bands are illustrated following the color gradient on the right side of the figure. Note that the radiance data points are plotted relative to the mean values, highlighting the impact of shifts from these central values in the retrieved data. A linear fit based on these shifts allows us to determine the lines equivalent to the ΔXCH4 values of −1, 0, and 1 parts per million (ppm). Moreover, three pixels from the original dataset were selected and transformed to represent different situations: one with a 1 ppm natural absorption, another with a 1 ppm absorption according to the matched filter model, and a third to illustrate the presence of a retrieval artifact. The absorption based on the model aligns with the alternative hypothesis H1 from Eq. (3), indicating a deviation from the mean radiance spectrum in the target spectrum direction. Instead, the natural absorption, which reflects a realistic CH4 absorption, is implemented by deviating the radiance spectrum of a randomly chosen pixel in the dataset in the target spectrum direction as well. On the other hand, the retrieval artifact was generated similarly to the natural absorption case but with an additional deviation in the non-absorption band, where the target spectrum has a null value. The radiance spectra related to these three cases are expressed as follows:
where LN, LM, and LRA are the radiance spectrum vectors referring to a 1 ppm natural absorption, a 1 ppm modeled absorption, and a retrieval artifact, respectively. L0 and are the selected radiance spectrum vectors from the original dataset pixels, and KRA is a made up equivalent unit absorption spectrum for the retrieval artifact. The difference between KRA and is that KRA presents a non-zero value in the band with no CH4 absorption. While the modeled absorption in LM results in 1 ppm, the natural absorption in LN suffers from underestimation due to the deviation of the original pixel radiance, L0, from the mean. Enhancement values associated with natural absorption scatter around their true value since the measurements are subject to noise; thus an overestimation would have been equally likely. Note that in Fig. 3, the retrieval is expected to yield a wide range of ΔXCH4 values due to the limited number of bands involved. On the other hand, while the retrieval artifact LRA exhibits a spectral feature similar to CH4 in the absorption band, it also displays a characteristic deviation in the non-absorption band that enables better discrimination from CH4. Thus, by expanding the spectral window in the matched filter application, a more comprehensive discrimination between retrieval artifacts and CH4 may lead to their attenuation or complete removal.
Additional variations may arise by expanding the window, as depicted in Fig. 4. For 1000 different pixels from the already-employed PRISMA dataset, absorptions of 1 ppm were applied using modeled and natural absorptions with Eqs. (6) and (5), respectively. In the right panel, we show the standard deviation resulting from the entire matched filter retrieval values when using a spectral window comprising a variable lower limit (λLowerLimit) and 2469 nm. We select this upper limit because it allows us to cover the entire 2300 nm CH4 absorption window. Incorporating more bands implies a more demanding spectrum to match, and the covariance matrix will better suppress the background, which will result in a lower standard deviation in the retrieval. In the left panel, we display the mean ΔXCH4 values retrieved from the pixels with the modeled (blue) and natural (black) absorptions, along with their related standard deviation values (red) as a measure of uncertainty. While modeled absorption consistently retrieves the expected 1 ppm value with negligible uncertainty, natural absorption yields progressively lower values when expanding the window. Similar to the background pixels, the accumulated deviations from the natural absorption compared to the modeled absorption will result in a reduction in the retrieved enhancement. As we can see, incorporating more bands makes the matched filter more sensitive to spectrum changes, which leads to a background noise reduction and an underestimation of the ΔXCH4 values from plume pixels. This increased sensitivity could also capture undesired variations from the modeled spectrum due to factors unrelated to methane, such as atypical albedo values or instrument noise, potentially resulting in clutter noise. New retrieval artifacts may appear when including the 1700 nm absorption window, but, overall, the increased spectral interval mitigates those from both the 1700 and the 2300 nm windows efficiently, as is shown in Sect. 3.
We have not yet considered the interference with other trace gases such as H2O and CO2 when expanding the window (see Fig. 1). Absorption features from these gases appear along the SWIR spectral region and might cause further biases in the ΔXCH4 values from plume pixels. The left panel of Fig. 4 shows a sudden increase in the standard deviation of the retrieved ΔXCH4 values related to the natural absorption when including several spectral bands around 1400 nm. This occurs because an important fraction of radiance pixels in these bands contains absolute 0 values due to strong H2O absorption, which violates the assumption of Gaussian modeling in the matched filter. If we remove these bands, the standard deviation increase does not occur. Consequently, we exclude the bands around 1400 nm along with those associated with the strong H2O absorption around 1900 nm, as they may also compromise the retrieval due to their very low values. Moreover, the atmospheric concentrations of H2O and CO2 are approximately homogeneous across the area captured in one dataset. However, variations in the atmospheric concentration of H2O are assumed when there are pronounced height variations in the terrain across the scene (Lou et al., 2021). Unless the dataset area meets this condition, we can assume homogeneity. As a result, variations from the mean array cannot be attributed to these gases, which implies that the matched filter should not be affected by them. Nevertheless, the co-emission or overlapping of plumes from H2O or CO2 with CH4 plumes has not been studied yet. Simulations will be employed to understand how they impact the retrieval. This could help to understand methane concentration maps in situations such as inefficient flaring (Irakulis-Loitxate et al., 2021), where there is co-emission of CH4 and CO2 plumes.
2.2 Combo-MF
In this work, we propose to expand the matched filter spectral range of application to the whole SWIR spectral range (1000–2500 nm) in order to remove retrieval artifacts and therefore to improve CH4 plume detection. Hereinafter we refer to this spectral range selection as SWIR-MF. We select this relatively wide spectral range to leverage the surface-related spectral features, aiming to maximize the mitigation of retrieval artifacts. This selection would be unfeasible using physically based methods such as the IMAP-DOAS (Frankenberg et al., 2005) because of the growing complexity of separating atmospheric absorptions from surface spectral features (Thorpe et al., 2014). Also note that the increased number of spectral bands does not substantially impact the computational processing time required when applying the matched filter.
As we observe in Fig. 4, SWIR-MF produces overall smaller ΔXCH4 values than 2300-MF. This is especially true for the retrieval artifacts that are displayed in the 2300-MF retrieval. However, expanding the window could also result in the appearance of clutter due to the higher matched filter sensitivity and the inclusion of new absorbing bands that could lead to the emergence of new retrieval artifacts. Therefore, SWIR-MF values greater than the 2300-MF values will probably come from disturbing factors. As a solution, we change these values to the ones of the original 2300-MF in order to penalize the increased enhancement. On the other hand, to solve the underestimation from plume pixels and keep the variances of both retrievals comparable, we multiply the remaining retrieval values by a factor f defined as
where σ(2300) and σ(SWIR) are the standard deviations from the Gaussian distributions that are followed by the ΔXCH4 retrieved values from the dataset resulting from applying the 2300-MF and SWIR-MF retrievals, respectively. Generally, retrievals follow a normal distribution with an averaged value of ∼ 0, so we can scale the distribution of untransformed SWIR-MF values to that of the 2300-MF values by simply multiplying by f. Then, the transformed values from the SWIR-MF retrieval will approximately follow the 2300-MF retrieval normal distribution. In this manner, plume pixel values will be approximately scaled to the enhancement levels from the 2300-MF retrieval in order to solve the underestimation. We call this procedure Combo-MF, which can be expressed as
where , , and are the CH4 column enhancement values from the 2300-MF, SWIR-MF, and Combo-MF retrievals, respectively. As a result, limitations from the SWIR-MF are mitigated: the emergence of new clutter noise is removed, and the SWIR-MF values are transformed into typical 2300-MF value levels. Nevertheless, in pixels where surface structures related to a retrieval artifact are positioned beneath a CH4 emission, there might be a more pronounced attenuation that could compromise the detection. Figure 5 shows retrieval histograms from an EnMAP dataset from an O&G field in Turkmenistan when applying 2300-MF, SWIR-MF, and Combo-MF. We observe that SWIR-MF has a lower standard deviation because of a more stringent spectrum that reduces background noise. Combo-MF takes a standard deviation close to the one from 2300-MF because of the scaled values, but its mean is shifted to negative values because a great fraction of the 2300-MF values from Combo-MF is negative. Therefore, there is a lower number of pixels with positive enhancement, which implies a better contrast between plume pixels and their background.
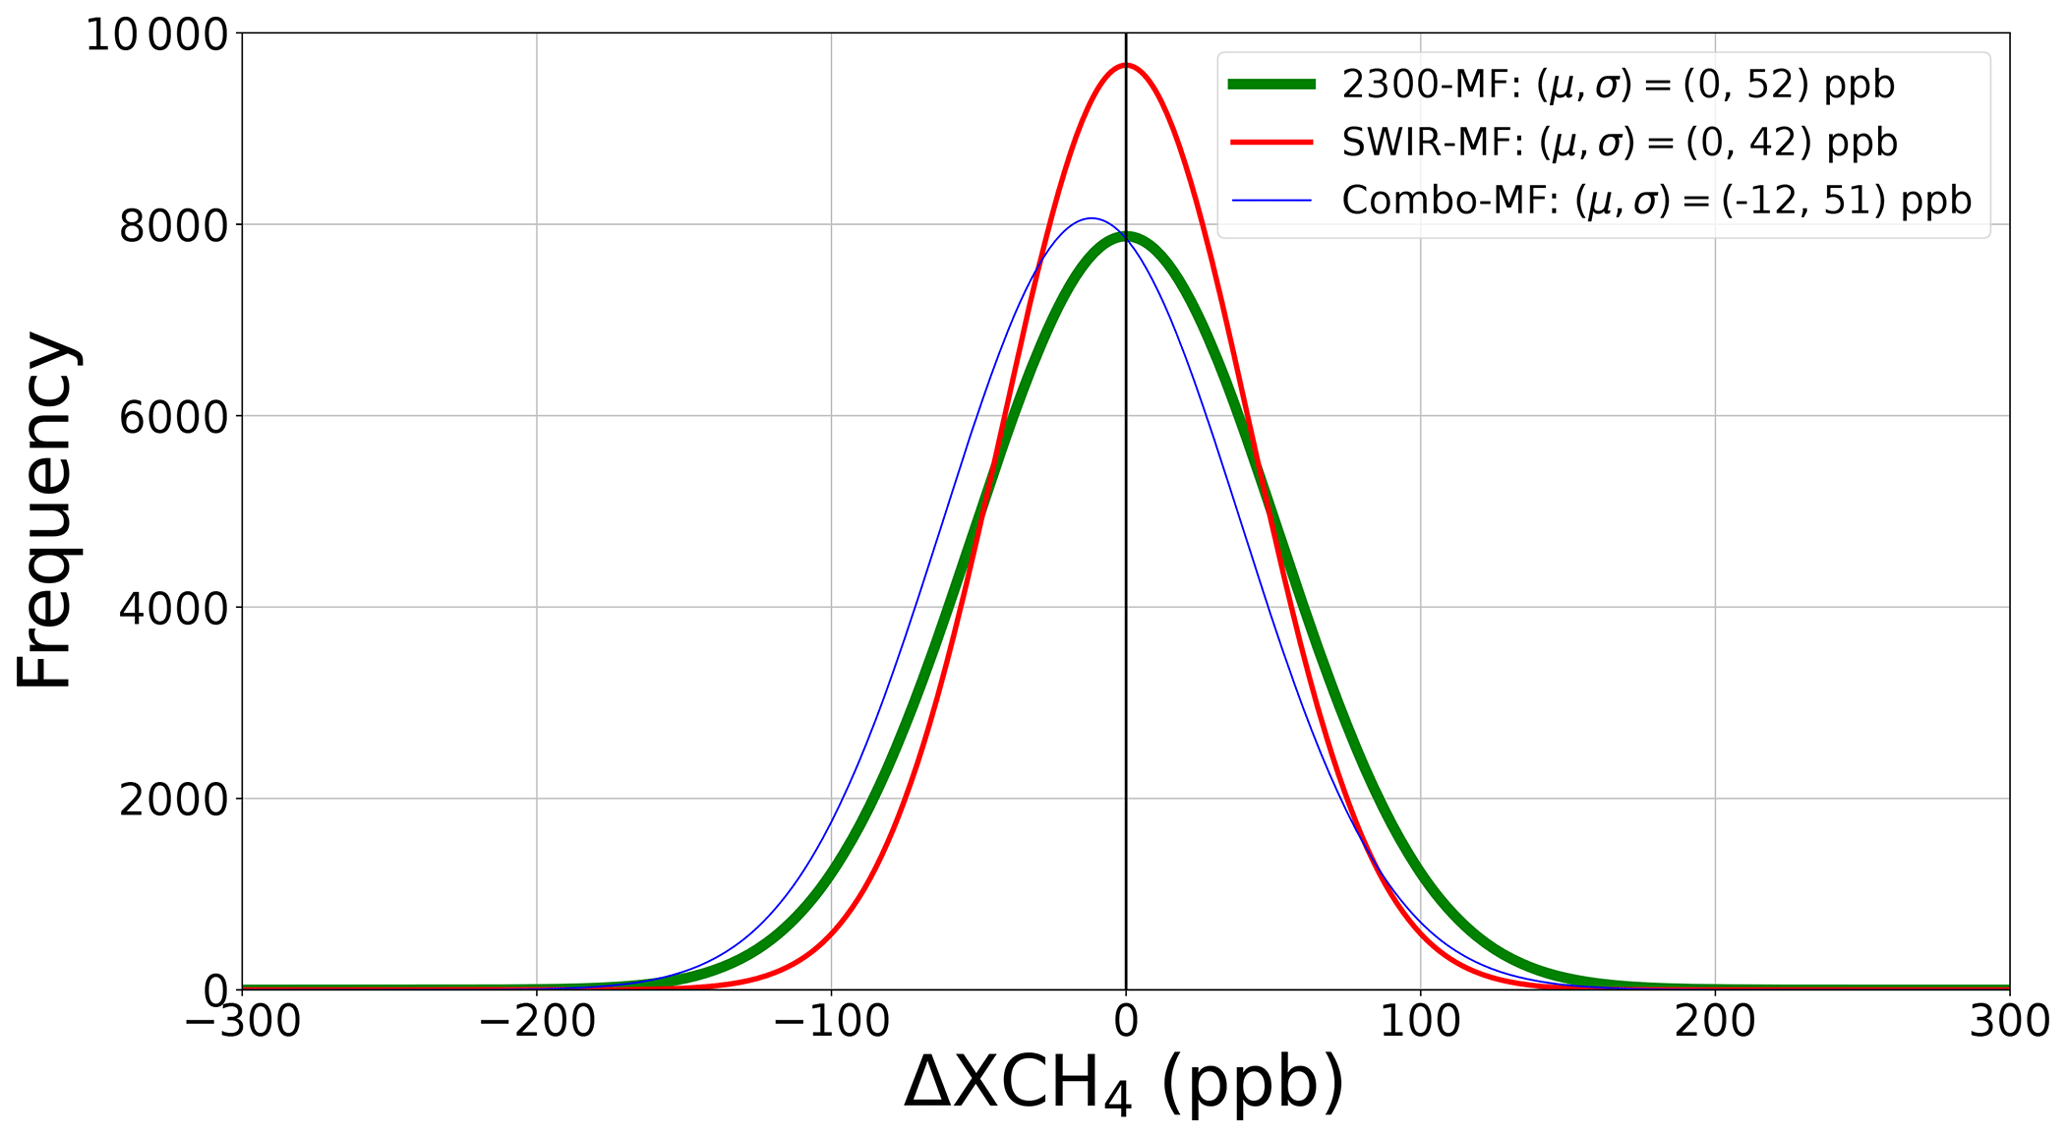
Figure 52300-MF (green), SWIR-MF (red), and Combo-MF (blue) retrieval histograms from an EnMAP dataset showing an O&G field located in Turkmenistan with CH4 emissions. μ and σ are the mean and standard deviation values from the different distributions, respectively.
Combo-MF is not a unique alternative created to improve CH4 emission detection. Instead, other matched-filter-derived methods exist, such as the Matched filter with Albedo correction and reweiGhted L1 sparsity Code (MAG1C) that has been used in some studies (Foote et al., 2021; Ayasse et al., 2022; Knapp et al., 2023). It applies an albedo correction across the radiance data cube in order to account for the homogeneity assumption from the matched filter. In addition, MAG1C leverages the CH4 sparsity assumption and also applies an iterative regularization that aims to reduce background noise. MAG1C retrieval values can be divided into two groups: (1) zero values that were obtained because of the sparsity assumption and (2) a set of values that follow a log-normal distribution and mostly refer to retrieval artifacts and CH4 emissions. If we transform the retrieval in order to follow a normal distribution, the resulting standard deviation will not be related to the random background noise, as with Combo-MF, and therefore we will not be able to compensate for a potential underestimation when extending the spectral window. Because of this, we do not apply an equivalent Combo-MF methodology to MAG1C. Thus, we compare MAG1C retrievals using the 2300 nm absorption window (2300-MAG1C) and the whole SWIR spectral region (SWIR-MAG1C) to the Combo-MF retrievals in order to assess if the latter improves plume detection.
2.3 Simulated trace gas enhancements
ΔXCH4 maps depicting simulated plumes with different shapes, related wind speed values, and concentrations have been generated by utilizing large-eddy simulations with the Weather Research and Forecasting model (WRF-LES) (Varon et al., 2018; Cusworth et al., 2019). Using the deduced lookup table used to obtain , the ΔXCH4 values associated with the synthetic plumes are transformed into their equivalent transmittance spectra. Then, transmittance is convolved to the instrument's spectral response and multiplied by the original radiance dataset, accounting for minor radiometric offsets (Guanter et al., 2021). These plumes are implemented in three different datasets from the PRISMA mission to assess the CH4 emission detection and quantification capabilities of the different procedures.
Table 1Information about the datasets used in this study. They are listed in order of appearance in this work. Dates are in day–month–year format, and latitude and longitude coordinates (lat, long) are in decimal degrees.
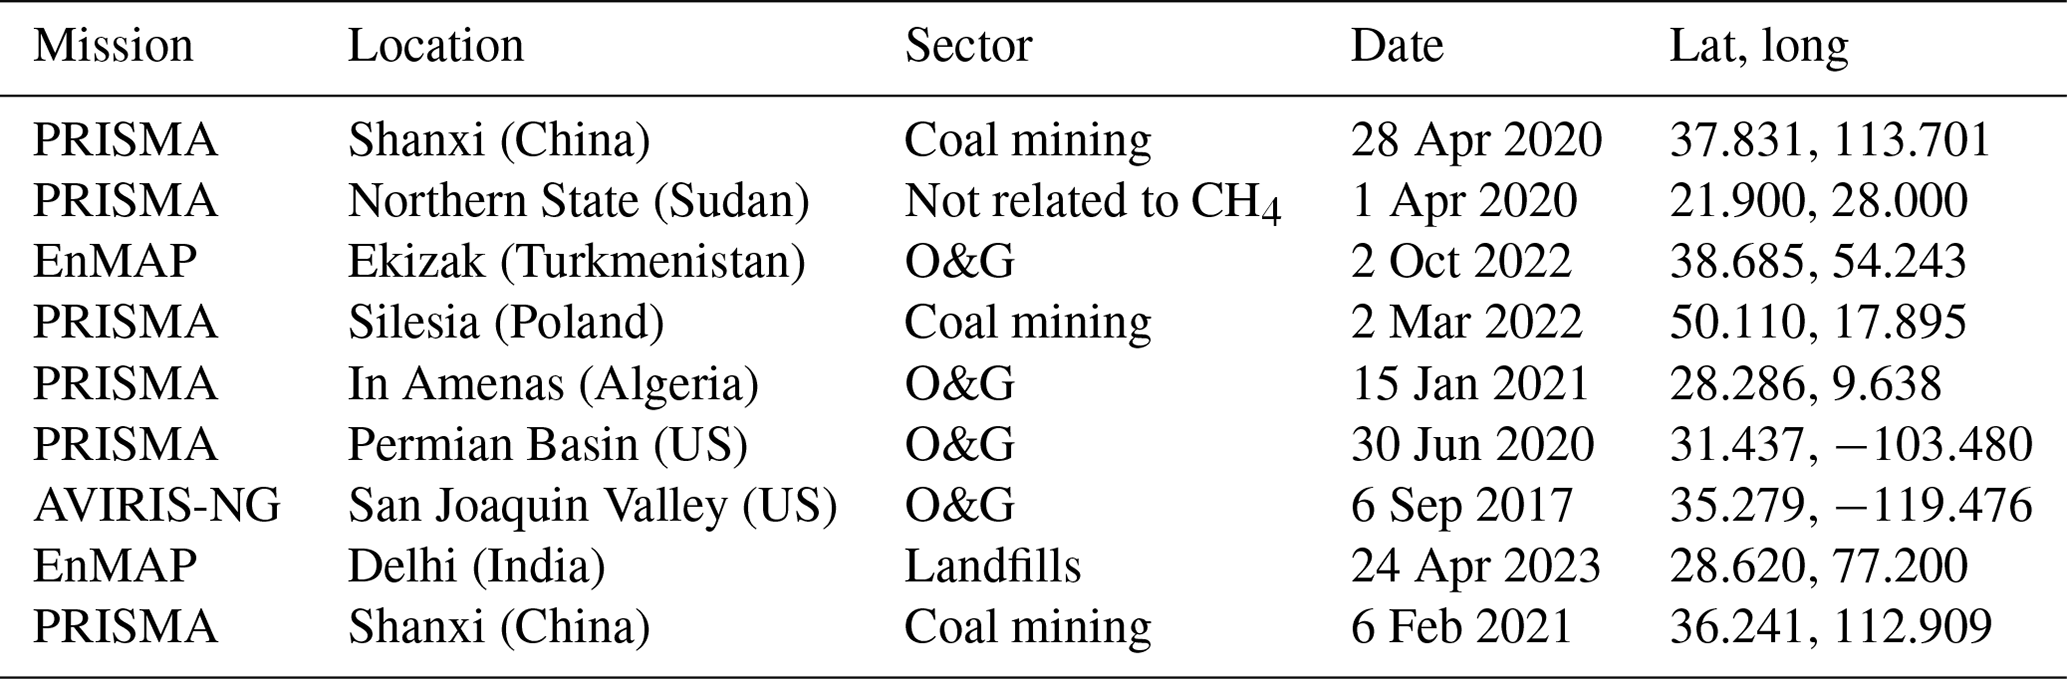
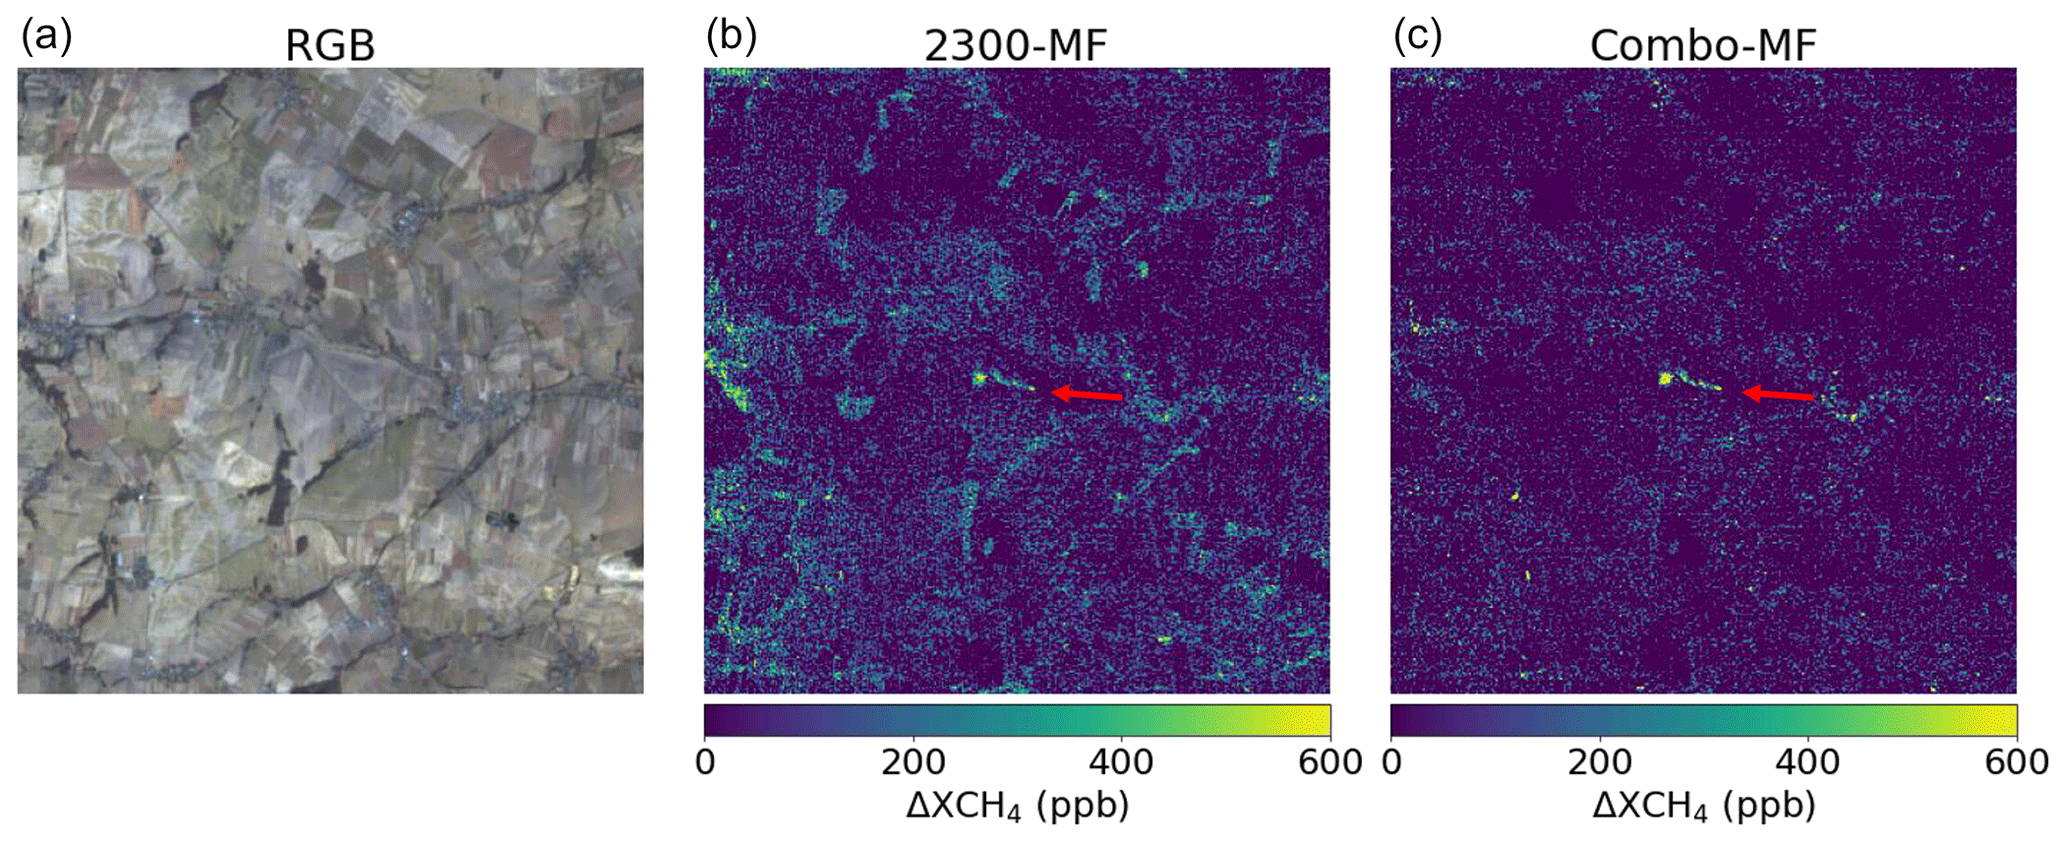
Figure 6Original image (a), 2300-MF retrieval (b), and Combo-MF retrieval (c) from a PRISMA dataset from a coal mine site in Poland, with an implemented plume with Q=2000 kg h−1. The plume is pointed out with an arrow.
Simulations are also used to assess the impact of H2O and CO2 on the retrievals. Simulated enhancements of typical background concentrations for CO2 (2500–10 000 ppb) (C3S, 2018) and H2O (1–2.5 g cm−2) (Mieruch et al., 2014) are uniformly applied to the whole extent of a PRISMA dataset with a constant value. This allows us to examine how variations in the atmospheric concentrations of these trace gases affect CH4 retrievals using 2300-MF and Combo-MF. Additionally, we introduce H2O and CO2 enhancements exclusively on pixels where we implemented a simulated CH4 plume to assess the impact of these trace gases on the plume ΔXCH4 values in the case of co-emission or overlapping plumes. A constant enhancement of 10 ppm has been applied for CO2 and 100 ppm for H2O, considering the order of magnitude observed in some CO2 and H2O plumes reported by Cusworth et al. (2023) and Thorpe et al. (2017), respectively.
2.4 Detection and quantification of point-source emissions
Generally, the detection of CH4 plumes is performed through a supervised methodology, which involves a direct visual inspection of the retrieval. First, we search for clusters with plume-like shapes and with ΔXCH4 values greater than background noise values. Then, we validate the association with a potential CH4 source using high-resolution images from Google Earth data or the spectral radiance bands within the dataset. Finally, we confirm the cluster as a true plume by validating its alignment with the wind direction, which can be retrieved from the GEOS-FP database (Molod et al., 2012). For instance, the emission in Fig. 2 was confirmed as the only plume in the image according to these steps. However, in order to establish a systematic procedure to study the detection capabilities of both 2300-MF and Combo-MF, we use an automatic detection algorithm instead of the supervised initial selection of clusters associated with potential plumes. The algorithm begins by applying a 3×3 median filter to the retrieval to mitigate the impact of random noise in the classification process (Varon et al., 2018). Subsequently, a mask is generated, retaining only the values from the filtered retrieval that exceed 1 standard deviation from the Gaussian distribution followed by the originally retrieved values. It is assumed that this threshold is reasonable for effectively distinguishing between background and plume pixels (Guanter et al., 2021). Next, a filter based on morphological parameters is applied to the resulting mask, isolating clusters with plume-like shapes. Finally, an analysis following the remaining supervised detection steps is applied to the persisting clusters, keeping only those related to CH4 plumes.
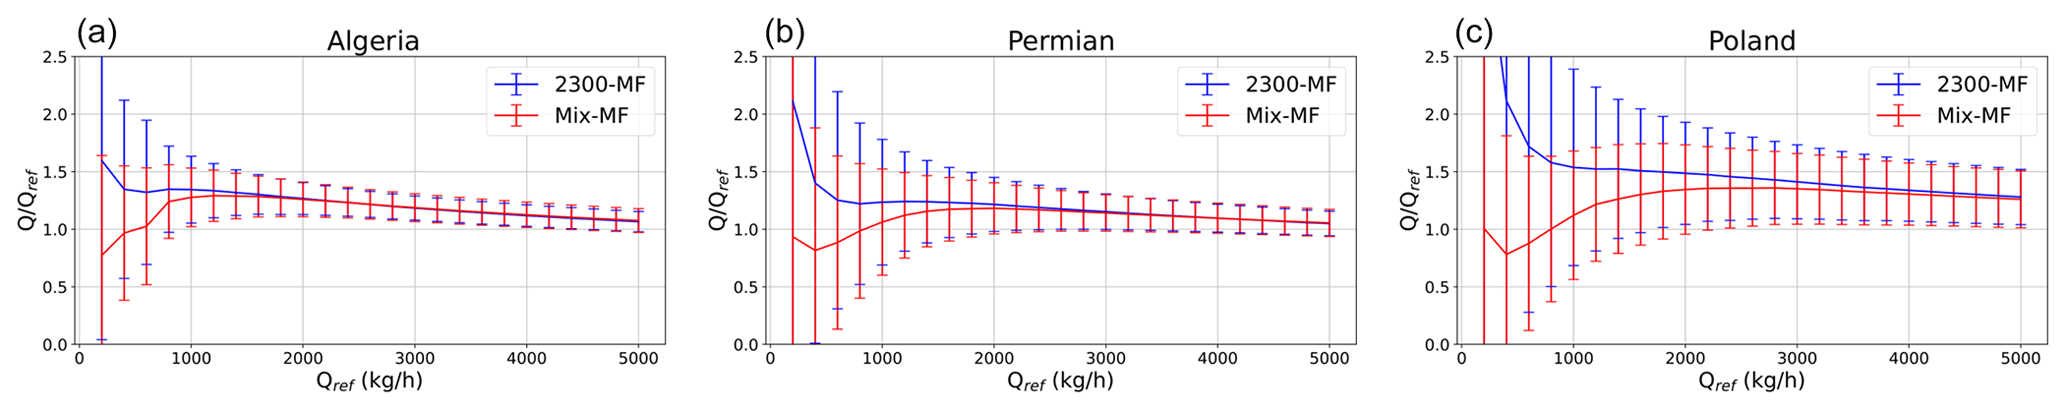
Figure 7Simulated flux rate Qref versus the ratio between the deduced flux rate Q and Qref from 100 different plumes implemented in PRISMA datasets from sites in Algeria (a), the Permian Basin (b), and Poland (c) using the Mix-MF (red) strategy and the 2300-MF retrievals (blue). Plotted points and error bars of each flux rate value correspond to the mean and 1 standard deviation values from the 100 estimates, respectively.
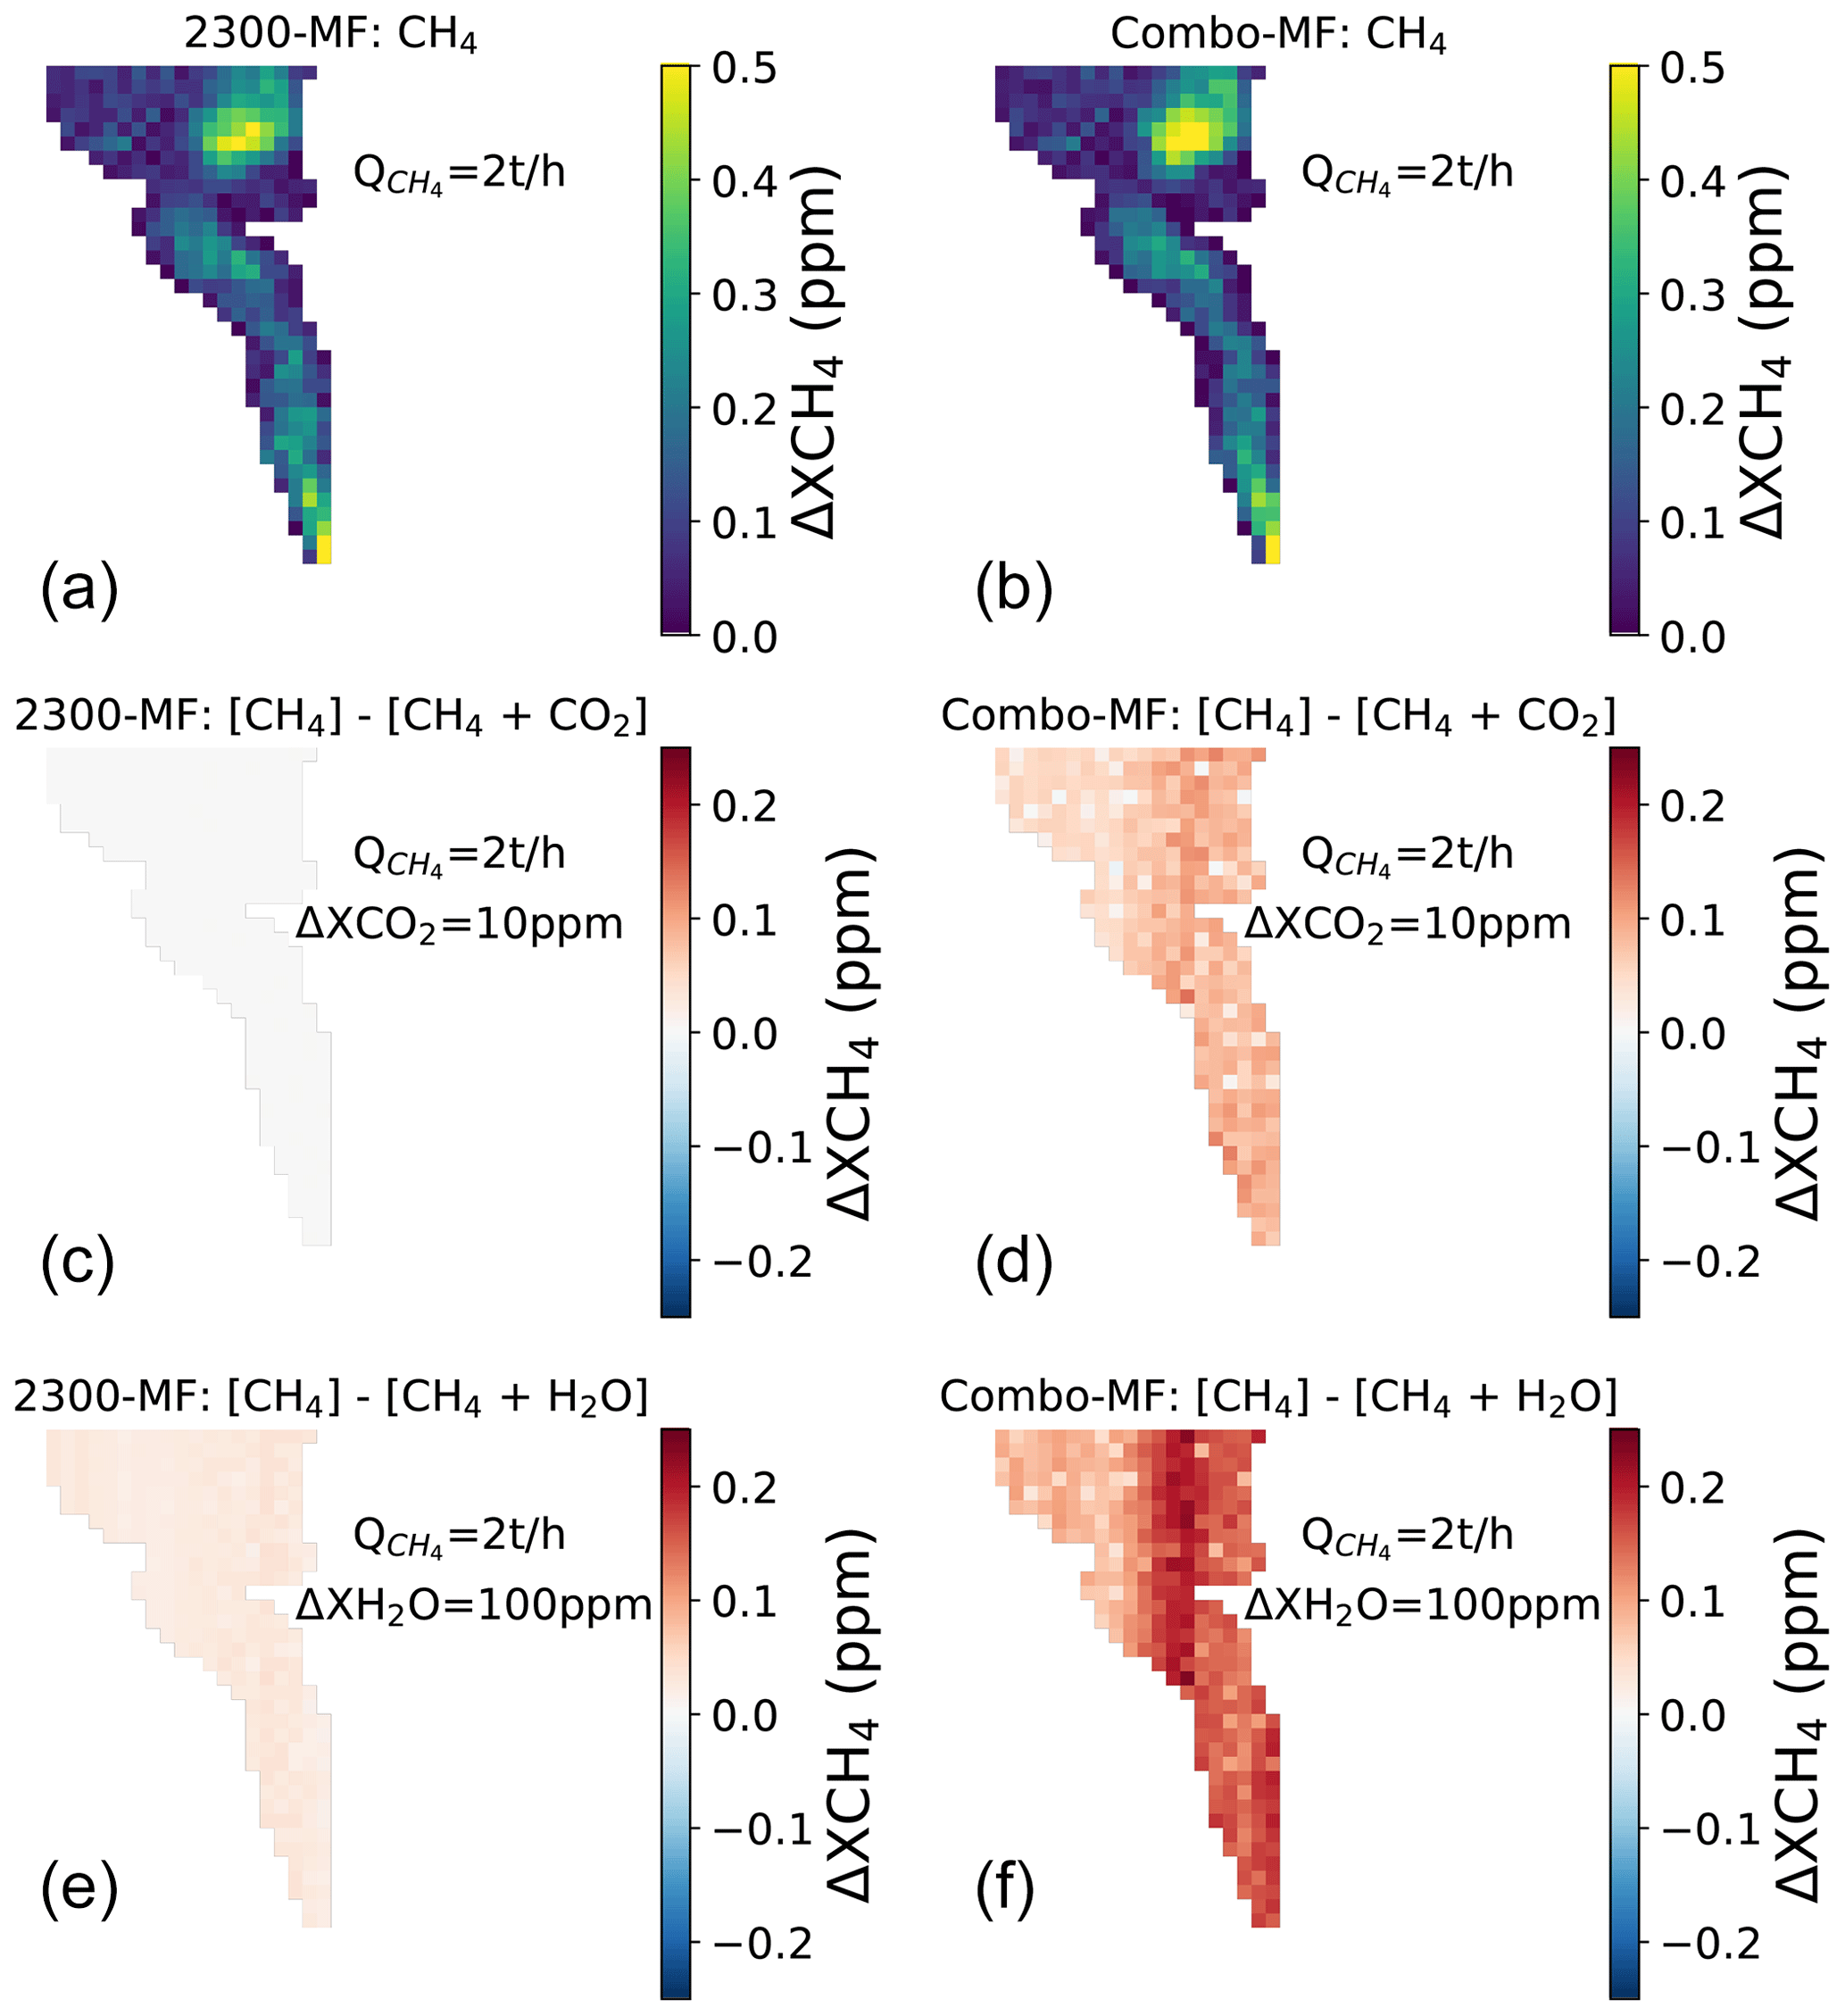
Figure 8Retrieved simulated plume of kg h−1 implemented on an EnMAP dataset from an O&G field in Turkmenistan using 2300-MF (a, c, e) and Combo-MF (b, d, f) retrievals (a, b) and the difference resulting from applying only to the plume pixels a constant ΔXCO2 value of 10 ppm (c, d) and a constant ΔXH2O value of 100 ppm (e, f).
On the other hand, the parameter typically used to quantify the intensity of CH4 emissions released from a point source is the flux rate (Q in kg h−1). As in Varon et al. (2018), we can express this magnitude as
where Ueff (m s−1) is the effective wind speed, a parameter that linearly depends on the wind speed at 10 m above the surface (U10) for PRISMA and EnMAP data (Guanter et al., 2021; Roger et al., 2023); L (m) is obtained as the square root of the plume mask area; and IME (kg) is the mass related to the CH4 enhancement contained in the masked plume (Frankenberg et al., 2016). IME and L depend on the plume mask, which makes masking an important factor that affects the accuracy of quantification. Masking is performed with the automatic algorithm used for detection. The resulting masks from both the 2300-MF and the Combo-MF retrievals may differ due to variations in background noise and the presence of retrieval artifacts. Moreover, the ΔXCH4 values of Combo-MF plume pixels cannot be trusted for quantification because the factor f used is only valid for scaling to typical 2300-MF values, and it does not ensure the accuracy of the enhancement values. To assess whether the masking from Combo-MF improves quantification compared to 2300-MF, we implement a quantification strategy using Combo-MF masking and 2300-MF values, which we call Mix-MF. This comparison is performed on multiple simulated plumes with known Q and Ueff values that have been applied to real datasets. A preliminary mask, delineating the plume shape coming directly from the simulation data, is implemented to eliminate the influence of retrieval artifacts, which allows for the isolation of background noise as the only disturbing contribution to quantification. This is also done to automatize the quantification process due to the large number of simulated plumes used for this analysis.
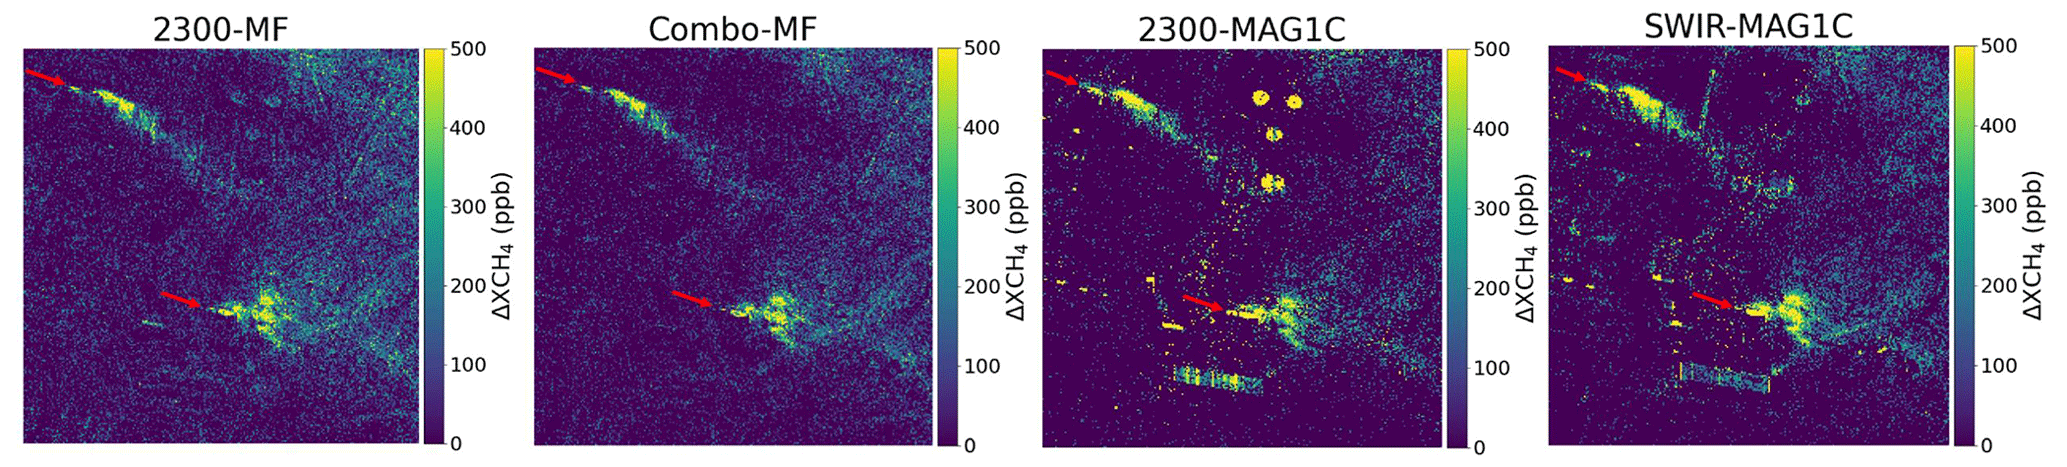
Figure 9Starting from the left, 2300-MF, Combo-MF, 2300-MAG1C, and SWIR-MAG1C retrievals from an AVIRIS-NG dataset showing an O&G field in San Joaquin Valley, California (US). Plumes are pointed out with an arrow.
2.5 Imaging spectroscopy data
In this work, we have used top-of-atmosphere radiance datasets from the PRISMA, EnMAP, and AVIRIS-NG missions. A PRISMA dataset from a coal mining region in Shanxi (China) is selected to exemplify the difficulties in emission detection in CH4 retrievals when using 2300-MF (Fig. 2). In this case, only one plume could be detected among a high number of retrieval artifacts. Another PRISMA dataset from Sudan is used to illustrate how the matched filter scores background and retrieval artifacts as well as plume pixels by introducing artificial absorptions and retrieval artifacts (Fig. 3). It is also used to assess its performance when expanding the spectral window of application (Fig. 4). This dataset shows a very low surface variability and no emissions, simplifying the analyses. Additionally, for implementing simulated enhancements of different trace gases, we selected PRISMA datasets from an arid O&G field in Algeria, an O&G field in the Permian Basin (US), a coal mine site in Poland, and an EnMAP dataset from an O&G field in Turkmenistan. The latter is also used to show the distribution of ΔXCH4 values when using the 2300-MF, SWIR-MF, and Combo-MF retrievals (Fig. 5). Note that, although some of the datasets with simulated enhancements present real CH4 emissions, the simulated plumes were intentionally implemented to avoid interference with the actual ones. Moreover, an AVIRIS-NG dataset from an O&G field in San Joaquin Valley in California (US) showing two plumes is used in order to show the performance of the 2300-MF, Combo-MF, 2300-MAG1C, and SWIR-MAG1C procedures. In addition, we show retrievals from an EnMAP dataset capturing the Delhi (India) area where there is CH4 release originating from the Ghazipur landfill. Finally, we show the detection capabilities of 2300-MF and Combo-MF in another PRISMA dataset from the Shanxi area, where 15 plumes were identified. More information about these datasets can be found in Table 1.
3.1 Real data with simulated trace gas enhancements
We implemented simulated CH4 plumes in three PRISMA datasets from three different sites. These areas were selected to study a diverse range of scenarios regarding surface heterogeneity and brightness, which are important factors in the matched filter retrieval. Homogeneous and bright surfaces will lead to a better performance than more heterogeneous and darker surfaces. The areas selected were a homogeneous and bright arid O&G site from Algeria, a heterogeneous and bright O&G site from the Permian Basin (US), and a heterogeneous and relatively dark coal mining site in Poland.
In Fig. 6 we show the RGB image and the 2300-MF and Combo-MF retrievals from the Poland site. We observe a remarkable reduction in the positive background noise values and the attenuation of retrieval artifacts related to the scene topography or different land covers. As a result, there is a greater contrast between the plume and its surroundings, and therefore it is easier to detect the emission by visual inspection. On the other hand, Fig. 7 shows the Mix-MF quantification and the one based entirely on the 2300-MF retrieval. The study covers a flux rate interval ranging from 200 to 5000 kg h−1 for five different plumes with different shapes and ΔXCH4 distributions. Each one of these plumes was implemented in 20 different locations within each dataset and for each flux rate value; i.e., quantification was assessed with 100 plumes for each flux rate value. Thus, we examine the quantification across a diverse range of plumes and backgrounds within the same dataset. Error bars display 1 standard deviation from the quantification distribution related to each implemented flux rate value (Qref). We observe that the Algeria and Permian Basin sites present lower uncertainty than the Poland site because the lower brightness from the latter is translated into noisier retrieval. For Q<1000 kg h−1, the low ΔXCH4 plume values, closer to noise level, complicate the masking process. In the 2300-MF quantification case we observe an overestimation, while for the Mix-MF quantification we generally obtain more accurate values. The number of pixels with ΔXCH4 values greater than 1 standard deviation from the distribution followed by the retrieved values is reduced in Mix-MF due to the clutter removal of Combo-MF, resulting in a more restrictive mask that is less affected by background noise. However, for both procedures there is an important uncertainty at these flux rate levels that limits quantification. For greater Q, there is a progressive uncertainty and overestimation reduction for both procedures that approximates quantification to true values. At these levels, estimations from both quantification strategies align because the greater enhancement from plume pixels leads to a practically identical masking for both of them.
In addition, typical background enhancements of CO2 and H2O were implemented homogeneously across these three datasets in order to assess their impact in the 2300-MF and Combo-MF retrievals. As a result, we observe practically null differences between the enhanced and not enhanced datasets using both procedures. Therefore, this confirms our hypothesis that the atmospheric concentrations of these trace gases do not disturb the retrievals since the changes in radiance are already integrated into the mean value of the scene. On the other hand, we have also found that the influence of CO2 and H2O enhancements only overlapped with a simulated CH4 plume of Q=2000 kg h−1 implemented in an EnMAP dataset covering an O&G area in Turkmenistan. In Fig. 8, the top row displays the retrieved CH4 plume obtained using 2300-MF (left column) and Combo-MF (right column). The centered row shows the difference between the original plume and the same plume with an overlapped constant CO2 enhancement (ΔXCO2) of 10 ppm, and the bottom row presents the difference with an overlapped constant H2O enhancement (ΔXH2O) of 100 ppm. In 2300-MF, we observe that there is a negligible difference when overlapping CO2 enhancements because of the little interference in the 2300 nm window. However, this interference does exist for the H2O case, which results in lower retrieved ΔXCH4 values. On the other hand, there is an increased underestimation for both trace gases when expanding the window (Combo-MF) because more absorption features that deviate from the CH4 absorption spectrum are introduced. Nevertheless, if the bands where other trace gases absorb are discarded when expanding the window, there will be no attenuation in the retrieved values due to the absence of interference with the CH4 absorption spectrum, as observed in the CO2 case in the 2300-MF retrieval. Then, when this interference does exist, the degree of underestimation will depend on the overlapped trace gas enhancement levels. Although these enhancements have been applied homogeneously to the plume area, there is a heterogeneous underestimation across the columns that is more pronounced in the H2O case. This occurs because the ΔXCH4 values from the simulated plume and the enhancements from the other traces gases can alter the statistics of the column, therefore resulting in a different underestimation. In addition, the noisy nature of the differences comes mostly from the retrieval noise.
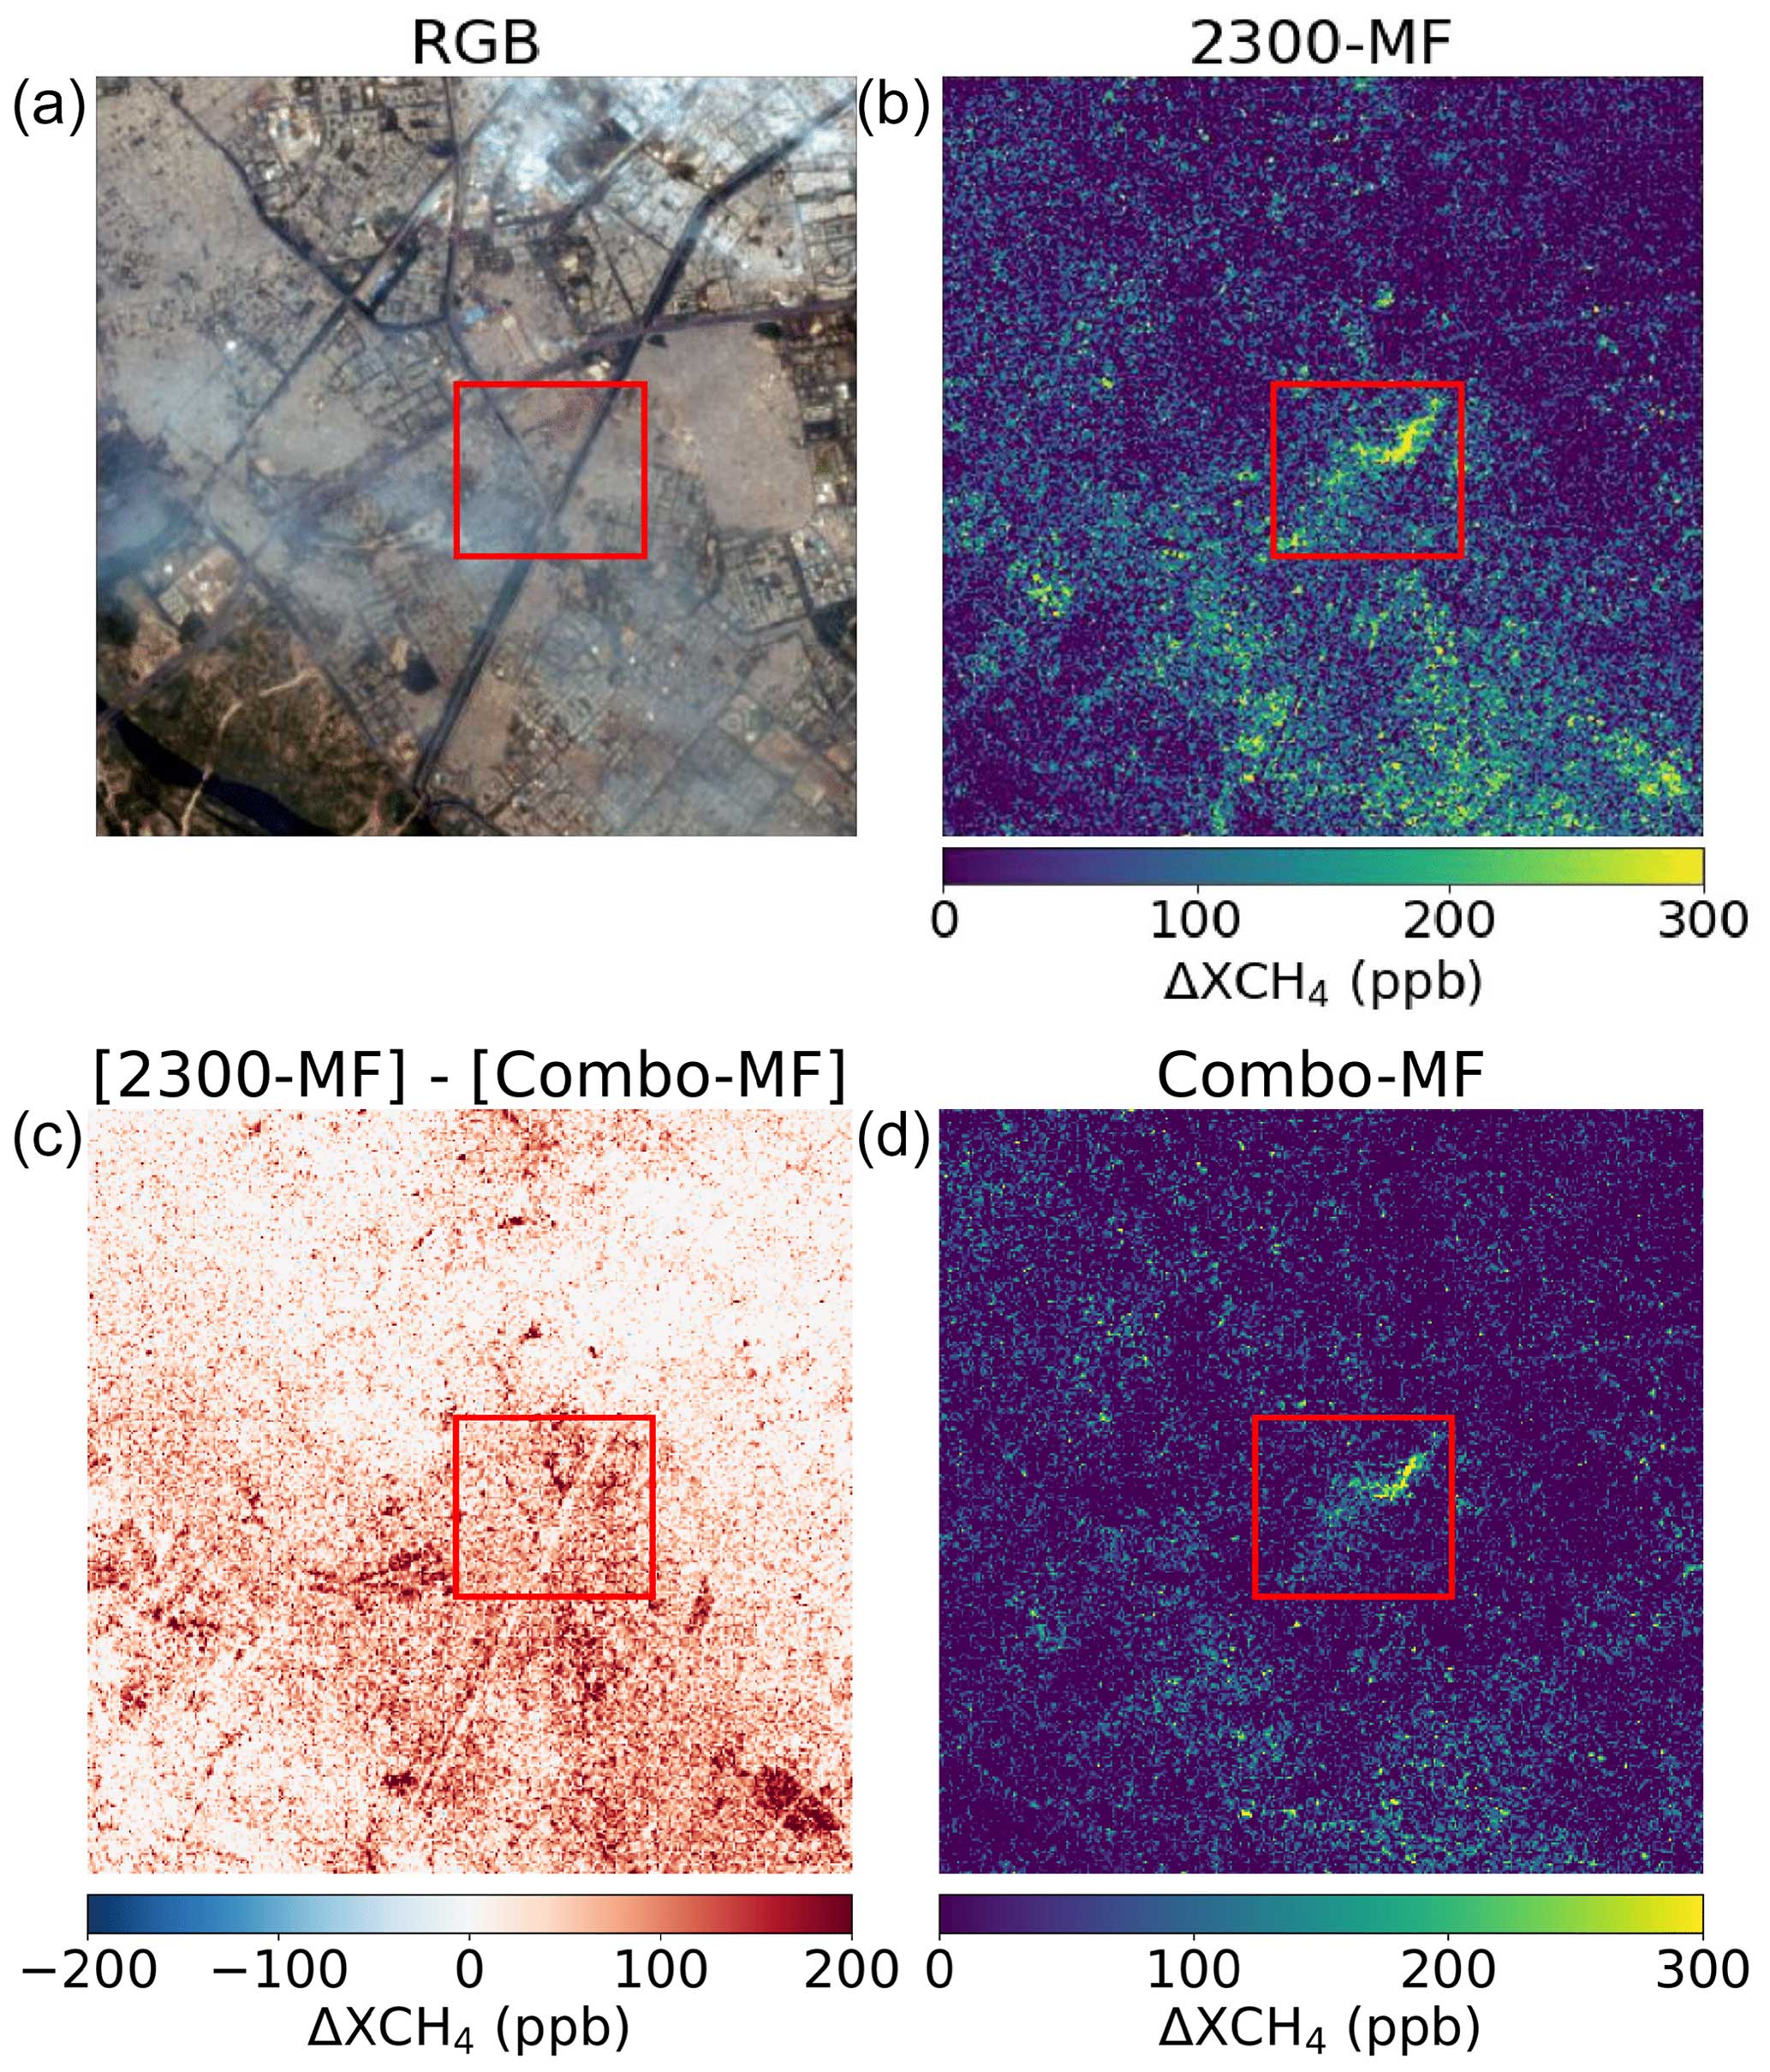
Figure 10Original image (a) as well as 2300-MF (b) and Combo-MF (d) retrievals and the difference between them (c) from an EnMAP dataset in Delhi (India) showing an emission from the Ghazipur landfill (framed in red).
3.2 Real CH4 plume cases
3.2.1 Comparison to MAG1C retrievals with AVIRIS-NG data
In Fig. 9, we compare ΔXCH4 retrievals using 2300-MF, Combo-MF, 2300-MAG1C, and SWIR-MAG1C from an AVIRIS-NG dataset capturing an O&G field site in San Joaquin Valley (US), where two plumes can be observed. The 2300-MAG1C retrieval presents higher ΔXCH4 plume values, as shown in Guanter et al. (2021), and also exhibits a greater number of retrieval artifacts than 2300-MF. These artifacts are further attenuated or totally removed in the SWIR-MAG1C retrieval. However, SWIR-MAG1C enhances some retrieval artifacts that are not shown when using Combo-MF. The latter presents a lower noise compared to 2300-MF, although it is slightly higher than in MAG1C, which leverages the sparsity assumption for its suppression. Therefore, Combo-MF can be considered to be an effective trade-off between reducing background noise and retrieval artifacts. Note that, instead of considering an integration of CH4 over a 8 km high column as with satellite-based data, we use the scene average sensor altitude (2.48 km) from the airborne AVIRIS-NG instrument at acquisition time.
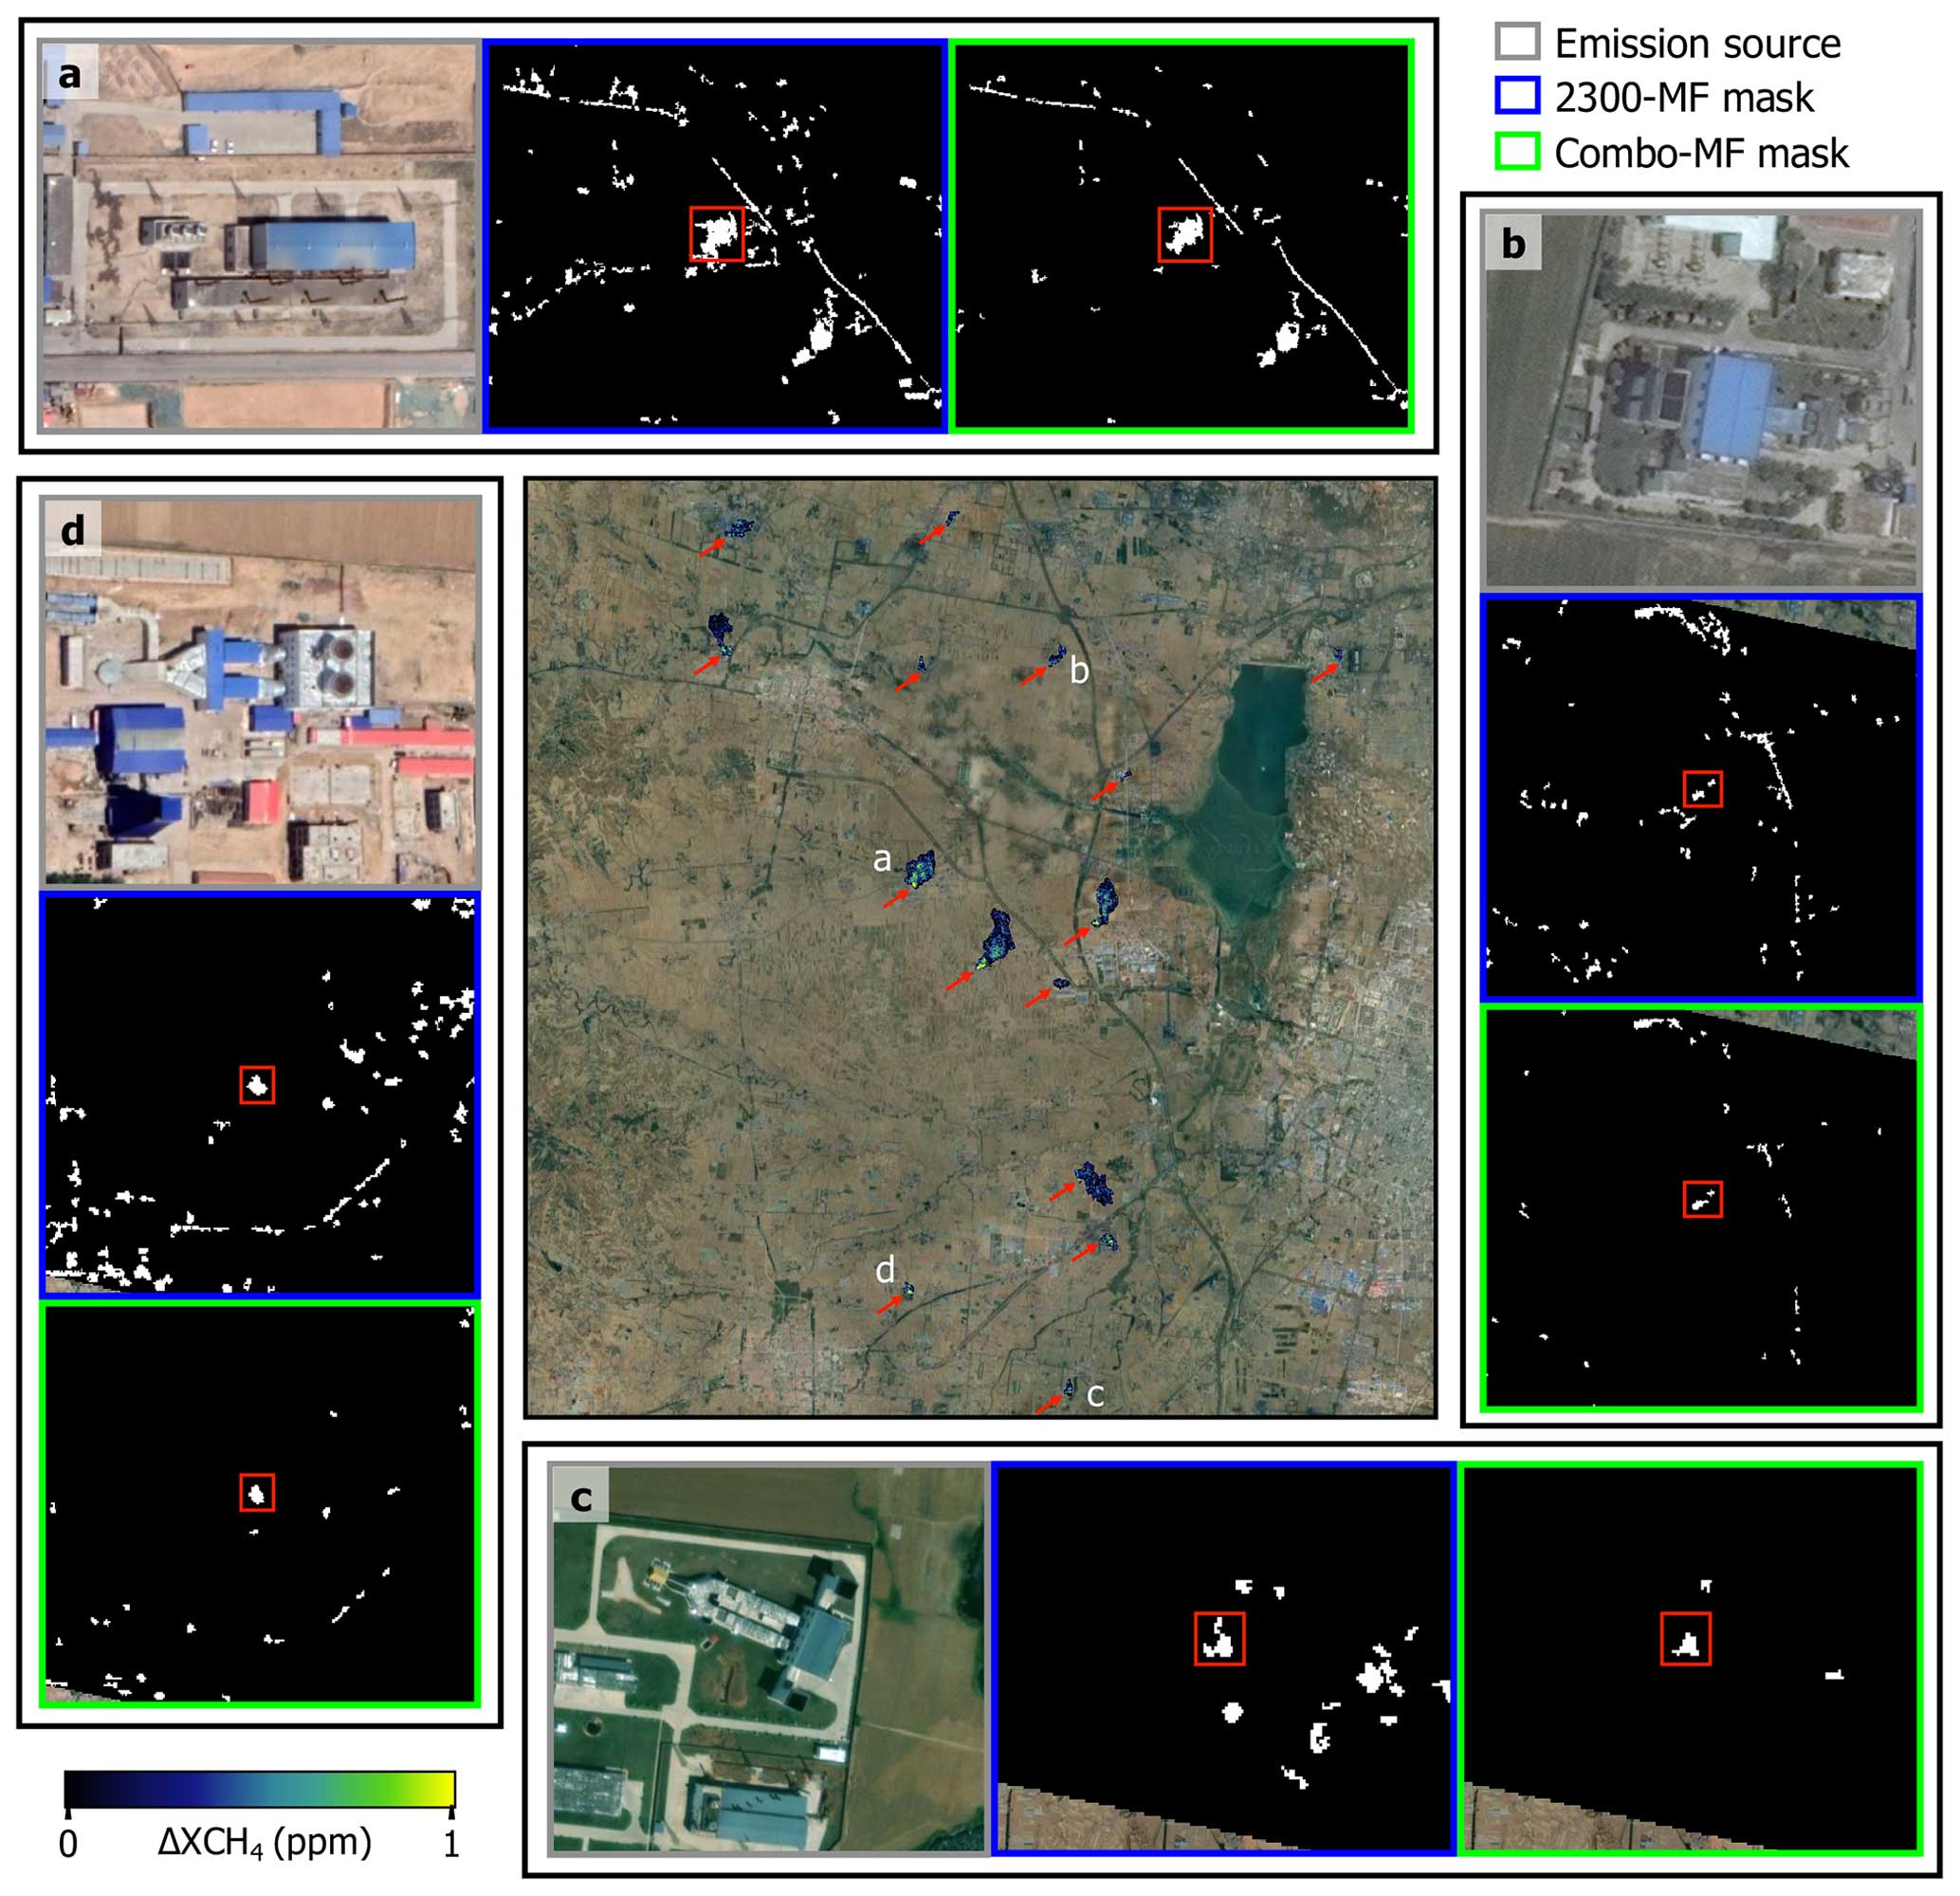
Figure 11Plumes (pointed out with red arrows) detected with the automatic detection algorithm using a PRISMA dataset from a coal mine site in Shanxi (China), overlaid on a © Google Earth high-resolution image (central panel). At the edges, four blocks associated with plumes selected as examples (labeled a–d) display a zoomed-in view of another © Google Earth image of the emission source (gray) and the output masks from the automatic detection algorithm. The masks show the clusters related to the plume (framed in red) and their surroundings for the 2300-MF (blue) and Combo-MF (green) retrievals.
3.2.2 Retrieval performance in a landfill area using EnMAP data
In Fig. 10, the 2300-MF (top right) and Combo-MF (bottom right) retrievals from an EnMAP dataset capturing the Delhi (India) area are compared. Both retrievals show an emission (framed in red) coming from the Ghazipur landfill. While 2300-MF shows a great number of retrieval artifacts related to the urban area and a higher background noise, Combo-MF further attenuates or removes these retrieval artifacts and reduces the positive values from background noise. The difference between both retrievals (bottom left) shows us that there is also attenuation in the pixels where we detect CH4 emission. In fact, we can identify this attenuation in the landfill area in the Combo-MF retrieval. This could be caused by the existence of retrieval artifacts beneath the emission, which would penalize the retrieved enhancements when expanding the matched filter spectral window of application. Although the use of Combo-MF should take into account the surface composition beneath potential methane emissions, it generally improves the detection capability. Note that the atmospheric elements that appear in the original image (top left) are mainly related to pollutants following the Mie scattering, which does not substantially affect radiance at SWIR wavelengths (Roger et al., 2023).
3.2.3 Retrieval performance in a coal mining site using PRISMA data
Combo-MF is well-suited to regions with pronounced heterogeneity because there are usually more retrieval artifacts that can be removed. In order to demonstrate this, we conduct a comprehensive study using a PRISMA dataset from a coal mining site in Shanxi (China) which can be considered heterogeneous. In Fig. 11, we illustrate in the central panel 15 plumes detected in the area with the automatic detection algorithm (see Sect. 2), which are pointed out with red arrows, over a high-resolution image of the area. These plumes originate from potential emission sources and approximately align with the wind direction, which is extracted from GEOS-FP. Therefore, we validate the existence of these emissions. At the edges of the central panel, we observe four blocks associated with plumes (panels a–d), displayed as an example of the detection process across the scene. In these blocks, we show the zoomed-in view of the emission source (gray) and the output masks derived from the automatic detection algorithm used in both the 2300-MF (blue) and the Combo-MF (green) retrievals. While the source of plume a is associated with a drainage station, in panels b–d we observe emissions emanating from venting shafts. In addition, the masked clusters associated with the plumes, framed in red, are illustrated along with their surroundings. We observe that the Combo-MF mask discards an important fraction of the clusters from the 2300-MF mask related to retrieval artifacts coming from surface structures such as roads or facilities. The clutter penalization from Combo-MF also reduces other pixel retrieved enhancements, resulting in a lower number of clusters related to background noise. However, clutter emergence does not always yield ΔXCH4 values in SWIR-MF greater than those in 2300-MF, and therefore they cannot be removed according to Eq. (9). Instead, these values are scaled, which contributes to the appearance of undesired clusters. For instance, right below plume d, a small cluster that is not present in 2300-MF appears in Combo-MF. In addition, the use of a more demanding target spectrum in Combo-MF can lead to the underestimation of weak plume pixels such as those from the plume tail. These pixels can be confused by background noise even after applying the scaling factor f. Therefore, plume clusters such as plume c can present a more reduced shape than in 2300-MF. Altogether, we observe that there is a lower number of clusters around the plume when using Combo-MF, which facilitates plume detection.
In this work, we propose a new matched-filter-based procedure that attenuates or removes retrieval artifacts and also reduces the positive values of background noise. We investigated the retrieval performance in real observations of spectral imagers on satellites and airplanes, using real and simulated plumes, and found a significant increase in CH4 emission detection. First, we implemented simulated CH4 plumes in different PRISMA datasets and conducted a visual comparison. Second, we quantified the synthetic plumes implemented using masks derived from different retrievals. Third, we assessed the interference of H2O and CO2 in CH4 retrievals by means of simulations applied in PRISMA and EnMAP datasets. Finally, we evaluated retrievals containing CH4 emissions from real AVIRIS-NG, EnMAP, and PRISMA data to compare the proposed procedure to already-existing procedures using an automatic detection algorithm and visual inspection.
Our analysis reveals that Combo-MF effectively attenuates or practically removes an important fraction of retrieval artifacts while maintaining plume ΔXCH4 values at levels comparable to those obtained with 2300-MF. In addition, plume masking resulting from Combo-MF is less affected by background noise for small flux rate values (Q<1000 kg h−1), translating to a lower sensitivity to clutter. Nevertheless, emissions over surface structures linked to artifacts can be considerably attenuated in the Combo-MF retrieval due to the penalization of the underlying surface, as seen in the Ghazipur landfill case. Moreover, local enhancements of H2O or CO2 interfering with CH4 emissions, as observed in inefficient flaring cases, can attenuate the plume enhancement in the ΔXCH4 maps. On the other hand, atmospheric H2O and CO2 concentrations have a negligible impact on the retrievals because of the homogeneous distribution of these trace gases across the retrieved area. We also evaluated the performance of MAG1C using the 1000–2500 nm spectral range, observing a reduction in the number of retrieval artifacts compared to the default 2122–2488 nm window. Despite this reduced number and the lower background noise, it generates plumes with higher ΔXCH4 values and still exhibits a greater number of artifacts compared to Combo-MF retrievals. Therefore, Combo-MF can be considered an optimal trade-off between background noise and retrieval artifact reduction, generally leading to an improved plume detection capability. This is illustrated by a comprehensive analysis in a PRISMA dataset, where the output masks from an automatic detection algorithm show an important reduction in the number of clusters not related to CH4 emissions.
Data used in this article are public. They can be found on PRISMA and EnMAP portals and on the JPL website.
JR: conceptualization, methodology, formal analysis, investigation, writing (original draft), writing (review and editing). LG: conceptualization, resources, writing (review and editing), supervision. JG: conceptualization, methodology, writing (review and editing). II-L: formal analysis, resources, writing (review and editing).
The contact author has declared that none of the authors has any competing interests.
Publisher’s note: Copernicus Publications remains neutral with regard to jurisdictional claims made in the text, published maps, institutional affiliations, or any other geographical representation in this paper. While Copernicus Publications makes every effort to include appropriate place names, the final responsibility lies with the authors.
The authors thank the Italian Space Agency, the DLR Space Agency, and the JPL team for the PRISMA, EnMAP, and AVIRIS-NG data used in this work, respectively. We are grateful to Daniel J. Varon for the WRF-LES-modeled plumes used in this study. Javier Roger, Javier Gorroño, and Luis Guanter received funding from ESA (contract no. 4000134929).
This work has been funded by the ESA project HiResCH4, which is framed in Future EO-1 EO Science for Society Permanently Open Call for Proposals (grant number: 4000135294/21/I-DT-lr (CCN)).
This paper was edited by Udo Friess and reviewed by Marvin Knapp and one anonymous referee.
Ayasse, A. K., Thorpe, A. K., Roberts, D. A., Funk, C. C., Dennison, P. E., Frankenberg, C., Steffke, A., and Aubrey, A. D.: Evaluating the effects of surface properties on methane retrievals using a synthetic airborne visible/infrared imaging spectrometer next generation (AVIRIS-NG) image, Remote Sens. Environ., 215, 386–397, https://doi.org/10.1016/j.rse.2018.06.018, 2018. a
Ayasse, A. K., Thorpe, A. K., Cusworth, D. H., Kort, E. A., Negron, A. G., Heckler, J., Asner, G., and Duren, R. M.: Methane remote sensing and emission quantification of offshore shallow water oil and gas platforms in the Gulf of Mexico, Environ. Res. Lett., 17, 084039, https://doi.org/10.1088/1748-9326/ac8566, 2022. a
Copernicus Climate Change Service, Climate Data Store: Carbon dioxide data from 2002 to present derived from satellite observations, Copernicus Climate Change Service (C3S) Climate Data Store (CDS), https://doi.org/10.24381/cds.f74805c8, 2018. a
Cusworth, D., Thorpe, A., Miller, C., Ayasse, A., Jiorle, R., Duren, R., Nassar, R., Mastrogiacomo, J.-P., and Nelson, R.: Two years of satellite-based carbon dioxide emission quantification at the world’s largest coal-fired power plants, EGUsphere [preprint], https://doi.org/10.5194/egusphere-2023-1408, 2023. a
Cusworth, D. H., Jacob, D. J., Varon, D. J., Chan Miller, C., Liu, X., Chance, K., Thorpe, A. K., Duren, R. M., Miller, C. E., Thompson, D. R., Frankenberg, C., Guanter, L., and Randles, C. A.: Potential of next-generation imaging spectrometers to detect and quantify methane point sources from space, Atmos. Meas. Tech., 12, 5655–5668, https://doi.org/10.5194/amt-12-5655-2019, 2019. a
Duren, R., Thorpe, A., Foster, K., Rafiq, T., Hopkins, F., Yadav, V., Bue, B., Thompson, D., Conley, S., Colombi, N., Frankenberg, C., McCubbin, I., Eastwood, M., Falk, M., Herner, J., Croes, B., Green, R., and Miller, C.: California's methane super-emitters, Nature, 575, 180–184, https://doi.org/10.1038/s41586-019-1720-3, 2019. a
Eismann, M.: Hyperspectral Remote Sensing, vol. PM210 of SPIE Press Monograph, Society of Photo Optical, ISBN 9780819487872, 2012. a
Foote, M. D., Dennison, P. E., Thorpe, A. K., Thompson, D. R., Jongaramrungruang, S., Frankenberg, C., and Joshi, S. C.: Fast and Accurate Retrieval of Methane Concentration From Imaging Spectrometer Data Using Sparsity Prior, IEEE Trans. Geosci. Remote Sens., 58, 6480–6492, 2020. a
Foote, M. D., Dennison, P. E., Sullivan, P. R., O'Neill, K. B., Thorpe, A. K., Thompson, D. R., Cusworth, D. H., Duren, R., and Joshi, S. C.: Impact of scene-specific enhancement spectra on matched filter greenhouse gas retrievals from imaging spectroscopy, Remote Sens. Environ., 264, 112574, https://doi.org/10.1016/j.rse.2021.112574, 2021. a
Frankenberg, C., Platt, U., and Wagner, T.: Iterative maximum a posteriori (IMAP)-DOAS for retrieval of strongly absorbing trace gases: Model studies for CH4 and CO2 retrieval from near infrared spectra of SCIAMACHY onboard ENVISAT, Atmos. Chem. Phys., 5, 9–22, https://doi.org/10.5194/acp-5-9-2005, 2005. a
Frankenberg, C., Thorpe, A. K., Thompson, D. R., Hulley, G., Kort, E. A., Vance, N., Borchardt, J., Krings, T., Gerilowski, K., Sweeney, C., Conley, S., Bue, B. D., Aubrey, A. D., Hook, S., and Green, R. O.: Airborne methane remote measurements reveal heavy-tail flux distribution in Four Corners region, P. Natl. Acad. Sci. USA, 113, 9734–9739, https://doi.org/10.1073/pnas.1605617113, 2016. a
Guanter, L., Segl, K., Sang, B., Alonso, L., Kaufmann, H., and Moreno, J.: Scene-based spectral calibration assessment of high spectral resolution imaging spectrometers, Opt. Express, 17, 11594–11606, https://doi.org/10.1364/OE.17.011594, 2009. a
Guanter, L., Kaufmann, H., Segl, K., et al.: The EnMAP Spaceborne Imaging Spectroscopy Mission for Earth Observation, Remote Sens., 7, 8830–8857, https://doi.org/10.3390/rs70708830, 2015. a
Guanter, L., Irakulis-Loitxate, I., Gorroño, J., Sánchez-García, E., Cusworth, D. H., Varon, D. J., Cogliati, S., and Colombo, R.: Mapping methane point emissions with the PRISMA spaceborne imaging spectrometer, Remote Sens. Environ., 265, 112671, https://doi.org/10.1016/j.rse.2021.112671, 2021. a, b, c, d, e, f, g
Irakulis-Loitxate, I., Guanter, L., Liu, Y.-N., Varon, D. J., Maasakkers, J. D., Zhang, Y., Chulakadabba, A., Wofsy, S. C., Thorpe, A. K., Duren, R. M., Frankenberg, C., Lyon, D. R., Hmiel, B., Cusworth, D. H., Zhang, Y., Segl, K., Gorroño, J., Sánchez-García, E., Sulprizio, M. P., Cao, K., Zhu, H., Liang, J., Li, X., Aben, I., and Jacob, D. J.: Satellite-based survey of extreme methane emissions in the Permian basin, Sci. Adv., 7, eabf4507, https://doi.org/10.1126/sciadv.abf4507, 2021. a, b, c
Jervis, D., McKeever, J., Durak, B. O. A., Sloan, J. J., Gains, D., Varon, D. J., Ramier, A., Strupler, M., and Tarrant, E.: The GHGSat-D imaging spectrometer, Atmos. Meas. Tech., 14, 2127–2140, https://doi.org/10.5194/amt-14-2127-2021, 2021. a
Knapp, M., Scheidweiler, L., Külheim, F., Kleinschek, R., Necki, J., Jagoda, P., and Butz, A.: Spectrometric imaging of sub-hourly methane emission dynamics from coal mine ventilation, Environ. Res. Lett., 18, 044030, https://doi.org/10.1088/1748-9326/acc346, 2023. a
Lan, X., Thoning, K. W., and Dlugokencky, E. J.: Trends in globally-averaged CH4, N2O, and SF6 determined from NOAA Global Monitoring Laboratory measurements, Version 2024-02, https://doi.org/10.15138/P8XG-AA10, 2023. a
Loizzo, R., Guarini, R., Longo, F., Scopa, T., Formaro, R., Facchinetti, C., and Varacalli, G.: Prisma: The Italian Hyperspectral Mission, 175–178, https://doi.org/10.1109/IGARSS.2018.8518512, 2018. a
Lou, H., Zhang, J., Yang, S., Cai, M., Ren, X., Luo, Y., and Li, C.: Exploring the Relationships of Atmospheric Water Vapor Contents and Different Land Surfaces in a Complex Terrain Area by Using Doppler Radar, Atmosphere, 12, 528, https://doi.org/10.3390/atmos12050528, 2021. a
Manolakis, D., Lockwood, R., Cooley, T., and Jacobson, J.: Robust Matched Filters for Target Detection in Hyperspectral Imaging Data, in: 2007 IEEE International Conference on Acoustics, Speech Signal Proc. ICASSP '07, vol. 1, I-529–I-532, https://doi.org/10.1109/ICASSP.2007.366733, 2007. a
Masood, F., Ahmad, S., and Malik, A.: Role of Methanotrophs in Mitigating Global Warming, 43–60, Springer Singapore, Singapore, ISBN 978-981-33-4508-9, https://doi.org/10.1007/978-981-33-4508-9_4, 2021. a
Mayfield, E. N., Robinson, A. L., and Cohon, J. L.: System-wide and Superemitter Policy Options for the Abatement of Methane Emissions from the U.S. Natural Gas System, Environ. Sci. Technol., 51, 4772–4780, https://doi.org/10.1021/acs.est.6b05052, 2017. a
Mieruch, S., Schröder, M., Noël, S., and Schulz, J.: Comparison of decadal global water vapor changes derived from independent satellite time series, J. Geophys. Res.-Atmos., 119, 12489–12499, https://doi.org/10.1002/2014JD021588, 2014. a
Ming, T., Li, W., Yuan, Q., Davies, P., de Richter, R., Peng, C., Deng, Q., Yuan, Y., Caillol, S., and Zhou, N.: Perspectives on removal of atmospheric methane, Adv. Appl. Energy, 5, 100085, https://doi.org/10.1016/j.adapen.2022.100085, 2022. a
Molod, A., Takacs, L., Suarez, M., Bacmeister, J., Song, I.-S., and Eichmann, A.: The GEOS-5 Atmospheric General Circulation Model: Mean Climate and Development from MERRA to Fortuna, NASA TM-2012-104606, https://portal.nccs.nasa.gov/datashare/gmao/geos-fp/das/ (last access: 12 November 2023), 2012. a
Ocko, I. B., Sun, T., Shindell, D., Oppenheimer, M., Hristov, A. N., Pacala, S. W., Mauzerall, D. L., Xu, Y., and Hamburg, S. P.: Acting rapidly to deploy readily available methane mitigation measures by sector can immediately slow global warming, Environ. Res. Lett., 16, 054042, https://doi.org/10.1088/1748-9326/abf9c8, 2021. a
Roger, J., Irakulis-Loitxate, I. Valverde, A., Gorroño, J., Chabrillat, S., Brell, M., and Guanter, L.: High-resolution methane mapping with the EnMAP satellite imaging spectroscopy mission [Preprint], https://doi.org/10.31223/X5M65Z, 2023. a, b
Spectral Sciencies, Inc.: The MODTRAN© (MODerate resolution atmospheric TRANsmission) computer code, http://modtran.spectral.com/ (last access: 12 November 2023), 2016. a
Thompson, D. R., Leifer, I., Bovensmann, H., Eastwood, M., Fladeland, M., Frankenberg, C., Gerilowski, K., Green, R. O., Kratwurst, S., Krings, T., Luna, B., and Thorpe, A. K.: Real-time remote detection and measurement for airborne imaging spectroscopy: a case study with methane, Atmos. Meas. Tech., 8, 4383–4397, https://doi.org/10.5194/amt-8-4383-2015, 2015. a, b
Thompson, D. R., Thorpe, A. K., Frankenberg, C., Green, R. O., Duren, R., Guanter, L., Hollstein, A., Middleton, E., Ong, L., and Ungar, S.: Space-based remote imaging spectroscopy of the Aliso Canyon CH4 superemitter, Geophys. Res. Lett., 43, 6571–6578, https://doi.org/10.1002/2016GL069079, 2016. a, b
Thorpe, A. K., Roberts, D. A., Bradley, E. S., Funk, C. C., Dennison, P. E., and Leifer, I.: High resolution mapping of methane emissions from marine and terrestrial sources using a Cluster-Tuned Matched Filter technique and imaging spectrometry, Remote Sens. Environ., 134, 305–318, https://doi.org/10.1016/j.rse.2013.03.018, 2013. a
Thorpe, A. K., Frankenberg, C., and Roberts, D. A.: Retrieval techniques for airborne imaging of methane concentrations using high spatial and moderate spectral resolution: application to AVIRIS, Atmos. Meas. Tech., 7, 491–506, https://doi.org/10.5194/amt-7-491-2014, 2014. a, b
Thorpe, A. K., Frankenberg, C., Thompson, D. R., Duren, R. M., Aubrey, A. D., Bue, B. D., Green, R. O., Gerilowski, K., Krings, T., Borchardt, J., Kort, E. A., Sweeney, C., Conley, S., Roberts, D. A., and Dennison, P. E.: Airborne DOAS retrievals of methane, carbon dioxide, and water vapor concentrations at high spatial resolution: application to AVIRIS-NG, Atmos. Meas. Tech., 10, 3833–3850, https://doi.org/10.5194/amt-10-3833-2017, 2017. a
UNEP: Global Methane Assessment: Benefits and Costs of Mitigating Methane Emissions, https://www.unep.org/resources/report/global-methane-assessment-benefits-and-costs- mitigating (last access: 12 November 2023), 2021. a
Varon, D. J., Jacob, D. J., McKeever, J., Jervis, D., Durak, B. O. A., Xia, Y., and Huang, Y.: Quantifying methane point sources from fine-scale satellite observations of atmospheric methane plumes, Atmos. Meas. Tech., 11, 5673–5686, https://doi.org/10.5194/amt-11-5673-2018, 2018. a, b, c