the Creative Commons Attribution 4.0 License.
the Creative Commons Attribution 4.0 License.
 | 10 Jan 2024
Evaluation of in situ observations on Marine Weather Observer during Typhoon Sinlaku
Wenying He
Hongbin Chen
Hongyong Yu
Jun Li
Jidong Pan
Shuqing Ma
Xuefen Zhang
Rang Guo
Bingke Zhao
Xi Chen
Xiangao Xia
Kaicun Wang
The mobile ocean weather observation system, named Marine Weather Observer (MWO), developed by the Institute of Atmospheric Physics (IAP), consists of a fully solar-powered, unoccupied vehicle and meteorological and hydrological instruments. One of the MWOs completed a long-term continuous observation, actively approaching the center of Typhoon Sinlaku from 24 July to 2 August 2020, over the South China Sea. The in situ and high-temporal-resolution (1 min) observations obtained from MWO were analyzed and evaluated through comparison with the observations made by two types of buoys during the evolution of Typhoon Sinlaku. First, the air pressure and wind speed measured by MWO are in good agreement with those measured by the buoys before the typhoon, reflecting the equivalent measurement capabilities of the two methods under normal sea conditions. The sea surface temperature (SST) between MWO and the mooring buoys is highly consistent throughout the observation period, indicating the high stability and accuracy of SST measurements from MWO during the typhoon evolution. The air temperature and relative humidity measured by MWO have significant diurnal variations, generally lower than those measured by the buoys, which may be related to the mounting height and sensitivity of sensors. When actively approaching the typhoon center, the air pressure from MWO can reflect some drastic and subtle changes, such as a sudden drop to 980 hPa, which is difficult to obtain by other observation methods. As a mobile meteorological and oceanographic observation station, MWO has shown its unique advantages over traditional observation methods, and the results preliminarily demonstrate the reliable observation capability of MWO in this paper.
- Article
(4935 KB) - Full-text XML
- BibTeX
- EndNote


Marine meteorological hazards, including typhoons, fog, strong winds, and many other extreme weather events, occur frequently over China (Xu et al., 2009). In particular, typhoons that make landfall off the southeast coast of China cause direct economic losses of about 0.4 % of the gross domestic product and more than 500 deaths per year (Lei, 2020). Many efforts have been made in recent decades to improve the understanding of typhoon genesis and evolution and the forecasting of typhoon paths (Bender et al., 2007; Black et al., 2007; Sanford et al., 2007; Bell et al., 2012). However, errors in model initial conditions remain the main cause of typhoon forecast uncertainty due to the scarcity of real-time ocean meteorological observations, especially in distant waters (Zheng et al., 2008; Rogers et al., 2013; Ito and Wu, 2013; Emanuel and Center, 2018). Currently, marine observations over China are very limited and rarely occur in the deep ocean (Dai et al., 2014; Chen et al., 2019). This situation greatly limits the development of marine meteorology, especially the improvement of typhoon forecasting. Therefore, there is a urgent need to develop advanced observation techniques at sea. With the rapid development of satellite communication and navigation technology as well as sensor technologies in recent years, marine unoccupied autonomous observation systems have been increasingly broken and applied at sea (Lenan and Melville, 2014; Wynn et al., 2014; Thomson and Girton, 2017).
To obtain more meteorological observations at sea, the Institute of Atmospheric Physics (IAP), Chinese Academy of Sciences, has developed an automatic and mobile marine weather observation system based on a solar-powered, unoccupied vehicle, named Marine Weather Observer (MWO). To test the observation capability and endurance, one of the MWOs cruised over the South China Sea from June to August 2020, during which a tropical cyclone formed and turned into a weak typhoon. The MWO was then remotely controlled to actively approach the center of Typhoon Sinlaku on 1 August 2020, providing valuable in situ observations for typhoon research and forecasting (Chen et al., 2021, hereafter Chen21).
To better understand the quality of observations obtained from MWO, we directly compared the observations of MWO and several buoys around it over the South China Sea during the evolution of Typhoon Sinlaku. The outline of the paper is described as follows: in Sect. 2, we briefly describe Typhoon Sinlaku and the observations obtained from MWO and the buoys. Then, MWO observations and the comparisons with buoys observations are presented in Sect. 3. The observation difference between MWO and buoys is discussed in Sect. 4, and finally a summary is given in Sect. 5.
Typhoon Sinlaku (no. 2003) formed as a tropical depression over the South China Sea on 31 July 2020, then intensified into a typhoon on 1 August. The center of the typhoon crossed Hainan Island, China, at a speed of 25 km h−1 and finally made landfall off the coast of Thanh Hoa City, Vietnam, at 08:40 UTC on 2 August.
To better monitor the evolution of Typhoon Sinlaku, MWO was used for the first time to obtain in situ meteorological observations under extreme sea conditions. The MWO design and performance were described in detail in Chen21. Measurements of atmospheric and oceanic environment variables are accomplished with instruments mounted on MWO, including the AirMar 220WX automatic weather station, mini-CT sensor, and pyranometer. High-temporal-resolution (1 min) data on atmospheric temperature and humidity, air pressure, wind speed, wind direction, sea surface temperature (SST), seawater conductivity, and total radiation can be automatically transmitted to the ground control center via the Beidou communication satellite. Detailed technical specifications of the meteorological and hydrological sensors can be found in Chen21.
To evaluate the quality of the observations obtained from MWO, we mainly compared them in this paper with the buoy observations conducted simultaneously during the Typhoon Sinlaku observation experiments from 22 July to 4 August (Zhang et al., 2021; Qin et al., 2022). The buoy data consisted mainly of five mooring and two drifting buoys that were able to provide the same environmental variables measured on MWO from 23 July to 2 August with a 10 min interval. Thus, the 1 min observations from the MWO were averaged into 10 min results and then matched with the 10 min observations from the buoys. More than 1300 matched samples at 10 min intervals were obtained from 24 July to 2 August 2020, covering the main evolution periods of Typhoon Sinlaku in the South China Sea.
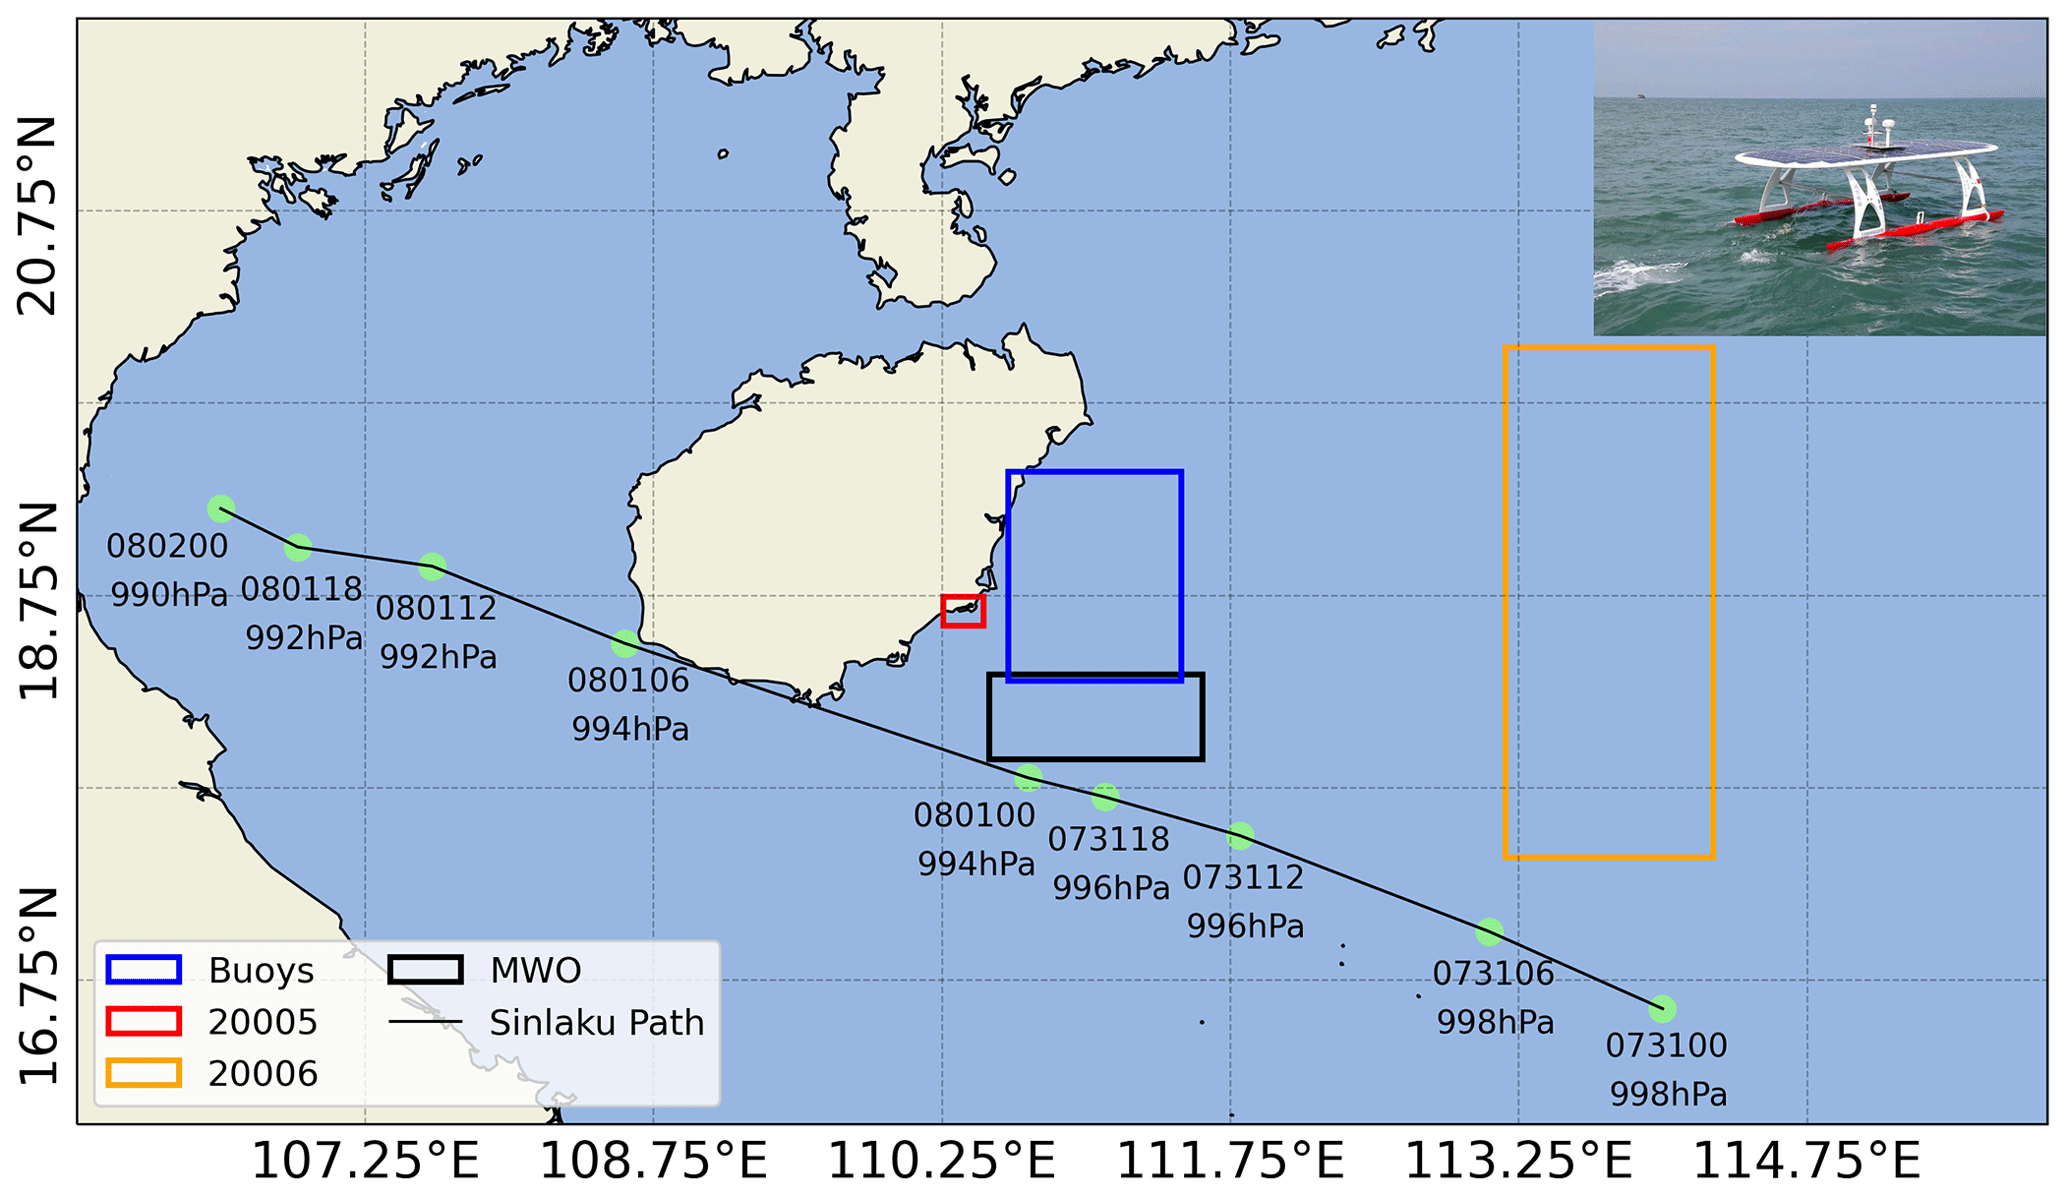
Figure 1Observation ranges of three observation methods, including five mooring buoys in the blue box, two drifting buoys (20005 and 20006), and MWO (as shown in the small photo in the upper right corner). The red, orange, and black boxes are the observation ranges of two drifting buoys and MWO from 24 July to 2 August 2020, respectively. The light-green dots marked with date and surface level pressure on the black line are the locations of Typhoon Sinlaku from 00:00 UTC on 31 July to 00:00 UTC on 2 August, which is from the best track typhoon provided by the Japan Meteorological Agency.
From the locations and the observation ranges of the buoys and MWO in Fig. 1, it can be seen that for the two drifting buoys (20005 and 20006, named D05 and D06, respectively), the drifting range of D05 is very close to the moving area of MWO, while the drifting path of D06 is about 3–4∘ from MWO in longitude. For the five mooring buoys in the blue box, one buoy named M64 is the closest, while the others are located within about 100 km from MWO.
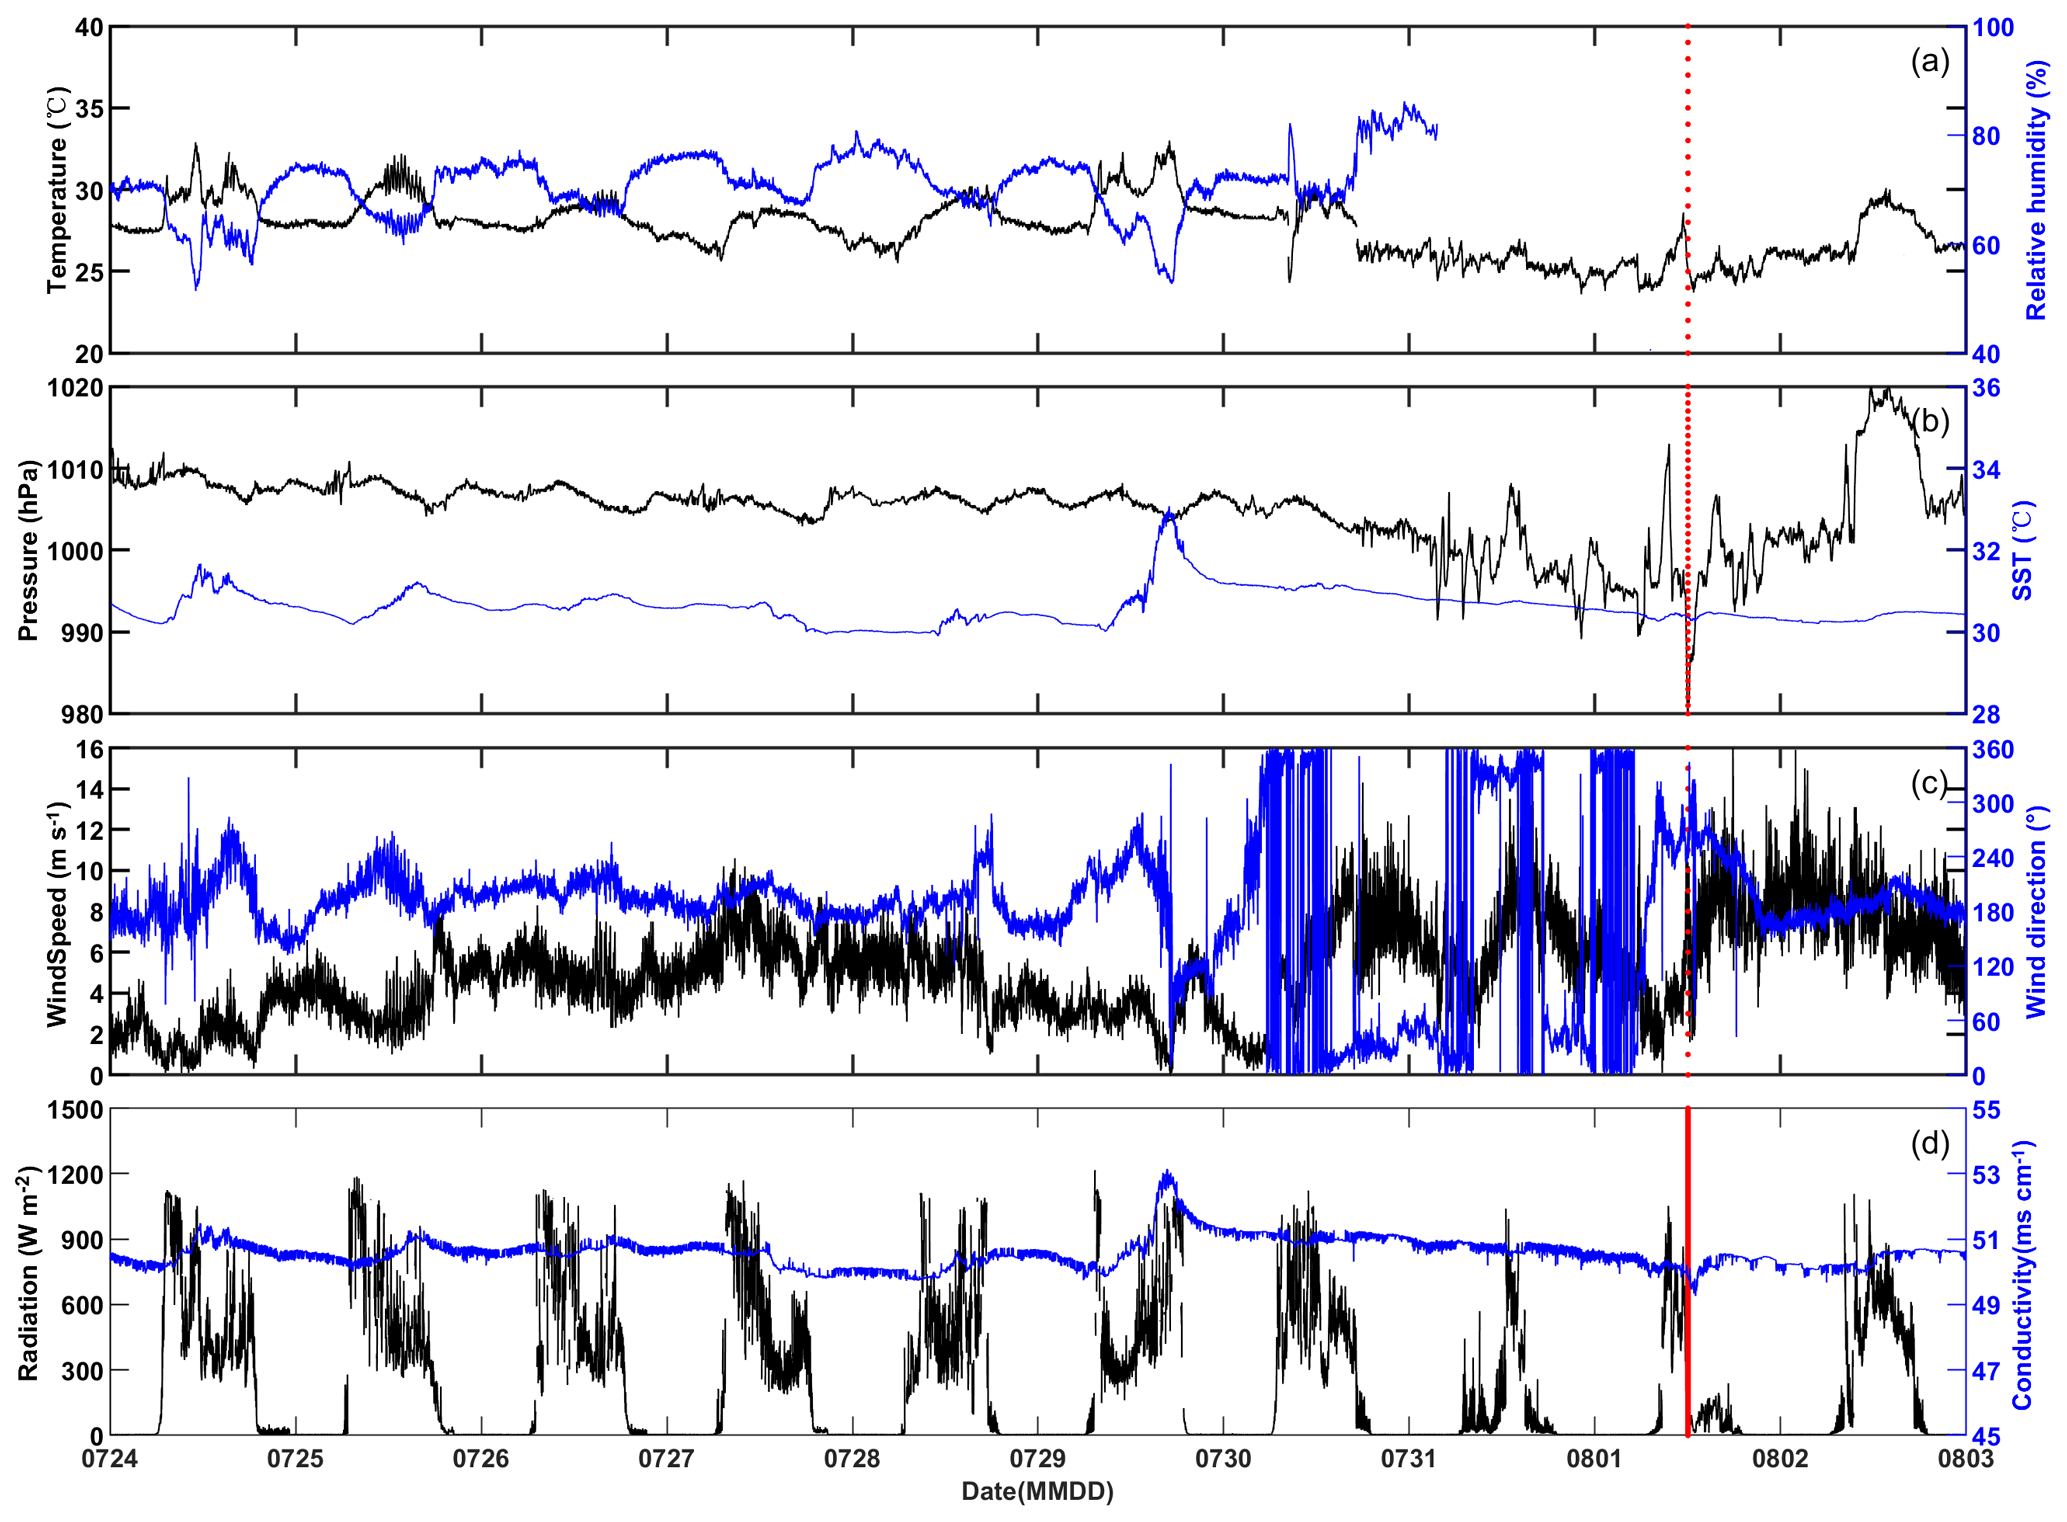
Figure 2Time series of (a) air temperature and relative humidity, (b) SST and atmospheric pressure, (c) wind speed and direction, and (d) total radiation and seawater conductivity collected on board MWO in the 1 min interval during the South China Sea typhoon observation experiment from 24 July to 2 August 2020. The dashed red line represents the nearest times of MWO passing through the typhoon center.
3.1 The observations from MWO
First, the time series of environmental variables measured by MWO at a 1 min interval from 24 July to 2 August 2020 are presented in Fig. 2. It should be noted that the time used in the following is local time (shortened as LT), also known as Beijing time. It can be seen that in the first stage before the arrival of the typhoon, such as 24–29 July, the air temperature and humidity show a clear diurnal variation and negative correlations, and the air pressure, SST, and seawater conductivity also show small and stable variation.
Then, from late 29 July to 1 August, the typhoon moved toward the observation area of MWO. The wind gradually strengthened, and the wind direction frequently changed from south to north. The air pressure, air temperature, SST, and seawater conductivity gradually decreased. On 31 July, MWO was about 30 km away from Typhoon Sinlaku and then actively moved to the predicted path of Sinlaku by remote control. The drastic changes in air pressure and wind speed can be seen around noon on 1 August. Unfortunately, the humidity sensor stopped working on 31 July.
MWO arrived at the predicted passing area of Sinlaku on 1 August at 09:28, with a pressure of 1011 hPa at that time. Then the air pressure decreased to 992 hPa around 11:40 and even rapidly dropped to the lowest 980 hPa at 11:58. Subsequently, the pressure gradually rose and increased to 992 hPa at 12:56, accompanied by strong winds of 15.1 m s−1.
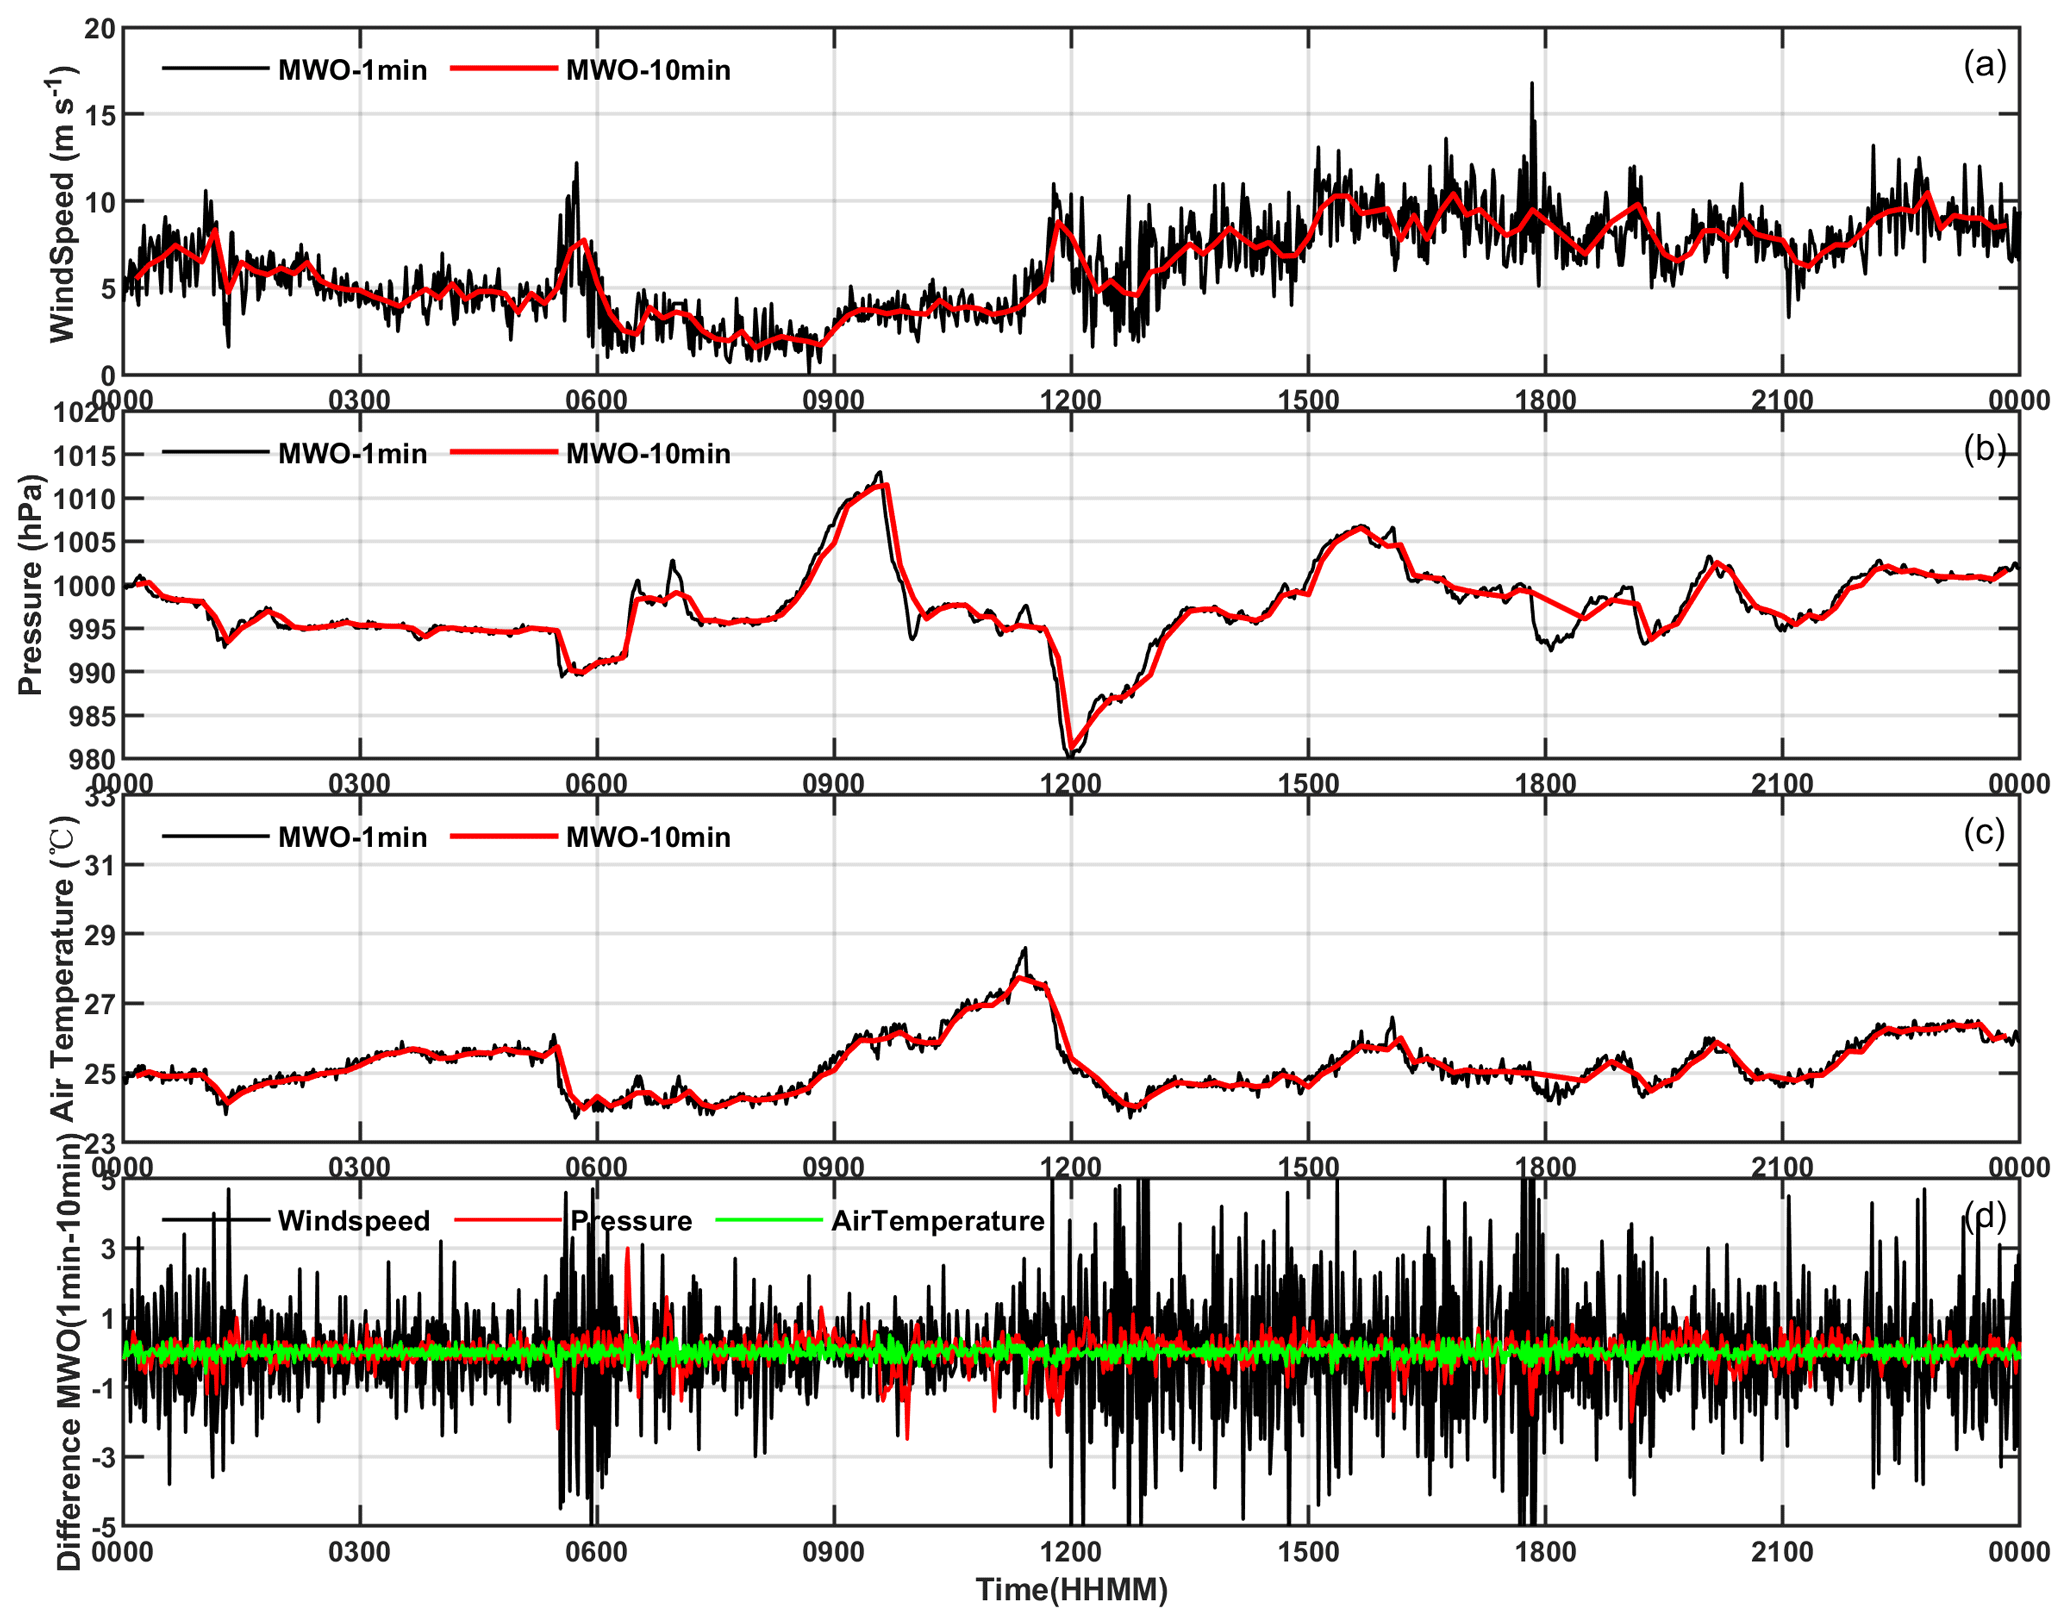
Figure 3The 1 and 10 min data for wind speed (a), air pressure (b), and temperature (c) and their difference (d) from MWO on 1 August.
Such drastic fluctuations of air pressure over sea indicated that MWO might be cross the typhoon center around 12:00 on 1 August. The subsequent path verification also proved that MWO was nearly 2.4 km away from the typhoon path issued by the Central Meteorological Observatory (CMO) of the China Meteorological Administration, which reflected that MWO successfully passed through the center of Typhoon Sinlaku. When Sinlaku moved away from MWO observation range on 2 August, the wind speed gradually decreased and varied less in direction. Compared with the normal sea conditions in the first stage, we call the next 4 d (from 30 July to 2 August) the second stage, with larger changes in sea conditions.
To match the 10 min observations from the buoy, we reprocessed the 1 min observations provided by MWO to the 10 min average. Usually, under stable sea conditions, the differences in meteorological variables over time may be slight in the short term. When the typhoon arrived on 1 August and MWO approached the typhoon center, the variables measured on MWO showed significant changes in Fig. 2. Therefore, the difference between 1 and 10 min averaged meteorological variables may be useful for detecting fine-scale structure during typhoons.
Thus, the differences between the 1 and 10 min results for the three variables, including wind speed, air pressure, and air temperature, on 1 August, are shown in Fig. 3. It is clear that the trends in air pressure (Fig. 3b) are consistent for both time windows; for example, there are two peaks from 6:00 to 10:00 and a sharp drop to 980 hPa around 12:00. The air temperature in Fig. 3c also shows a highly consistent variation in the 1 and 10 min results. However, there is a significant difference in the wind speed between the two time windows (Fig. 3a). Before 12:00, both wind speeds are close to each other and are relatively consistent. As the MWO approaches the typhoon center after 12:00, the 1 min wind speed varies more significantly than the 10 min wind speed until 18:00. it is assumed that the 10 min window may reflect the average state of the wind field to some extent. The significant difference between the 1 and 10 min wind speeds reflects the changes in the fine-scale structure of the wind field during the typhoon evolution. As shown in Fig. 3d, the differences in pressure and temperature in the two time windows were mostly close to zero and did not vary much throughout the day on 1 August. In contrast, the wind speed varies greatly with different time interval during most of the day, especially around 06:00 and 12:00–18:00, where the wind speed difference is as high as 5 m s−1. This also reflects the apparent fluctuating behavior of the 1 min wind field, indicating strong turbulent activity in the near-surface atmosphere. There has been a lot of research work on horizontal roll and tornado-scale vortices of typhoons, which are closely related to the drastic changes in the wind field (Morrison et al., 2005; Lorsolo et al., 2008; Wurman and Kosiba, 2018; Wu et al., 2020). Most of the previous work has been based mainly on hurricane landfalls observed by Doppler radar deployed near the coast. In this work, in situ observations of MWOs that can actively cross typhoon centers in distant oceanic regions will provide a new perspective to study the fine structural changes during typhoon evolution.
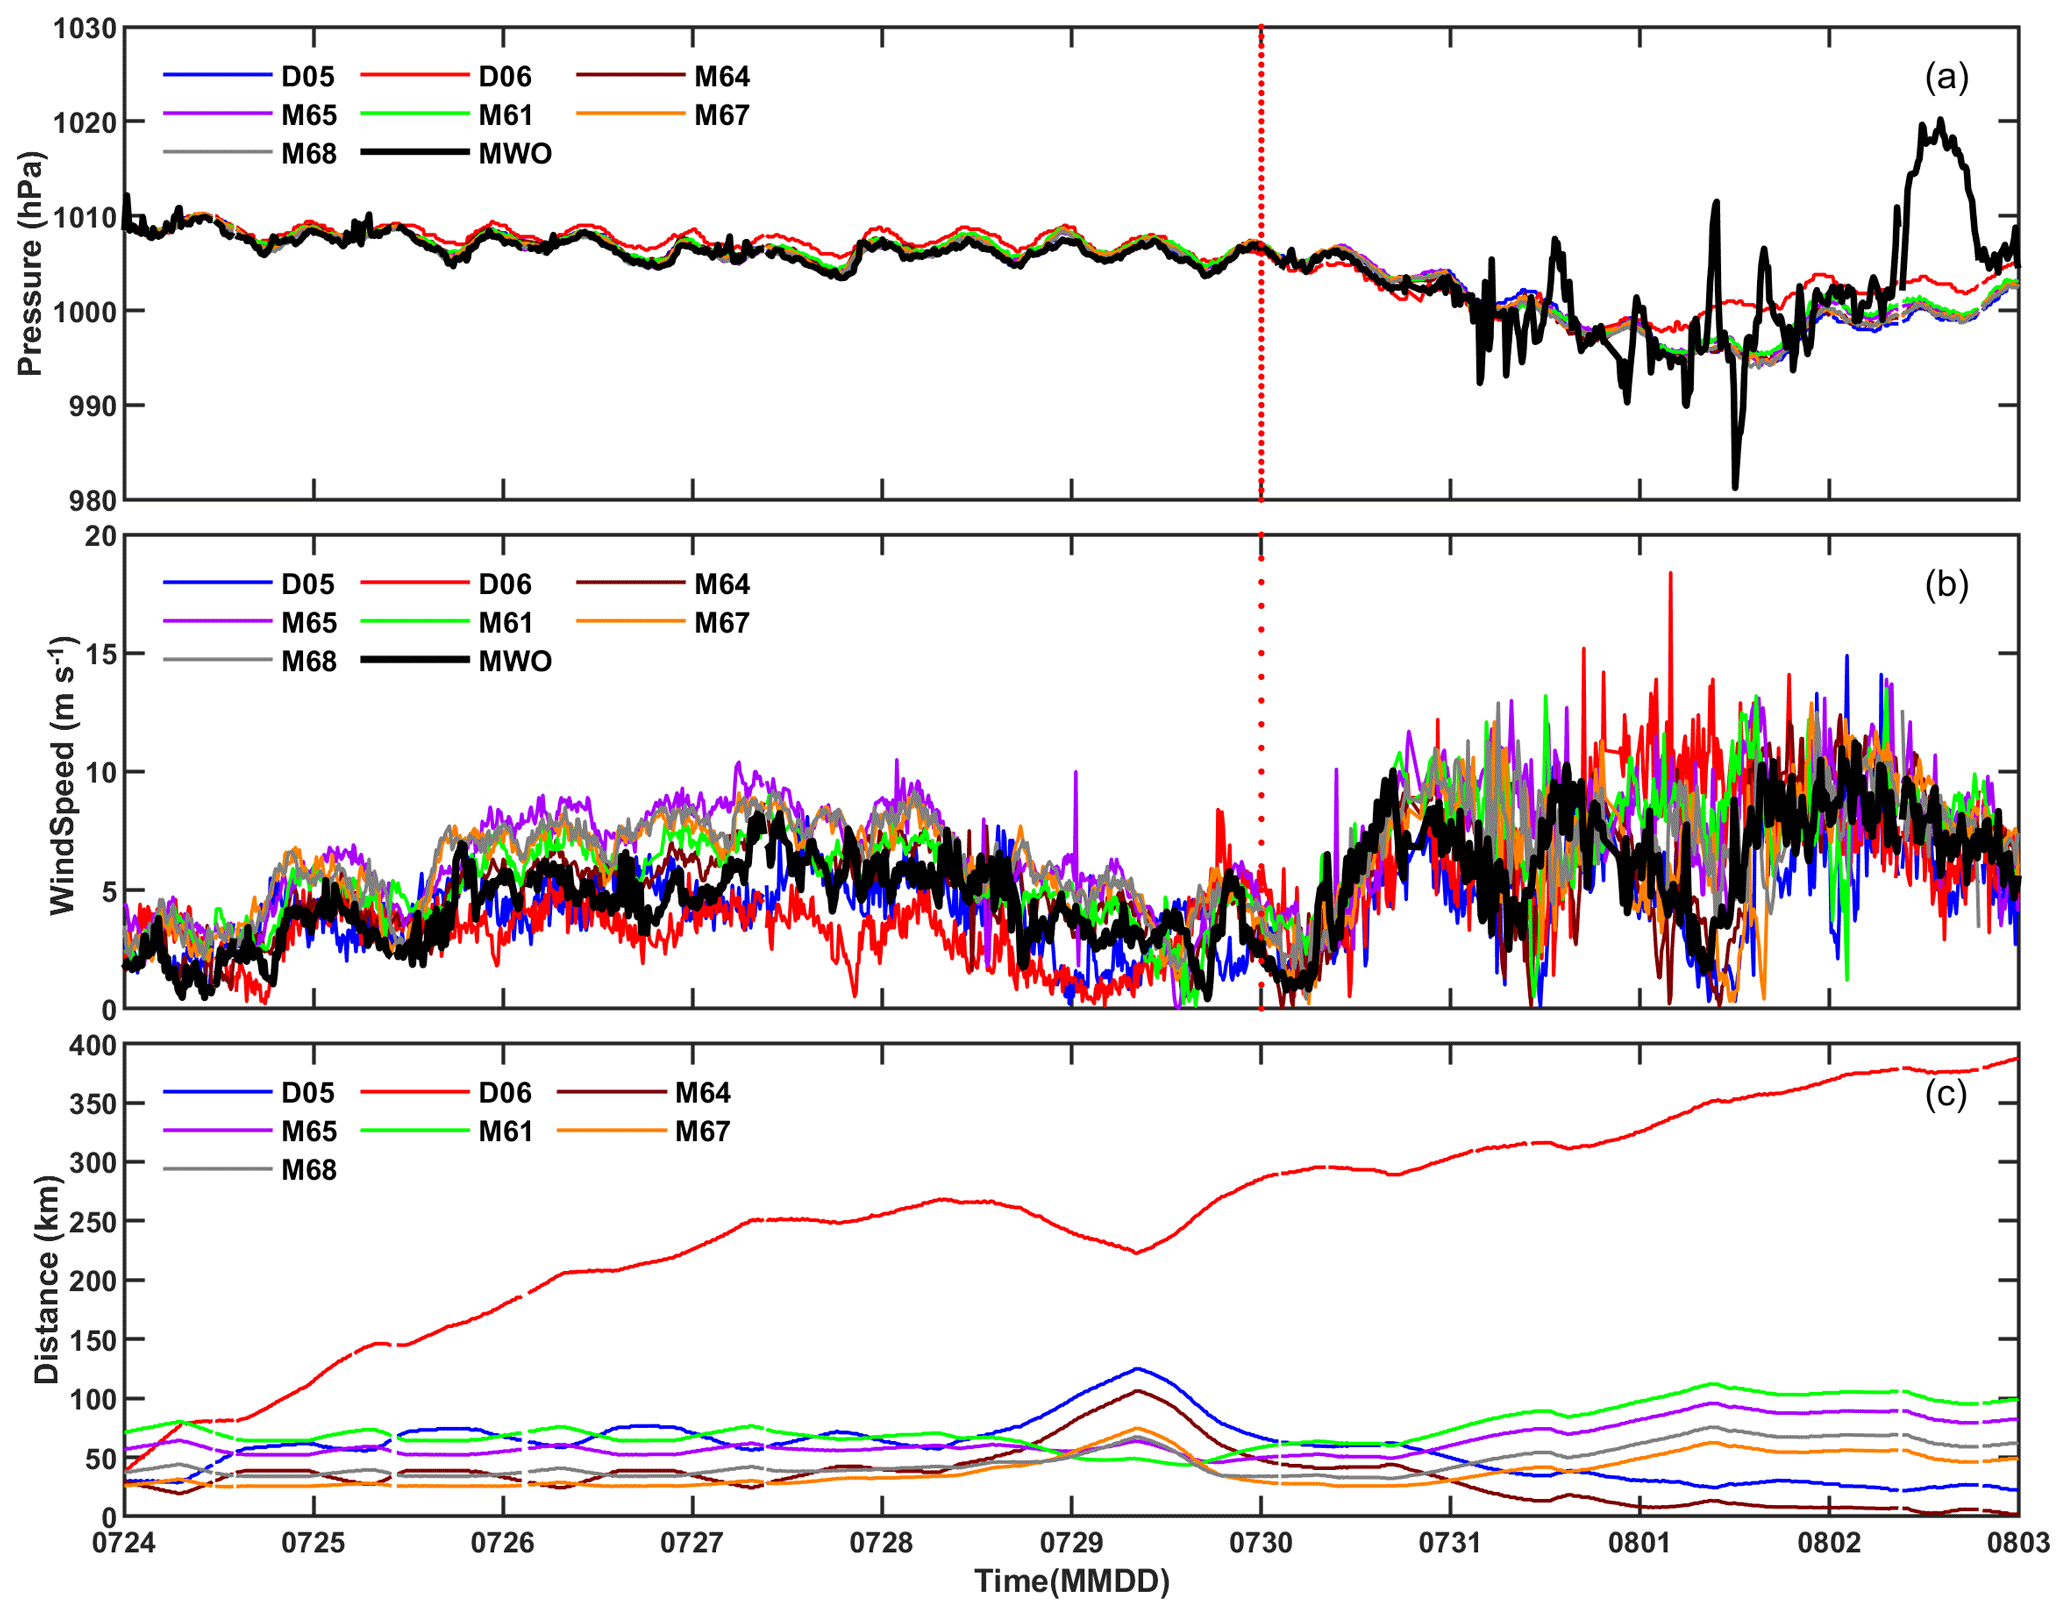
Figure 4Time series of (a) air pressure, (b) wind speed, and (c) distance for the seven buoys (two drifting and five mooring; legend begins with D and M, respectively) and MWO from 24 July to 2 August 2020. The dashed red line is on 30 July to separate the first and second stages.
3.2 Comparisons of the observations between MWO and buoys
To assess the quality of MWO observations, we first compared the air pressure and wind speed measured by MWO and all buoys (drifting and moored) as shown in Fig. 4. Before seeing the differences in the observations, it is best to know the spatial distance variation between MWO and the buoys as shown in Fig. 4c. For the two drifting buoys, the D05 was always closer to the MWO, within 100 km, from 24 July to 2 August. While D06 gradually moved away from MWO over time, from less than 100 km on 24 July to 400 km on 2 August. For the five mooring buoys, M64 is less than 50 km from MWO from 24 to 31 July and very close to MWO from 1 to 2 August. The rest of the buoys are within 100 km from MWO.
Then for the air pressure comparison in Fig. 4a, all buoys and the MWO measurements in the first stage match very well and basically overlap, except for a slight difference in the farthest D06. With the arrival of the typhoon, the measured pressure from MWO changed more obviously; in particular, around 12:00 on 1 August the lowest pressure was about 980 hPa when MWO was close to the typhoon center. In addition, an abnormally high pressure was measured on MWO at 14:00 on 2 August, and the cause of the abnormality is unknown at present. The pressure measured by the buoys was relatively close and consistent throughout the period, except for a slight change in the farthest buoy D06.
The wind speeds measured from buoys and MWO (Fig. 4b) have a good consistency. They are very close to each other in the first stage due to stable sea conditions, especially the closer buoys, D05 and M64. In the second stage, especially from 31 July to 1 August, there are enhanced changes in wind speed due to the passing of the typhoon. In the first half of 1 August, there was a significant trend difference in wind speed from MWO and buoys; for example, the former gradually decreased and reached its minimum value when MWO is close to the typhoon center about 12:00, while the latter mostly increased during this period. Subsequently, in the second half of 1 August, the wind speed from MWO rapidly increases to 10 m s−1, more consistent with measurements from buoys and almost superimposed. As the typhoon gradually moved away from the observation domain of MWO and buoys on 2 August, all wind speeds became closer and gradually decreased, returning to the first-stage state.
Similarly, air temperature and SST obtained from MWO and buoys are compared in Fig. 5. It seems in Fig. 5a that air temperature from MWO is generally lower than that from buoys most of the time, especially during the night of the first stage and when approaching the center of the typhoon in the second stage. The diurnal variations of air temperature measured from MWO and the drifting buoy D05 are more significant and close in the first stage. Relatively, the air temperature differences among the mooring buoys are smaller and more stable in the first stage and then enhanced due to the coming of the typhoon.
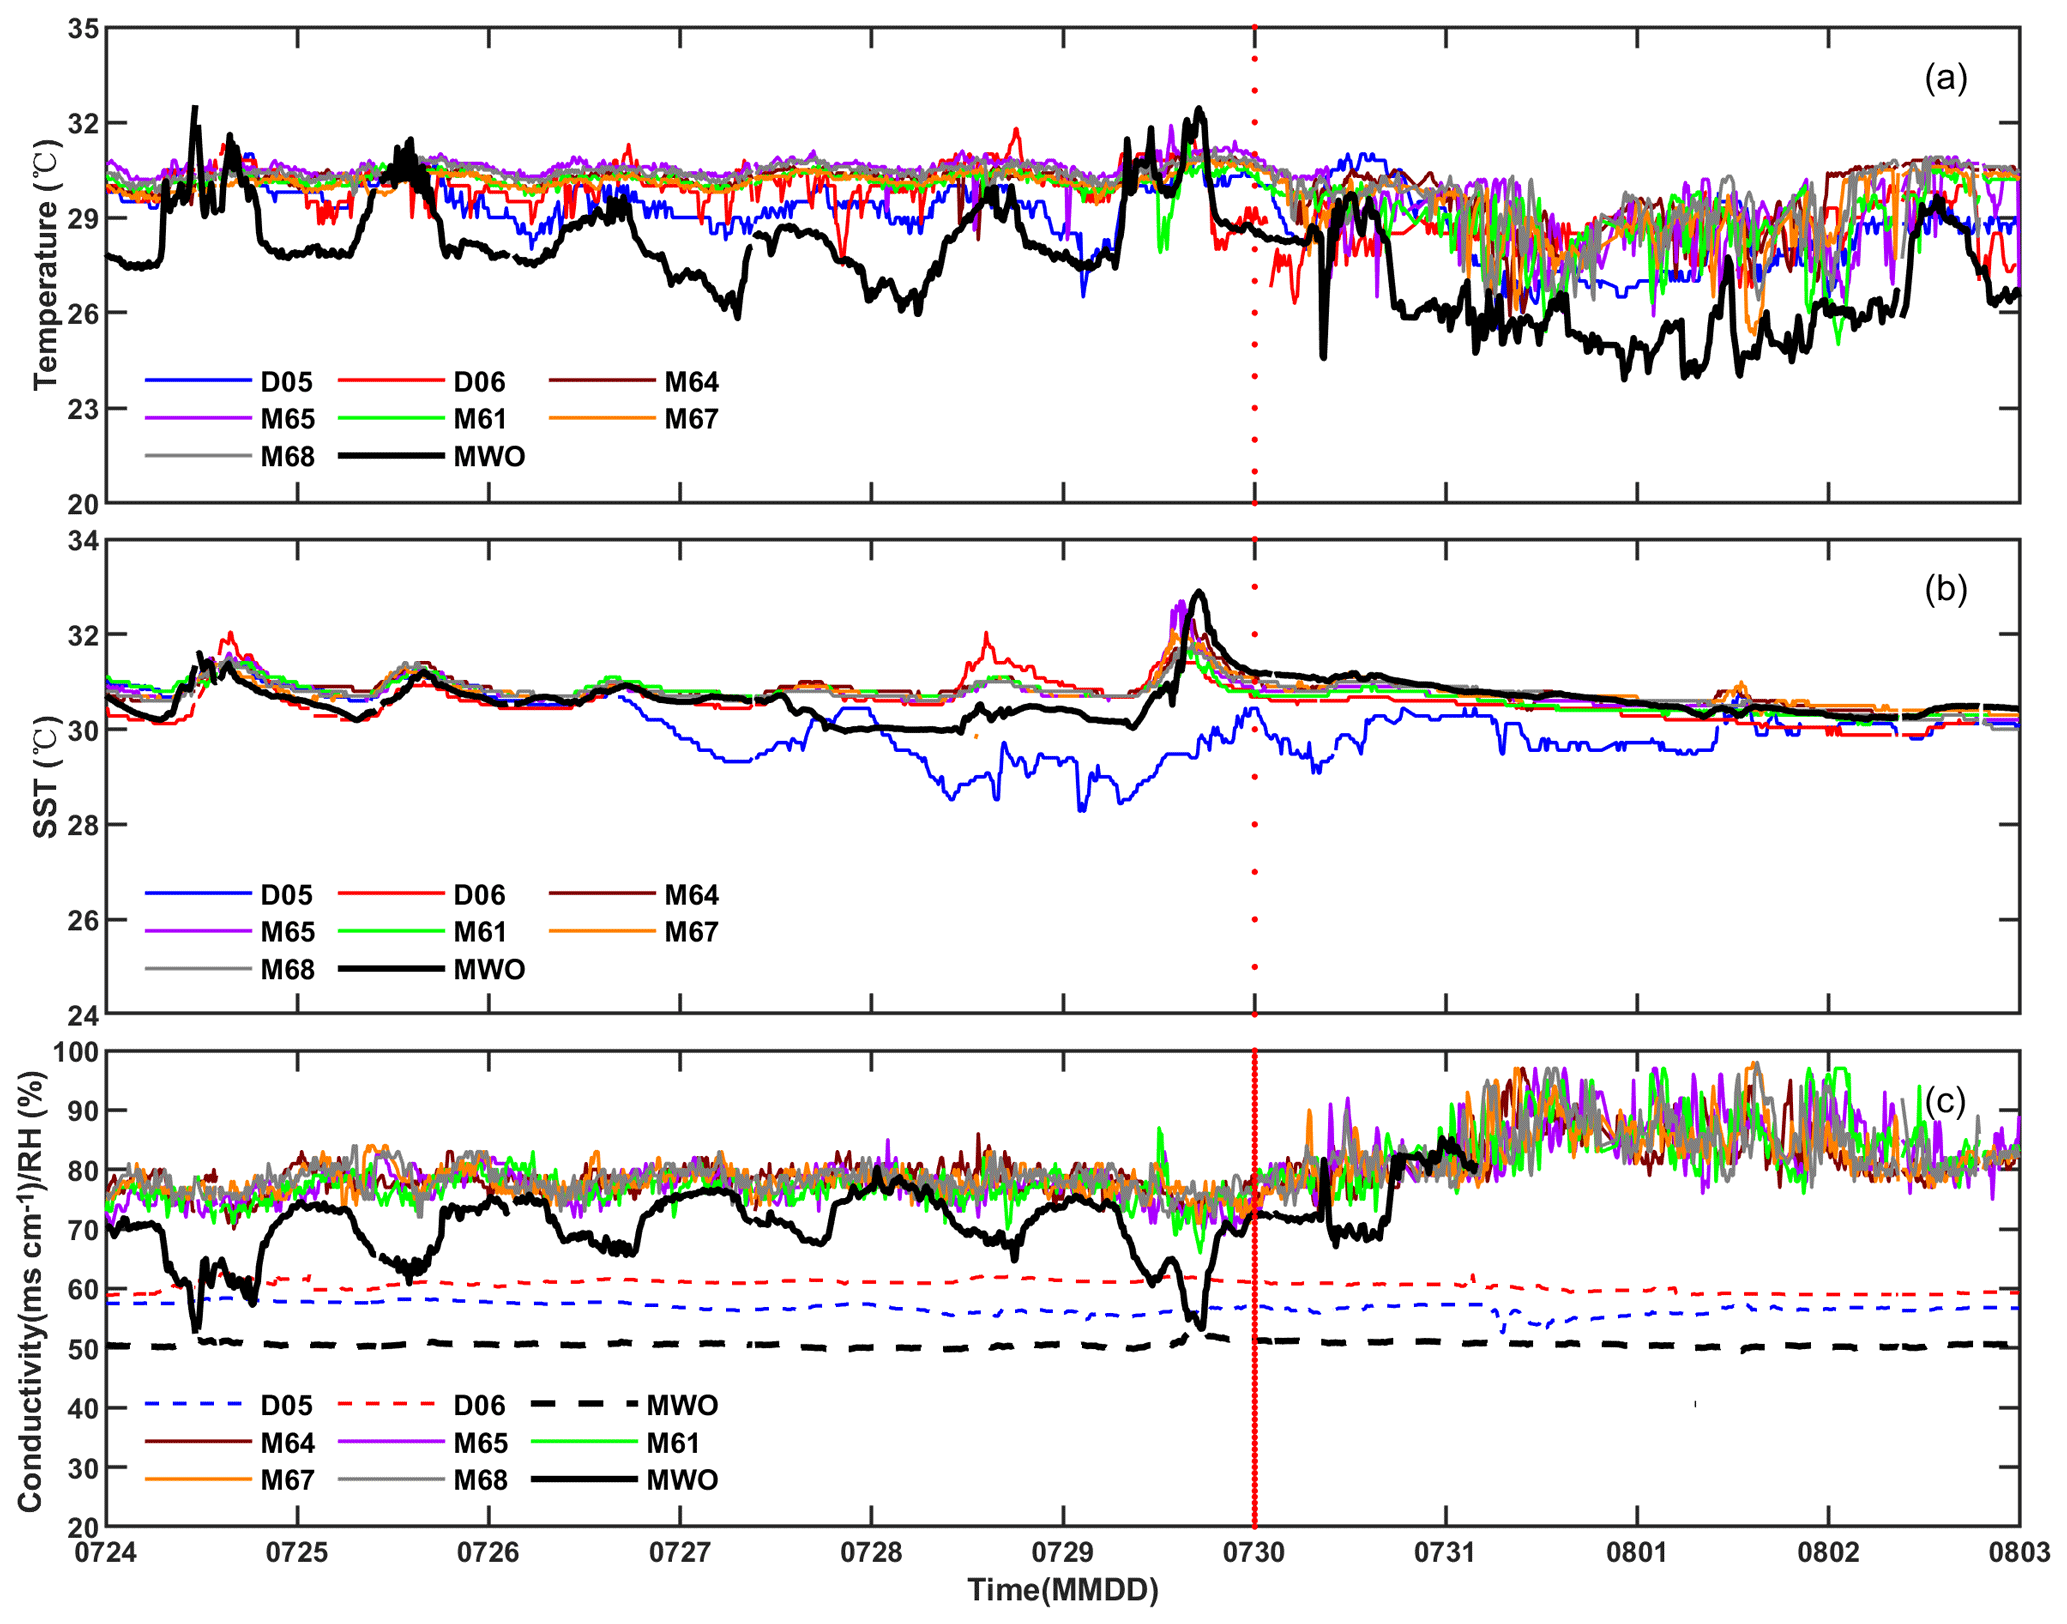
Figure 5Same as Fig. 3 except for (a) air temperature, (b) SST, and (c) seawater conductivity (dotted line) for drifting buoys and RH (solid line) for mooring buoys.
For SST shown in Fig. 5b, the observations from MWO during the entire period are very close to those from the five mooring buoys and are more consistent, even showing peak areas simultaneously, except for the slight difference from 27–29 July. For the two drifting buoys, the SST measured by the D05 buoy is 1–2∘ lower than that measured by MWO on 27–30 July, while SST measured by the D06 buoy is more stable and close to that measured by MWO.
In addition, seawater conductivity and relative humidity (RH) can be obtained from MWO. However, only the two drifting buoys can provide seawater conductivity measurement, and the mooring buoys can provide relative humidity (RH) measurement. Hence, the seawater conductivity and RH measured from MWO are compared with those from the corresponding available buoys and displayed in Fig. 5c.
Firstly, the seawater conductivity measured on MWO and two drifting buoys are very different, but the detailed values of each instrument are constant throughout the entire period. The conductivity measurement from the D06 buoy is the highest, generally exceeding 60 mS cm−1, followed by the D05 buoy, which is basically around 57 mS cm−1, and the lowest is about 50 mS cm−1 from MWO.
The RH difference between mooring buoys and MWO shown in Fig. 5c is only available in the first stage because the humidity sensor on MWO stopped working after 30 July. The RH variations are similar to those of air temperature; that is, RH from MWO is mostly lower than that from the mooring buoys, especially in the daytime. The diurnal variations of RH measured from MWO are more significant, while RH differences among the mooring buoys are smaller and stable in the first stage.
To better see the influence of typhoon moving on MWO observations, Fig. 6 shows the scattering plots of meteorological variables observed by MWO and the nearest buoys, including the drifting D05 and the mooring M94. The color samples and their corresponding statistical results are used to quantify the observations differences before (in red) and after the arrival of typhoons (in blue). Firstly, before the arrival of the typhoon, air pressure differences between MWO and both buoys are in good agreement, as shown in the red samples in Fig. 6a and b. Both air pressure differences are very close and smaller; e.g., the difference in the mean bias error (MBE) and standard deviation (SD) is less than 0.5 hPa. However, in the second stage, the pressure difference is significantly enhanced when MWO approaches the center of the typhoon, shown as the highly scattered blue samples in Fig. 6a and b, with corresponding SD up to 3.5 hPa.
The wind speed measurements from both buoys and MWO have good consistency in both stages, which is reflected in the good overlap of the red and blue samples in Fig. 6c and d, and the corresponding MBE and SD are very close. For SST shown in Fig. 6e and f, it is seen that the observations between MWO and the M64 mooring buoy are quite consistent with a difference of less than 0.3∘ before and after the coming of the typhoon. The SST measurements from the drifting buoy D05 are more scattered with those from MWO most of the time; in particular, they were significantly decreased by about 1–2∘ from 27 July to 1 August, as shown in Fig. 5b. Both the overall MBE and SD of the SST difference are less than 1.0∘ due to partial overlap of the samples, as shown in Fig. 6.
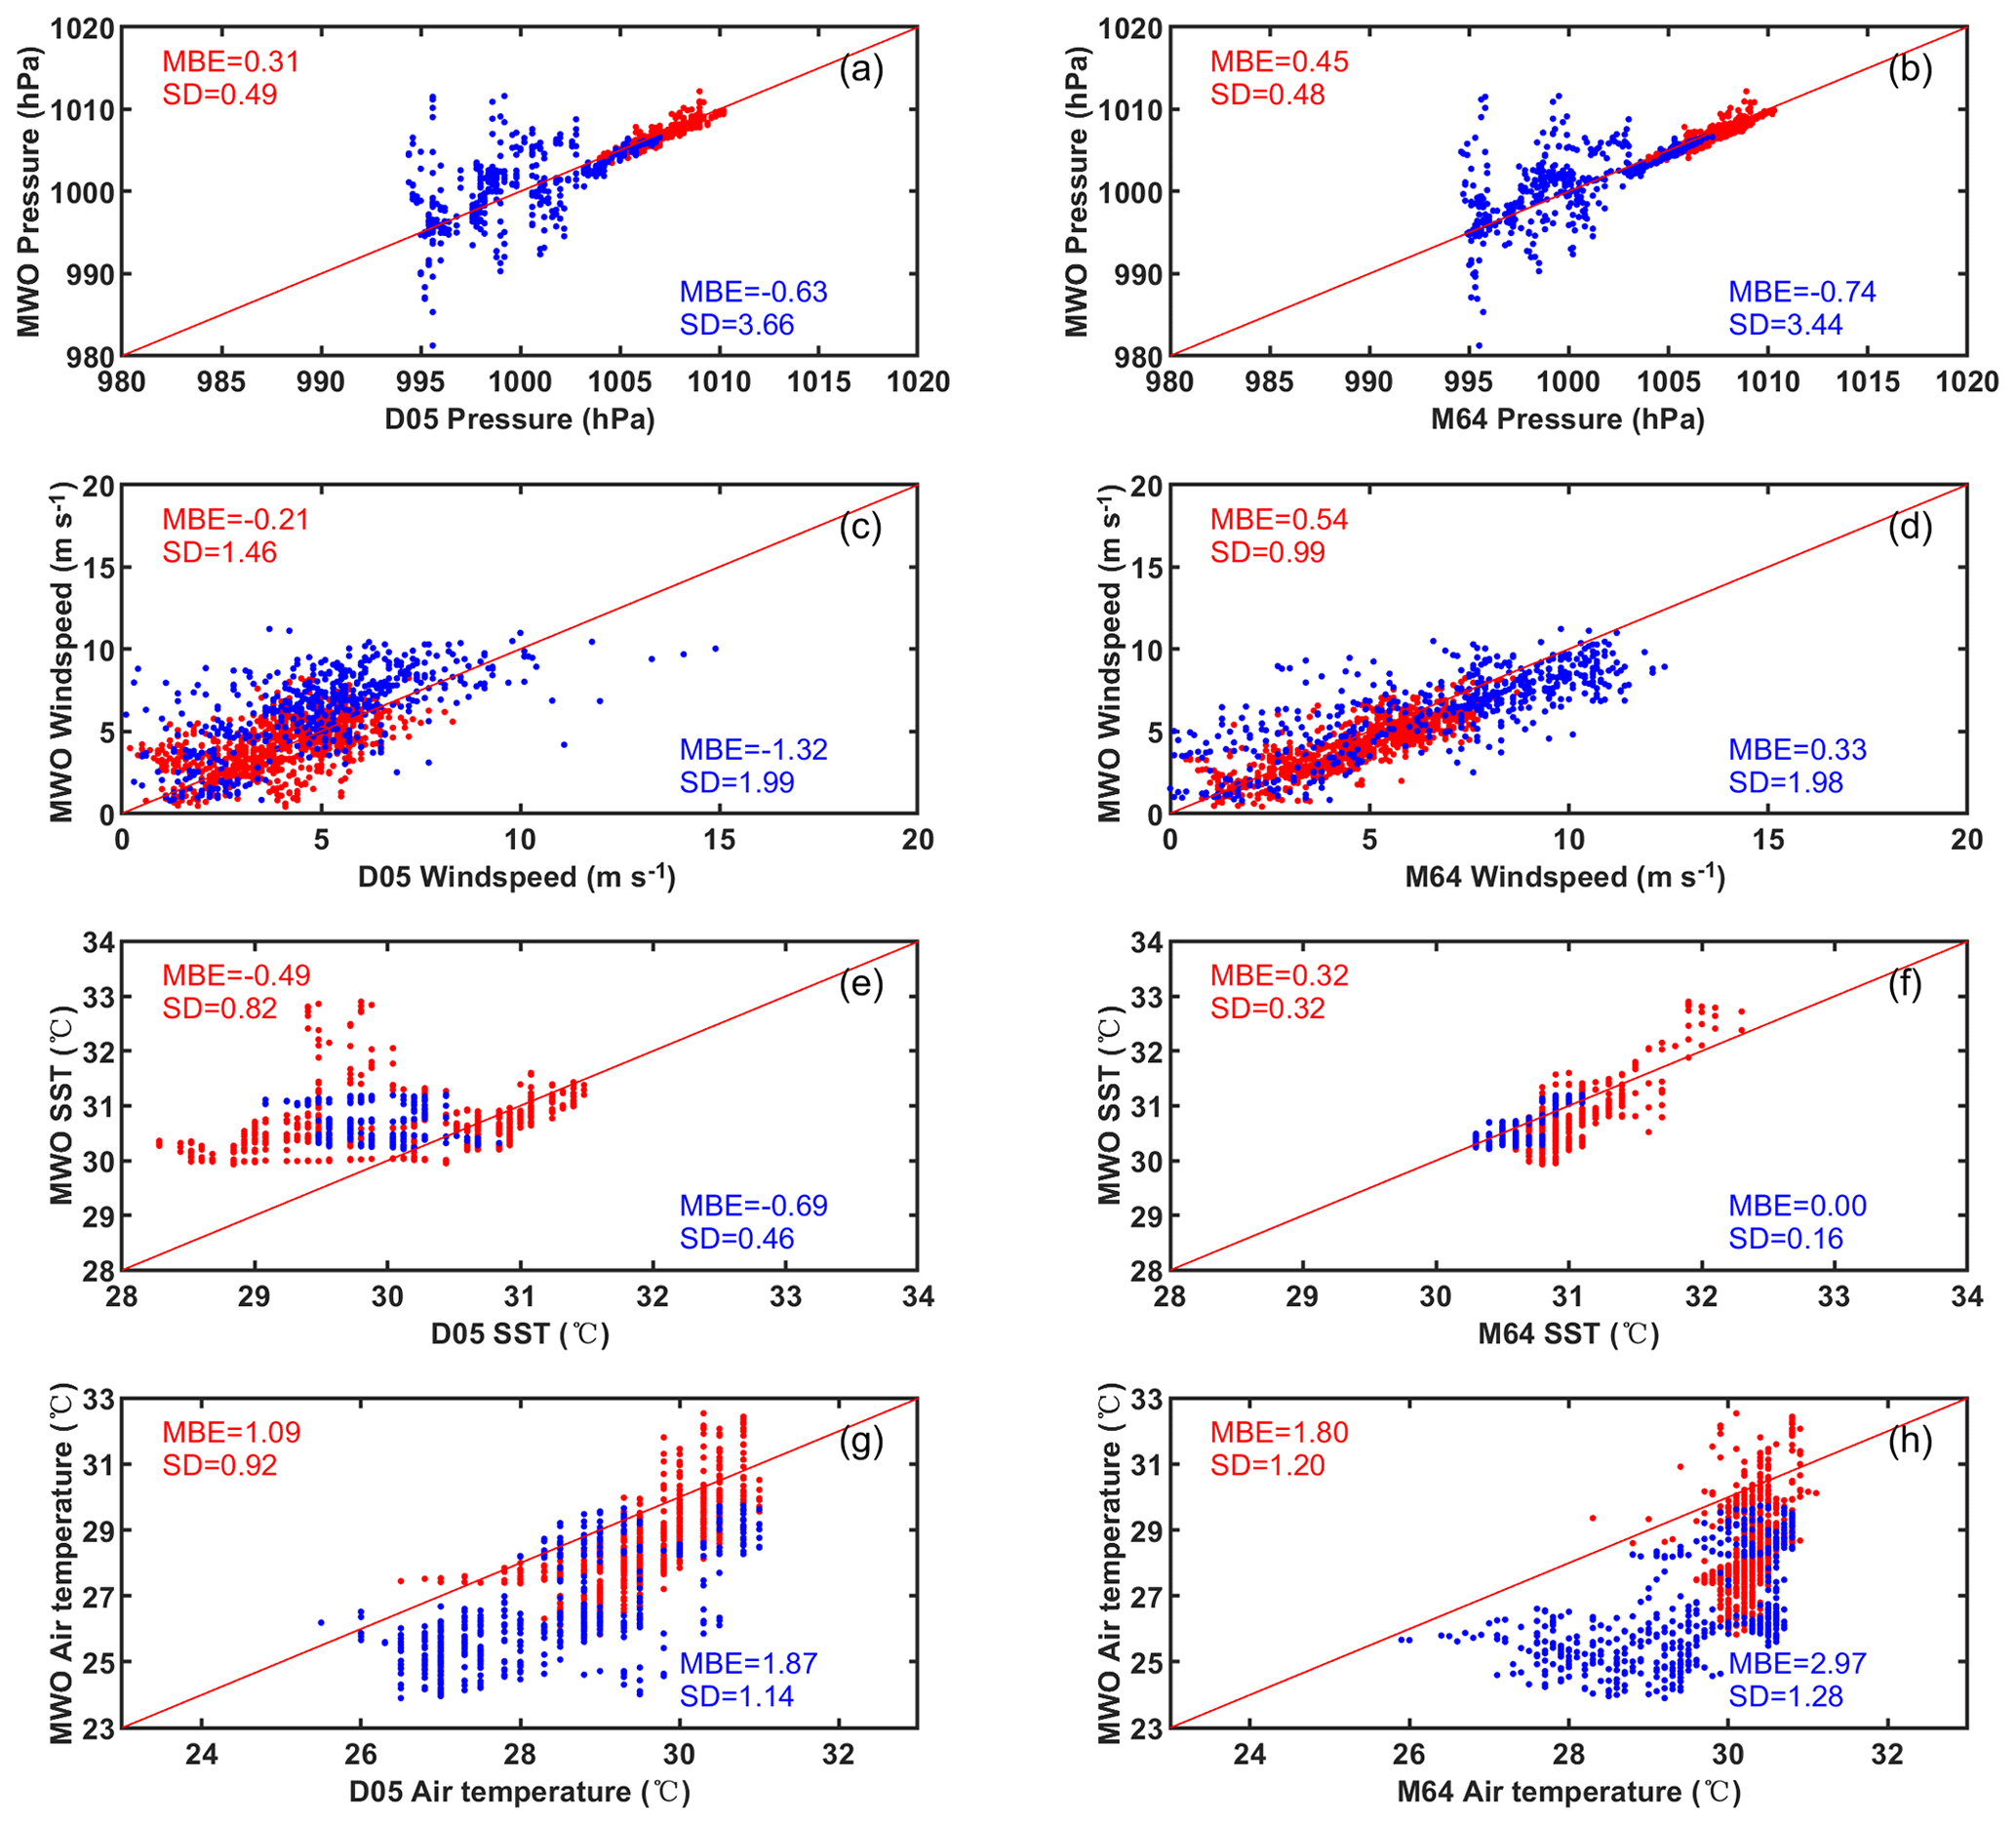
Figure 6Scattering plots of observations from the nearest buoys and MWO, with the D05 drifting buoy in the left column and the M64 mooring buoy in the right column. From top to bottom, they are air pressure, wind speed, SST, and air temperature, respectively.
Regarding air temperature, the observations from MWO show significant fluctuations, while the M64 mooring buoy shown in Fig. 6h is mostly fixed around 30∘ in the first stage. In the second stage, the air temperature measured from MWO is lower than that measured from both buoys; for example, the MBEs corresponding to buoys D05 and M64 are close to 1.9 and 3∘, respectively. Relatively, the changed trends of air temperature measured from MWO and D05 have good consistency in both stages.
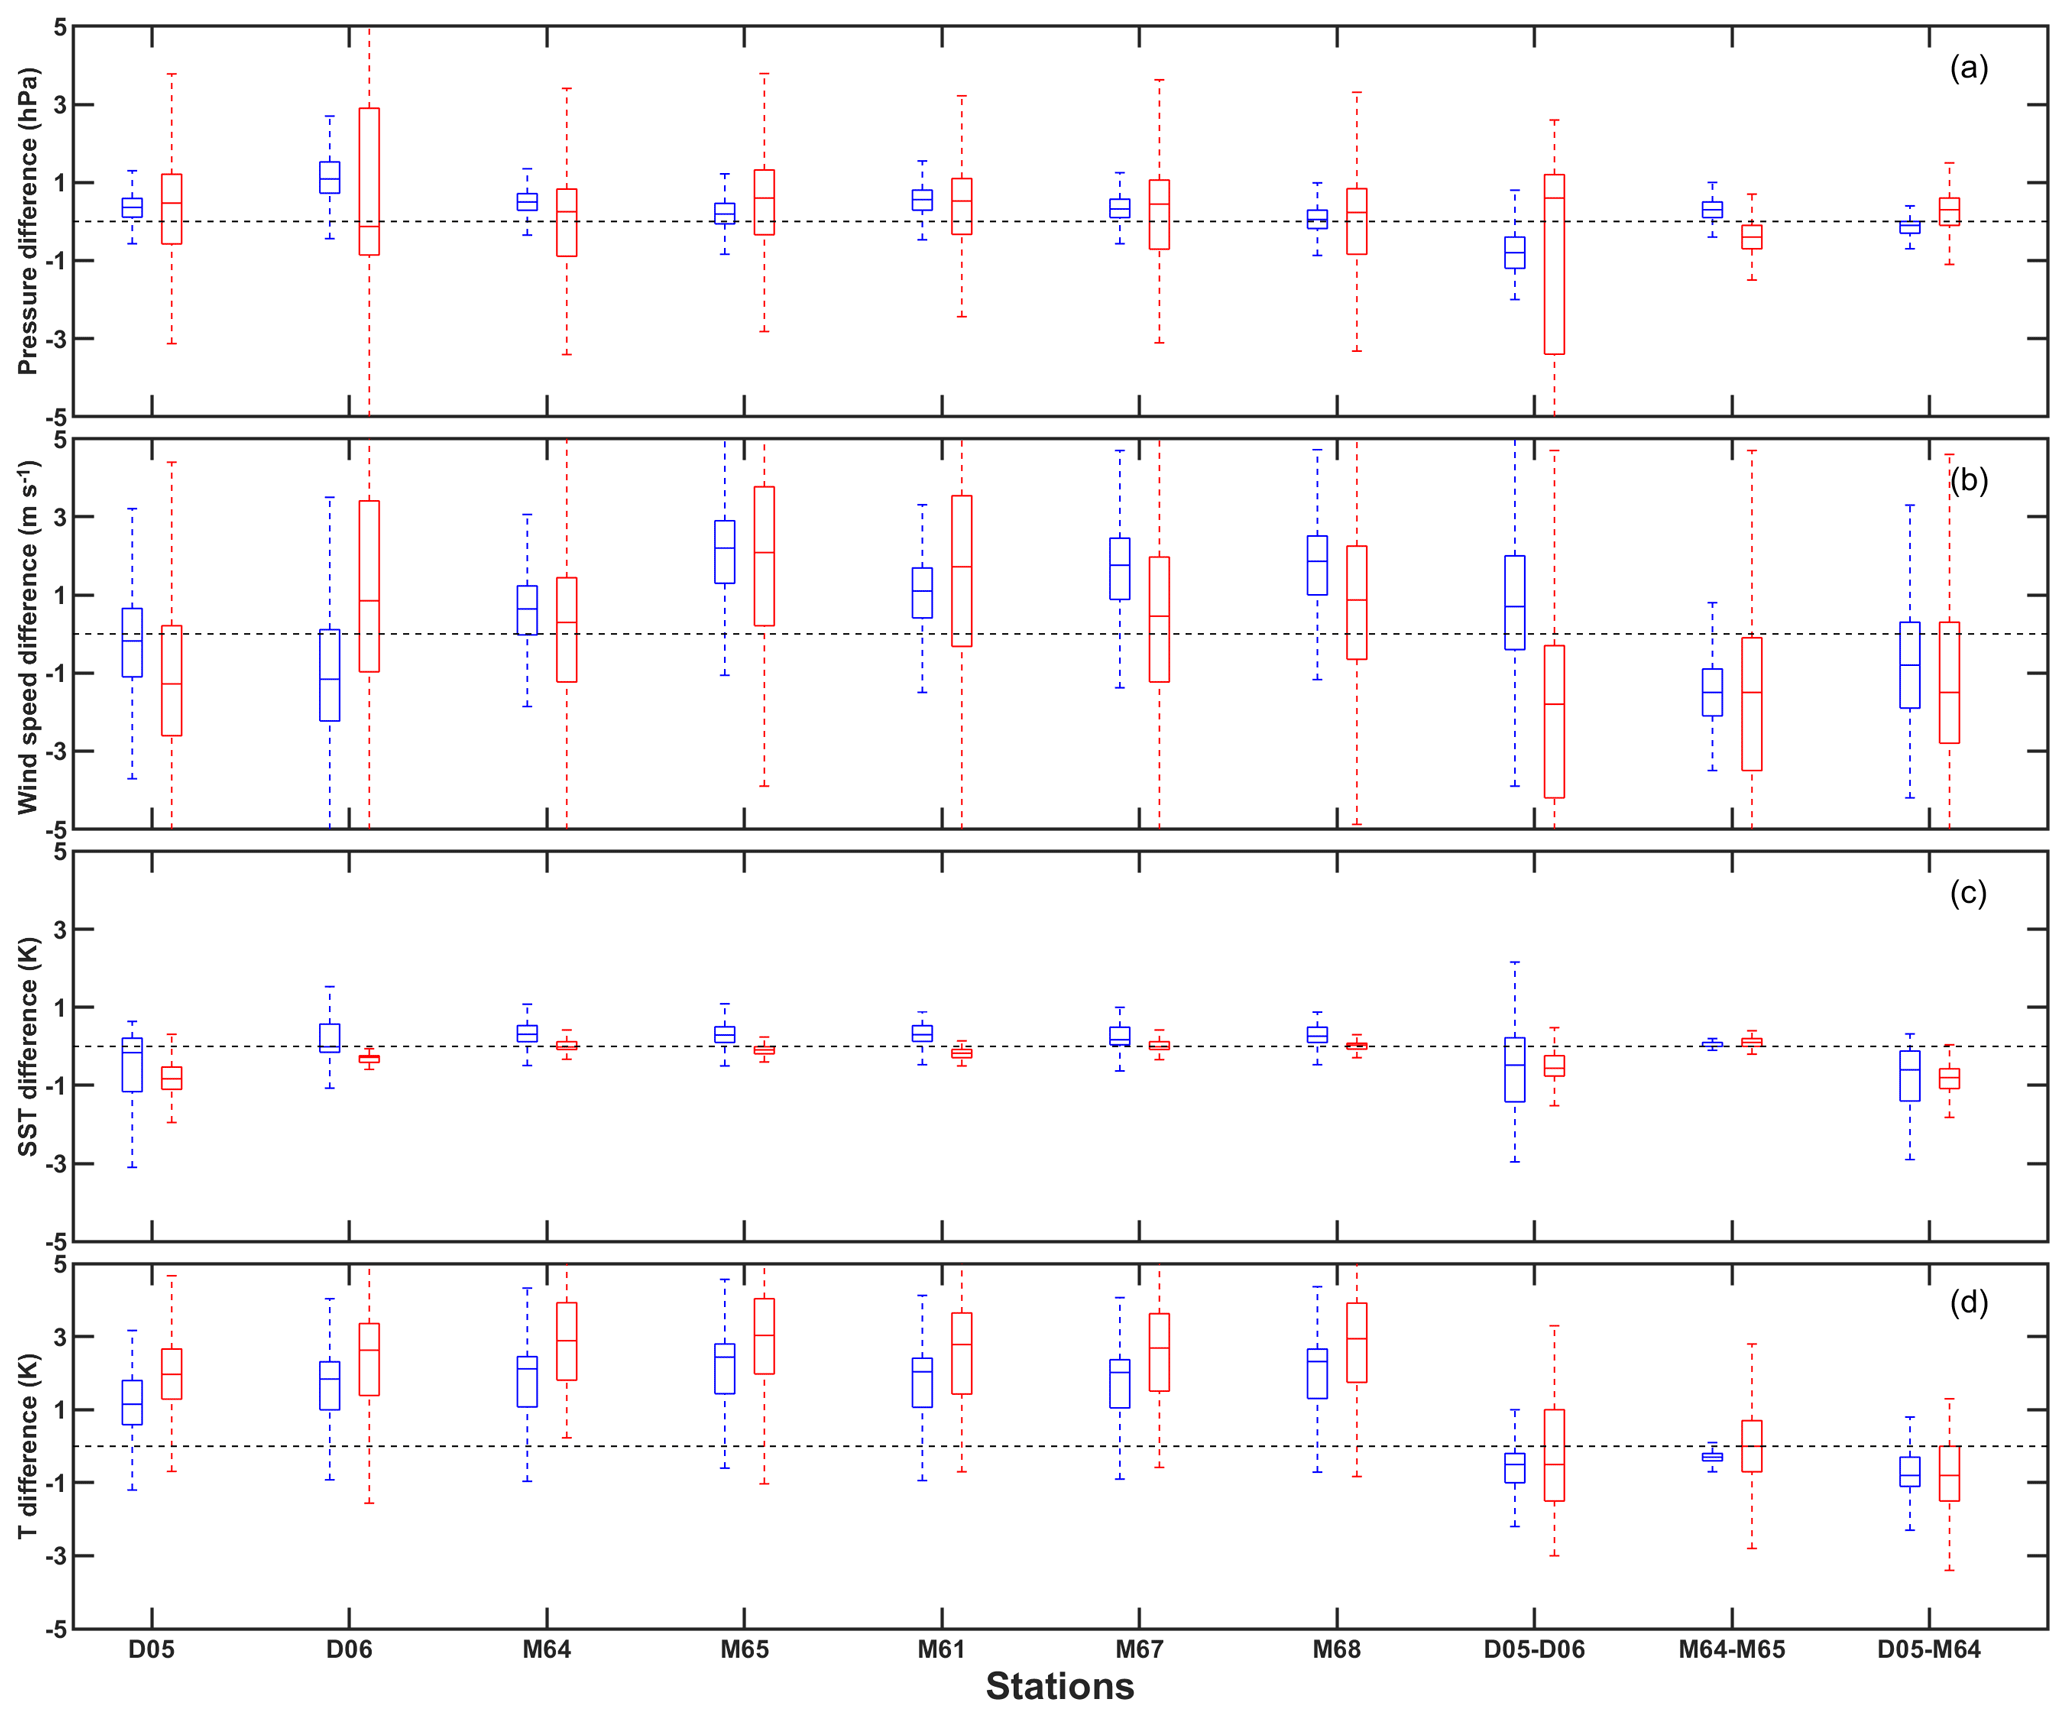
Figure 7Box plots of observation difference (blue – the first stage; red – the second stage) between MWO and seven buoys, as well as between buoys (i.e., D05 and D06, M64 and M65, D05 and M64). The observations from top to bottom are air pressure (a), wind speed (b), SST (c), and air temperature (d). The dotted line is the zero-value line.
To better understand the observed differences between MWO and buoys, as well as between buoys, the box plots in Fig. 7 show the distribution of their differences in pressure, wind speed, SST, and air temperature during the first (blue) and second (red) stages. The center marker in each box indicates the median, and the bottom and top edges of the box indicate the 25th and 75th percentiles, respectively. The first seven buoys reflect the difference between the buoy observations and MWO observations. The last three reflect differences in observations between buoys, including the two drifting buoys D05 and D06, the nearest (M64) and farthest mooring buoys (M65) from the MWO, and the nearest drifting (D05) and mooring (M64) buoys from the MWO.
The pressure difference in Fig. 7a shows a clear change in the first and second stage. Before the arrival of the typhoon, the pressure difference between MWO and the buoys is close to zero, and the magnitude of the differences between MWO and the buoys varies relatively uniformly, indicating that the pressure measured by MWO has the same level of accuracy as that measured by buoys under normal sea conditions. In the second stage, the range of pressure difference between MWO and buoy is 2–3 times larger than that in the first stage, but the median value of pressure difference is still relatively close, mostly within 1 hPa. Relatively, the pressure differences between the buoys in both stages are relatively small and stable, except for the farthest, D06.
The median difference of wind speed between MWO and the buoys is mostly within 1 m s−1, as shown in Fig. 7b. The wind speed difference in the second stage is significantly larger than that in the first stage. The wind speed difference between buoys seems to increase with the distance between buoys, as for the more distant buoys D06 and M65. In general, the wind speed differences between MWO and buoys are comparable to the wind speed differences between buoys.
For the SST in Fig. 7c, the observed differences between MWO and the moored buoys are very small throughout the period and even better in the second stage. In contrast, the difference in SST between MWO and the two drifting buoys is not as good as that between the moored buoys, especially for the closest buoy, D05, which fluctuates more in the first period, which may indicate that the SST quality of D05 buoy is not as good as its other measurements, such as pressure and wind speed.
The difference in air temperature between MWO and the buoys (Fig. 7d) is more pronounced than the difference in SST. Because of the lower temperature measured by MWO, the median of temperature difference with the buoys is mostly positive, e.g., 1 K in the first stage and 2 K in the second stage, while the temperature difference between the buoys is smaller in the first stage and increases significantly by a factor of 2–3 in the second stage.
In this paper, we first used 1 min MWO in situ observation data to monitor the changes in air pressure, wind field, temperature, and humidity before and after the arrival of typhoons. In particular, the air pressure significantly decreased from 1010 hPa under normal sea conditions to 980 hPa at the time when MWO crossed the center of the typhoon. During this period the air pressure underwent obvious and detailed fluctuations, which cannot be provided by previous observations. In addition, the wind field reflected the detailed and obvious fluctuations when the typhoon approached. The air temperature and relative humidity in the lower layers of the sea exhibited obvious diurnal variations. In contrast, SST is more stable, showing slight changes before and after the typhoon.
Further comparison with buoys observations during the same period revealed that under normal sea conditions before the arrival of the typhoon, the air pressure and wind speed measured by MWO and buoys showed good consistency; in particular, the difference in air pressure was only less than 0.5 hPa, and the wind speed difference was less than 0.5 m s−1. Moreover, the difference between MWO and buoys was comparable to that of multiple buoys, indicating that the measurement accuracy of air pressure and wind speed on MWO was equivalent to that of the buoys under normal sea conditions. With the arrival of the typhoon, the air pressure measured on MWO fluctuated greatly, while the corresponding measurements from the buoys were more stable, resulting in a significant pressure difference between MWO and the buoys. This may mainly be related to the location where MWO crossed the center of the typhoon. In addition, as the typhoon departed, the air pressure and temperature measured on MWO showed abnormally high values around 14:00 on 2 August and then returned to normal range at night, which may be related to unknown external interference.
The trend of wind speed change between MWO and the buoys was more consistent before and after the arrival of the typhoon. When MWO was closest to the center of the typhoon, the wind speed change between MWO and the buoys was slightly misaligned.
For the air temperature and relative humidity under normal sea conditions, measurements made by the mooring buoys were relatively constant and showed little variation in a day, the corresponding drifting buoy measurements showed weak diurnal fluctuations, and MWO measurements fluctuated significantly from day to night. This may be related to the installation height and sensitivity of sensors. Usually, the sensor on the mooring buoy can reach up to 10 m; on the drifting buoy and MWO it may be about 1.0 m (Cao et al.,2019). The closer the sensor is to the surface, the more pronounced the impact of near-surface environmental changes.
Compared with other variables, the SST variation before and after the typhoon's arrival was weak and appeared relatively stable. In particular, the SST measurements from MWO and the mooring buoys were very close throughout the period. However, the larger difference in SST between MWO and the nearest drifting buoy may be caused by the quality of the SST measurement from the latter.
During the typhoon observation experiment in the South China Sea in July–August 2020, MWO completed long-term continuous observations, especially by actively approaching the center of Typhoon Sinlaku in the deep sea. The in situ meteorological and hydrological observations obtained by MWO were evaluated by comparing them with the observations made by two types of buoys during the evolution of Typhoon Sinlaku. We obtained some preliminary results as follows.
-
Before the arrival of the typhoon, air pressure and wind speed measured by MWO and the buoys were in good agreement, with the difference in air pressure less than 0.5 hPa and the difference in wind speed less than 0.5 m s−1, indicating that the measurement accuracy of air pressure and wind speed obtained by the two methods is comparable under normal sea conditions.
-
The SST observations of MWO and the mooring buoys show highly consistent in the entire period, demonstrating the high stability and accuracy of SST measurements from MWO during the typhoon evolution.
-
The air temperature and relative humidity measured from MWO have obvious diurnal variations and are generally lower than those from the buoys, which may be related to the mounting height and sensitivity of sensors.
-
When actively approaching the typhoon center, the air pressure measured by MWO can reflect some drastic and subtle changes, such as a sudden drop to 980 hPa, which is difficult to obtain by other observation methods.
As a mobile meteorological and oceanographic observation station, MWO has shown its unique advantages over traditional observation methods. Although we only analyzed and evaluated the in situ observations obtained in one individual case of MWO crossing the Typhoon Sinlaku in this paper, the results preliminarily demonstrate the reliable observation capability of MWO. For better monitoring of typhoon systems, it will be necessary to deploy a meteorological and hydrological observation network composed of multiple MWOs in the future, which will provide comprehensive in situ observations on spatial and temporal scales required for forecasting, warnings, and research of marine meteorological hazards.
The observation data can be made available upon request from the corresponding author.
WH, HC, XX, and KW wrote the draft of the paper. WH, HY, and JL did the data analysis. HC and SM were the main designers of the observation system. JL, JP, XZ, RG, BZ, and XC contributed to the sensors' installment and data collection.
The contact author has declared that none of the authors has any competing interests.
Publisher's note: Copernicus Publications remains neutral with regard to jurisdictional claims made in the text, published maps, institutional affiliations, or any other geographical representation in this paper. While Copernicus Publications makes every effort to include appropriate place names, the final responsibility lies with the authors.
We wish to express our sincere gratitude to Beijing Chunyi Aviation Technology Co., Ltd.; Hainan Meteorological Service; Wang Hu and Wang Chunhua of Qionghai Meteorological Service; and all personnel who participated in this experiment. We also appreciate the very helpful and detailed comments of the anonymous reviewers.
This research has been supported by the National Natural Science Foundation of China (grant no. 41627808), the Key Technologies Research and Development Program (grant no. 2018YFC1506401), and the Shanghai Typhoon Research Foundation (grant no. TFJJ202101).
This paper was edited by Yuanjian Yang and reviewed by Jiagen Li and one anonymous referee.
Bell, M. M., Montgomery, M. T., and Emanuel, K. A.: Air-sea enthalpy and momentum exchange at major hurricane wind speeds observed during CBLAST, J. Atmos. Sci., 69, 3197–3222, 2012.
Bender, M. A., Ginis, I., Tuleya, R., Thomas, B., and Marchok, T.: The operational GFDL coupled hurricane-ocean prediction system and a summary of its performance, Mon. Weather Rev., 135, 3965–3989, 2007.
Black, P. G., D'Asaro, E. A., Drennan, W. M., French, J. R., Niiler, P. P., Sanford, T. B., Terrill, E. J., Walsh, E. J., and Zhang, J. A.: Air-sea exchange in hurricanes: Synthesis of observations from the coupled boundary layer air-sea transfer experiment, B. Am. Meteorol. Soc., 88, 357–374, 2007.
Cao, X. Z., Li, X. X., Lei, Y., Wen, H. Y., and Wang, X.: Typhoon observation and analysis of domestic marine meteorological drift buoy experiment, Meteor. Mon., 45, 1457–143, 2019 (in Chinese).
Chen, H. B., Li, J., Ma, S. Q., and Hu, S. Z.: Progress of the marine meteorological observation technologies, China Assoc. Sci. Technol., 37, 91–97, 2019 (in Chinese).
Chen, H. B., Li, J., He, W., Ma, S., Wei, Y., Pan, J., Zhao, Y., Zhang, X., and Hu, S.: IAP's solar-powered unmanned surface vehicle actively passes through the center of Typhoon Sinlaku (2020), Adv. Atmos. Sci., 38, 538–545, 2021.
Dai, H. L., Mou, N. X., Wang, C. Y., and Tian, M. Y.: Development status and trend of ocean buoy in China, Meteorological, Hydrol. Mar. Instrum., 125, 118–121, 2014.
Emanuel, K. and Center, L.: 100 Years of Progress in Tropical Cyclone Research, Meteorol. Monogr., 59, 15.1–15.68, 2018.
Ito, K. and Wu, C. C.: Typhoon-position-oriented sensitivity analysis. Part I: Theory and verification, J. Atmos. Sci., 70, 2525–2546, 2013.
Lei, X. T.: Overview of the development of Typhoon scientific research in China in the past century, Sci. China-Earth Sci., 50, 321–338, 2020.
Lenan, L. and Melville, W. K.: Autonomous surface vehicle measurements of the ocean's response to tropical cyclone Freda, J. Atmos. Ocean. Technol., 31, 2169–2190, 2014.
Lorsolo, S., Schroeder, J. L., Dodge, P., and Marks, F.: An observational study of hurricane boundary layer small-scale coherent structures, Mon. Weather Rev., 136, 2871–2893, 2008.
Morrison, I., Businger, S., Marks, F., Dodge, P., and Businger, J. A.: An observational case for the prevalence of roll vortices in the hurricane boundary layer, J. Atmos. Sci., 62, 2662–2673, 2005.
Qin, G., Lei, Y., Li, X., Cao, X., Wang, Y., Xu, M., and Zhou, W.: Operational assessment of domestic marine meteorological drifting buoys, Meteorol. Sci. Technol., 50, 467–475, 2022.
Rogers, R., Aberson, S., Aksoy, A., Annane, B., Black, M.,Cione, J., Dorst, N., Dunion, J., Gamache, J., Goldenberg, S., Gopalakrishnan, S., Kaplan, J., Klotz, B., Lorsolo, S., Marks, F., Murillo, S., Powell, M., Reasor, P., Sellwood, K., and Zhang, X.: NOAA's hurricane intensity forecasting experiment: A progress report, B. Am. Meteorol. Soc., 94, 859–882, 2013.
Sanford, T. B., Price, J. F., Girton, J. B., and Webb, D. C.: Highly resolved observations and simulations of the ocean response to a hurricane, Geophys. Res. Lett., 34, L13604, https://doi.org/10.1029/2007GL029679, 2007.
Thomson, J. and Girton, J.: Sustained measurements of Southern Ocean air-sea coupling from a Wave Glider autonomous surface vehicle, Oceanography, 30, 104–109, 2017.
Wynn, R. B., Huvenne, V., Le Bas, T., Murton, B., Connelly, D., Bett, B., Ruhl, H., Morris, K., Peakall, J., Parsons, D., Sumner, E., Darby, S., Dorrell, R., and Hunt, J.: Autonomous Underwater Vehicles (AUVs): Their past, present and future contributions to the advancement of marine geoscience, Mar. Geol., 352, 451–468, 2014.
Xu, X. F, Gu, J. F., and Li, Y. P.: Marine meteorological disaster [M], China Meteorol. Press, Beijing, ISBN 9787502947033, 1–4, 2009 (in Chinese).
Zhang, X., Li, L. X., Yang, R., Guo, R., Sun, X., Luo, J., Chen, H., Liu, D., Tang, K., Peng, W., Han, X., Guo, Q., Li, X., and Fei, X.: Comprehensive Marine Observing Experiment Based on High-Altitude Large Unmanned Aerial Vehicle(South China Sea Experiment2020 of the “Petrel Project”), Adv. Atmos. Sci., 38, 528–535, 2021.
Zheng, G. G., Chen, H. B., and Bian, J. C.: Atmospheric sciences entering the 21st century [M], China Meteorol. Press, Beijing, ISBN 9787502945466, 21–25, 2008 (in Chinese).
Wu, L. G., Liu, Q. Y., and Zhou, X. Y.: A review on fine-scale structures in tropical cyclone boundary layer, J. Meteorol. Sci., 40, 1–10, 2020.
Wurman, J. and Kosiba, K.:The role of small-scale vortices in enhancing surface winds and damage in Hurricane Harvey (2017), Mon. Weather Rev., 146, 713–722, 2018.