the Creative Commons Attribution 4.0 License.
the Creative Commons Attribution 4.0 License.
 | 12 Jan 2024
Comparisons and quality control of wind observations in a mountainous city using wind profile radar and the Aeolus satellite
Hua Lu
Wei Zhao
Bojun Liu
Tijian Wang
Bingliang Zhuang
Observations of the vertical wind profile in Chongqing, a typical mountainous city in China, are important, but they are sparse and have low resolution. To obtain more wind profile data, this study matched the Aeolus track with ground-based wind observation sites in Chongqing in 2021. Based on the obtained results, verification and quality control studies were conducted on the wind observations of a wind profile radar (WPR) with radiosonde (RS) data, and a comparison of the Aeolus Mie-cloudy and Rayleigh-clear wind products (Aeolus winds measured in cloudy and aerosol-rich atmospheric conditions from Mie-channel-collected data and winds measured in clear-air conditions from Rayleigh-collected data) with WPR data was then performed. The conclusions can be summarized as follows: (1) a clear correlation between the wind observations of WPR and RS was found, with a correlation coefficient (R) of 0.71. Their root mean square deviation increased with height but decreased at heights between 3 and 4 km. (2) After quality control using Gaussian filtering (GF) and empirical orthogonal function construction (EOFc; G=87.23 %) of the WPR data, the R between the WPR and RS reached 0.83 and 0.95, respectively. The vertical distribution showed that GF could better retain the characteristics of WPR wind observations but with limited improvement in decreasing deviations, whereas EOFc performed better in decreasing deviations but considerably modified the original characteristics of the wind field, especially regarding intensive vertical wind shear in strong convective weather processes. (3) In terms of the differences between the Aeolus and WPR data, 56.0 % and 67.8 % deviations were observed within ±5 m s−1 for Rayleigh-clear and Mie-cloudy winds (Aeolus winds measured in cloudy and aerosol-rich atmospheric conditions from Mie-channel-collected data and winds measured in clear-air conditions from Rayleigh-collected data) vs WPR winds, respectively. Vertically, large mean differences of both Rayleigh-clean and Mie-cloudy winds versus WPR winds appeared below 1.5 km, which is attributed to the prevailing quiet and small winds within the boundary layer in Chongqing; in this case the movement of molecules and aerosols is mostly affected by irregular turbulence. Additionally, large mean differences at a height range between 4 and 8 km for Mie-cloudy versus WPR winds may be related to the high content of cloud liquid water in the middle troposphere of Chongqing. (4) The differences in both Rayleigh-clear and Mie-cloudy versus WPR winds had changed. Deviations of 58.9 % and 59.6 % were concentrated within ±5 m s−1 for Rayleigh-clear versus WPR winds with GF and EOFc quality control, respectively. In contrast, 69.1 % and 70.2 % of deviations appeared within ±5 m s−1 for Rayleigh-clear versus WPR and EOFc WPR winds, respectively. These results shed light on the comprehensive applications of multi-source wind profile data in mountainous cities or areas with sparse ground-based wind observations.
- Article
(10219 KB) - Full-text XML
- BibTeX
- EndNote


The detection of the atmospheric wind profile is essential for studying atmospheric dynamics, interactions between weather and pollution, and predictions of extreme weather (Baker et al., 1995; King et al., 2017; Stettner et al., 2019; Sun et al., 2022). Furthermore, the value of atmospheric wind observations has been illustrated by assimilation applications in numerical weather prediction (Benjamin et al., 2004; Weissmann and Cardinali, 2007; Michelson and Bao, 2008). In particular, wind fields within the boundary layer are mostly turbulent and difficult to simulate using models without the assimilation of wind observations (Belmonte and Stoffelen, 2019; Simonin et al., 2014). For areas with complex terrain, such as mountainous cities, individual ground-based observation stations usually have poor representation, and thus vertical observations are essential (Sekuła et al., 2021; Lu et al., 2022b). Therefore, unconventional wind profile observations are urgently required for analysis and assimilation into numerical prediction models to describe the transport of mesoscale weather systems, as well as to advance our knowledge of atmospheric component movement in the actual atmosphere.
Wind profile radar (WPR) data may partially compensate for the limitations of conventional wind field observations. WPR detects the scattering effect of atmospheric turbulence on electromagnetic waves to detect the Doppler effect signals of air movement and is capable of providing horizontal wind vectors with high temporal and vertical resolution (Weber and Wuertz, 1990; Dibbern et al., 2001). The automated, continuous, and real-time vertical wind profiles from the WPR could fill the gaps in upper-air observations, both in time continuity and vertical resolution. Terrain and climate characteristics in unique regions could have different impacts on WPR echoes, resulting in separate data observation errors. Therefore, data verification and, occasionally, adequate quality control are required before the application of WPR data in a specific region (Zhang et al., 2015; Guo et al., 2021a). In comparison, radiosonde (RS) data are often considered reliable atmospheric wind observations to verify WPR data (Weber and Wuertz, 1990; Chen et al., 2021).
Owing to advances in satellite detection, wind fields acquired from satellites can supplement conventional ground-based observations in space coverage. Atmospheric motion vector detection can only extract the wind information of layers with clouds. The United States and Europe have successively detected sea surface wind fields using microwave radiometers and scatterometers (Endlich et al., 1971; Njoku et al., 1980; Gaiser et al., 2004; Barre et al., 2008). The World Meteorological Organization regards the detection of global three-dimensional wind fields as one of the most challenging and important meteorological observation missions in the 21st century (WMO, 2001). The United States and Europe have conducted spaceborne wind lidar measurement programs, as these are the best methods for detecting three-dimensional wind fields (Beranek et al., 1989; Baker et al., 2014; Wernham et al., 2016). The Aeolus satellite was launched following the fifth Earth Explorer mission of the European Space Agency (ESA) on 22 August 2018. As the world's first Doppler wind lidar in space, Aeolus has enabled the continuous detection of global wind profiles from the ground to the lower stratosphere with a vertical resolution of 0.25–1 km (Marseille et al., 2008; Reitebuch et al., 2006; Zhang et al., 2019). Therefore, the wind profile data detected by Aeolus can compensate for the lack of spatial coverage and vertical resolution of ground-based wind field observations to some extent.
Located at the edge of the Sichuan Basin, Chongqing is a typical mountainous city in China known for its complex topography. Owing to the unique terrain, the mechanisms of extreme weather and the movement of atmospheric components in the city are intricate and complex, making vertical observations essential. Interference sources for the vertical detection of WPR might form in mountainous areas, which are different from those in plain areas. Thus, reasonable data verification and quality control should be conducted before application to ensure the accuracy and representativeness of the WPR. The spatial distribution of ground-based vertical wind observations in Chongqing is sparse, and it is worthwhile verifying the performance of Aeolus wind products and applying them to related mechanistic studies or numerical assimilation systems. To this end, wind profile observations of RS, WPR, and Aeolus were collected and matched in terms of time and space for 2021 in Chongqing. Based on the matched results, data verification and quality control of WPR wind observations were implemented using RS data, and the performance of Aeolus wind products in Chongqing was analyzed to provide a scientific basis for multi-source wind profile data applications in mountainous cities. The remainder of this paper is organized as follows: the RS, WPR, and Aeolus data used in this study; the matching procedure, data verification; and the quality control methods are described in Sect. 2. Section 3 presents the comparison and quality control results of the WPR and Aeolus wind profile data. Finally, the main conclusions are summarized in Sect. 4.
2.1 Data
2.1.1 Ground-based wind profile data
Shapingba (57516; 29.34∘ N, 106.27∘ E) is a national weather station and the only RS station in Chongqing. Wind speed and direction at 00:00 and 12:00 UTC (universal time coordinated) were obtained from an L-band sounding system on vertical height levels every 1 s from the surface to 30 km in the air (Zhang et al., 2020). Shapingba station belonged to the network of the L-band sounding system by the China Meteorological Administration. The operational radiosonde stations in China widely use GTS1 digital radiosonde instruments as key components of the L-band sounding system; they have high accuracy within the troposphere in detecting fine-resolution profiles of meteorological factors (Bian et al., 2011; Guo et al., 2016, 2021b).
There are two wind profile radars in Chongqing, one at Shapingba station and the other at Youyang station (57633; 28.84∘ N, 108.76∘ E). Radars can operate almost automatically and continuously, acquiring vertical profiles of horizontal wind speed and wind direction (Guo et al., 2021a). The WPRs in Shapingba and Youyang are from the same manufacturer, sharing the same temporal and spatial vertical resolutions of 5 min and 120 m, and vertically detecting 48 and 45 layers up to 9360 and 8910 m, respectively.
RS wind data are generally reliable vertical observations. Considering Shapingba WPR is located at the same station with RS, while Youyang Station is 360 km away from the RS, the data verification of WPR wind observations was conducted based on Shapingba WPR and RS data in this study (Fig. 1).
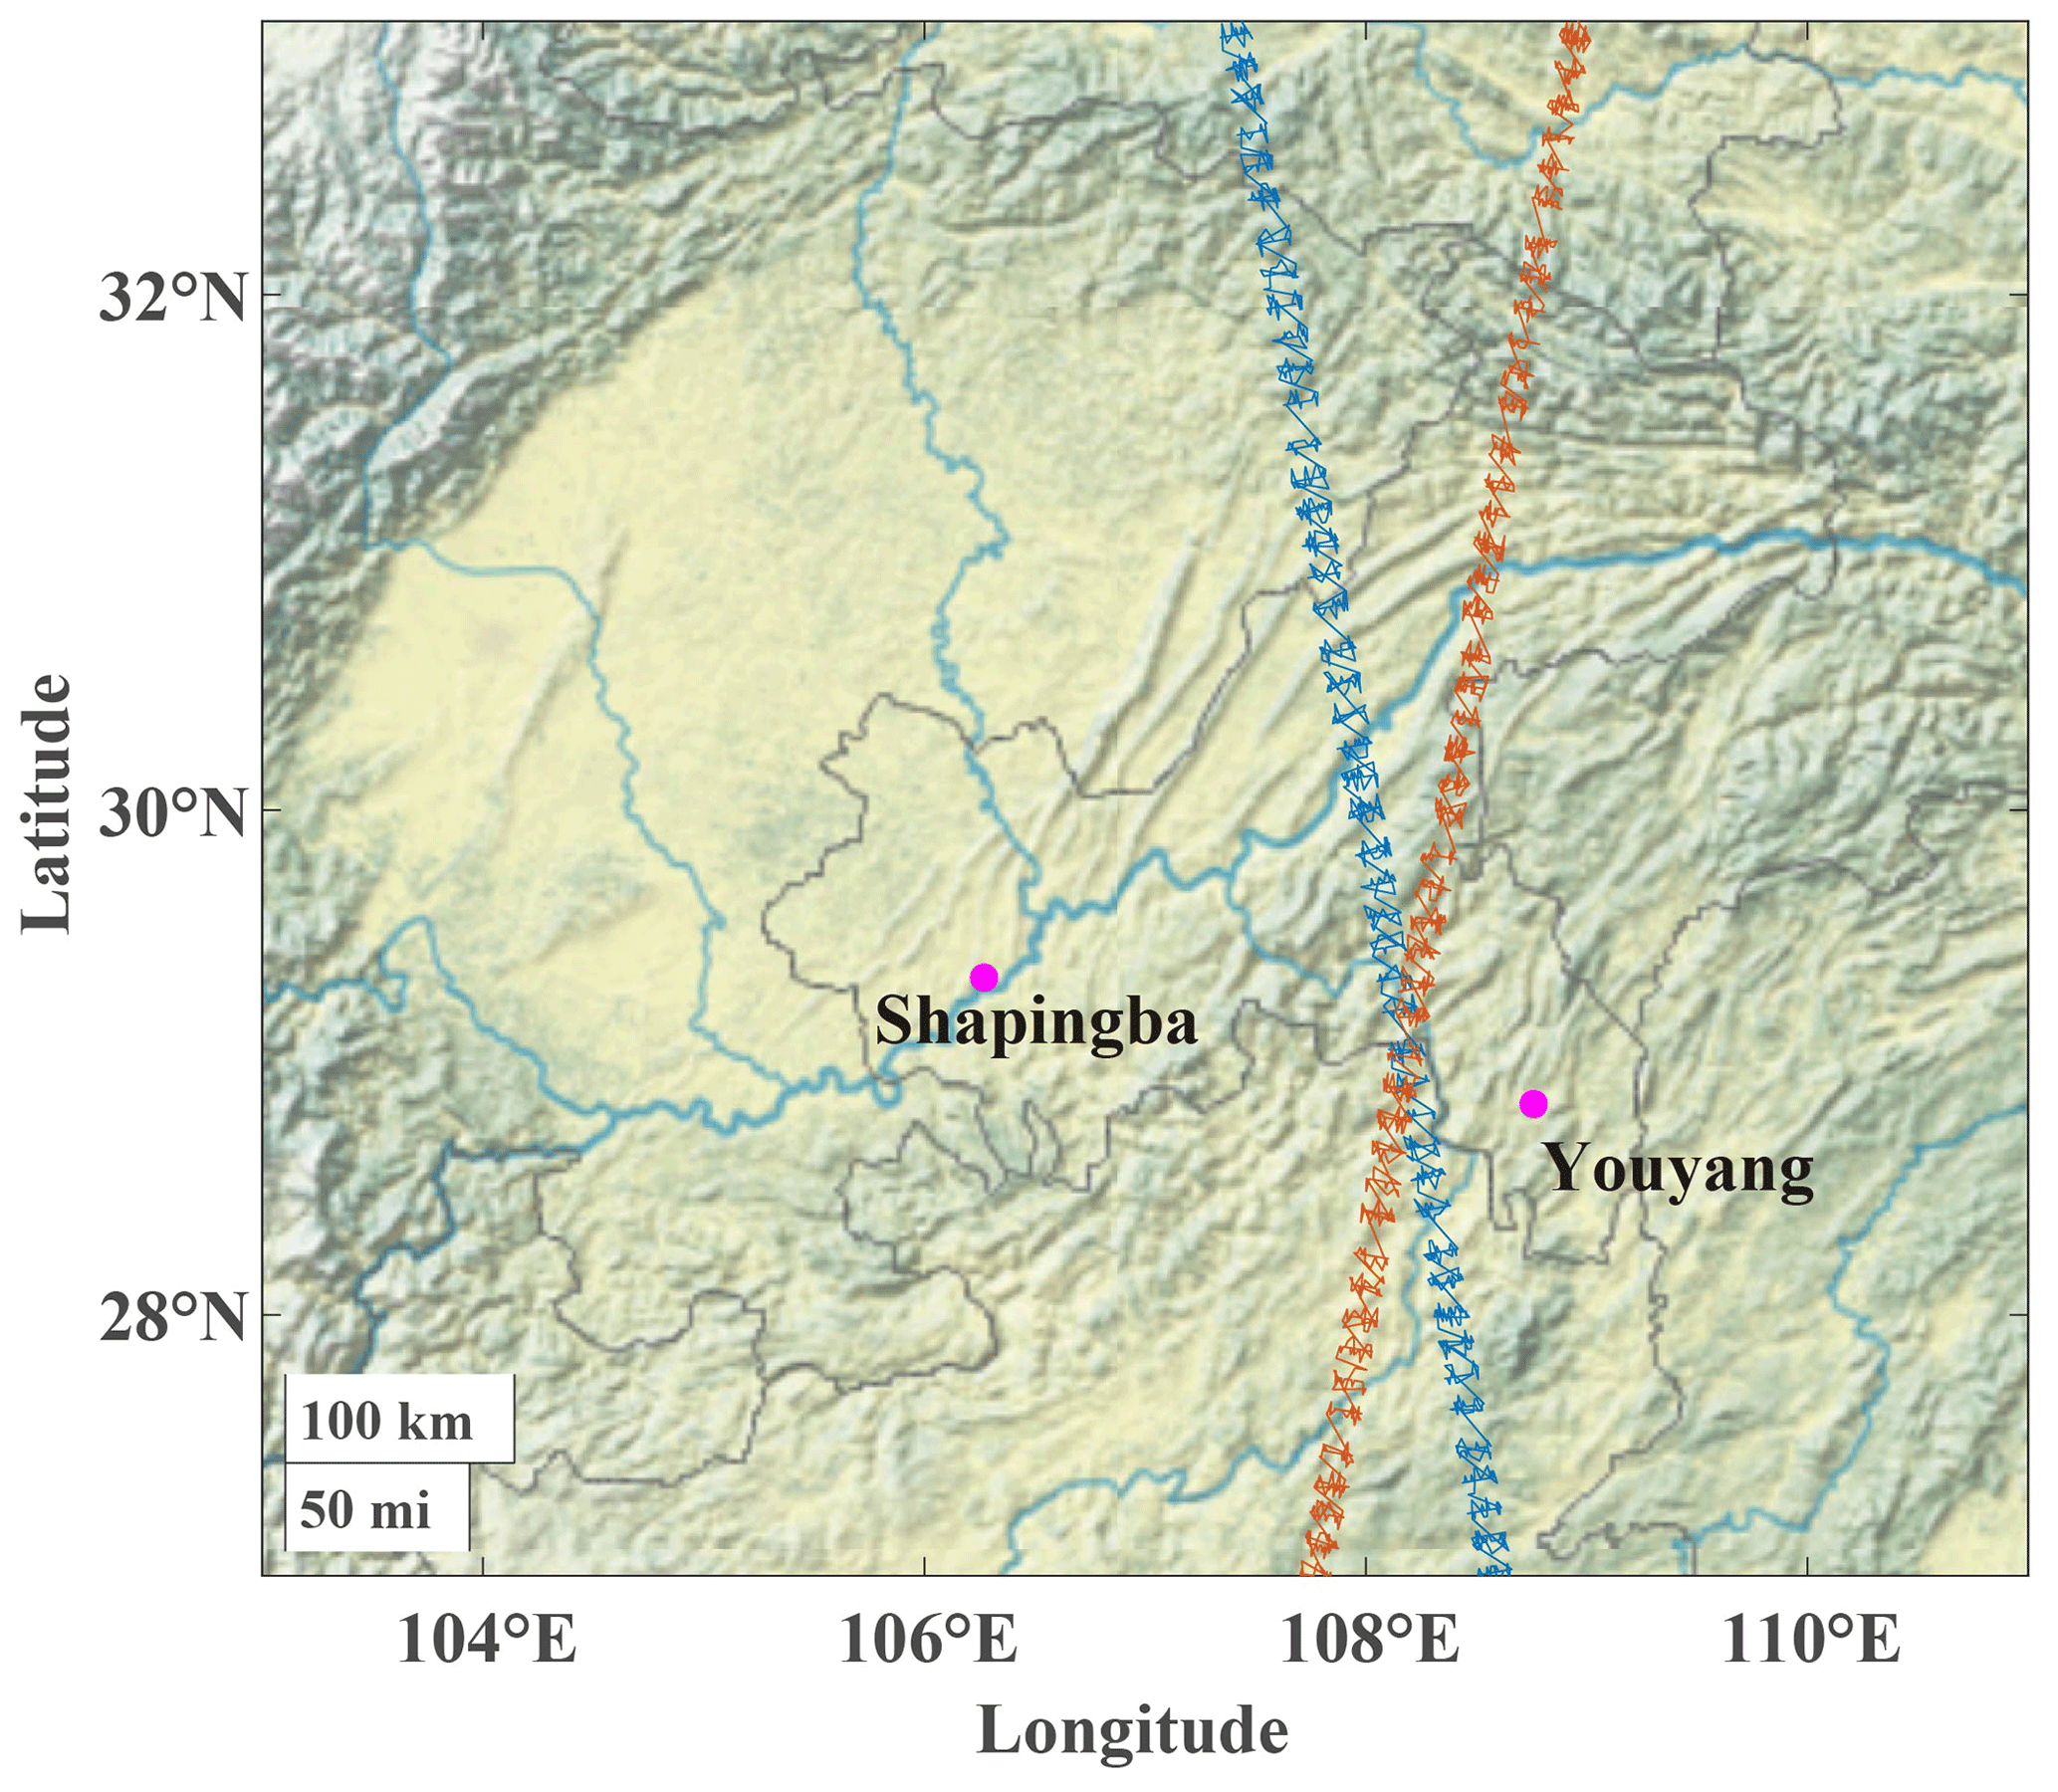
Figure 1Geographic locations of ground-based wind observation stations and Aeolus tracks along within Chongqing. The magenta dots denote ground-based observation stations, while red and blue line represent Aeolus tracks. The background is the terrain heights.
2.1.2 Aeolus wind products
Launched on 22 August 2018, the first spaceborne Doppler wind lidar, Aeolus, developed by the ESA, has been circling in a sun-synchronous orbit at an altitude of approximately 320 km, with a 7 d repeat cycle (ESA, 2008). Based on the original detection information, a series of products was released by the ESA. The Aeolus Level-2B products can provide scientific wind products, which can be used to obtain wind profile data from the ground to approximately 30 km in the air, with a vertical resolution of 0.25–2 km and an uncertainty of 2–4 m s−1, varying with height (Rennie, 2018; Chen et al., 2022). Level-2B wind products are classified into Rayleigh-clear and Mie-cloudy winds. Specifically, Rayleigh channels mainly detect wind fields with atmospheric molecules as tracers in the troposphere and lower stratosphere, whereas the Mie channel detects signals from aerosols and cloud droplet particles within the boundary layer or in the cloud (Witschas et al., 2020). In this study, the horizontal-line-of-sight (HLOS) wind products of both Rayleigh and Mie channels were used. Additionally, the validity flag and estimated errors were extracted for quality control of HLOS wind products (Tan et al., 2017; Guo et al., 2021a).
2.2 Methods
2.2.1 Data matching and verification procedures
In an attempt to make full use of the multi-source vertical wind data from Chongqing, appropriate procedures were used to match the RS, WPR, and Aeolus data in time and space to make up the limited ground-based wind profile observations. A flowchart of the procedure is shown in Fig. 2.
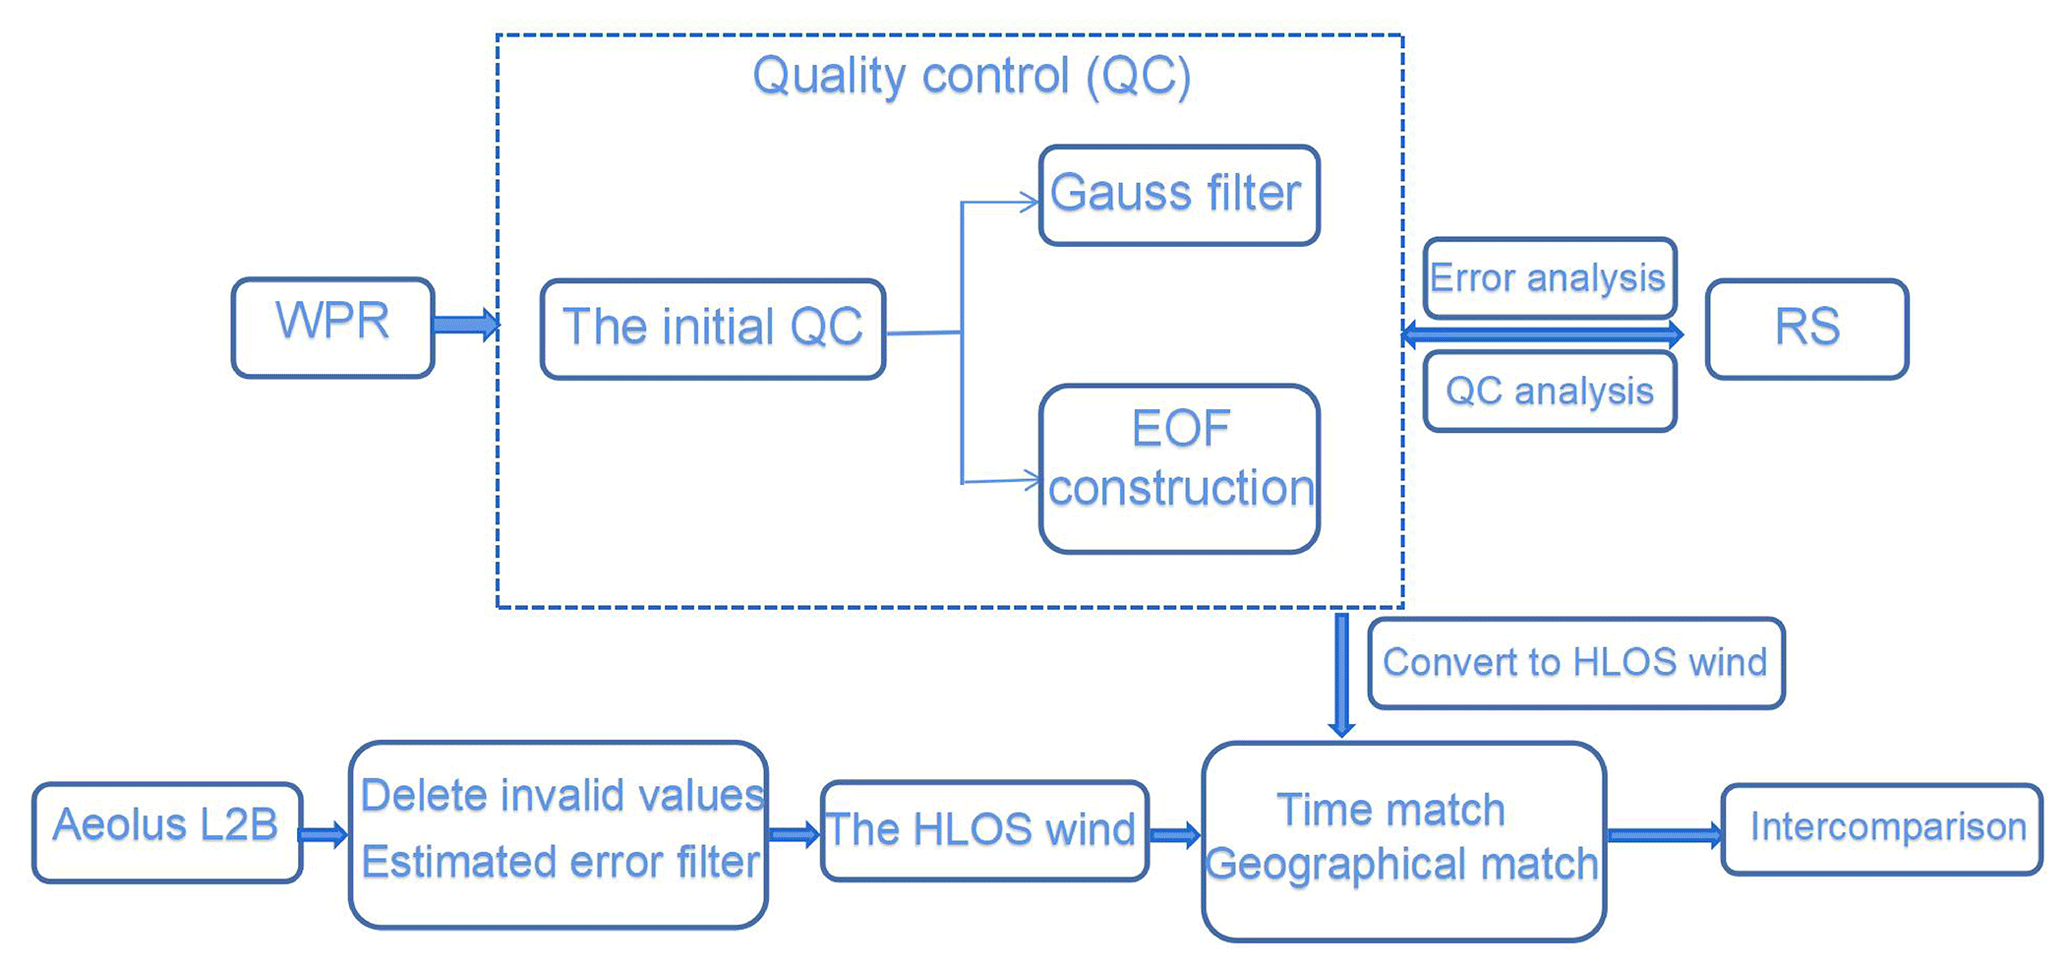
Figure 2Flowchart of the multi-source wind profile data matching and verification procedures. WPR stands for wind profile radar, RS stands for radiosonde, and EOF stands for empirical orthogonal function.
First, data verification and quality control effect analysis of the Shapingba WPR were implemented based on RS data. Based on the approach used by Zhang et al. (2016) and Guo et al. (2021a), the Aeolus data were removed once the distances between adjacent tracks of Aeolus and ground-based sites exceeded 1∘. This procedure showed that Shapingba station is not suitable for comparison with Aeolus data, whereas Youyang WPR data are. Time and space matches of the WPR and Aeolus data were posed before the comparison. The geographic locations of WPR stations and Aeolus tracks are shown in Fig. 1. Specifically, because of the higher temporal resolution of WPR, the mean values of WPR data within 10 min before and after Aeolus sampling were used. Vertically, Aeolus data were interpolated and matched to the layers of WPR data. Subsequently, Aeolus data were screened by validity flags and estimated errors. Thereafter, both the original Youyang WPR detection and quality control data were converted into HLOS winds for comparison with the Aeolus data. The WPR wind vector was projected onto the HLOS winds using the following equation (Witschas et al., 2020):
where ψAeolus is the Aeolus azimuth angle, which could be extracted from the Level 2B products, while wdRWP and wsRWP are WPR wind direction and speed, respectively.
2.2.2 Statistical method
The mean bias (MB) and root mean squared error (RMSE) were adopted as indicators (Eqs. 2 and 3) for the verification of the WPR and Aeolus wind products, which compare absolute and relative deviations, respectively.
where o(i) represents the observation values, and r(i) represents the referent values.
2.2.3 Data quality control of the wind profile radar
The initial quality control
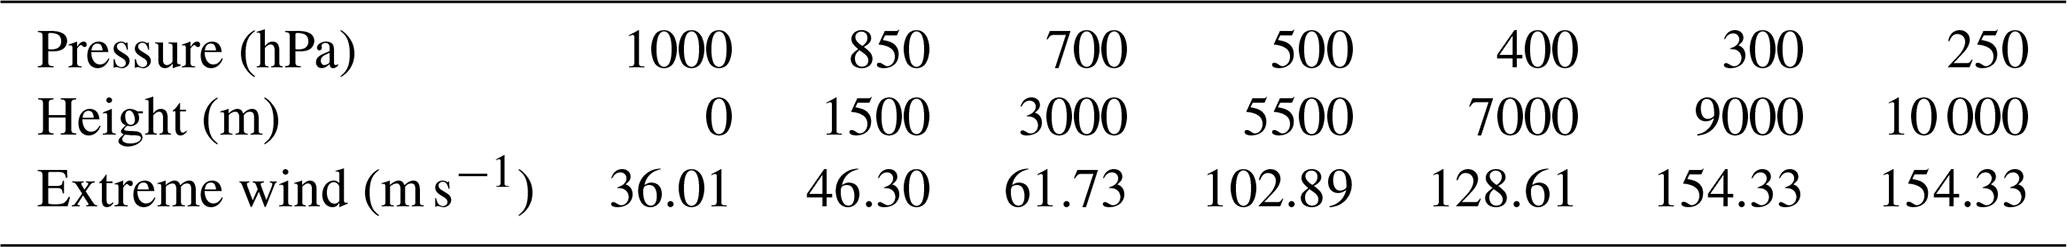
The first step in quality control is to eliminate the abnormal increase of horizontal wind in a small vertical range of WPR data, including screening invalid data exceeding the climate extreme values and the vertical consistency test. The extreme climate wind values on the relative layers (Zuo, 2020) are listed in Table 1. For the vertical consistency test, if the wind difference between a specific layer and its adjacent layer is greater than 3 times that of the two layers below, the value is considered an abnormal observation to be deleted (Zhang et al., 2015).
Gaussian filtering (GF) method
GF is a smooth filtering method that can be used to smooth out the details and noise of two-dimensional graphs, and the observed value of the central point and its surrounding values are summed in one-to-one correspondences. GF is similar to mean filtering, but its preset convolution operator presents a Gaussian distribution. In this study, the convolutional operator was used to calculate the weighted average of the WPR data to filter the high-frequency noise in the observation of WPR. The Gaussian filtering function of the one-dimensional zero-mean normalization is as follows:
where σ is the scale factor that determines the width of the Gaussian filter and further affects the degree of data smoothing. The larger the σ value, the wider the frequency band of the Gaussian filter and the better the data smoothing effect. However, an excessively large σ value causes excessive data loss and distortion. In this study, σ was set to 3.
Empirical orthogonal function construction (EOFc) method
Based on the spatial–temporal sequence formed by wind field data W, calculations similar to empirical orthogonal decomposition were performed, and the main modes obtained by calculation were used to reconstruct the spatial–temporal sequence to construct new wind fields. Specifically, the X matrix is formed by selecting N times, a period of time before and after a certain moment, and L layers of effective data, vertically. X is represented below:
Subsequently, the covariance matrix of X, that is, S = XXT, and its eigenvalues and eigenvectors were calculated. According to the arrangement of the eigenvalues from largest to smallest, the cumulative interpretation variance of the first m eigenvectors can be expressed as follows:
The larger the eigenvalue corresponding to the eigenvector, the more its corresponding distribution reflects the typical characteristics of the original field. The time coefficient T = ETX was calculated with the eigenvector E. Finally, the main modes decomposed by EOF were used to reconstruct the time series within N times, following the use of X = ET to obtain the vertical distribution of the wind field at the corresponding time. In the reconstruction of the time series, a cut-off threshold (G≥85 %) was set for the interpretation of the cumulative variance to control the quality of the observed data.
Assuming that the cumulative interpretation variances of the first m feature vectors met G≥85 %, and the first m−1 did not meet G≥85 %, the feature vectors of the first m modes were adopted in the reconstruction of the sequence, and the corresponding winds at moment j of the ith altitude layer are
The EOFc method can eliminate outliers and pulsating noise from observation data and has been applied in quality control research of observational elements in previous studies, such as in Qin et al. (2010).
2.2.4 Quality control of Aeolus wind products
The quality of the Aeolus HLOS wind products is controlled by validity flags and estimated errors, which are also present in Level 2B data products. Only data with flags equal to 1 were considered valid. The data were subsequently filtered according to estimated errors, and the theoretical values were calculated based on the measured signal levels, as well as the temperature and pressure sensitivity of the Rayleigh channel response (Dabas et al., 2008). Previous studies have revealed that notable observation errors appeared when the estimated errors were large (Witschas et al., 2020). Consequently, thresholds for estimated errors of 7(5) m s−1 were applied for Rayleigh(Mie) winds in this study, based on the method described by Guo et al. (2021a). Using the parameters valid_flag and hlos_estimate_error, 18241 Mie-cloudy wind profile samples and 1010 Rayleigh-clear samples were excluded. As a result, there are 1003 remaining usable Mie-cloudy samples and 1558 remaining Rayleigh-clear samples. Through the quality control process, significant reductions in the estimated error were achieved for the Mie-cloudy wind products, from 42.22 to 3.50 m s−1. Similarly, for the Rayleigh-clear wind products, the estimated error was reduced from 78.69 to 4.58 m s−1.
3.1 Data verification and quality control of WPR
Data verification and quality control of the Shapingba WPR were performed based on RS data from the same station. The missing data rate for the Shapingba WPR is 22.78 %, resulting in 8117 valid wind profile samples. For the Wulong WPR, the missing data rate is 30.08 %, resulting in 7350 valid wind profile samples. RS data have a missing data rate of 13.55 %, with 631 valid samples. To address the missing data, different approaches were employed based on the nature of the missing values. When specific levels within a profile have missing data, linear interpolation is used to fill in the gaps. However, if an entire layer of data is missing within a profile, the entire profile is excluded from the analysis.The WPR detects data vertically above the station, while the RS data are derived from air balls, which can respectively drift as far as 0–90, 2–25, and < 10 km away from the releasing station at 200, 500, and 850 hPa (Zeng et al., 2019). Therefore, certain differences exist in the spatial sampling of WPR and RS. Assuming that the atmospheric horizontal distribution is uniform within dozens of kilometers, the WPR and RS wind fields will be comparable. Additionally, the exact release times of the air balls were 23:15 and 11:15 UTC, and they generally take 25 min to rise to 10 km. Therefore, the mean values of the 23:15–00:00 and 11:15–12:00 WPR data were processed to compare the WPR and RS data. Finally, for comparison with the Aeolus data, wind fields derived from WPR and RS data were converted into zonal wind components for data verification and quality control.
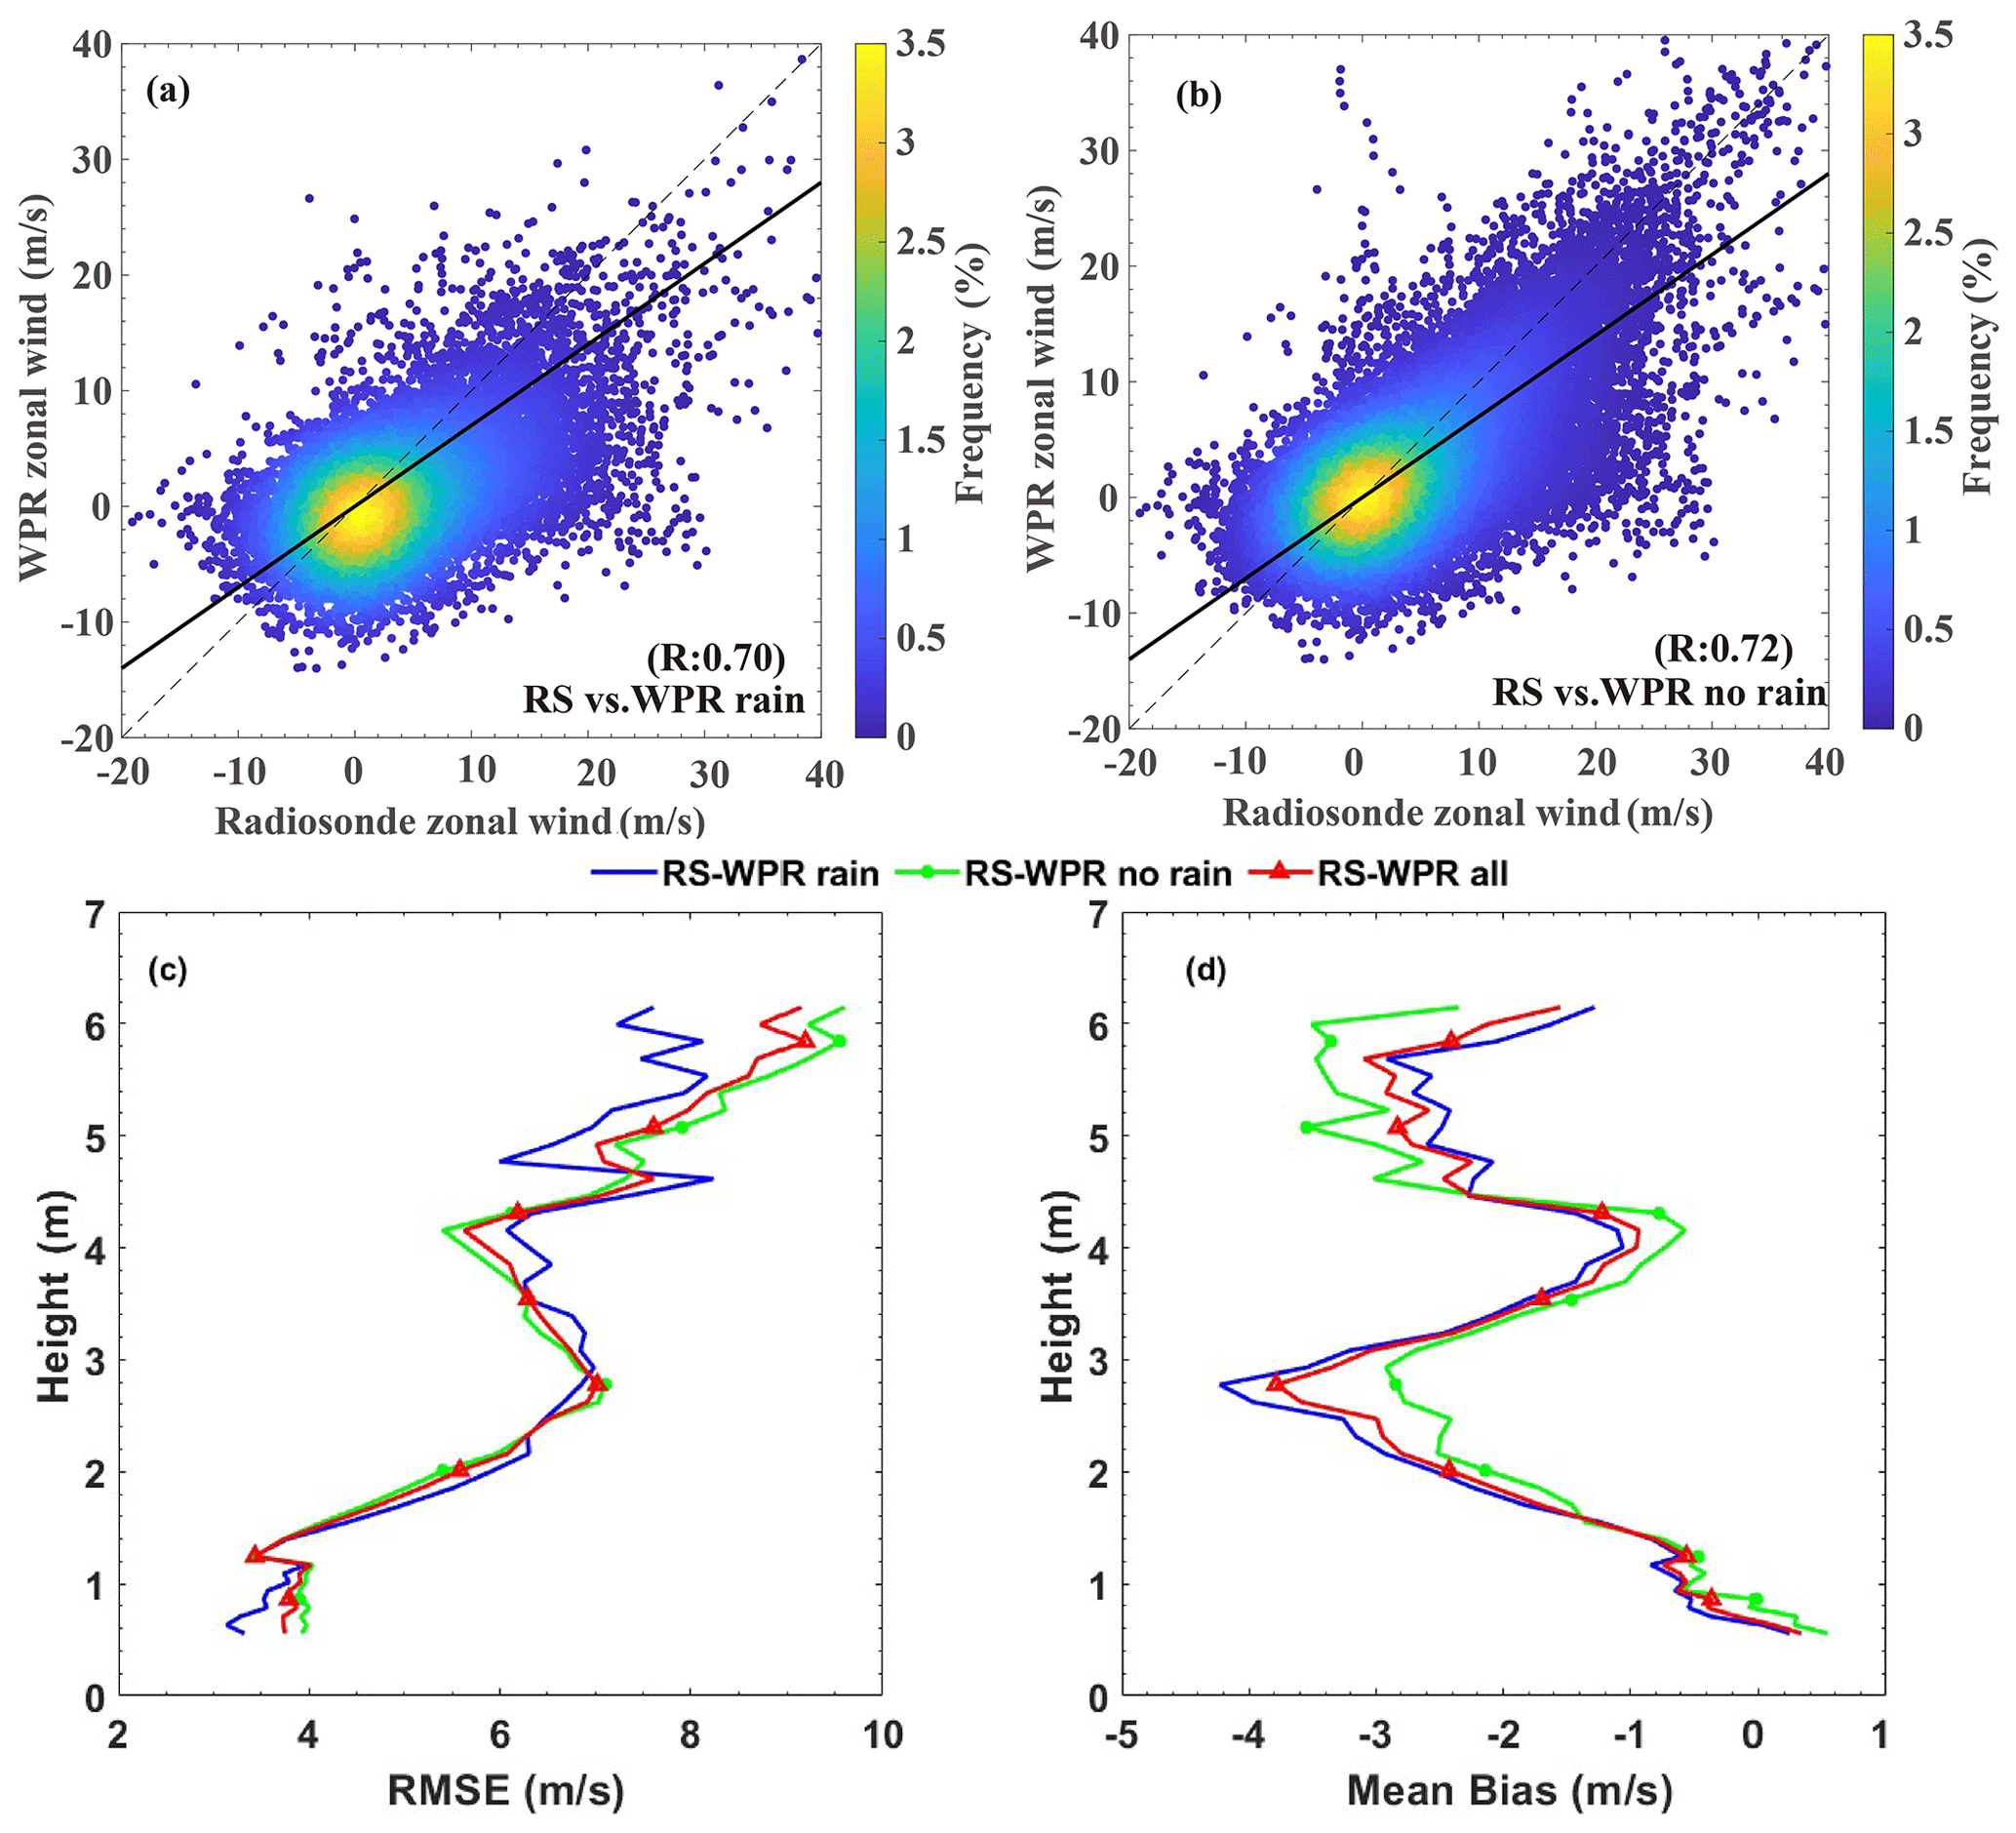
Figure 3Scatter density plots for wind profile radar (WPR) vs radiosonde (RS) data during (a) rainy days and (b) no rainy days and vertical distribution of (c) root mean squared error (RMSE) and (d) mean bias (MB) for WPR vs RS during all days, rainy days, and no rainy days.
To clarify influences of weather, especially precipitation, on wind profile radar observation quality, scatter plots and the vertical distribution of statistical parameters for WPR versus RS during rainy days and no rainy days are given in Fig. 3. Between 1.5 and 4.5 km, WPR deviations during rainy days exceeded those without rain a little, and the RMSE and MB between WPR and RS were slightly smaller during rainy days than those without rain below 1.5 km and above 4.5 km. The correlation coefficient between WPR and RS with rain was a bit lower than that without rain. Generally speaking, precipitation could affect WPR observation quality, but the deviation distributions were overall the same during rainy and no rainy days, with slight differences on different layers. As a result, we discussed the quality control effects of WPR data based on all data, including rainy days and no rain days.
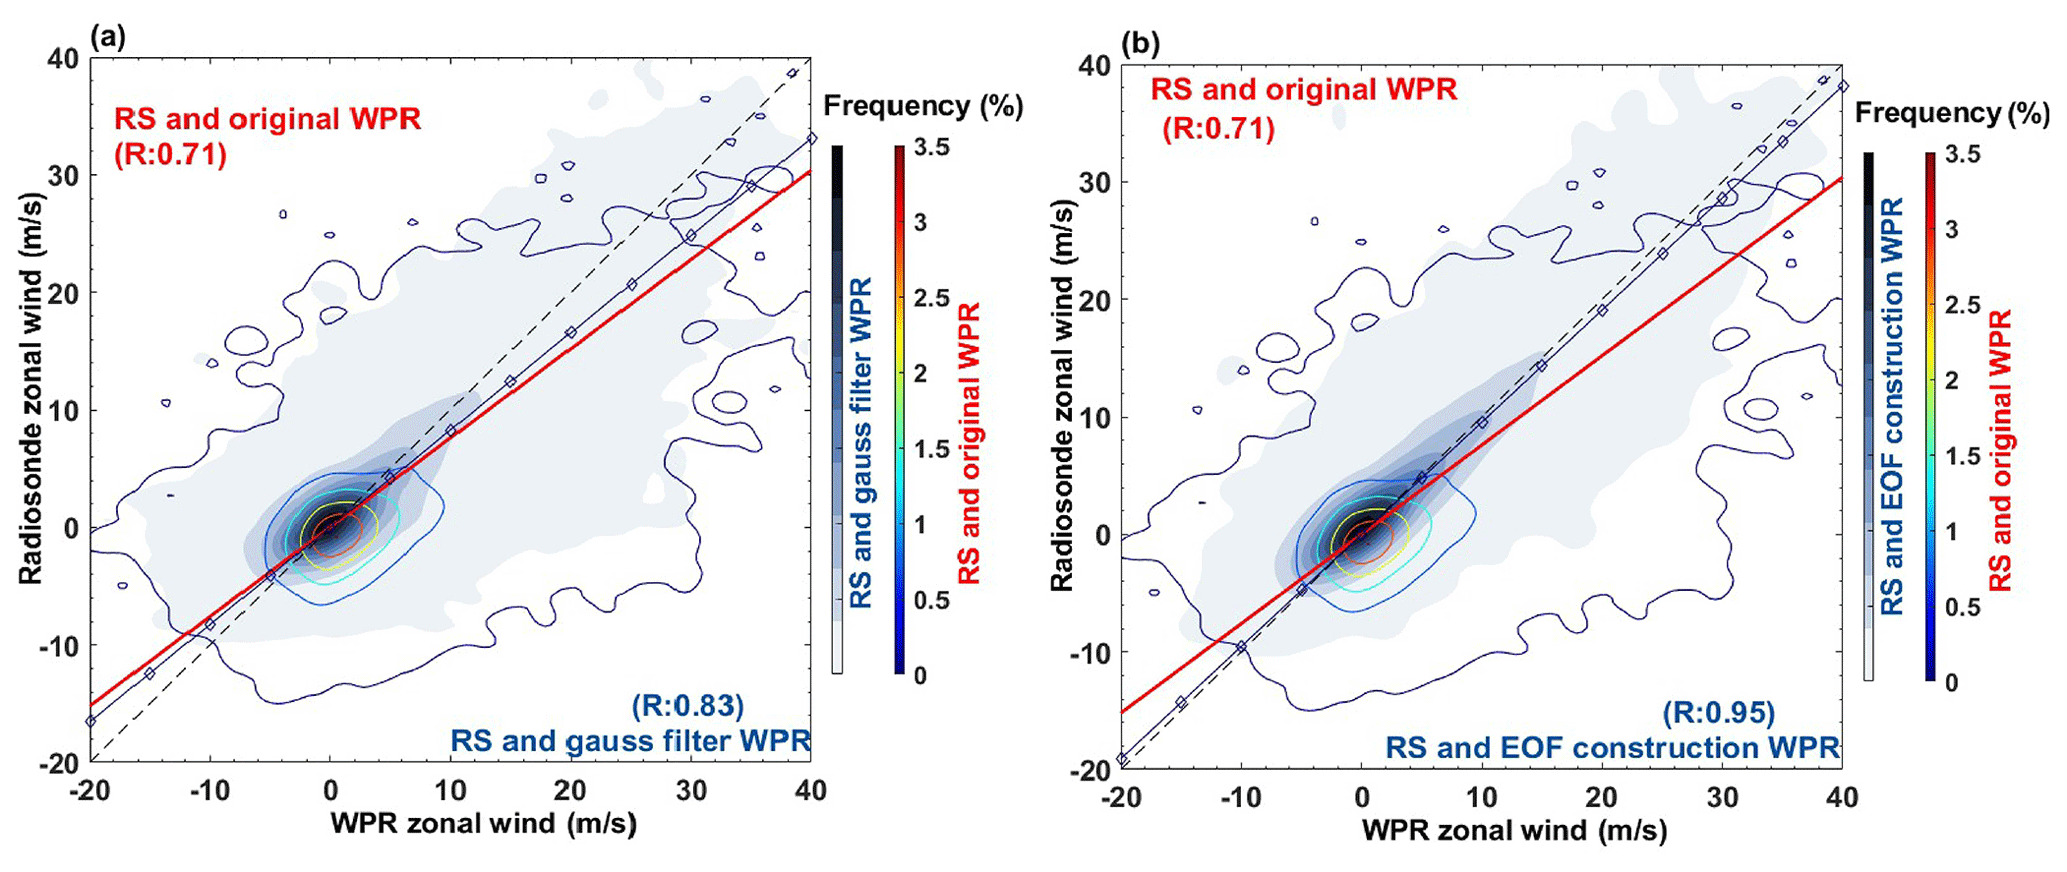
Figure 4Scatter density contour plots for (a) original and Gaussian-filtered (GF) WPR vs RS data and (b) original and empirical orthogonal function construction (EOFc) WPR vs RS data. The filled contour plots represent original WPR vs RS data, while the contour plots with no colored filling show GF or EOFc WPR vs RS data.
Based on Quality Control 1 of the WPR data mentioned above, 784 invalid wind speed data were filtered, after which GF and EOFc were conducted on WPR winds. The filled contour plots in Fig. 4 represent the scatter density distributions of the original WPR and RS data. The correlation coefficient (R) was 0.71, with the scatter distributed along the reference line, indicating a correlation between the two types of data. Large numbers of dots with significant deviations from the reference line between the wind speeds of ±10 m s−1 implied large differences between the WPR and RS in the observation of low wind speeds. The contour plots without filling color in Fig. 4a are scatter density distributions of GF-controlled WPR and RS, with an R of 0.83, showing better correlation compared with the original WPR and RS wind data. The GF method screened parts of the data far away from the reference line, which are wind data with large differences between WPR and RS, contributing to an improvement in the correlation of the two types of data. The performance of the WPR data quality control based on EOFc is more significant in Fig. 4b compared to GF. For EOFc, G was selected to be greater than 85 % for the first time; specifically, the first two modes were added after EOF decomposition, with G = 87.23 %. The R between the EOFc WPR and RS winds reached 0.95, with the scatter more concentrated around the reference line compared with the original and GF WPR.
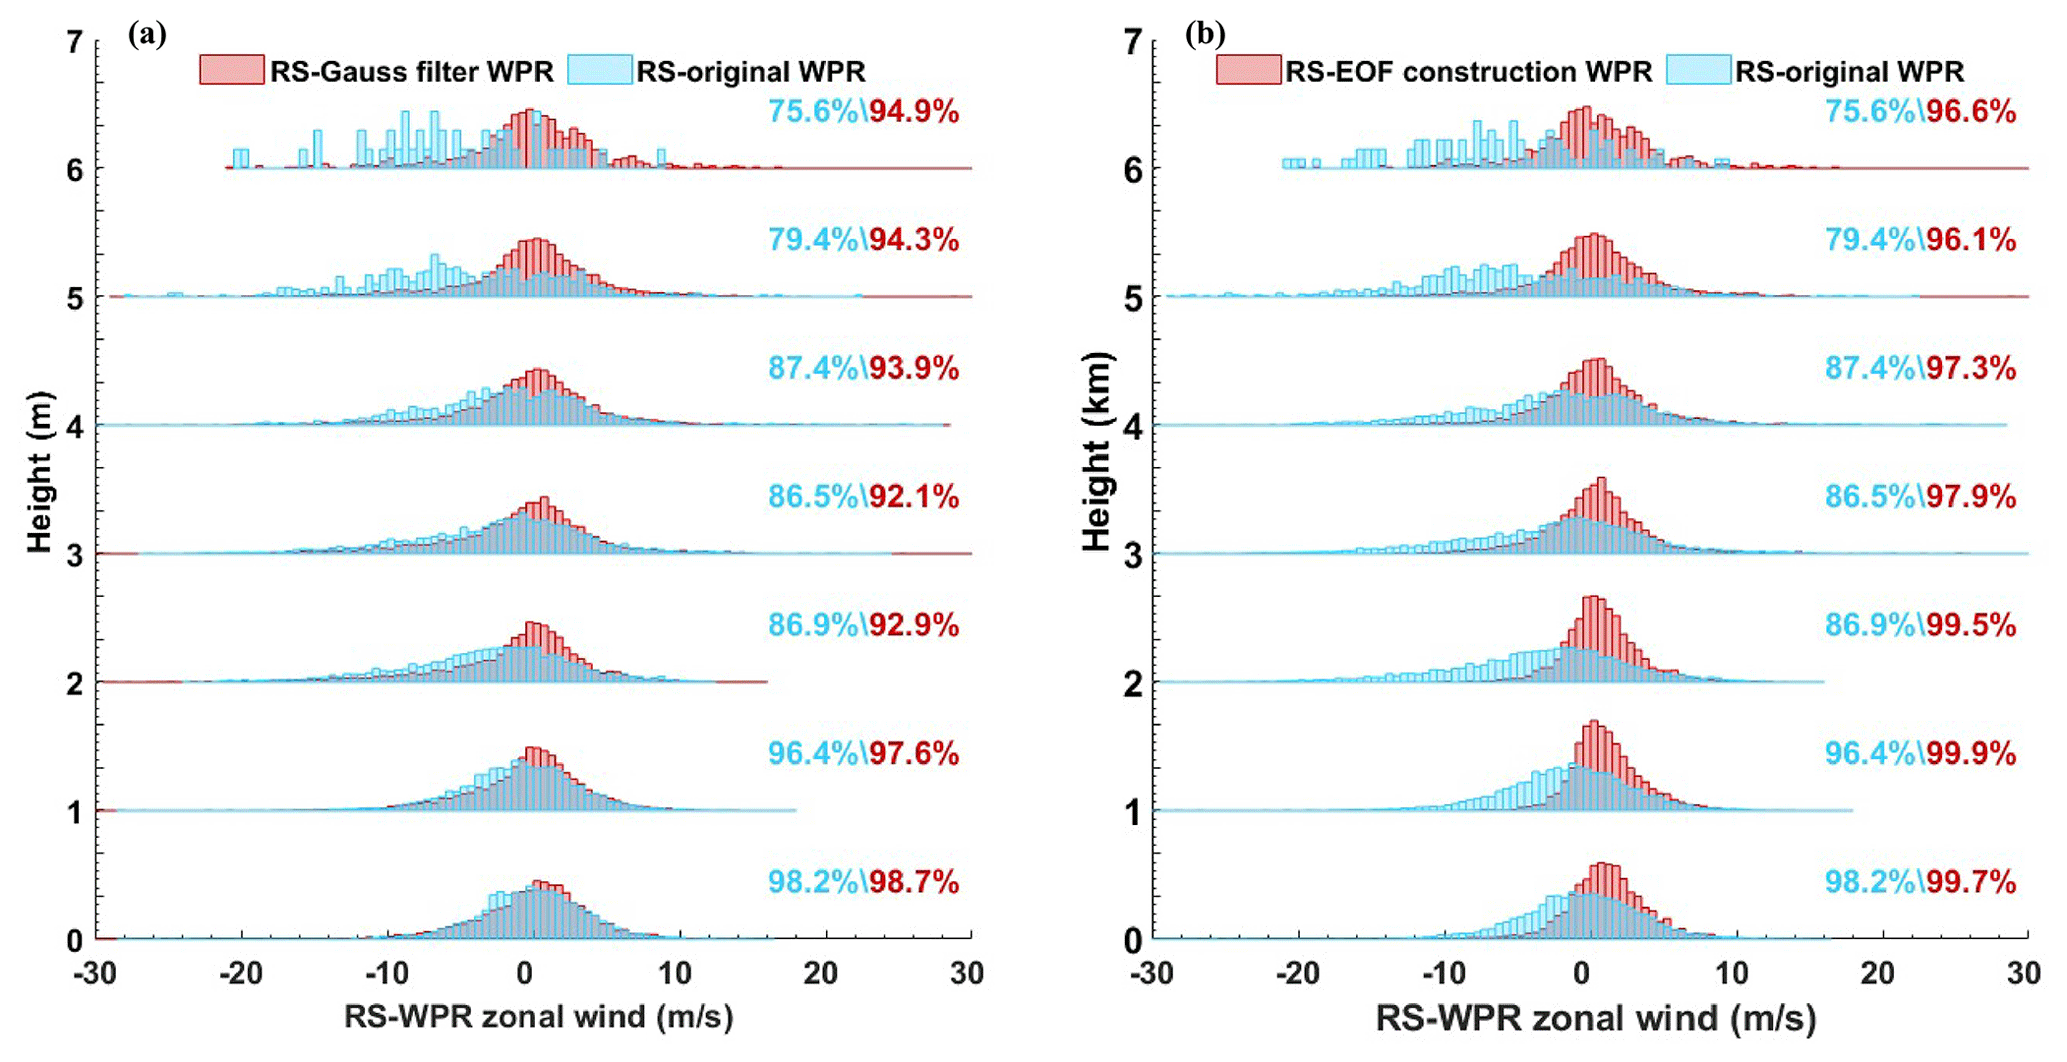
Figure 5Probability density distributions for vertical variations of (a) RS minus original and GF WPR data and (b) RS minus EOFc WPR data. The blue numbers represent the proportion of RS minus original WPR within −10 to 10 m s−1. In (a), the red numbers represent the proportion of RS minus GF WPR within the range, and in (b), red represents the proportion of RS minus EOFc WPR within the range.
The vertical wind deviation distributions of the original and quality-controlled WPR are shown in Fig. 5, and the vertical distributions of the statistical parameters are shown in Fig. 5. The distribution of deviations between the RS and original WPR data followed normal distribution on various layers. The median of the distribution was centered around 0 near the ground within 2 km and gradually moved towards the negative values above 2 km, indicating significant negative deviations on the upper layers. Large negative deviations emerged on different layers; however, large positive deviations were mainly distributed around 3–5 km, with the maximum around 30 m s−1. Comparing RS with the original WPR data, 98.2 % of the deviations were distributed within the −10 to +10 m s−1 range near the surface. However, this proportion decreases with increasing altitude, with only 75.6 % of the deviations falling within this range between 6–7 km. Furthermore, when comparing RS with the WPR data corrected using GF and EOFc, a higher proportion of deviations was observed to concentrate between −10 to +10 m s−1 at different altitudes. Specifically, the deviations between RS and EOFc WPR exhibit a higher proportion of deviations within the −10 to +10 m s−1 range compared to those between RS and GF data. From the perspective of statistical parameters, the RMSE of RS and the original WPR deviation increased with height overall but decreased at heights between 3 and 4 km. The vertical MB distribution between the RS and original WPR data presented an M-shaped distribution, with positive MB values near the ground and negative values in the other layers. According to the vertical distribution of the deviation scatter points, the negative deviations are significantly larger than the positive deviations. For a relatively small MB value of approximately 4 km, some of the large positive deviations in Fig. 5 at this level balance the negative values. Similarly, large positive and negative deviations appeared at approximately 6 km, forming small MB values at this level. In general, wind speeds increase with height, leading to an increase in the observation deviations of the WPR.
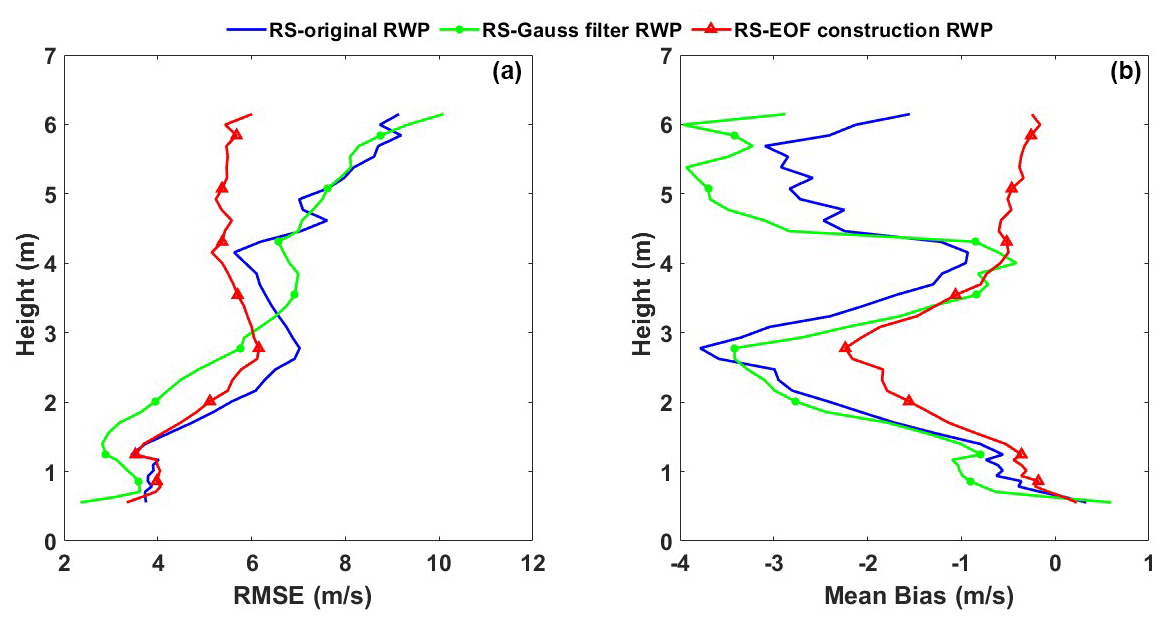
Figure 6Vertical distributions of RMSE and MB for (a) RS vs GF WPR data and (b) RS vs EOFc WPR data.
Taking RS data as true values, the zonal WPR wind data in Chongqing exhibited various detection errors with height, indicating that quality control of the original WPR data is necessary. The red histograms in Fig. 5a represent the vertical deviation distributions between RS data and the GF WPR with respect to height. Compared with the original WPR data, GF eliminates some large deviation values of different layers, making the distribution more centered around 0, especially on the upper layers. The vertical distributions of the RMSE and MB between the RS and WPR data corresponded to modifications. The RMSE of the RS and GF WPR data is reduced below 3 km compared to the original WPR, while the alteration of MB mainly manifests above 4 km. Remarkably, the negative value of MB above 4 km increased after GF in the WPR data. This was because of the reduction in the larger positive deviation value, and the negative deviation could not be offset. Subsequently, the EOFc method was adopted for the zonal winds in the original WPR data. The vertical deviation distributions of RS and EOFc WPR reduced many large negative deviations in the different vertical layers, making distribution more in line with normal distribution (Fig. 5b). The statistical parameters of the vertical distribution also showed significant changes compared to the original data. A significant decrease in the RMSE value and a notable reduction in the negative MB above 1 km were observed between the RS and EOFc WPR (Fig. 6). Combining both the vertical distribution for deviation scatter and statistical parameters, the EOFc WPR winds were similar to the RS data at various heights. Although the deviations of the two types of data were significantly reduced, it is worth noting that the EOFc WPR data have modified the characteristics of the original wind fields to a large extent, especially under strong convective weather conditions with large vertical wind shear. In comparison, the GF WPR data could better retain the basic characteristics of the original wind fields. However, the GF method exhibited a limited reduction in the detection deviations of the WPR data. In general, the two quality control methods have different effects on the reduction of detection deviations and the retention of the original information.
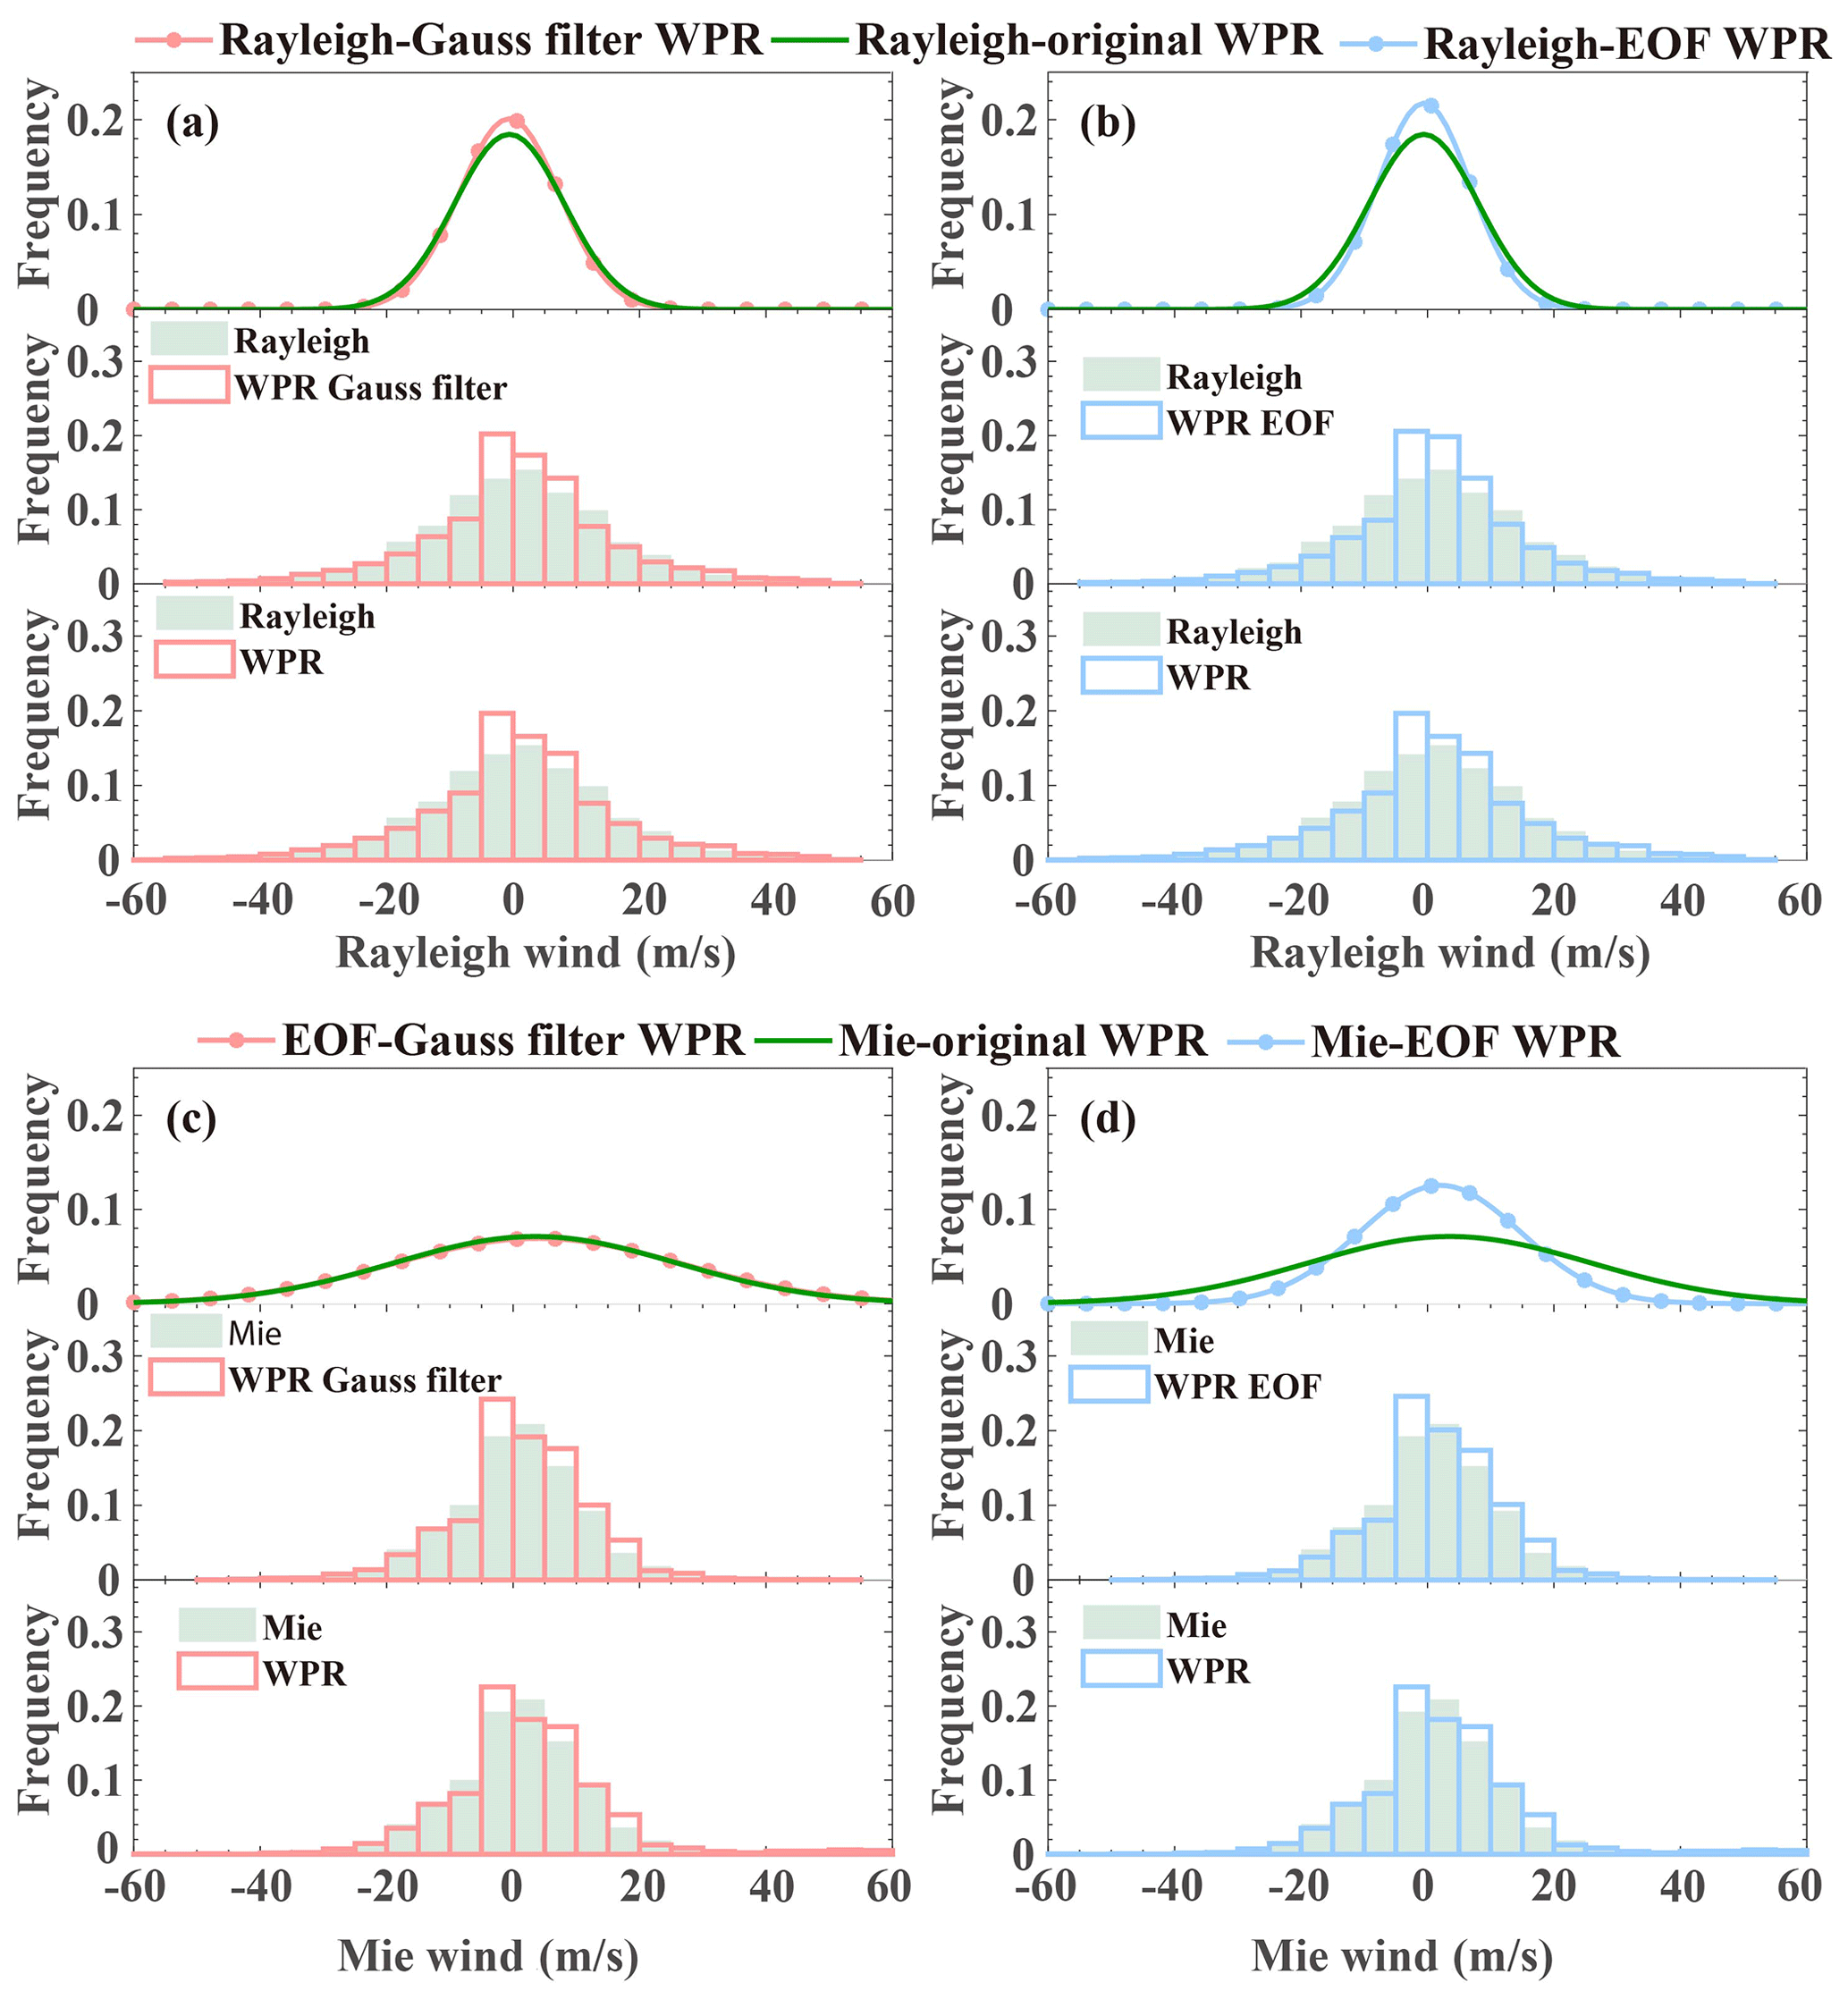
Figure 7Probability density distributions of deviations and wind distributions of (a) Rayleigh-clear and (c) Mie-cloudy vs WPR original and GF WPR winds and (b) Rayleigh-clear and (d) Mie-cloudy vs original and EOFc WPR winds.
3.2 Comparison of the Aeolus and WPR wind data
Owing to the limited spatial coverage of ground-based wind profile data, data verification of Aeolus products in Chongqing was conducted to compensate for the spatial coverage of wind observations to some extent. The match procedure results indicate that the Youyang WPR data can be used to verify the Aeolus products described in Sect. 2. The probability density distributions (PDDs) of deviations and wind distributions of both Aeolus Rayleigh-clear and Mie-cloudy products versus WPR data are shown in Fig. 7. The PDDs of deviations between Rayleigh-clear and WPR in Fig. 7a generally present a Gaussian distribution, with 82.9 % of deviations concentrating within ±10 m s−1 and 56.0 % of deviations within ±5 m s−1. Quality control with the GF and EOFc methods was conducted on original WPR observations, and the PDDs of deviations between Rayleigh-clear and quality-controlled WPR winds were concentrated around 0. For deviations between Rayleigh-clear and GF WPR winds, 85.8 % of deviations were centralized within ±10 m s−1 and 58.9 % of deviations within ±5 m s−1. In comparison, 86.3 % of deviations of Rayleigh-clear and EOFc WPR winds appeared within ±10 m s−1 and 59.6 % of deviations within ±5 m s−1. The scatter distributions of the Rayleigh-clear and WPR winds were shown in Fig. 7a and b, respectively. WPR detects winds between −5 and 10 m s−1 as larger than Rayleigh-clear wind, while it underestimates wind speeds in the range of ±10 to ±20 m s−1 compared with Aeolus Rayleigh wind products. Figure 7c–d show the PDDs of deviations and wind distributions of between the Mie-cloudy and WPR winds. A total of 86.2 % of deviations of Mie-cloudy versus original WPR data were centralized within ±10 m s−1 and 67.8 % of deviations within ±5 m s−1, while 86.9 % of deviations of Mie-cloudy versus GF WPR winds were centralized within ±10 m s−1 and 69.1 % of deviations within ±5 m s−1. For the EOFc WPR winds, 87.5 % of deviations appeared within ±10 m s−1 and 70.2 % of deviations within ± 5 m s−1. The PDD of wind detected by WPR is similar to that of Mie-cloudy wind, but WPR generally overestimates wind in the range of −5 and 20 m s−1 compared with Aeolus Mie wind products. First, the deviations of the Mie-cloudy and quality-controlled WPR data were more concentrated around 0 compared with the original WPR. Additionally, compared with Rayleigh-clear winds, deviations in the Mie-cloudy versus WPR data were small, which may be attributed to the detection principles of the two channels. Compared with the Rayleigh channel, the tracers for the Mie channel, including aerosols and cloud droplets within the boundary layer and in the cloud, were mainly centralized at lower vertical levels with smaller wind speeds, resulting in smaller wind deviations for the Mie-cloudy observations.
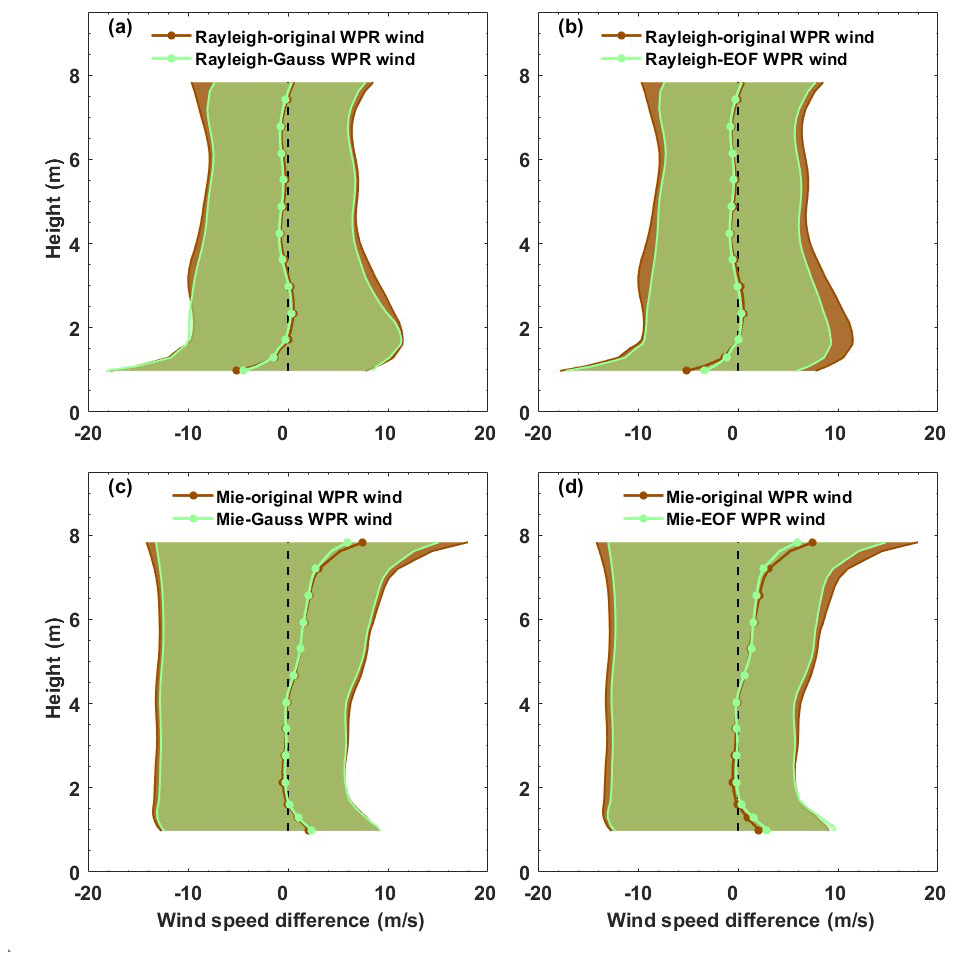
Figure 8Vertical distribution of mean differences and deviations between (a) Rayleigh-clear vs GF WPR data, (b) Rayleigh-clear vs original and EOFc WPR data, (c) Mie-cloudy vs original and GF WPR data and (d) Mie-cloudy vs original and EOFc WPR data.
Figure 8 shows the vertical distribution characteristics of the differences between Aeolus products and WPR data. The solid red line represents the vertical distributions of the mean differences between Aeolus and the original WPR data, and the shaded areas denote positive and negative deviations from the mean differences. Mean differences between the Rayleigh-clear and original WPR winds have large negative deviations below 1.5 km, with the maximum deviation reaching −5.2–13.0, −5.2 + 12.61 m s−1. However, the mean difference between these data stayed within ±1 m s−1 from the heights of 1.5 to 8 km, with simultaneous decreasing negative and positive deviations with height. The wind measurement capability of the Rayleigh channel is largely limited by the receiving intensity, and the Sichuan Basin is a region with one of the highest levels of aerosols in China (Zhang et al., 2012; Lu et al., 2022a). Particularly, below 1.5 km within the boundary layer, strong aerosol scattering will inevitably affect molecular scattered signals, thus reducing the accuracy of Rayleigh channel wind field inversion (Tan et al., 2017; Guo et al., 2021a). In contrast, the vertical distribution of mean differences between Mie-cloudy and original WPR data (Fig. 8c and d) showed large values within the boundary layer (below 1.5 km) and middle troposphere (4–8 km). The maximal deviation within the boundary layer reached 2.09–18.23, 2.09 + 14.76 m s−1, while the maximal values were 7.49–19.98, 7.49 + 21.64 m s−1 in the middle troposphere. For the Mie channel, aerosols and cloud droplet particles were used as tracers for wind measurements. Owing to the influence of the topography in Chongqing, the prevailing quiet and small winds within the boundary layer result in the dominant influence of turbulent motion on large particles (Lu et al., 2022b). This contributes to larger deviations in Mie wind observations because of the irregularity of turbulence. The notable mean differences in the middle troposphere may be affected by the distribution of cloud droplets. Previous studies have revealed that due to the influence of the topography of the Tibetan Plateau, the liquid cloud water contents around 27 to 35∘ N in central China are remarkably larger than those in the southern and northern regions at the same altitude (Yang and Wang, 2012), with nimbostratus and altostratus prevailing in the affected areas (Yu et al., 2004). These may contribute to large mean differences and deviations between Mie winds and WPR data at altitudes of 4–8 km in Chongqing, which is located on the eastern side of the Tibetan Plateau. According to existing observations, the frequency of cloud occurrence in the middle troposphere in spring, autumn, and winter is higher than that in summer, which can explain to some extent why the annual mean differences between Mie winds and WPR around 4–8 km have large values, whereas the average values in summer do not (Guo et al., 2021a). Based on the GF and EOFc quality control of the WPR data, the mean differences between the Rayleigh-clear and WPR winds were found to not change significantly, with only some reduction in the differences between the Rayleigh-clear and EOFc WPR data within the boundary layer. However, by controlling the WPR data quality, the positive and negative deviations of the mean difference at various heights can be effectively reduced (Figs. 8a and 6b). Specifically, GF can reduce deviations above 3 km, whereas EOFc modifies the positive deviations within the boundary layer. For the Mie winds, a remarkable reduction was observed for mean differences at an altitude of approximately 6–8 km and deviations in various layers with quality-controlled WPR data compared with the original WPR data.
To evaluate the observation quality of the multi-source wind profile data in Chongqing, this study matched the Aeolus, RS, and WPR data for 2021. The matching results indicate that the Youyang WPR can be used for comparison with the Aeolus winds. Additionally, data verification and quality control studies of ground-based WPR data were conducted based on Shapingba RS wind observations. The main conclusions are given in the following.
A correlation was found between the RS and original WPR zonal wind data, with an R of 69.92 % and scatter points generally distributed along the reference line. The RMSEs of the RS and WPR data increased with height overall, except at an increase of approximately 3–4 km. The MB was vertically distributed in an M shape, with relatively smaller MB values appearing at 4 and 6 km because of the cancellation of positive and negative deviations.
Screened by the extreme wind climate values and the vertical consistency test, 784 WPR wind observations were eliminated. R values between RS versus GF WPR data and EOFc (G = 87.23) WPR data were 0.83 and 0.95, respectively, demonstrating a better correlation between RS and EOFc WPR data. A comparison of the deviations in the vertical distribution of the RS and WPR data before and after quality control revealed that the EOFc WPR data are closer to RS winds at various heights, resulting in smaller deviations between the two. However, it should be noted that the EOFc WPR winds have a broader filter than the original data, which can remarkably alter the characteristics of the original wind fields, particularly in cases of severe convection weather conditions where there are significant vertical wind shears. While preserving the basic features of the original wind field, the GF method has a limited impact on reducing the deviations of the original WPR wind observations.
The Rayleigh and Mie winds detected by Aeolus exhibited various deviations from the WPR data; 56.0 % of deviations between Rayleigh-clear and WPR data existed within ±5 m s−1, while 67.8 % of deviations between Mie-cloudy and WPR data were within ±5 m s−1. The Mie channel detects aerosols and cloud droplets as tracers, which are lower than the height layers detected by the Rayleigh channel, resulting in relatively small wind speed deviations. However, the mean differences between Rayleigh-clear and WPR winds are smaller than those of Mie-cloudy winds, especially in the middle troposphere of 4–8 km. This may be due to the influence of the topography of the Tibetan Plateau, resulting in a remarkable increase in the liquid cloud water content from 27 to 35∘ N in central China compared to other regions. Chongqing is located in the affected areas; thus, the accuracy of Mie wind observations is influenced by the middle troposphere.
The deviations between the Aeolus and WPR data changed to some extent after quality control of the WPR data, both for the Rayleigh-clear and Mie-cloudy winds. The scatter points of the Aeolus and WPR data, which were far away from the reference line, decreased; 58.9 % of deviations between the Rayleigh-clear and GF WPR data were centralized within ± 5 m s−1, and 59.6 % of deviations for EOFc WPR data were within ± 5 m s−1. For the Mie channel, 69.1 % of deviations were concentrated ± 5 m s−1 between the satellite and GF WPR data, and 70.2 % of deviations existed between the Mie and EOFc WPR data. The mean differences of the Rayleigh channel and WPR data changed little after quality control was conducted using both the GF and EOFc methods on WPR data; however, both positive and negative deviations to the mean values decreased. For Mie winds, quality control on WPR made distinct modifications to the mean differences between 6–8 km and deviations to the mean values of all layers between Mie-cloudy and WPR data.
The code can be accessed at https://doi.org/10.5281/zenodo.10483770 (Lu, 2024).
The L-band sounding data and wind profile radar data used in this paper can be provided for non-commercial research purposes upon request to the first author (Hua Lu: vibgyor0113@163.com). The Aeolus data were obtained from https://aeolus-ds.eo.esa.int/oads/access/collection (ESA, 2023).
HL and MX had the original idea, designed the research, performed data quality control, and prepared the main part of the paper. WZ provided valuable comments and acquired financial support for the research. BL was responsible for data curation and undertook part of the analysis. TW and BZ reviewed and edited the paper.
The contact author has declared that none of the authors has any competing interests.
Publisher’s note: Copernicus Publications remains neutral with regard to jurisdictional claims made in the text, published maps, institutional affiliations, or any other geographical representation in this paper. While Copernicus Publications makes every effort to include appropriate place names, the final responsibility lies with the authors.
We would like to express our gratitude to the China Meteorological Bureau for providing the ground-based wind profile data and the European Space Agency for providing the Aeolus wind products.
This work was supported by the National Natural Science Foundation of China (grant nos. 42205186 and 42275102), the Chongqing Natural Science Foundation (grant no. cstc2021jcyj-msxmX1007), the Open Research Fund of Chongqing Meteorological Bureau (grant no. KFJJ-201607), the Sichuan Science and Technology Program (grant no. 2023YFS0430), Heavy Rain and Drought-Flood Disasters in Plateau and Basin Key Laboratory of Sichuan Province (grant nos. SZKT202206 and SCQXKJZD202103), the Key Technology Research and Development of Chongqing Meteorological Bureau (grant nos. YWJSGG-202215 and YWJSGG-202303), the Natural Science Foundation of Jiangsu Province (grant no. BK20211158), and the research start-up fund for the introduction of talents from Nanjing Normal University (grant no. 184080H201B57).
This paper was edited by Ad Stoffelen and reviewed by four anonymous referees.
Baker, W. E., Atlas, R., Cardinali, C., Clement, A., Emmitt, G. D., Gentry, B. M., Hardesty, R. M., Källén, E., Kavaya, M. J., Langland, R., Ma, Z., Masutani, M., McCarty, W., Pierce, R. B., Pu, Z., Riishojgaard, L. P., Ryan, J., Tucker, S., Weissmann, M., and Yoe, J. G.: Lidar-Measured Wind Profiles: The Missing Link in the Global Observing System, B. Am. Meteorol. Soc., 95, 543–564, https://doi.org/10.1175/BAMS-D-12-00164.1, 2014.
Baker, W. E., Emmitt, G. D., Robertson, F. R., Atlas, R., Molinari, J. E., Bowdle, D. A., Paegle, J. N., Hardesty, R. M., Menzies, R. T., Krishnamurti, T. N., Brown, R. A., Post, M. J., Anderson, J. R., Lorenc, A. C., and McElroy, J. L.: Lidar-measured winds from space: A key component for weather and climate prediction, B. Am. Meteorol. Soc., 76, 869–888, 1995.
Barre, H. M. J. P., Duesmann, B., and Kerr, Y. H.: SMOS: the mission and the system, IEEE T. Geosci. Remote Sens., 46, 587–593, 2008.
Belmonte Rivas, M. and Stoffelen, A.: Characterizing ERA-Interim and ERA5 surface wind biases using ASCAT, Ocean Sci., 15, 831–852, https://doi.org/10.5194/os-15-831-2019, 2019.
Benjamin, S. G., Schwartz, B. E., Szoke, E. J., and Koch, S. E.: The Value of Wind Profiler Data in U.S. Weather Forecasting, B. Am. Meteorol. Soc. 85, 1871–1886, 2004.
Beranek, R. G., Bilbro, J. W., Fitzjarrald, D. E., Jones, W. D., Keller, V. W., and Perrine, B. S.: Laser atmospheric wind sounder (LAWS)//Proceedings of SPIE 1062, Laser Applications in Meteorology and Earth and Atmospheric Remote Sensing, Los Angeles, SPIE, 1062, 234–248, 1989.
Bian, J., Chen, H., Vömel, H., Duan, Y., Xuan, Y., and Lü, D.: Intercomparison of humidity and temperature sensors: GTS1, Vaisala RS80, and CFH, Adv. Atmos. Sci., 28, 139–146, https://doi.org/10.1007/s00376-010-9170-8, 2011.
Chen, C., Xue, X., Sun, D., Zhao, R., Han, Y., Chen, T., Liu, H., and Zhao, Y.: Comparison of lower stratosphere wind observations from the USTC's Rayleigh Doppler lidar and the ESA's satellite mission Aeolus, Earth Space Sci., 9, e2021EA002176, https://doi.org/10.1029/2021EA002176, 2022.
Chen, Z.-Y., Chu, Y.-H., and Su, C.-L.: Intercomparisons of Tropospheric Wind Velocities Measured by Multi-Frequency Wind Profilers and Rawinsonde, Atmosphere, 12, 1284, https://doi.org/10.3390/atmos12101284, 2021.
Dabas, A., Denneulin, M. L., Flamant, P., Loth, C., Garnier, A., and Dolfifi-Bouteyre, A.: Correcting winds measured with a Rayleigh Doppler lidar from pressure and temperature effects, Tellus A, 60, 206–21, 2008.
Dibbern, J., Monna, W., Nash, J., and Peters, G.: COST Action 76-final report. Development of VHF/UHF wind profilers and vertical sounders for use in European observing systems. European Commission, 350 pp., ISBN 92-894-4899-7, 2001.
Endlich, R. M., Wolf, D. E., Hall, D. J., and Brain, A. E.: Use of a pattern recognition technique for determining cloud motions from sequences of satellite photographs, J. Appl. Meteorol., 10, 105–117, 1971.
European Space Agency (ESA): “ADM-Aeolus Science Report”: ESA SP-1311, 121 p., http://esamultimedia.esa.int/docs/SP-1311_ADM-Aeolus_FINAL_low-res.pdf (last access: 8 December 2022), 2008.
European Space Agency (ESA): ESA Aeolus Online Dissemination System, ESA [data set], https://aeolus-ds.eo.esa.int/oads/access/collection, last access: 12 January 2023.
Gaiser, P. W., St Germain, K. M., Twarog, E. M., Poe, G. A., Purdy, W., Richardson, D., Grossman, W., Jones, W. L., Spencer, D., Golba, G., Cleveland, J., Choy, L., Bevilacqua, R. M., and Chang, P. S.: The WindSat spaceborne polarimetric microwave radiometer: sensor description and early orbit performance, IEEE T. Geosci. Remote Sens., 42, 2347–2361, 2004.
Guo, J., Miao, Y., Zhang, Y., Liu, H., Li, Z., Zhang, W., He, J., Lou, M., Yan, Y., Bian, L., and Zhai, P.: The climatology of planetary boundary layer height in China derived from radiosonde and reanalysis data, Atmos. Chem. Phys., 16, 13309–13319, https://doi.org/10.5194/acp-16-13309-2016, 2016.
Guo, J., Liu, B., Gong, W., Shi, L., Zhang, Y., Ma, Y., Zhang, J., Chen, T., Bai, K., Stoffelen, A., de Leeuw, G., and Xu, X.: Technical note: First comparison of wind observations from ESA's satellite mission Aeolus and ground-based radar wind profiler network of China, Atmos. Chem. Phys., 21, 2945–2958, https://doi.org/10.5194/acp-21-2945-2021, 2021a.
Guo, J., Zhang, J., Yang, K., Liao, H., Zhang, S., Huang, K., Lv, Y., Shao, J., Yu, T., Tong, B., Li, J., Su, T., Yim, S. H. L., Stoffelen, A., Zhai, P., and Xu, X.: Investigation of near-global daytime boundary layer height using high-resolution radiosondes: first results and comparison with ERA5, MERRA-2, JRA-55, and NCEP-2 reanalyses, Atmos. Chem. Phys., 21, 17079–17097, https://doi.org/10.5194/acp-21-17079-2021, 2021b.
King, G. P., Portabella, M., Lin, W., and Stoffelen, A.: Correlating extremes in wind and stress divergence with extremes in rain over the Tropical Atlantic, EUMETSAT Ocean and Sea Ice SAF Scientifific Report OSI_AVS_15_02, Version 1.0, http://www.osi-saf.org/?q&=_content/correlating (last access: 8 December 2022), 2017.
Lu, H.: Code for amt-2023-152, Zenodo [code], https://doi.org/10.5281/zenodo.10483770, 2024.
Lu, H., Xie, M., Liu, B., Liu, X., Feng, J., Yang, F., Zhao, X., You, T., Wu, Z., and Gao, Y.: Impact of atmospheric thermodynamic structures and aerosol radiation feedback on winter regional persistent heavy particulate pollution in the Sichuan-Chongqing region, China, Sci. Total Environ., 842, 156575, https://doi.org/10.1016/j.scitotenv.2022.156575, 2022a.
Lu, H., Xie, M., Liu, X., Liu, B., Liu, C., Zhao, X., Du, Q., Wu, Z., Gao, Y., and Xu, L.: Spatial-temporal characteristics of particulate matters and different formation mechanisms of four typical haze cases in a mountain city, Atmos. Environ., 269, 118868, https://doi.org/10.1016/j.atmosenv.2021.118868, 2022b.
Marseille, G. J., Stoffelen, A., and Barkmeijer, J.: Impact assessment of prospective spaceborne Doppler wind lidar observation scenarios, Tellus A, 60, 234–248, 2008.
Michelson, S. and Bao, J.-W.: Sensitivity of Low-Level Winds Simulated by the WRF Model in California's Central Valley to Uncertainties in the Large-Scale Forcing and Soil Initialization, J. Appl. Meteorol. Climatol., 47, 3131–3149, 2008.
Njoku, E., Christensen, E., and Cofield, R.: The Seasat scanning multichannel microwave radiometer (SMMR): antenna pattern corrections-Development and implementation, IEEE J. Ocean. Eng., 5, 125–137, 1980.
Qin, Z. K., Zou, X., Li, G., and Ma, X. L.: Quality control of surface station temperature data with non-Gaussian observation-minus-background distributions, J. Geophys. Res., 115, D16312, https://doi.org/10.1029/2009JD013695, 2010.
Reitebuch, O., Paffrath, U., and Leike, I.: ATBD: ADM-Aeolus Level 1B Product, European Space Research and Technology Centre, AE-RP-DLRL1B-001, issue 3.0, 62 pp., 2006.
Rennie, M. P.: An assessment of the expected quality of Aeolus Level-2B wind products, EPJ Web Conf., 176, 02015, https://doi.org/10.1051/epjconf/201817602015, 2018.
Sekuła, P., Bokwa, A., Bartyzel, J., Bochenek, B., Chmura, Ł., Gałkowski, M., and Zimnoch, M.: Measurement report: Effect of wind shear on PM10 concentration vertical structure in the urban boundary layer in a complex terrain, Atmos. Chem. Phys., 21, 12113–12139, https://doi.org/10.5194/acp-21-12113-2021, 2021.
Simonin, D., Ballard, S., and Li, Z.: Doppler radar radial wind assimilation using an hourly cycling 3D-Var with an 1.5 km resolution version of the Met Office Unified Model for Nowcasting, Q. J. Roy. Meteorol. Soc., 140, 2298–2314, https://doi.org/10.1002/qj.2298, 2014.
Stettner, D., Velden, C., Rabin, R., Wanzong, S., Daniels, J., and Bresky, W.: Development of enhanced vortex-scale atmospheric motion vectors for hurricane applications, Remote Sens., 11, 1981, https://doi.org/10.3390/rs11171981, 2019.
Sun, X., Zhou, Y., Zhao, T., Bai, Y., Huo, T., Leng, L., He, H., and Sun, J.: Effect of Vertical Wind Shear on PM2.5 Changes over a Receptor Region in Central China, Remote Sens., 14, 3333, https://doi.org/10.3390/rs14143333, 2022.
Tan, D., Rennie, M., Andersson, E., Poli, P., Dabas, A., de Kloe, J., Marseille, G.-J., and Stoffelen, A.: Aeolus Level-2B Algorithm Theoretical Basis Document, Tech. rep., AE-TN-ECMWFL2BP- 0023, v. 3.0, 109 pp., 2017.
Weber, B. L. and Wuertz, D. B.: Comparison of Rawinsonde and Wind Profiler Radar Measurements, J. Atmos. Ocean. Technol., 7, 157–174, 1990.
Weissmann, M. and Cardinali, C.: Impact of airborne Doppler lidar observations on ECMWF forecasts, Q. J. Roy. Meteorol. Soc., 133, 107–116, 2007.
Wernham, D., Ciapponi, A., Riede, W., Allenspacher, P., Era, F., D'Ottavi, A., and Thibault, D.: Verification for robustness to laser-induced damage for the Aladin instrument on the ADM-Aeolus satellite//Proceedings of SPIE 10014, Laser-Induced Damage in Optical Materials 2016, Boulder, SPIE: 1001408, 2016.
Witschas, B., Lemmerz, C., Geiß, A., Lux, O., Marksteiner, U., Rahm, S., Reitebuch, O., and Weiler, F.: First validation of Aeolus wind observations by airborne Doppler wind lidar measurements, Atmos. Meas. Tech., 13, 2381–2396, https://doi.org/10.5194/amt-13-2381-2020, 2020.
World Meteorological Organisation (WMO): Statement of Guidance Regarding How Well Satellite Capabilities Meet WMO User Requirements in Several Application Areas, WMO Satellite Reports SAT-26, WMO/TD No. 1052, 2001.
Yang, D. and Wang, P.: Characteristics of Vertical Distributions of Cloud Water Contents over China during Summer[J], Chinese J. Atmos. Sci., 36, 89–101, 2012.
Yu, R., Wang, B., and Zhou, T.: Climate Effects of the Deep Continental Stratus Clouds Generated by the Tibetan Plateau, J. Climate, 17, 2702–2713, 2004.
Zeng, Z., Mao, F., Wang, Z., Guo, J., Gui, K., An, J., Yim, S. H. L., Yang, Y., Zhang, B., and Jiang, H.: Preliminary evaluation of the atmospheric infrared sounder water vapor over China against high-resolution radiosonde measurements, J. Geophys. Res.-Atmos., 124, 3871–3888, https://doi.org/10.1029/2018JD029109, 2019.
Zhang, C. L., Sun, X. J., Zhang, R. W., Zhao, S. J., Lu, W., Liu, Y. W., and Fan, Z. Q.: Impact of solar background radiation on the accuracy of wind observations of spaceborne Doppler wind lidars based on their orbits and optical parameters, Opt. Express, 27, A936–A952, 2019.
Zhang, W., Guo, J., Miao, Y., Liu, H., Zhang, Y., Li, Z., and Zhai, P.: Planetary boundary layer height from CALIOP compared to radiosonde over China, Atmos. Chem. Phys., 16, 9951–9963, https://doi.org/10.5194/acp-16-9951-2016, 2016.
Zhang, X., Wan, Q., Xue, J., Ding, W., and Li, H.: Quality control of wind profile radar data and its application to assimilation, Acta Meteorol. Sin., 73, 159–176, 2015.
Zhang, X. Y., Wang, Y. Q., Niu, T., Zhang, X. C., Gong, S. L., Zhang, Y. M., and Sun, J. Y.: Atmospheric aerosol compositions in China: spatial/temporal variability, chemical signature, regional haze distribution and comparisons with global aerosols, Atmos. Chem. Phys., 12, 779–799, https://doi.org/10.5194/acp-12-779-2012, 2012.
Zhang, Y., Guo, J., Yang, Y., Wang, Y., and Yim, S. H. L.: Vertical wind shear modulates particulate matter pollutions: A perspective from Radar wind profiler observations in Beijing, China, Remote Sens., 12, 546, https://doi.org/10.3390/rs12030546, 2020.
Zuo, Q. M. S.: Research on Quality Control Methods and Assimilation Application of Wind Profiler Radar Data, Nanjing: Nanjing University of Information Science and Technology, 22 pp., https://doi.org/10.27248/d.cnki.gnjqc.2020.000073, 2020.