the Creative Commons Attribution 4.0 License.
the Creative Commons Attribution 4.0 License.
 | 08 Apr 2024
Comparing FY-2F/CTA products to ground-based manual total cloud cover observations in Xinjiang under complex underlying surfaces and different weather conditions
Shuai Li
Yonghang Chen
Zhili Wang
Xiangyu Li
Yuan Li
Yuanyuan Xue
Clouds are an important parameter of artificial water augmentation, which is of substantial significance to judge the precipitation capacity. Xinjiang is an arid region in northwestern China, where weather stations are sparsely distributed, the types of underlying surface are complex, and the climate between the southern and northern region varies greatly. However, the retrieval of the total cloud cover (TCC) from satellite in arid areas is a challenging task. Based on the TCC data observed by ground observation stations (GOSs) from June 2015 to May 2016 considering the complex underlying surfaces and different weather conditions, the precision, consistency, and error between the cloud total amount from the FengYun-2F stationary satellite (FY-2F/CTA) and manually observed TCC are compared and evaluated in the Xinjiang region. The findings of this study are as follows: (1) the precision rate (PR) of FY-2F/CTA in the Xinjiang region is 75.6 %, which gradually decreases from north to south, demonstrating a high false rate (FR) and a low missing rate (MR). The consistency rate (CR) is 51.5 %, with little difference among three subregions of Xinjiang, all showing a high weak rate (WR) and low strong rate (SR), which means that the TCC values inverted from FY-2 satellite data are generally lower than those observed by GOSs, especially in southern Xinjiang. The bias is −20 %, and all the error indexes (EIs) including bias, MAE, and RMSE increase from central to the north and south of Xinjiang; that means the EIs are the lowest in Tianshan and the highest in southern Xinjiang. FY-2F/CTA exhibits higher PR and CR in the underlying surface of vegetation compared to non-vegetation; that is to say that FY-2F/CTA performs best in the underlying surfaces of forest and plowland, while their performance is relatively poorer in the underlying surface of snow and ice. (2) With rising temperature the PR and CR of FY-2F/CTA increase, while the EIs decrease. Under various temperature conditions, FY-2F/CTA has always exhibited high MR, low FR (on the contrary in January), high WR, and low SR. From low elevation to high elevation, the PR and CR of FY-2F/CTA decrease, but the PR increases significantly when the altitude is higher than 2000 m. (3) Dust reduces the CR of FY-2F/CTA and increases their WR and MR but has a relatively minor impact on the identification of cloud and non-cloud. (4) Under different cloud cover levels, the PR and EIs of FY-2F/CTA are directly proportional to the amount of TCC, while the CR is inversely proportional to it: that is, the CR is higher and the PR and EIs are lower under clear-sky and partly cloudy conditions, and the CR is lower and the PR and EIs are higher under cloudy and overcast conditions. This study assessed the FY-2F/CTA under various conditions in arid areas of Xinjiang, including complex underlying surface, various temperature and altitude, dust effects, and different cloud cover levels. Thus, the research finding could serve as a valuable reference for satellite-based retrieval and applications related to TCC in arid regions.
- Article
(5993 KB) - Full-text XML
- BibTeX
- EndNote


Clouds are a crucial element of weather and climate characteristics; they affect atmospheric movement and the earth's climate through three mechanisms: radiative forcing (J. D. Li et al., 2019; Kiran et al., 2015; Haynes et al., 2013), latent heat forcing (Loeb et al., 2018), and convective forcing (Slingo and Slingo, 1988; Guo et al., 2015; Li et al., 2017). In addition, clouds can influence the climate system indirectly through interactions with aerosols (Boers et al., 2006; Zhou et al., 2020). The feedback effect of climate change can also directly lead to change in cloud characteristics simultaneously (Harrison et al., 1990; Errico et al., 2007; Chepfer et al., 2014). For every 1 °C increase in global temperature, the content of water vapor in the atmosphere will increase by about 7 % (Boucher et al., 2013), and the variation of water vapor can affect the occurrence, development, and extinction of clouds and change cloud cover, cloud albedo, and cloud microphysical properties (Zhang et al., 2022). The World Climate Research Programme (WCRP) lists understanding clouds, atmospheric circulation, and climate sensitivity as one of the key scientific challenges currently facing the climate community (Bony et al., 2015). As an important component of climate feedbacks, cloud feedbacks are one of the largest sources of uncertainty in simulating current climate and predicting future climate change (Bony et al., 2006; Zelinka et al., 2017). Cloud cover, as a significant cloud parameter, can directly or indirectly affect research on climate change, weather, or climate models by taking advantage of the cloud macro- and micro-parameters, radiation parameters, water vapor and precipitation, aerosols, and other physical quantities (Chen et al., 2000; Betts et al., 2014; Ceppi et al., 2017). An accurate understanding of the spatial distribution and temporal evolution of cloud cover is the basis for conducting research on atmospheric radiation, energy and water cycles, climate analysis, and numerical models. It is of great significance for gaining insight into the complex interactions between clouds and the terrestrial system and thus for better understanding climate change (Pavolonis and Key, 2003; Errico et al., 2007; Guo et al., 2015).
At present, conventional ground-based cloud cover observations, global reanalysis cloud products (NECP, ERA, etc.), and the total cloud cover (TCC) retrieved by satellite remote sensing (including ISCCP, MODIS, NOAA series, and CloudSat) are the most common cloud cover data. They are extensively applied in analysis of cloud parameters and climatological characteristics (Sun, 2003; Ding et al., 2004; Danso et al., 2019) as well as satellite inversion and validation (Yousef et al., 2020; Yang et al., 2020); in particular, the cloud parameters of satellite inversion are usually compared with those of cloud radar, lidar, spectral imagers, and ground observations (Kotarba, 2009; Wang and Zhao, 2017). A great deal of research has been carried out by experts in the field of inspection and evaluation of cloud products. Werkmeister et al. (2015) compared cloud fractional cover measured by radiometers on polar satellites (AVHRR) and on one geostationary satellite (SEVIRI) to ground-based manual SYNOP and automated observations by a cloud camera (the Hemispherical Sky Imager); they found generally good agreement between satellite-derived estimates and the Hemispherical Sky Imager with biases ranging from 2 % (AVHRR) to 8 % (SEVIRI) and standard deviations of 22 % (AVHRR) and 29 % (SEVIRI) for instantaneous results. They also found that SYNOP underestimated cloud fractional cover by 6±19 % compared to the Hemispherical Sky Imager and SEVIRI. Free et al. (2016) compared a homogeneity-adjusted dataset of TCC from weather stations in the contiguous United States with cloud cover in four global reanalysis products, including the Climate Forecast System Reanalysis from NCEP (CFSR), the Modern-Era Retrospective Analysis for Research and Applications from NASA (MERRA), ERA-Interim from ECMWF (ERA-Interim), and the Japanese 55-year Reanalysis Project from the Japan Meteorological Agency (JAR-55). The result showed that TCC from ERA-Interim and CFSR had the best correlation with weather stations, followed by JRA-55 and MERRA with the lowest correlation. Sun et al. (2015) concluded that average cloud cover in the United States from AVHRR Pathfinder Atmospheres Extended (PATMOS-x) with station observations, including 54 from the National Weather Service (NWS), Federal Aviation Administration (FAA) stations, and 101 military stations, showed the closest trend, followed by ISCCPs, with CLARA-A1 (AVHRR Data Edition 1) showing a larger negative trend. Wu et al. (2014) found that in the United States, Active Remote Sensing of Clouds (ARSCL) and the International Satellite Cloud Climatology Project (ISCCP) have higher cloudiness than surface observations. This was the same as the research results in China, where the ISCCPD2 total cloud cover products (TCCPs) were 8.46 % higher than the ground observations (Wang and Wang, 2009). The accuracy of ISCCP TCCPs in January is better than that of MODIS, while the MODIS TCCPs in July were slightly better than that of ISCCP (Liu et al., 2009): NOAA/AVHRR TCCPs could better reflect the variation characteristics of TCC in China. However, the amount of TCC was slightly lower than that observed in ground observations (Liu et al., 2016). In addition, many experts have done a lot of research on the development and validation of TCCPs from the FY-2 series satellite, and some research results indicate that in China, FY-2 satellite-observed cloud products were lower relative to ground-based manual observations and also slightly lower than the MODIS-calculated TCCPs, but the overall trend was comparable (Li et al., 2018; Liu et al., 2017; Han and Cong, 2015). However, the results of Xi et al. (2013) showed that TCCPs in East Asia retrieved by FY-2 and GMS were higher in magnitude than observed in ground-based observations north of 40° N. Few studies related to clouds in the Xinjiang region and only some scholars have analyzed the cloud characteristics of Xinjiang, Feng et al. (2014) analyzed the characteristics of different types of cloud heights in Xinjiang mountainous areas by using CloudSat data. Based on FY-2F data, S. Li et al. (2019) analyzed the distribution and difference of cloud cover in mountainous areas and basins of Xinjiang.
Xinjiang is a typical arid and semi-arid region, and the shortage of water resources has become a “bottleneck” problem in the development of the social economy and ecological construction in Xinjiang. It is a vast and sparsely populated area with extremely low spatial coverage of ground-based conventional observation stations, which is more suitable for satellite observation. How to use satellite observations to complement ground-based observation has become an urgent issue. The accuracy assessment of cloud cover retrieved by satellite is the basis of application and also a challenging task. In this paper, the examination and evaluation of the cloud total amount of the FengYun-2F stationary satellite (FY-2F/CTA) are carried out using ground-based manually observed TCC and considering complex underlying surface (subsurface types, temperature and altitude conditions) and different weather conditions (dust effects and different cloud cover levels) with Xinjiang as the examination region, with a view to providing valuable references for application and research related to FY-2 cloud products.
2.1 Research area
Xinjiang (Fig. 1) is located in the hinterland of Eurasia and is characterized by a typical temperate continental arid climate. It is a core component of the world's largest non-zonal arid zone (the Central Asian arid zone) and occupies an extremely important position in the Northern Hemisphere climate system, with average annual precipitation of only about 150 mm, which is representative of the global arid zone (Yao et al., 2018). With a complex topography of “three mountains sandwiched by two basins” and a unique landscape, mountains and basins account for 42.7 % and 57.3 % of the total area of the Xinjiang region, respectively. The annual average TCC in Xinjiang is 37.7 %, showing a pattern of “less in the east and more in the west, less in the south and more in the north, less on plains and in basins, and more in mountains” (S. Li et al., 2019).
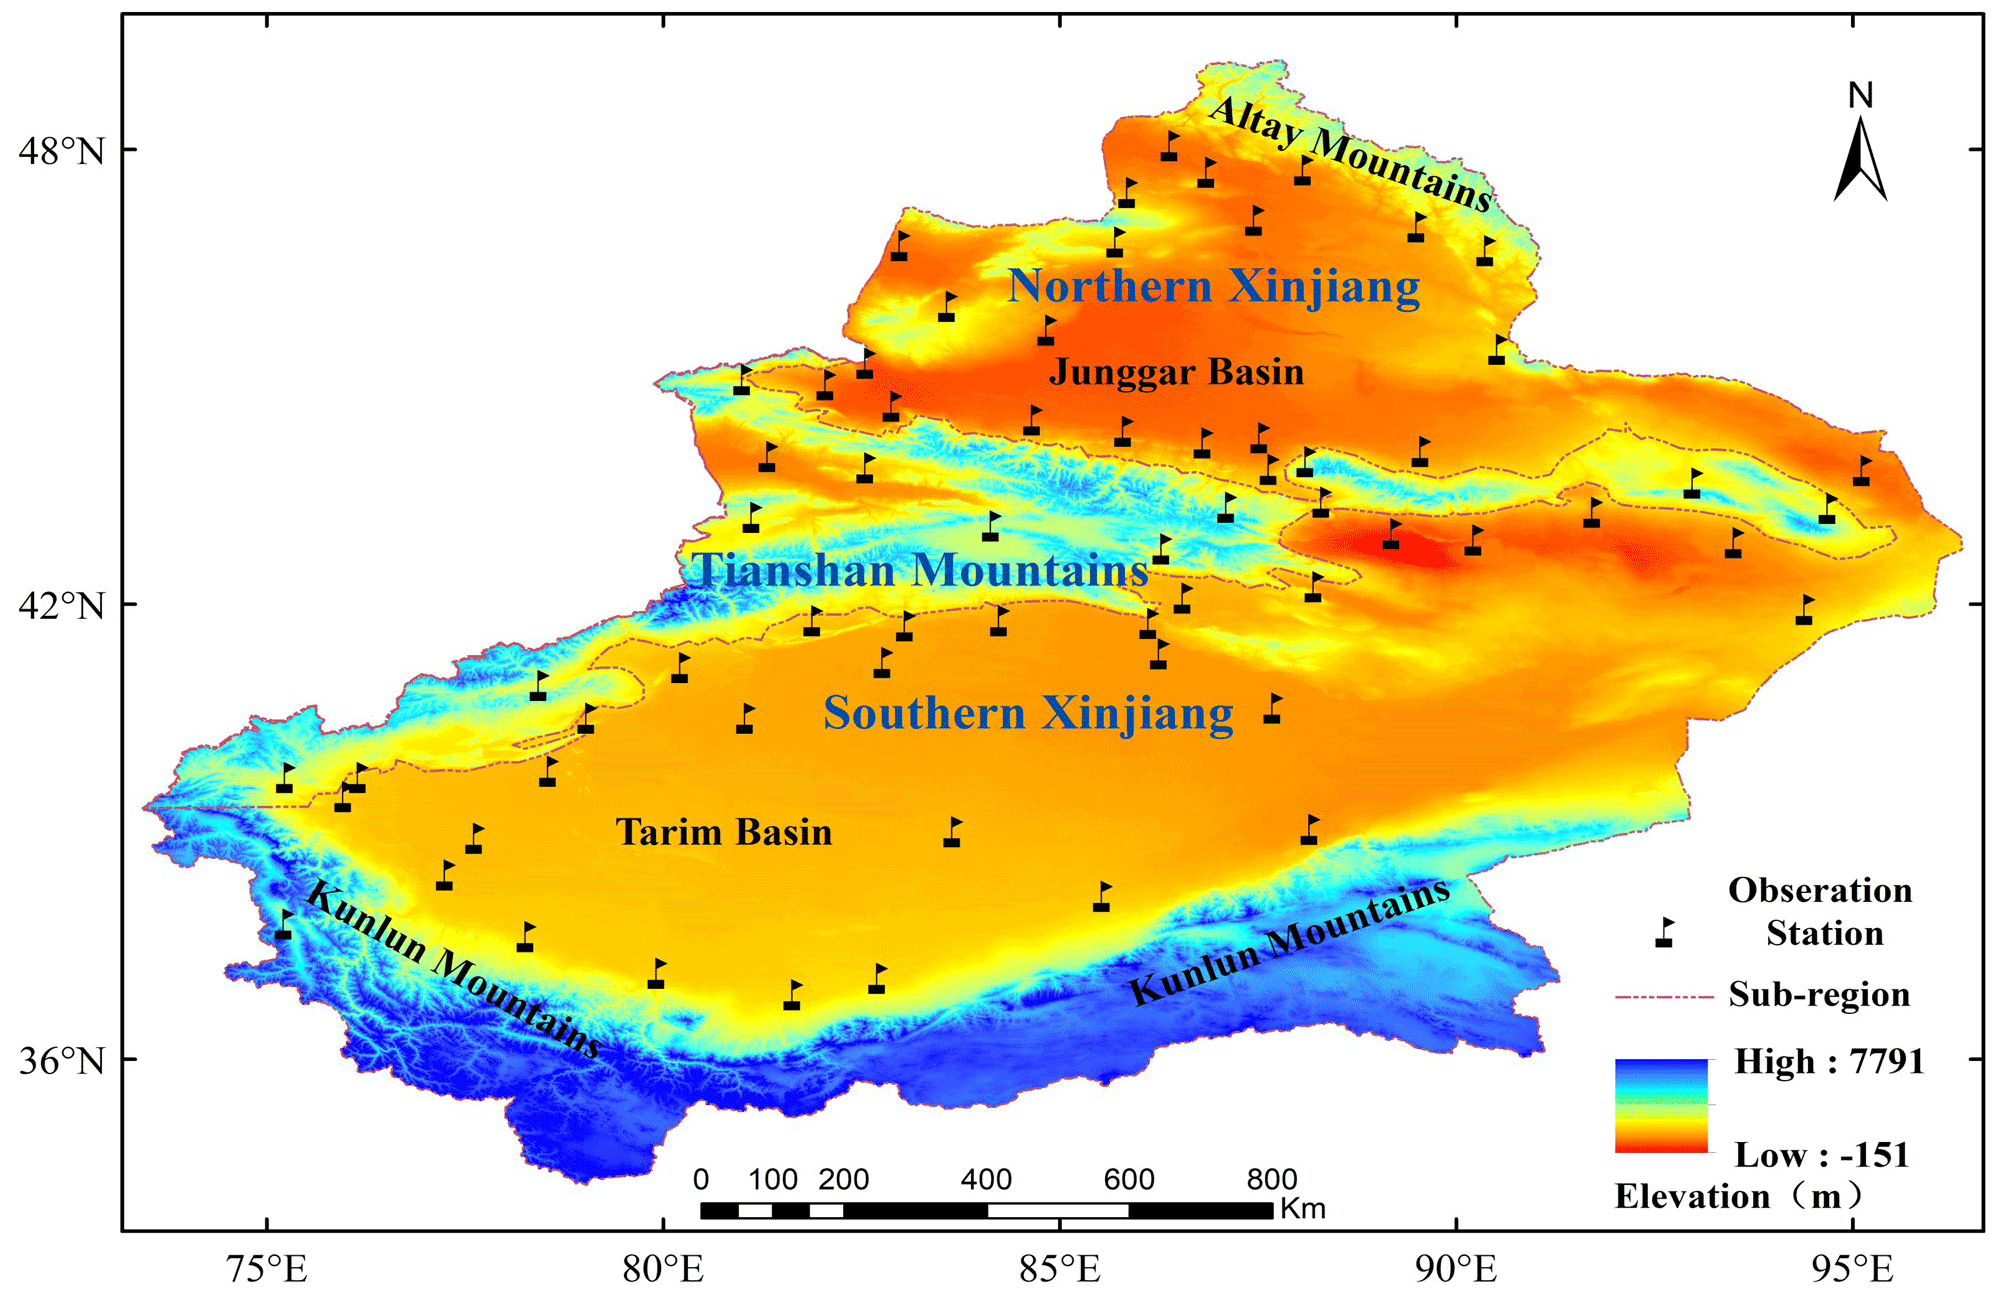
Figure 1Overview of the geographic location and topography of Xinjiang with three mountain ranges (Altai Mountains, Tianshan, and Kunlun Mountains) and two basins (Tarim Basin and Junggar Basin). The dashed red polygons indicate the three subregions (NX, SX, and Tianshan). Black flags represent the 66 TCC ground observation stations in the Xinjiang region.
2.2 Research data
The data used in this paper mainly include manually observed TCC by 66 ground observation stations (GOSs) in Xinjiang from 1 June 2015 to 30 May 2016 obtained from the information center of Xinjiang. Of these, 24 GOSs are distributed in northern Xinjiang (NX), 10 in Tianshan (mountains), and 32 in southern Xinjiang (SX). Manually observed TCC represents human-eye observations on the ground; they are collected five times a day (at 00:00, 03:00, 06:00, 09:00, and 12:00 UTC), with values ranging from 0 to 10. The observations follow the specifications outlined below: when the sky is entirely clear, the TCC is recorded as 0. If the sky is completely covered by clouds, it is recorded as 10. If the sky is fully covered by clouds but openings in the clouds allow glimpses of the sky, it is recorded as 10−. When there are a few clouds in the sky, amounting to less than 0.5 of the sky's coverage, the TCC is recorded as 0. When visibility is impaired due to phenomena such as haze, suspended dust, sandstorms, or blowing sand, rendering the determination of TCC either entirely or partially indiscernible, the TCC is recorded as “–”. If clouds occupy 110 of the sky, the TCC is recorded as 1; if they occupy 210 of the sky, it is recorded as 2, and so forth, following a similar progression for different levels of cloud coverage.
FY-2F/CTA customized data from the service network of the National Satellite Meteorological Center (http://satellite.nsmc.org.cn/portalsite/default.aspx, last access: last access: 10 February 2022) from 1 June 2015 to 30 May 2016, and the total number of data points is 8317. Among them, FengYun-2F (FY-2F) is the fourth geostationary satellite developed by China independently. It is equipped with various detection channels, including visible light (0.5–0.9 µm), mid-wave infrared (3.5–4.0 µm), thermal infrared (infrared channel 1 at 10.3–11.3 µm), infrared channel 2 (11.5–12.5 µm), and water vapor (6.3–7.6 µm). The satellite provides observational data every half-hour, allowing for improved monitoring of the entire process of cloud formation, development, and dissipation. The cloud products of FY-2F include cloud cover, cloud type, and cloud-top temperature, among others. FY-2F/CTA represents its TCC product; the spatial resolution is 0.1° × 0.1°, temporal resolution is 1 h, and the projection method is equal latitude and longitude projection. This configuration enables enhanced monitoring capabilities for the complete life cycle of clouds.
2.3 Research methods
FY-2F/CTA is calculated by Eq. (1): that is, firstly by calculating the radiation value of clear sky and full cloud for a certain pixel and secondly by using the radiation formula according to the actual radiation value of the pixel at a certain time (Liu et al., 2017):
where TCC is the total cloud cover, Iclr is the radiation value of full cloud pixels, Icld is the radiation value of clear-sky pixels, and I is the actual radiation value of the pixel at a certain time. This calculation method starts from the radiative transfer equation, takes into account the emissivity of the cloud, preserves the spatial resolution of the original observation image, and improves the sub-image problem in principle, but the TCC computed by satellite will appear to be low when compared with the TCC observed by GOSs.
The specific data processing methods are as follows. (1) To mitigate the impact of short-term weather changes on ground observations, reduce data fluctuations caused by observational errors, and enhance data stability, the stations with continuous observations for 20 d or more are selected to enhance data stability (Liu et al., 2016); the abnormal observations, including missing data and outliers (observations < 0 or > 10 or the records are “–”), are removed from the dataset during the preliminary quality control of the ground observation data. (2) The ground observation TCC reflects the cloud cover within a certain range around each observation point; the area can reach several kilometers or even more than 10 km. For satellite observation TCCPs, only the radiation ratio at grid points is considered. Therefore, for satellite products, the TCC at each station is determined by averaging the cloud amounts of all grid points within a 10 km radius centered on the station's location. (3) Using the observation time, latitude, and longitude information of the observation stations, the TCC values observed by the GOSs are matched with those observed by the satellite, and the total number of matched data points is 80 855.
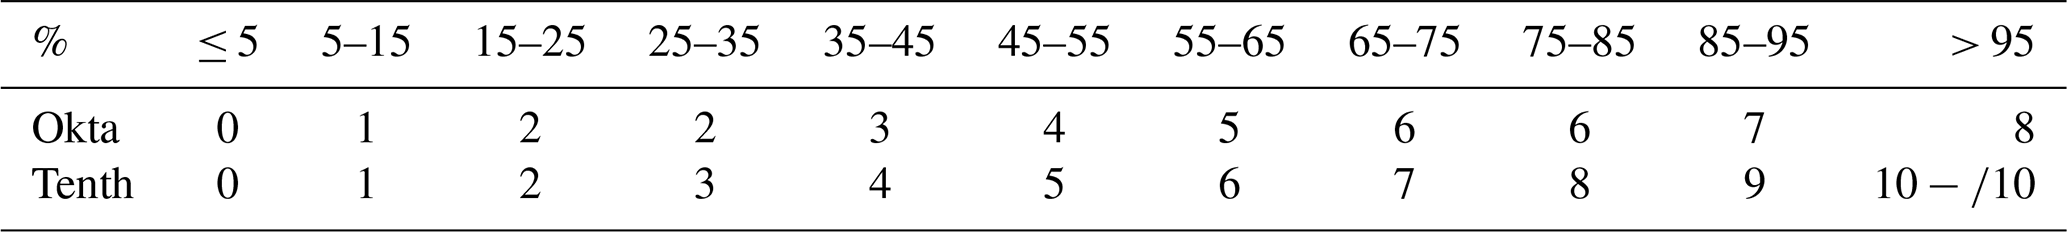
In addition, because FY-2F/CTA observations are provided as integer values from 0 % to 100 %, they are converted into tenths from 0 to 10, as listed in Table 1 (Kim et al., 2023).
Table 1Tenth cloud cover conversion table of satellite (%) and ceilometer (okta) cloud cover.
The matching principles are as follows. (1) When the observation of a ground station is under a clear sky and the satellite observation is also clear sky, it would be judged as an effective clear-sky detection point of satellite, which is recorded as Nn. (2) When the observation of a ground station is cloud and the satellite observation is also cloud, it would be deemed an effective cloud detection point of the satellite, which is recorded as Yy. (3) When the observation of a ground station is clear sky but the satellite detection result is cloud, it would be seen as satellite misjudgment and recorded as Ny. (4) When the observation of a ground station is cloud, but the satellite detection result is clear sky, then the effective cloud arithmetic average is performed on the points in a certain area around the point; if the result is still clear sky, then the satellite is judged to have missed the detection and this point is recorded as Yn.
The precision analysis of FY-2F/CTA includes precision rate (PR), false rate (FR), and missing rate (MR), which are calculated by Eqs. (2) to (4), respectively.
For the consistency analysis of FY-2F/CTA, if the absolute values of the difference between FY-2F/CTA and ground-based manual TCC observations are less than or equal to 2, they are considered to be correct; if the values of difference are greater than 2 or less than −2, they are considered to be stronger or weaker, respectively (Li et al., 2018). Then the consistency rate (CR), strong rate (SR), and weak rate (WR) can be expressed as Eqs. (5) to (7), respectively (Han and Cong, 2015).
Here, NRk represents the number of times that FY-2F/CTA is correct for a station during the test period, NSk means the number of times that FY-2F/CTA is stronger, and NWk means the number of times that FY-2F/CTA is weaker.
Using the ground-based manual TCC observations as true values, the error analysis between FY-2F/CTA and ground-based manual TCC observations includes bias, mean absolute error (MAE), and root mean square error (RMSE), which are calculated by Eqs. (8) to (10), respectively.
Here, N represents the number of matched samples, X represents the FY-2F/CTA observations, and X0 represents the ground-based manual TCC observations.
3.1 The difference between FY-2F/CTA products and manual observed TCC in complicated underlying surfaces of Xinjiang
3.1.1 Different underlying surface types
Due to the fragmentation of complex terrain, the climate in different regions of Xinjiang varies widely; therefore, this paper calculates and analyzes the precision, consistency, and error of FY-2F/CTA in NX, Tianshan, and SX (Fig. 2). It can be seen that the PR of FY-2F/CTA in the Xinjiang region is about 75.6 % and that in NX, Tianshan, and SX it is 79.5 %, 75.5 %, and 72.6 %, respectively, showing a decreasing trend from north to south. The FR is higher than the MR overall, with the highest FR in the Tianshan and the highest MR in SX. This conclusion is consistent with MODIS TCCPs, in contrast to the NOAA/AVHRR TCCPs. The study shows (Liu et al., 2017) that MODIS/Aqua TCCPs present high FR and low MR, mainly due to the 1.375 µm channel of MODIS, which is dedicated to detecting cirrus cloud in the upper atmosphere. In addition, several channels such as 6.715, 7.325, and 13.935 µm can be used to assist in the detection of cirrus cloud, reducing the MR of cirrus cloud detecting. However, the TCCPs calculated by NOAA/AVHRR show high MR, mainly due to the translucent characteristics of thin cirrus cloud, whose reflectance of visible channels and brightness temperature of infrared channels are not obvious. Of the five detection channels available to NOAA/AVHRR, although it is possible to detect thin cirrus cloud with the bright temperature difference of the infrared split window, the detection accuracy is not high.
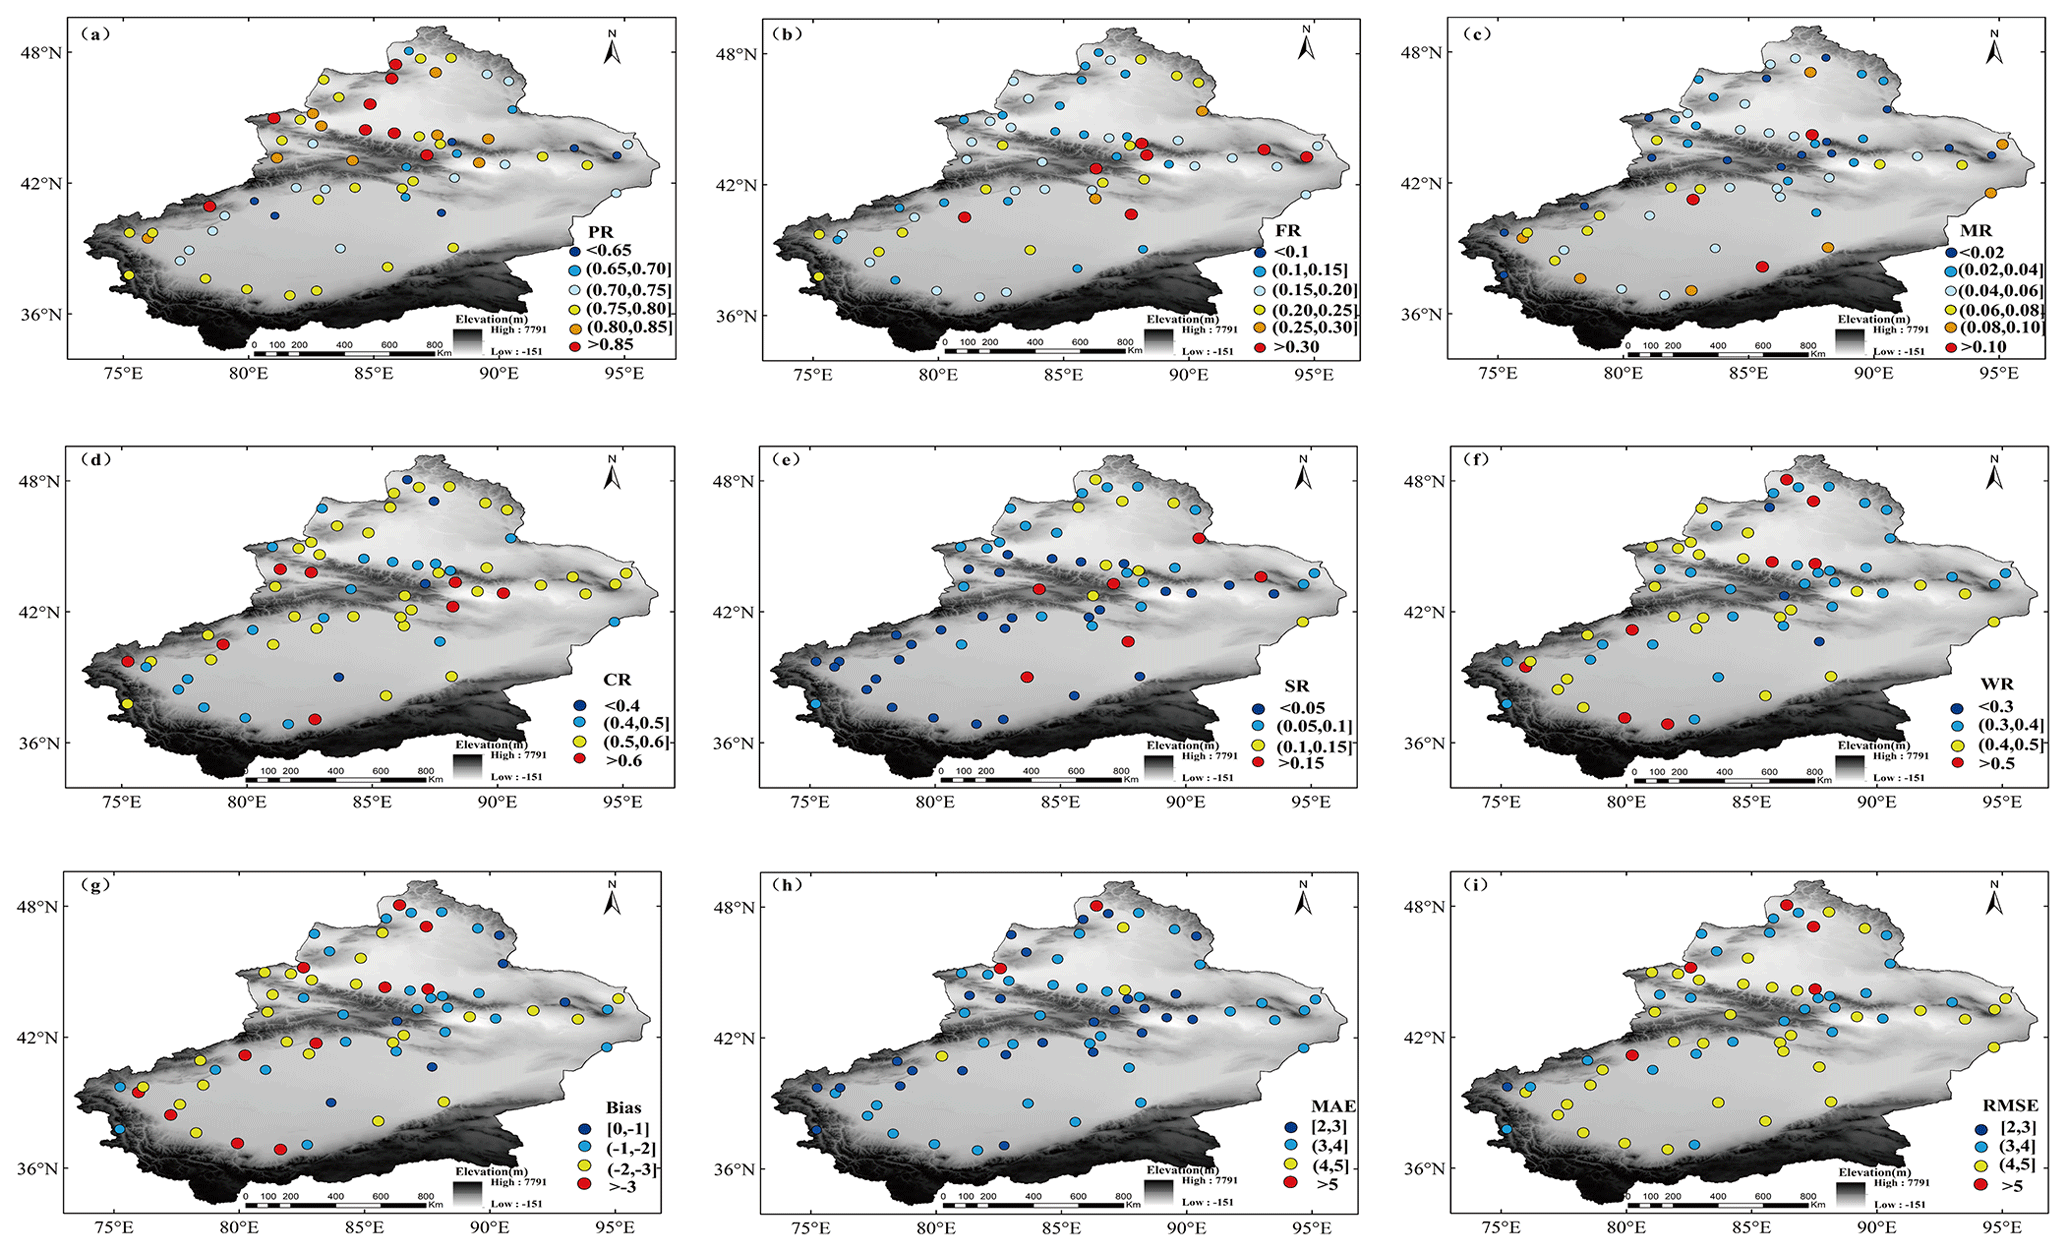
Figure 2The precision, consistency, and error spatial distribution map of FY-2F/CTA products in Xinjiang. Panels (a) to (i) show PR, FR, MR, CR, SR, WR, bias, MAE, and RMSE, respectively. The data are based on the hourly TCC of FY-2F/CTA and ground-based manual observations. The total number of all valid matches is 80 855; among them, 29 750 are distributed in NX, 10 884 are distributed in Tianshan, and 40 221 are distributed in SX.
The CR of FY-2F/CTA does not vary significantly among the three subregions of Xinjiang, remaining at about 51.5 %. The TCCPs observed by FY-2 satellite are lower than that observed by the GOSs on the whole: that is, FY-2F/CTA products show high WR and low SR; the WR is highest in SX, and the SR is highest in Tianshan. FY-2F/CTA products are calculated in a certain field of view by using the radiation value, which takes into account the emissivity of cloud and solves the problem of some sub-pixel cloud, but the effective cloud cover obtained from this calculation is relatively small. The ability of satellites to detect high cloud is better than that of low cloud. The main reason is that low cloud is closer to the ground and has less variability. The satellite cloud detection algorithm could easily misjudge low cloud as surface, which would underestimate the cloud coverage, while the Tarim Basin, which occupies most of SX, is dominated by stratocumulus (S. Li et al., 2019), so WR is much higher than SR in SX. This conclusion is the same as the NOAA/AVHRR TCCPs and contrary to the MODIS/Aqua TCCPs. Compared with the TCC observed by the GOSs, TCCPs calculated by NOAA/AVHRR are smaller, but TCCPs obtained by MODIS/Aqua are larger, and the TCCPs retrieved by FY-2 are lower than that retrieved by MODIS/Aqua. This may be due to the fact that NOAA/AVHRR TCCPs and FY-2/CAT use the same calculation method and that the resolution and channel information of the two satellites are close. Meanwhile, the differences in observational capabilities and cloud detection algorithms between MODIS/Aqua TCCPs and the two satellite TCCPs mentioned above are the main reasons for the deviations (Liu et al., 2016, 2017).
The errors of FY-2F/CTA in the three subregions of Xinjiang are high overall, and all the error indexes (EIs) including bias, MAE, and RMSE show an increasing trend from the central to the north and south of Xinjiang: that is, the EIs are the lowest in Tianshan, and the correlation coefficient between FY-2F/CTA and ground-based manual TCC observations is high at about 0.65. However, the EIs in NX and SX are high, and the correlation coefficients are slightly low, especially in NX, at only 0.52 (Fig. 3). This may be mainly due to the fact that satellite cloud observation observes from upper air downwards, and what is observed is mostly high cloud, while ground-based observation observes cloud from the ground upwards, and what is observed is mostly medium and low cloud. In addition, there is a certain subjectivity in ground-based manual cloud observation, and when the cloud in the sky cannot be identified or not fully identified due to snow, fog, sand, and other weather phenomena, this would affect the accuracy of cloud observation, making the difference between satellite observation and ground-based manual TCC observation larger. In this study, the reasons for the differences will be analyzed in detail in terms of complex subsurface types, various temperature and altitude conditions, dust effects, and different cloud levels.
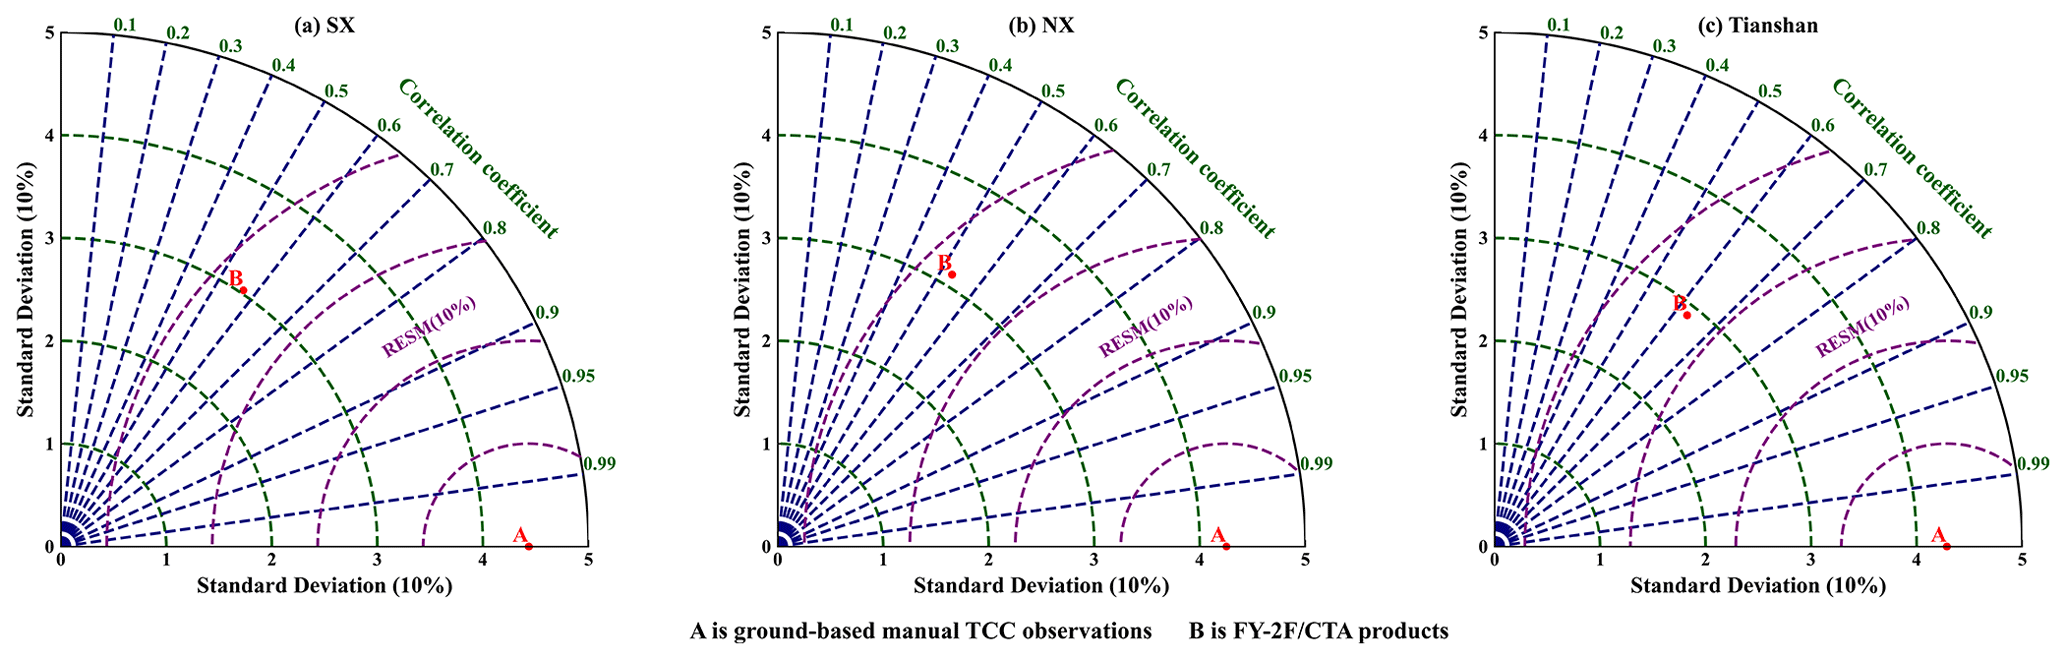
Figure 3Taylor diagrams between FY-2F/CTA products and ground-based manual TCC observations in different regions of Xinjiang.
Xinjiang is a vast territory with complex underlying surface types. In order to investigate the influence of diverse underlying surfaces on the difference between FY-2F/CTA and ground-based manual TCC observations, this study selects typical underlying surfaces in Xinjiang, including snow and ice, desert, and city in a non-vegetated region and grassland, forest, and plowland in a vegetated region, then compares and analyzes the precision, consistency, and error of FY-2F/CTA under complex underlying surfaces (Fig. 4). It can be seen that the PR, CR, and EIs of the vegetation region are better than those of the non-vegetation region, with the highest accuracy in the underlying surface of forest and plowland and the lowest accuracy in the underlying surface of snow and ice. The MR in the vegetation area is higher (grassland is the highest), and the FR in the non-vegetation area is higher (snow–ice is the highest). The WR is higher than the SR in all kinds of underlying surfaces, but the difference is not significant in the underlying surface of snow and ice. This is mainly due to the fact that the approximate distribution of albedo for different underlying surfaces ranges from 0.2–0.46 for desert, 0.15–0.25 for grassland, 0.1–0.2 for forest, 0.75–0.95 for snow (clean), and 0.25–0.75 for snow (wet and dirty). And according to the extracted temperature results of Kang et al. (2022) using MOD11C3, the annual mean values of land surface temperature (LST) for different underlying surfaces are 2.57 °C for grassland, 9.03 °C for forest, 10.27 °C for plowland, 11 °C for city, and −7.01 °C for snow and ice, respectively. In the process of FY-2 TCCP retrieval, the underlying surface of snow and ice exhibits a high reflectance and low surface temperature, and the minimal contrast between the two factors makes distinguishing between ice/snow and clouds challenging, particularly during nighttime and when visible light channel data are unavailable. Therefore, the PR of FY-2F/CTA in snow and ice underlying surface is low, and the FR is high. In contrast, the underlying surface of forest, which differs significantly from the underlying surface of ice and snow, tends to yield more effective cloud discrimination.
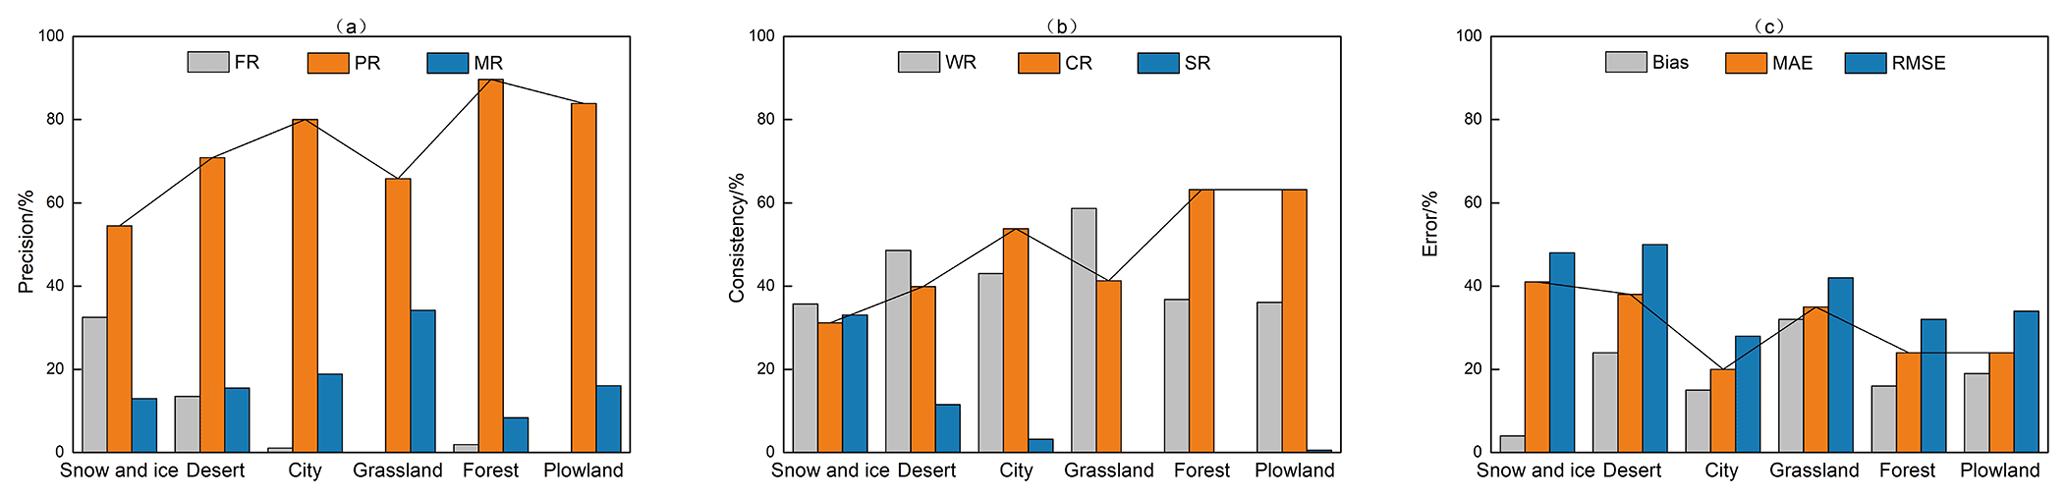
Figure 4The precision, consistency, and error of FY-2F/CTA products in complicated underlying surfaces of Xinjiang. In this case, the number of samples is 9196, 1650 of which are distributed with snow and ice underlying; 1596 have desert underlying, 992 have city underlying, 1653 have grassland underlying, 1653 have forest underlying, and 1652 have underlying plowland.
3.1.2 Under different temperature conditions
Xinjiang has a temperate continental climate and plateau mountain climate with average temperatures of −4.46 °C in January, 26.73 °C in April, 38.66 °C in July, and 19.52 °C in October. In this paper the precision, consistency, and error of FY-2F/CTA under different temperature conditions are analyzed by using January, April, July, and October to represent winter, spring, summer, and autumn, respectively. Figure 5 is the scattered point of the FY-2F/CTA and ground-based manual TCC observations in the Xinjiang region. It can be seen that the amount of TCC inverted from FY-2 satellite data is generally lower than that observed by GOSs, with the greatest degree of underestimation in April; the correlation between the two is the best in July and October and is the worst in January, and all of them pass the significance test of 0.01 except for January. This is basically consistent with the test results of the northern China and Huanghuai regions carried out by Han and Cong (2015): that is, the correlation coefficient between FY-2/CTA and ground-based manual TCC observation is the largest in May at 0.92 and the smallest in January at 0.56.
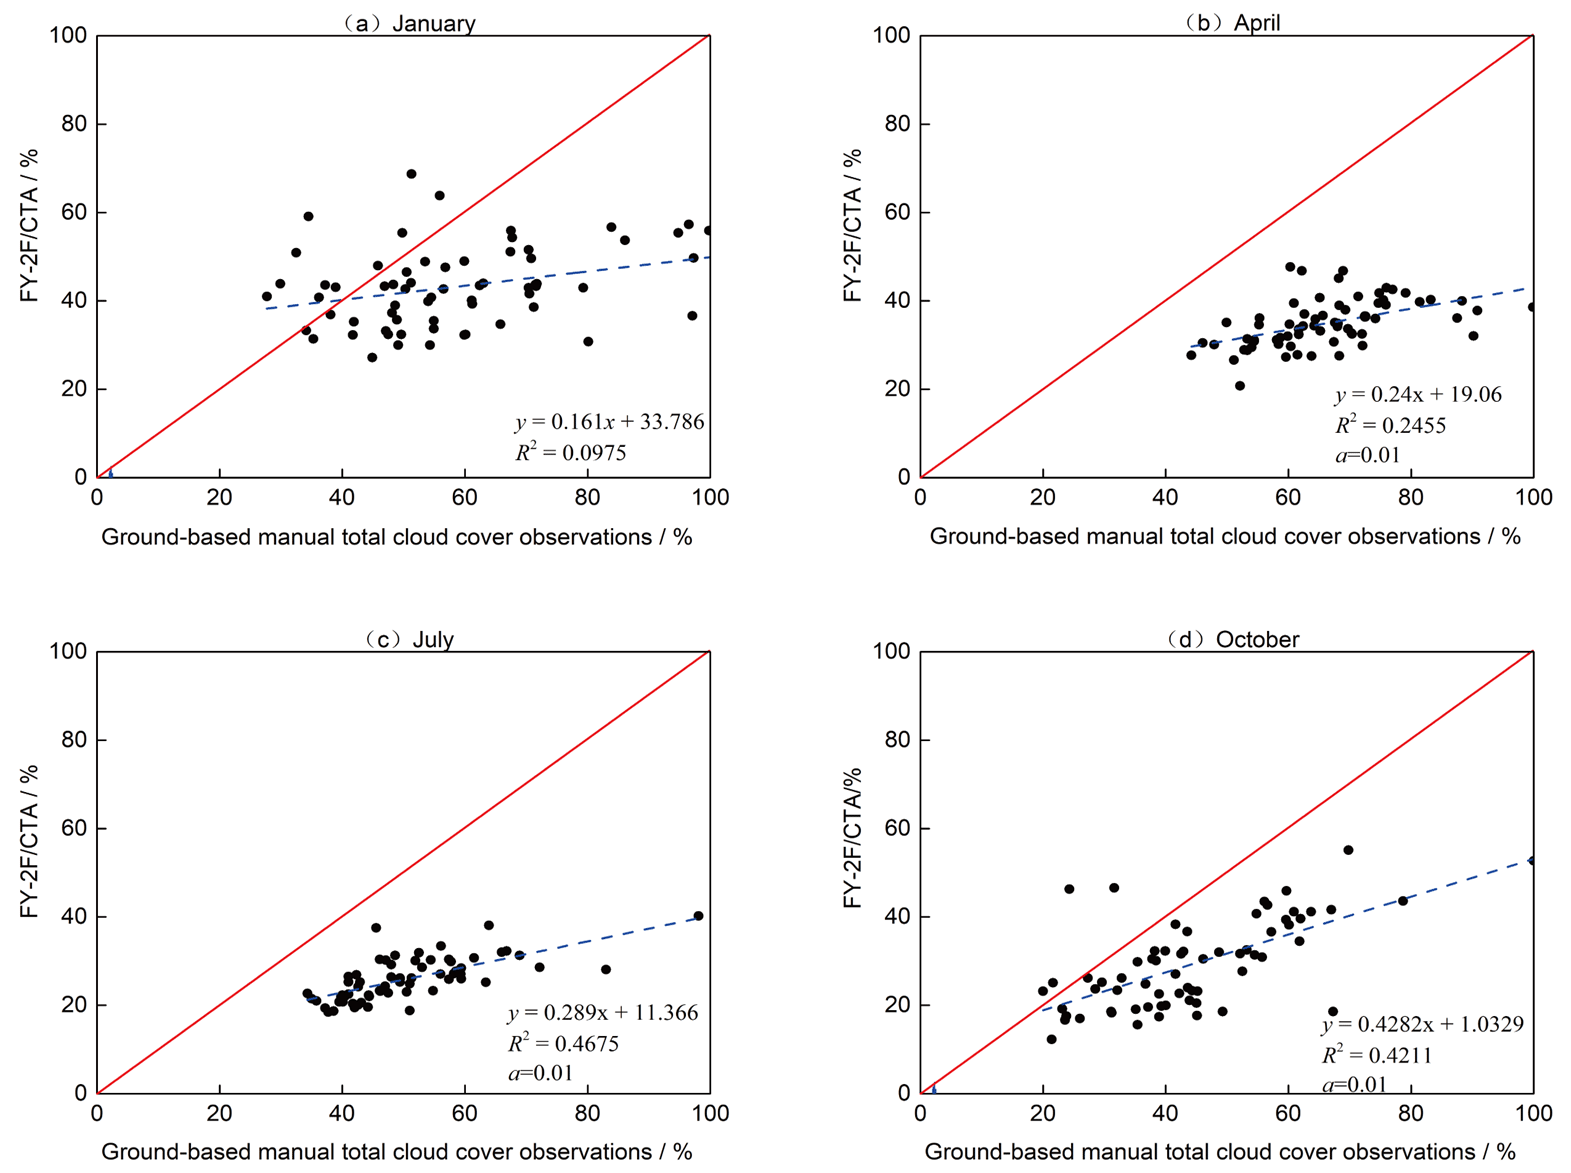
Figure 5The scatter plot of FY-2F/CTA compared to ground-based manual TCC observations in Xinjiang. The data are the monthly average TCC of FY-2F/CTA and ground-based manual observations. It is based on the hourly data from FY-2F/CTA and GOSs in (a) January, (b) April, (c) July, and (d) October (the total sample points of 66 GOSs are 7634, 7235, 7592, and 7554, respectively), and after summing and average calculation, the monthly average TCC of FY-2F/CTA and ground-based manual observations of stations is obtained. Therefore, in this figure, the total number of all valid matches is 264; among them, 66 are in January, 66 are in April, 66 are in July, and 66 are in October.
Figure 6 shows a box plot of the precision, consistency, and error of FY-2F/CTA under different temperatures, and it can be seen that the PR of FY-2F/CTA in the Xinjiang region increases with increases in temperature. For instance, in July, it reaches around 76 %, whereas in January, it is lower at 66 %. the PR tends to decrease from the central region towards the northern and southern regions; when temperature is above 0 °C, it exhibits a high MR and a low FR. Conversely, when temperature drops below 0 °C, the pattern is reversed: that is, there is a high FR and a low MR in January. The CR is higher in July and October (52 % and 67 %, respectively) than that in January and April (50 % and 45 %, respectively), and it decreases from the central to the north and south of Xinjiang in April and increases from the north to the south of Xinjiang in July. Under various temperature conditions, it shows a high WR and a low SR. The EIs are high in January and low in July, which increase from the central to the north and south of Xinjiang: that is, the EIs are the lowest in Tianshan and highest in SX, and they are high in January in the three subregions of Xinjiang. This is mainly caused by the fact that at higher temperature, the larger the temperature differences are between the underlying surface and cloud top, the better the satellite discrimination there would be. Additionally, in January, the region north of Tianshan and some mountainous areas in SX are covered with snow; therefore, the PR of FY-2F/CTA in Xinjiang in January is low and its EIs are large, possibly due to the misjudgment of cloud and snow.
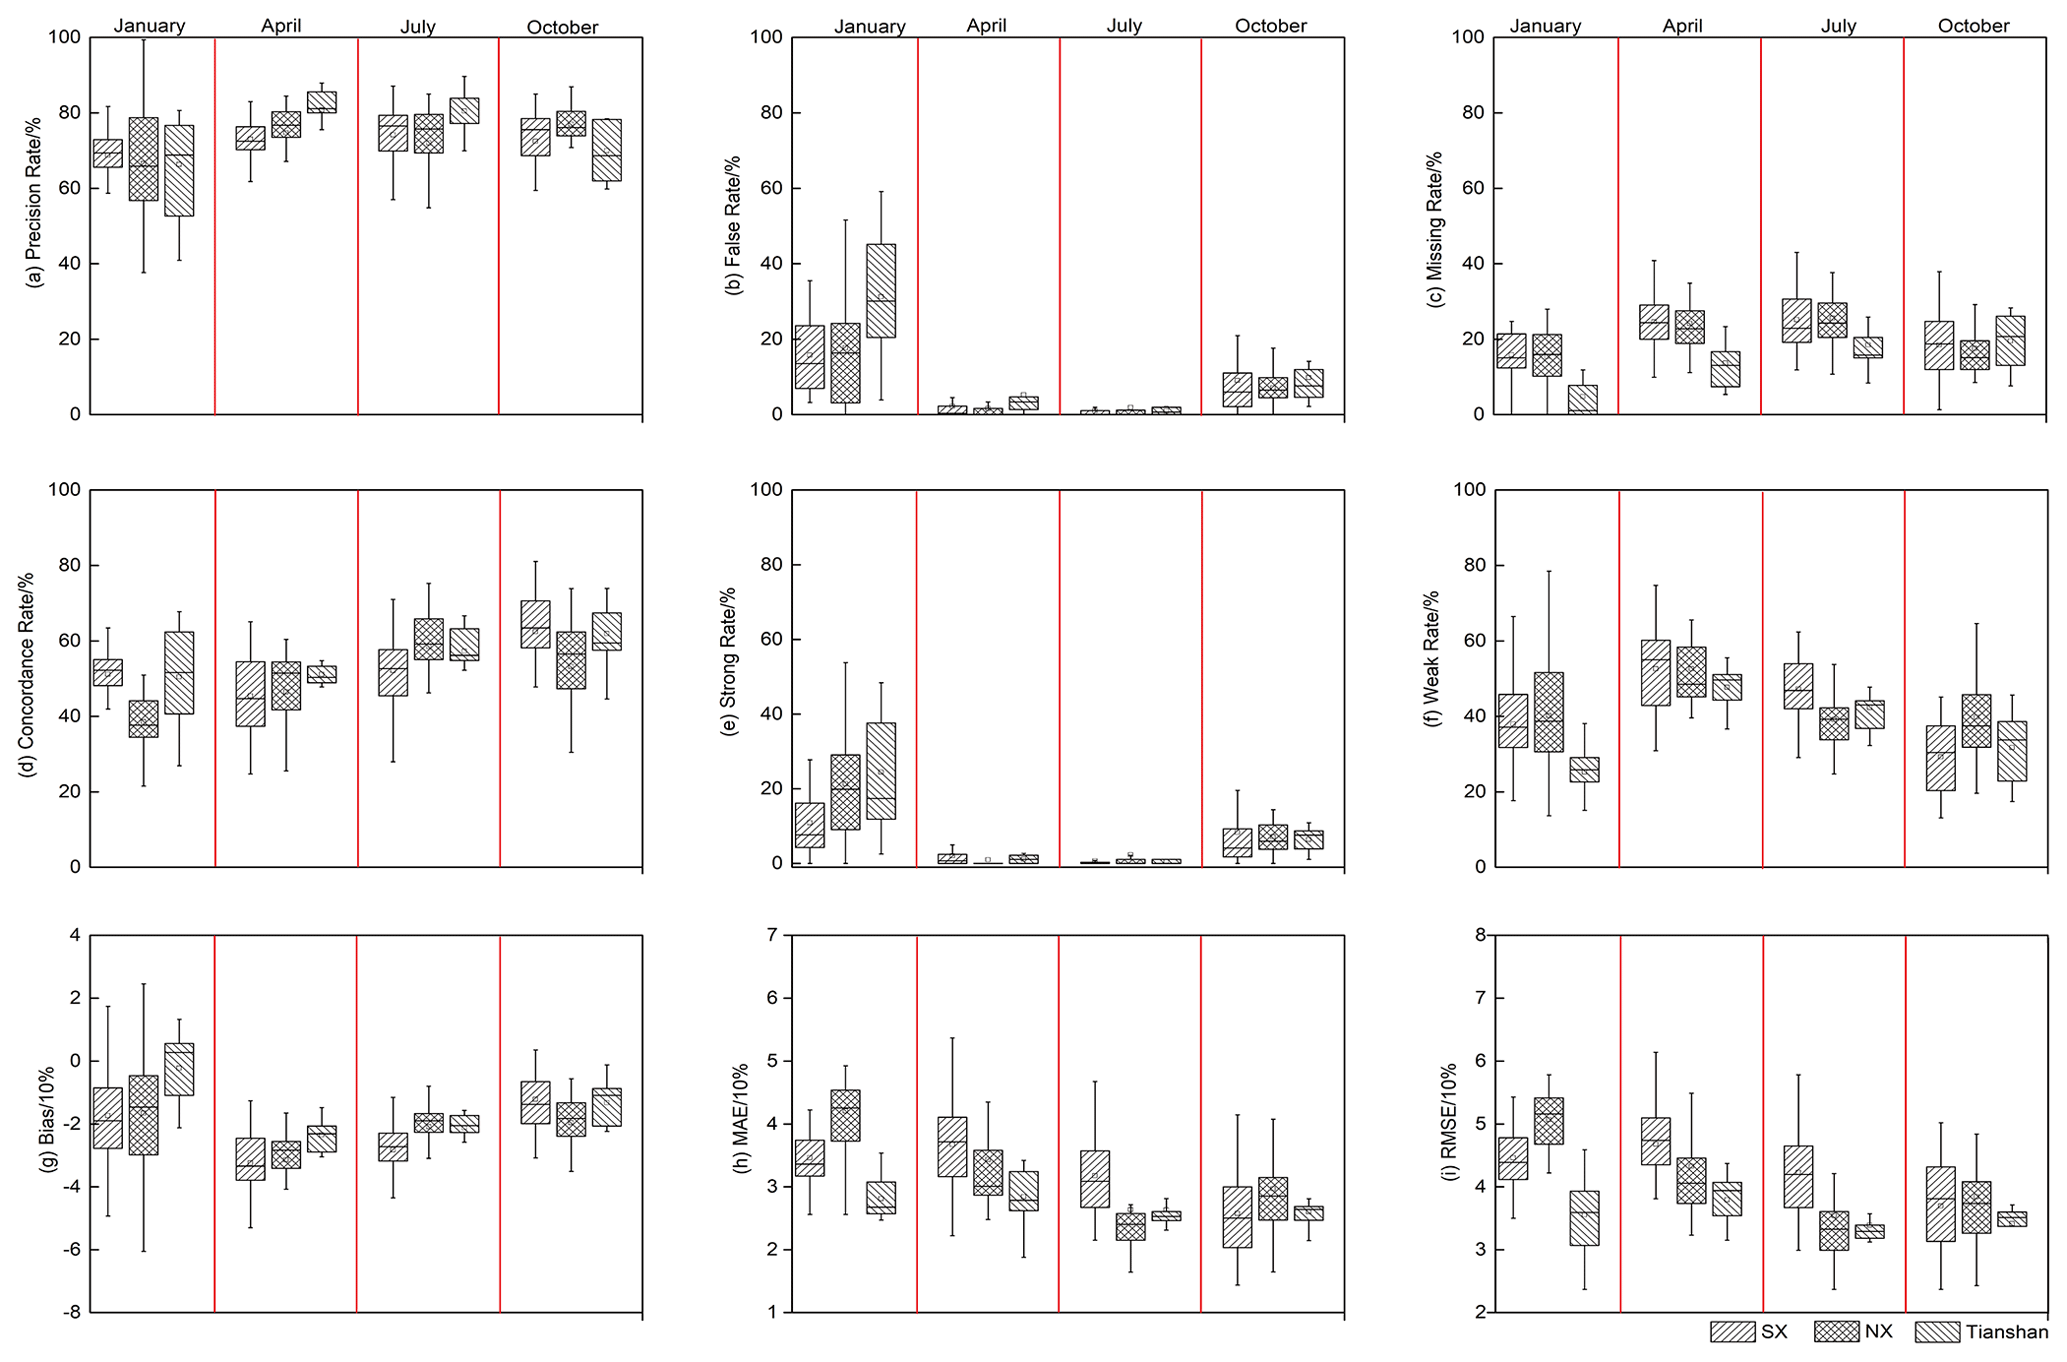
Figure 6The precision, consistency, and error box plot of FY-2F/CTA products in different temperature conditions of Xinjiang.
3.1.3 Under different altitude conditions
Altitude affects the LST; for every 100 m increase in altitude, the LST would drop by approximately 0.52 °C. When the temperature difference between the cloud top and underlying surface in clear sky is very small, it is difficult to distinguish between the cloud pixels and the non-cloud pixels, which could affect the cloud recognition. The altitude of Xinjiang is divided into four levels: less than 1000 m (31 GOSs are distributed), 1000–1500 m (22 GOSs are distributed), 1500–2000 m (8 GOSs are distributed), and greater than 2000 m (5 GOSs are distributed) in this paper. Figure 7 shows the precision, consistency, and error of FY-2F/CTA products at different altitudes in Xinjiang. It is observed that with the increase in altitude, the PR and CR of FY-2F/CTA present a slightly decreasing trend (kPR, the slope of first-order linear regression of PR and altitude, is −3.95; , the coefficient of determination of PR and altitude, is 0.932 except for altitude greater than 2000 m – kCR is −2.12; is 0.544), but the PR increases significantly when the altitude is greater than 2000 m. The reason for this may be mainly due to the fact that in mountainous areas with higher altitude, the cloud cover is high, and the cloud pattern mainly consists of altostratus or nimbostratus as well as cirrostratus; the cloud layer is thicker, so it is more accurate to identify the cloud and non-cloud but less effective in discerning the amount of TCC.
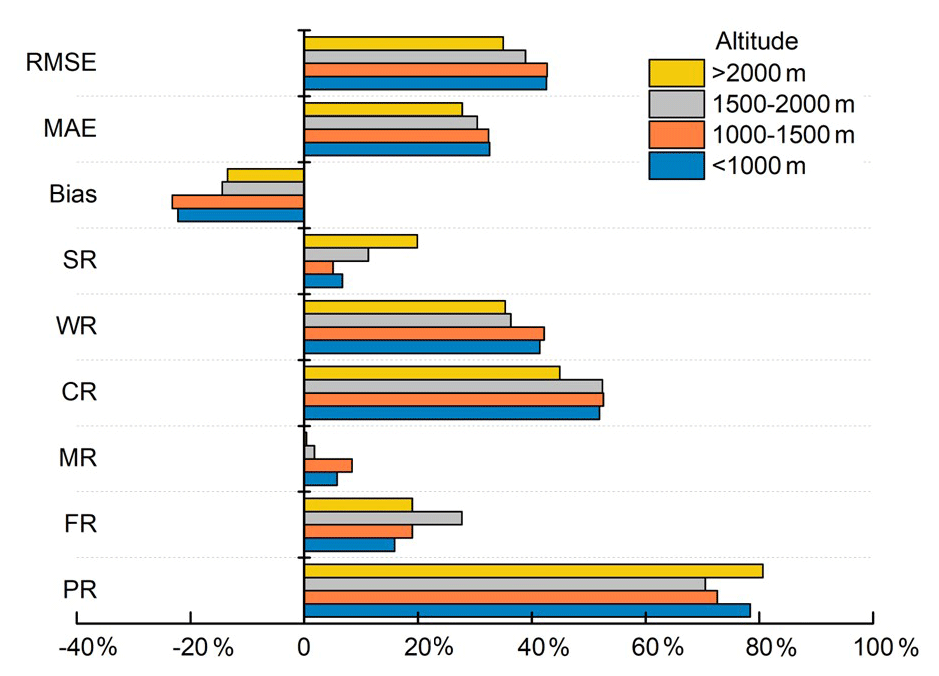
Figure 7The precision, consistency, and error of FY-2F/CTA products in different altitude conditions of Xinjiang. Among them, the number of samples is 37 939 for altitude less than 1000 m, 27 080 for altitude between 1000 and 1500 m, 11 232 for altitudes between 1500 and 2000 m, and 4604 for altitudes greater than 2000 m.
3.2 The difference between FY-2F/CTA products and manual observed TCC in dust- and non-dust-affected periods in Xinjiang
As the seasons change, the types of underlying surface also change in most areas of Xinjiang, from vegetation in spring and summer to bare land in autumn and snow in winter. Studies have shown that dusty weather occurs frequently in the Taklimakan Desert (Fig. 9b), mainly in spring and summer, accounting for 88.3 % of the total number of dusty events, with winter being the season with the fewest dusty weather occurs throughout the year, accounting for only 2.3 % of the total (Zhou et al., 2017). In addition, the EOS/MODIS satellite remote sensing snow cover thematic map of Xinjiang in January (Fig. 9a) shows that there is no stable snow cover in the Taklimakan Desert in January, and the underlying surface changes little in the four seasons. In order to reduce the influence of underlying surface changes, only the influence of dust on cloud identification is considered; therefore, the precision, consistency, and error of FY-2F/CTA are analyzed by selecting January as the non-dust period and April as the dust period in Tazhong and Qiemo (Fig. 8). It shows that dust can reduce the CR of FY-2F/CTA discrimination by about 15 %, but it has little effect on the PR, and the MR and WR in dust period are higher than those in non-dust period. The FR and SR in the dust period are lower than those in non-dust period. This might be caused by the fact that the dust period is mainly dominated by low cloud, and the detection ability of satellites for low cloud is worse than that of high cloud, so the MR and WR during the dust period are much higher than those during the non-dust period. And beyond that, dust storms are often accompanied by precipitation, so the dusty weather has little effect on the identification of cloud and non-cloud; however, dusty weather has a greater effect on the recognition of cloud coverage due to uncertain sky conditions and poor visibility.
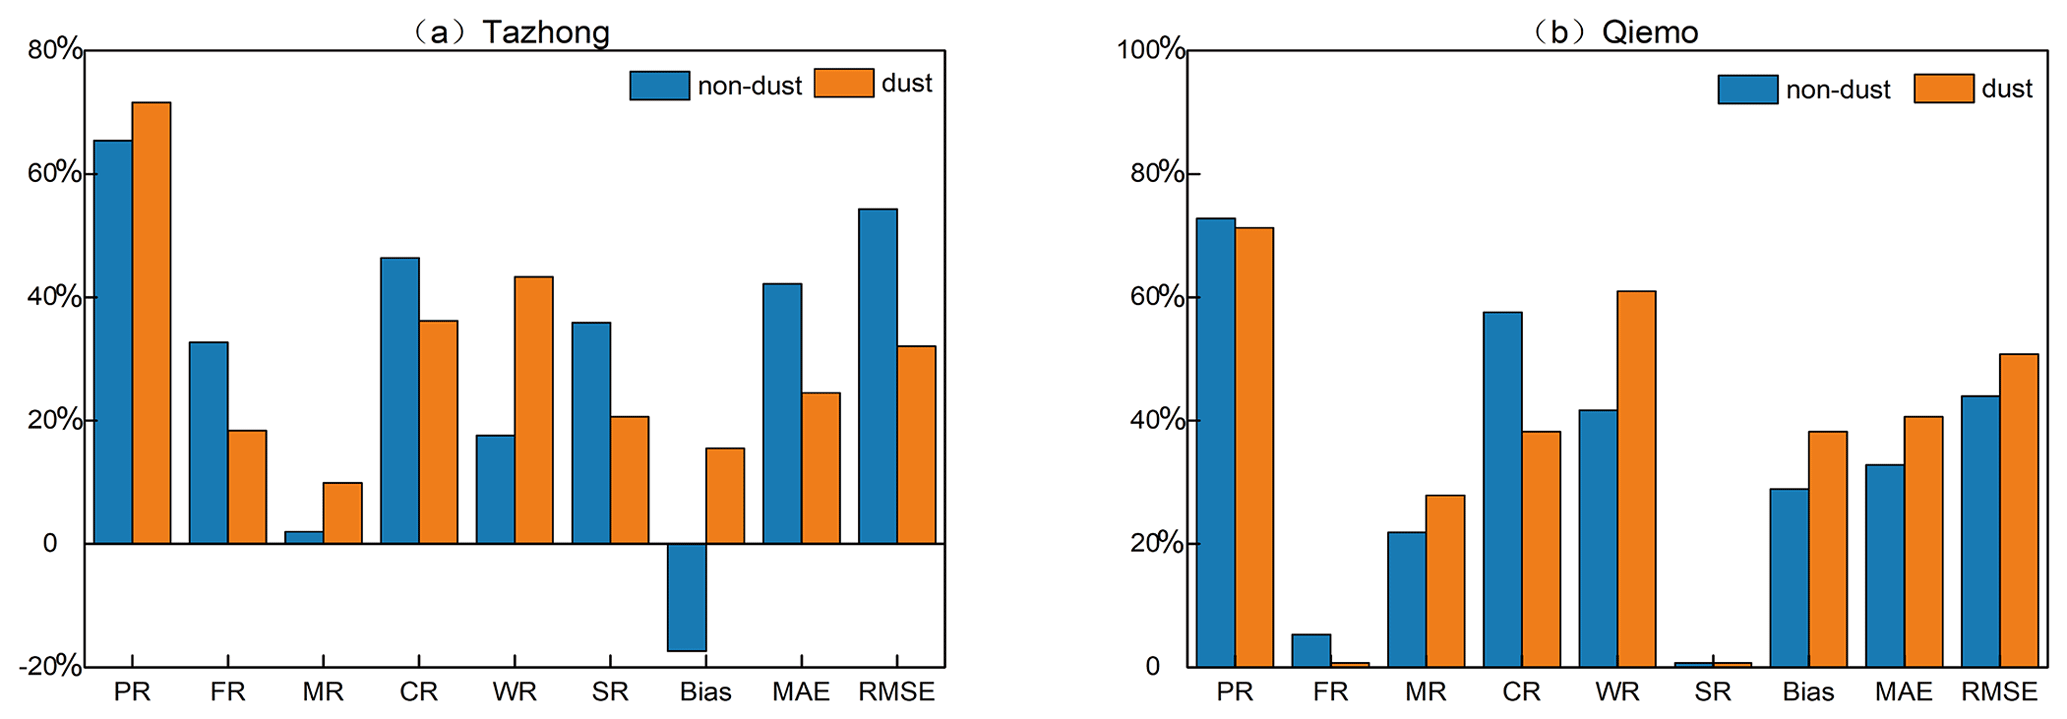
Figure 8The precision, consistency, and error box plot of FY-2F/CTA products in dust- and non-dust-affected periods of Xinjiang. In this case, the number of samples is 153 in Tazhong and 151 in Qiemo.
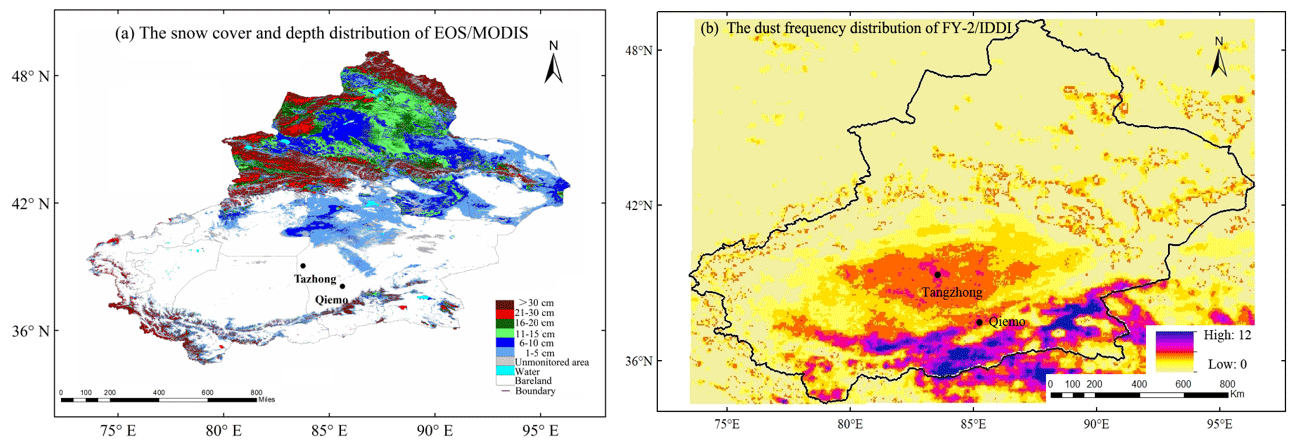
Figure 9Distribution of snow cover (in January 2016) and dust frequency (in April 2016) in Xinjiang. (a) The snow cover and depth distribution of EOS/MODIS and (b) the dust frequency distribution of the FY-2 infrared difference dust index (FY-2/IDDI).
3.3 The difference between FY-2F/CTA products and manual observed TCC under various cloud cover levels of Xinjiang
Referring to the definition of cloud cover levels in weather forecast and the classification of cloud cover level by Han and Cong (2015), taking the ground-based manual TCC observation as the standard, the amount of TCC ranging from 0 %–10 % is defined as clear sky, 20 %–30 % as partly cloudy, 40 %–70 % as cloudy, and 80 %–100 % as overcast. Figure 10 shows the precision, consistency, and error of FY-2F/CTA under different cloud cover levels of Xinjiang. It can be seen that, in general, the PR of FY-2/CTA in the Xinjiang region is directly proportional to the amount of TCC, with 97.2 %, 92.0 %, 85.9 %, and 31.8 % for overcast > cloudy > partly cloudy > clear sky, respectively: that is, the higher the amount of TCC, the better the PR of FY-2F/CTA identification overall. Under different cloud cover levels, the MR is high and FR is low (except clear sky). The FR decreases with the increase in the amount of TCC, and it is the highest in clear sky, up to 64.9 %; it is zero in all other weather conditions. The MR is the lowest in partly cloudy and the highest in cloudy conditions: partly cloudy > cloudy > clear sky > overcast, which are 14.1 %, 8.0 %, 3.3 %, and 2.9 %, respectively. The CR is inversely proportional to the amount of TCC: for partly cloudy > clear sky > overcast > cloudy, the CRs are 82.2 %, 76.6 %, 34.1 %, and 30.3 %, respectively. The higher the amount of TCC, the lower the CR of FY-2F/CTA identification overall. Under different cloud cover levels, WR is high and SR is low. The SR decreases with the increase in the amount of TCC; that means that for clear sky > partly cloudy > cloudy > overcast, the SRs are 23.4 %, 11.0 %, 3.9 %, and 0.4 %, respectively. On the contrary, the WR increases with the increase in the amount of TCC: that is, for cloudy day > overcast > partly cloudy > clear sky, the WRs are 65.8 %, 65.5 %, 6.7 %, and 0.01 %, respectively. The EIs are also proportional to the amount of TCC. Under clear-sky conditions, the precision of FY-2/CTA increases from the central to the north and south: that is, the PR and CR are the highest, and the EIs are the lowest in SX. Under partly cloudy, cloudy, and overcast conditions, the precision of FY-2/CTA decreases from the central to the south: that is, the PR and CR are the highest, and the EIs are the lowest in Tianshan. In the Xinjiang region, the CRs of FY-2F/CTA under clear-sky and partly cloudy conditions are higher than the average value of 63 % in China (Li et al., 2018) and of about 60 % in the northern China and Huanghuai region (Han and Cong, 2015).
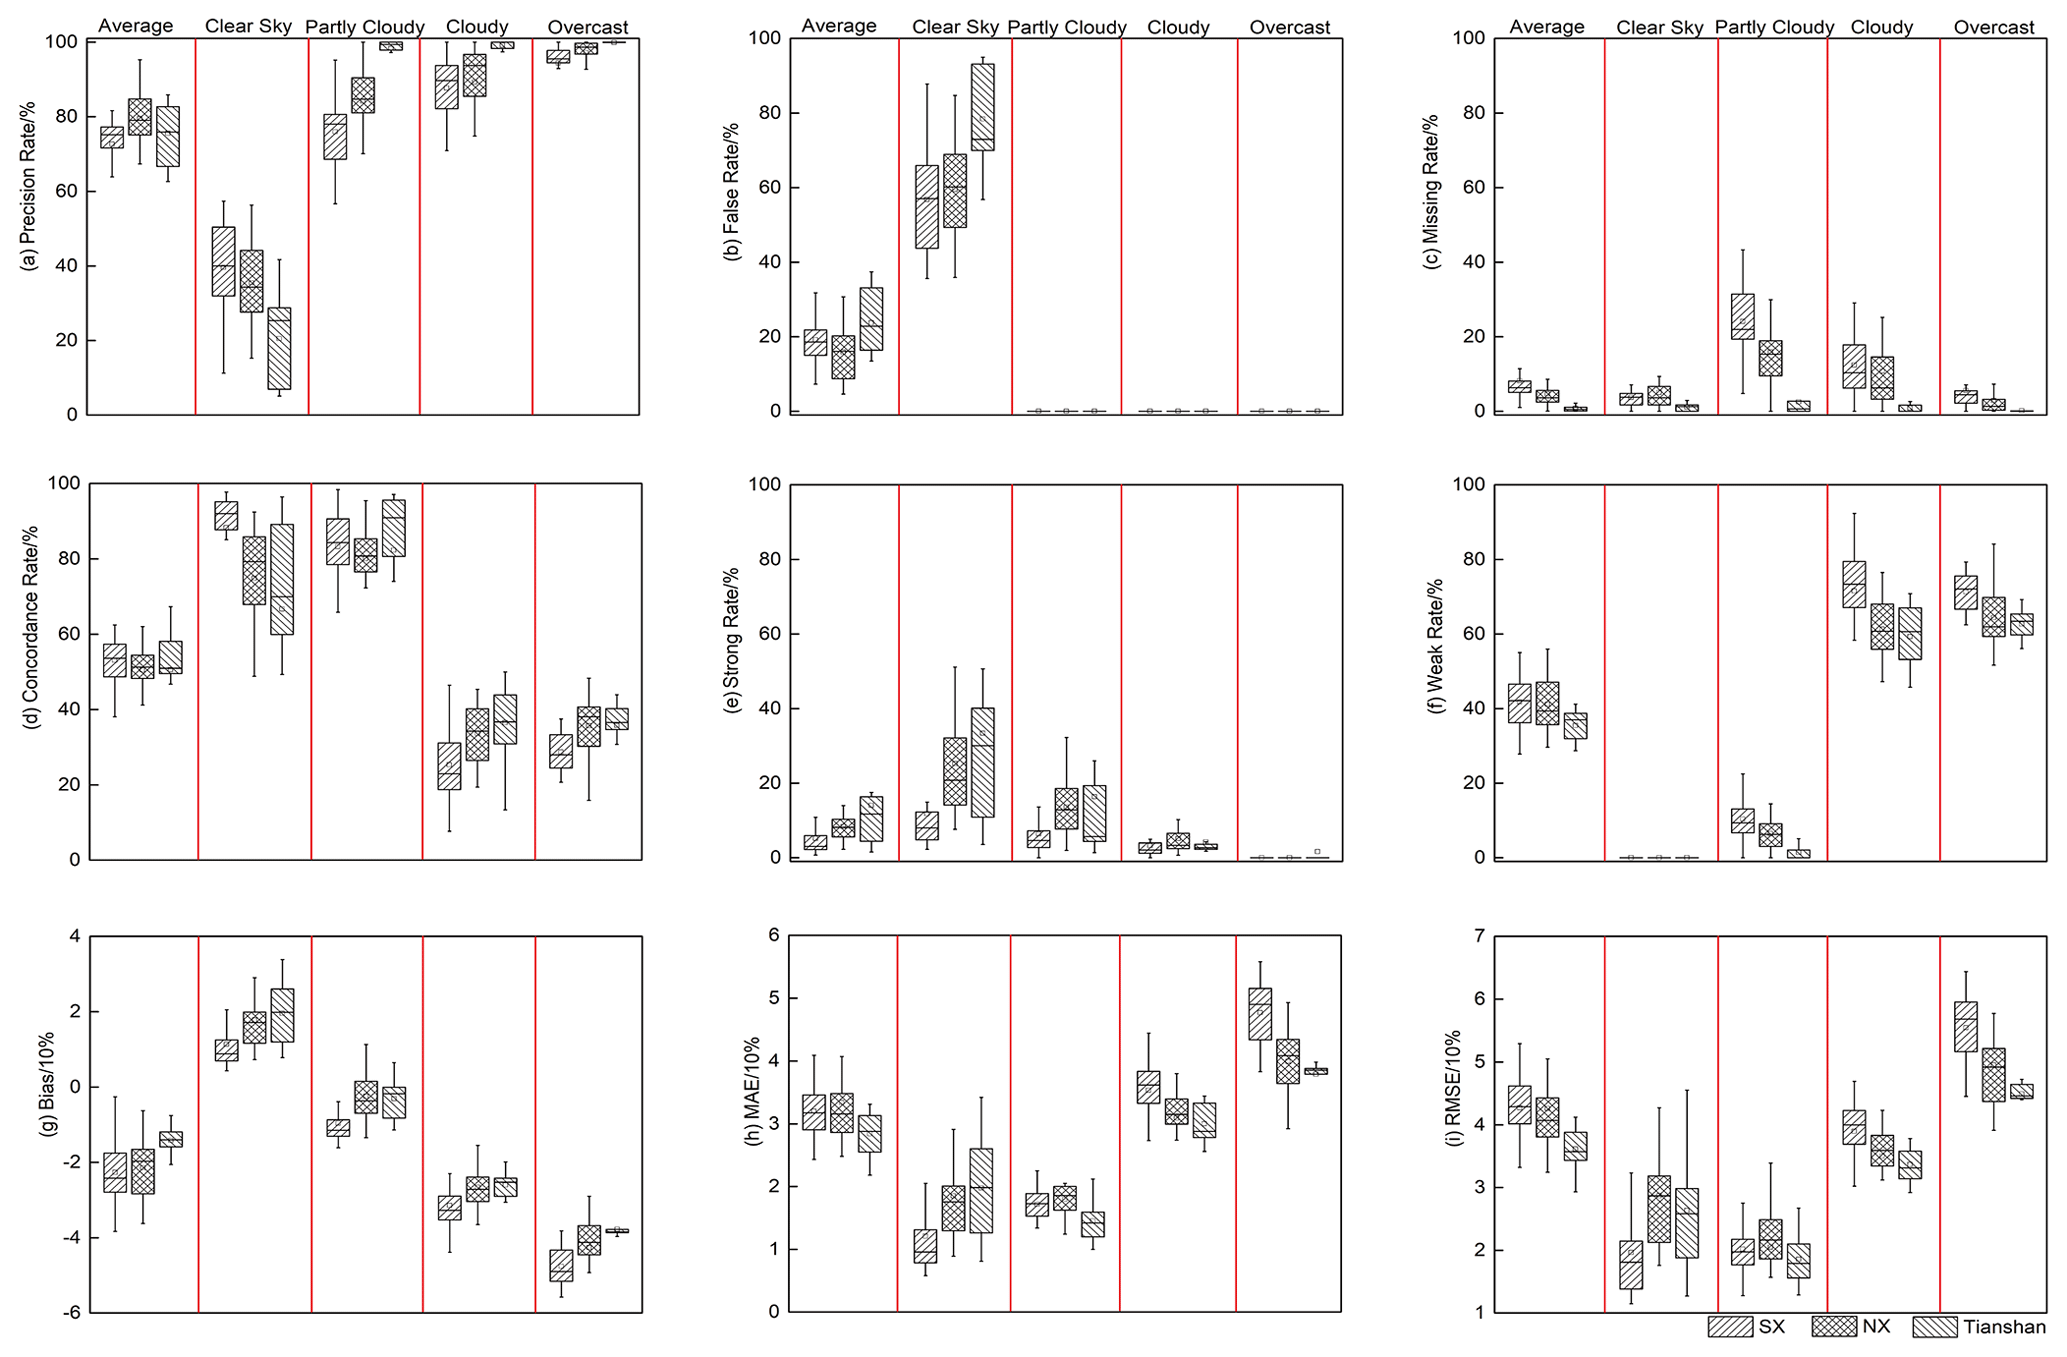
Figure 10The precision, consistency, and error comparison box plot of FY-2F/CTA under different TCC levels in Xinjiang. The number of samples is 24 931 for clear sky, 7954 for partly cloudy, 9557 for cloudy, and 38 413 for overcast.
Using satellite data to retrieve TCC has compensated for the limitations of traditional ground-based manual TCC observations and provided valuable foundational data for many studies. However, errors are unavoidable in the process of deriving the TCC from radiometric values received by the satellite; it is limited by the accuracy of many algorithms such as calibration, positioning, and cloud detection, as well as the effects of underlying surface type, surface temperature, and weather conditions. In this paper, Xinjiang was taken as the test area, and nine evaluation indexes (PR, FR, MR, CR, SR, WR, bias, MAE, and RMSE) of FY-2F/CTA are calculated and analyzed under complex underlying surface types, various temperature and altitude, dust effects, and different cloud cover levels. The precision, consistency, and EIs of FY-2F/CTA are tested and evaluated, and the following main conclusions are reached.
- 1.
The PR of FY-2F/CTA in the Xinjiang region shows a trend of gradually decreasing from north to south, and it demonstrates a high FR (the highest in Tianshan) and a low MR (the highest in SX). There is little difference in the CR among the three subregions of Xinjiang, showing a high SR and a low WR, which means that the amount of TCC inverted from FY-2 satellite data is generally lower than that observed by GOSs. The EIs increase from central to the north and south of Xinjiang, which means the EIs are the lowest in Tianshan and the highest in SX.
- 2.
The FY-2F/CTA exhibits higher PR and CR in the vegetation underlying surface compared to non-vegetation. That is, FY-2F/CTA has the best identification effect on the forest and plowland underlying surface and the worst effect on the snow and ice underlying surface. The MR in the vegetation underlying surface is higher (grassland is the highest), and the FR in the non-vegetation underlying surface is higher (ice–snow is the highest). The WR is higher than the SR in all kinds of underlying surfaces, but there is little difference between them in snow and ice underlying surface.
- 3.
With the increases in temperature, the PR and CR of FY-2F/CTA increase, while the EIs decrease. Under various temperature conditions, FY-2F/CTA has always exhibited high MR, low FR (on the contrary in January), high WR, and low SR.
- 4.
With the increase in altitude, the AR and CR of FY-2F/CTA decrease, but the PR increases significantly when the altitude is higher than 2000 m.
- 5.
Dust reduces the CR of FY-2F/CTA and increases their WR and MR but has a relatively minor impact on the identification of cloud and non-cloud.
- 6.
Under different cloud cover levels, the PR and EIs of FY-2F/CTA are proportional to the amount of TCC, while the CR is inversely proportional to it. It presents a high MR and a low FR (except clear sky), as well as a high SR and a low WR. This means that under clear-sky conditions, the PR and CR are the highest, and the EIs are the lowest in SX; under partly cloudy, cloudy, and overcast conditions, the PR and CR are the highest, and the EIs are the lowest in Tianshan.
Although the FY-2F/CTA dataset released by the national satellite center has some systematic errors with the ground-based manual TCC observations, it should be appropriately corrected by considering the complex underlying surface conditions, the influence of dust, and different cloud cover levels, which could provide better data guarantee for the research. And the data sequence length, accuracy, and spatial–temporal resolution can meet the needs of most climate research.
| TCC | Total cloud cover |
| TCCPs | Total cloud cover products |
| FY-2F | FengYun-2F |
| FY-2F/CTA | Cloud total amount of FengYun-2F stationary satellite |
| PR | Precision rate |
| FR | False rate |
| MR | Missing rate |
| CR | Consistency rate |
| WR | Weak rate |
| SR | Strong rate |
| EIs | Error indexes |
| MAE | Mean absolute error |
| RMSE | Root mean square error |
| NX | Northern Xinjiang |
| Tianshan | Tianshan (mountains) |
| SX | Southern Xinjiang |
| GOSs | Ground observation stations |
Underlying research data are available by request to Shuai Li (rainlishuai@163.com). Data published in the main paper's figures and tables are available via the Figshare data repository (https://doi.org/10.6084/m9.figshare.22015592, Li, 2023).
SL, HZ, YC, ZW, XL, YL, and YX designed the study. YL and YX carried out the data collection. SL, ZW, and XL carried out the data processing and analysis. SL, HZ, and YC assisted with the interpretation of results. All co-authors contributed to writing and reviewing the paper.
The contact author has declared that none of the authors has any competing interests.
Publisher’s note: Copernicus Publications remains neutral with regard to jurisdictional claims made in the text, published maps, institutional affiliations, or any other geographical representation in this paper. While Copernicus Publications makes every effort to include appropriate place names, the final responsibility lies with the authors.
We are grateful to the National Satellite Meteorological Center for FY-2F/CTA data support. We further acknowledge the researchers Zhaojun Zhen and Changjun Yang of the National Satellite Meteorological Center for giving a lot of guidance in FY-2/CTA data processing. We are grateful to the engineer Yu Cui of Urumqi Meteorological Satellite Ground Station for giving good advice on the preparation of snow cover distribution in Xinjiang. We thank the editors and three anonymous reviewers, whose comments and suggestions improved the utility and readability of this paper.
This work was financially supported by the National Key R&D Program of China (grant no. 2022YFC3701202), the National Natural Science Foundation of China (grant no. 42275039), and the S&T Development Fund of Chinese Academy of Meteorological Sciences (fund no. 2022KJ019).
This paper was edited by Maximilian Maahn and reviewed by three anonymous referees.
Betts, A. K., Desjardins, R., Worth, D., and Beckage, B.: Climate coupling between temperature, humidity, precipitation, and cloud cover over the Canadian Prairies, J. Geophys. Res.-Atmos., 119, 13305–13306, https://doi.org/10.1002/2014JD022511, 2014.
Boers, R., Acarreta, J. A., and Gras, J. L.: Satellite monitoring of the first indirect aerosol effect: Retrieval of the droplet concentration of water clouds, J. Geophys. Res., 111, D22208, https://doi.org/10.1029/2005JD006838, 2006.
Bony, S., Colman, R., Kattsov, V. M., Allan, R. P., Bretherton, C. S., Dufresne, J. L., Hall, A., Hallegatte, S., Holland, M. M., Ingram, W., Randall, D. A., Soden, B. J., Tselioudis, G., and Webb, M. J.: How well do we understand and evaluate climate change feedback processes?, J. Climate, 19, 3445–3482, https://doi.org/10.1175/JCLI3819.1, 2006.
Bony, S., Stevens, B., Frierson, D. M. W., Jakob, C., Kageyama, M., Pincus, R., Shepherd, T. G., Sherwood, S. C., Siebesma, A. P., Sobel, A. H., Watanabe, M., and Webb, M. J.: Clouds, circulation and climate sensitivity, Nat. Geosci., 8, 261–268, https://doi.org/10.1038/ngeo2398, 2015.
Boucher, O., Randall, D., Artaxo, P., Bretherton, C., Feingold, G., Forster, P., Kerminen, V. M., Kondo, Y., Liao, H., Lohmann, U., Rasch, P., Satheesh, S. K., Sherwood, S., Stevens, B., and Zhang, X. Y.: Clouds and aerosols, in: Climate Change 2013: The Physical Science Basis. Contribution of Working Group I to the Fifth Assessment Report of the Intergovernmental Panel on Climate Change, edited by: Stocker, T. F., Qin, D., Plattner, G. K., Tignor, M., Allen, S. K., Doschung, J., Nauels, A., Xia, Y., Bex, V., Midgley, P. M., Cambridge University Press, Cambridge, 571–657, ISBN: 978-1-009-41954-3, 2013.
Ceppi, P., Brient, F., Zelinka, M. D., and Hartmann, D. L.: Cloud feedback mechanisms and their representation in global climate models, WIREs Clim. Change, 8, e465, https://doi.org/10.1002/wcc.465, 2017.
Chen, T., Rossow, W. B., and Zhang, Y. C.: Radiative effects of cloud type variations, J. Climate, 13, 264–286, https://doi.org/10.1175/1520-0442(2000)013<0264:REOCTV>2.0.CO;2, 2000.
Chepfer, H., Noel, V., Winker, D., and Chiriaco, M.: Where and when will we observe cloud changes due to climate warming?, Geophys. Res. Lett., 41, 8387–8395, https://doi.org/10.1002/2014GL061792, 2014.
Danso, D. K., Anquetin, S., Diedhiou, A., Lavaysse, C., Kobea, A., and Touré, N. D. E.: Spatio-temporal variability of cloud cover types in West Africa with satellite-based and reanalysis data, Q. J. Roy. Meteor. Soc., 145, 3715–3731, https://doi.org/10.1002/qj.3651, 2019.
Ding, S. G., Shi, G. Y., and Zhao, C. S.: Analyzing global trends of different cloud types and the their potential impacts on climate by using the ISCCP D2 dataset, Chinese Sci. Bull., 49, 1105–1111, https://doi.org/10.1360/csb2004-49-11-1105, 2004 (in Chinese).
Errico, R. M., Ohring, G., Weng, F., Bauer, P., Ferrier, B., Mahfouf, J.-F., and Turk, J.: Assimilation of satellite cloud and precipitation observations in numerical weather prediction models: Introduction to the JAS special collection, J. Atmos. Sci, 64, 3737–3741, https://doi.org/10.1175/2007JAS2622.1, 2007.
Feng, J. D., Wu, Z. T., Peng, K. J., Chen, Y. H., Wu, J. J., Wei, W. S., Cui, C. X., and Gao, Y.: Variations in the heights of different clouds over three major mountains in Xinjiang based on CloudSat observation, J. Glaciol. Geocryol., 36, 310–317, http://www.bcdt.ac.cn/CN/10.7522/j.issn.1000-0240.2014.0038, 2014 (in Chinese with English abstract).
Free, M., Sun, B., and Yoo, H. L.: Comparison between total cloud cover in four reanalysis products and cloud measured by visual observations at US weather stations, J. Climate, 29, 2015–2021, https://doi.org/10.1175/JCLI-D-15-0637.1, 2016.
Guo, Z., Zhou, T. J., Wang, M. H., and Qian, Y.: Impact of cloud radiative heating on East Asian summer monsoon circulation, Environ. Res. Lett., 10, 074014, https://doi.org/10.1088/1748-9326/10/7/074014, 2015.
Han, Y. Q. and Cong, C. H.: Analysis and validation of FY-2E total cloud amount productions in north China and Huanghuai area, J. Meteor. Environ., 31, 153–158, http://www.jme1984.net.cn/CN/Y2015/V31/I5/153 (last access: 24 March 2024), 2015 (in Chinese).
Harrison, E. F., Minnis, P., Barkstrom, B. R., Ramanathan, V., Cess, R. D., and Gibson, G. G.: Seasonal variation of cloud radiative forcing derived from the earth radiation budget experiment, J. Geophys. Res., 95, 18687–18703, https://doi.org/10.1029/JD095iD11p18687, 1990.
Haynes, J. M., Vonder Haar, T. H., L'Ecuyer, T., and Henderson, D.: Radiative heating characteristics of earth's cloudy atmosphere from vertically resolved active sensors, Geophys. Res. Lett., 40, 624–630, https://doi.org/10.1002/grl.50145, 2013.
Kang, Z. W., Zhang, Z.Y., Liu, L., Wang, T. X., Tian, H., Chen, H. J., and Zhang, X. Y.: Spatio-temporal variation characteristics of land surface temperature in Xinjiang based on MODIS, Geogr. Res., 41, 997–1017, https://doi.org/10.11821/dlyj020210232, 2022.
Kim, B.-Y., Cha, J. W., and Lee, Y. H.: Estimation of 24 h continuous cloud cover using a ground-based imager with a convolutional neural network, Atmos. Meas. Tech., 16, 5403–5413, https://doi.org/10.5194/amt-16-5403-2023, 2023.
Kiran, V. R., Rajeevan, M., Gadhavi, H., Rao, S. V. B., and Jayaraman, A.: Role of vertical structure of cloud microphysical properties on cloud radiative forcing over the Asian monsoon region, Clim. Dynam., 45, 3331–3345, https://doi.org/10.1007/s00382-015-2542-0, 2015.
Kotarba, A. Z.: A comparison of MODIS-derived cloud amount with visual surface observations, Atmos. Res., 92, 522–530, https://doi.org/10.1016/j.atmosres.2009.02.001, 2009.
Li, J. D., Wang, W. C., Dong, X. Q., and Mao, J. Y.: Cloud-radiation-precipitation associations over the Asian monsoon region: An observational analysis, Clim. Dynam., 49, 3237–3255, https://doi.org/10.1007/s00382-016-3509-5, 2017.
Li, J. D., Wang, W. C., Mao, J. Y., Wang, Z. Q., Zeng, G., and Chen, G. X.: Persistent spring shortwave cloud radiative effect and the associated circulations over southeastern China, J. Climate, 32, 3069–3087, https://doi.org/10.1175/JCLI-D-18-0385.1, 2019.
Li, S.: Comparing FY-2F/CTA products to ground-based manual total cloud cover observations in Xinjiang under complex underlying surfaces and different Weather Conditions, figshare [data set], https://doi.org/10.6084/m9.figshare.22015592, 2023.
Li, S., Hou, X. G., Cui, Y., Liang, F. C., and Xu, Z. D.: Research on cloud characteristics in Xinjiang region based on FY-2F satellite data, Plateau Meteor., 38, 617–624, https://doi.org/10.7522/j.issn.1000-0534.2018.00101, 2019 (in Chinese with English abstract).
Li, Y., Guo, J. X., Cao, Y. C., Zhou, C., and Chen, Y. Z.: Compare and analyze FY-2G cloud products to ground-based manual observed cloud amount, Plateau Meteor., 37, 514–523, https://doi.org/10.7522/j.issn.1000-0534.2017.00027, 2018 (in Chinese with English abstract).
Liu, J., Yang, X. F., and Cui, P.: Validation of total cloud amount in 2007 derived by NOAA/AVHRR, Plateau Meteor., 35, 1027–1038, http://www.gyqx.ac.cn/CN/10.7522/j.issn.1000-0534.2015.00029 (last access: 24 March 2024), 2016 (in Chinese with English abstract).
Liu, J., Cui, P., and Xiao, M.: The bias analysis of FY-2G cloud fraction in summer and winter, J. Appl. Meteor. Sci., 28, 177–188, https://doi.org/10.11898/1001-7313.20170205, 2017 (in Chinese with English abstract).
Liu, R. X., Chen, H. B., Zheng, Z. J., Liu, N. Q., Shi, C. X., and Liu, Y. J.: Analysis and validation of total cloud amount data in China, J. Appl. Meteor. Sci., 20, 571–578, https://doi.org/10.3969/j.issn.1001-7313.2009.05.008, 2009 (in Chinese).
Loeb, N. G., Doelling, D. R., Wang, H. L., Su, W. Y., Nguyen, C., Corbett, J. G., Liang, L. S., Mitrescu, C., Rose, F. G., and Kato, S.: Clouds and the earth's Radiant Energy System (CERES) Energy Balanced and Filled (EBAF) Top-of-Atmosphere (TOA) Edition-4.0 data product, J. Climate, 31, 895–918, https://doi.org/10.1175/JCLI-D-17-0208.1, 2018.
Pavolonis, M. J. and Key, J. R.: Antarctic cloud radiative forcing at the surface estimated from the AVHRR Polar Pathfinder and ISCCP D1 datasets, 1985–93, J. Appl. Meteorol., 42, 827–840, https://doi.org/10.1175/1520-0450(2003)042<0827:ACRFAT>2.0.CO;2, 2003.
Slingo, A. and Slingo, J. M.: The response of a general circulation model to cloud longwave radiative forcing. I: Introduction and initial experiments, Q. J. Roy. Meteor. Soc., 114, 1027–1062, https://doi.org/10.1002/qj.49711448209, 1988.
Sun, B.: Cloudiness over the contiguous United States: Contemporary changes observed using ground-based and ISCCP D2 data, Geophys. Res. Lett., 30, 1053, https://doi.org/10.1029/2002GL015887, 2003.
Sun, B., Free, M., Yoo, H. L., Foster, M. J., Heidinger, A., and Karlsson, K. G.: Variability and trends in US cloud cover: ISCCP, PATMOS-x, and CLARA-A1 compared to homogeneity-adjusted weather observations, J. Climate, 28, 4373–4389, https://doi.org/10.1175/JCLI-D-14-00805.1, 2015.
Wang, M. Y. and Wang, B. M.: Total cloud amount difference between ISCCP product and ground observation over China, J. Appl. Meteor. Sci., 20, 411–418, https://doi.org/10.3969/j.issn.1001-7313.2009.04.004, 2009 (in Chinese).
Wang, Y. and Zhao, C.: Can MODIS cloud fraction fully represent the diurnal and seasonal variations at DOE ARM SGP and Manus sites?, J. Geophys. Res.-Atmos., 122, 329–343, https://doi.org/10.1002/2016JD025954, 2017.
Werkmeister, A., Lockhoff, M., Schrempf, M., Tohsing, K., Liley, B., and Seckmeyer, G.: Comparing satellite- to ground-based automated and manual cloud coverage observations – a case study, Atmos. Meas. Tech., 8, 2001–2015, https://doi.org/10.5194/amt-8-2001-2015, 2015.
Wu, W., Liu, Y., Jensen, M. P., Toto, T., Foster, M. J., and Long, C. N.: A comparison of multiscale variations of decade-long cloud fractions from six different platforms over the Southern Great Plains in the United States, J. Geophys. Res.-Atmos., 119, 3438–3459, https://doi.org/10.1002/2013JD019813, 2014.
Xi, L., Shi, C. X., Zhao, B. F., Zhu, C., and Zhu, X. L.: Validation and evaluation of cloud amount by geostationary satellite data from 1995 to 2010, Meteor. Sci. Technol., 41, 8–14, http://www.qxkj.net.cn/qxkj/article/abstract/20130102 (last access: 24 March 2024), 2013 (in Chinese with English abstract).
Yang, Y., Zhao, C., and Fan, H.: Spatiotemporal distributions of cloud properties over China based on Himawari-8 advanced Himawari imager data, Atmos. Res., 240, 104927, https://doi.org/10.1016/j.atmosres.2020.104927, 2020.
Yao, J. Q., Zhao, Y., Chen, Y. N., Yu, X. J., and Zhang, R. B.: Multi-scale assessments of droughts: A case study in Xinjiang, China, Sci. Total Environ., 630, 444–452, https://doi.org/10.1016/j.scitotenv.2018.02.200, 2018.
Yousef, L. A., Temimi, M., Molini, A., Weston, M., Wehbe, Y., and Mandous, A. A.: Cloud Cover over the Arabian Peninsula from Global Remote Sensing and Reanalysis Products, Atmos. Res., 238, 104866, https://doi.org/10.1016/j.atmosres.2020.104866, 2020.
Zelinka, M. D., Randall, D. A., Webb, M. J., and Klein, S. A.: Clearing clouds of uncertainty, Nat. Clim. Change, 7, 674–678, https://doi.org/10.1038/nclimate3402, 2017.
Zhang, H., Wang, F., Wang, F., Li, J., Chen, X., Wang, Z., Li, J., Zhou, X., Wang, Q., Wang, H., You, T., Xie, B., Chen, Q., and Duan, Y.: Advances in cloud radiative feedbacks in global climate change, Scientia Sinica Terrae, 52, 400–417, https://doi.org/10.1360/SSTe-2021-0052, 2022 (in Chinese).
Zhou, C. L., Yang, X. H., Zhong, X. J., Yang, F., and Chou, H. M.: Dust weather in hinterland of the Taklamakan desert, Arid Zone Res., 34, 324–329, https://doi.org/10.13866/j.azr.2017.02.11, 2017.
Zhou, S., Yang, J., Wang, W.-C., Zhao, C., Gong, D., and Shi, P.: An observational study of the effects of aerosols on diurnal variation of heavy rainfall and associated clouds over Beijing–Tianjin–Hebei, Atmos. Chem. Phys., 20, 5211–5229, https://doi.org/10.5194/acp-20-5211-2020, 2020.