the Creative Commons Attribution 4.0 License.
the Creative Commons Attribution 4.0 License.
 | 17 Apr 2024
Radiative closure tests of collocated hyperspectral microwave and infrared radiometers
Natalia Bliankinshtein
John R. Gyakum
Philip M. Gabriel
Shiqi Xu
Mengistu Wolde
Temperature and water vapor profiles are essential to climate change studies and weather forecasting. Hyperspectral instruments are of great value for retrieving temperature and water vapor profiles, enabling accurate monitoring of their changes. Successful retrievals of temperature and water vapor profiles require accuracy of hyperspectral radiometer measurements. In this study, the radiometric accuracy of an airborne hyperspectral microwave radiometer, the High Spectral Resolution Airborne Microwave Sounder (HiSRAMS), and a ground-based hyperspectral infrared radiometer, the Atmospheric Emitted Radiance Interferometer (AERI), is simultaneously assessed by performing radiative closure tests under clear-sky conditions in Ottawa, Canada. As an airborne instrument, HiSRAMS has two radiometers measuring radiance in the oxygen band (49.6–58.3 GHz) and water vapor band (175.9–184.6 GHz) for zenith-pointing and nadir-pointing observations. AERI provides ground-based, zenith-pointing radiance measurements between 520 and 1800 cm−1. A systematic warm radiance bias is present in AERI observations in the window band. Upon removal of this bias, improved radiative closure was attained in the window band. The brightness temperature (BT) bias in nadir-pointing HiSRAMS observations is smaller than at the zenith. A novel but straightforward method is developed to diagnose the radiometric accuracy of the two instruments in comparison based on the relationship between radiometric bias and optical depth. Compared to AERI, HiSRAMS demonstrates similar radiometric accuracy for nadir-pointing measurements but exhibits relatively poor accuracy for zenith-pointing measurements, which requires further characterization. Future work on temperature and water vapor concentration retrievals using HiSRAMS and AERI is warranted.
- Article
(10656 KB) - Full-text XML
-
Supplement
(531 KB) - BibTeX
- EndNote


Accurate long-term measurements of the vertical distributions of temperature and water vapor are crucial for climate change analysis, climate model validation, and weather forecasting. Radiosondes provide accurate in situ temperature and water vapor profiles with high vertical resolution but are limited in spatial and temporal coverage. Remote sensing techniques have been developed to fill such data gaps (Aires et al., 2015; Blackwell et al., 2010; Delamere et al., 2010; Turner and Blumberg, 2018; Warwick et al., 2022; King et al., 1992; Han and Westwater, 1995; Westwater, 1997; Turner et al., 2000). Hyperspectral measurements, in which the vertical information of temperature and water vapor can be retrieved from different spectral channels (Smith et al., 2021), are valuable for sounding their vertical distributions (e.g., Divakarla et al., 2006; Turner and Blumberg, 2018). Spectral resolution (the number of channels within a certain spectral range) is pivotal in determining the information content in such retrievals (Rodgers, 2000).
Both hyperspectral infrared and microwave radiometers can be employed to retrieve temperature and water vapor concentration profiles. A distinct advantage of microwave radiometers in retrieving temperature and water vapor profiles is their ability to sound through clouds, allowing for all-sky retrievals. However, the existing microwave radiometers typically have no more than 100 spectral channels (Blackwell et al., 2010; Hilliard et al., 2013), which is an order of magnitude less than infrared hyperspectrometers (Aumann and Strow, 2001; Carminati et al., 2019; Knuteson et al., 2004a). Thanks to the advancement of digital polyphase fast Fourier transform (FFT) filter banks, hyperspectral microwave radiometers can now acquire a comparable number of spectral channels, which allows us to access and compare their temperature and water vapor profiling abilities as well as develop synergies between hyperspectral microwave and infrared radiometers. The High Spectral Resolution Airborne Microwave Sounder (HiSRAMS) is such a hyperspectral microwave radiometer, developed by Omnisys Instruments AB, the National Research Council of Canada (NRC), and McGill University under the sponsorship of the European Space Agency (Auriacombe et al., 2022; Bliankinshtein et al., 2023b). As a prototype for possible future satellite missions, HiSRAMS' accuracy needs thorough assessment.
In this study, we focus on two hyperspectral radiometers: (1) HiSRAMS, operating in the microwave spectral range (49.6–58.3 and 175.9–184.6 GHz for single-polarized observations), and (2) the Atmospheric Emitted Radiance Interferometer (AERI), operating in the infrared spectral range (520–3020 cm−1). AERI is a well-tested instrument with good radiometric accuracy (Knuteson et al., 2004b), which provides a benchmark comparison for the radiometric accuracy of HiSRAMS.
HiSRAMS, a payload mounted on a wing of the NRC's Convair-580 research aircraft (Bliankinshtein et al., 2022), provides zenith-pointing (looking up) and nadir-pointing (looking down) observations or can be deployed on the ground for zenith-pointing observations. AERI is perpetually deployed on the ground for zenith-pointing observations (Knuteson et al., 2004a, b). Both instruments have high spectral resolutions and mainly target the retrieval of temperature and water vapor profiles with the potential to retrieve other trace gases. When airborne, HiSRAMS can take measurements at different altitudes. Such multi-altitude measurements yield more constraints of the detailed and extensive temperature and water vapor retrievals. In comparison, AERI has been demonstrated to be capable of retrieving temperature and water vapor profiles at high vertical resolutions, especially in the boundary layer (Turner and Löhnert, 2014; Turner and Blumberg, 2018).
The radiometric accuracy of the hyperspectral measurements is vital for successful retrievals. For example, in the optimal estimation method (Rodgers, 2000), the ability of a hyperspectrometer to resolve the vertical distributions of temperature and water vapor can be measured by the degree of freedom for signals (DFS), which is dependent on the characterizations of errors in both the hyperspectral measurements and the meteorological variables. Radiative closure tests can help determine the bias in the radiometer measurements and provide clues to their origins (Barrientos-Velasco et al., 2022; Clough et al., 1994; Delamere et al., 2010; Turner, 2003). In this study, we focus on clear-sky radiative closure tests to avoid uncertainties due to the poor representation of clouds. Two primary objectives of this work include (1) collecting collocated AERI and HiSRAMS radiance measurements under clear-sky conditions and (2) performing radiative closure tests for both radiometers and comparing their radiometric accuracy.
2.1 Datasets
Three clear-sky field campaigns (FC2021, FC2022, and FC2023) were carried out in Ottawa, Canada (latitude: 45.32° N, longitude: 75.66° W), to collect hyperspectral measurements and to perform radiative closure tests of the AERI stationed on the ground and the HiSRAMS mounted on the NRC's Convair-580 research aircraft (details listed in Table 1).
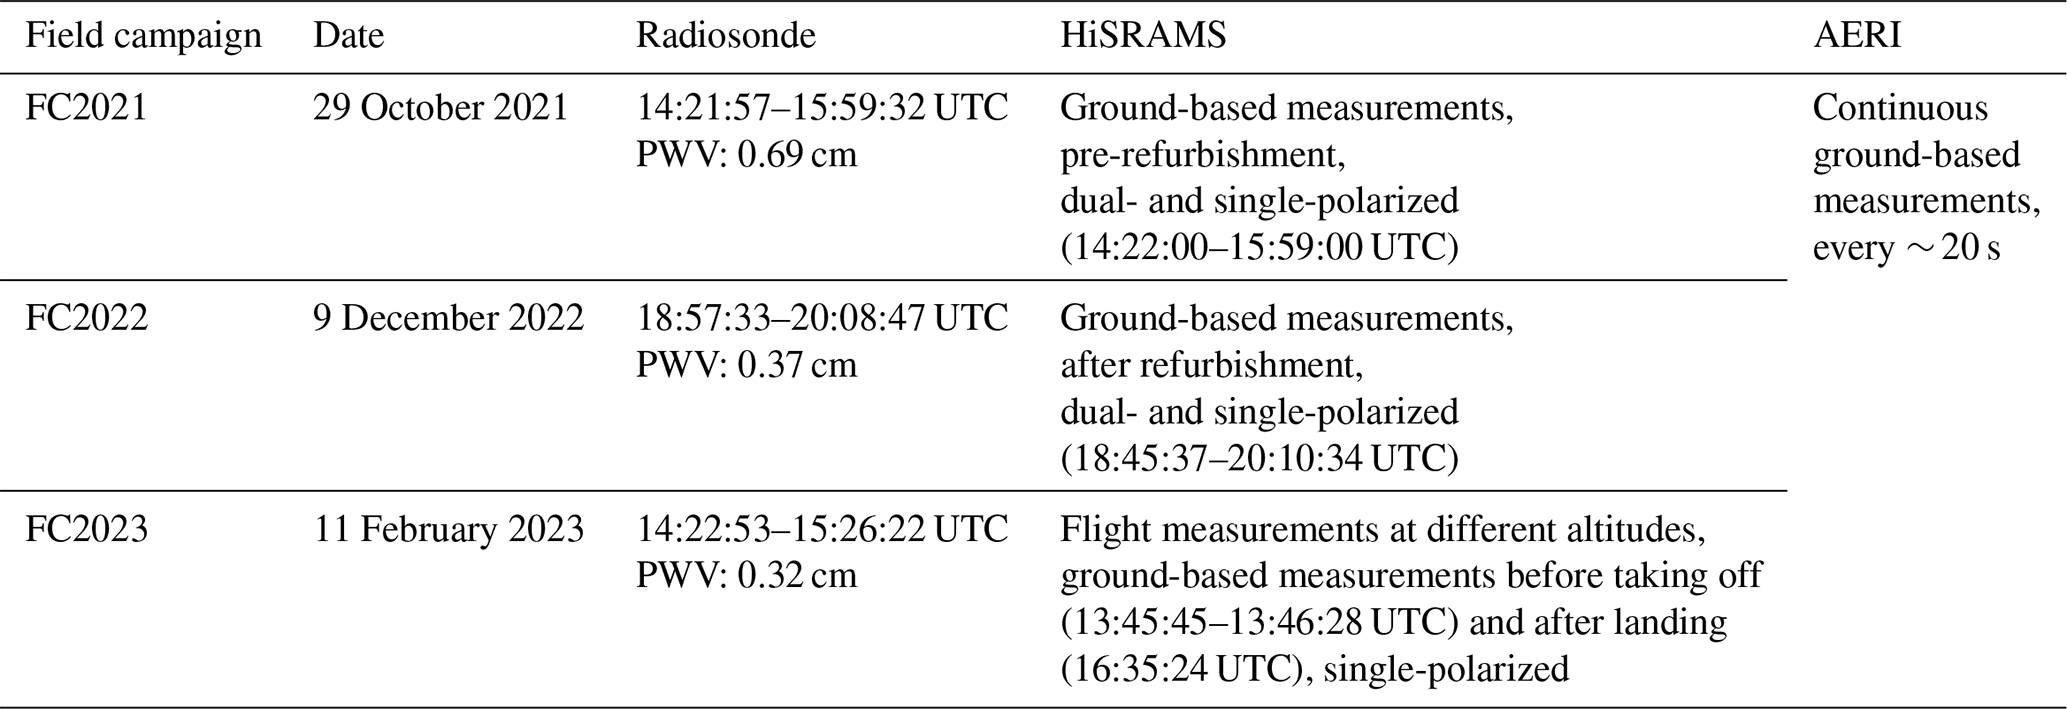
Radiosonde measurements were collected (one for each campaign), together with the HiSRAMS (Fig. 1a, b) and AERI measurements (Fig. 1c). Ground-based zenith-pointing HiSRAMS measurements were archived in all three field campaigns. In the first two field campaigns, HiSRAMS collected longer ground-based records. In the final field campaign, HiSRAMS was mounted on the NRC's Convair-580 research aircraft to gather ground-based zenith-pointing measurements before take-off and after landing, including airborne measurements at different flight altitudes. In all three field campaigns, AERI provided continuous ground-based zenith-pointing measurements.
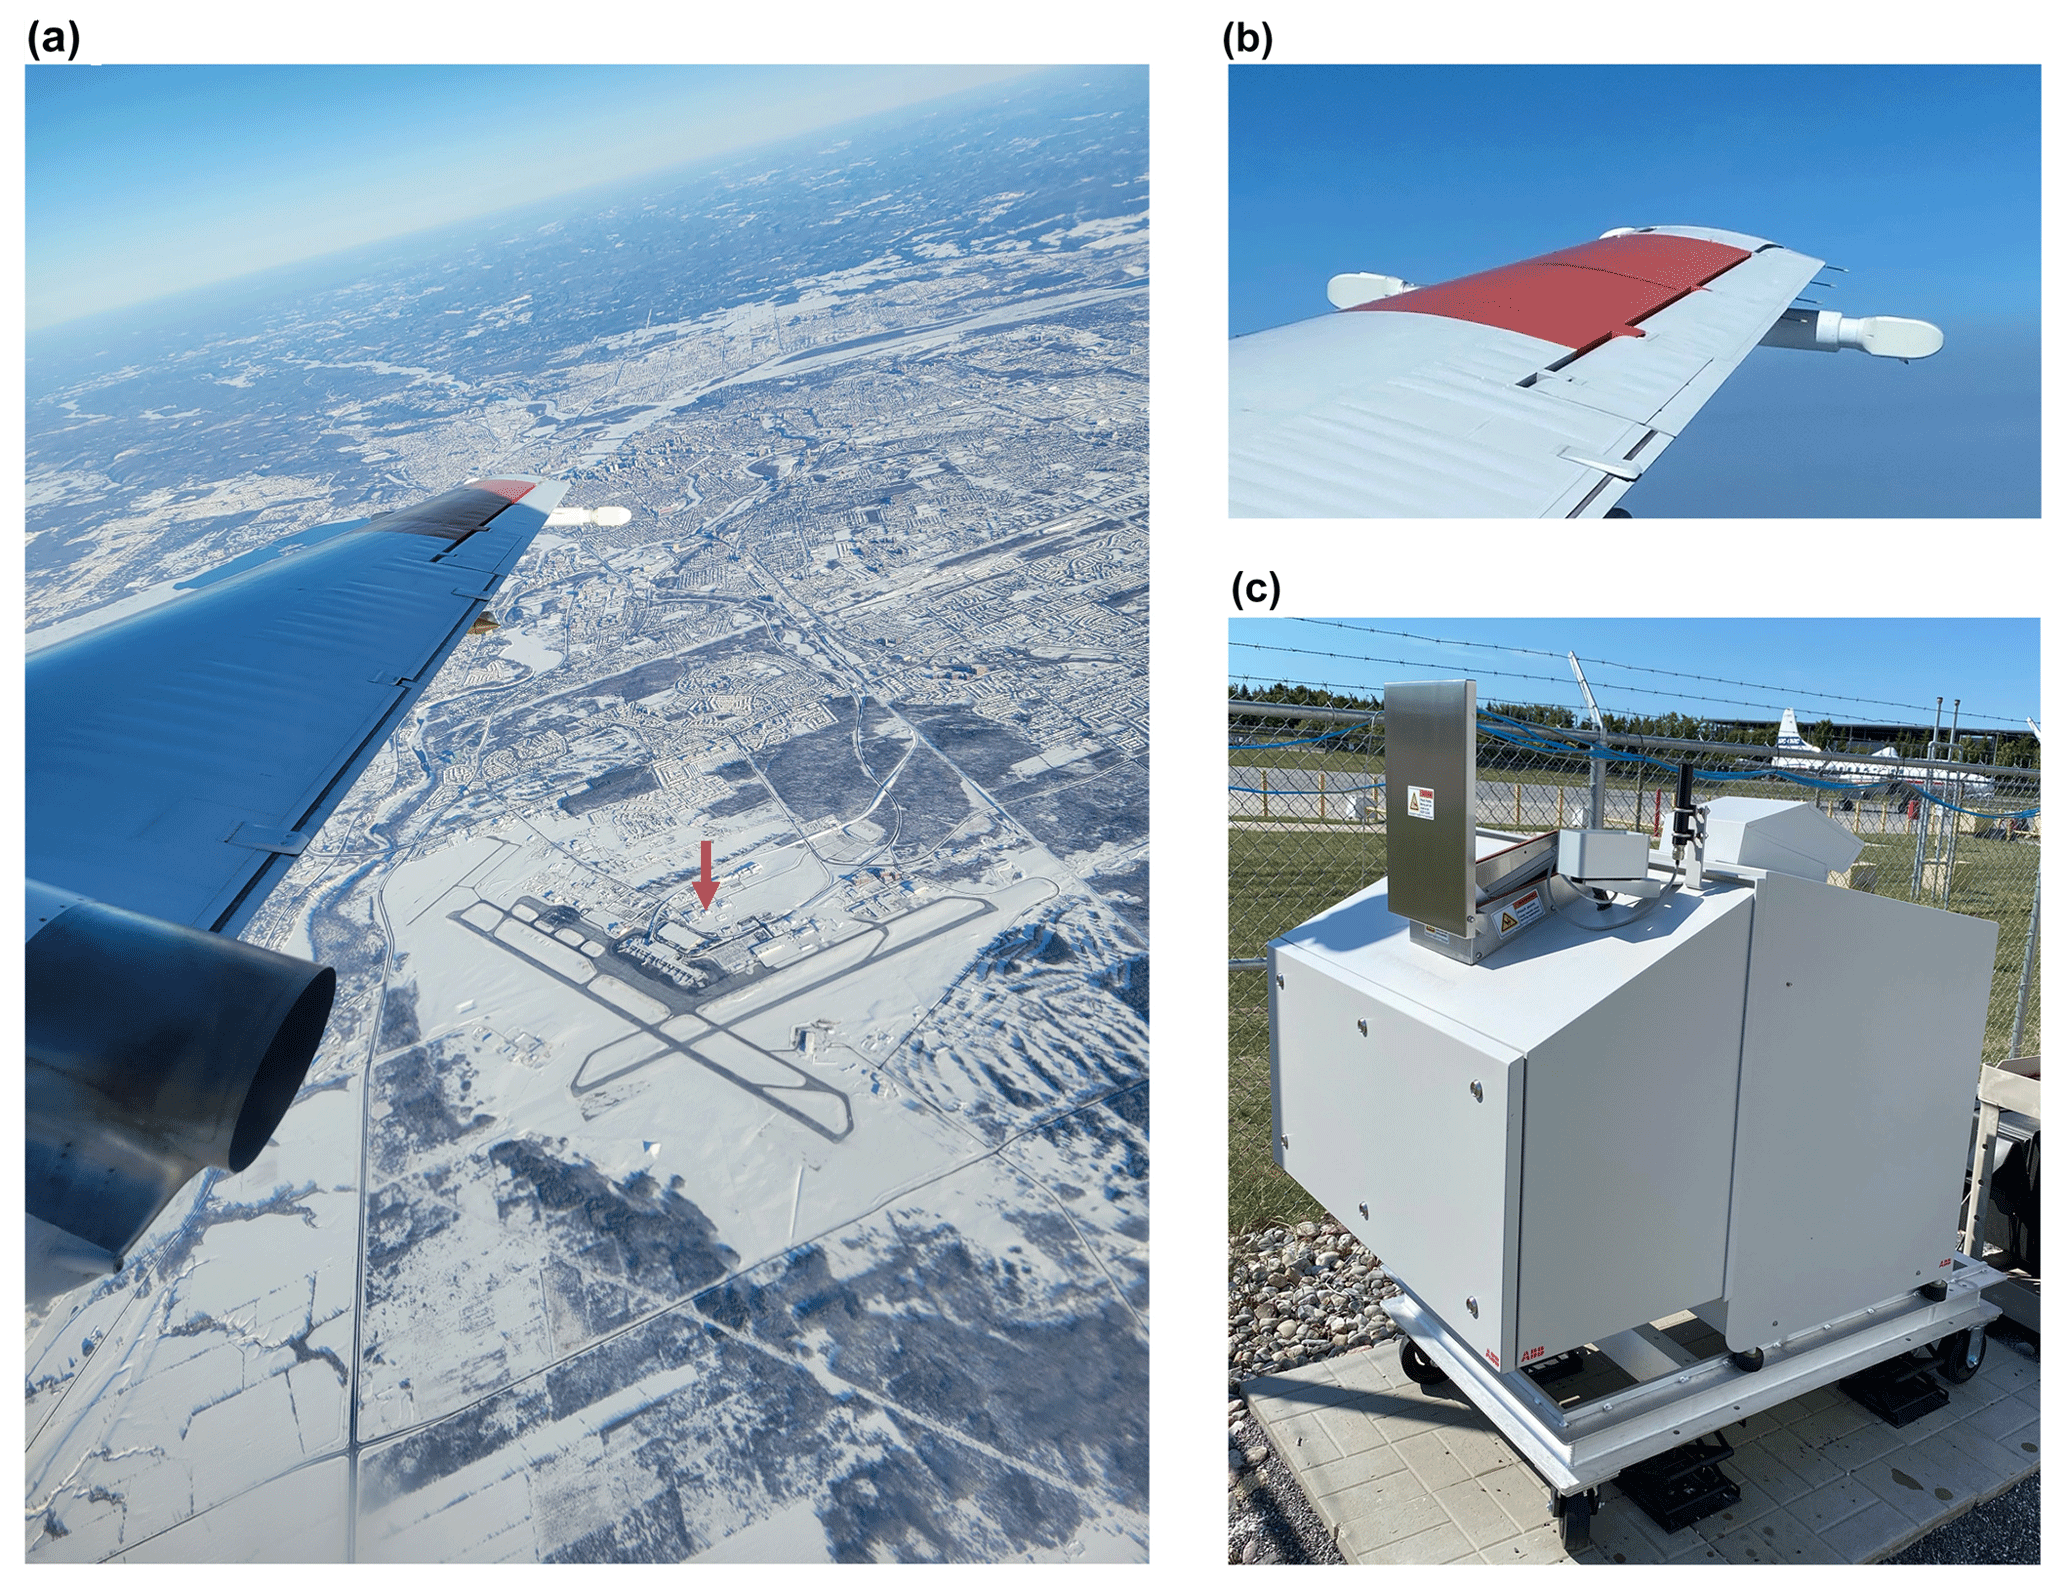
Figure 1(a, b) HiSRAMS mounted on the wing tip of the NRC's Convair-580 research aircraft for zenith-pointing and nadir-pointing measurements during the flights. The arrow in panel (a) indicates the location of AERI. (c) AERI on the ground with the hatch open, taking zenith-pointing measurements.
2.1.1 Radiosonde temperature and water vapor profiles
The radiosonde used in this study was an iMet-4 from InterMet. We considered both repeatability and reproducibility errors in temperature and relative humidity to determine the total radiosonde uncertainty, following the procedure outlined in Blumberg et al. (2017). Repeatability errors indicate random errors, measuring 0.2 K for temperature and 5 % for relative humidity. Meanwhile, reproducibility errors represent systematic errors, measuring 0.3 K above and 0.75 K below 100 hPa for temperature and 3 % and 5 % for relative humidity at temperatures above 0 and between −40 and 0°, respectively. All the specified statistical uncertainties were at the 95 % confidence level (see https://www.intermetsystems.com/products/imet-4-radiosonde/, last access: 25 September 2023). The temperature and water vapor profiles obtained from in situ radiosonde observations are considered representative of “true” atmospheric thermodynamic states (see Fig. 2). These profiles serve as inputs to radiative transfer models for testing the radiative closure. However, since radiosondes can drift, their measurements may not always accurately represent zenith profiles. Table 1 lists precipitable water vapor (PWV) converted from radiosonde water vapor measurements in each field campaign. The small fluctuations in the temperature and water vapor vertical profiles have a negligible effect on AERI- and HiSRAMS-detected radiances (not shown).
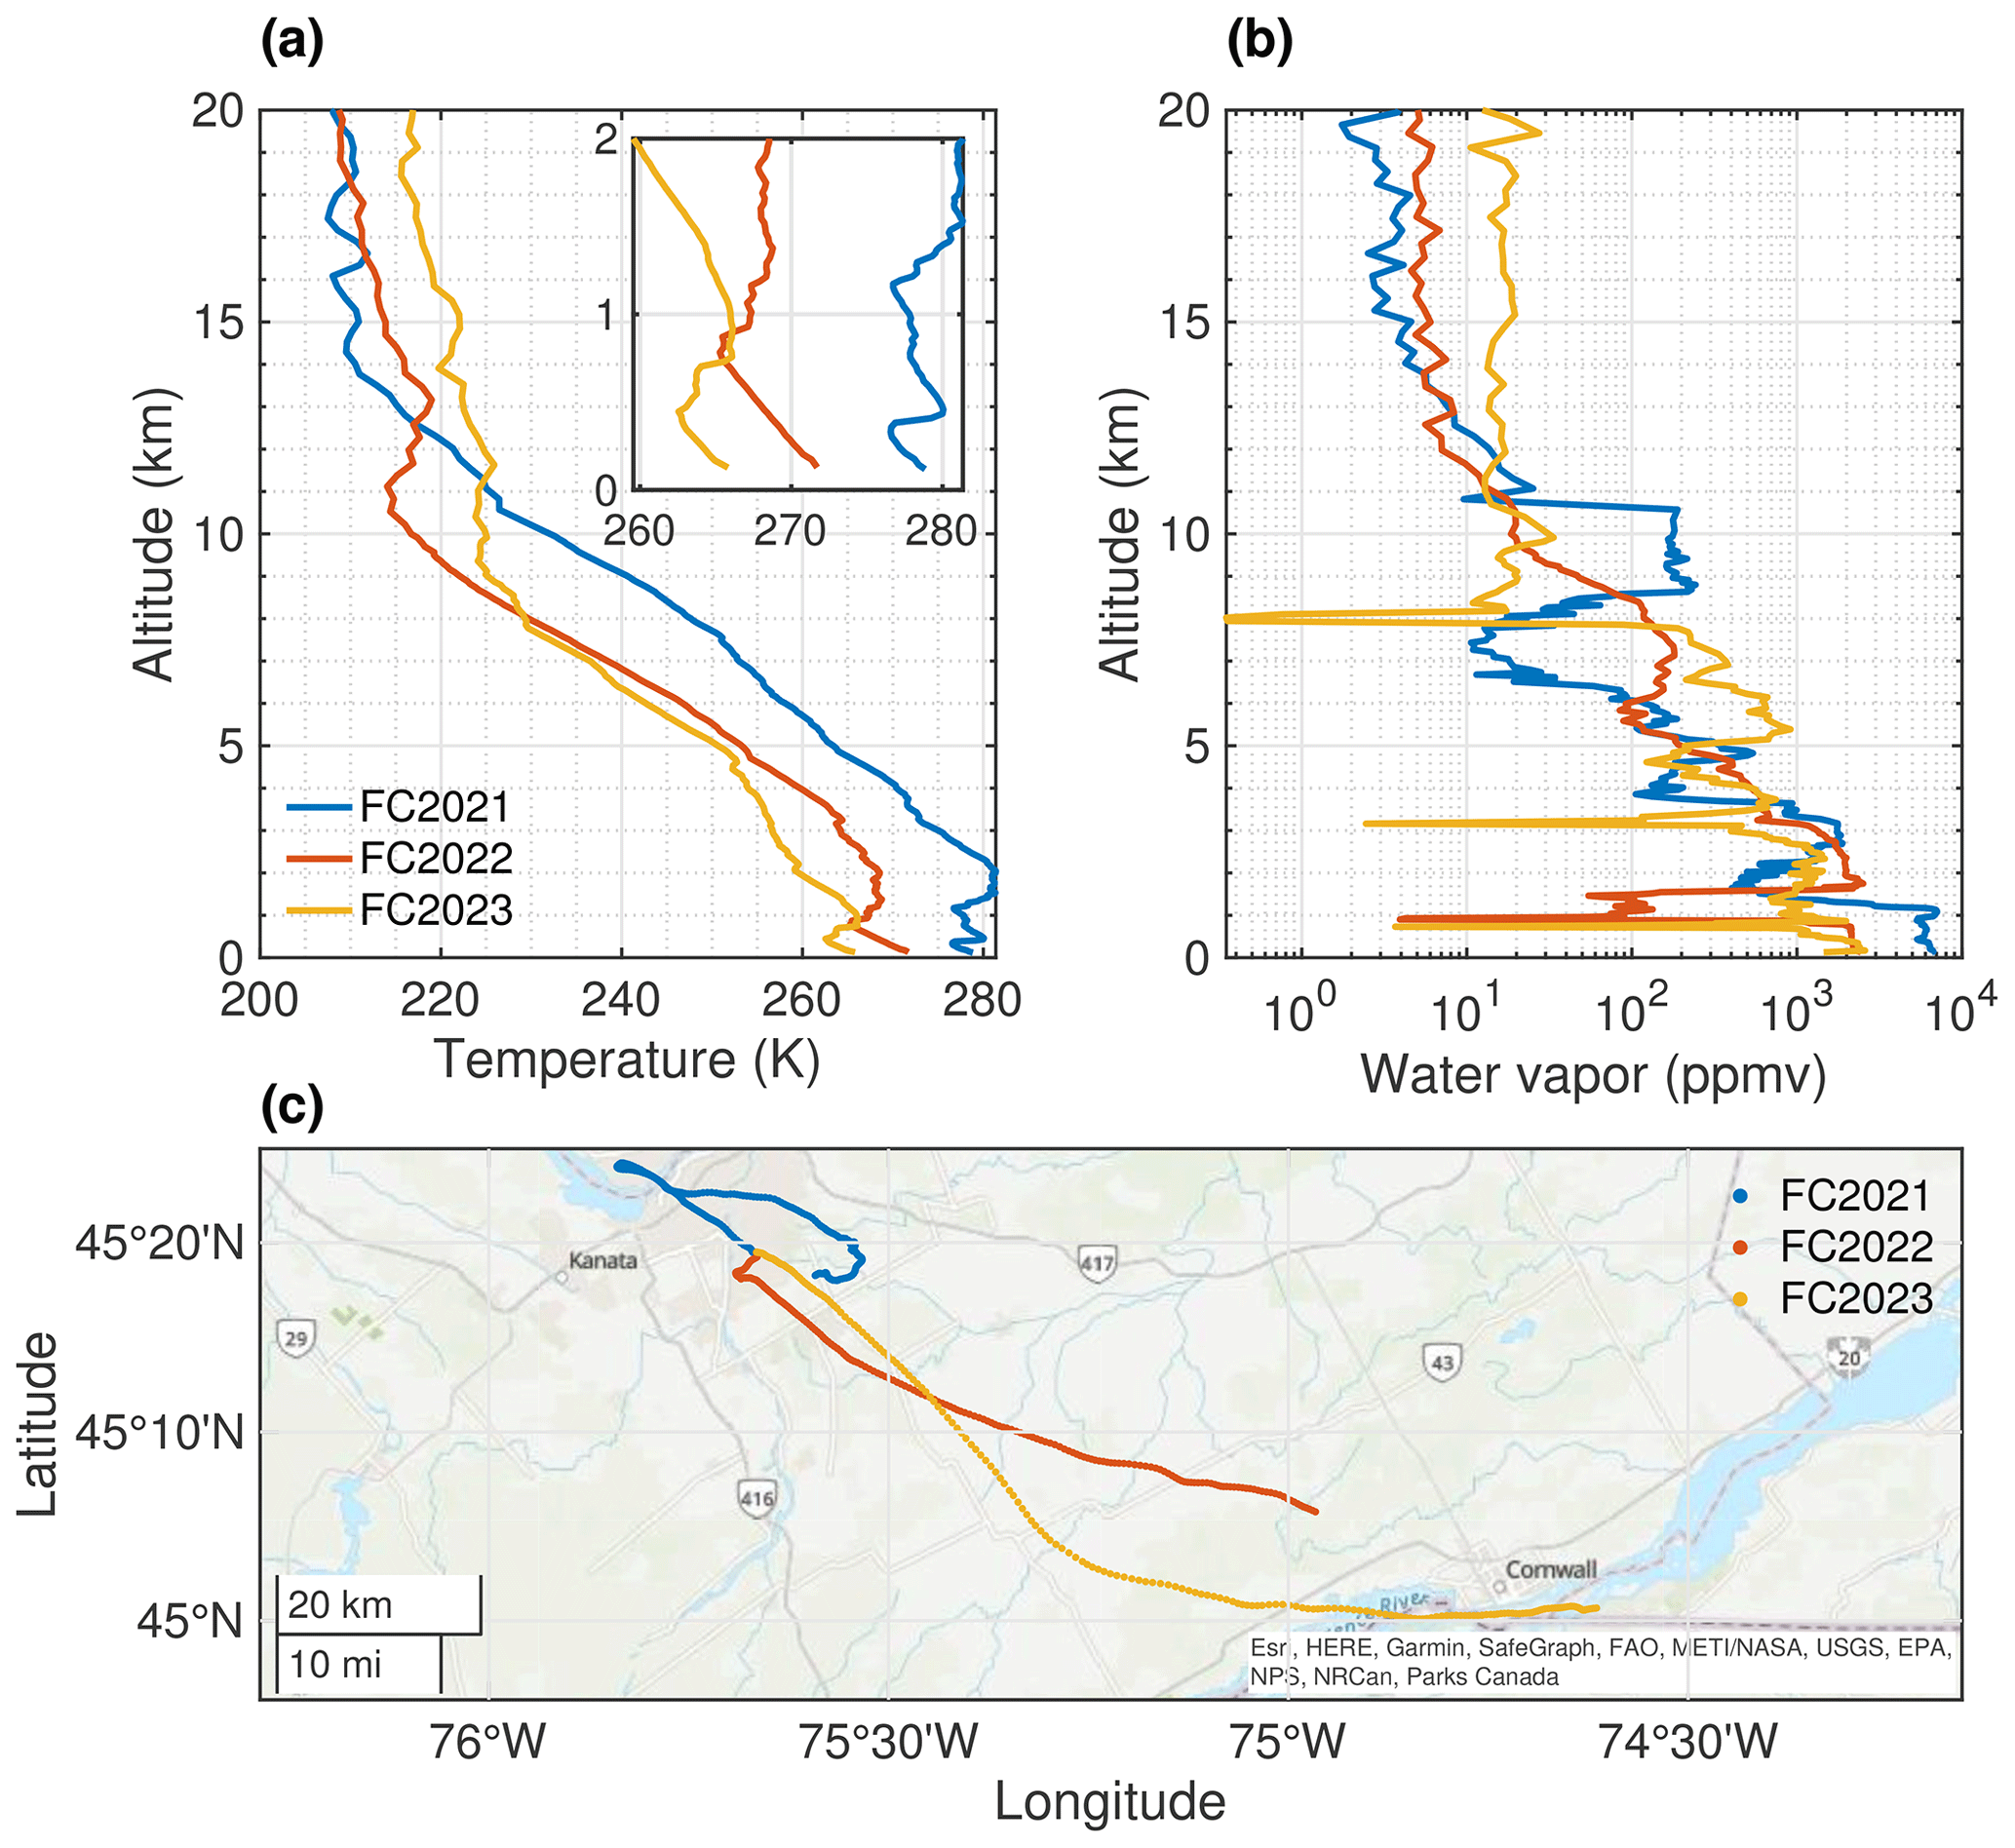
Figure 2Radiosonde in situ measurements of (a) temperature and (b) water vapor concentration profiles in the three field campaigns, together with (c) radiosonde trajectories.
In the boundary layer, temperature inversions with different inversion intensity and inversion depth were present in all three field campaigns (see the inset in Fig. 2a), e.g., the two temperature inversions around 0.4 and 1.2 km in FC2021, the temperature inversion around 0.5 km in FC2022, and the temperature inversion around 0.8 km in FC2023. Drier layers associated with the temperature inversions were also observed in all three field campaigns (Fig. 2b). Based on the temperature, dew point temperature, and water vapor profiles, the cause of the temperature inversions was subsidence. The sources and features (such as the fine vertical structure) of the temperature and water vapor anomalies exhibited in these profiles are beyond the scope of this paper but warrant future analyses.
Hourly-mean atmospheric state profiles from the fifth-generation European Centre for Medium-Range Weather Forecasts atmospheric reanalysis dataset, ERA5 (Hersbach et al., 2020), at 8 × 8 grid boxes containing the trajectory of each radiosonde (Fig. 2c), were also included for analysis of the spatial variability of temperature and water vapor concentrations. Generally, the ERA5 hourly profiles agree well with radiosonde measurements, except that they do not resolve the aforementioned dry layers, likely due to their limited vertical resolution. Considering this, we mainly use radiosonde-observed temperature and water vapor profiles for the radiative closure analyses.
A higher vertical resolution is applied in the boundary layer compared to the upper troposphere and stratosphere because the AERI ground measurements are most sensitive to the lowermost layers. To avoid interpolating radiosonde measurements, the original temperature and relative humidity profiles are updated every 5 s until the balloon reaches 3 km, then every 15 s until it reaches 10 km, and finally every 60 s until the balloon reaches 20 km. Atmospheric conditions above 50 hPa (inclusive) from ERA5 are added to the top of the radiosonde measurements to form a hybrid full profile. Temperature and water vapor concentration at over 200 levels are provided in inputs to the radiative transfer models.
2.1.2 AERI spectra
AERI measures downwelling longwave radiance (DLR) emitted from the atmosphere from 520 to 3020 cm−1, with a field of view (FOV) of 2.6°, a spectral resolution of 0.5 cm−1, and a temporal resolution of 20 s (Knuteson et al., 2004a, b). The units of radiance observed by AERI are the radiance units (RUs), representing 1 mW (m2 sr cm−1)−1. In each 20 s observation cycle, aside from taking sky-view measurements, AERI also stares at two blackbodies, an ambient blackbody at the temperature of the surrounding air, and a hot blackbody at a fixed temperature of 60 °C to radiometrically calibrate the measured DLR. In this study, the focus is on the AERI Channel 1 observations from 520 to 1800 cm−1.
Given AERI is most sensitive to atmospheric conditions in the boundary layer (Turner and Blumberg, 2018), an accurate representation of near-surface temperature and water vapor concentration profiles is essential for analyzing the radiometric accuracy of AERI. Each balloon launch exceeds 1 h, during which the thermodynamic conditions may change considerably. Consequently, the original AERI-observed spectra, with a ∼ 20 s sampling frequency, are averaged over the period from 2 min before to 8 min after the balloon launch to provide temporal sampling consistency between AERI observations (shown in Fig. 3) and radiosonde profiles.
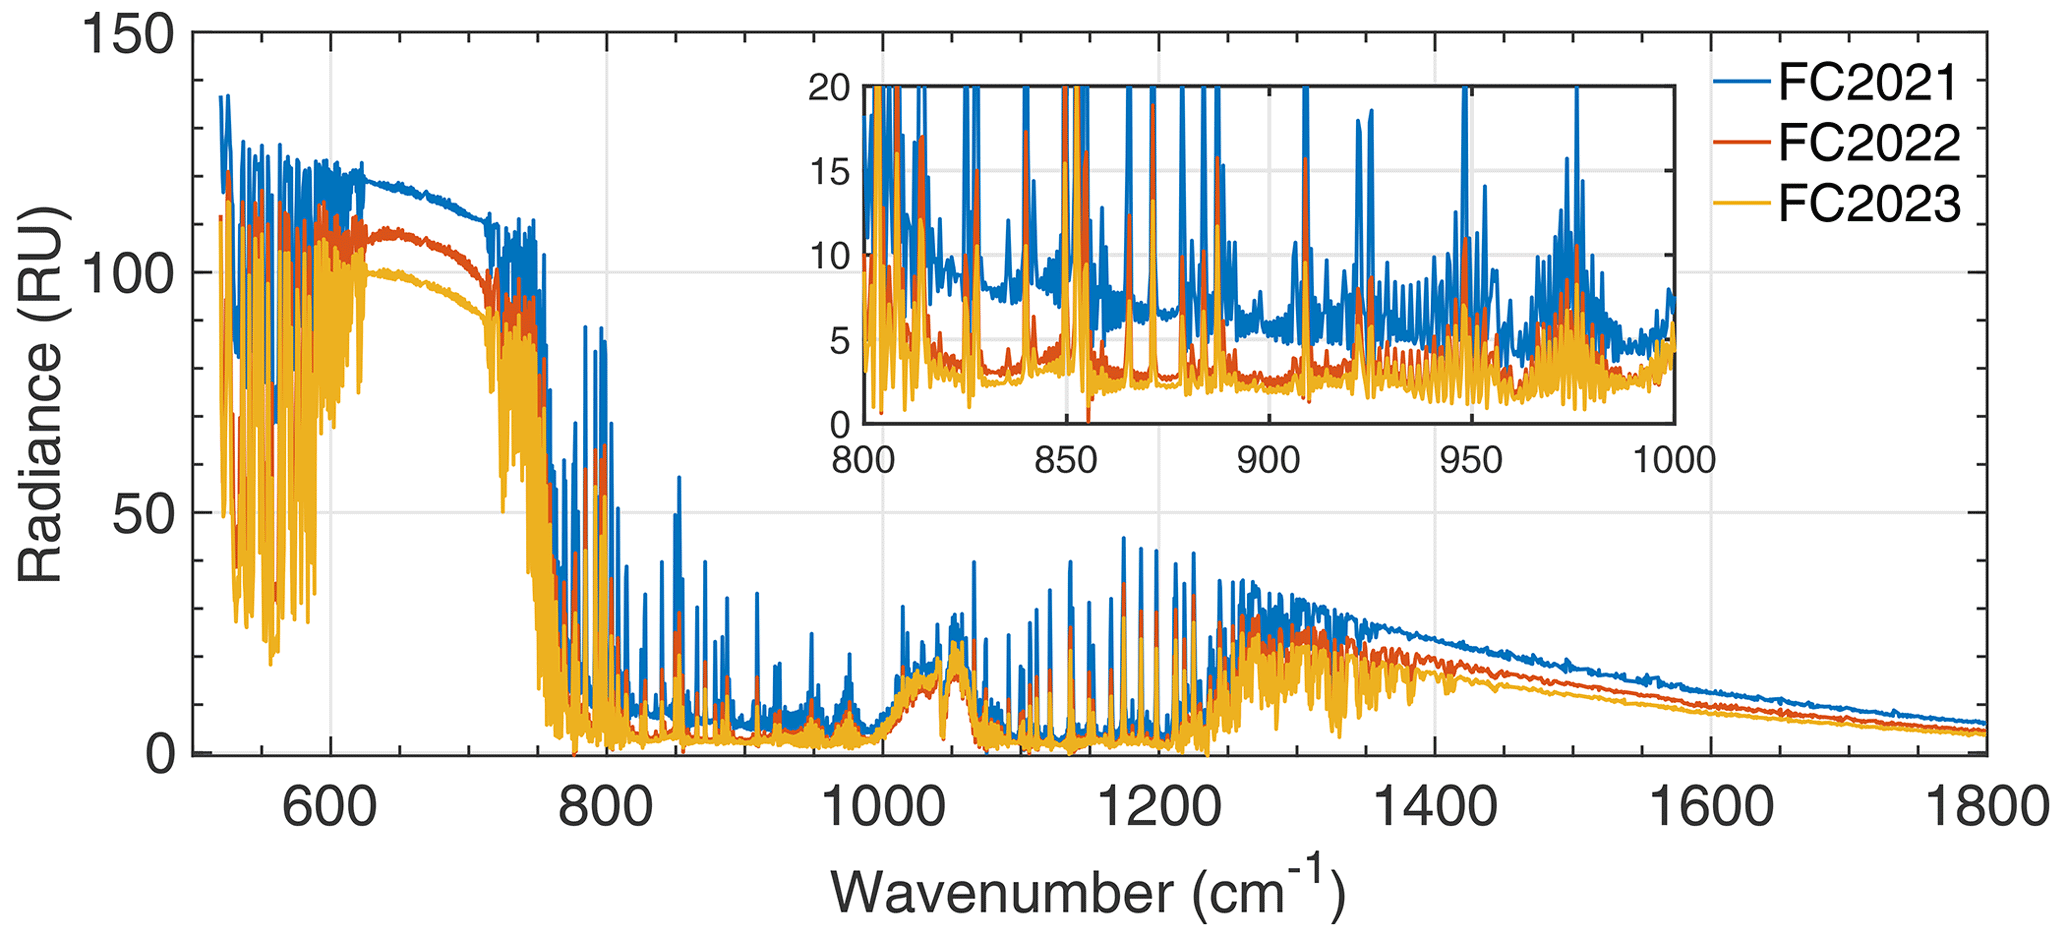
Figure 3AERI-observed spectra. The spectra are averaged over a period from 2 min before to 8 min after the time of the balloon launch (RU: radiance unit; 1 RU = 1 mW [m2 sr cm−1]−1).
The radiance in the CO2 absorption band centered at 667 cm−1 and the water vapor absorption band between 1400 and 1800 cm−1 indicates the radiating temperatures of the near-surface atmosphere. The radiance differences shown in Fig. 3 correspond to the different air temperatures during the three field campaigns. The generally low radiance in the window band (800–1200 cm−1) confirms a clear-sky condition during the three field campaigns. The radiance differences here indicate different PWV values. The radiance differences in the water vapor absorption band between 520 and 600 cm−1 also indicate the different PWV: the low PWV value of 0.32 cm in FC2023 led to very low radiance values in this spectrum.
In summary, the differences between the AERI spectra from the three field campaigns are qualitatively consistent with the differences in air temperature and water vapor concentrations.
2.1.3 HiSRAMS spectra
HiSRAMS consists of two radiometers, one targeting an oxygen absorption band and the other a water vapor absorption band. HiSRAMS can measure either single-polarized radiance over 49.6–58.3 GHz in the oxygen band and 175.9–184.6 GHz in the water vapor band or dual-polarized radiance over 52.4–57.2 GHz in the oxygen absorption band and 178.8–183.5 GHz in the water vapor band. Although dual-polarized measurements are valuable for characterizing radiance over water surfaces, this study focuses on single-polarized observations because the nadir-pointing measurements from FC2023 were mostly over land.
With its FFT filter banks, HiSRAMS achieves a spectral resolution as high as 305 kHz (Auriacombe et al., 2022). To reduce noise in brightness temperature (BT) measurements, the data were averaged to a 6.1 MHz resolution; i.e., the radiance was resampled every 20 original HiSRAMS channels. Each HiSRAMS radiometer is equipped with two FFT spectrometers: FFT0 and FFT1. In the case of single-polarization observations, both FFT spectrometers share an overlapping frequency range. For dual-polarization observations, the two FFT spectrometers have identical spectral ranges. HiSRAMS-observed spectra are calibrated regularly using measurements of a hot calibration load maintained at 80 °C as well as an ambient calibration load.
Ground-based zenith-pointing HiSRAMS observations of single-polarized spectra are averaged over the entire observation period shown in Fig. 4. As with AERI measurements, differences between HiSRAMS spectra in the oxygen and water vapor absorption bands reflect the temperature and water vapor variations in the three clear-sky field campaigns. In the opaque frequency range of about 56 GHz in the oxygen band, the effective emitting layer lies close to the surface, resulting in the observed BT representing the near-surface temperature. Greater water vapor concentration results in a higher BT in the water vapor band.
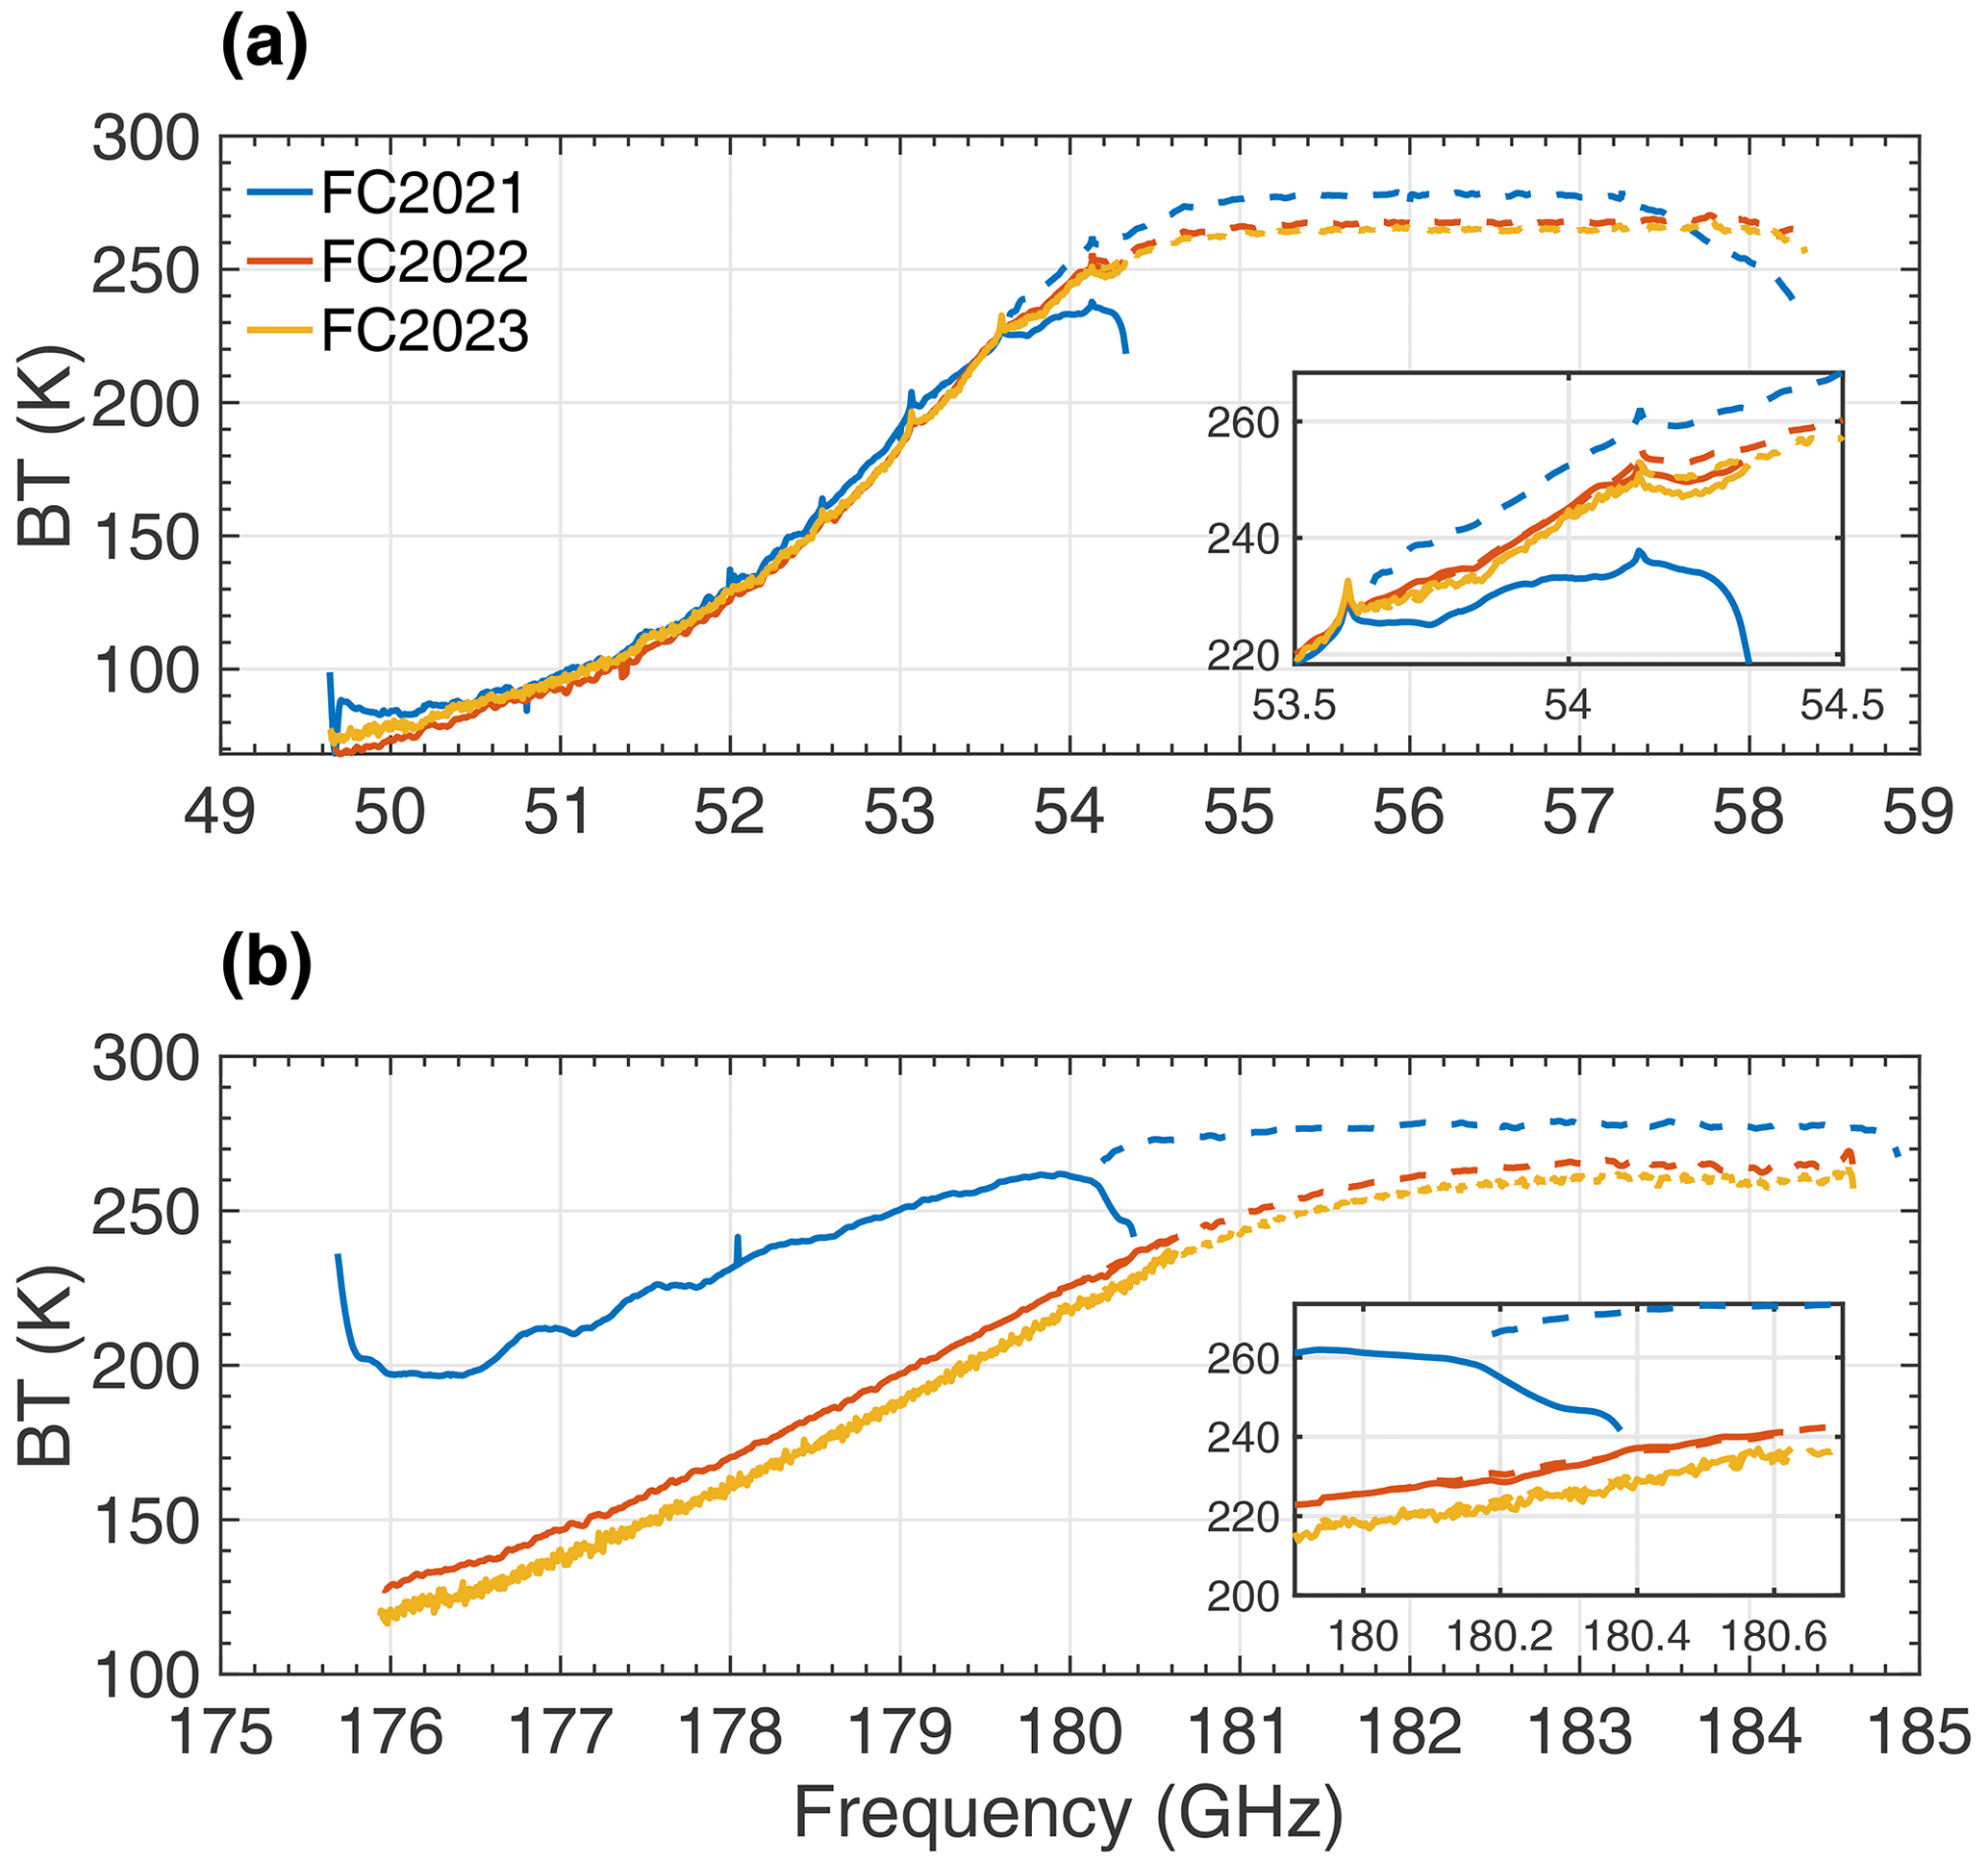
Figure 4HiSRAMS-observed ground-based zenith-pointing spectra in the (a) oxygen band and (b) water vapor band. Solid and dashed lines show the observed spectra from the two overlapping spectrometers, FFT0 and FFT1, respectively.
In Fig. 4, the observed spectra from the two FFT spectrometers are shown in solid lines (FFT0) and dashed lines (FFT1), respectively. In FC2021, unphysical signals at the edge of the spectral range were detected, herein referred to as a “roll-off” issue. This issue occurred in both FFT spectrometers, showing an overestimation of the radiance at the lower end of the frequency range and an underestimation at the higher end. Hence, discrepancies between the two spectrometers were identified within the overlapping frequency ranges in the oxygen and water vapor absorption bands (see the blue lines in the insets in Fig. 4). One cause of the roll-off issue was attributed to incomplete image rejection in channels symmetric about the local oscillator frequency (Xu et al., 2023). After a refurbishment in the summer of 2022 to improve HiSRAMS' image rejection behavior and to better characterize the image response, the discrepancies between the two FFT spectrometers were significantly reduced.
The HiSRAMS flight measurements taken during FC2023 are shown in Fig. 5. Observations in both the zenith and nadir directions were made over 10 straight-and-level flight legs on 11 February 2023, with altitudes ranging from 429 m to 6.8 km. After the HiSRAMS refurbishment, the observed spectra in the overlapping frequency range agreed well between the two FFT spectrometers in both the oxygen and water vapor absorption bands, at all flight altitudes.
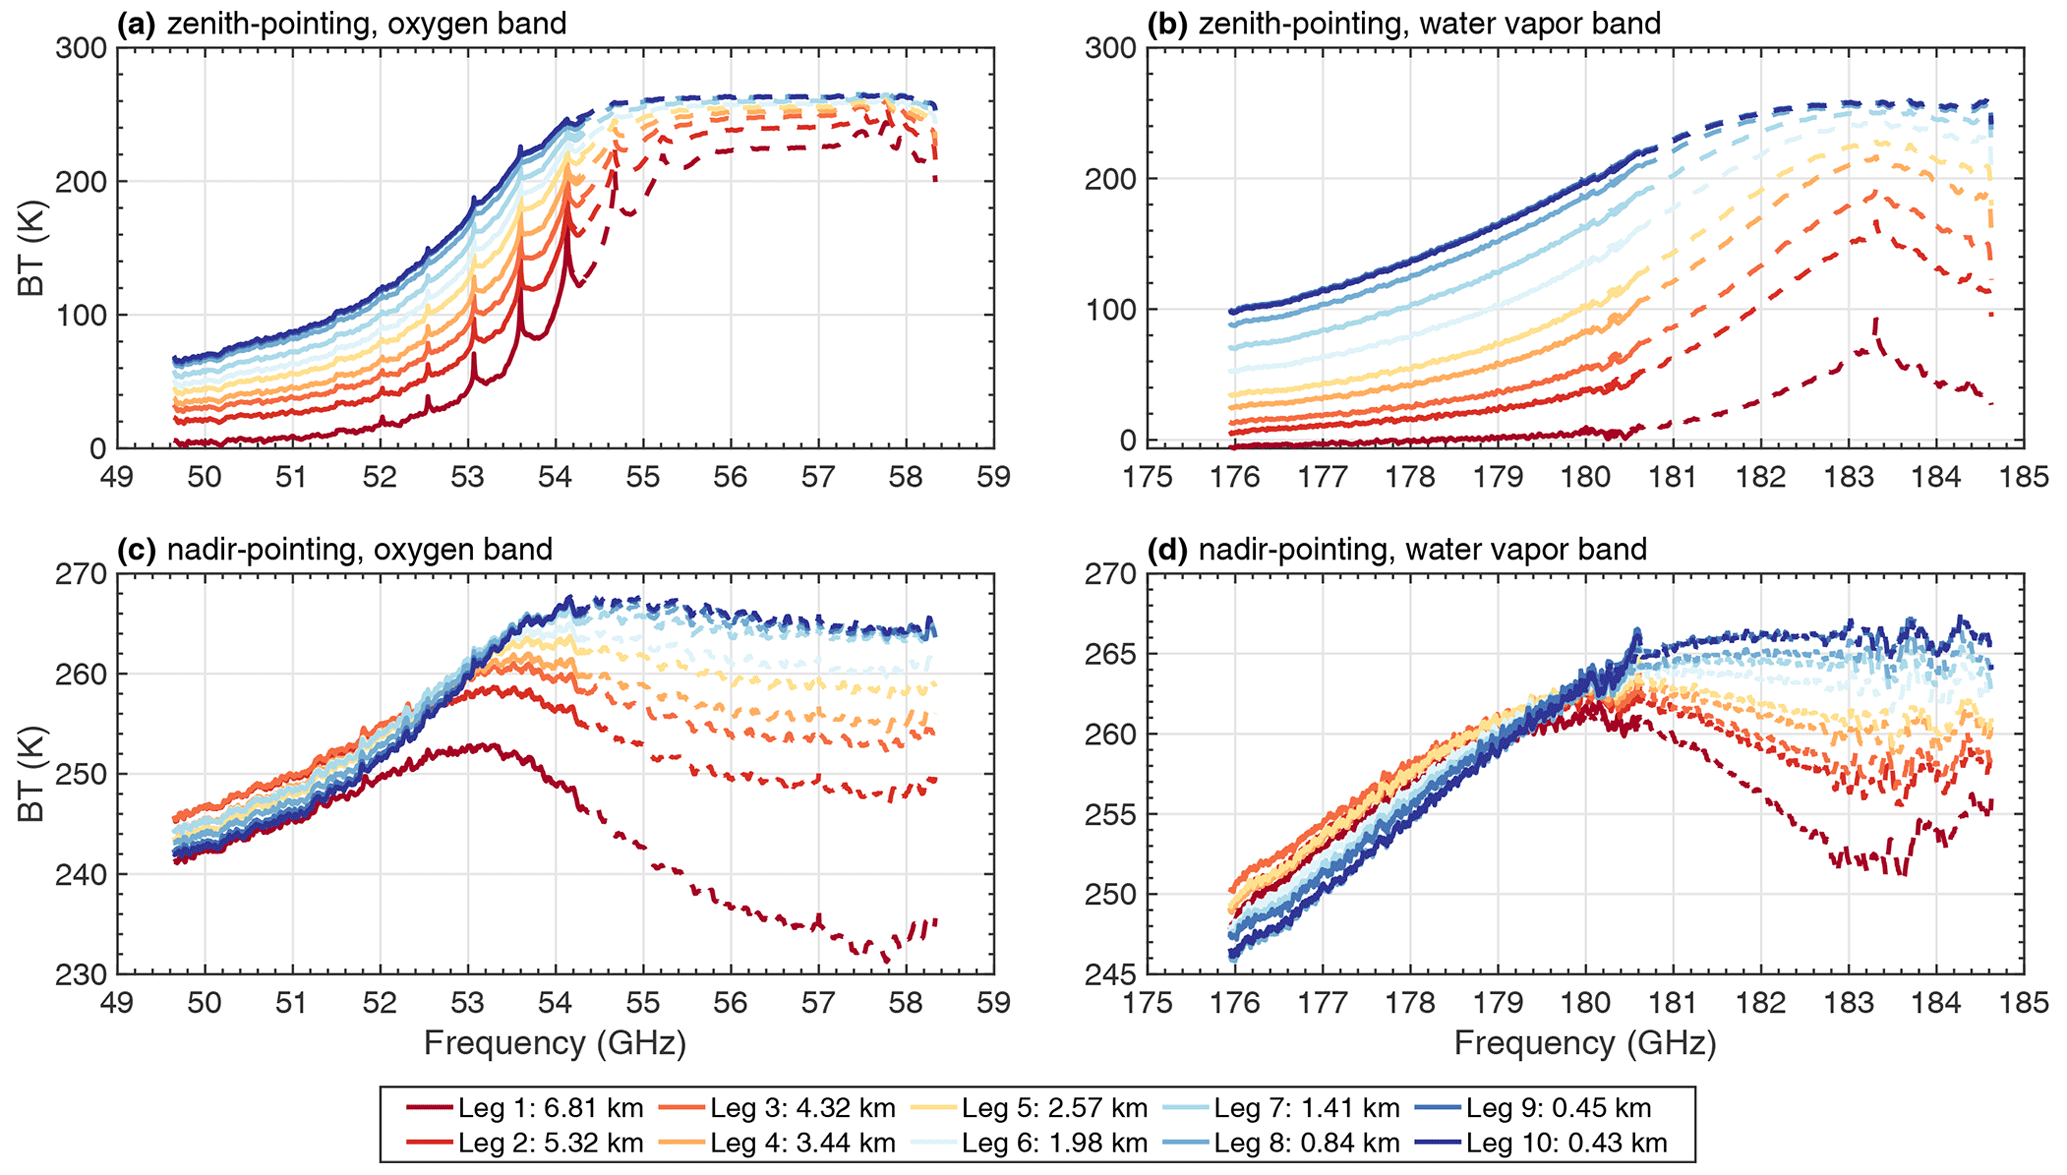
Figure 5HiSRAMS-observed spectra during FC2023 flights at different altitudes. Solid lines are for FFT0 measurements and dashed lines are for FFT1 measurements. (a, b) Zenith-pointing and (c, d) nadir-pointing spectra in the oxygen and the water vapor band, respectively.
In zenith-pointing spectra, the BT decreases with observation altitude in both the oxygen and water vapor bands (Fig. 5a, b) because of the corresponding overall decrease in temperature (and water vapor), resulting in lower emitting temperatures with increasing altitudes. In contrast, with nadir-pointing spectra in the strong absorption frequency range, e.g., 54–58 GHz in the oxygen band and 181–184 GHz in the water vapor band, the BT decreases with altitude because the emitting layer goes higher according to the τ= 1 law; i.e., the altitude corresponding to τ= 1 is where the weighting function peaks (Huang and Bani Shahabadi, 2014), resulting in a lower emitting temperature, while in the weak absorption frequency range, e.g., 49.5–52 GHz in the oxygen band and 176–179 GHz in the water vapor band, the BT increases overall with altitude as a result of competing contributions from the surface and from atmospheric emissions (Fig. 5c, d).
2.2 Forward model
In radiative closure tests, the radiometric accuracy of a radiometer is verified by comparing its measurements to synthetic spectra simulated by a radiative transfer model. The input of the temperature and water vapor concentration profiles to the radiative transfer model is taken from radiosonde measurements, as described above.
2.2.1 AERI forward model
We use the Line-by-Line Radiative Transfer Model Version 12.9 (LBLRTM v12.9, Clough et al., 2005) as the forward model for AERI synthetic spectra simulation. LBLRTM-computed monochromatic radiance spectra were convolved with the AERI scan function, enabling comparisons with AERI-measured spectra. Carbon dioxide concentrations (413.84, 418.75, and 419.72 ppmv), sourced from the global and monthly averaged marine surface values of the Global Monitoring Laboratory of the National Oceanic and Atmospheric Administration (Lan et al., 2023), remain constant across all the vertical levels. Ozone and methane concentration profiles were taken from the ERA5 reanalysis dataset and the Copernicus Atmosphere Monitoring Service (CAMS) global atmospheric composition forecast dataset (Inness et al., 2019), respectively. No CFC11 and CFC12 were prescribed in the synthetic spectra calculations. We undertook a comparison between the most recent version of LBLRTM, v12.16, and the version we chose, v12.9. The primary distinction arises within the far-infrared spectral range, where AERI observations exhibit a relatively large measurement uncertainty attributed to inadequate calibration at the spectral detector's edge (see a detailed description in Sect. S1 of the Supplement).
2.2.2 HiSRAMS forward model
The HiSRAMS forward model (Bliankinshtein et al., 2019) consists of two major components, the Rosenkranz gas absorption parameterization (Rosenkranz, 2017) and an efficient plane-parallel radiative solver that excludes multiple scattering but accounts for surface polarization. A sea surface emissivity model is used as an example boundary condition for nadir-pointing measurements. The forward model was validated against the Monochromatic Radiative Transfer Model, MonoRTM (Clough et al., 2005), and the Atmospheric Radiative Transfer Simulator, ARTS (Eriksson et al., 2011). To avoid uncertainty with regard to the surface contribution in the closure tests, nadir-pointing measurements taken at the lowest flight altitude (429 m) were employed as the boundary condition (i.e., elevating the surface to this altitude). The nadir-pointing measurement taken by HiSRAMS at 429 m already includes the contribution from the surface (i.e., the product of the surface emissivity and the blackbody emission at the effective skin temperature plus the reflected atmospheric downwelling radiation) as well as the impact of the atmosphere below 429 m. The boundary emissions propagating upwards, along with emissions from the atmosphere, constitute simulated measurements at higher flight legs.
2.3 Radiative closure diagnosis
In this study, the radiance or BT bias is defined as the instrument-measured radiance or BT minus the forward model-simulated radiance or BT, which provides a metric for evaluating the radiance closure:
The bias uncertainty derives from the instrument measurement uncertainty and model simulation uncertainty:
The instrument measurement uncertainty for AERI is 1 % of ambient blackbody radiance (3-σ), which is its absolute radiometric calibration accuracy (Knuteson et al., 2004a). For HiSRAMS measurements, if multiple individual measurements are averaged, the standard deviation of any individual measurements during the whole observational period is considered to be the uncertainty of the HiSRAMS-averaged measurements, which is applied to HiSRAMS ground measurements in FC2021 and FC2022 and flight measurements in FC2023. If only the individual observed spectrum is available, i.e., FC2023 HiSRAMS ground measurements, its uncertainty is determined by taking into account the radiometric noise characterized by the noise-equivalent differential temperature, calibration load imperfections, detector nonlinearity error, and instrument drift (Bliankinshtein et al., 2023a). Both the forward model uncertainty and the uncertainties associated with the input variables contribute to the total uncertainty in model simulations. Input uncertainties include radiosonde (instrumental) measurement errors and those arising from the spatial variability of the input profiles due to radiosonde drift. Both uncertainties are combined in quadrature similar to Eq. (2). We used the ERA5 hourly-mean profile within the 8 × 8 grid box rectangular region, including the balloon trajectory (Fig. 2c), to represent the spatial variability of the temperature and relative humidity profiles.
Randomly generated noise, accounting for both random errors, including radiosonde repeatability errors and the radiosonde drifting errors derived from ERA5 spatial variability in temperature and relative humidity, was added to the radiosonde profiles for each case. In total, 1000 profiles were created with this random noise. Subsequently, a single randomly determined radiosonde reproducibility error was added to each generated profile. Using radiative Jacobians, we determined the radiance or BT difference between using the original radiosonde profiles and using the randomly generated profiles as inputs. The standard deviation of the radiance or BT simulation from the 1000 generated profiles was utilized to represent the 1-σ model-simulated uncertainty. In all uncertainty analyses in the following discussion, the σ level is set to 3 standard deviations (99.7 % confidence level).
3.1 AERI
The DLR observed by AERI is most strongly influenced by the near-surface atmospheric thermodynamic state. Quality control of the AERI spectra was performed following Liu et al. (2022). For example, strong CO2 and water vapor absorption channels subject to calibration errors were excluded in this analysis following the optical depth screening procedure of Liu et al. (2022).
Figure 6 exhibits the AERI radiative closure test results. Overall, the uncertainty in the DLR bias for AERI mainly derives from LBLRTM simulation uncertainties in the temperature-sensitive bands. In the window band, both measurement uncertainty and LBLRTM simulation uncertainty contribute to the total uncertainty.
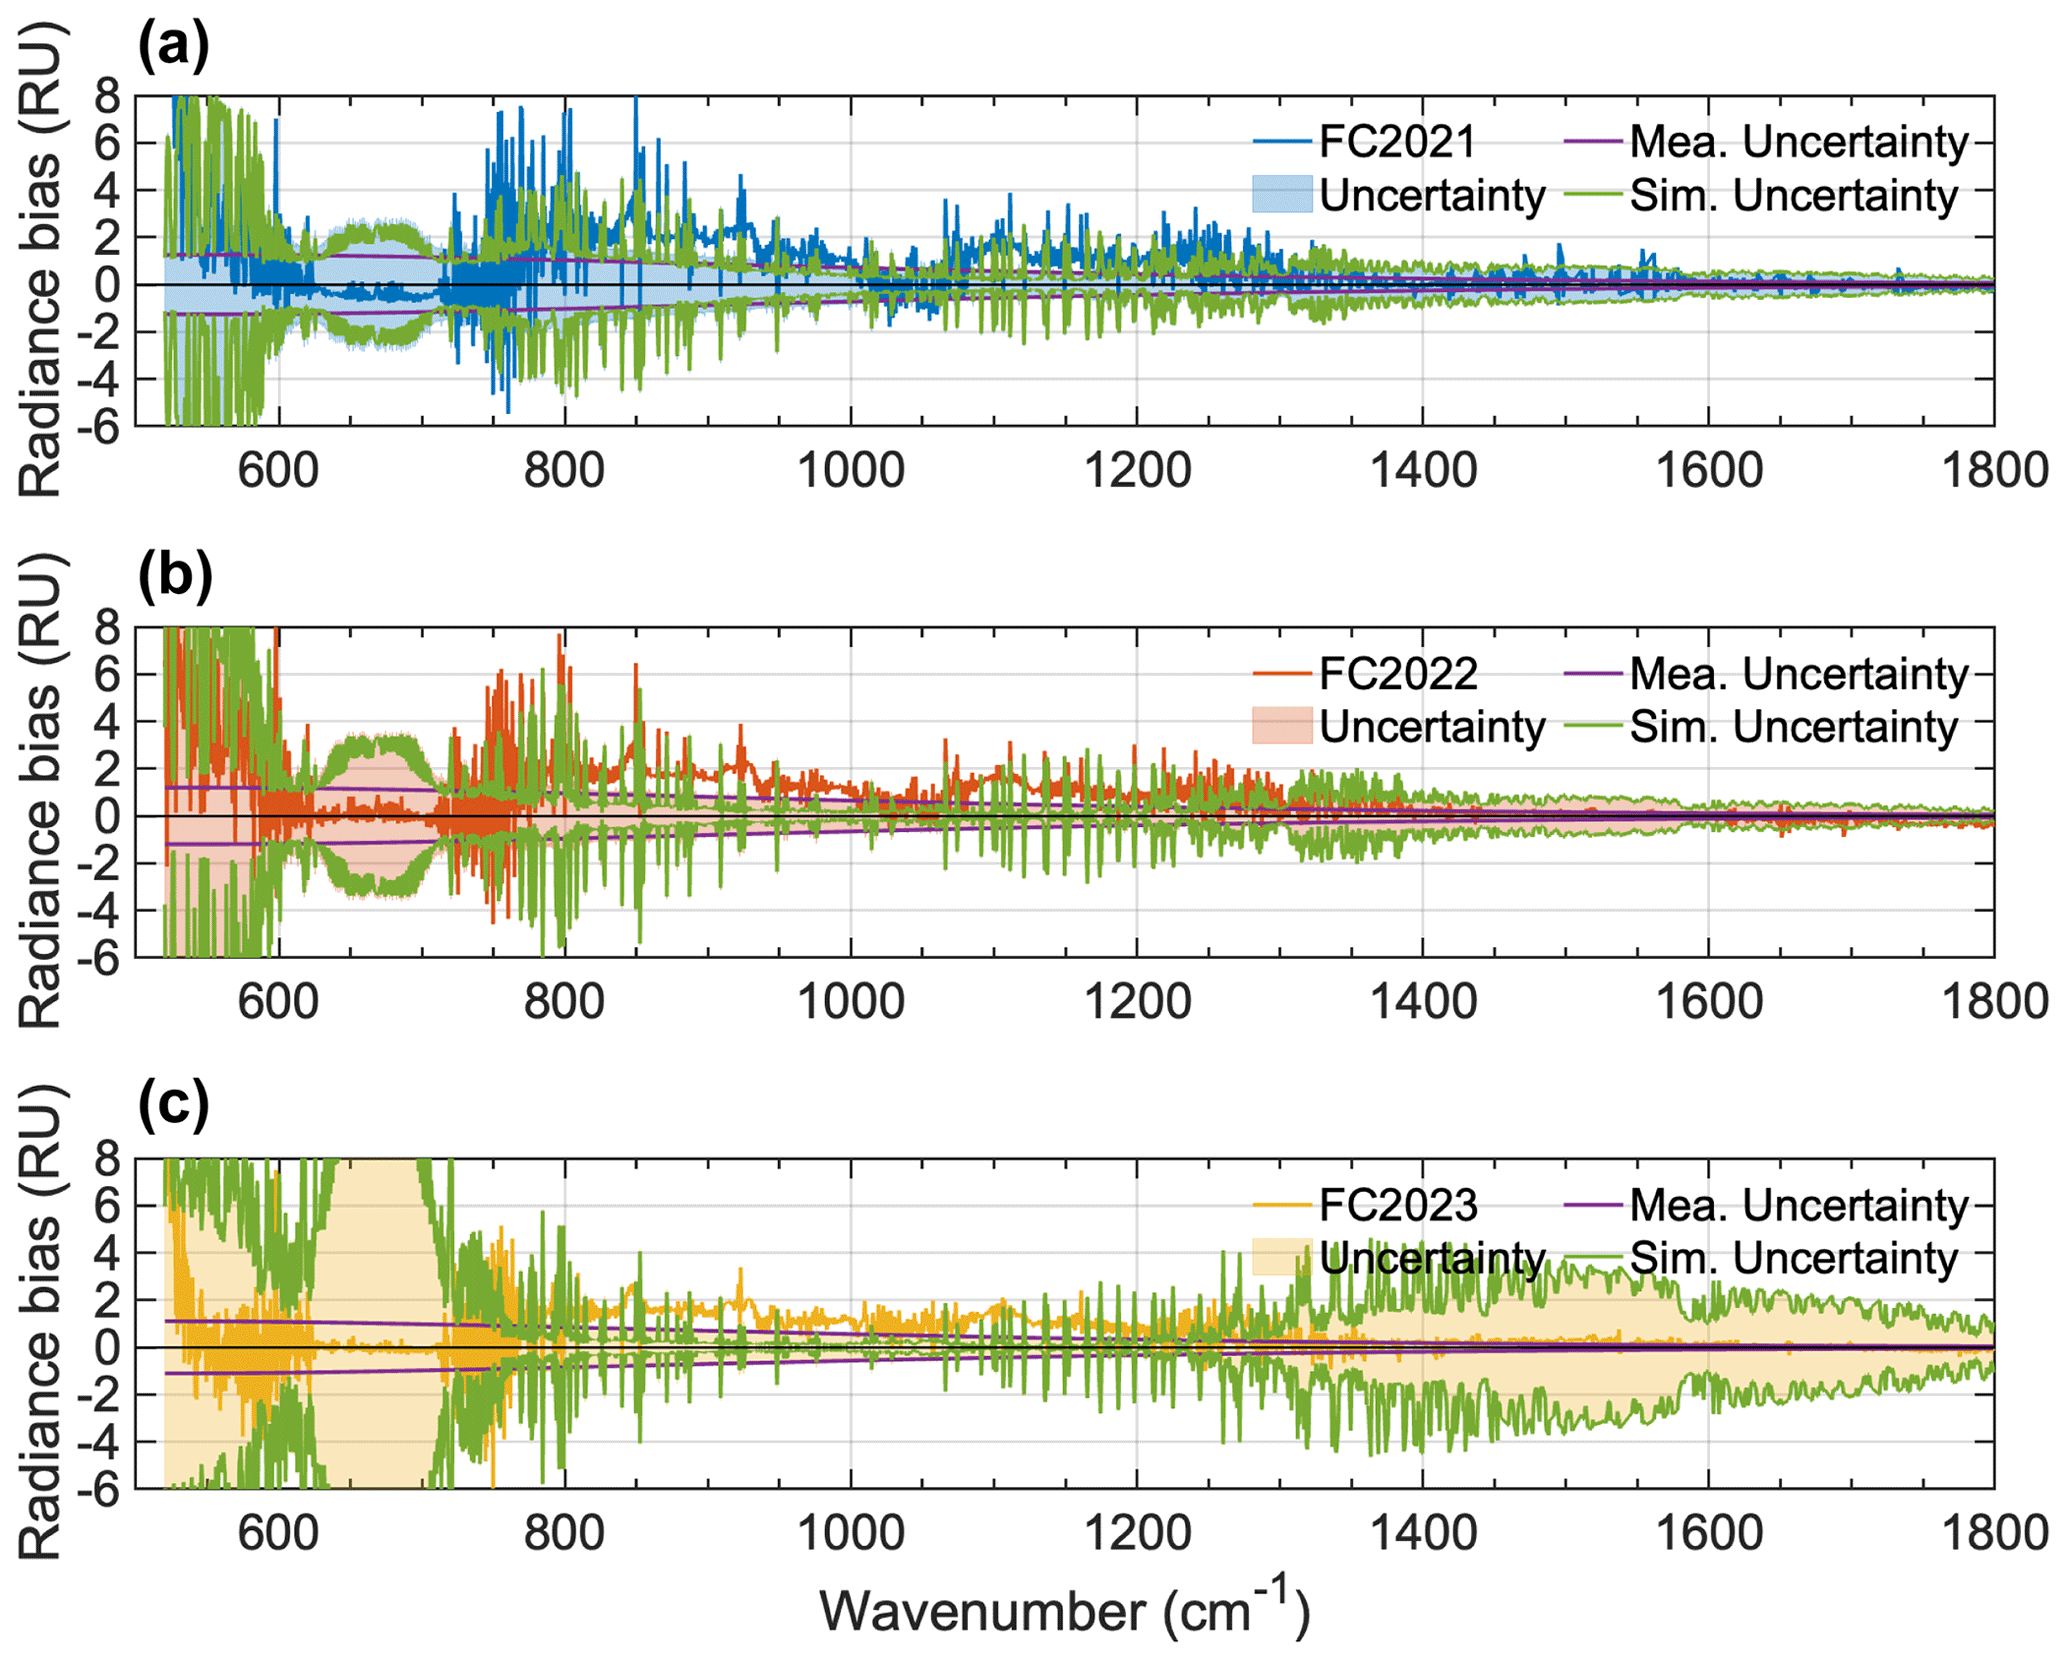
Figure 6AERI radiative closure test results. Each panel represents one field campaign. The blue line in panel (a), the orange line in panel (b), and the yellow line in panel (c) represent the DLR bias between 10 min averaged AERI-observed and LBLRTM-simulated spectra. The purple lines and the green lines represent the AERI measurement uncertainty and LBLRTM simulation uncertainty, respectively. The shadings represent the total DLR bias uncertainty.
Good agreement between 10 min averaged AERI-observed spectra and LBLRTM-simulated spectra was observed in the CO2 absorption band centered around 667 cm−1 and the water vapor absorption band of 1400–1800 cm−1, controlled primarily by atmospheric temperature, indicating excellent closure between the radiance measurements of AERI and the temperature profiles collected by radiosondes.
Over the three field campaigns, a persistent and stable positive DLR bias in the window band was detected, with the mean biases from the three campaigns (blue line in Fig. 7) far exceeding their standard deviation (orange line in Fig. 7). Across many channels in the window band, the sigma level exceeds 4, indicating a more than 99.99 % likelihood that the bias mean will exceed the bias standard deviation for these three field campaigns. Moreover, the DLR bias in the window band in each of the field campaigns is larger than the DLR bias uncertainty (Fig. 6). Because of the low BT in the window band, even a small radiance bias leads to a relatively large BT bias (Fig. 7b). In this band, the radiance is primarily controlled by water vapor, aerosols, and clouds (Hansell et al., 2008; Seo et al., 2022). Through sensitivity tests (not shown), the bias was unlikely to be explainable by possible errors in the radiosonde water vapor measurements: over 150 % of the original water vapor concentration in all the vertical layers would be needed to remove this bias (not shown). The presence of optically thin aerosols or clouds with an optical depth of ∼ 0.06 at the altitude with a higher relative humidity may explain the magnitude of this bias. However, the almost constant values of this bias across all three field campaigns make this hypothesis less likely.
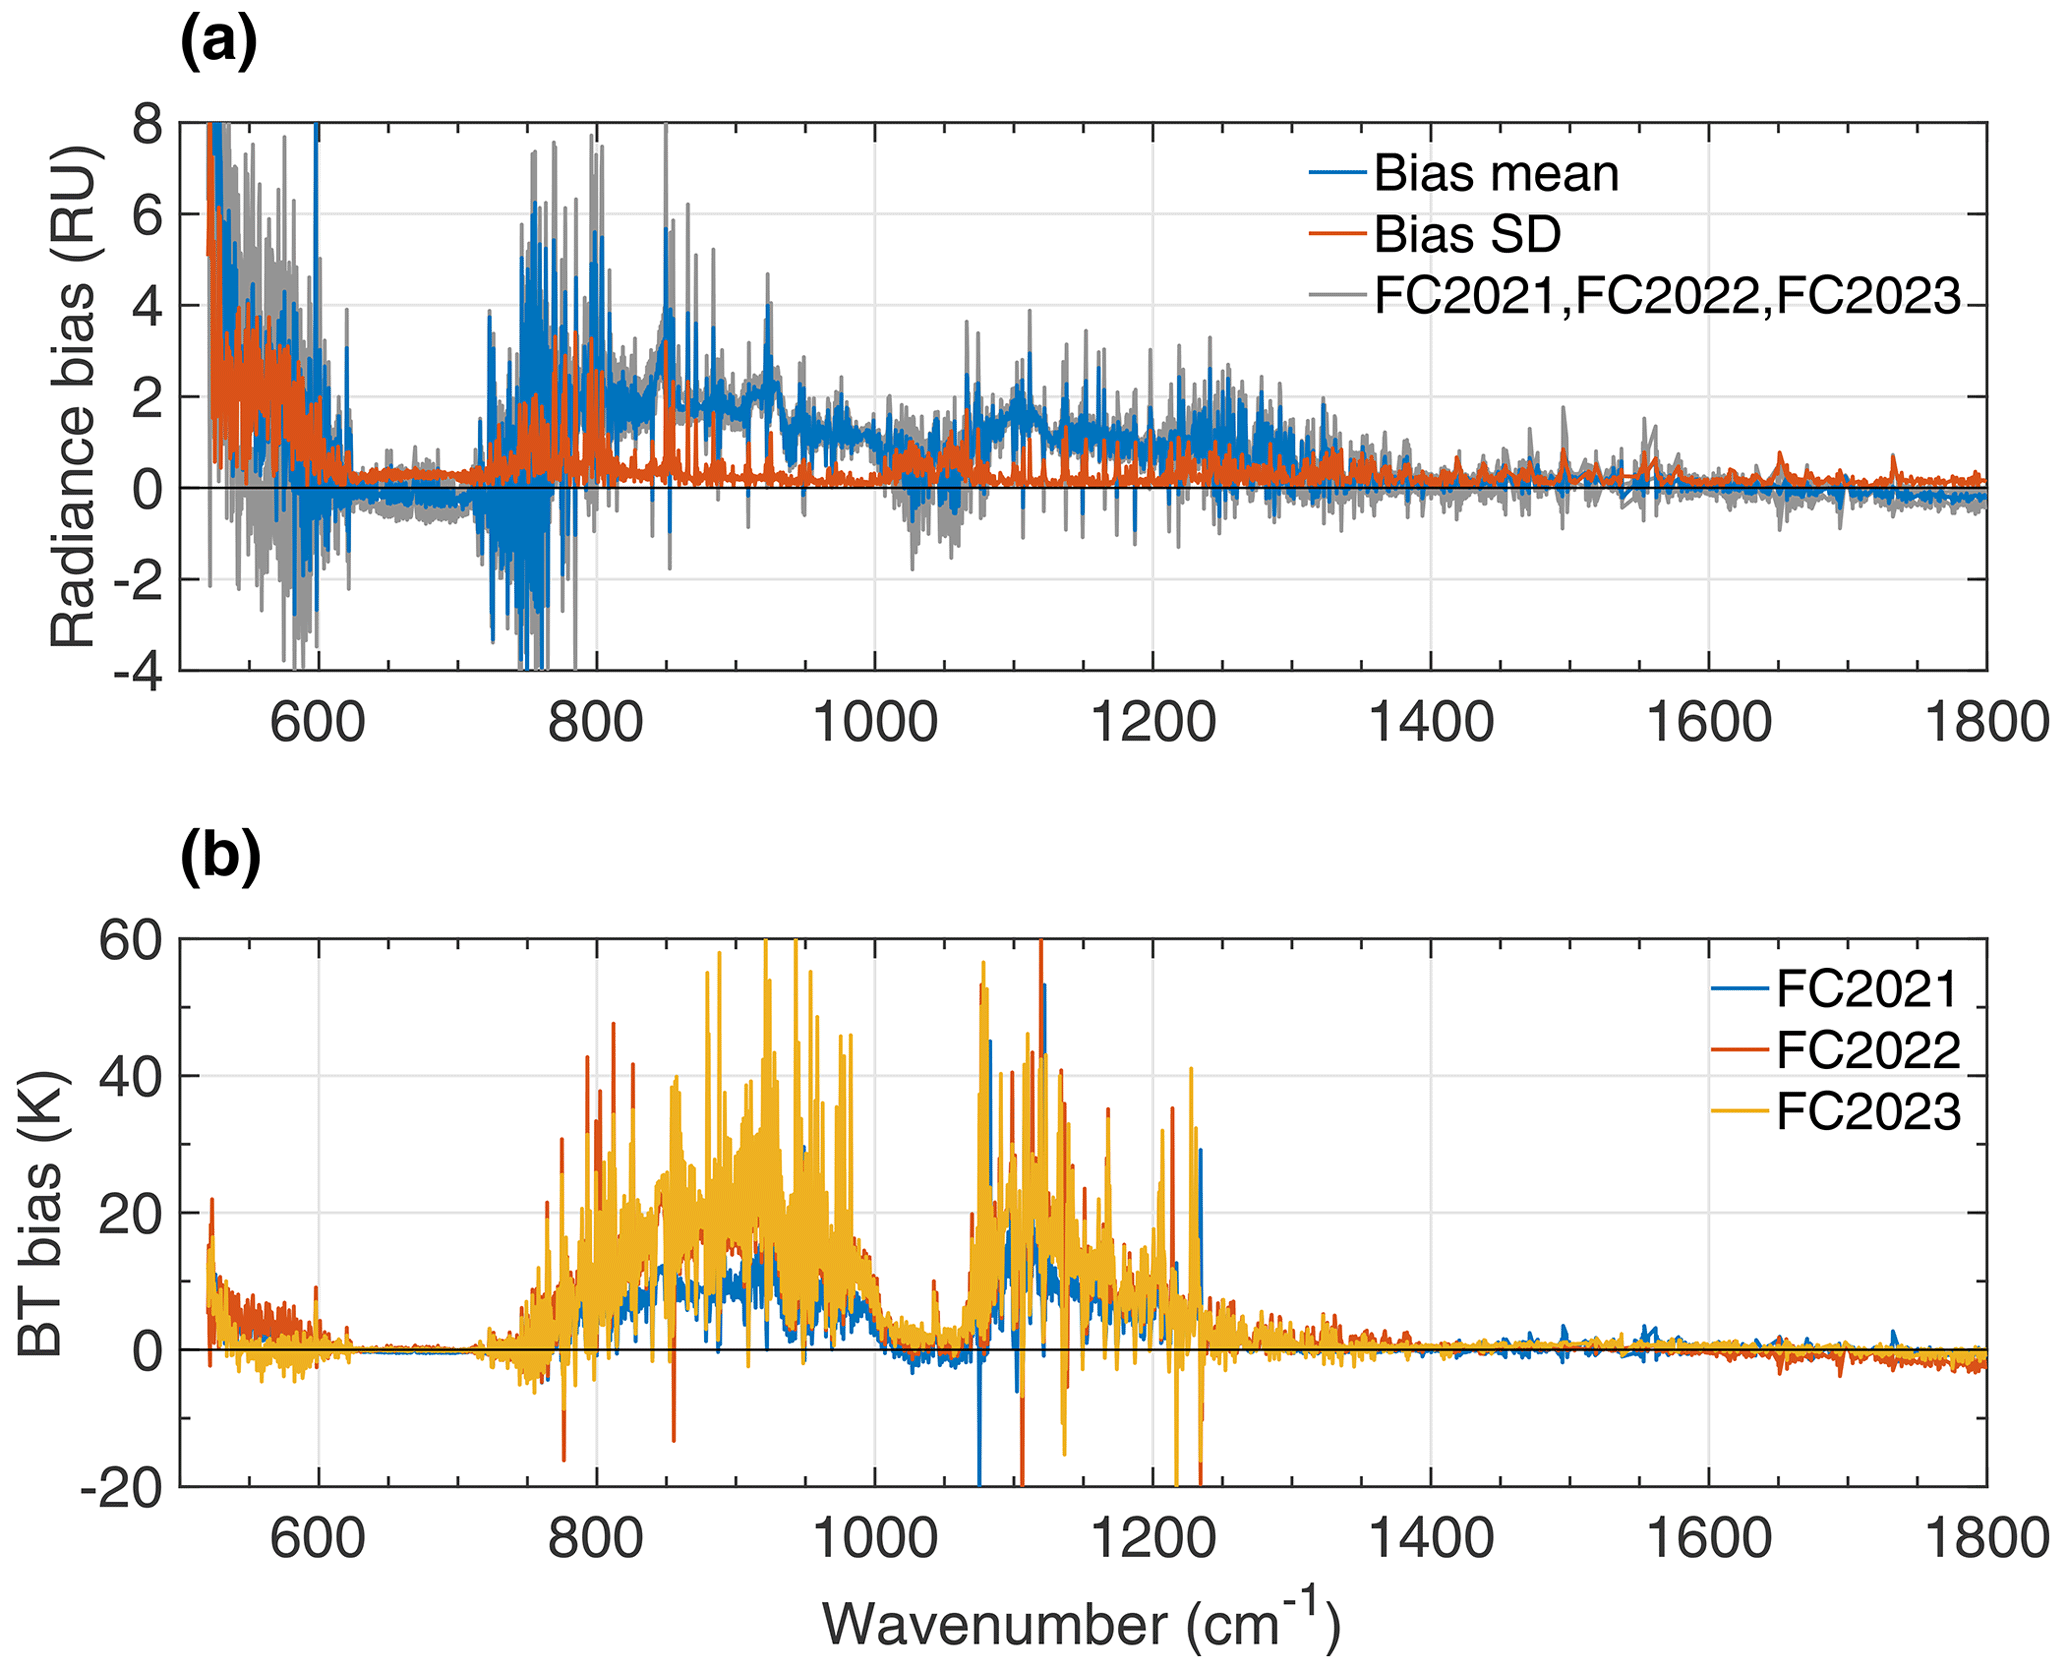
Figure 7AERI radiative closure test results. (a) DLR bias. The grey lines show the DLR difference between 10 min averaged AERI-observed spectra and the LBLRTM-simulated synthetic spectra in the three campaigns. The blue line and the orange line represent the mean and standard deviation, respectively, of the DLR differences. (b) BT bias.
It is interesting to note that historical AERI data measured elsewhere have also exhibited relatively large biases in the window band under clear-sky conditions (Liu et al., 2022; Delamere et al., 2010). A FOV obstruction could introduce a positive radiance bias into the window band due to radiance leakage from the obstructive element having an emitting temperature higher than the scene temperature in the window band under clear-sky conditions (Turner, 2003). Based on a sensitivity test, the portion of obstructed FOVs needed to explain this warm bias in the window band is around 2 % (not shown). Since all three field campaigns targeted cold and dry clear-sky atmospheric conditions whose calibration extrapolation process introduces larger uncertainties, it is also possible that calibration bias, e.g., the nonlinearity-induced inaccuracy, accounts for the radiance bias in the window band. Lower radiance in the window band draws the extrapolation further away from the blackbodies' emitted radiance, resulting in a larger calibration bias. However, whether the calibration process could lead to a consistent positive DLR bias in the window band is unknown.
As a result, a systematic, consistent warm radiance bias in the window band for AERI clear-sky observations is present and removable for future retrieval analysis by subtracting the bias mean in channels whose radiance bias means (blue line in Fig. 7a) are larger than their radiance bias standard deviation (orange line in Fig. 7a). This correction is referred to as the AERI warm bias correction.
3.2 HiSRAMS
Radiative closure tests were performed on both the ground-based zenith-pointing measurements and the flight measurements of HiSRAMS. In light of the roll-off error in the FC2021 measurements previously noted, the following discussions focus on the results of FC2022 and FC2023, which show a better closure in both the oxygen and water vapor absorption bands at the frequency edges of each FFT spectrometer after the HiSRAMS refurbishment (Fig. 8). The radiative closure results for ground measurements in FC2022 and FC2023 as well as flight measurements in FC2023 are shown in Figs. 9 and 10, respectively. The two methods mentioned in Sect. 2.3 to determine the uncertainty of HiSRAMS ground measurements result in similar measurement uncertainties (purple lines in Fig. 9), except for the significant measurement uncertainty at the edge of FFT1 for both the oxygen and water vapor bands in FC2022, whose source is the remaining roll-off issue. This indicates that the frequency range with large measurement uncertainty, computed from the standard deviations of individual spectra, should be discarded in future retrieval analysis.
Figure 8HiSRAMS-observed ground-based zenith-pointing spectral BT bias for the (a) oxygen band and (b) water vapor band. Solid and dashed lines show the observed spectra from FFT0 and FFT1, respectively.
Figure 9The ground-based zenith-pointing HiSRAMS radiative closure test results for the (a, c) oxygen band and (b, d) water vapor band. Orange lines in panels (a) and (b) and yellow lines in panels (c) and (d) represent the BT bias. In each panel, the shading represents the total uncertainty of the BT bias, while the purple and green lines represent the measurement uncertainty and simulation uncertainty, respectively.
Figure 10BT bias for FC2023 flight measurements at different observational altitudes. (a, b) Zenith-pointing BT bias in the oxygen and water vapor bands, respectively. (c, d) Nadir-pointing BT bias in the oxygen and water vapor bands, respectively.
The primary contribution to the radiative closure uncertainty in the weak absorption frequency range (50–54 GHz) of the zenith-pointing oxygen band radiometer is the measurement uncertainty. However, in the strong absorption frequency range (55–58 GHz), the simulation uncertainty could be similar to or larger than the measurement uncertainty, depending on the uncertainties in the vertical temperature profiles. The zenith-pointing BT bias in the strong absorption frequency range (55–58 GHz) is relatively small, falling within the radiative closure uncertainty (Fig. 9a and c). However, in the weak absorption channels (50–54 GHz), a notable BT bias occurs which exceeds the 3-σ BT bias uncertainty. In FC2022 and FC2023, the BT bias for both ground and flight zenith-pointing measurements in the oxygen band has similar spectral shapes and magnitudes (except for leg-1 FC2023 flight measurements; these suffer from a large calibration bias discussed later), suggesting a systematic bias, which may come from the calibration process. The zenith-pointing BT biases in the oxygen band, excluding the leg-1 FC2023 flight measurements, exhibit a mean BT bias larger than the standard deviation of the BT biases (Fig. 11), supporting the hypothesis that the bias may be systematic.
Figure 11HiSRAMS radiative closure results for the zenith-pointing oxygen band measurements from FC2022 and FC2023 ground measurements as well as FC2023 flight measurements. The grey lines represent individual BT biases for different conditions. The blue and orange lines represent the mean BT bias and the standard deviation of the BT biases, respectively.
Compared to the oxygen band radiometer's zenith-pointing BT bias uncertainty, simulation uncertainty primarily contributes to the radiative closure uncertainties in the water vapor band radiometer's zenith-pointing BT bias. A relatively smaller BT bias was present in the strong water vapor absorption band (182–184 GHz) in zenith-pointing ground measurements (Fig. 9b and d). There is a positive BT bias for both FC2022 and FC2023, with different magnitudes, in the weak absorption band at 176–180 GHz (Fig. 9b and d). This bias is within the 3-σ BT bias uncertainty. Measurements in different flight legs in FC2023 also show different BT biases in the water vapor absorption band (Fig. 10b). Flight legs at lower altitudes tend to have positive BT biases; those in higher-altitude legs tend to have negative BT biases, which suggests that these biases may be environment-dependent. The correlation coefficients between the environmental temperature from radiosonde temperature measurements and the channel-averaged BT biases for FFT0 and FFT1 in the water vapor band are 0.90 and 0.87, respectively (Fig. 12), suggesting that the source of the HiSRAMS bias in the water vapor absorption band is related to the calibration processes.
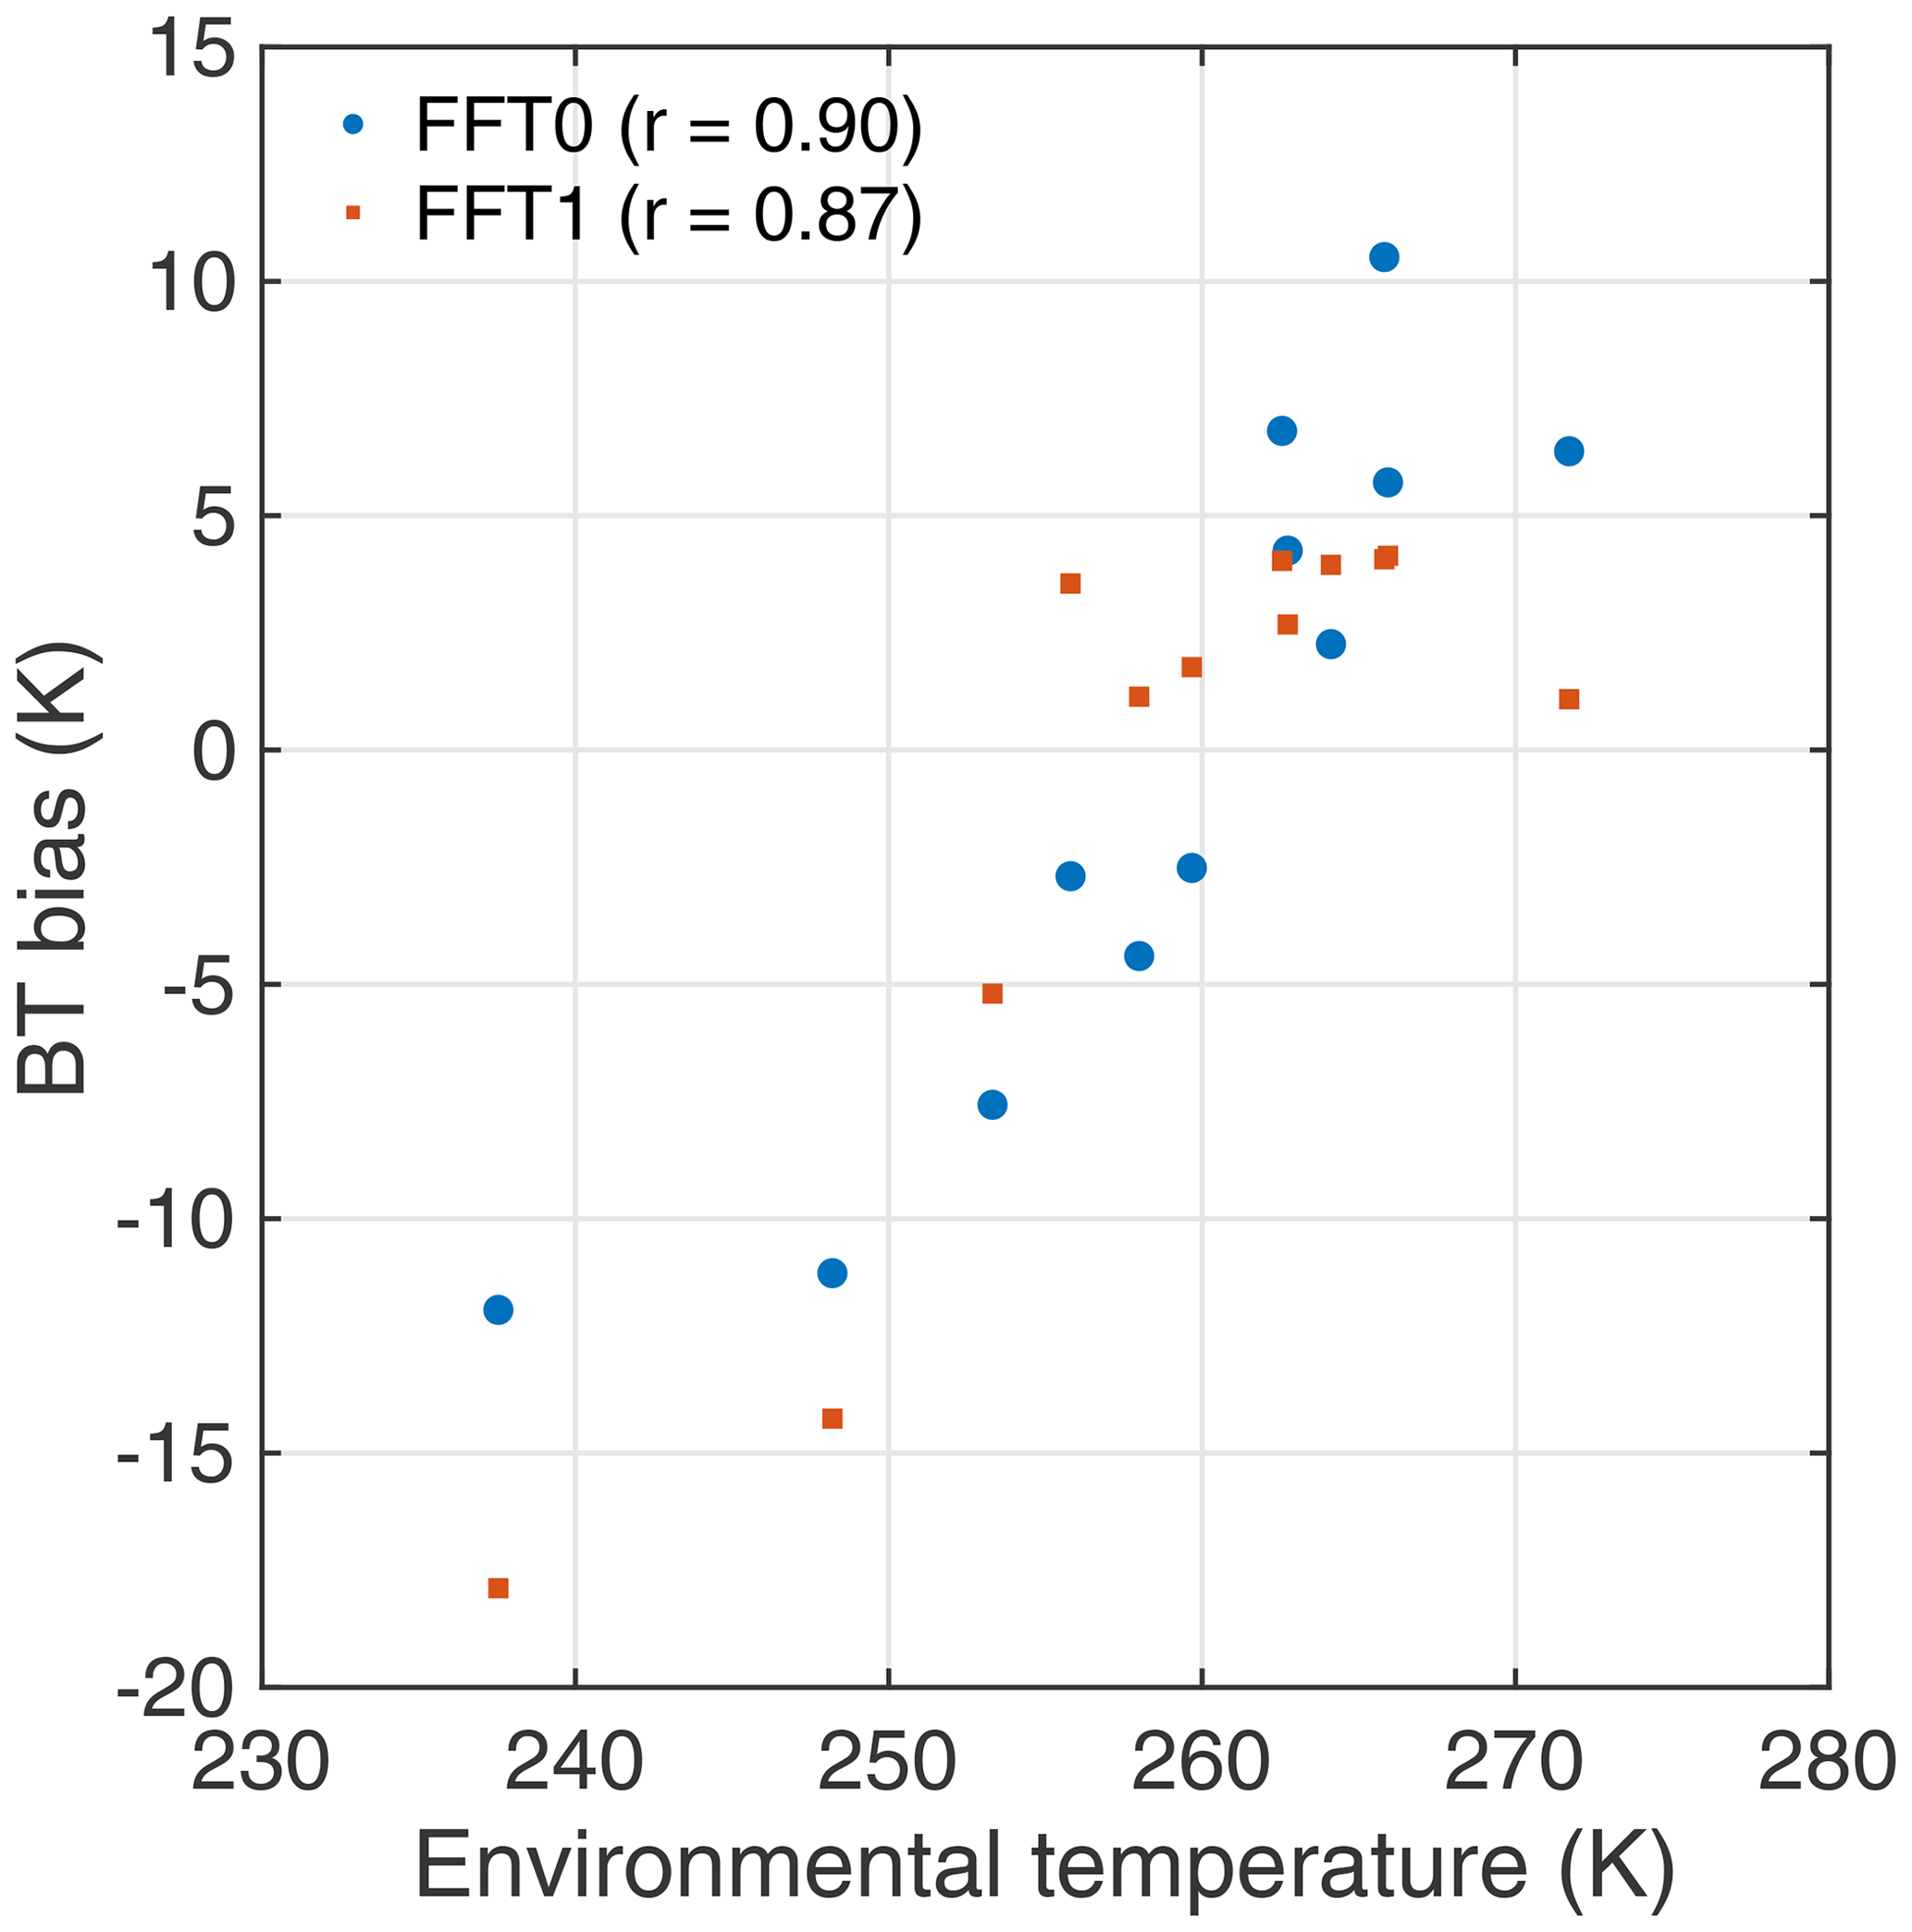
Figure 12Scatter plot between HiSRAMS zenith-pointing averaged BT biases in the water vapor band (FFT0 and FFT1) and environmental temperature from radiosonde measurements. r represents the correlation coefficients.
A more accurate radiative closure was achieved for nadir-pointing HiSRAMS flight measurements (Fig. 10c, d) compared to the zenith-pointing HiSRAMS flight measurements (Fig. 10a, b). BT biases within 3 K were observed for nadir-pointing HiSRAMS measurements at all observational altitudes below 5.32 km.
Flight leg 1 (6.81 km) exhibits relatively poor radiative closure for all observational conditions and spectral ranges, which is an absolute outlier from the radiative closure for other flight legs. The HiSRAMS calibration process is sensitive to the environmental temperature; validation of the HiSRAMS calibration was performed in a well-controlled laboratory environment. However, the difference in environmental temperature during the flight measurements may introduce a larger bias into HiSRAMS measurements (Bliankinshtein et al., 2023a).
Because the zenith-pointing BT in the water vapor absorption band is highly sensitive to variations in water vapor vertical profiles, the uncertainty in the water vapor input results in the relatively large BT bias shown in Figs. 9b, d, and 10b. This strong sensitivity could be beneficial to water vapor concentration retrieval if the accuracy of the HiSRAMS zenith-pointing measurements under different environmental conditions can be ensured; this requires more HiSRAMS ground-based and flight measurements.
3.3 Comparison of HiSRAMS and AERI radiative accuracy
As an established hyperspectrometer, AERI can be used to evaluate the accuracy of the HiSRAMS experimental radiometers. The BT biases in both AERI and HiSRAMS measurements are organized with respect to the total column optical depth for the channels dominated by either CO2 or water vapor absorptions for AERI (see the detailed AERI channel selection in Sect. S2) and all the channels for HiSRAMS (Fig. 13). In the original AERI measurements, the BT bias decreases overall with optical depth. The BT bias has a broader spread when the optical depth is low (Fig. 13a); this may arise from the slight wavenumber mismatch between AERI observations and LBLRTM simulations. After the warm bias correction, a more accurate radiative closure of AERI is achieved (Fig. 13b) with a lower BT bias and a standard deviation for both the CO2 and water vapor channels.
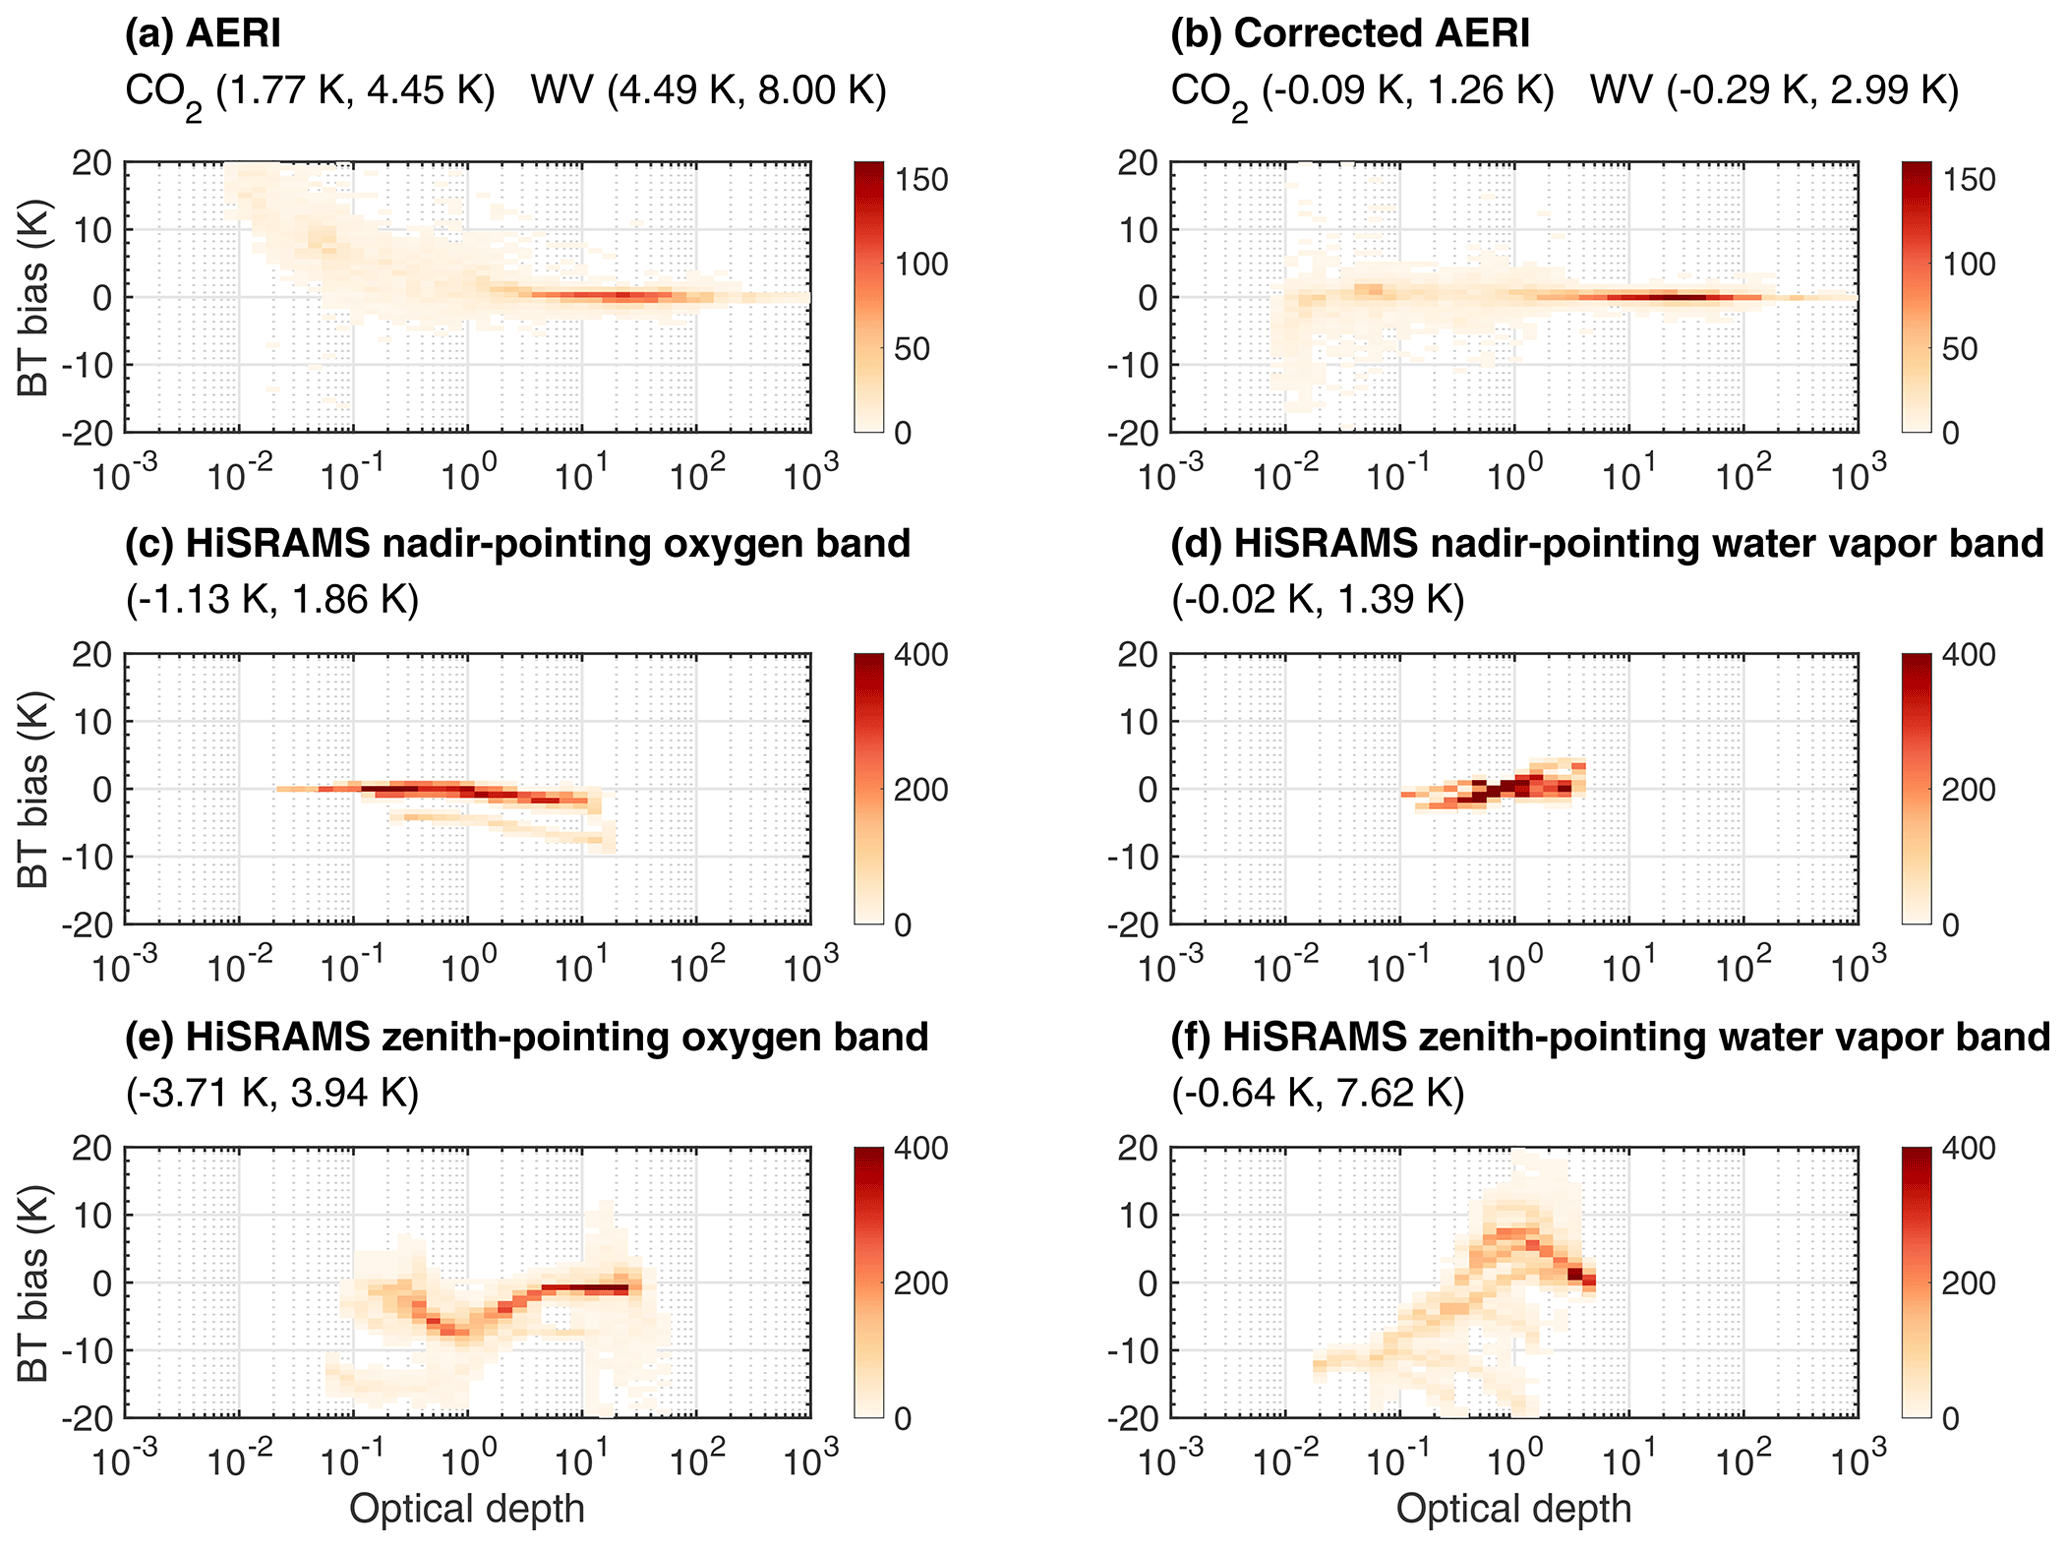
Figure 13BT biases with respect to optical depth at different channels for (a) AERI measurements, (b) corrected AERI measurements, (c) nadir-pointing HiSRAMS oxygen band measurements, (d) nadir-pointing HiSRAMS water vapor band measurements, (e) zenith-pointing HiSRAMS oxygen band measurements, and (f) zenith-pointing HiSRAMS water vapor measurements. The color represents the number of channels. The numbers in the parentheses represent the mean and standard deviation of the BT biases, respectively. For AERI measurements, only channels dominated by either carbon dioxide or water vapor absorptions are included.
Nadir-pointing HiSRAMS measurements display consistent radiometric characteristics across various optical depth ranges. The mean BT bias for nadir-pointing HiSRAMS measurements is relatively small, and the spread of the BT bias at different optical depths is minimal (Fig. 13c, d). In contrast, the zenith-pointing HiSRAMS BT bias does not exhibit a straightforward relationship with optical depth. Within the oxygen band, where optical depth is relatively large, the BT bias is close to zero, showing good radiometric accuracy (Fig. 13e). However, at other optical depth ranges within the oxygen band and across the entire optical depth range in the water vapor band, the BT biases are substantial, with a significant standard deviation. It is important to note that, in nadir-pointing measurements, the elevated surface setting may mitigate the BT biases between the measurement and the simulation. This is because the surface contribution in the simulation is derived from the measurement.
Figure 14 compares the radiometric accuracy of AERI and HiSRAMS. The results for the mean BT bias and the standard deviation of the BT biases at different optical depth ranges are shown. The optical depth here refers to the total column optical depth along the entire light path. Considering the corrected AERI radiometric accuracy to be the benchmark, the nadir-pointing HiSRAMS measurements (yellow and purple dots and shadings in Fig. 14) agree well with the corrected AERI measurements (orange dots and shading in Fig. 14). The zenith-pointing HiSRAMS measurements (green and black dots and shadings) clearly diverge from the corrected AERI measurements, indicating poorer radiometric accuracy. When comparing the radiometric accuracy of AERI and HiSRAMS in zenith-pointing measurements, the viewing geometry of the two instruments is identical, ensuring a fair comparison. However, when comparing the radiometric accuracy between AERI zenith-pointing measurements and HiSRAMS nadir-pointing measurements, it is necessary to consider their different viewing geometries, as this could also affect the radiometric accuracy.
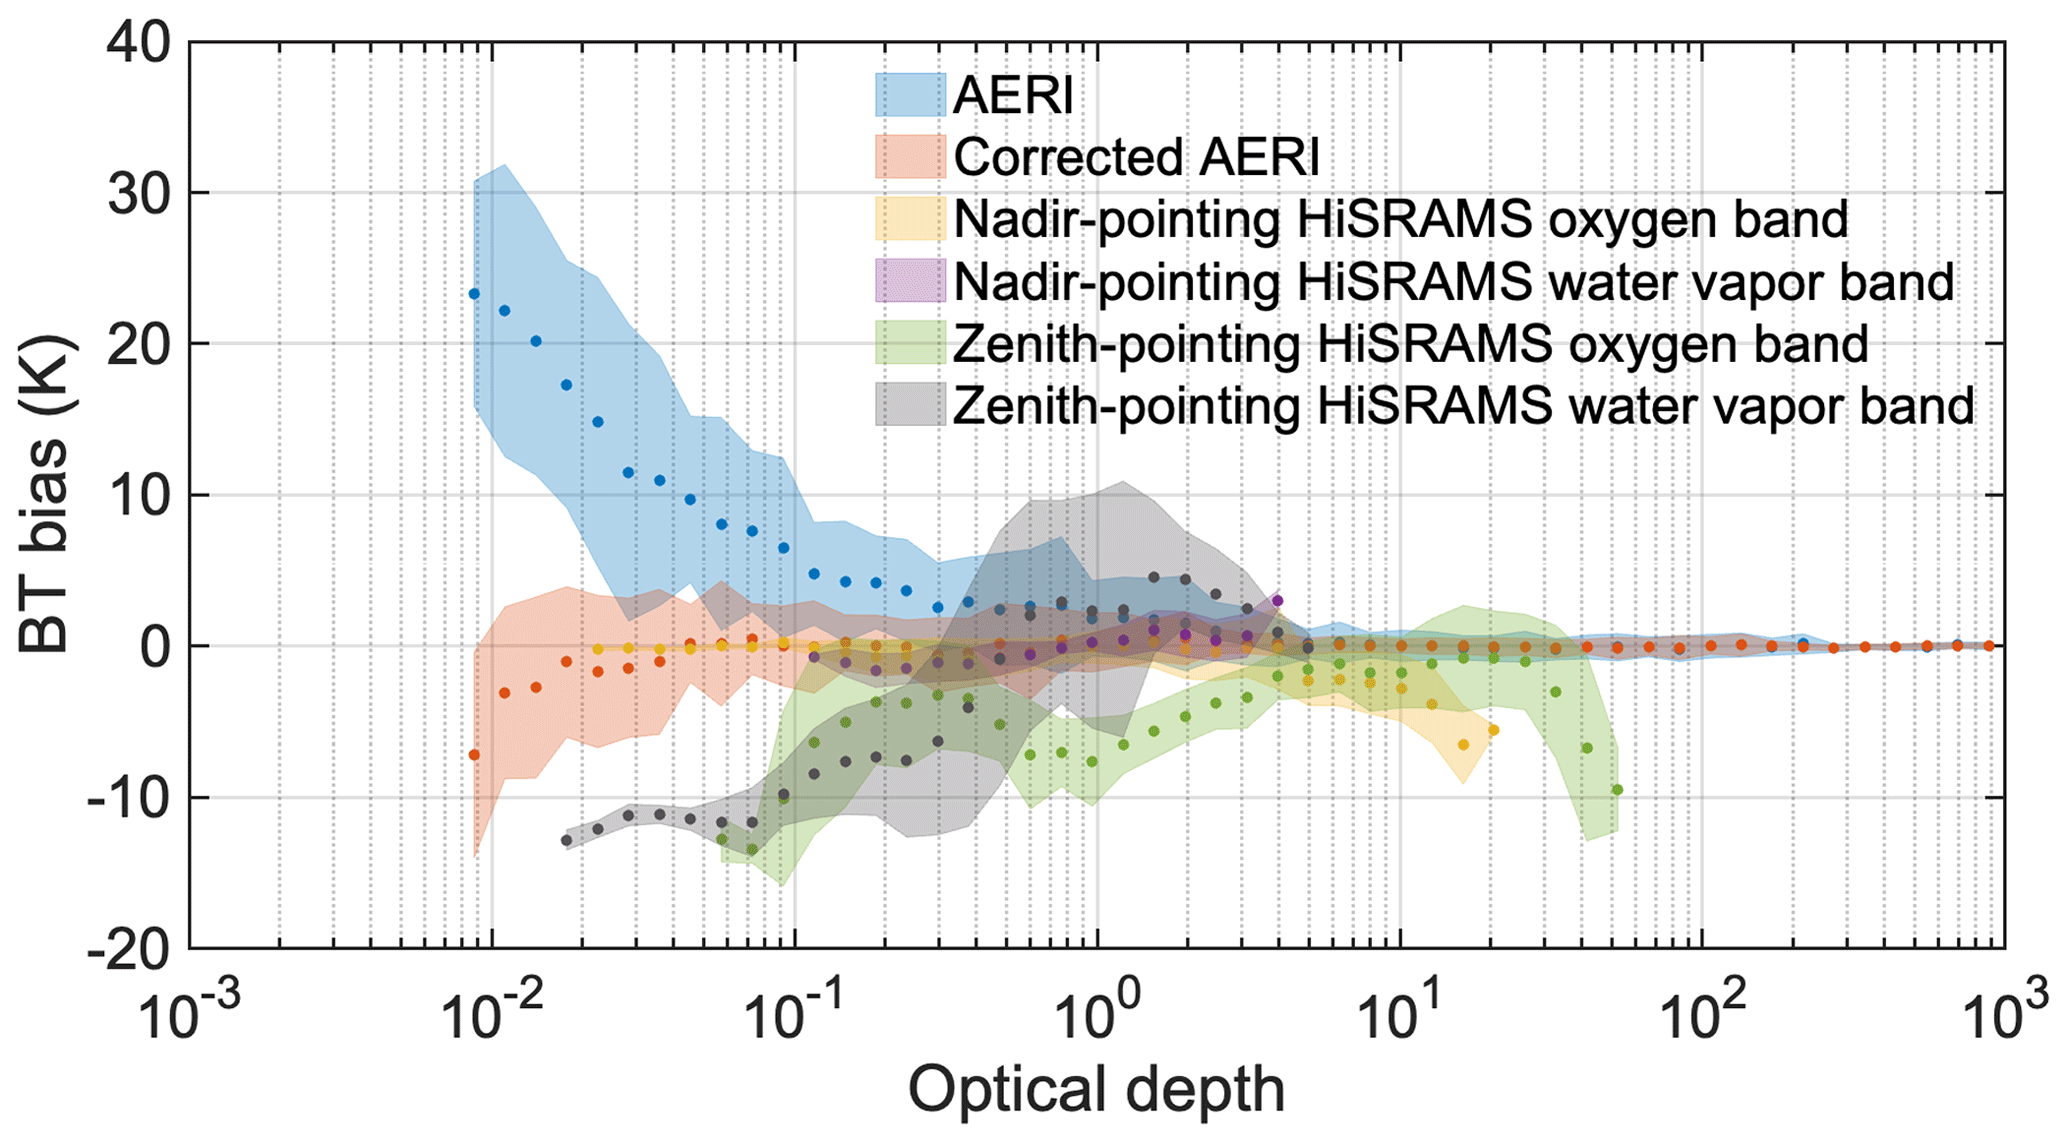
Figure 14Mean (dots) and standard deviation (shadings) of BT biases with respect to optical depth at different channels for AERI observations, corrected AERI observations, nadir-pointing HiSRAMS observations, and zenith-pointing HiSRAMS observations. For AERI measurements, only channels dominated by either carbon dioxide or water vapor absorptions are included.
In conclusion, nadir-pointing HiSRAMS measurements in the oxygen and water vapor bands have a similar radiometric accuracy to the AERI benchmark. However, poor radiometric accuracy has been observed in zenith-pointing HiSRAMS measurements in the oxygen and water vapor bands, indicating the necessity to improve HiSRAMS's zenith-pointing radiometric accuracy calibration.
Vertical temperature and water vapor concentration profiles are essential for climate and weather studies. Hyperspectral radiometers have been shown to be useful in retrieving high temporal and spatial resolution profiles of temperature and water vapor concentration. Advancements in millimeter-wave technologies have made possible the development of hyperspectral microwave radiometers exhibiting thousands of channels. HiSRAMS, designed and developed by an international team, is an instance of such a development. The radiometric accuracy of this experimental instrument was evaluated under clear-sky conditions, employing collocated clear-sky AERI and HiSRAMS spectral measurements collected in Ottawa, Canada, together with the radiosonde measurements of temperature and water vapor concentration profiles. Determining the radiometric accuracy of the two HiSRAMS hyperspectral radiometers is a prerequisite for temperature and water vapor concentration retrievals.
Three field campaigns were conducted to evaluate the radiometric accuracy of AERI and HiSRAMS. The radiance bias in the temperature-sensitive bands in AERI observations is relatively small, indicating a good accuracy of the temperature inputs from radiosonde measurements. A persistent warm bias in the window band was present in AERI measurements, which may be due to the FOV obstruction or calibration processes; this can be corrected. Upon implementing the warm bias correction in AERI measurements, a more accurate radiometric closure was achieved in the window band. HiSRAMS nadir-pointing spectra from flight measurements exhibit a smaller BT bias compared to zenith-pointing spectra from both ground and flight measurements. Zenith-pointing HiSRAMS water vapor band measurements are sensitive to changes in water vapor concentration, underscoring the importance of accurate HiSRAMS measurements for water vapor concentration retrievals. It is essential to note that the sample size for this study was limited to three field campaigns, each accompanied by one radiosonde launch. The two instruments, HiSRAMS and AERI, are planned to be deployed in additional field campaigns and calibration experiments in the future, which will validate the closure assessment concluded here.
A novel but straightforward method was developed to test the radiometric accuracy of the instruments based on the relationship between radiative closure bias and total column optical depth. The radiometric accuracy of HiSRAMS was compared against the well-tested instrument AERI. Based on the BT bias in different optical depth ranges, nadir-pointing HiSRAMS measurements exhibit a radiometric accuracy comparable to AERI. However, poorer radiometric accuracy was observed in the zenith-pointing HiSRAMS measurements. To fully assess the source of this measurement bias, improved calibration and field campaigns are required.
The objective of designing and developing HiSRAMS is to test the retrieval performance of temperature and water vapor concentration from hyperspectral microwave observations under clear- and cloudy-sky conditions. This study focuses on the radiometric accuracy of HiSRAMS and AERI under clear-sky conditions as a first step. Future work will include comparisons of temperature and water vapor retrieval performance between hyperspectral infrared and microwave radiometers under clear-sky conditions, assessing the synergy of HiSRAMS and AERI observations for temperature and water vapor retrieval under clear-sky conditions and validating the all-sky radiometric accuracy of HiSRAMS as well as all-sky temperature, water vapor, and cloud retrievals based on HiSRAMS.
The field campaign observational data together with the radiative forward model simulation data can be obtained from the Mendeley data at https://doi.org/10.17632/kvt2s9ryk7.2 (Liu et al., 2024).
The supplement related to this article is available online at: https://doi.org/10.5194/amt-17-2219-2024-supplement.
YH conceived the research. YH, JRG, NB, PMG, and MW co-designed the measurement experiment. LL and YH developed the AERI forward model and performed AERI data collection and analysis. NB and PMG developed the HiSRAMS forward model. NB, PMG, and SX performed HiSRAMS data collection and analysis. LL led the writing of the manuscript with contributions from all the co-authors.
The contact author has declared that none of the authors has any competing interests.
Publisher’s note: Copernicus Publications remains neutral with regard to jurisdictional claims made in the text, published maps, institutional affiliations, or any other geographical representation in this paper. While Copernicus Publications makes every effort to include appropriate place names, the final responsibility lies with the authors.
Many people from the NRC, McGill University, and Ominisys Instruments contributed to the successful completion of the measurement campaign. The collection of flight data was specifically supported by NRC scientists Cuong Nguyen, Leonid Nichman, Keyvan Ranjbar, and Kenny Bala and others in the Airborne Facilities for Atmospheric Research and Reconnaissance (AFARR) team. The operation of the AERI and ground facility received support from Eve Bigras, Calin Giurgiu, Véronique Meunier, and other staff members at McGill University.
This research has been supported by the Canadian Space Agency (grant no. 19FAMCGB16), the Fonds de recherche du Québec – Nature et technologies (grant no. PR-283823), the European Space Agency (ESA contract no. 4000123417/NL/LA), and the Canada Foundation for Innovation (grant no. CFI-36146).
This paper was edited by Maximilian Maahn and reviewed by two anonymous referees.
Aires, F., Prigent, C., Orlandi, E., Milz, M., Eriksson, P., Crewell, S., Lin, C. C., and Kangas, V.: Microwave hyperspectral measurements for temperature and humidity atmospheric profiling from satellite: The clear-sky case, J. Geophys. Res.-Atmos., 120, 11334–11351, 2015.
Aumann, H. H. and Strow, L.: AIRS, the first hyper-spectral infrared sounder for operational weather forecasting, in: 2001 IEEE Aerospace Conference Proceedings (Cat. No. 01TH8542), 1684, 4/1683–1684/1692, Big Sky, Montana, USA, 10–17 March 2001, IEEE, https://doi.org/10.1109/AERO.2001.931472, ISBN: 0-7803-6599-2, 2001.
Auriacombe, O., Bliankinshtein, N., Gabriel, P., Wolde, M., Huang, Y., Embretsén, J., Krus, M., Olvhammar, S., and Angevain, J.-C.: High Spectral Resolution Airborne Microwave Sounder (HiSRAMS), in: 2022 47th International Conference on Infrared, Millimeter and Terahertz Waves (IRMMW-THz), Delft, Netherlands, 28 August–2 September 2022, IEEE, 1–2, https://doi.org/10.1109/IRMMW-THz50927.2022.9895768, 2022.
Barrientos-Velasco, C., Deneke, H., Hünerbein, A., Griesche, H. J., Seifert, P., and Macke, A.: Radiative closure and cloud effects on the radiation budget based on satellite and shipborne observations during the Arctic summer research cruise, PS106, Atmos. Chem. Phys., 22, 9313–9348, https://doi.org/10.5194/acp-22-9313-2022, 2022.
Blackwell, W. J., Bickmeier, L. J., Leslie, R. V., Pieper, M. L., Samra, J. E., Surussavadee, C., and Upham, C. A.: Hyperspectral microwave atmospheric sounding, IEEE T. Geosci. Remote, 49, 128–142, 2010.
Bliankinshtein, N., Gabriel, P., Huang, Y., Wolde, M., Olvhammar, S., Emrich, A., Kores, M., and Midthassel, R.: Airborne Measurements of Polarized Hyperspectral Microwave Radiances to Increase the Accuracy of Temperature and Water Vapor Retrievals: an Information Content Analysis, AGU Fall Meeting Abstracts, A13K-2959, 2019AGUFM.A13K2959B, 2019.
Bliankinshtein, N., Gabriel, P., Wolde, M., Huang, Y., Embretsen, J., Krus, M., and Angevain, J.-C.: HiSRAMS flight tests and radiation closure, in: 2022 ESA Living Planet Symposium, Bonn, Germany, 23–27 May 2022, European Space Agency, 2022.
Bliankinshtein, N., Gabriel, P., Auriacombe, O., Huang, Y., Wolde, M., Xu, S., Liu, L., and Angevain, J.-C.: Radiometric calibration of a hyperspectral microwave sounder, in: 48th International Conference on Infrared, Millimeter and Terahertz Waves (IRMMW-THz), Montreal, Canada, 17–22 September 2023, IEEE, https://doi.org/10.1109/IRMMW-THz57677.2023.10299101, 2023a.
Bliankinshtein, N., Liu, L., Gabriel, P., Xu, S., Bala, K., Wolde, M., Huang, Y., Auriacombe, O., Krus, M., and Angevain, J.-C.: Airborne validation of HiSRAMS atmospheric soundings, in: IGARSS 2023 – 2023 IEEE International Geoscience and Remote Sensing Symposium, Pasadena, USA, 16–21 July 2023, IEEE, https://doi.org/10.1109/IGARSS52108.2023.10281883, 2023b.
Blumberg, W., Wagner, T., Turner, D., and Correia, J.: Quantifying the accuracy and uncertainty of diurnal thermodynamic profiles and convection indices derived from the Atmospheric Emitted Radiance Interferometer, J. Appl. Meteorol. Clim., 56, 2747–2766, 2017.
Carminati, F., Xiao, X., Lu, Q., Atkinson, N., and Hocking, J.: Assessment of the hyperspectral infrared atmospheric sounder (HIRAS), Remote Sens.-Basel, 11, 2950, https://doi.org/10.3390/rs11242950, 2019.
Clough, S., Brown, P., Miller, N., Liljegren, J., and Shippert, T.: Residual analysis of surface spectral radiances between instrument observations and line-by-line calculations, in: Proceedings of the Fourth Atmospheric Radiation Measurement (ARM) Science Team Meeting, Charleston, South Carolina, USA, 28 February–3 March 1994, United States Department of Energy CONF-940277, 101–109, 1994.
Clough, S. A., Shephard, M. W., Mlawer, E. J., Delamere, J. S., Iacono, M. J., Cady-Pereira, K., Boukabara, S., and Brown, P. D.: Atmospheric radiative transfer modeling: a summary of the AER codes, J. Quant. Spectrosc. Ra., 91, 233–244, https://doi.org/10.1016/j.jqsrt.2004.05.058, 2005.
Delamere, J., Clough, S., Payne, V., Mlawer, E., Turner, D., and Gamache, R.: A far-infrared radiative closure study in the Arctic: Application to water vapor, J. Geophys. Res.-Atmos., 115, D17106, https://doi.org/10.1029/2009JD012968, 2010.
Divakarla, M. G., Barnet, C. D., Goldberg, M. D., McMillin, L. M., Maddy, E., Wolf, W., Zhou, L., and Liu, X.: Validation of Atmospheric Infrared Sounder temperature and water vapor retrievals with matched radiosonde measurements and forecasts, J. Geophys. Res.-Atmos., 111, D09S15, https://doi.org/10.1029/2005JD006116, 2006.
Eriksson, P., Buehler, S., Davis, C., Emde, C., and Lemke, O.: ARTS, the atmospheric radiative transfer simulator, version 2, J. Quant. Spectrosc. Ra., 112, 1551–1558, 2011.
Han, Y. and Westwater, E. R.: Remote sensing of tropospheric water vapor and cloud liquid water by integrated ground-based sensors, J. Atmos. Ocean. Tech., 12, 1050–1059, 1995.
Hansell, R., Liou, K., Ou, S., Tsay, S., Ji, Q., and Reid, J.: Remote sensing of mineral dust aerosol using AERI during the UAE2: A modeling and sensitivity study, J. Geophys. Res.-Atmos., 113, D18202, https://doi.org/10.1029/2008JD010246, 2008.
Hersbach, H., Bell, B., Berrisford, P., Hirahara, S., Horányi, A., Muñoz-Sabater, J., Nicolas, J., Peubey, C., Radu, R., and Schepers, D.: The ERA5 global reanalysis, Q. J. Roy. Meteor. Soc., 146, 1999–2049, 2020.
Hilliard, L., Racette, P., Blackwell, W., Galbraith, C., and Thompson, E.: Hyperspectral Microwave Atmospheric Sounder (HyMAS) architecture and design accommodations, in: 2013 IEEE Aerospace Conference, Big Sky, Montana, USA, 2–9 March 2013, IEEE, 1–11, https://doi.org/10.1109/AERO.2013.6496895, ISBN: 978-1-4673-1812-9, 2013.
Huang, Y. and Bani Shahabadi, M.: Why logarithmic? A note on the dependence of radiative forcing on gas concentration, J. Geophys. Res.-Atmos., 119, 13683–613689, 2014.
Inness, A., Ades, M., Agustí-Panareda, A., Barré, J., Benedictow, A., Blechschmidt, A.-M., Dominguez, J. J., Engelen, R., Eskes, H., Flemming, J., Huijnen, V., Jones, L., Kipling, Z., Massart, S., Parrington, M., Peuch, V.-H., Razinger, M., Remy, S., Schulz, M., and Suttie, M.: The CAMS reanalysis of atmospheric composition, Atmos. Chem. Phys., 19, 3515–3556, https://doi.org/10.5194/acp-19-3515-2019, 2019.
King, M. D., Kaufman, Y. J., Menzel, W. P., and Tanre, D.: Remote sensing of cloud, aerosol, and water vapor properties from the moderate resolution imaging spectrometer(MODIS), IEEE T. Geosci. Remote, 30, 2–27, 1992.
Knuteson, R., Revercomb, H., Best, F., Ciganovich, N., Dedecker, R., Dirkx, T., Ellington, S., Feltz, W., Garcia, R., and Howell, H.: Atmospheric emitted radiance interferometer. Part I: Instrument design, J. Atmos. Ocean. Tech., 21, 1763–1776, 2004a.
Knuteson, R., Revercomb, H., Best, F., Ciganovich, N., Dedecker, R., Dirkx, T., Ellington, S., Feltz, W., Garcia, R., and Howell, H.: Atmospheric emitted radiance interferometer. Part II: Instrument performance, J. Atmos. Ocean. Tech., 21, 1777–1789, 2004b.
Lan, X., Tans, P., and Thoning, K. W.: Trends in globally-averaged CO2 determined from NOAA Global Monitoring Laboratory measurements, version 2023-06, NOAA GML [data set], https://doi.org/10.15138/9N0H-ZH07, 2023.
Liu, L., Huang, Y., Gyakum, J. R., Turner, D. D., and Gero, P. J.: Trends in Downwelling Longwave Radiance over the Southern Great Plains, J. Geophys. Res.-Atmos., 127, e2021JD035949, https://doi.org/10.1029/2021JD035949, 2022.
Liu, L., Bliankinshtein, N., and Huang, Y.: Radiative closure tests of collocated hyperspectral microwave and infrared radiometers, Version 2, Mendeley Data [data set], https://doi.org/10.17632/kvt2s9ryk7.2, 2024.
Rodgers, C. D.: Inverse methods for atmospheric sounding: theory and practice, World Scientific, https://doi.org/10.1142/3171, ISBN: 978-981-02-2740-1, 2000.
Rosenkranz, P.: Line-by-line microwave radiative transfer (non-scattering), Remote Sensing Code Library [code], https://doi.org/10.21982/M81013, 2017.
Seo, J., Choi, H., and Oh, Y.: Potential of AOD Retrieval Using Atmospheric Emitted Radiance Interferometer (AERI), Remote Sens.-Basel, 14, 407, https://doi.org/10.3390/rs14020407, 2022.
Smith, W. L., Revercomb, H., Weisz, E., Tobin, D., Knuteson, R., Taylor, J., and Menzel, W. P.: Hyperspectral satellite radiance atmospheric profile information content and its dependence on spectrometer technology, IEEE J. Sel. Top. Appl., 14, 4720–4736, 2021.
Turner, D. D.: Microphysical properties of single and mixed-phase Arctic clouds derived from ground-based AERI observations, The University of Wisconsin-Madison, PhD thesis, AAI3089667, ISBN: 9780496373994, 2003.
Turner, D. D. and Blumberg, W. G.: Improvements to the AERIoe thermodynamic profile retrieval algorithm, IEEE J. Sel. Top. Appl., 12, 1339–1354, 2018.
Turner, D. D. and Löhnert, U.: Information content and uncertainties in thermodynamic profiles and liquid cloud properties retrieved from the ground-based Atmospheric Emitted Radiance Interferometer (AERI), J. Appl. Meteorol. Clim., 53, 752–771, 2014.
Turner, D. D., Feltz, W. F., and Ferrare, R. A.: Continuous water vapor profiles from operational ground-based active and passive remote sensors, B. Am. Meteorol. Soc., 81, 1301–1318, 2000.
Warwick, L., Brindley, H., Di Roma, A., Fox, S., Havemann, S., Murray, J., Oetjen, H., Price, H., Schüttemeyer, D., and Sgheri, L.: Retrieval of Tropospheric Water Vapor From Airborne Far-Infrared Measurements: A Case Study, J. Geophys. Res.-Atmos., 127, e2020JD034229, https://doi.org/10.1029/2020JD034229, 2022.
Westwater, E. R.: Remote sensing of tropospheric temperature and water vapor by integrated observing systems: The remote sensing lecture, B. Am. Meteorol. Soc., 78, 1991–2006, 1997.
Xu, S., Bliankinshtein, N., Gabriel, P., Liu, L., Wolde, M., Huang, Y., Auriacombe, O., Krus, M., and Angevain, J.-C.: Low-level processing of passive hyperspectral microwave measurements from HiSRAMS, in: 2023 IEEE International Geoscience and Remote Sensing Symposium (IGARSS), Pasadena, California, USA, 16–21 July 2023, IEEE, https://doi.org/10.1109/IGARSS52108.2023.10283050, 2023.