the Creative Commons Attribution 4.0 License.
the Creative Commons Attribution 4.0 License.
 | 23 Apr 2024
Application of Doppler sodar in short-term forecasting of PM10 concentration in the air in Krakow (Poland)
Ewa Agnieszka Krajny
Marek Jan Wojtylak
This paper describes an attempt to use data obtained from sodar (sound detection and ranging) for short-term forecasting of PM10 concentration levels in Krakow. Krakow is one of the most polluted cities in central Europe (CE) in terms of PM10 concentration. This is due to the high municipal emissions. Thanks to intensive corrective actions taken by the city authorities, these are being effectively eliminated, but the unfavourable topographic location of the city limits natural ventilation. The article describes all these conditions, focusing on presenting the method of short-term correction of air quality for the time needed to take quick corrective actions by the city authorities in the event of anticipated exceedances of the permissible values. Based on several years of measurements of the physical properties of the atmosphere with sodar, the authors of the paper suggest that sodar data could be considered for operational use to generate short-term predictions.
The proposed method is based on the use of the spectrum, i.e. the set of amplitudes of signals returning to the sodar receiver from the reflection of a single-frequency sound transmission and its characteristic properties depending on the physical state of the atmosphere. Similar spectra were parameterised with a single numerical value using statistical methods.
It was found that, in some cases preceding high concentrations of PM10, the spectral parameters had similar values. This made it possible to develop a forecasting method for such concentrations by using data mining to search for conditions in historical data closest to the state of the atmosphere at the time of forecasting. In this part of the study, data from 2017–2018 were used. In the next step, three methods of using the sodar data developed for PM10 prediction were proposed, comparing them with the method without sodar use. The study results were tested on independent material using data concerning the episodes of high concentrations of pollutants from October 2021 to March 2022 in Krakow. The findings were considered to be encouraging, also taking into account the speed and low cost of preparing the forecast.
- Article
(4092 KB) - Full-text XML
- BibTeX
- EndNote


Air pollution is a significant problem for residents of urban agglomerations. The growing size of cities and the increasing number of inhabitants result in both an increase in emissions and a reduction in the efficient removal of pollutants outside the city limits. This then causes a periodic pollution accumulation, leading to smog episodes. There is evidence that air pollution has a significant impact on both life expectancy and quality of life. During episodes, increased numbers of hospital admissions and deaths are observed, especially among children and the elderly (WHO, 2004; Bell and Davis, 2001; Dockery et al., 1993). The occurrence of high PM concentrations in Krakow is described below.
Considering the increase in emissions as a result of lower air temperatures during the cold season, reducing the demand for heat and thus reducing emissions as a result of “warm winters” are well-known examples of emission control mechanisms based on meteorological and climatological factors. Another equally important role is played by thermal and dynamic conditions in the boundary layer of the atmosphere, where, apart from solar radiation and dynamic factors, the degrees of urbanisation and land cover are also important (Wenbo et al., 2021; Ji et al., 2020; Xu et al., 2018; Engelbart et al., 2009; Fisher et al., 2006; Piringer et al., 2004; Arya, 1999). These issues have also been studied in Poland, where the problem of high concentrations of particulate pollutants is prevalent, especially in the winter months: January–March and October–December (Juda-Rezler and Toczko, 2016; Ziemianski and Osrodka, 2012). Among the large Polish cities, Krakow is the most polluted when it comes to PM concentration. Therefore, research in this area is particularly intensive (Bajorek and Weżyk, 2016; Bokwa, 2010; Matuszko, 2007; Walczewski, 1994). For example, extensive research on secondary sources on the legacy and contemporary research on climate diversity in Krakow can be found in Bokwa (2019) and Matuszko (2007).
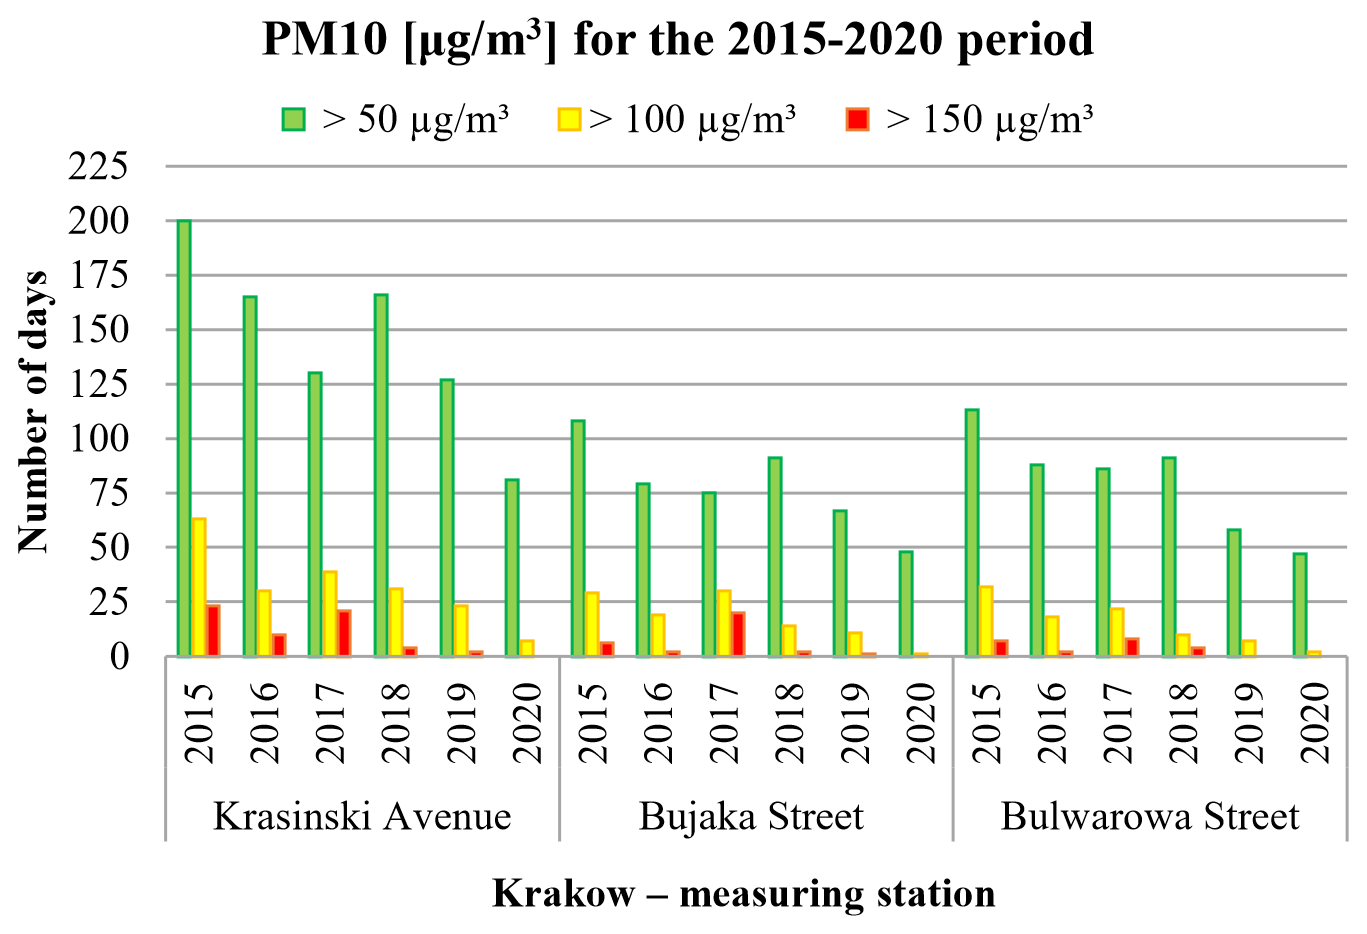
Figure 1Total number of days with PM10 concentrations exceeding 50, 100, and 150 µg m−3 in 2015–2020.
The inspiration for this research was the analysis of the current state of knowledge regarding the atmospheric structure of the boundary layer over Krakow (Godlowska et al., 2008; Lewinska et al., 1982; Morawska-Horawska, 1978). In connection with the 1993 introduction in Krakow of the first automatic air quality monitoring system in Poland and the delivery of system equipment, including REMTECH Doppler sodar (sound detection and ranging) delivered to the Center Observation Station of the Institute of Meteorology and Water Management – National Research Institute in Krakow-Czyzyny, the research became more extensive. Based on data obtained from sodar, wind roses were developed separately for Krakow at the altitudes of 50 to 550 m at intervals of 100 m for different types of atmospheric equilibrium (Rozwoda, 1995), for mixing layers and wind circulating over the city (Fisher et al., 2006; Piringer et al., 2004), and for COST 720 (Engelbart et al., 2009), while the measurement results obtained at that time became a useful knowledge base for the subject, as used in modern research (Godlowska and Kaszowski, 2019; Bajorek-Zydron and Wezyk, 2016). In recent years, thanks to the use of drones and balloons for civilian applications, as well as the miniaturisation of measuring instruments, experimental studies of the vertical structure of the atmosphere from the boundary layer in Krakow have been widely developed, with an emphasis on the impact of meteorological conditions on the vertical profile of air pollutants (Sekuła et al., 2021). These studies provide important information on the vertical distribution of PM10 concentrations under different meteorological conditions.
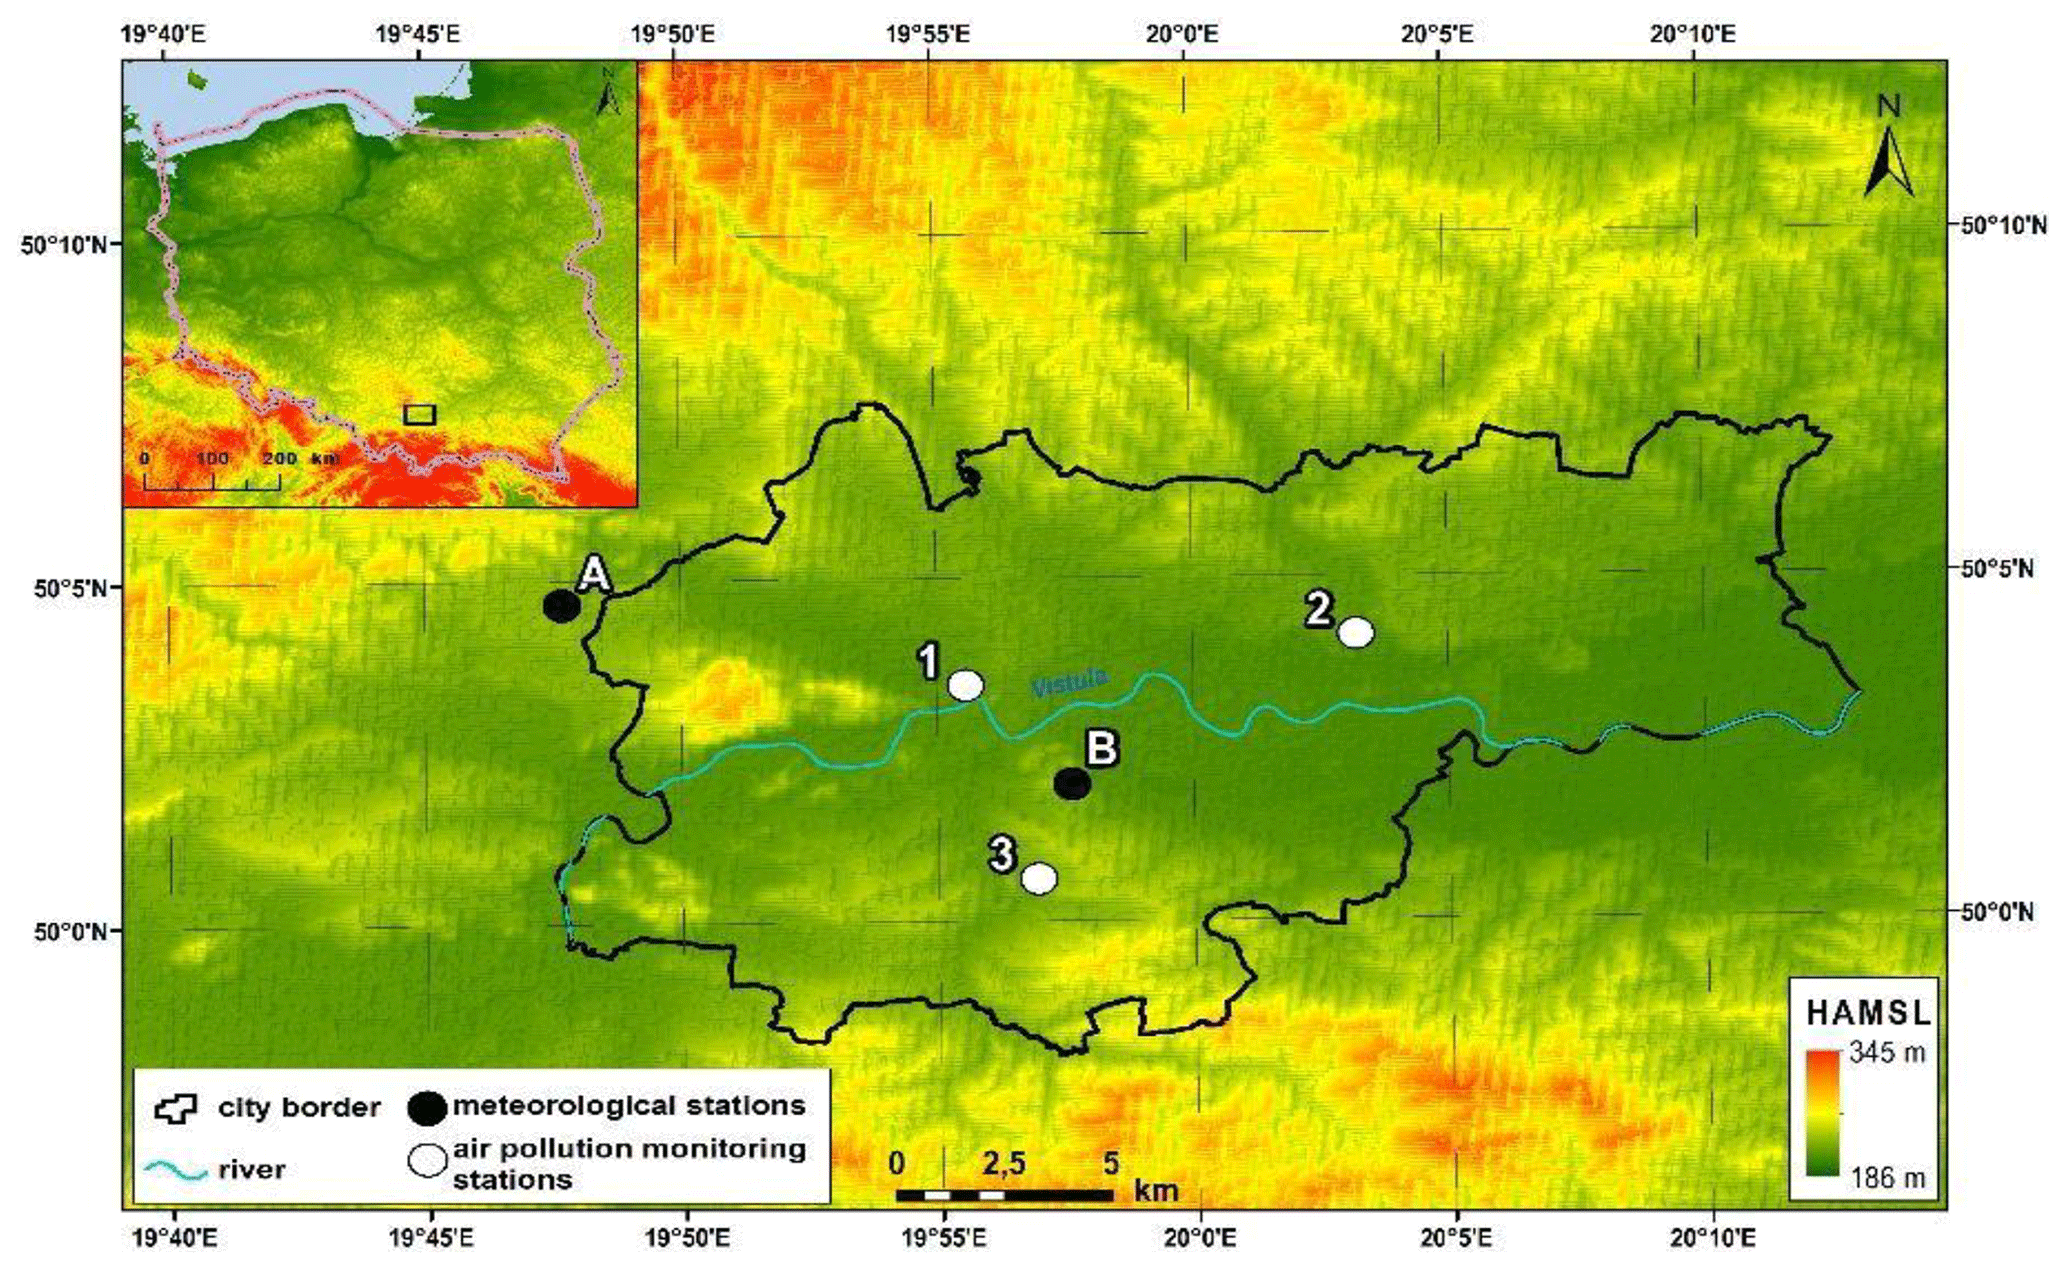
Figure 2Geographical location of the research area, showing the locations of meteorological and air pollution monitoring stations. Meteorological stations of the Institute of Meteorology and Water Management – National Research Institute (marked in black): (A) Krakow-Balice, (B) sodar. Monitoring stations of the National Environmental Monitoring Network (NEM) (marked in white): (1) Krasinski Avenue, (2) Bulwarowa Street, (3) Bujaka Street (source: https://srtm.csi.cgiar.org/srtmdata, last access: 21 December 2023; Jarvis et al., 2008).
Intensive corrective actions were carried out in Krakow as part of research activities concerning the causes and effects of excessive air pollution. In Poland, legal solutions have been applied in accordance with the provisions of Directive 2008/50/EC of the European Parliament and of the Council of 21 May 2008 with regard to ambient air quality and cleaner air for Europe (2008). Therefore, in areas (zones) with excessive air pollution, it is necessary to establish air quality programmes to direct corrective actions (Regulation of the Minister of the Environment, 2012). In addition to being an important legislative function (they constitute an act of local law), these programmes are of significant preventive and educational importance. Due to the fact that the concentrations of PM10, PM2.5 and benzo(a)pyrene (B(a)P) in Krakow exceeded the limits specified in the applicable legal standards, air quality programmes have been implemented for several years. The effects of their implementation include, among other things, the so-called anti-smog resolution (Małopolska Regional Assembly, 2016), which, as of 2019, prohibits the combustion of solid fuels for space heating and results in a gradual reduction in PM concentrations. As a result of these legislative actions, the replacement of boilers for space and water heating, a process carried out since 1995, has increased sharply, leading to a significant reduction in PM emissions in the municipal sector (the number of solid-fuel boilers decreased by around 15 000 boiler installations in 2017–2019) (AQP Air Quality Portal, 2018). This, in turn, significantly reduced PM10 concentrations, shown in Fig. 1 as the number of days when the PM concentration threshold was exceeded. Specific meteorological conditions in recent years (mild and warm winters) have also contributed to the situation but have not diminished the importance of reducing municipal emissions.
The unfavourable geographical location of the city also causes the failure to meet air quality standards in Krakow. In the north and south, the historical centre of the city, located in the Vistula Valley, is sheltered by round hills that cross river valleys. The biggest problem of Krakow is that, from the west, it is protected by the features of a topographically diverse area called the Krakow Bridge, located at 370 m above sea level (a.s.l.) (German, 2001). The hills of the Krakow Bridge are a barrier for the entire city, reducing the efficiency of ventilation and limiting the clearance of the Vistula Valley in the western part of Krakow, threatening the influx of wind, with western air circulation dominating in Poland. The location of Krakow in the Vistula Valley not only affects the wind conditions but also contributes to temperature inversions, determining a constant type of equilibrium of the atmosphere in harsh conditions and reducing the ability to mix air vertically. Urbanisation processes, which result in an increasing density of taller and taller buildings, also contribute to the reduction in wind speed and the ability to remove air pollution outside the city area. However, urbanisation often contributes to improving vertical ventilation conditions by reducing the horizontal dispersion of pollutants. This is facilitated by increased anthropogenic heat production, which reduces the frequency of inversions in areas with large communities.
The episodes of high PM10 concentrations in Krakow prompted the city authorities to develop a system that will provide residents with access to free public transport when the limit of 8 h of concentration is to be exceeded the next day. The implementation of an air quality forecasting system to control public transport imposes the obligation to exercise the utmost care in modelling. An inaccurate forecast is associated with the risk of the city budget incurring either unjustified costs (by multiplying the air quality forecast) or social (health) costs, which are difficult to estimate for an underestimated air quality forecast. In the specific conditions prevailing in Krakow, mainly local factors of stagnation, such situations are not uncommon. An additional element that makes it difficult to correctly forecast air quality using a deterministic model is the inability to provide an accurate emission inventory. Given this state of affairs, methods are needed to frame air quality forecasts, in particular, time trend forecasts of the absolute value of PM10 concentration. The long-term activity of Doppler sodar in Krakow and the analysis of the impact of atmospheric stability conditions on air quality gave us the opportunity to use the results of these measurements to improve the air quality forecasting system (Bajorek-Zydroń and Weżyk, 2016).
The work uses two data sources.
-
Data from the selected Inspectorate for Environmental Protection/National Environmental Monitoring (IEP/NEM) (105 automatic air quality monitoring stations based in Krakow – data from 2015 to March 2022)
-
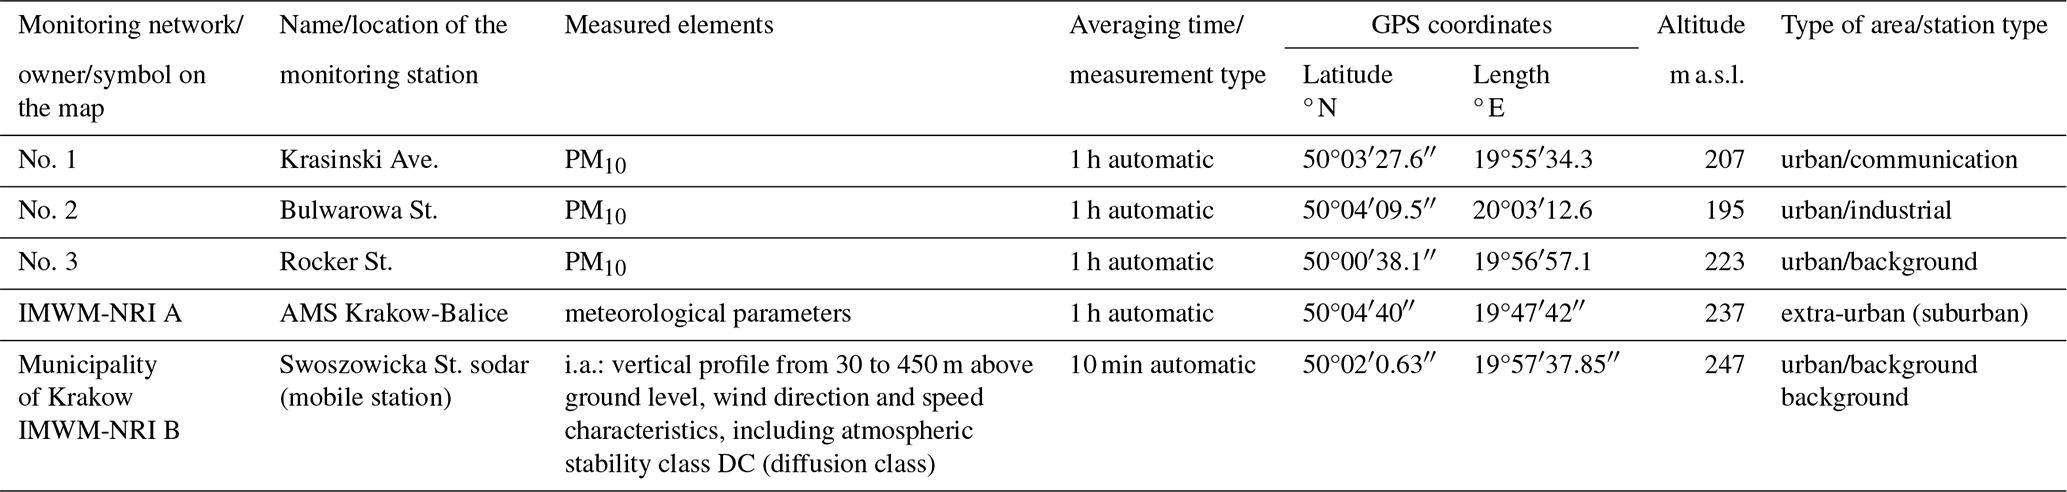
Measurements of sodar tags from 2017 to March 2022 (the station characteristics and locations are shown in Table 1, and the station codes are shown in Fig. 2)
3.1 Measurements of sodar tags
The monostatic Doppler sodar PCS.2000-24 system has been operating in Krakow since January 2015 as part of the MONIT-AIR project. The system was manufactured by the German company METEK Meteorologische Messtechnik GmbH (https://metek.de, last access: 21 December 2023). The principle of operation of sodar is based on the Doppler effect.
The sodar PCS.2000-24 system was built to measure wind speed and the wind direction profile, based on which turbulence parameters are determined, in the form of atmospheric stability class and, indirectly, air temperature inversion. It includes a monostatic Doppler sodar system transmitting antenna that transmits an audio signal of a given frequency and switches to receive and record a feedback signal. The monostatic sodar PCS.2000-24 system transmits three audio beams simultaneously, each with three antennas: one vertical and two inclined phased antennas (Table 2).
The maximum range of vertical sodar detection depends on the frequency of the transmitted signal and the current atmospheric conditions. Sodar measures the physical parameters of the atmosphere by analysing the spectrum of sound waves dispersed by atmospheric fluctuations of different degrees, which are the result of heat and dynamic turbulence in the atmosphere (air temperature gradients, wind speed and hydrometeors). The Doppler effect for the plane phase antennas depends only on wind speed and distance between the audio transmissions. The technical specifications of sodar are shown in Table 2, and an overview of sodar is shown in Fig. 3.
Table 2Selected technical specifications of sodar PC.2000-24 (based on PSC.2000-24 tag manual, METEK version 2013).
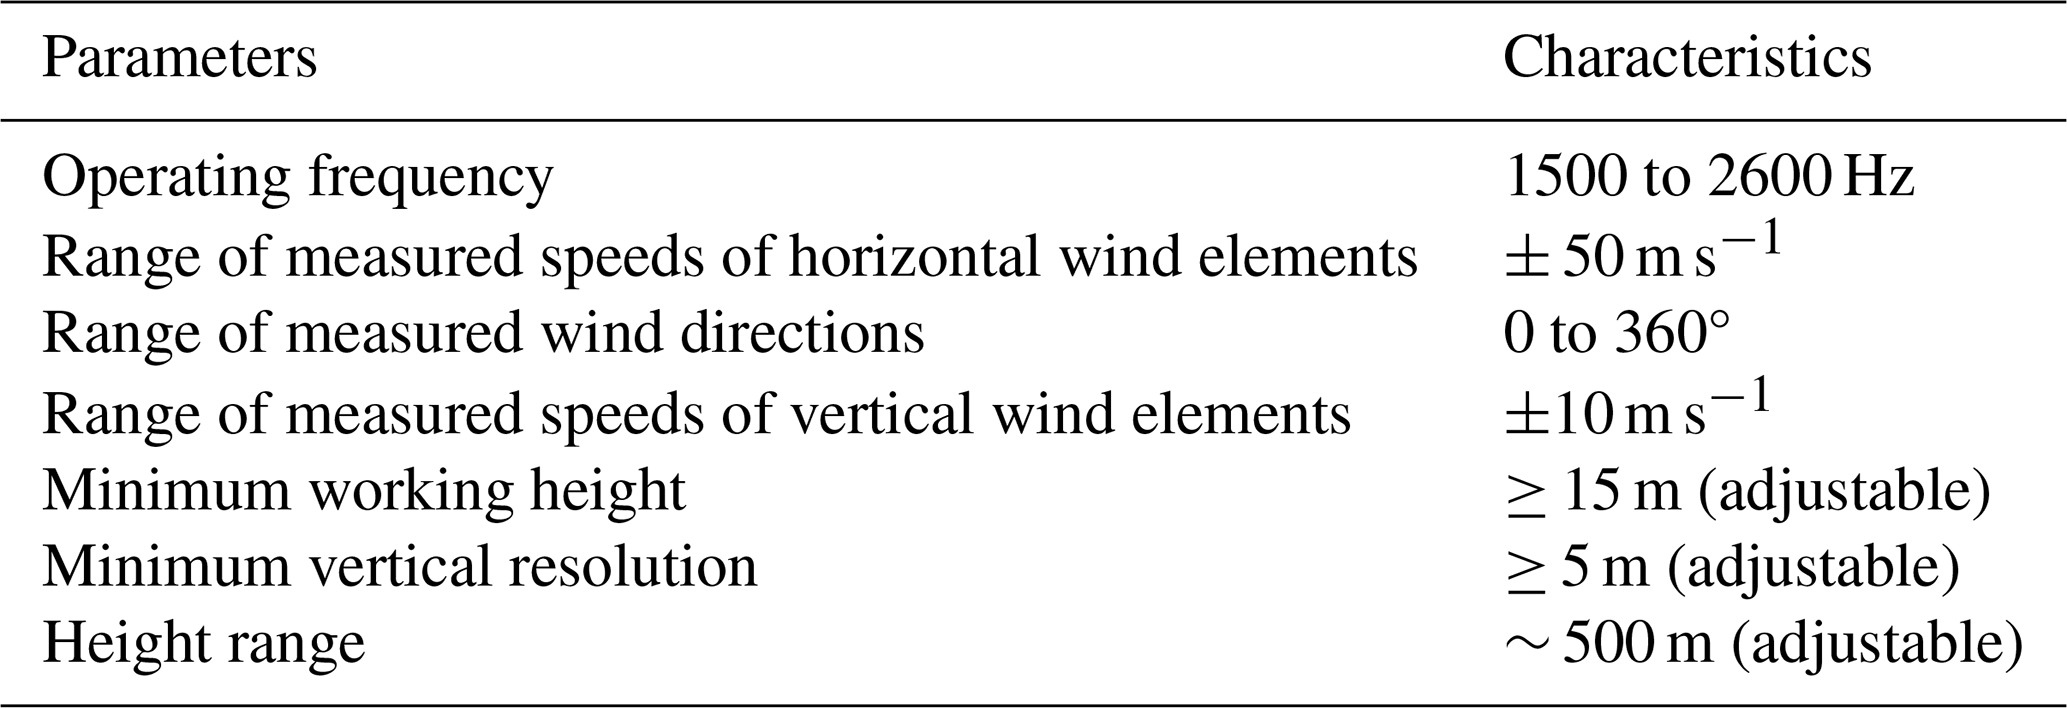

Figure 3METEK sodar PC 2000-24: (a) antenna panel with phased circuit, consisting of 24 speakers; (b) Swoszowicka Street in Krakow.
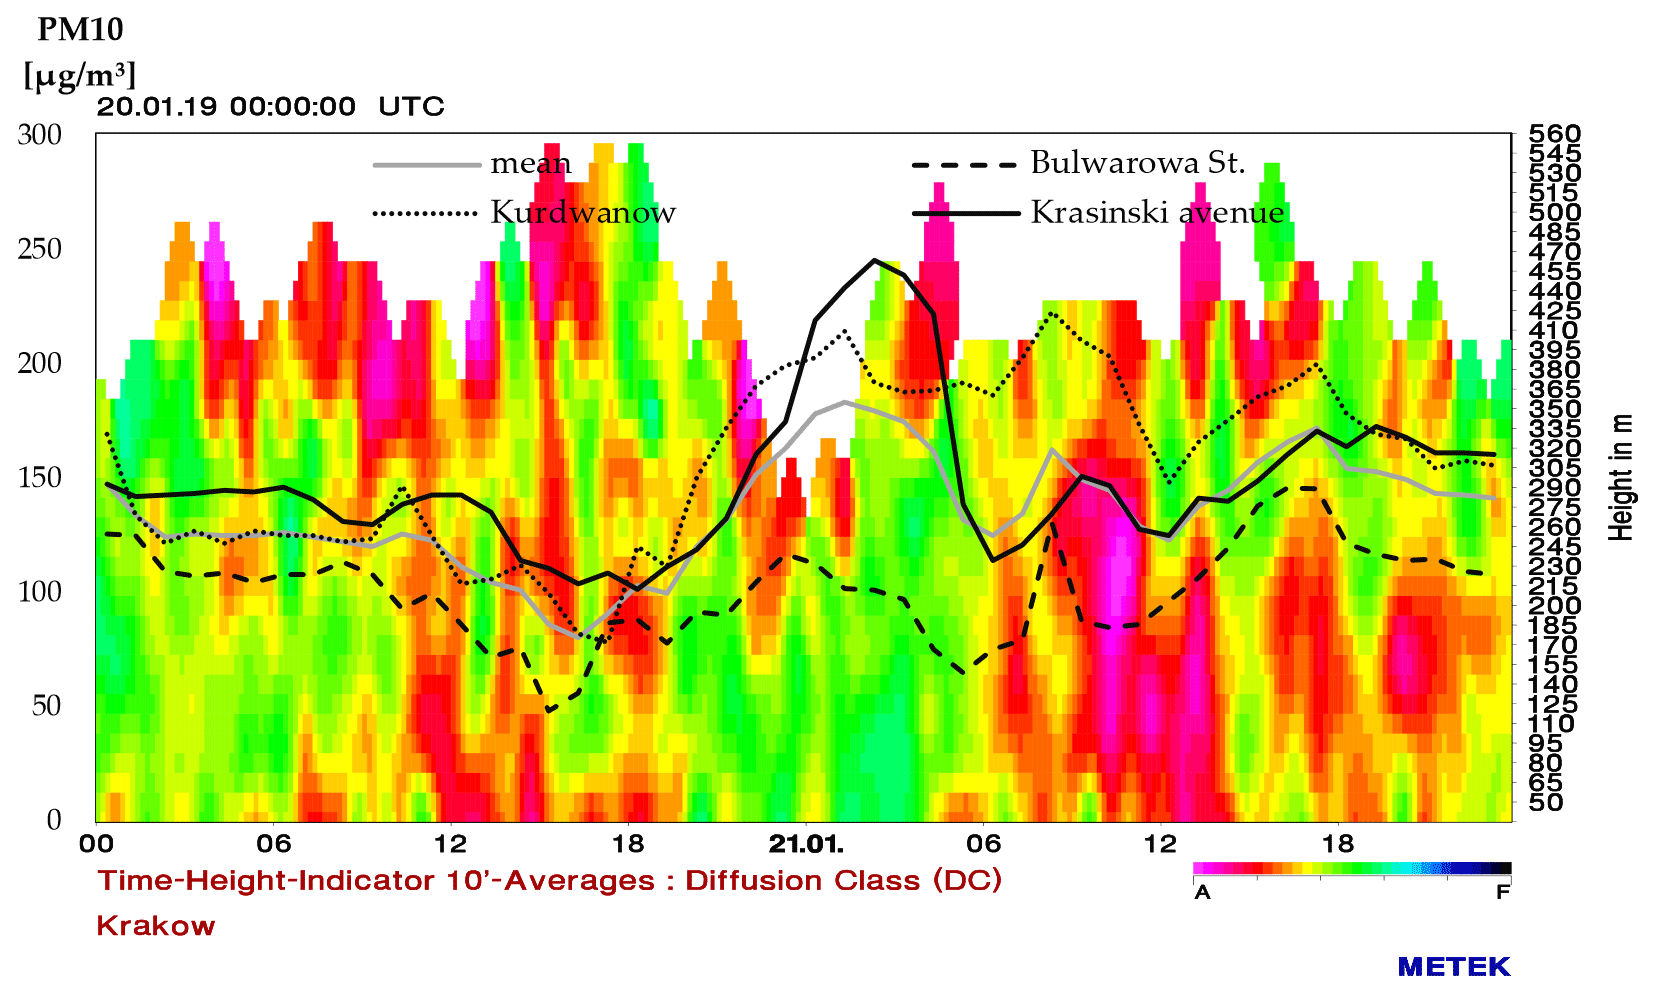
Figure 4PM10 concentrations at selected environmental monitoring stations in Krakow and the average measurements as at 20 January 2019 compared to atmospheric stability classes calculated based on sodar data.
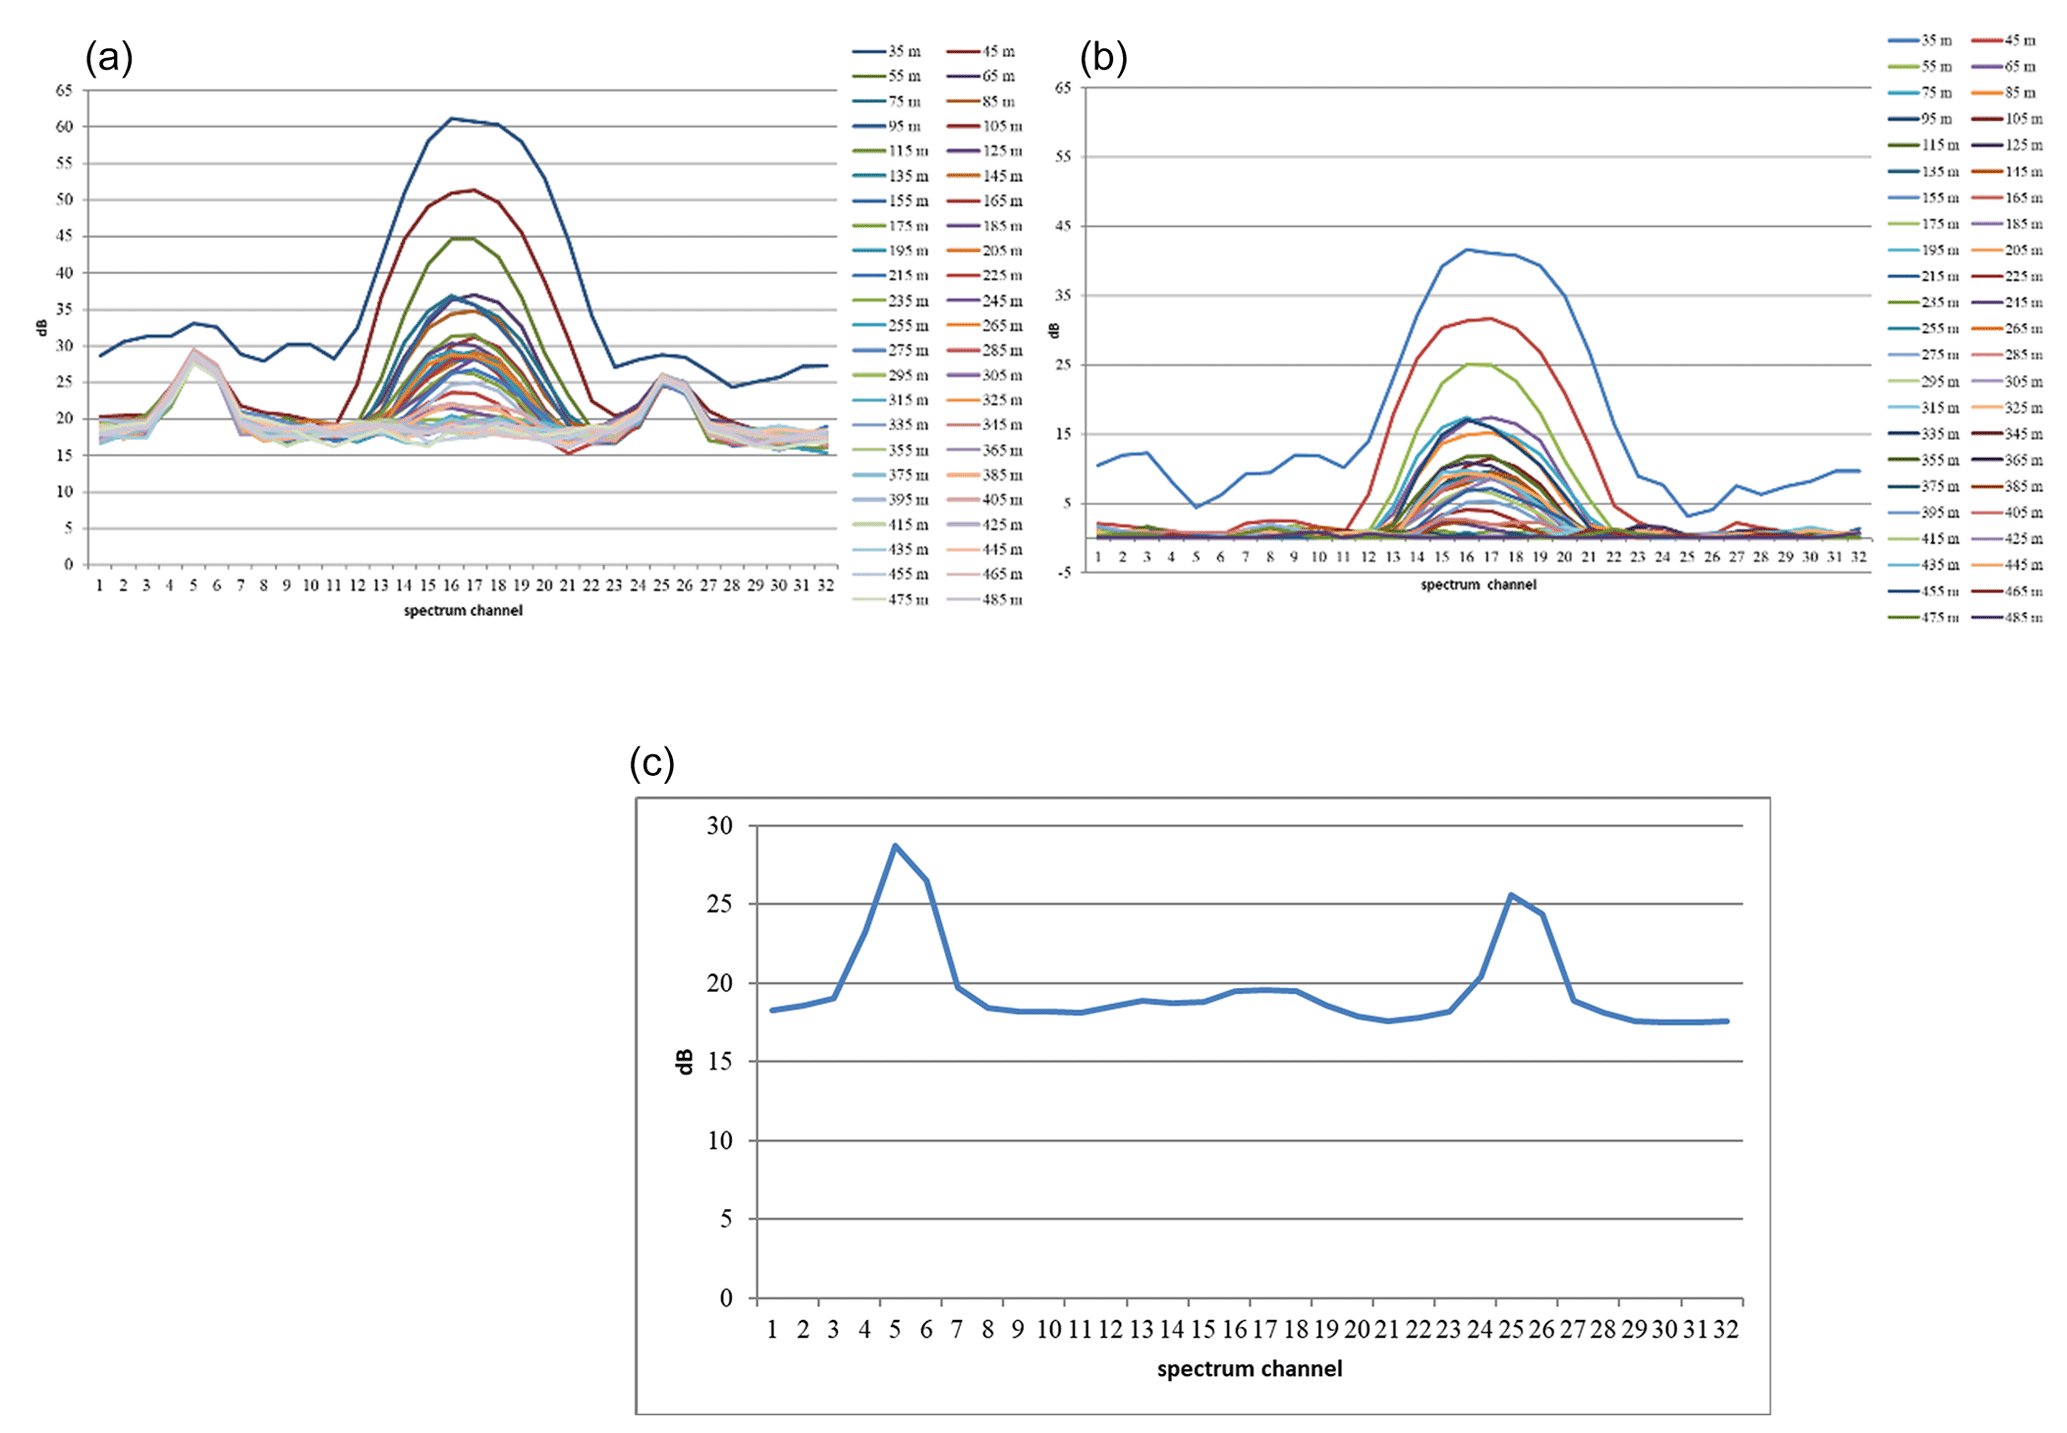
Figure 5Example of filtering the sodar spectrum over 32 channels: (a) original spectrum, (b) spectrum with subtracted background, (c) context.
The methodology for compiling sodar measurement results has been described by Emeis (2011) and Netzel et al. (2000), among others, and its usefulness is demonstrated by Simakhin et al. (2017), Sgouros et al. (2011) and Yushkov et al. (2007). Sodar measurements are used for diagnostics or for setting physical property parameters in the atmospheric boundary layer (ABL). Other uses of sodar were presented by Yang et al. (2020), who suggested using advanced sodar data to forecast wind energy resources.
During the development of this study, the sodar systems were located near the Krzemionki Reservoirs at Swoszowicka Street in Krakow. It should be mentioned that these sodar locations represent a compromise between the presentability of the measurement site for the largest possible area and the technical and organisational conditions required for the colocation of sodar systems (Fig. 2, Table 2).
Sodar measurements make it possible to determine several meteorological parameters and standards that can be directly used to analyse the air ventilation conditions in the city. These parameters include the following:
-
wind speed (WS) and wind direction (WD) of the horizontal wind component (v and y);
-
wind speed and wind direction of the vertical wind component (w);
-
atmospheric stability classes (the sodar parameter is called diffusion class (DC)), which describe the stability of the atmosphere according to the modified Pasquill–Turner classification system, expressed by letters A to F (or numbers 1 to 6), where classes A, B and C (1 to 3) mean extremely, moderately and slightly unstable atmospheric conditions; respectively, class D (4) means neutral and classes E and F (5 and 6) mean stable and highly stable atmospheric conditions.
All these elements were defined at levels up to 500 m above ground level (a.g.l.) with an approximate vertical resolution of 10 m (a.g.l.). Sodar also provides raw data that determine the transmitted and reflected signal and noise spectrum parameters. These data were taken as input for the development of a PM10 forecasting algorithm based on sodar data.
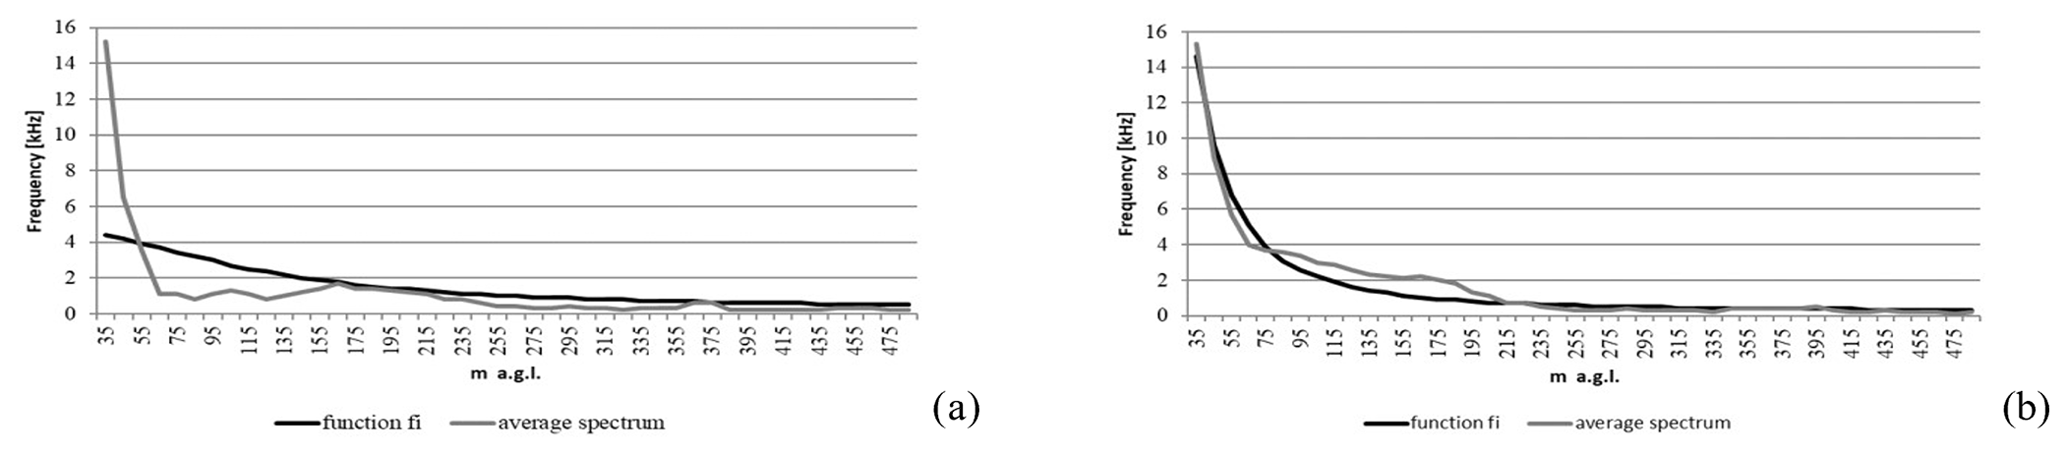
Figure 6Graph of the regularity coefficient for parameter a (mean spectrum – spectrum average) compared to the PM10 concentration: (a) irregularity at 18:00 UTC, (b) good regularity at 23:00 UTCon 26 January 2018.
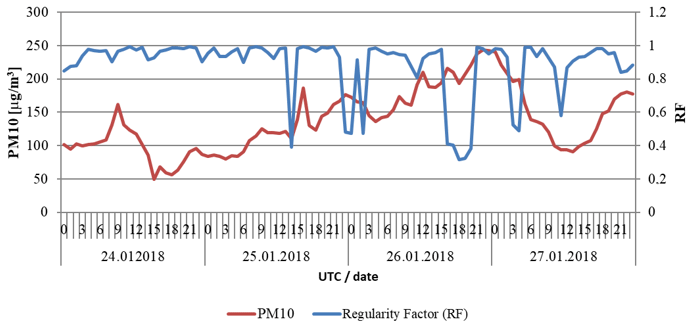
Figure 7Example of the regularity factor (RF) for characterisation (mean spectrum or spectrum average) between the sodar data height v of 35–205 m a.g.l. and PM10 concentration.
3.2 Sodar-based PM10 prediction method
3.2.1 Justification for use
The analysis of episodes of high concentrations of PM10 in Krakow and the classes of atmospheric stability identified by sodar led to the use of sodar data for short-term forecasting of PM10 concentrations in the city. Figure 4 illustrates an episode of high concentrations of PM10 dust against the background of DC determined from sodar.
The lack of a clear relationship between the high DC obtained from the visualisation of sodar data and the simultaneous high concentration of PM10 dust in stagnant weather conditions (high-pressure system, low wind speed, temperature inversion conditions) suggests that the sodar data concerning only DC are insufficient for a precise diagnosis and prediction of the episodes of high PM10 concentrations. In view of the above, it was decided to use properly processed data of the sodar spectrum, assuming that this would allow for a more thorough analysis of ventilation conditions.
3.2.2 Preparation of sodar data filtration
To build the PM10 concentration forecast, the basic results of sodar measurements as a spectrum were used, i.e. a set of amplitudes of signals returning to the sodar receiver from the reflection of sound transmission of a single frequency. Finding the required information in this way seemed to be the most promising option given the purpose of the study (which was to analyse the ventilation conditions of air in the atmosphere). When a signal is reflected through different layers of the atmosphere, it becomes scattered. The spectrum was recorded on 32 frequency channels around the transmission frequencies. In a homogeneous atmosphere, the spectra should take the form of noise. An initial transformation was required to improve the transparency of the basic data of the sodar spectrum. After analysing the spectrum for all altitudes and on different dates, it was found that, as the altitude increased, the variability of the amplitudes of all frequencies in the spectrum decreased, and a tendency towards a non-zero, almost constant function appeared. In addition, secondary maxima (external sound emitters) could distort the analysis. It was also found that the shape of the spectrum was similar to the Gaussian curve. It was decided that the spectra should be simplified by subtracting their common part; this was similarly the case for spectra at all altitudes. This process is shown in Fig. 5a–c. The first graph (Fig. 5a) shows the original spectra measured at different altitudes, the second graph (Fig. 5b) shows the spectra after subtracting their common part, and the third graph (Fig. 5c) shows the common part of all spectra called the spectral background.
The example refers to a 5 min period on 7 October 2017. This is an illustration of the spectrum development method. Only the filtered spectra were used for further study. In addition, in order to slightly reduce the number of data and to adjust the frequency of air volume measurements, the spectrum of interest was averaged to 1 h. However, sodar measures the data at 10 min intervals.
3.2.3 Spectral properties of sodar data
Because of the difficulty in comparing full spectra (a string of 32 values at each height) with each other and with spectra from other periods, each spectrum was characterised by a single number (parameter). Thus, there arose many functions of real values, the argument of which is height. Any such function will be called the atmospheric state profile (ASP). The most commonly observed feature of ASP is a rapid, non-linear decrease in value as the height increases. Attempts were made to determine as many parameters of the spectrum as possible. The numerical characteristics of the spectrum were chosen following a statistical approach without analysing their physical interpretations.
The characteristics with which ASP was determined were as follows.
- A.
Mean value of the sodar reflection spectrum
- B.
Maximum value of the spectra with a beam
- C.
Signal-to-noise ratio (SNR)
- D.
Modal value (channel number with maximum high spectrum)
- E.
Standard deviation
- F.
Median
- G.
Skewness
- H.
Kurtosis
- I.
Similarity to the Gaussian curve
Table 3Basic statistical characteristics of the differences between forecasts and PM10 measurements for the entire data population from October 2021 to March 2022.
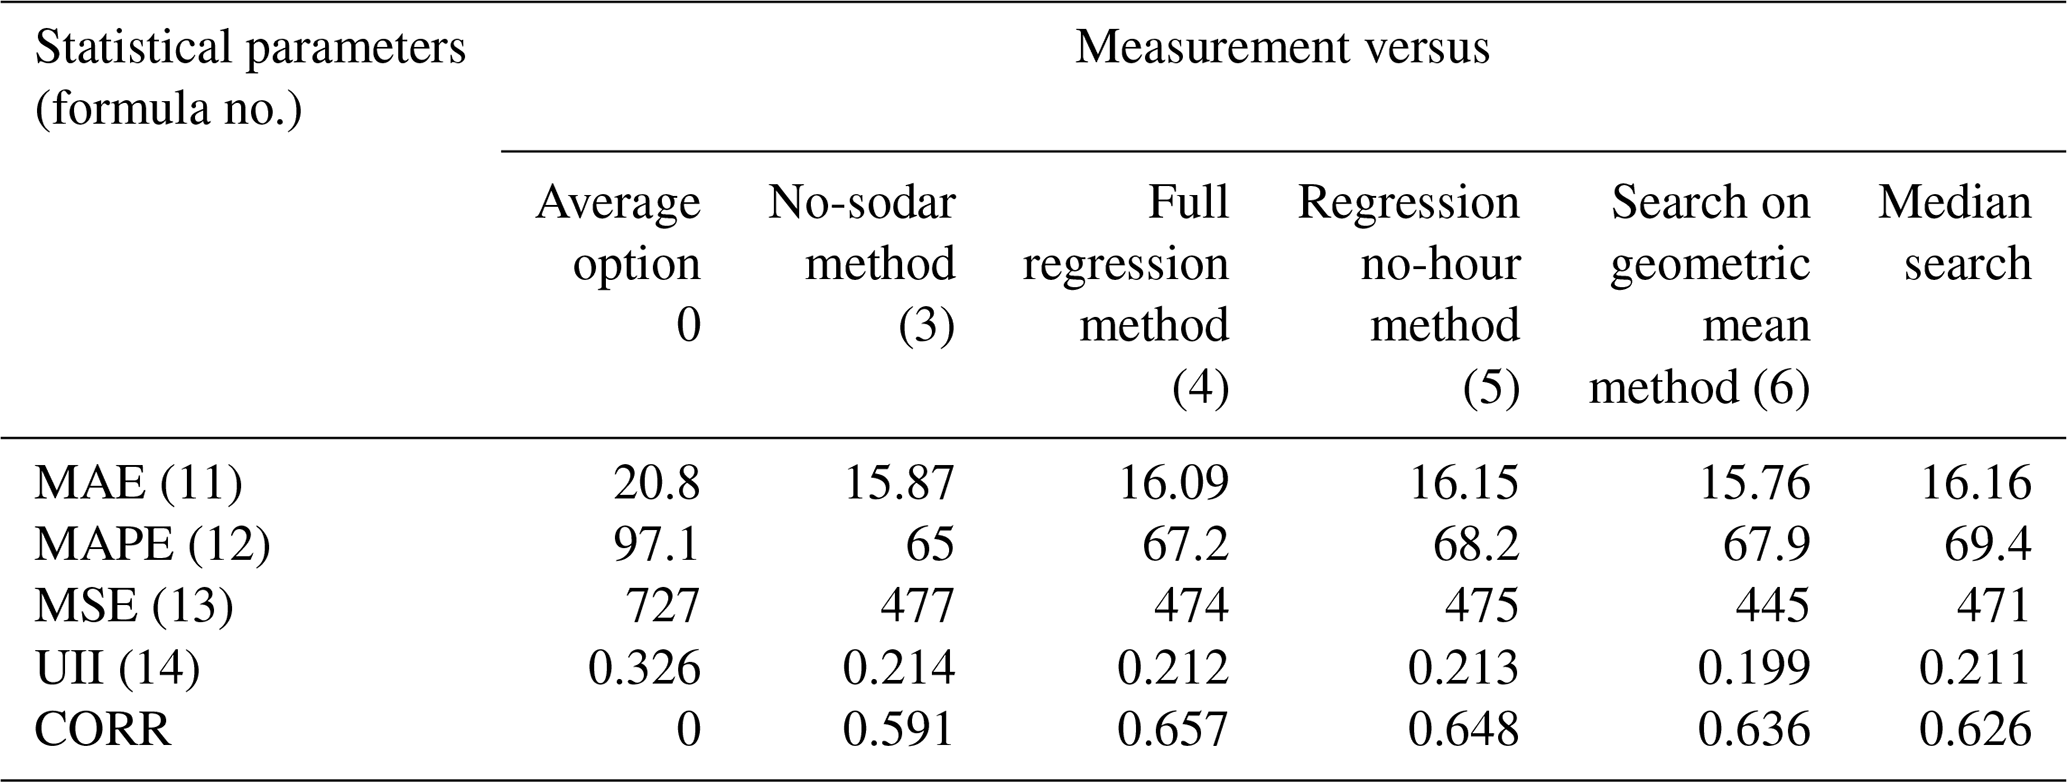
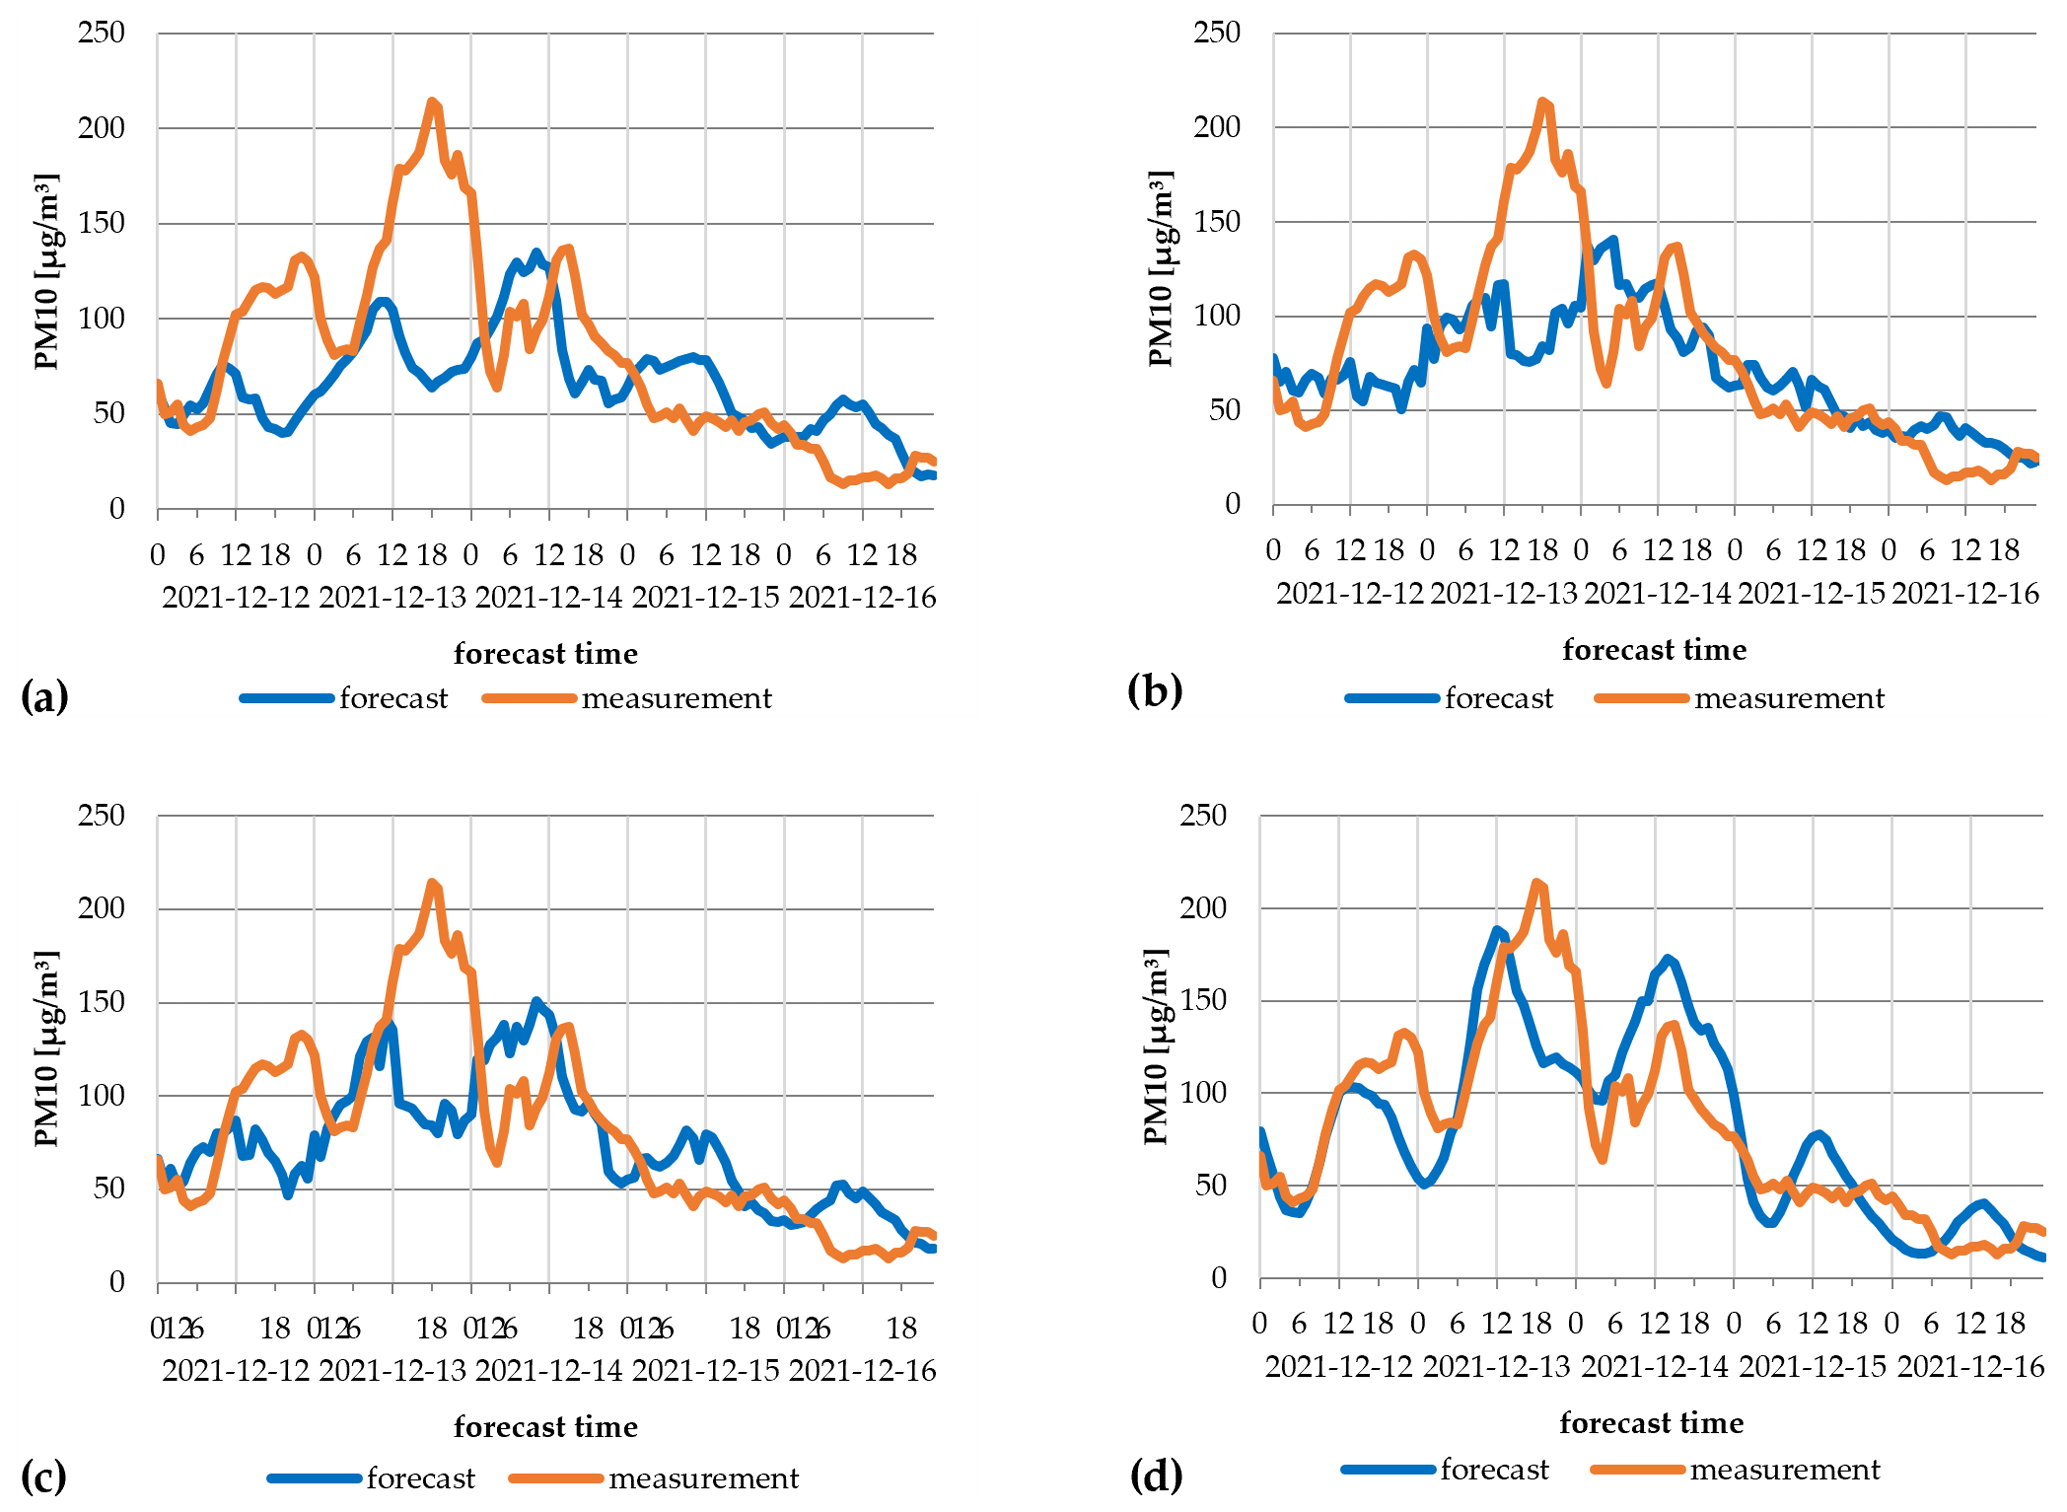
Figure 9Measurements and forecasts for 12–16 December 2021: (a) forecast without sodar data, (b) forecast predicted by regression without hours, (c) full regression forecast, (d) search method forecast.
Analysing ASP shapes, their similarity to the Φ function turned out to be familiar (Eq. 1):
The ASP for the parameter C profile was similar to another feature (Eq. 2):
The functions Φ and Ψ were chosen arbitrarily. Parameters a, b and c of Eqs. (1) and (2) were determined for individual ASPs (h – height above ground level using the quadratic mean approximation method). The mean-square approximation method determines the quality of the model's matching with the measurement data in the form of a coefficient of determination (the square of the correlation coefficient). This coefficient for transparency is marked RF (regularity factor) and ranges from 0 (significant irregularity) to 1 (perfect regularity).
The sample analysis suggested that RF = 0.373 means poor regularity (Fig. 6a), and RF = 0.956 means good regularity (Fig. 6b). A general feature was that the transformed spectra were close to zero from a certain height. Therefore, the calculations included up to 19 heights (215 m).
Figure 7 shows that the ASP at 18:00 UTC was irregular, meaning that the vertical structure of the atmosphere was deformed and irregular. ASP at 23:00 GMT was almost perfect. This led to an investigation of the relationship between the value of ASP and PM10 concentration. For example, the chart in Fig. 7 shows that 24–27 January 2018 is the period during which excessive PM10 concentrations occurred. The regularity factor for the characteristic was compared with the average concentration of PM10 from three automatic NEM stations near the sodar location (Krasinski Avenue, Bulwarowa Street and Bujaka Street). The three stations were selected for analysis because they are located in different areas of spatial development. These allowed us to approximate the average PM10 concentration for Krakow as they had the most complete series of measurements. For example, only one RF was shown in the graphs for clarity, but the other regularity factors were similar. On this basis, it was hypothesised that ASP was disturbed a few hours before the increase in PM10 concentration. The hypothesis was developed based on the analysis of many charts, including Fig. 7. This happened so often that it became the inspiration for this work.
For a complete description of the state of the atmosphere, it was decided that the meteorological RF wind characteristics should be added to the regularity coefficients A to I:
- J.
horizontal wind speed (averaged in ASP)
- K.
vertical wind speed (difference: min − max)
- L.
wind direction (dispersion of direction around the average vector of this wind direction)
- M.
temperature measured with sodar at 2 m a.s.l.

Figure 10Measurements and forecasts for 25–30 December 2021: (a) forecast without sodar data, (b) forecast predicted by regression without hours, (c) full regression forecast, (d) search method forecast.
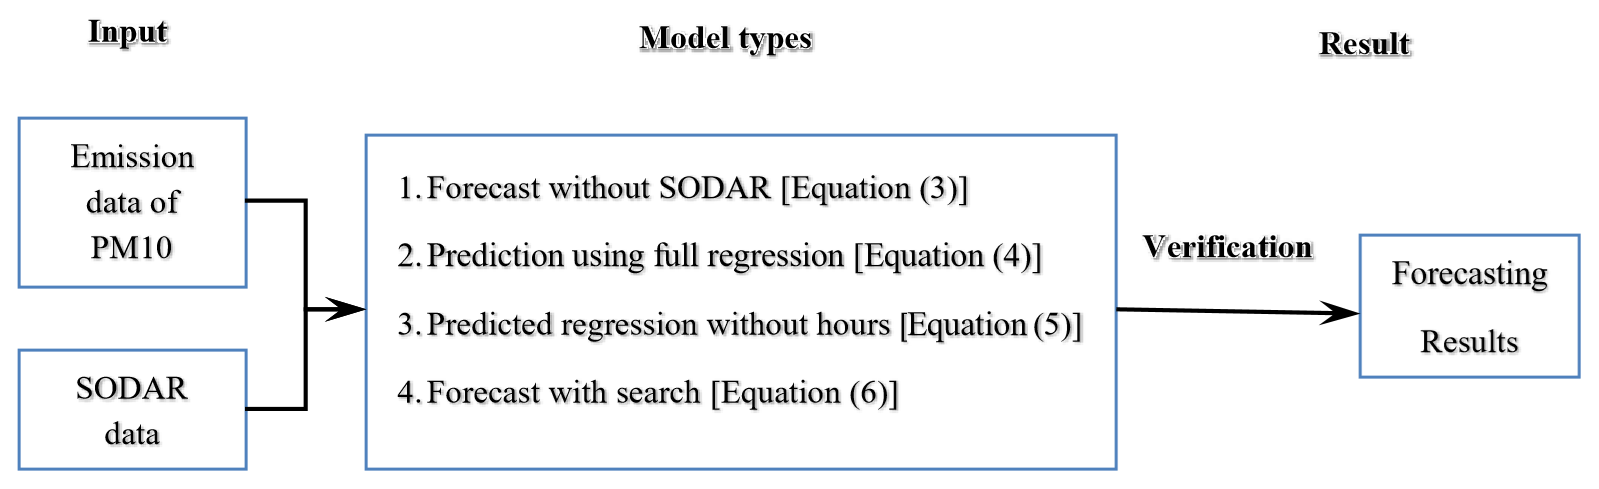
This article proposes four methods of forecasting PM10 concentration in Krakow. Three use sodar data, and the fourth is a reference method for a forecast when only pollution data are available. The forecast is for the 12 h time horizon, and the forecasting methods are based on sodar and pollution data for the October–March winter seasons of 2017–2019. Reference data from 1 October 2021 to 28 February 2022 were used to compare the methods. Each method was employed to calculate the forecast every hour, and the results were compared with the actual (mathematical statistics: MEA, MAPE (mean absolute percentage error), MSE (mean square error), Theil's inequality coefficient UII measurements of PM10 concentrations. Thanks to this, a quantitative assessment of each method was made, and a correlation coefficient was derived for the relationship between PM10 measurements and short-term PM10 forecasts. Four methods for predicting PM10 concentrations have been developed, with descriptions and application systems of the methods explained below (Fig. 8).
4.1 Reference method without sodar data
Linear regression n was used to calculate the coefficients in Eq. (3):
where h is the hour of the day.
4.2 Full regression method
Linear regression was used to calculate the coefficients in Eq. (4):
The corresponding transformations led to a weather pattern:
RFch means the regression coefficient for the characteristic ch = A, ..., M.
4.3 Hourless regression method
In the full regression method, the arguments (independent variables) removed factors related to daily periodicity since they also characterised sodar factors. As a result, the following equation was formed:
The corresponding transformations have led to a forecasting pattern:
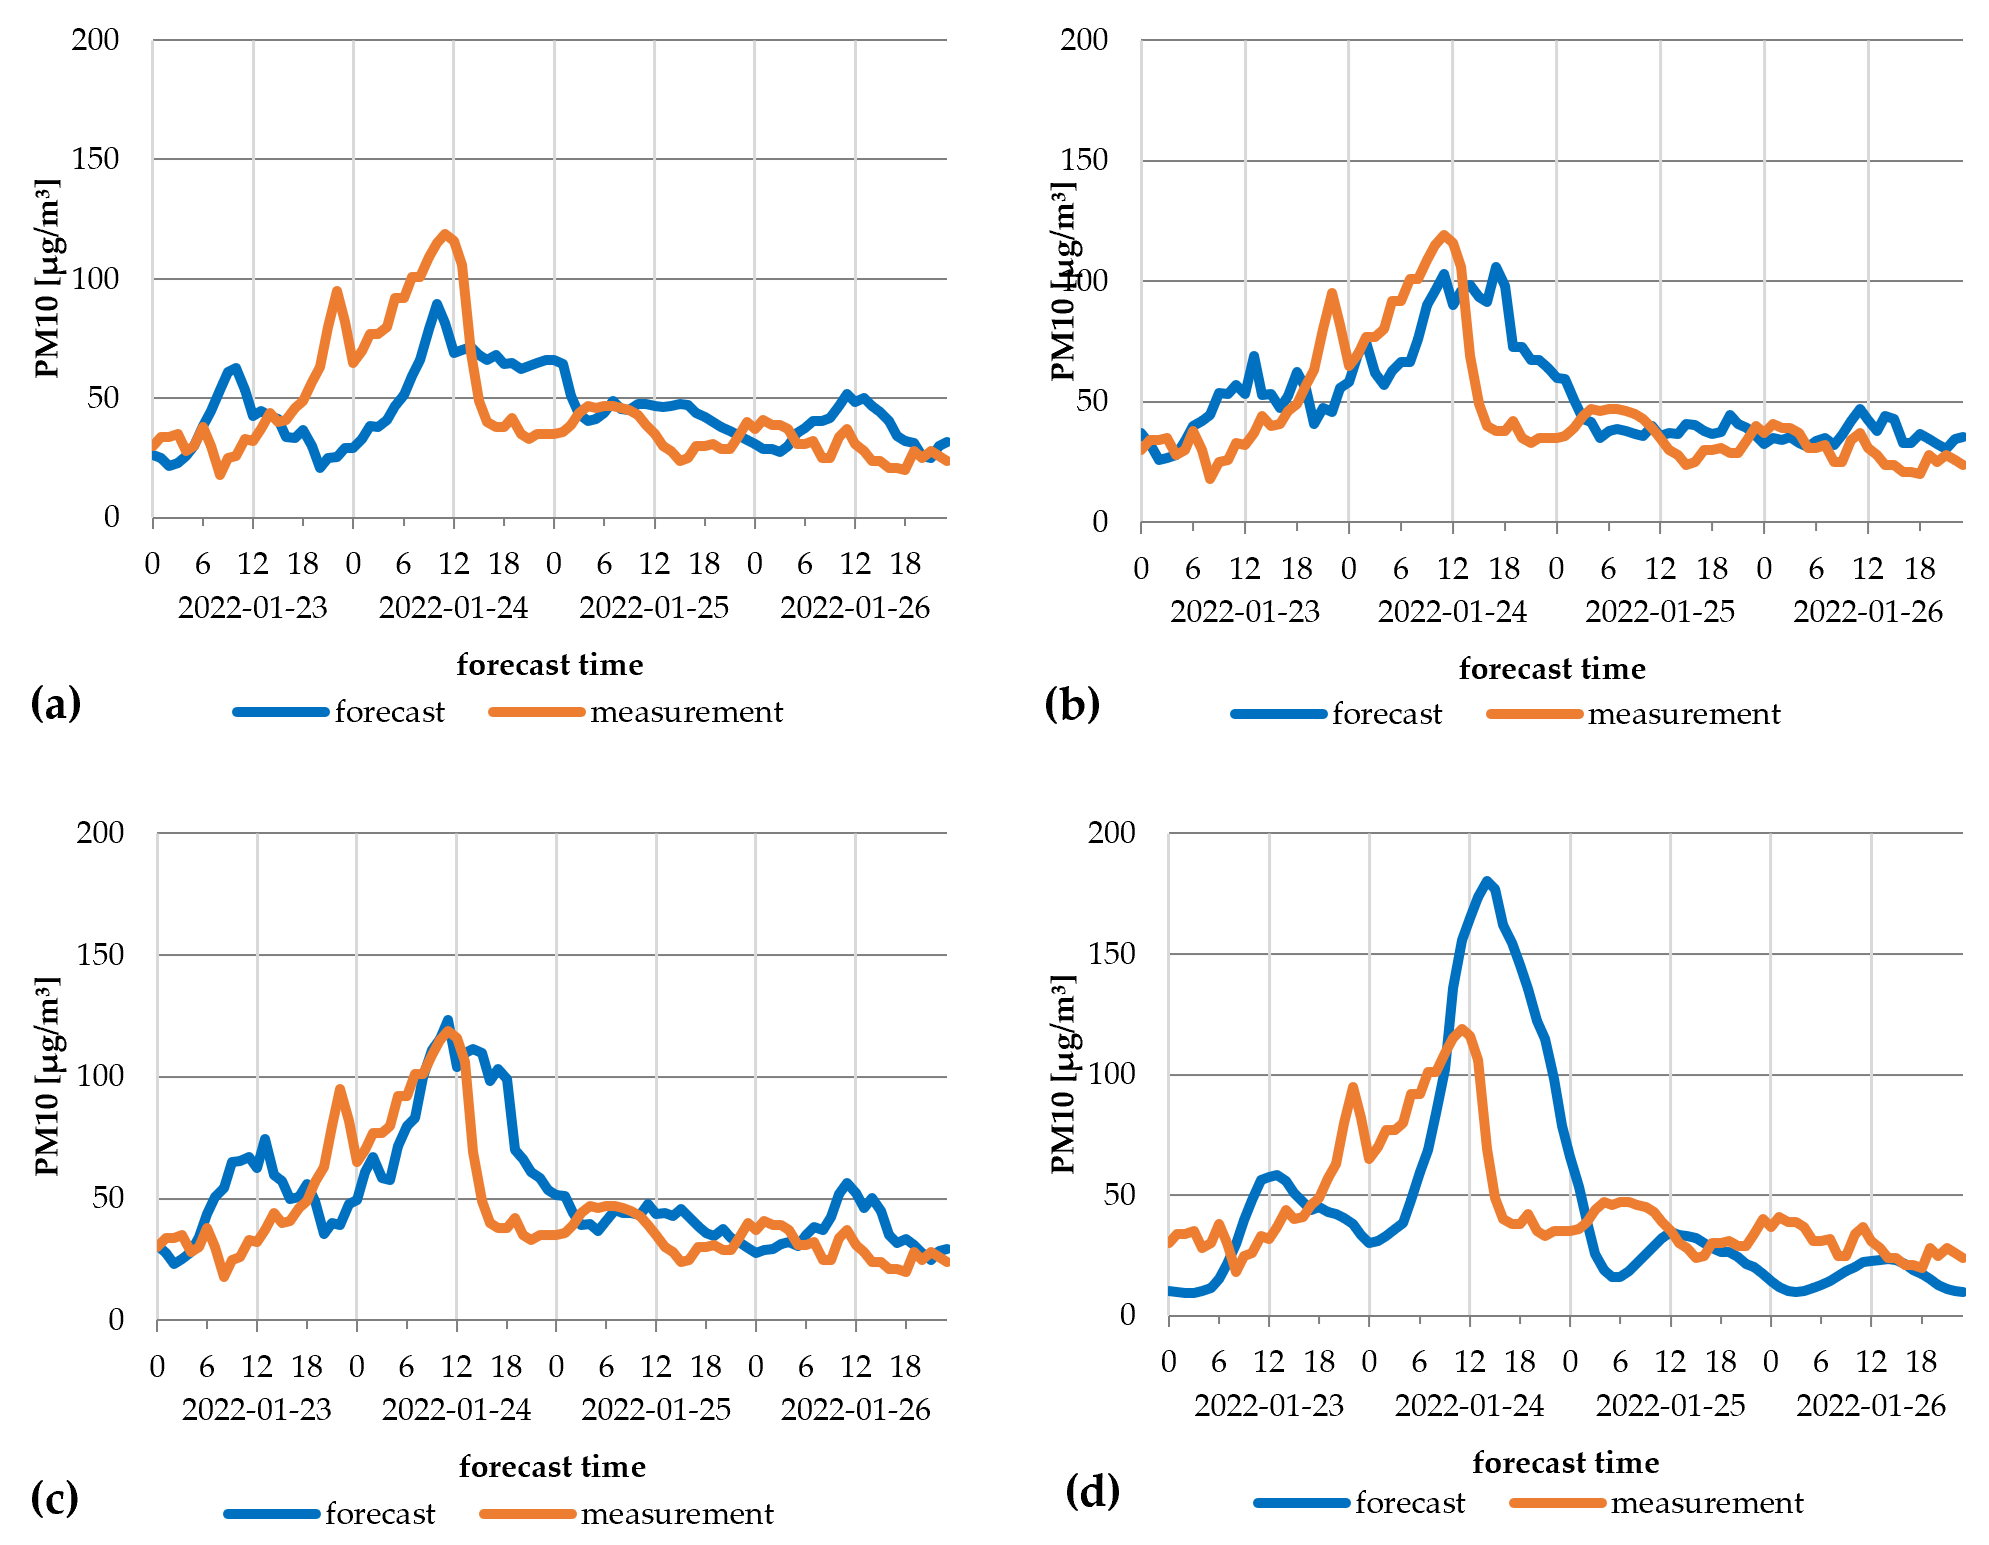
Figure 11Measurements and forecasts for 23–26 January 2022: (a) forecast without sodar data, (b) forecast predicted by regression without hours, (c) full regression forecast, (d) search method forecast.
4.4 Search method
There is a method using an algorithm that is more flexible and can accommodate changes and improvements. The main idea of the method is to find the conditions in historical data (data mining, big data, big-data form) closest to the state of the atmosphere at the time of forecasting.
Historical data and current state are expressed as a vector of numbers:
The historical data for each X contain the actual values of PM10 concentration after 12 h, which means that there is a sequence of pairs {(X (0), PM10 (12)), (X (1), PM10 (13)), ..., (X(n), PM10 (n+12))}. Y denotes the vector of the current state. Y is related to X (0), ..., X(n), and the resulting extended sequence is normalised as follows:
where max and min are the maximum and minimum numbers for the corresponding coordinate. The values of each coordinate are reduced to [0,1]. The sequence (0), ..., is searched for the most similar vectors . To avoid the effects of the “dimensionality curse”, which means poor differentiation of radix in Euclidean spaces greater than 10, a fractional distance is used:
where .
The most similar vectors are selected (X (k1), …, X (ks)), and the value PM10 (k1+12), …, PM10 (ks+12) is used to generate a forecast for a situation 12 h after the current state. This may be an arithmetic mean, but in practice, the geometric mean is better. The values of k and s can be specified at any time. For the purposes of this test, k=0.6.
Thus,
denotes the element that fulfils this minimum. PM10 (hmin + 12) can be taken as a 12 h forecast in the current situation. However, such a choice is very ineffective. That is why we propose a statistical approach.
It is guided by inequality:
For the sample, the values of PM10 (h+12) were selected for the periods in which the inequality is satisfied. Various descriptive statistics can be calculated based on the sample obtained this way. This may be an arithmetic mean. In practice, the geometric mean was better. In addition, good results were obtained for the median or quantiles (0.35) and (0.6). The values of τ and k can be specified at any time. For the purposes of the study, k=0.6 and τ=0.5 were assumed. The sample size was usually around 100.
The undoubted advantage of this method is the constant supplementation of historical data. After 12 h, when the concentration of PM10 is known, the current state (situation) is considered to be historical, and these latest historical data drive further forecasts. This method also uses the division of modelling results into the geometric mean and the median.

Figure 12Measurements and forecasts for 13–16 February 2022: (a) forecast without sodar data, (b) forecast predicted by regression without hours, (c) full regression forecast, (d) search method forecast.
Table 4Basic statistical characteristics of the differences between PM10 projections and measurements for 100 PM10 episodes (µg m−3) from October 2021 to March 2022.
4.5 Results
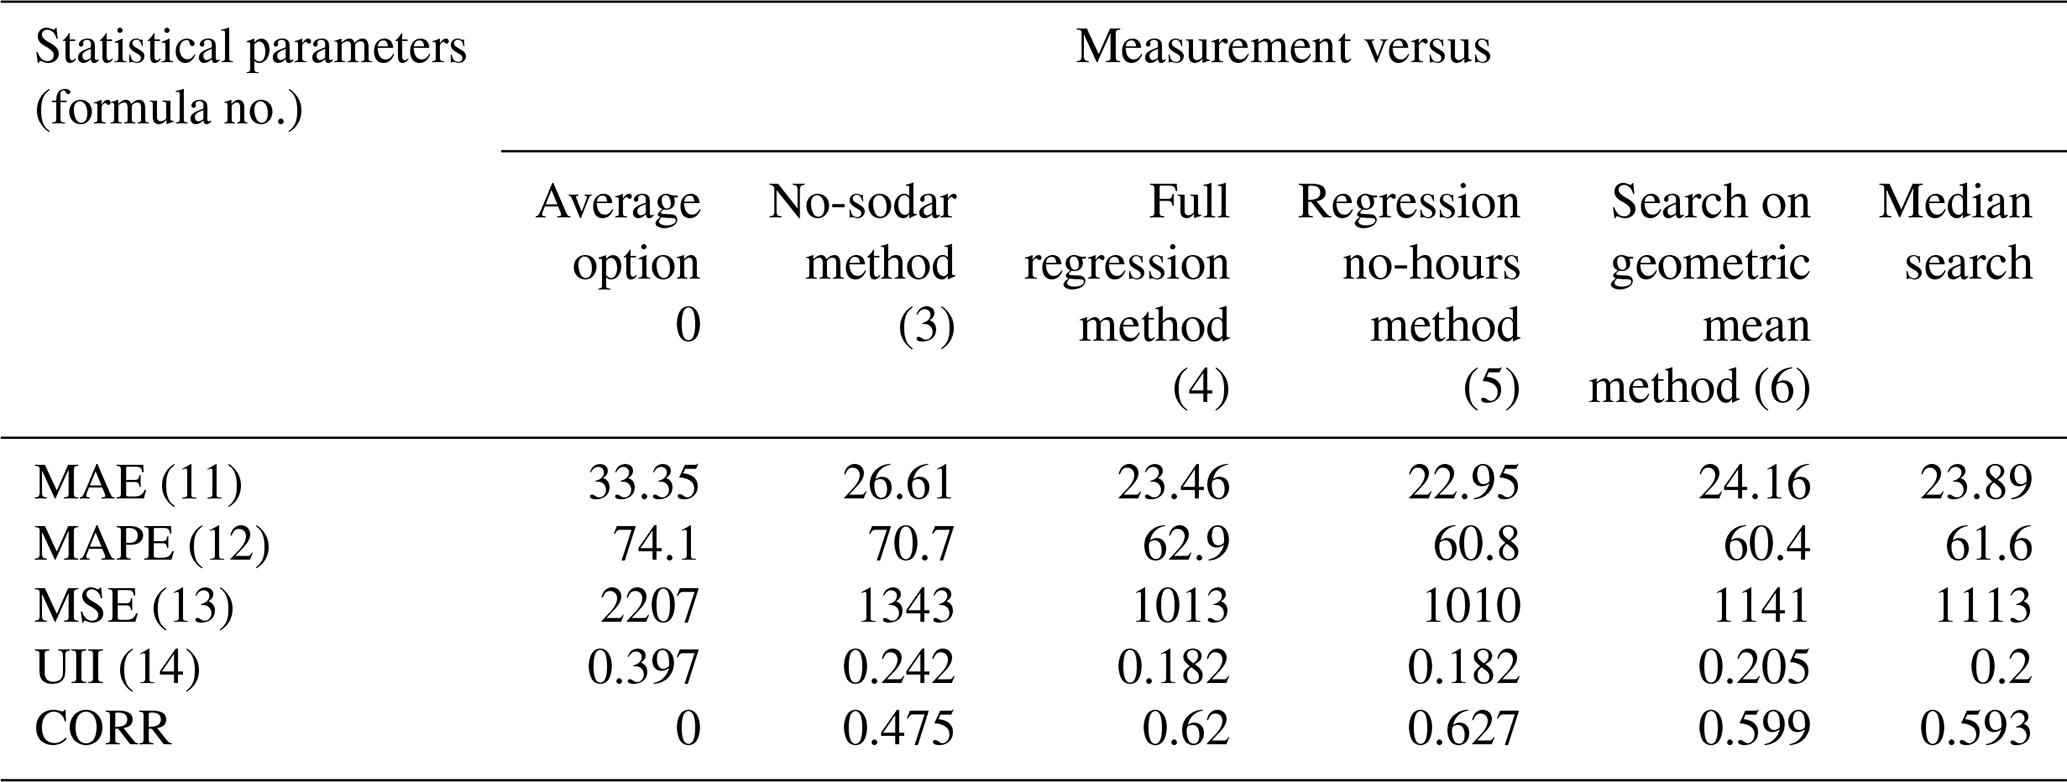
Forecasting methods were verified for the entire population of areas with an average PM10 concentration in Krakow from October 2021 to March 2022 and with episodes of high PM10 concentration (during which the momentary PM10 concentration was above 100 µg m−3). The initial forecast assessment compared with a situation in which the forecast would be replaced by an average value (option 0). The first step to verify the correctness of the forecasting was to determine the forecast errors for the entire data population using the following metrics:
MAE – mean absolute error:
MAPE – mean absolute percentage error:
MSE – mean square error:
and UII – Theil's coefficient:
where T is the sample size (forecast length), yt represents the measurement value, denotes the measurement forecast, and CORR is a correlation factor.
The results concerning the whole population revealed that the error results were better for all forecasting methods than if the average value was used (Table 3). This means that the forecasts have been made as intended. Analysis of specific model data revealed various statistics in relation to forecast errors, while the MAE (11) achieved the lowest values for the prediction of the search method using a geometric mean (15.76). MAPE (12) had the lowest value for the reference method with no sodar data (65 %). MSE (13) and UII (14) proved that the search method using the geometric mean was the best. CORR analysis showed that it was best with the full regression method. The results of such analyses for the whole population did not show a preference for a single forecasting method.
In the second stage, episodes of high PM10 concentration were distinguished for detailed analysis. Episodes of high PM10 concentration are critical for providing free public transport in Krakow (where PM10>100 µg m−3). Four such episodes were recorded from October 2021 to March 2022: 12–16 December 2021, 25–30 December 2021, 23–26 January 2022 and 13–16 February 2022. The trend in the observed PM10 concentrations and the projections based on four interesting methods are shown in Figs. 9 to 12.
The above trends in PM10 predictions compared to measurements during PM10 episodes > 100 µg m−3 (Figs. 9 to 12) revealed that each prediction method underestimated the measured maximum PM10 concentration. It should also be noted that the discrepancy between predictions and measurements changed with episodes. It can be concluded that the meteorological origin of each episode was different, which made forecasting difficult. Despite these discrepancies, it was found that each forecasting method provided a trend result that mimicked the measurements, sometimes with a delay of several hours. The methods fit well under certain circumstances. This was the case, for example, for the forecast (d) for the section 12–16 December 2021 (Fig. 9d), forecast (d) for the section 25–30 December 2021 (Fig. 10d) and the forecast (c) for the section 23–26 January 2022 (Fig. 11c).
The aggregated characterisation of the forecast error statistics for episodes (Table 4) revealed that, as with the entire data population, each forecasting method produced better results than the average values, meaning the predictions were useful. As for the statistical parameters studied, the fifth method – regression without hours (with the lowest MAE, UII and MSE and the highest CORR) – was the best fit. However, this does not mean this method is universal or suitable for every episode, as shown above.
The use of PM10 forecasts for short-term improvement of air quality is becoming more and more frequent in Poland (3 d forecasts and forecasts of the Chief Inspectorate for Environmental Protection, available online: http://powietrze.gios.gov.pl/pjp/airPollution, last access: January 2024). However, air quality forecasting is rarely used to guide administrative and economic decision-making (e.g. providing free public transport). This is because inaccurate forecasts cause high social costs (dissatisfaction of residents) or unjustified financial costs (lack of revenue from public-transport tickets). Therefore, applying air quality models to these forecasts must ensure as little loss as possible due to poor decision-making.
The research discussed here shows that using sodar data to support an air quality forecasting system is reasonable. In particular, the following proposals were made:
-
The sodar model can be complementary to other forecasting methods as it is highly useful due to its simplicity and speed of calculations.
-
The sodar model does not require emission data, for which temporal and spatial variability are difficult to verify quickly.
-
Table 4 shows that, especially at high concentrations, sodar data provide significant information relative to the model (3) without sodar.
-
The use of simple formulas for regression models in forecasting while maintaining their multi-variance (taking into account the four forecast options) facilitates the optimisation of the predictive process.
-
The model is ready for use, but work is underway to improve it through a different selection of sodar parameters.
Applying the model proposed in this article may improve short-term air quality predictions, although the model still requires further testing, especially for episodes of high PM10 concentrations.
The meteorological data used in this paper (the wind roses) are available to the public: https://danepubliczne.imgw.pl/ (IMGW-PIB, 2022). The air quality data used in this paper are available to the public: https://powietrze.gios.gov.pl/pjp/archives/ (GIOŚ, 2022). The owner of the sodar is Krakow City Hall, but it is lent to IMWM-PIB. The measurement results are not made publicly available because they constitute raw data and are prepared periodically after validation.
Idea and conception: EK and LO. Methodology: EK. Software: MW. Validation: MW and EK. Formal analysis: LO. Investigation: LO. Resources: EK. Data curation: EK. Writing – original draft preparation: LO. Writing – review and editing: EK. Visualisation: EK. Supervision: MW. Project administration: LO. Funding acquisition: LO. All the authors have read and agreed to the published version of the paper.
The contact author has declared that none of the authors has any competing interests.
Publisher's note: Copernicus Publications remains neutral with regard to jurisdictional claims made in the text, published maps, institutional affiliations, or any other geographical representation in this paper. While Copernicus Publications makes every effort to include appropriate place names, the final responsibility lies with the authors.
The authors thank the Ministry of Science and Higher Education of the Republic of Poland, the Office of the City of Krakow and the Institute of Meteorology and Water Management – National Research Institute for the opportunity to use the results of the research carried out under the projects AIR BORDER (contract no. 3911/INTERREG VA/2018/2), MONIT-AIR (co-financed by the Financial Mechanism of the European Economic Area 2009–2014) and AIR TRITIA (contract no. CE1101).
The paper was financed with funds for scientific research from IMGW-PIB.
This paper was edited by Jun Wang and reviewed by two anonymous referees.
AQP Air Quality Portal: Forecast per day, Chief Inspectorate for Environmental Protection, https://powietrze.gios.gov.pl/pjp/airPollution/ (last access: January 2022), 2022.
Arya, P. S.: Air pollution meteorology and dispersion, Oxford University Press, New York, USA, 321 pp., , 1999.
Bajorek-Zydroń, K. and Weżyk, P. (Eds.): Atlas pokrycia terenu i przewietrzania Krakowa, Urząd Miasta Krakowa, WydziałKształtowania Środowiska, Kraków, 552 pp., ISBN: 978-83-918196-5-4, 2016.
Bell, M. L. and Davis, D. L.: Reassessment of the lethal London fog of 1952: novel indicators of acute and chronic consequences of acute exposure to air pollution, Environ. Health Perspect., 109, 389–394, https://doi.org/10.1289/ehp.01109s3389, 2001.
Bokwa, A.: Wieloletnie zmiany struktury mezoklimatu miasta na przykładzie Krakowa, Instytut Geografii i Gospodarki Przestrzennej Uniwersytetu Jagiellońskiego, Kraków, Polska, ISBN: 978-83-88424-53-3, 235 pp., 2010.
Bokwa, A.: Development of research on the local climate of Krakow, Acta Geogr., 108, 7–20, https://doi.org/10.26485/AGL/2019/108/1, 2019.
Dockery, D. W., Pope, C. A., Xu, X., Spengler, J. D., Ware, J. H., Fay, M. E., Ferris Jr., B. G. and Speizer, F. E.: An association between air pollution and mortality in six US cities. N. Engl. J. Med., 329, 1753–1759, https://doi.org/10.1056/NEJM199312093292401, 1993.
European Union: Directive 2008/50/EC of the European Parliament and of the Council of 21 May 2008 on ambient air quality and cleaner air for Europe, OJ L 152, 18 September 2015, 1–44, https://eur-lex.europa.eu/eli/dir/2008/50/2015-09-18 (last access: 2 February 2024), 2015.
Emeis, S.: Surface-Based Remote Sensing of the Atmospheric Boundary Layer, Springer: Dordrecht, Netherlands, Heidelberg, Germany, London, UK, New York, NY, USA, 33–71, https://doi.org/10.1007/978-90-481-9340-0, 2011.
Engelbart, D. A. M., Monna, W.A. A., Nash, J., and Mätzler, C. (Eds.): Integrated Ground-Based Remote-Sensing Stations for Atmospheric Profiling, EUR 24172 – COST-Action 720 Final Report, https://www.knmi.nl/research/publications/ integrated-ground-based-remote-sensing-stations-for-atmospheric-profiling (last access: 24 March 2024), 2009.
Fisher, B., Kukkonen, J., Piringer, M., Rotach, M. W., and Schatzmann, M.: Meteorology applied to urban air pollution problems: concepts from COST 715, Atmos. Chem. Phys., 6, 555–564, https://doi.org/10.5194/acp-6-555-2006, 2006.
German, K.: Fizycznogeograficzne regiony województwa małopolskiego. Folia Geographica, Geogr.-Oeconom., 31–32, 9–38, 2001.
GIOŚ (Inspekcja Ochrony Środowiska): Measurement data archives, https://powietrze.gios.gov.pl/pjp/archives/, last access: 15 July 2022.
Godlowska, J. and Kaszowski, W.: Testing various morphometric methods for determining the vertical profile of wind speed above Krakow, Poland, Bound.-Lay. Meteorol., 172, 107–132, https://doi.org/10.1007/s10546-019-00440-9, 2019.
Godlowska, J., Tomaszewska, A. M., and Hajto, M.: Związek wysokości imisji zanieczyszczeń w Krakowie z warunkami w miejskiej warstwie granicznej, określonymi na podstawie danych sodarowych, in: Klimat i bioklimat miast, edited by: Kłysik, K., Wibig, J., and Fortuniak, K., Wyd. Uniw. Łódz., Łódź, 455–465, 2008.
IMGW-PIB: Dane publiczne, https://danepubliczne.imgw.pl/, last access: 15 July 2022.
Implementation of the “Air Quality Plan for the Malopolska Region – Malopolska in a healthy atmosphere”, LIFE14 IPE/PL/021, https://powietrze.malopolska.pl/wp-content/uploads/2021/07/AQP_Malopolska_Full_text.pdf (last access: 2 February 2024), 28 September 2020.
Jarvis, A., Reuter, H. I., Nelson, A., and Guevara, E.: Hole-filled SRTM for the globe Version 4, available from the CGIAR-CSI SRTM 90 m Database, https://srtm.csi.cgiar.org/srtmdata/ (last access: 6 February 2024), 2008
Ji, M., Jiang, Y., Han, X., Liu, L., Xu, X., Qiao, Z., and Sun, W.: Spatiotemporal Relationships between Air Quality and Multiple Meteorological Parameters in 221 Chinese Cities, Complexity, 2020, 25, https://doi.org/10.1155/2020/6829142, 2020.
Juda-Rezler, K. and Toczko, B. (Eds.): Fine dust in the atmosphere, In: Compendium of Knowledge about Air Pollution in Particulate Matter in Poland, Inspection of Environmental Protection; IOŚ, Library of Environmental Monitoring, Warsaw, Poland, 239 pp., ISBN: 978-83-61227-73-1, 2016.
Lewinska, J., Bartosik, J., Bascik, J., Czerwieniec, M., and Zgud K.: Wpływ miasta na klimat lokalny (na przykładzie aglomeracji krakowskiej), Inst. Kształt. Środ., Warszawa, 1–162, 1982.
Małopolska Regional Assembly: Resolution No. XVIII/243/16 of 15 January 2016 on the introduction of restrictions on the operation of installations in which Fuel Spillage takes place in the Area of the Municipality of Kraków, http://edziennik.malopolska.uw.gov.pl/legalact/2016/812/ (last access: 2 February 2024), 2016.
Matuszko, D. (Ed): Klimat Krakowa w XX wieku, IGiGP UJ, Kraków, Poland, 260 pp., ISBN: 978-83-88424-28-1, 2007.
Morawska-Horawska, M.: Przebieg zmienności pionowego profilu prędkości wiatru w warstwie 300 m w Krakowie, Wiadomości IMGW, 4, 2/3, 123–129, 1978.
Netzel, P., Stano, S., and Zarebski, M.: Troìjmonostatyczny sodar dopplerowski 3DDS, Wiadomości IMGW, 23, 3, 131–136, https://www.worldcat.org/title/trojmonostatyczny-sodar-dopplerowski-3dds/oclc/998387930, (last access: 2 Ferbruary 2024), 2000.
Piringer, M., Joffre, S., Baklanov, A., Burzynski, J., De Ridder, K., Deserti, M., Karppinen, A., Mestayer, P., Middleton, D., Tombrou, M., Vogt, R., and Christen, A.: The surface energy budget and the mixing height, COST Action 715, https://ibis.geog.ubc.ca/ achristn/publications/2004/2004-NATO-Piringer-et-al.pdf (last access: 2 February 2024), 2004.
Regulation of the Minister of the Environment: Regulation of the Minister of the Environment of 11 September 2012 on Air Quality Programmes and Short-Term Action Plans, J. Laws, 1028, http://isap.sejm.gov.pl/isap.nsf/DocDetails.xsp?id=WDU20120001028 (last access: 2 February 2024), 2012.
Rozwoda, W.: Wysokościowe charakterystyki wiatru w Krakowie w zależności od stanów równowagi atmosfery, Wiadomości IMGW, 18, 109–117, 1995.
Sekuła, P., Bokwa, A., Bartyzel, J., Bochenek, B., Chmura, Ł., Gałkowski, M., and Zimnoch, M.: Measurement report: Effect of wind shear on PM10 concentration vertical structure in the urban boundary layer in a complex terrain, Atmos. Chem. Phys., 21, 12113–12139, https://doi.org/10.5194/acp-21-12113-2021, 2021.
Sgouros, G., Helmis, C., and Degleris, J.: Development and application of an algorithm for the estimation of mixing height with the use of a SODAR-RASS remote sensing system, Int. J. Remote. Sens., 32, 7297–7313, https://doi.org/10.1080/01431161.2010.521205, 2011.
Simakhin, V. A., Cherepanov, O. S., and Shamanaeva, L. G.: Robust statistical methods in sodar studies of the ABL, Proc. SPIE 10466, 23rd International Symposium on Atmospheric and Ocean Optics: Atmospheric Physics, 1046632, https://doi.org/10.1117/12.2286426, 30 November 2017.
Walczewski, J. (Ed): Charakterystyka warstwy granicznej atmosfery nad miastem (na przykł adzie Krakowa), Mat. Bad. IMGW, Meteor., 122 pp., 1994.
WHO: Health aspects of air pollution: results from the WHO project “Systematic review of health aspects of air pollution in Europe”, Copenhagen: WHO Regional Office for Europe, https://iris.who.int/bitstream/handle/10665/107571/E83080.pdf?sequence=1 (last access: 2 February 2024), 2004.
Xu, Y., Xue, W., Lei, Y., Zhao, Y., Cheng, S., Ren, Z., and Huang, Q.: Impact of Meteorological Conditions on PM2.5 Pollution in China during Winter, Atmosphere, 9, 429, https://doi.org/10.3390/atmos9110429, 2018.
Wenbo, X., Xurong, S., Yan, G., Wang, J., Xu, Y., Tang, Q., Wang, Y., Yixuan, Z., and Yu, L.: Impacts of meteorology and emission variations on the heavy air pollution episode in North China around the 2020 Spring Festival, Sci. China, Earth Sci., 64, 329–339, https://doi.org/10.1007/s11430-020-9683-8, 2021.
Yang, G., Xinlei, S., Baoliang, L., Wenzhong, S., Mingjiang, Z., and Ziyan, Z.: Research on wind power prediction based on Doppler Sodar, in: 2020 Chinese automation congress (CAC), Shanghai, China, 6–8 November 2020, IEEE, 1345–1348, https://doi.org/10.1109/CAC51589.2020.9326699, 2020.
Yushkov, V. P., Kallistratova, M. A., Kouznetsov, R. D., Kurbatov, G. A., and Kramar, V. F.: Experience in measuring the wind-velocity profile in an urban environment with a Doppler sodar, Izv. Atmos. Ocean. Phys, 43, 168–180, https://doi.org/10.1134/S0001433807020041, 2007.
Ziemianski, M. and Osrodka, L. (Eds.): Zmiany klimatu a monitoring i prognozowanie stanu środowiska atmosferycznego, IMGW-PIB, Warszawa, Polska, 235 pp., ISBN 978-83-61102-66-3, 2012.
The sodar model is a complement to forecasting methods because it is useful due to its simplicity and speed of calculations. It does not require emission data, for which it is difficult to quickly verify temporal and spatial variability.
The use of simple formulas of regression models in forecasting, while maintaining their multivariate nature, facilitates the optimisation of the prediction process.
The sodar...