the Creative Commons Attribution 4.0 License.
the Creative Commons Attribution 4.0 License.
 | 26 Apr 2024
Characterization of dust aerosols from ALADIN and CALIOP measurements
Rui Song
Adam Povey
Roy G. Grainger
Atmospheric aerosols have pronounced effects on climate at both regional and global scales, but the magnitude of these effects is subject to considerable uncertainties. A major contributor to these uncertainties is an incomplete understanding of the vertical structure of aerosol, largely due to observational limitations. Spaceborne lidars can directly observe the vertical distribution of aerosols globally and are increasingly used in atmospheric aerosol remote sensing. As the first spaceborne high-spectral-resolution lidar (HSRL), the Atmospheric LAser Doppler INstrument (ALADIN) on board the Aeolus satellite was operational from 2018 to 2023. ALADIN data can be used to estimate aerosol extinction and co-polar backscatter coefficients separately without an assumption of the lidar ratio. This study assesses the performance of ALADIN's aerosol retrieval capabilities by comparing them with Cloud-Aerosol LIdar with Orthogonal Polarization (CALIOP) measurements. A statistical analysis of retrievals from both instruments during the June 2020 Saharan dust event indicates consistency between the observed backscatter and extinction coefficients. During this extreme dust event, CALIOP-derived aerosol optical depth (AOD) exhibited large discrepancies with Moderate Resolution Imaging Spectroradiometer (MODIS) Aqua measurements. Using collocated ALADIN observations to revise the dust lidar ratio to 63.5 sr, AODs retrieved from CALIOP are increased by 46 %, improving the comparison with MODIS data. The combination of measurements from ALADIN and CALIOP can enhance the tracking of aerosols' vertical transport. This study demonstrates the potential for spaceborne HSRL to retrieve aerosol optical properties. It highlights the benefits of spaceborne HSRL in directly obtaining the lidar ratio, significantly reducing uncertainties in extinction retrievals.
- Article
(8160 KB) - Full-text XML
- BibTeX
- EndNote


Atmospheric aerosols have a pronounced effect on climate at both regional and global scales. They directly affect the climate by scattering and absorbing both shortwave and longwave radiation (Ghan et al., 2012; Myhre et al., 2013; Oikawa et al., 2018). Aerosols have an indirect effect through their interactions with clouds by modifying their microphysical characteristics, radiative properties, and lifetime (Altaratz et al., 2014; Bellouin et al., 2020). Such interactions alter the net radiation fluxes at the top of the atmosphere and the surface. The magnitude of these effects is subject to considerable uncertainties. These uncertainties are attributed to limitations in the description of aerosol properties, the spatio-temporal variation in aerosols, and particularly inadequate understanding of the vertical structure of aerosol. The vertical distribution of aerosol is driven by atmospheric transport patterns, residence times, and the efficiency of vertical transport (Koffi et al., 2012), which vary by up to an order of magnitude among models (Textor et al., 2006; Kipling et al., 2016). Minimizing the uncertainty in aerosol vertical distribution is crucial for accurately assessing the effects of aerosols on the climate system. Vertical dispersal patterns of aerosols have become better constrained since the development of lidar technology. Ground-based lidar networks, such as the European Aerosol Research Lidar Network (EARLINET) (Pappalardo et al., 2014), the Micro-Pulse Lidar Network (MPLNET) (Welton et al., 2001), and the Asian Dust and Aerosol Lidar Observation Network (AD-Net) (Sugimoto et al., 2016), provide detailed vertical aerosol profiles on regional scales.
The limitation in spatial coverage of ground lidar was partially overcome with the launch of lidar into orbit. Spaceborne lidars are often calibrated in atmospheric regions for which a very low aerosol content is assumed, i.e. typically the stratosphere. One further advantage is that, in contrast to ground-based lidars, no significant aerosol contribution is expected between the spaceborne lidars and this calibration region. Lidars launched into orbit include the Lidar In-space Technology Experiment (LITE) (Winker et al., 1996), the Geoscience Laser Altimeter System (GLAS) (Spinhirne et al., 2005), the Cloud-Aerosol Transport System (CATS) (McGill et al., 2015), and the Advanced Topographic Laser Altimeter System (ATLAS) (Markus et al., 2017). The Cloud-Aerosol LIdar with Orthogonal Polarization (CALIOP) (Winker et al., 2010) instrument on board the Cloud-Aerosol Lidar and Infrared Pathfinder Satellite Observations (CALIPSO) satellite, launched in 2006, measured the vertical profile of both clouds and aerosols coincident with other observations in NASA's A-Train (Afternoon Constellation). CALIOP emitted laser pulses towards the Earth's surface, capturing attenuated backscattered signals at 532 and 1064 nm from which the profiles of aerosol backscatter and extinction coefficients were retrieved. CALIOP measured the linear depolarization of the backscattered signals, facilitating the discrimination of the cloud phase and identification of non-spherical aerosols (such as mineral dust, volcanic ash, and soot). The European Space Agency further advanced this field by launching the Aeolus satellite carrying the Atmospheric LAser Doppler INstrument (ALADIN) a high-spectral-resolution lidar (HSRL) (Stoffelen et al., 2005). Operational from 2018 until 2023, ALADIN was a state-of-the-art direct-detection Doppler wind lidar that operated at 355 nm. While its primary focus was detecting wind patterns, this study considers aerosol backscatter and extinction coefficient retrievals from ALADIN and compares them with CALIOP retrievals.
As an elastic backscatter lidar, CALIOP needs the particle extinction-to-backscatter ratio, commonly referred to as the lidar ratio, to accurately interpret the signals. While its value depends on the microphysical characteristics of aerosols, including their refractive index and size distribution, the lidar ratio is unaffected by aerosol concentration (Mona et al., 2006). The lidar ratio enables the derivation of particle extinction coefficients from single-channel backscatter profiles and is fundamental to the accurate estimation of aerosol radiative impact. However, there remain limitations in CALIOP's lidar ratio selection scheme. For example, the use of a single lidar ratio for all dust aerosols introduces bias (Kim et al., 2020) because the lidar ratio is influenced by the mineralogical composition and refractive index of dust particles (Schuster et al., 2012) and particle non-sphericity (Dubovik et al., 2006). Beyond the limitations associated with selecting a constant lidar ratio for specific aerosol types, CALIOP's extinction retrieval presents additional challenges. There is a minimum aerosol optical depth (AOD) detectable by CALIOP, which affects how observations should be compared (Watson-Parris et al., 2018). Layers with weak backscatter that remain undetected by CALIOP have a global mean AOD of 0.031 ± 0.052 (Kim et al., 2017).
High-spectral-resolution lidars are recognized for their potential in atmospheric aerosol remote sensing as they separately detect particles and molecules (Shipley et al., 1983; Müller et al., 2014; Wang et al., 2022). A significant advantage of this technique is that the aerosol retrieval is independent of assumptions regarding the lidar ratio. The aerosol and cloud retrievals from ALADIN have been systematically validated against a variety of ground-based measurements (Baars et al., 2021; Paschou et al., 2022; Abril-Gago et al., 2022; Feofilov et al., 2022; Gkikas et al., 2023). The ALADIN instrument employs a circularly polarized emission but only detects the co-polar component of the return. Due to this instrument configuration, ALADIN's aerosol retrieval underestimates the aerosol backscatter coefficient for highly depolarized atmospheric particles (Paschou et al., 2022; Gkikas et al., 2023), including ice crystals, smoke, dust, and volcanic ash. This misdetection of cross-polar-component backscattered signals does not influence the retrieval of the extinction coefficient. The aerosol processing in ALADIN does not rely on the information of the lidar ratio. Instead, ALADIN is capable of retrieving the lidar ratio as a variable within its Level-2 aerosol products. As the aerosol retrieval process does not set constraints on the lidar ratio, the retrieved lidar ratio often exhibits significant fluctuations for a given aerosol layer. One scenario leading to this variability is when the backscattered signal approaches the instrument's detection threshold. Thus, effective filtering is essential when analysing ALADIN lidar ratios. Additionally, ALADIN's Level-2 backscatter and extinction coefficients are subject to independent quality control (QC) procedures. Despite these challenges, it has been demonstrated that ALADIN is capable of retrieving lidar ratios from smoke (Baars et al., 2021), dust (Flament et al., 2021), and marine aerosols (Sun et al., 2023).
This study aims to explore and demonstrate the capabilities of ALADIN in retrieving aerosol optical properties, specifically the backscatter coefficient, extinction coefficient, and lidar ratio. The CALIOP Level-2 aerosol products, with a 5 km horizontal resolution, are used as a benchmark. The Saharan dust in June 2020 is chosen as the study area. Firstly, desert dust is the most predominant aerosol by mass in the atmosphere. Secondly, the lidar ratio of dust exhibits pronounced geographic variations. Finally, the Saharan dust event of June 2020 serves as a unique challenge, acting much like a stress test for evaluating space lidar measurements (particularly where the dust layer can fully attenuate the return). In this study, a statistical comparison is made of the ALADIN and CALIOP retrievals of aerosol backscatter and extinction coefficients. To further understand the underlying causes of discrepancies in extinction retrievals, a comparison is made between the dust lidar ratio values assumed by CALIOP and those retrieved by ALADIN.
2.1 Aeolus ALADIN aerosol products
Aeolus was launched into space on 22 August 2018 and concluded its mission on 30 April 2023, operating in a Sun-synchronous orbit at an altitude of 320 km with an inclination angle of 97°. The Aeolus satellite carried ALADIN as its sole payload, which was equipped with an Nd:YAG laser, emitting narrow-bandwidth UV laser pulses at a wavelength of 355 nm. Completing 16 orbits per day, Aeolus maintained a revisit time of 7 d. The laser was directed at an off-nadir angle of 35° as the primary mission was the sounding of horizontal winds.
Each observation by ALADIN integrates laser shots over a 12 s interval, corresponding to an along-track horizontal resolution of approximately 87 km, which is defined as one basic repeat cycle or “observation”, as detailed in the Level-2A Algorithm Theoretical Baseline Document (Flamant et al., 2020a). Each observation comprises 24 vertical bins, with varying vertical resolutions: 0.5 km between 0 and 2 km, 1 km between 2 and 16 km, and 2 km above 16 km. This spacing was adjustable to meet the requirements of specific scenarios. For instance, the ceiling was increased to 30 km near the Hunga Tonga–Hunga Ha′apai plume (30° S–0°) in response to the changes observed a few days after the eruption on 15 January 2022 (Legras et al., 2022).
The ALADIN Level-2A products are derived using several algorithms, including the standard correct algorithm (SCA), the standard correct algorithm middle bin (SCAmb), and maximum-likelihood estimation (MLE) (Ehlers et al., 2022). The SCA aerosol retrieval is an algebraic inversion scheme that relies on processing cross-talk-corrected signals from both the Rayleigh and the Mie channels (Flament et al., 2021). An assessment over the eastern Mediterranean demonstrated that the SCA backscatter coefficients were in good agreement with ground measurements for horizontally homogeneous, fine, spherical particles at altitudes below 4 km. However, the performance of the SCA degrades in the lowermost bins, attributed to either contamination from surface signals or increased noise levels (Gkikas et al., 2023). Another limitation of the SCA method is that the errors in extinction propagate from the first (uppermost) bin to underlying bins. To address this limitation, the SCAmb method averages extinction values over two consecutive bins. This results in a reduction in vertical resolution and a significant improvement in signal-to-noise ratio (SNR). By adapting the SCA method into a physically constrained optimal estimation framework, the MLE method demonstrates a predominantly positive impact coupled with considerable noise suppression. The enhancements effected by the MLE method largely arise from the imposition of positivity constraints on optical properties and the employment of a bounded lidar ratio (Ehlers et al., 2022). In this work, the Level-2 SCAmb products (baseline 2A11) are used to examine ALADIN's aerosol retrieval performance. This approach allows a direct comparison of aerosol retrievals between two different lidar systems, focusing on the performance of the instruments themselves rather than evaluating advancements in algorithms such as MLE.
The quality control of ALADIN's Level-2 SCAmb products involves several criteria: the validity of extinction and backscatter coefficient retrievals, the backscatter-to-extinction ratio (BER), Mie and Rayleigh SNRs, estimated errors in extinction and backscatter coefficients, and the accumulated optical depth. These criteria are comprehensively detailed in Flamant et al. (2020b). ALADIN's L2A processing strategy has a high sensitivity to errors so that small errors in extinction propagate from one bin to the next, often leading to negative extinction coefficients. To mitigate this issue, an additional filtering step is used in this study to eliminate negative extinction coefficients.
ALADIN is designed to measure only the co-polar component of backscatter signals, omitting the cross-polar component. This design choice becomes significant when ALADIN probes non-spherical particles like dust, volcanic ash, and ice crystals, potentially leading to an underestimation of the backscatter coefficient. This was illustrated during the PollyXT ground lidar experiments conducted in the eastern Mediterranean (Gkikas et al., 2023), where ALADIN underestimated the aerosol backscatter coefficients by up to 33 % when non-spherical mineral particles were present. To address this issue, the method of Abril-Gago et al. (2022) is used to convert between the co-polar part and total particle backscatter coefficient. The formula used to convert between the 355 nm co-polar part and total backscatter coefficient is
where is the ALADIN 355 nm co-polar part of the particle backscatter coefficient and is the 355 nm total backscatter coefficient. The circular particle depolarization ratio at 355 nm, , is typically not directly measured. It can be estimated from the linear particle depolarization ratio (Mishchenko and Hovenier, 1995), using
where is the linear particle depolarization ratio at 355 nm. ALADIN does not measure the linear particle depolarization ratio, and CALIOP only measures the linear particle depolarization ratio at 532 nm. To address this, a further conversion is required:
where Kδ is the spectral conversion factor. Abril-Gago et al. (2022) conducted a thorough bibliographic review of previous multispectral depolarization studies and applied a linear regression between and to estimate the spectral conversion factor Kδ. For dust, the best linear fit was found to be , which will be used in this study for evaluating the backscatter coefficients obtained from CALIOP and ALADIN.
2.2 CALIPSO CALIOP aerosol products
The CALIPSO satellite, with the CALIOP instrument as its primary payload, was launched in 2006 alongside CloudSat, subsequently joining the A-Train. It is approximately 73 s behind the Moderate Resolution Imaging Spectroradiometer (MODIS) Aqua satellite. This orbital configuration guarantees frequent collocations between CALIOP and MODIS measurements. The specifics of this collocation process are detailed in Kim et al. (2017), where the collocated MODIS AOD serves as an additional constraint on CALIOP extinction retrievals. Due to technical challenges affecting its manoeuvering capability, CloudSat exited the A-Train to a lower orbit in February 2018. By September of the same year, CALIPSO rejoined CloudSat to form the C-Train. This orbit is 16.5 km below the A-Train, resulting in a slightly different ground track.
CALIOP Level-2 products include the physical and optical parameters associated with detected aerosol and cloud layers. The utilization of the selective iterated boundary location (SIBYL) algorithm aims to optimize the detection of weakly scattering layers while maintaining reliable identification of dense layers. SIBYL uses a threshold-based detection mechanism, so it occasionally misses optically thin features that fall below the detection threshold. Subsequent to detection, the aerosol layers undergo classification into distinct aerosol types. This classification is made by the scene classification algorithm (Kim et al., 2018), a decision-tree-based method that takes into account factors such as altitude, geographical location, surface type, estimated particulate depolarization ratio, and integrated attenuated backscatter. In the final phase, the Level-2 extinction coefficient is retrieved using the Hybrid Extinction Retrieval Algorithm (HERA) (Winker et al., 2010; Young et al., 2018). The CALIOP Level-1 data provide a horizontal resolution of 333 m and a variable vertical resolution: 30 m below 8 km and 60 m in the range of 8 to 20 km. In contrast, the CALIOP Level-2 aerosol products present a horizontal resolution of 5 km. The vertical resolution is 60 m up to an altitude of 20.2 km and transitions to 180 m between 20.2 and 30.1 km.
In CALIOP Level-2 scene classification V3 and earlier versions, aerosols are placed into six distinct categories: clean marine, dust, polluted continental, clean continental, polluted dust, and smoke (Omar et al., 2009). Each aerosol category is assigned a specific lidar ratio, along with a corresponding uncertainty value. The scheme tended to misclassify aerosols in regions with a mixture of different aerosol types (Burton et al., 2012; Nowottnick et al., 2015), and it lacked a mechanism for identifying stratospheric aerosol types. Such aerosol misclassifications can lead to 30 %–50 % uncertainty in the selected lidar ratio, introducing bias in CALIOP's retrievals (Rogers et al., 2014; Amiridis et al., 2013; Burton et al., 2013). To address these shortcomings, the CALIOP V4 scene classification algorithm enhanced aerosol subtyping, expanding the number of aerosol types to 11, covering both tropospheric and stratospheric aerosols (Kim et al., 2018). Version 4 also revised the lidar ratios designated for different aerosol subtypes. Owing to these enhancements, CALIOP V4 demonstrates reduced bias in AOD when compared to AERONET and MODIS measurements.
In this study, the CALIOP Level-2 V-4.21 aerosol profiles APro (CAL_LID_L2_05kmAPro-Standard-V4-21) are used for comparison against ALADIN aerosol retrievals (baseline 2A11). The Level-2 APro data include a cloud–aerosol discrimination (CAD) score, which we use as a QC flag, selecting only aerosol retrievals with a CAD score of less than −20.
2.3 Collocation of Aeolus and CALIPSO
Aeolus performs its overpass of the Equator at 06:00 and 18:00 LST, whereas CALIPSO does so at 01:30 and 13:30 LST. The ALADIN lidar has a line of sight that is 35° off nadir towards the Earth's night side. The CALIPSO lidar probes the Earth's atmosphere at an angle of 3° off nadir. Collocation between Aeolus and CALIPSO represents a balance between the quantity of collocated profiles and their coincidence. In an examination of the scattering ratio profiles from both ALADIN and CALIOP, Feofilov et al. (2022) established a collocated database with a spatial distance under 1° and a temporal discrepancy not exceeding 24 h, based on data between 30 June 2019 and 28 September 2021. Although the dataset utilizes a temporal disparity of up to 24 h, it enables researchers to reduce the temporal threshold. Figure 1 is a representation of the global distribution of these collocated profiles when applying a stricter temporal threshold of 9 h.
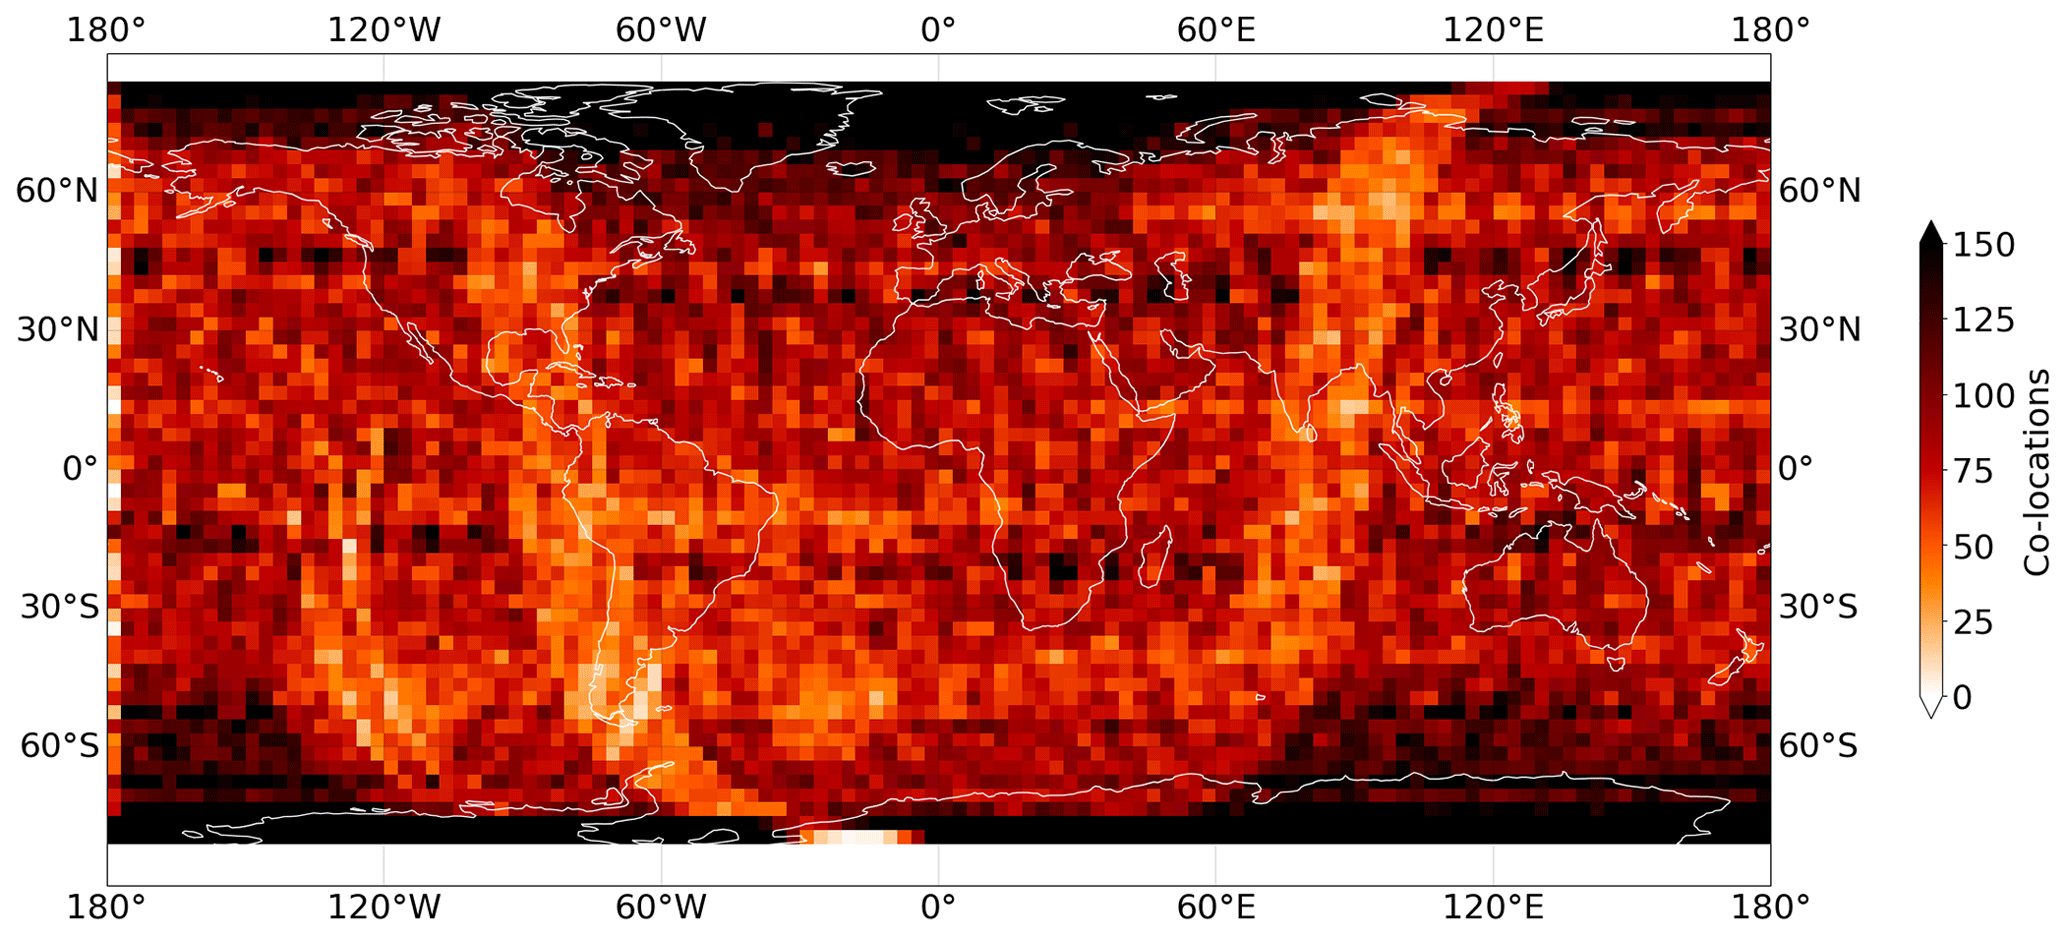
Figure 1Global distribution of collocated ALADIN and CALIOP profiles from 30 June 2019 to 28 September 2021. In this plot the dataset is constrained to a temporal disparity of no more than 9 h and has been regridded to 3° × 3° globally.
From Fig. 1, it is evident that collocations are concentrated at the poles. The distributions of temporal disparity and spatial distance between collocations, for three latitude bands, are shown in Fig. 2. Between 30° N and 30° S, most collocated observations are within 4 h and 100 km. These observations primarily constitute the dataset utilized for analysis in the comparative part (Sect. 3.2) of this study.
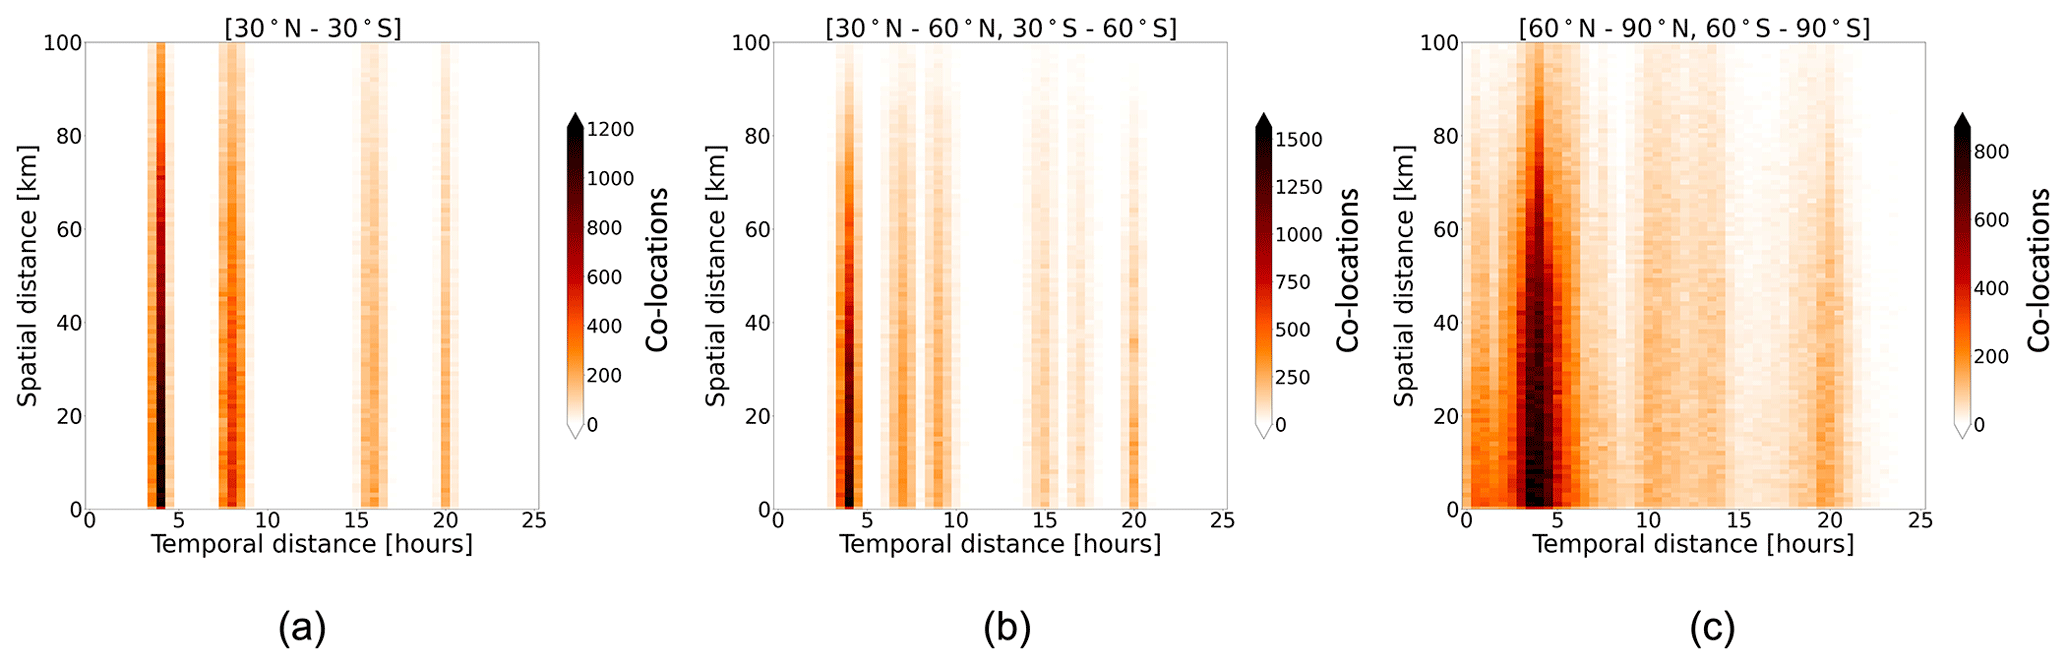
Figure 2Temporal disparity and spatial distance of collocated ALADIN and CALIOP profiles at (a) 30° N–30° S, (b) 30–60° N and 30–60° S, and (c) 60–90° N and 60–90° S.
2.4 Aerosol and cloud discrimination
CALIOP's effectiveness in distinguishing between various aerosols and clouds can be largely attributed to its measurements of the particle depolarization ratio at 532 nm and its colour ratio between 532 and 1064 nm. With Version 4.5 (Tackett et al., 2023), enhancements were made to the CALIOP Level-2 aerosol products, primarily focusing on the improved accuracy of stratospheric aerosol classification.
ALADIN, limited by its single-band observation and its inability to capture particle depolarization information, faces a significant challenge when it comes to discriminating between aerosols and clouds. In van Zadelhoff et al. (2023), the development of a method for detecting aerosol and cloud features, known as the ATLID FeatureMask and intended for use with the forthcoming high-spectral-resolution UV Atmospheric Lidar (ATLID) on board the EarthCARE satellite mission, is presented. Initially, the ATLID FeatureMask was evaluated using synthetic data from the EarthCARE end-to-end simulator and real observations from ALADIN's L1 data. It was then adapted into the operational Aeolus FeatureMask, which is now included in the operational L2A Aeolus processor. Another aerosol and cloud discrimination method is proposed in Flament et al. (2021). This method uses auxiliary meteorological information provided by the European Centre for Medium-Range Weather Forecasts to identify cloud-free conditions. Both aerosol and cloud discrimination methods highlighted above have undergone updates, enhancing their accuracy in aerosol and cloud typing. It is planned to apply the discrimination methods during the reprocessing of the ALADIN aerosol products, and both cloud masks will be incorporated into the future releases of ALADIN L2A products.
At the time of this paper's writing, the ALADIN L2A data (baseline 2A11) from the study period do not include the advanced cloud masks described, prompting the exploration of alternatives. In the assessment of Aeolus particle backscatter coefficient retrievals in the eastern Mediterranean, Gkikas et al. (2023) used the cloud mask product obtained from the Spinning Enhanced Visible and Infrared Imager (SEVIRI) instrument mounted on the Meteosat Second Generation (MSG) geostationary satellite (Schmetz et al., 2002). This cloud mask was effective at filtering out cloud-contaminated data from ALADIN L2A aerosol products. This current work is focused on the east Atlantic, which frequently experiences the transport of dense dust plumes from the Sahara. In this region, differentiating between thick dust and clouds using the SEVIRI cloud mask has proven challenging. As a result, rather than employing a standard cloud mask to filter out cloud-contaminated data for space lidar observations, this study uses a dust mask to identify lidar observations that capture only dust plumes.
Figure 3 provides a comparison of various products used for cloud and dust detection on 17 June 2020 at 19:12 UTC, including the SEVIRI cloud mask (CLM),1 SEVIRI cloud mask generated by the EUMETSAT Satellite Application Facility on Climate Monitoring (CM SAF),2 and the SEVIRI dust mask (Ashpole and Washington, 2012). A comparison of these masks reveals that the CM SAF product has fewer regions misclassified as cloud compared to the CLM product. A significant portion of the dust plume is still incorrectly classified as cloud in both products. Figure 3d displays the generated dust mask, which can accurately identify dust regions over the entire area automatically. This dust flagging method utilizes the infrared channels of SEVIRI for the detection of dust events, proving to be effective in consistently identifying moderate to heavy dust outbreaks across the central and western Sahara.
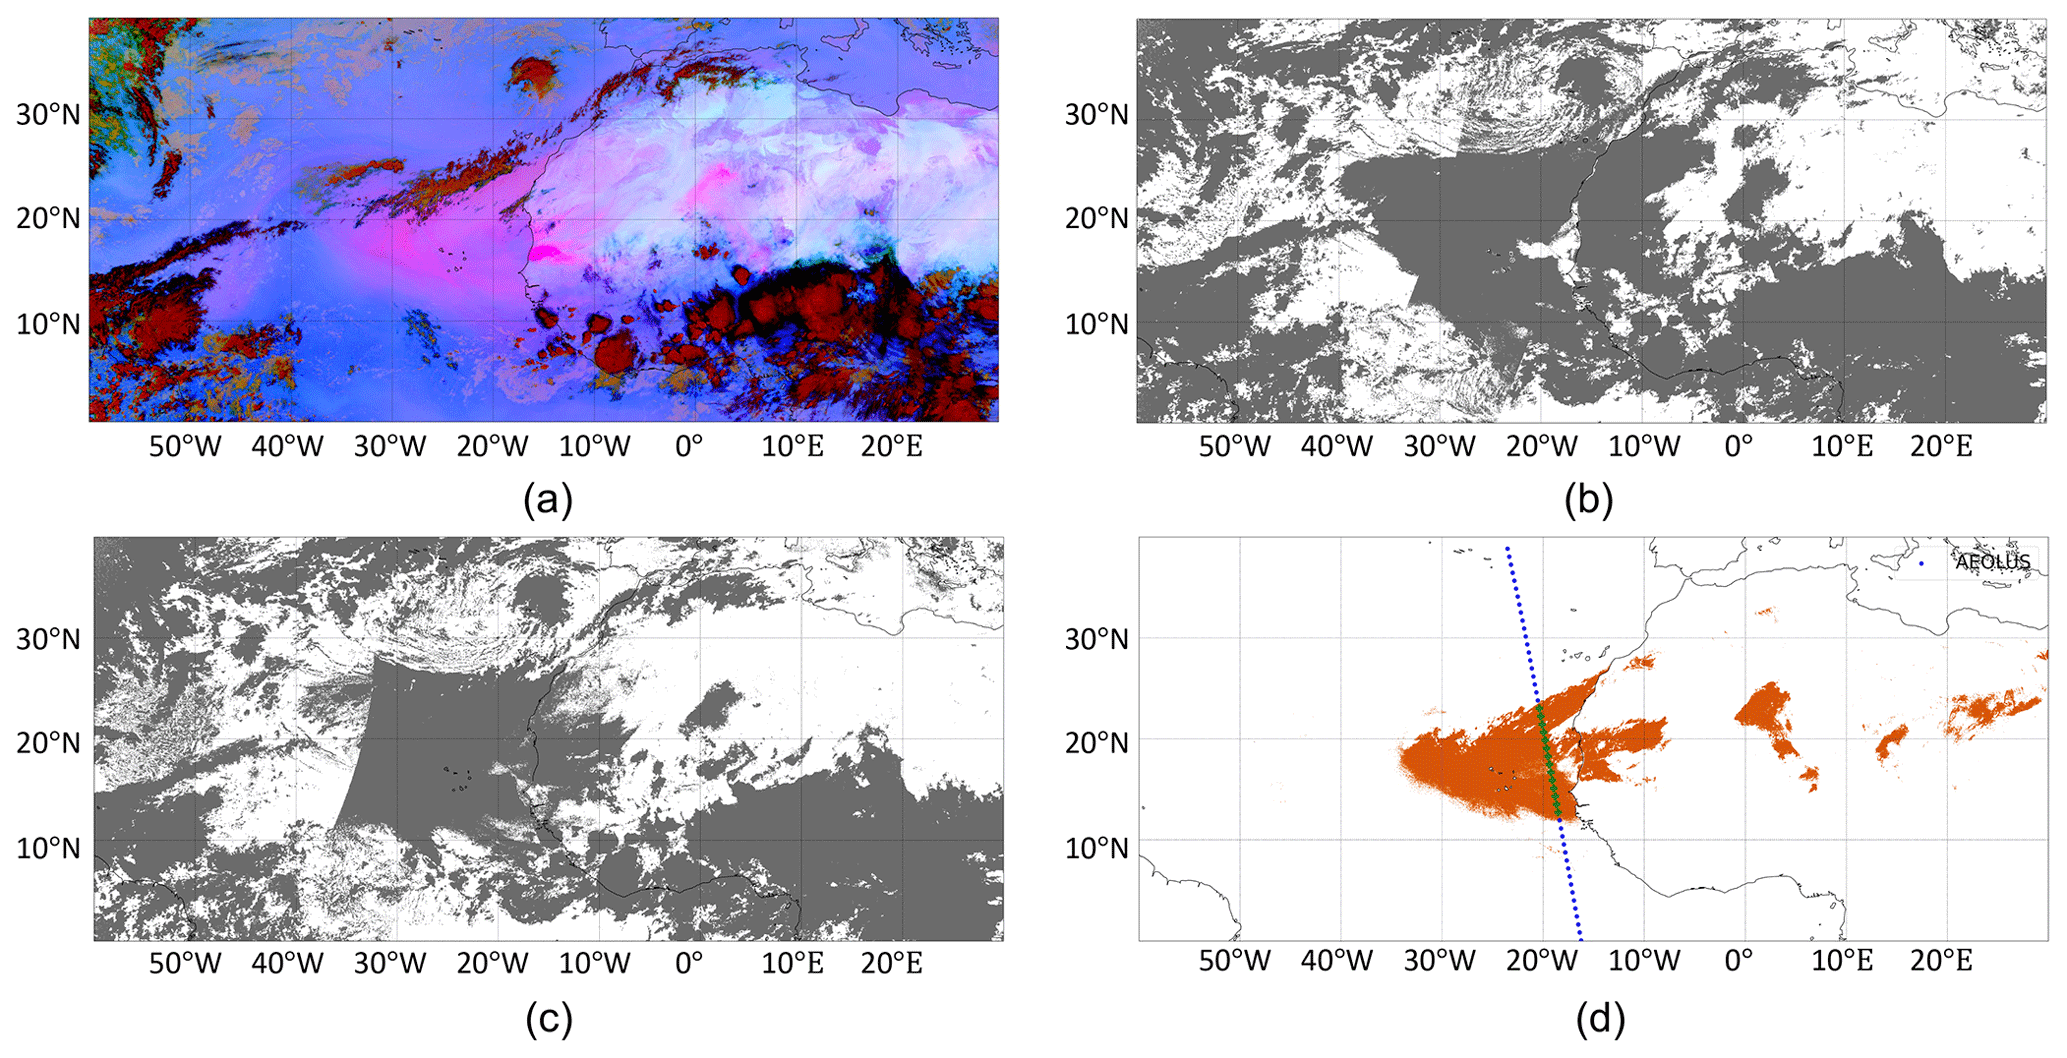
Figure 3Illustration of SEVIRI products and a generated dust flag used on 17 June 2020 at 19:12 UTC. (a) SEVIRI dust RGB composite based on three thermal bands (8.7, 10.8, and 12 µm), where shades of pink to violet denote dust. (b) SEVIRI CLM, highlighting regions identified as clouds in grey. (c) CM SAF cloud mask. (d) Generated dust flag using the method proposed by Ashpole and Washington (2012), illustrating the accurate automatic detection of dust regions over the entire study area. The blue dots in panel (d) represent the footprints of Aeolus at a horizontal step of approximately 87 km, and the green plus sign marks the location where Aeolus detects dust aerosol in that profile.
The SEVIRI instrument completes a full-disc scan every 15 min, ensuring a SEVIRI dust flag is available within 7.5 min of each ALADIN observation. While ALADIN observations have a horizontal resolution of ∼ 87 km, the SEVIRI sub-satellite points have a resolution of ∼ 3 km. In this study, each geolocation is resampled at a 3 km resolution along the satellite track, and a profile is designated as a dust aerosol observation if 95 % of the corresponding resampled footprints are flagged as dust in the relevant SEVIRI data. In the case studies presented here, the SEVIRI dust mask is used to identify dust-dominated profiles within ALADIN observations. As CALIOP Level-2 APro products already discriminate between aerosol and cloud features, they do not require additional cloud masking.
In June 2020, a large-scale uplift and subsequent transport of dust from the Sahara to the Americas was observed. This event resulted in the highest AOD for the month of June since 2002. Characterized by continuous emissions over 4 d, the dust was elevated to altitudes above 6 km due to strong updraughts. The African easterly jet facilitated rapid westward long-range transport of the dust (Francis et al., 2020).
3.1 Statistics between ALADIN and CALIOP retrievals
Figure 4 illustrates the aerosol backscatter coefficients derived from CALIOP and ALADIN during the 11 d Saharan dust event that began on 14 June 2020. For the sake of comparison, the ALADIN aerosol retrievals in Fig. 4b have been converted from co-polar to total backscatter coefficients, aligning them with the CALIOP aerosol retrievals in Fig. 4a. The conversion process involved acquiring from the CALIOP measurements depicted in Fig. 4c. After omitting values below 0 and above 1, the depolarization ratio has an average of 0.32 between altitudes of 2.5 and 7 km. This depolarization ratio aligns with results obtained from other experiments conducted on Saharan dust. For instance, the NASA Langley Research Center's airborne HSRL measurements reported a mean depolarization ratio of 0.32 in the upper part of the dust layer (Liu et al., 2008). Similarly, the SAMUM-2 experiment conducted at Cabo Verde reported a mean depolarization ratio of 0.3 (Ansmann et al., 2011). The observed decrease in the depolarization ratio in the lower part below 2.5 km in Fig. 4c is attributed to the mixing of spherical maritime aerosols, known for generally having lower depolarization ratios.
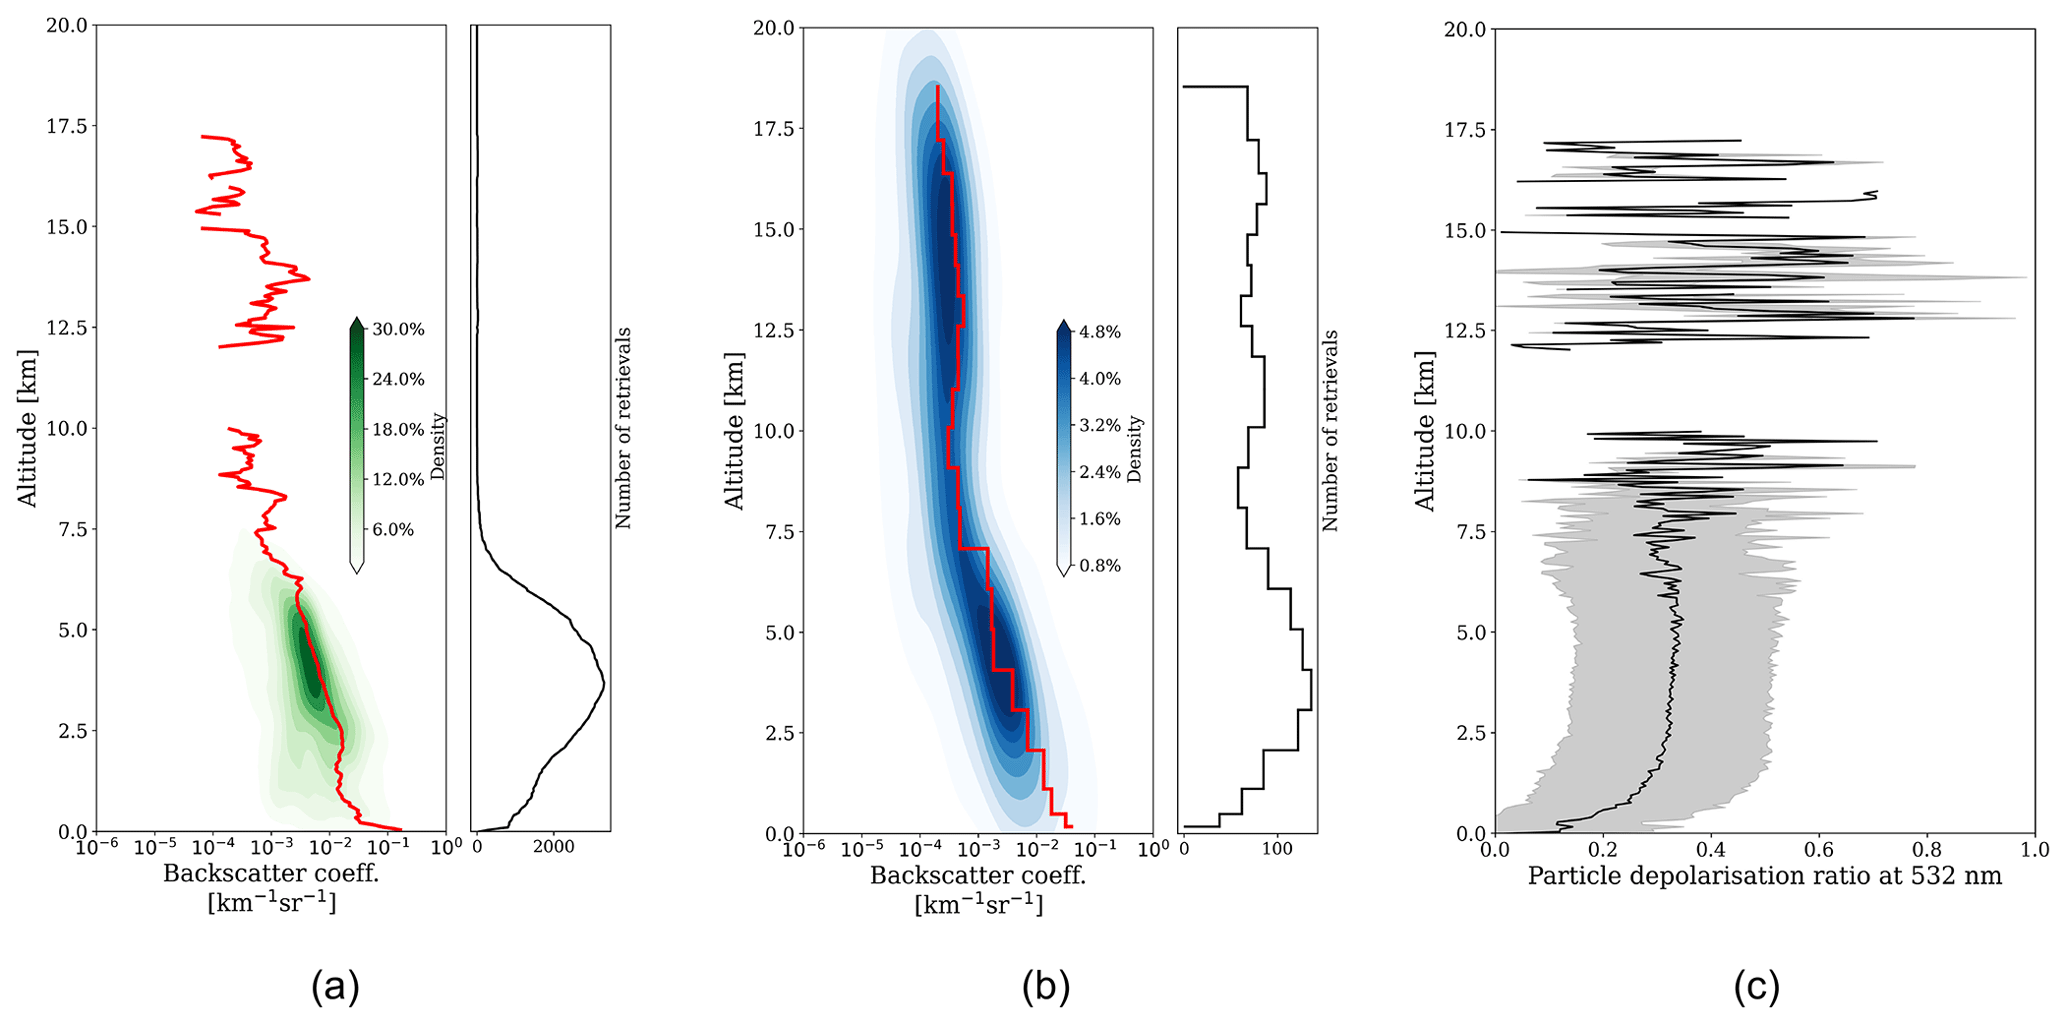
Figure 4Comparison of aerosol backscatter coefficients between CALIOP and ALADIN for the Saharan dust event spanning 14 to 24 June 2020. The analysis covers the region between 60° W and 30° E in longitude and 0° and 40° N in latitude. (a) The green contours represent the density distribution of particle backscatter coefficients derived from all available CALIOP profiles over the 11 d period. (b) The blue contours depict the density distribution of particle backscatter coefficients from all available ALADIN profiles over the same period. The red curve indicates the average backscatter coefficient profile. The right margins of the main backscatter plots in panels (a) and (b) display the number of valid retrievals at various altitudes. (c) This panel illustrates the depolarization ratio at 532 nm from CALIOP measurements, where the black curve signifies the mean and the grey shadow denotes the standard deviation.
In general, CALIOP and ALADIN show good consistency in detecting dust aerosols, with evidence of dust being uplifted to 7 km. Within the main aerosol layer from 1.5 to 7.5 km in altitude, the mean backscatter coefficients retrieved by CALIOP and ALADIN show a strong correlation, with an R squared (R2) of 0.967. At ∼ 3.5 km, the altitude with the most valid retrievals, ALADIN's retrieved backscatter coefficient averages 0.004 km−1 sr−1. CALIOP, which offers a higher vertical resolution, has an average backscatter coefficient of 0.01 km−1 sr−1 when adjusted to match ALADIN's vertical resolution. Disparities between CALIOP and ALADIN backscatter coefficients can be primarily traced back to four factors: (1) the spectral difference between 532 and 355 nm; (2) the timing discrepancy as the two instruments are scanning different segments of the dust plume at different times of the day; (3) ALADIN's coarser sampling rate compared to CALIOP, on both the vertical and the horizontal scales, which may cause ALADIN to underestimate aerosol backscatter coefficients at bins with lower aerosol mixing ratios; and (4) the conversion from ALADIN's co-polar to total backscatter coefficients involves the use of Kδ, an empirical value of 0.82 obtained from linear fitting for dust aerosols, which could introduce bias during the conversion process. A noteworthy observation from Fig. 4 is the lack of aerosol detection above 8 km by CALIOP, contrasted with ALADIN's ability to provide an equivalent quantity of aerosol retrievals as in the lower atmosphere. This divergence originates from the distinct retrieval approaches employed by these two systems. While CALIOP's retrieval relies on an initial feature type identification, this constraint is non-existent in ALADIN's retrieval approach. This discrepancy reflects similar issues addressed by Kim et al. (2017), who investigated the bias within CALIOP's column AOD due to undetected aerosol layers. This study focuses on the investigation of aerosol retrievals concentrated within dust layers. Assessing the accuracy of ALADIN's aerosol retrievals within the upper atmospheric region exceeding the dust layer is beyond the scope of this work. A comprehensive evaluation of whether ALADIN outperforms CALIOP in the detection of weak aerosol signals necessitates an analysis of global aerosol retrievals, including a wide range of aerosol types and distributions. The investigation of this topic will be the subject of future research efforts.
Figure 5 presents a comparison of aerosol extinction coefficients as measured by CALIOP and ALADIN, derived from the same experimental conditions described in Fig. 4. The two instruments generally show a good agreement in their extinction coefficients within the dust layer, with an R2 value of 0.992 for mean extinction retrievals between 1.5 and 7.5 km altitude. However, as illustrated in Fig. 5c with the direct comparison on a linear scale, some disparities are also apparent. For instance, at the altitude of ∼ 3.5 km, ALADIN has an extinction coefficient of 0.057 km−1, while CALIOP has an extinction coefficient of 0.046 km−1. Apart from the spectral difference, time discrepancy, and contrasting sampling rates, this divergence is largely attributed to the differences inherent in the extinction retrieval methods of the two instruments. CALIOP's extinction retrieval relies on a predefined lidar ratio tailored for specific aerosol types (e.g. 23 ± 5 sr for clean marine and 44 ± 9 sr for desert dust aerosols at 532 nm). In contrast, ALADIN's backscatter and extinction coefficient retrievals operate independently of each other. The estimation of the lidar ratio for a given aerosol event can introduce its own set of biases. These biases could be further magnified in scenarios where the aerosol mixture deviates from the prescribed types. For instance, in this case study, the lidar ratio in the lower atmosphere below 2.5 km is influenced by both dust and maritime aerosols, leading to an augmented bias in the lidar ratio estimation.
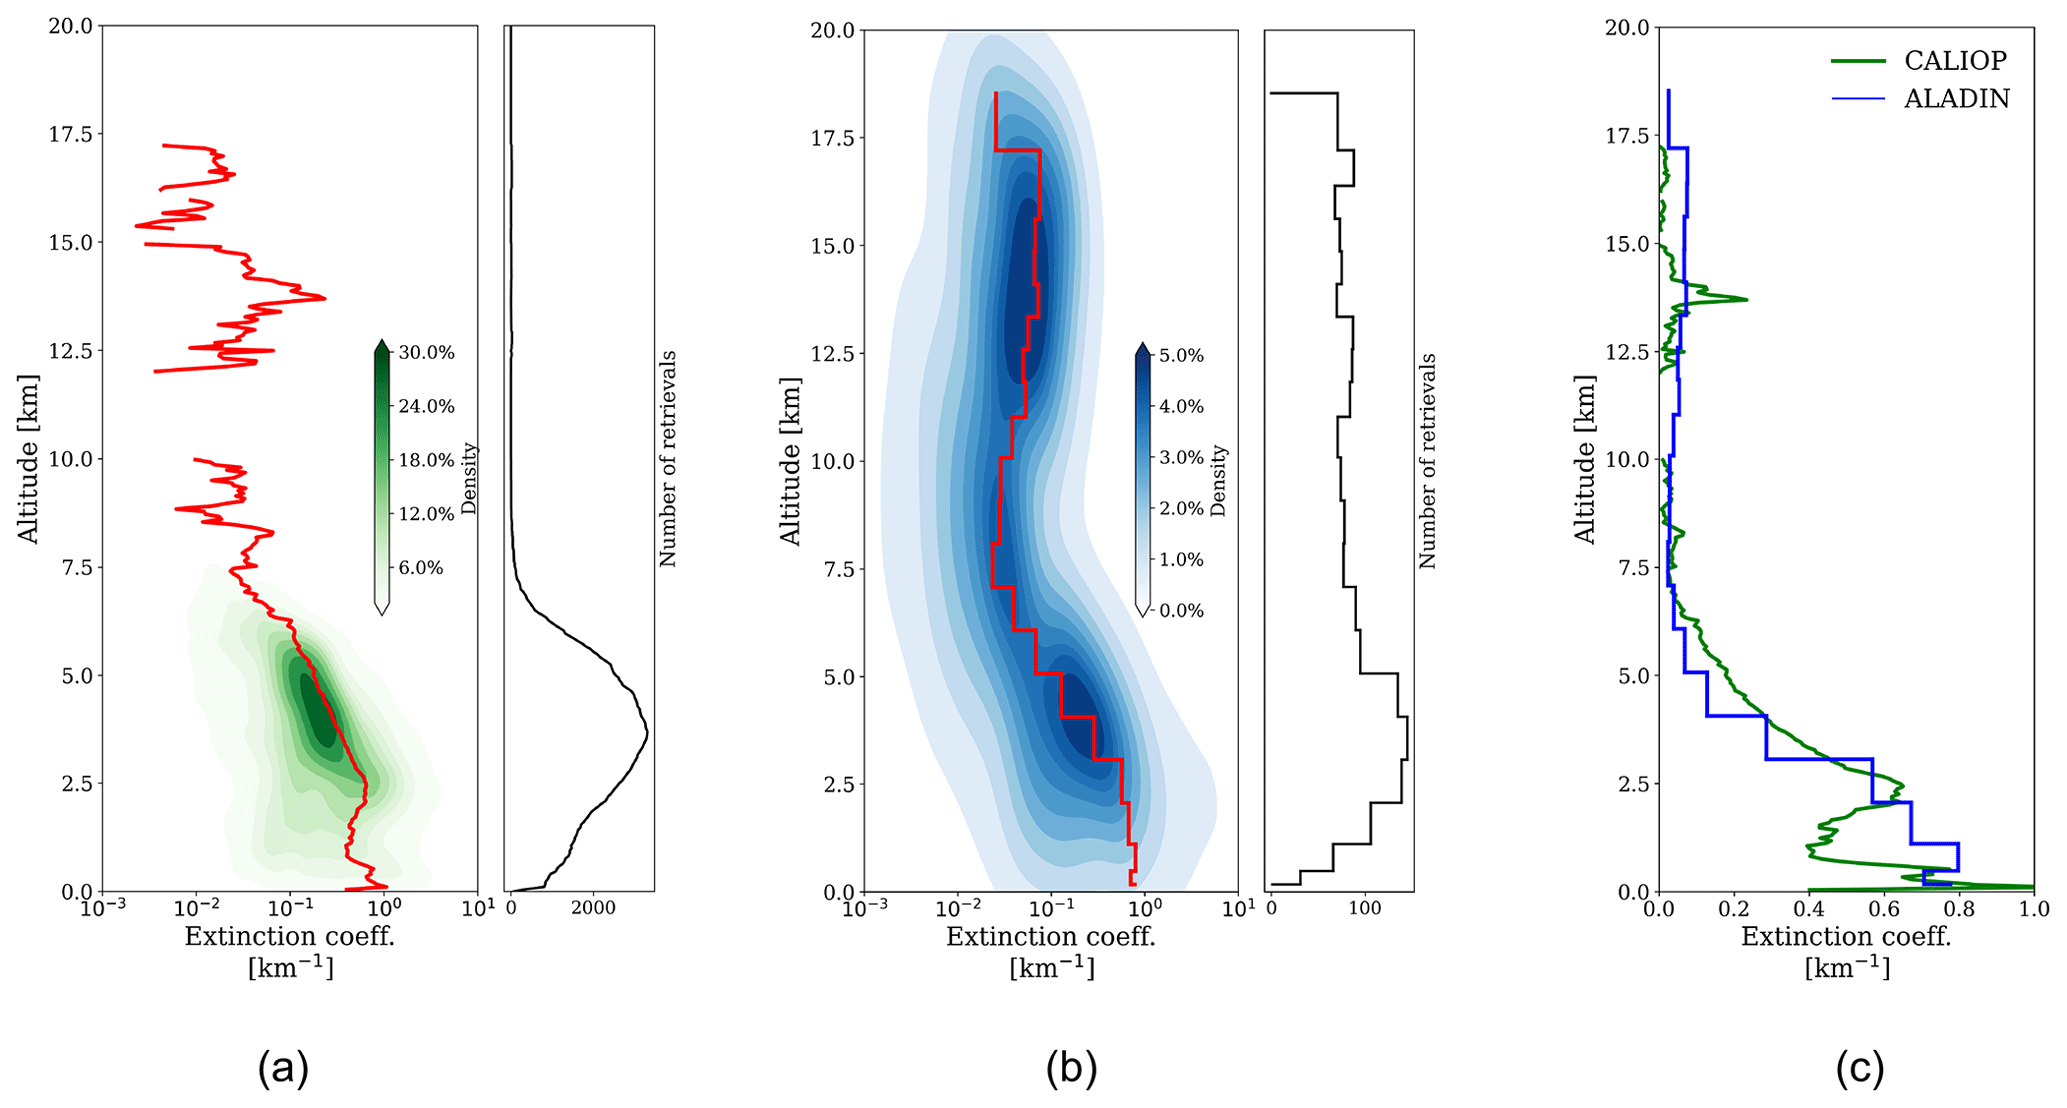
Figure 5Comparison of aerosol extinction coefficients between CALIOP (a) and ALADIN (b) for the Saharan dust event spanning 14 to 24 June 2020.
3.2 Experiments over collocated orbits
Figure 6 displays a pair of collocated orbits, specifically between 50 and 40° W, on 24 June 2020. The dust layers identified in Fig. 6b, e, c, and f have been determined based on the ALADIN grid. Collocated CALIOP retrievals were upscaled from a resolution of 0.03 km to match this resolution. Layers beneath 2.4 km are not shown due to the reduction in accuracy from ALADIN resulting from low SNRs. ALADIN and CALIOP extinction retrievals demonstrate qualitatively good agreement. For Fig. 6b, both measurements show an extinction of ∼ 0.15 km−1, except where there are no ALADIN observations (because they failed quality control). This is a common occurrence for the bottom layer of a thick aerosol layer, where signals are heavily attenuated by the overlying layers. For the middle layers of the dust, ALADIN and CALIOP extinction values display good agreement in both magnitude and structure. At the top layer between 5.4 and 6.4 km, a very thin dust layer is detected by both measurements. However, ALADIN exhibits larger values of the extinction coefficient, possibly resulting from the temporal and spatial variability in the measurements. In this instance for the specific lidar overpass, there were no coinciding third-party aerosol observations available.
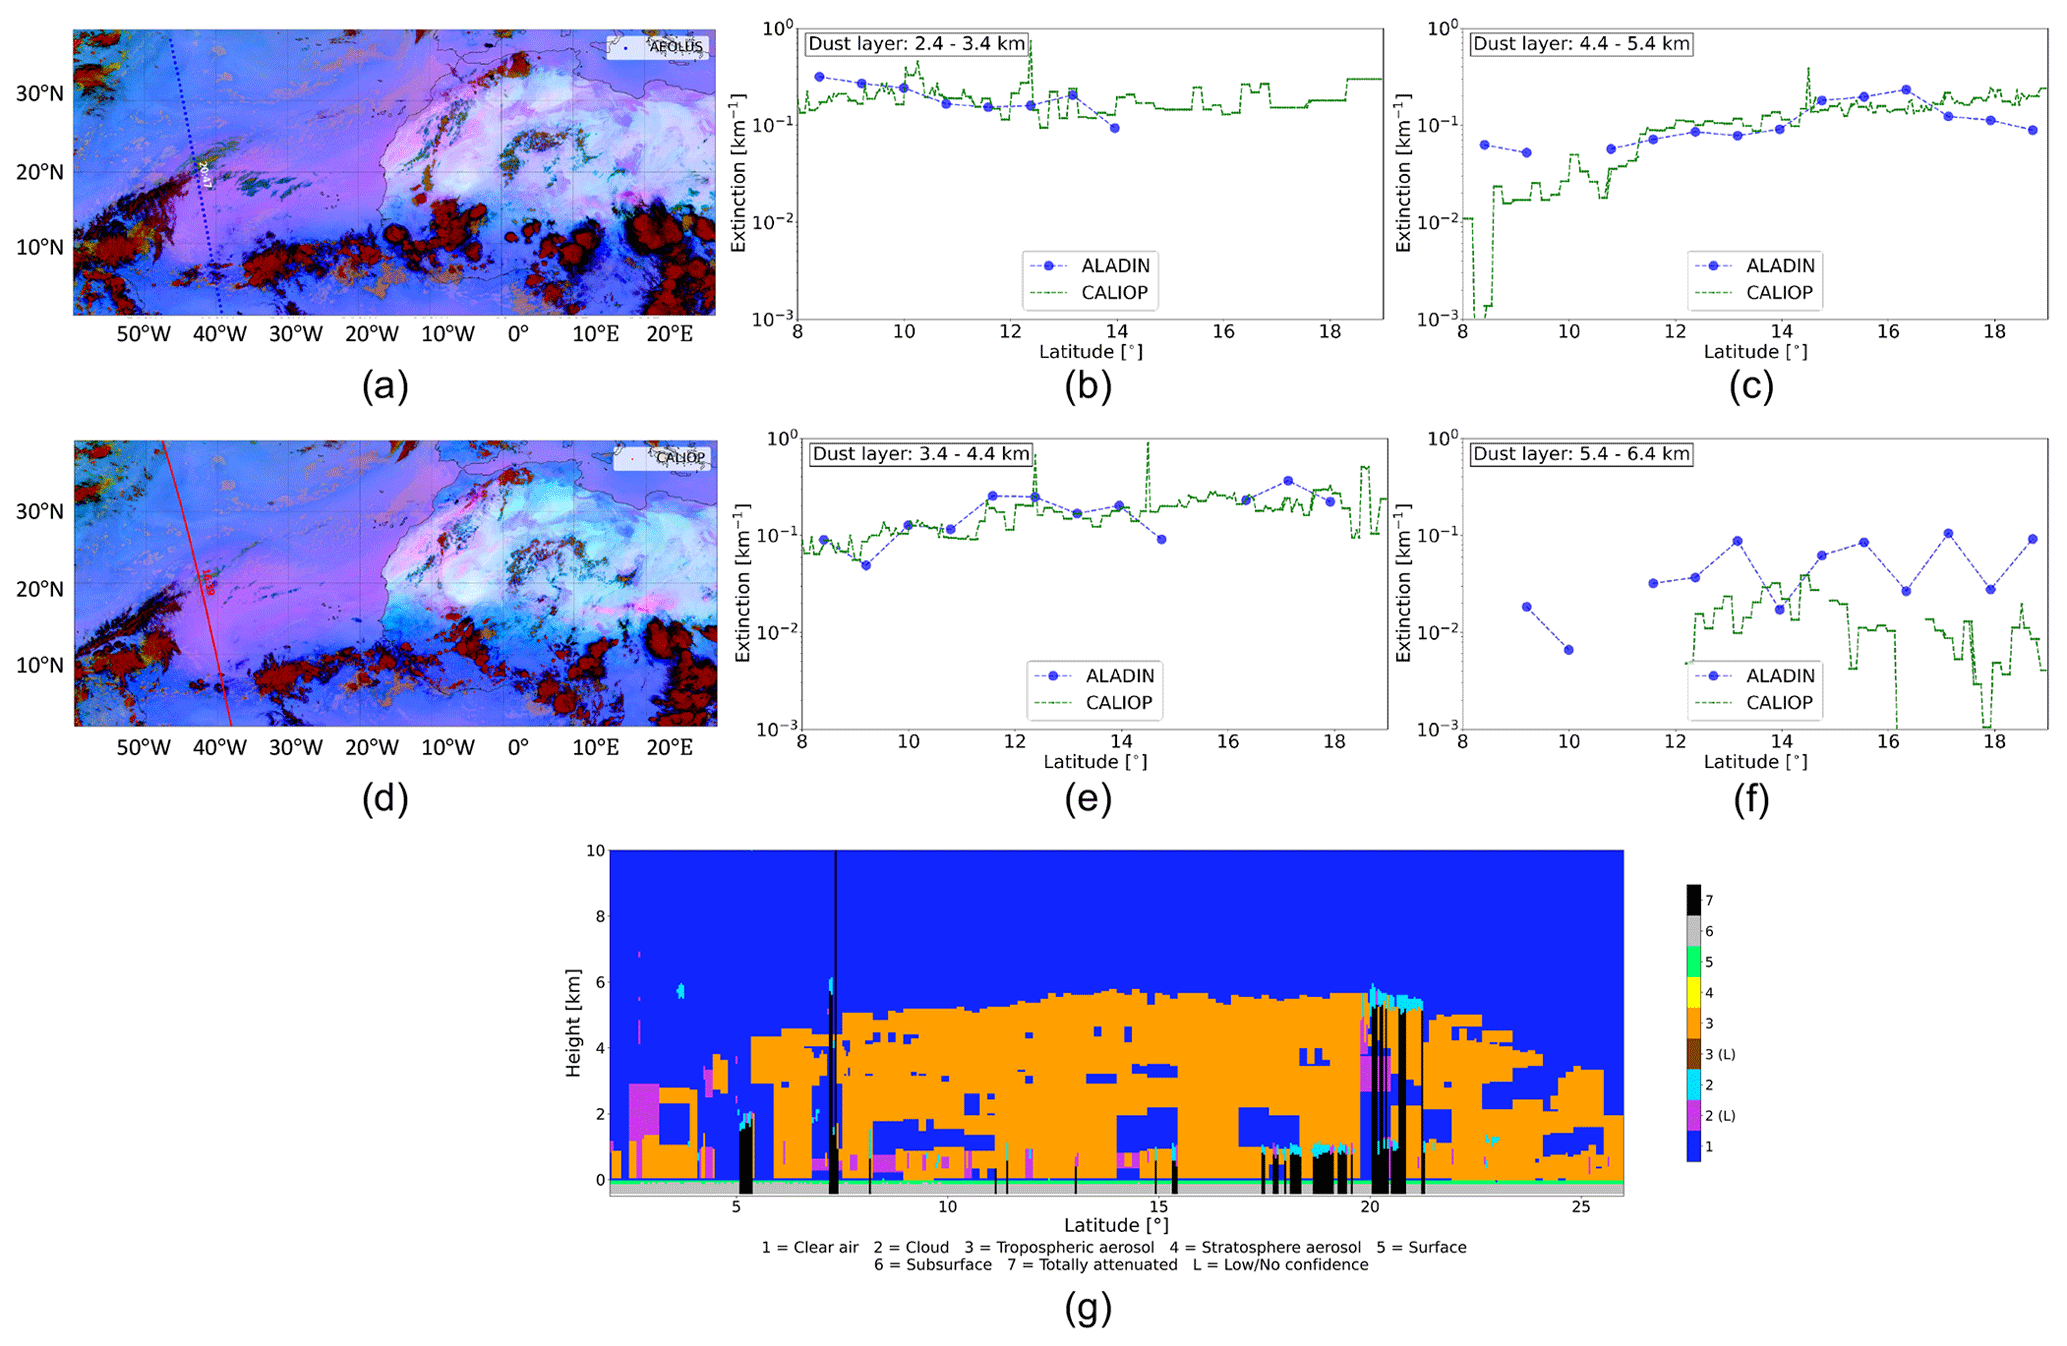
Figure 6Comparison of aerosol extinction retrievals from collocated orbits on 24 June 2020, featuring (a) an Aeolus overpass at 20:47 UTC and (d) a CALIPSO overpass at 16:39 UTC, with SEVIRI dust RGB displayed in the background of each. The extinction retrievals from cloud-free regions located between 8 and 19° N are compared across various altitude layers: (b) 2.4–3.4 km, (e) 3.4–4.4 km, (c) 4.4–5.4 km, and (f) 5.4–6.4 km. Panel (g) shows the CALIOP vertical feature mask.
Another example of retrieval comparison is illustrated in Fig. 7, featuring descending orbits with CALIPSO overpassing at 04:16 UTC on 19 June 2020 and Aeolus overpassing 4 h later. This comparison primarily focuses on retrievals at the peak of this dust event, which is characterized by high AOD values. The extinction retrievals across the upper two layers (Fig. 7c, f) exhibit a consistent level of agreement, reflecting patterns previously observed in Fig. 6. This example also underscores the divergences in the extinction retrievals from the two instruments within high-AOD regions, which become more pronounced within the middle and bottom layers. In Fig. 7e, ALADIN retrievals depict a drop within the regions between 14 and 20° N. Similarly, for the bottom layer (Fig. 7b), ALADIN observations fail to provide quality-controlled retrievals for an extended area beginning from 10° N and continuing onwards. This example illustrates a common problem with ALADIN extinction retrieval: retrievals at the base of a thick aerosol layer are very likely to be significantly underestimated or excluded by quality control due to low SNRs (Ehlers et al., 2022; Baars et al., 2020). A further intriguing insight arises from the layer between 3.4 and 4.4 km (Fig. 7e). By filtering out retrievals between 14 and 20° N, it becomes clear that both instruments efficiently track the spatial evolution of the dust, showing reasonable alignment. This agreement experiences a slight deviation owing to the projection of two datasets with minor geolocation differences onto a linear latitude-based scale. ALADIN frequently records an extinction coefficient that is higher by ∼ 0.2 km−1 compared to CALIOP. This discrepancy in absolute extinction coefficients between ALADIN and CALIOP only becomes discernible under two specific conditions: (1) when the extinction within the layer is high – as otherwise the absolute difference substantially decreases – and (2) when the SNR for ALADIN is sufficiently high to surpass the threshold. The hypothesis to explain this phenomenon is that ALADIN, under this given aerosol condition, has higher lidar ratios than CALIOP. A higher lidar ratio inherently leads to elevated extinction coefficients. In light of this, the subsequent section investigates this discrepancy.
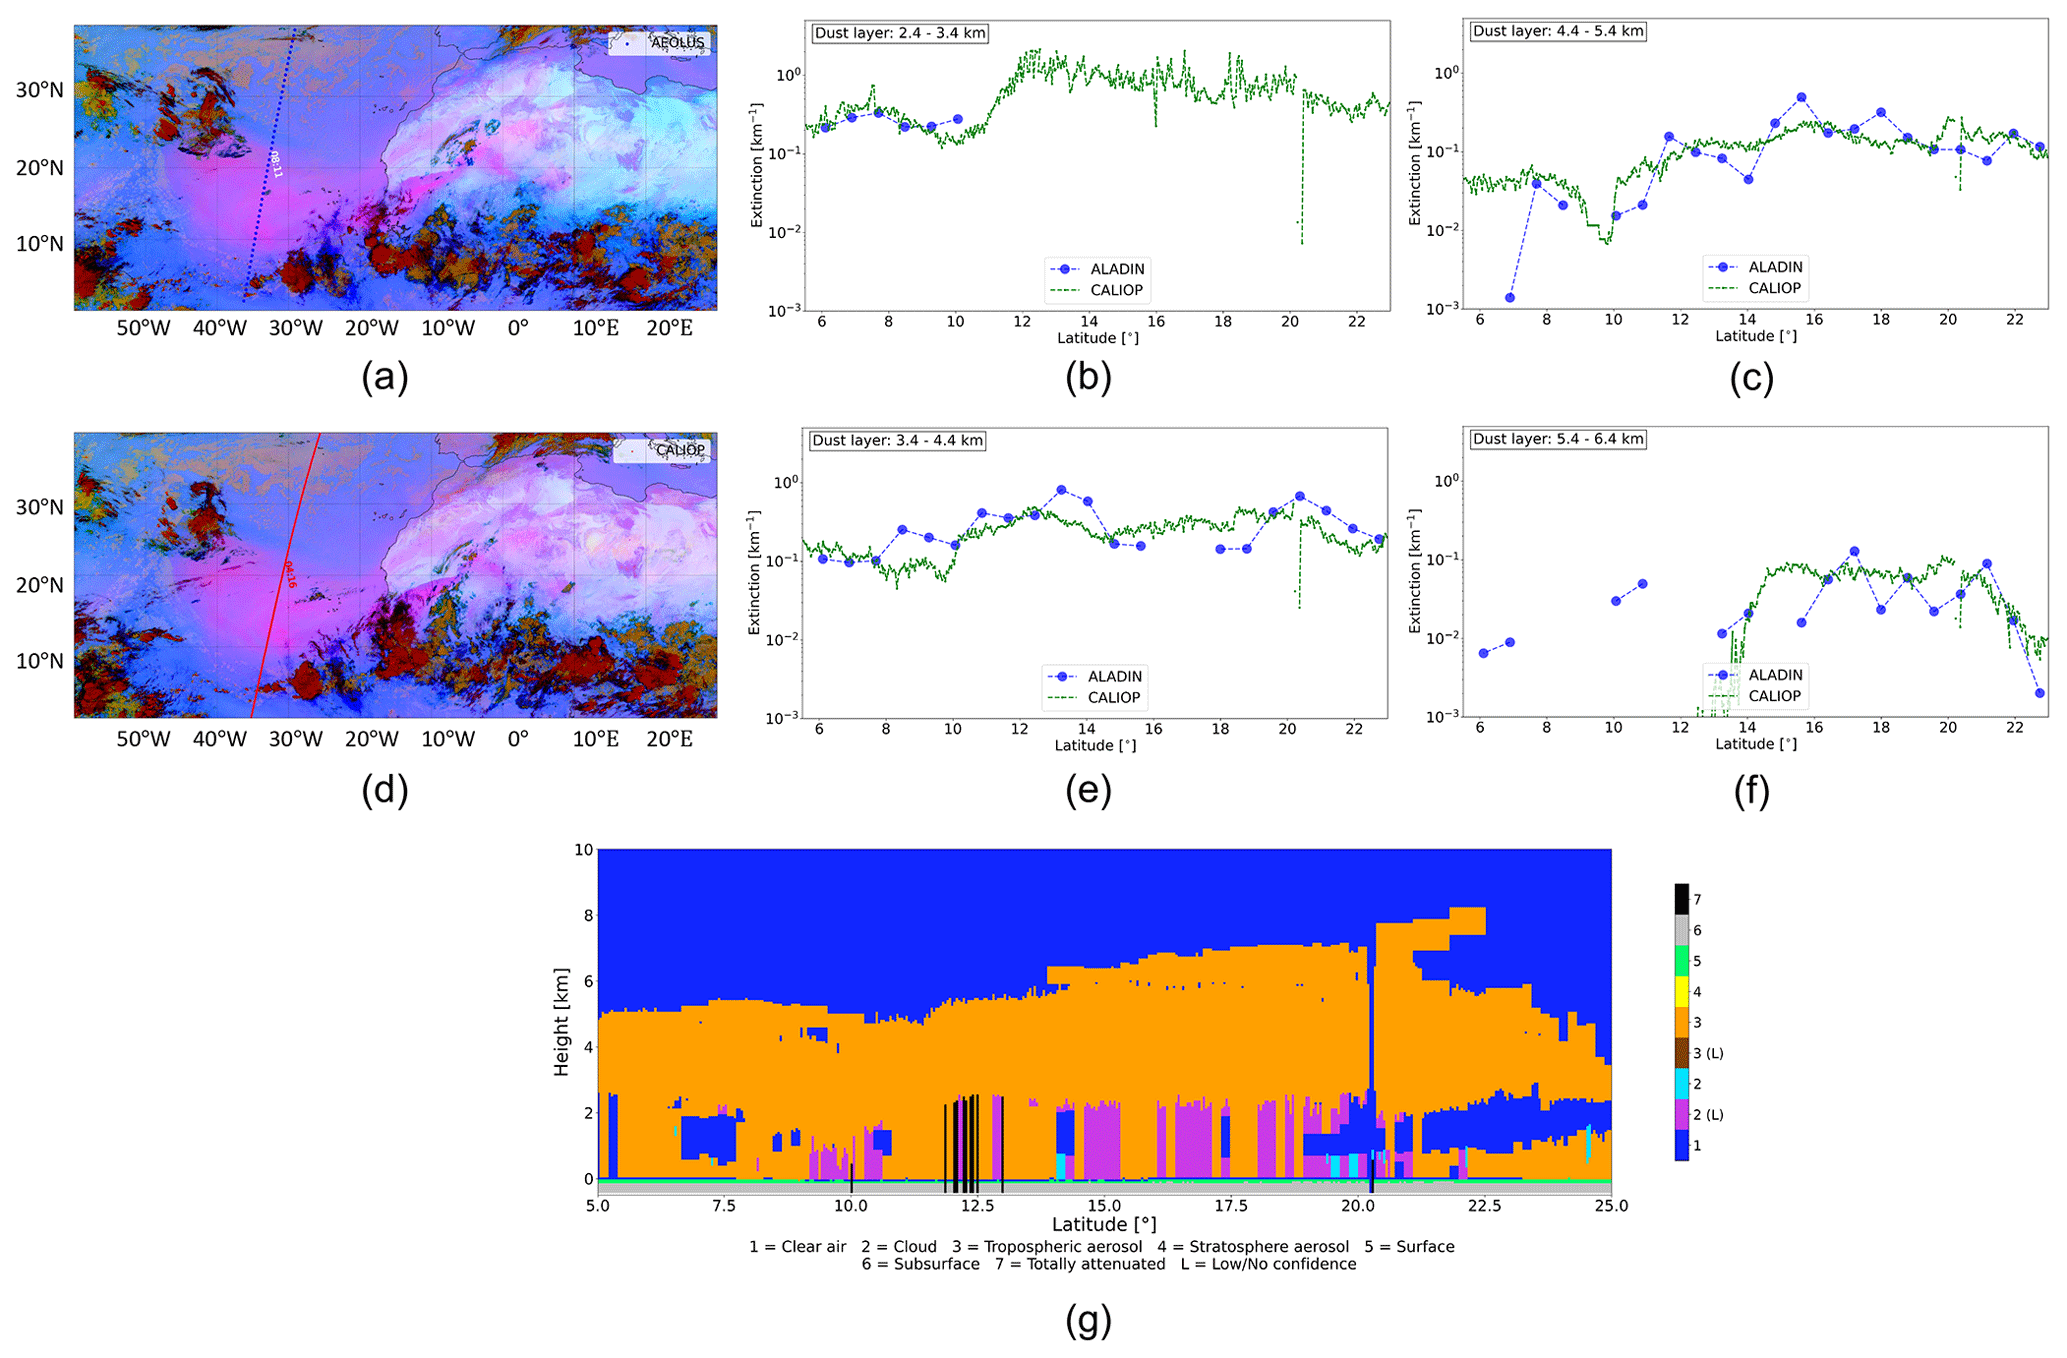
Figure 7Comparison of aerosol extinction retrievals from collocated orbits on 19 June 2020, featuring (a) an Aeolus overpass at 08:11 UTC and (d) a CALIPSO overpass at 04:16 UTC. For details on the background display and altitude layers compared, refer to Fig. 6.
Figure 8 presents one of the rare instances where both collocated CALIOP profiles and cloud-free MODIS Aqua AOD measurements are available during this dust event. The CALIOP vertical feature mask highlights the dust plume in orange, but it also includes profiles exhibiting fully attenuated bins, represented as black at lower altitudes. To calculate the column AOD from CALIOP extinction retrievals, it is essential to exclude these profiles with fully attenuated bins. The CALIOP column AOD is obtained by integrating the 532 nm aerosol extinction profile reported in the 5 km aerosol profile products.
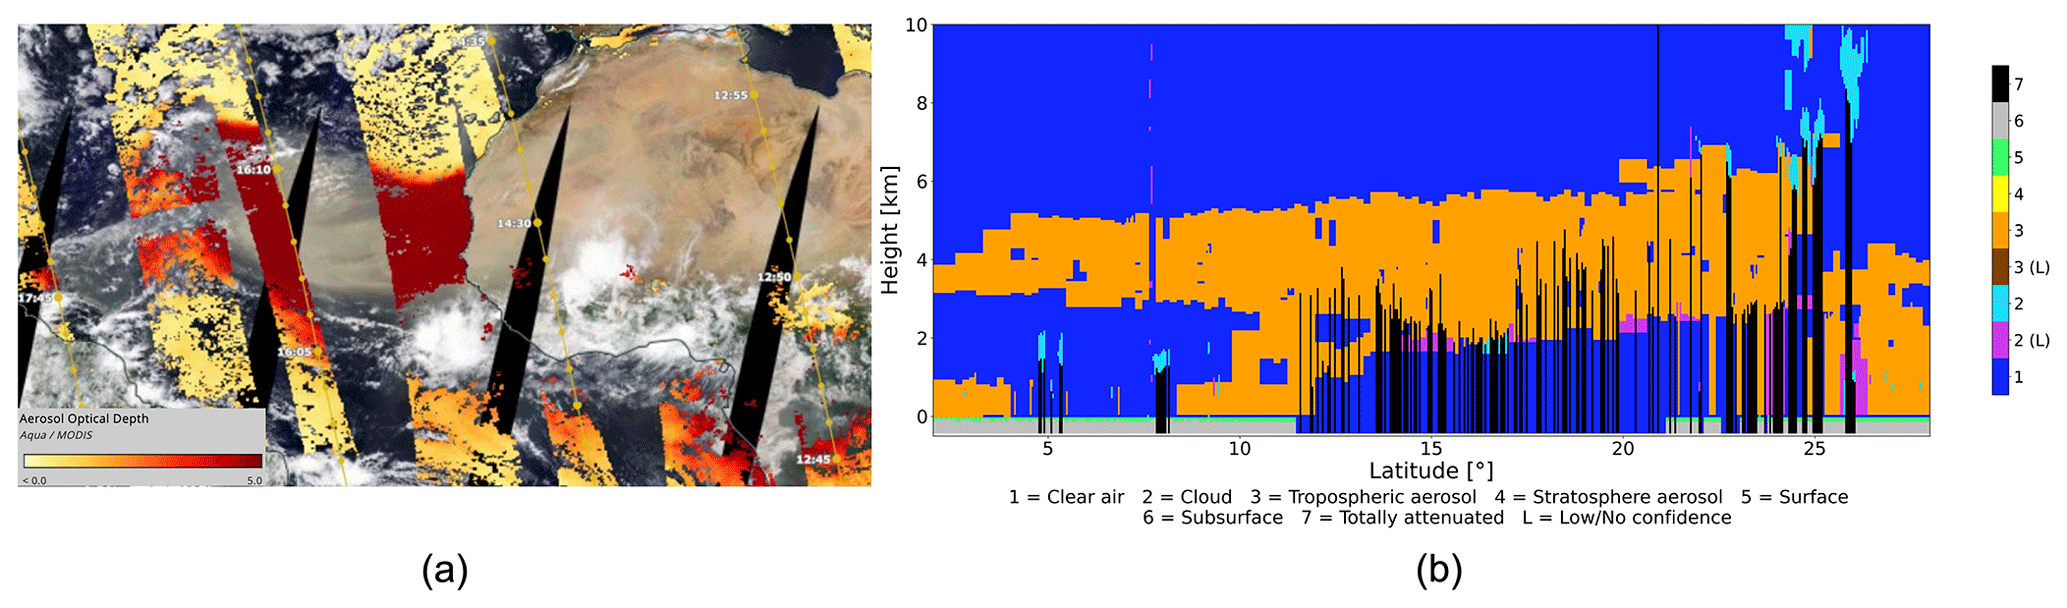
Figure 8Collocated MODIS Aqua and CALIPSO observations on 18 June 2020, with a time difference of ∼ 50 min. Panel (a) displays the MODIS Aqua cloud-free AOD at a 3 km resolution accompanied by the ascending CALIPSO track (available from NASA Worldview, last accessed on 3 July 2023). Panel (b) illustrates the corresponding CALIOP vertical feature mask.
Figure 9 compares MODIS Aqua 550 nm and CALIOP 532 nm AODs for the scene depicted in Fig. 8a. For this analysis, each CALIOP profile is paired with the nearest valid, cloud-free MODIS Aqua AOD observation. While the typical spectral difference in AODs at 532 and 550 nm is ∼ 3 %–6 % (Kim et al., 2013), this difference is relatively small when compared to the larger discrepancies observed within the latitude range of 12 to 20° N in Fig. 9. Given that CALIOP retrievals have already excluded vertical profiles containing fully attenuated bins, this AOD underestimation cannot be attributed to lost retrievals from the dust's bottom layer and marine boundary layer.
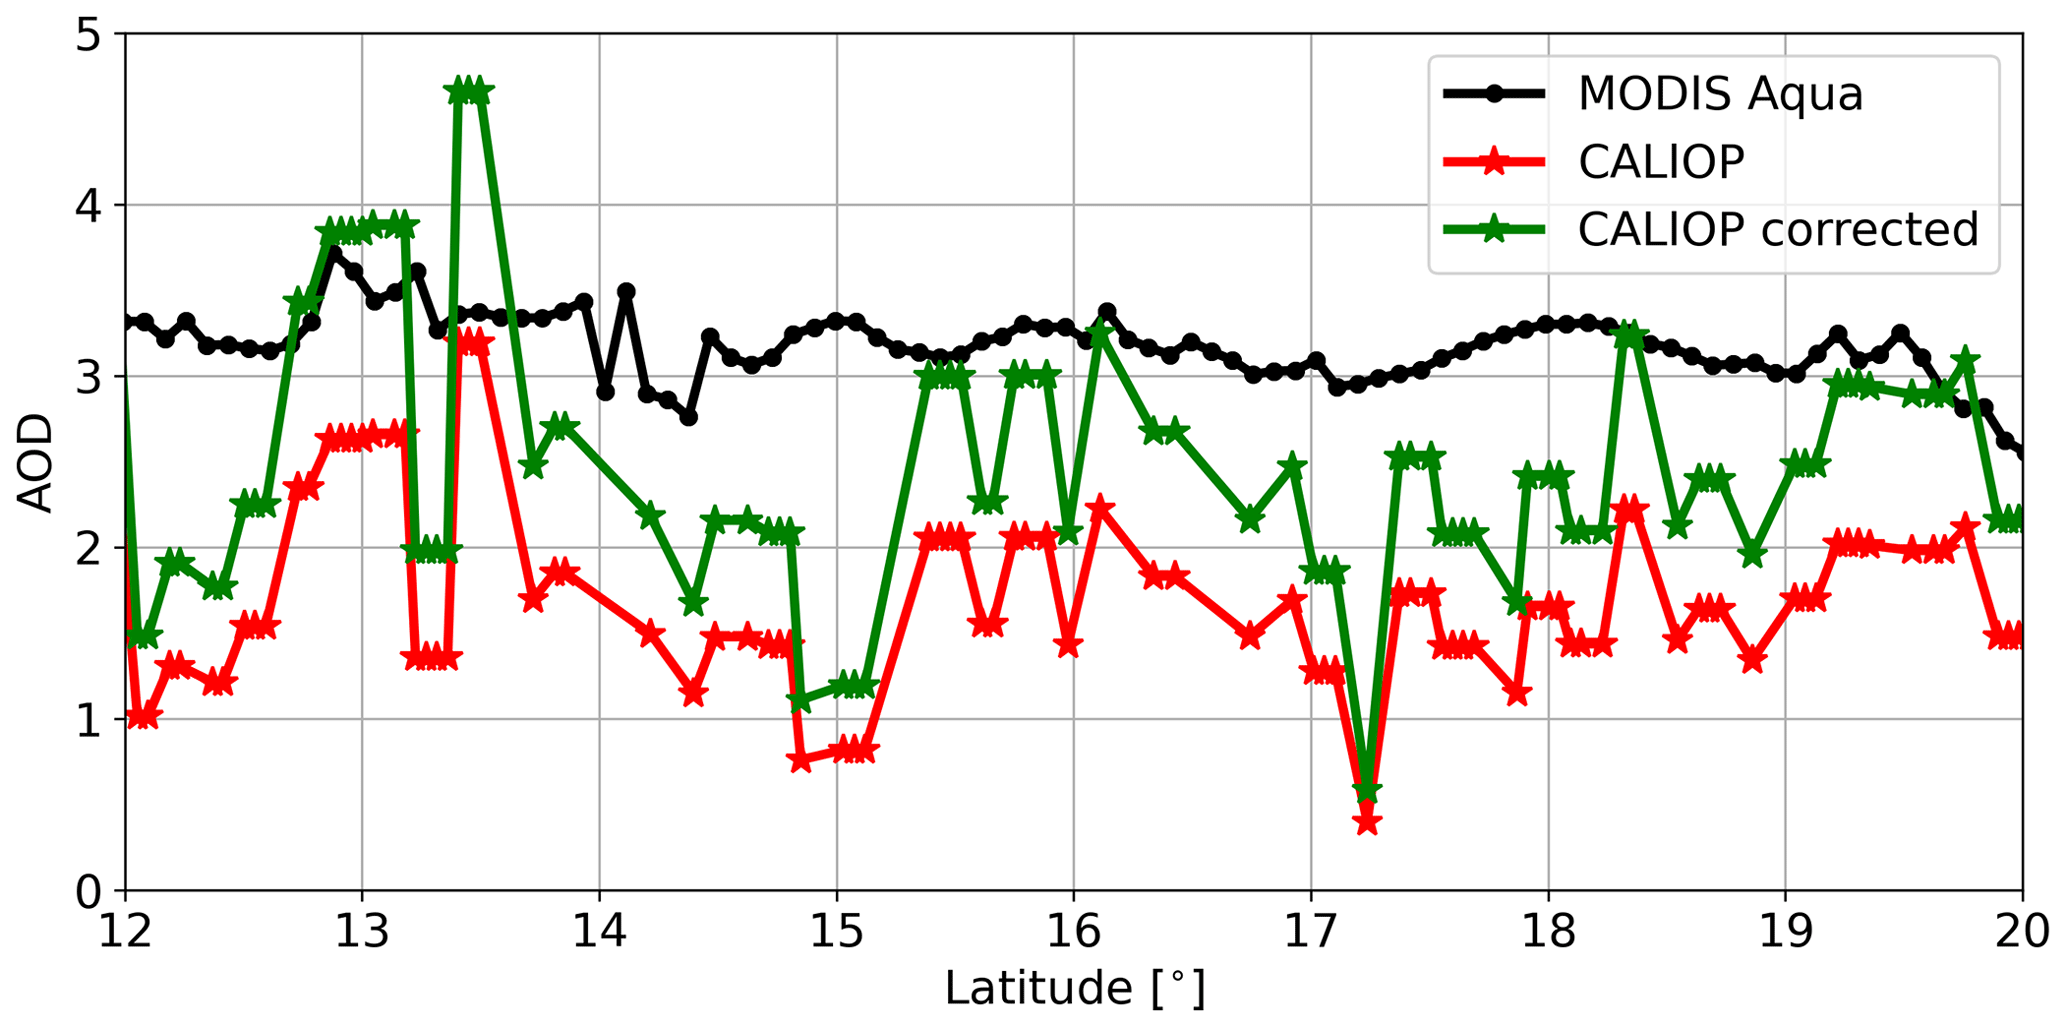
Figure 9Contrast between MODIS Aqua and CALIOP AOD, derived from observational data illustrated in Fig. 8a. MODIS Aqua AOD is selected exclusively from cloud-free retrievals. The CALIOP AODs have excluded profiles containing fully attenuated bins at any altitude. The original and corrected CALIOP AODs are shown in red and green, respectively.
In Version 3 and previous releases, a lidar ratio of 40 sr at 532 nm was adopted for CALIOP dust retrievals. Several studies suggest that a larger lidar ratio may be appropriate (Schuster et al., 2012; Papagiannopoulos et al., 2016; Wandinger et al., 2010). With the most recent Version-4 retrieval scheme, CALIOP has increased the lidar ratio of dust to 44 sr for 532 nm (Kim et al., 2018). Dust lidar ratios demonstrate significant regional variability, ranging between 35 and 60 sr (Mamouri et al., 2013; Nisantzi et al., 2015). Implementing a globally adaptable lidar ratio to accommodate various dust types is complicated, as it requires identifying the source region of the transported dust. Lidar ratios can be extracted from ALADIN observations. However, the derived lidar ratios are frequently noisy and can possess exceptionally small or large values, as the retrieval process is not constrained by the lidar ratios. During the analysis of lidar ratios from ALADIN aerosol retrievals, these noisy values should be filtered out.
Figure 10 presents the lidar ratio calculated between 18 and 19 June 2020 for all valid CALIOP and ALADIN retrievals. CALIOP retrievals use an average lidar ratio of 43.5 sr above 2.5 km – an area less impacted by maritime aerosols and regarded as the dust layer. For ALADIN retrievals, a selective filtering strategy has been implemented, maintaining only data within the 2.4-to-5.8 km altitude range that best characterize the dust layers. Within this particular altitude segment, the mean lidar ratio for dust layers stands at 63.5 sr. Although no established physical equations convert lidar ratios between 355 and 532 nm, multiple experiments with ground-based Raman lidars and airborne HSRLs have demonstrated no wavelength dependence of dust lidar ratios at these wavelengths, as detailed in Table 1.
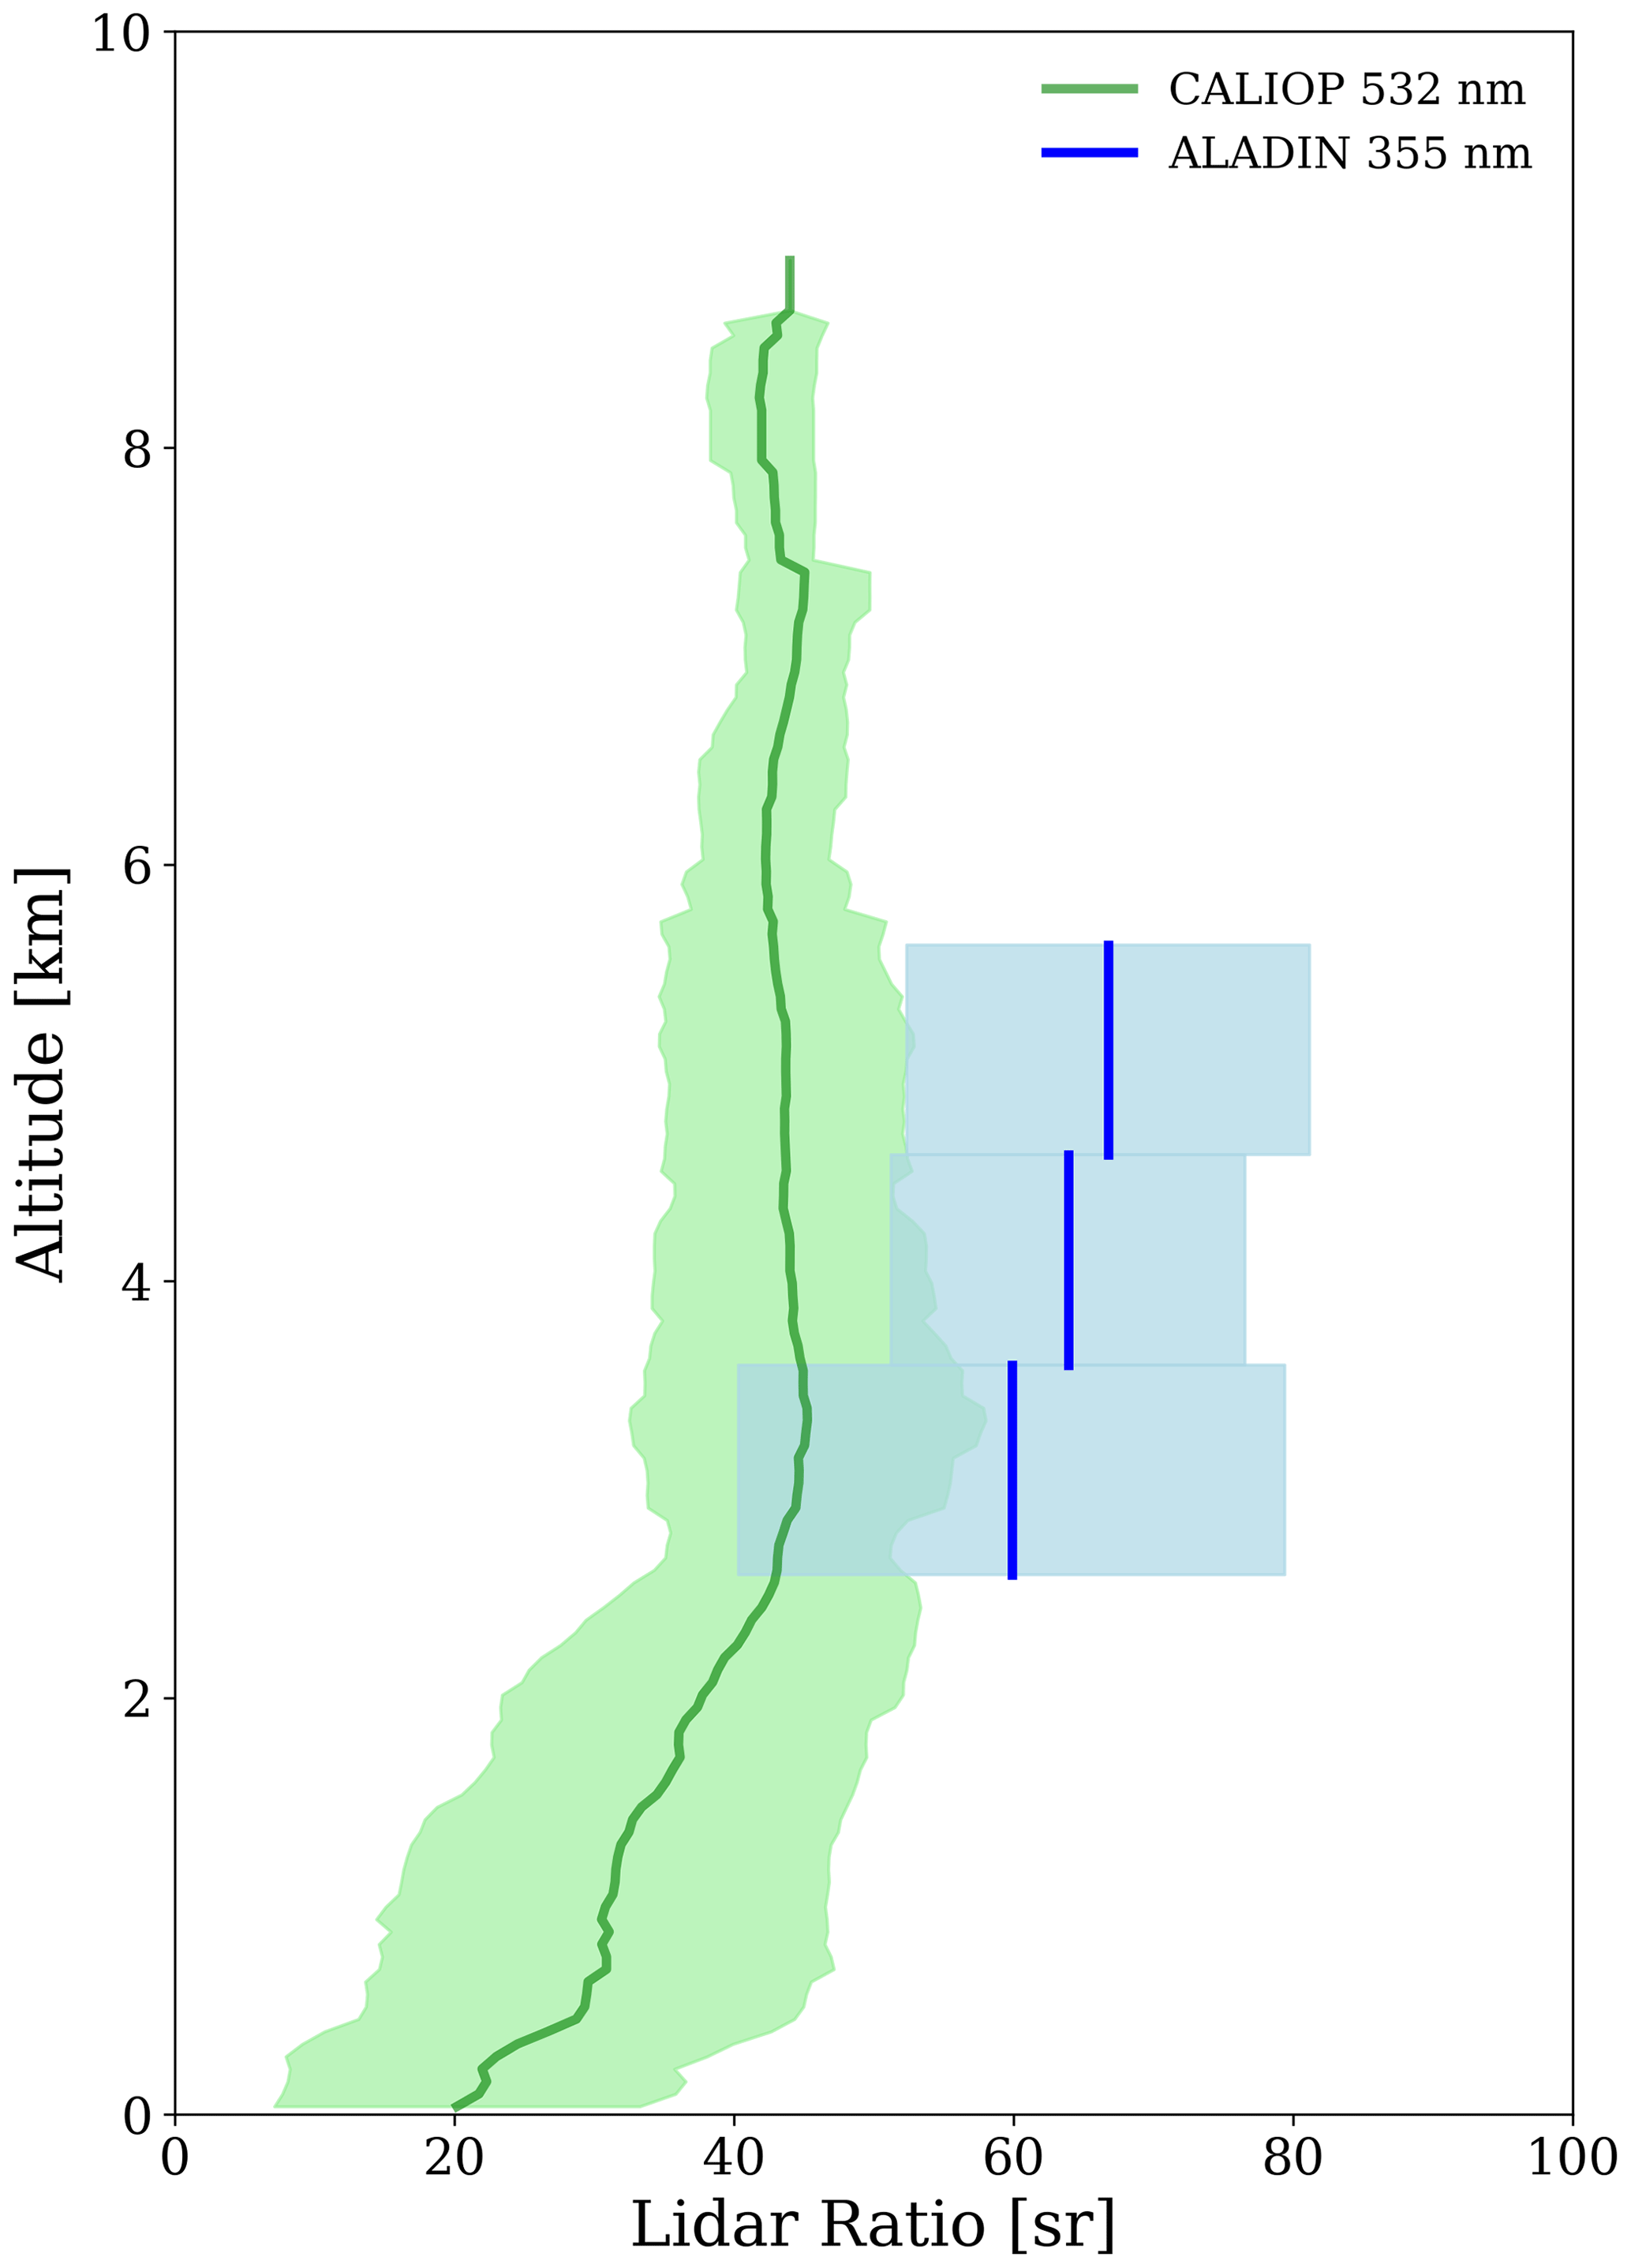
Figure 10Lidar ratios derived for the dust event from 18–19 June 2020 with CALIOP depicted in green and ALADIN in blue. The computation of ALADIN lidar ratios incorporated the conversion from co-polar to total backscatter signals.
Table 1Lidar ratios at 355 and 532 nm derived by various previous studies.
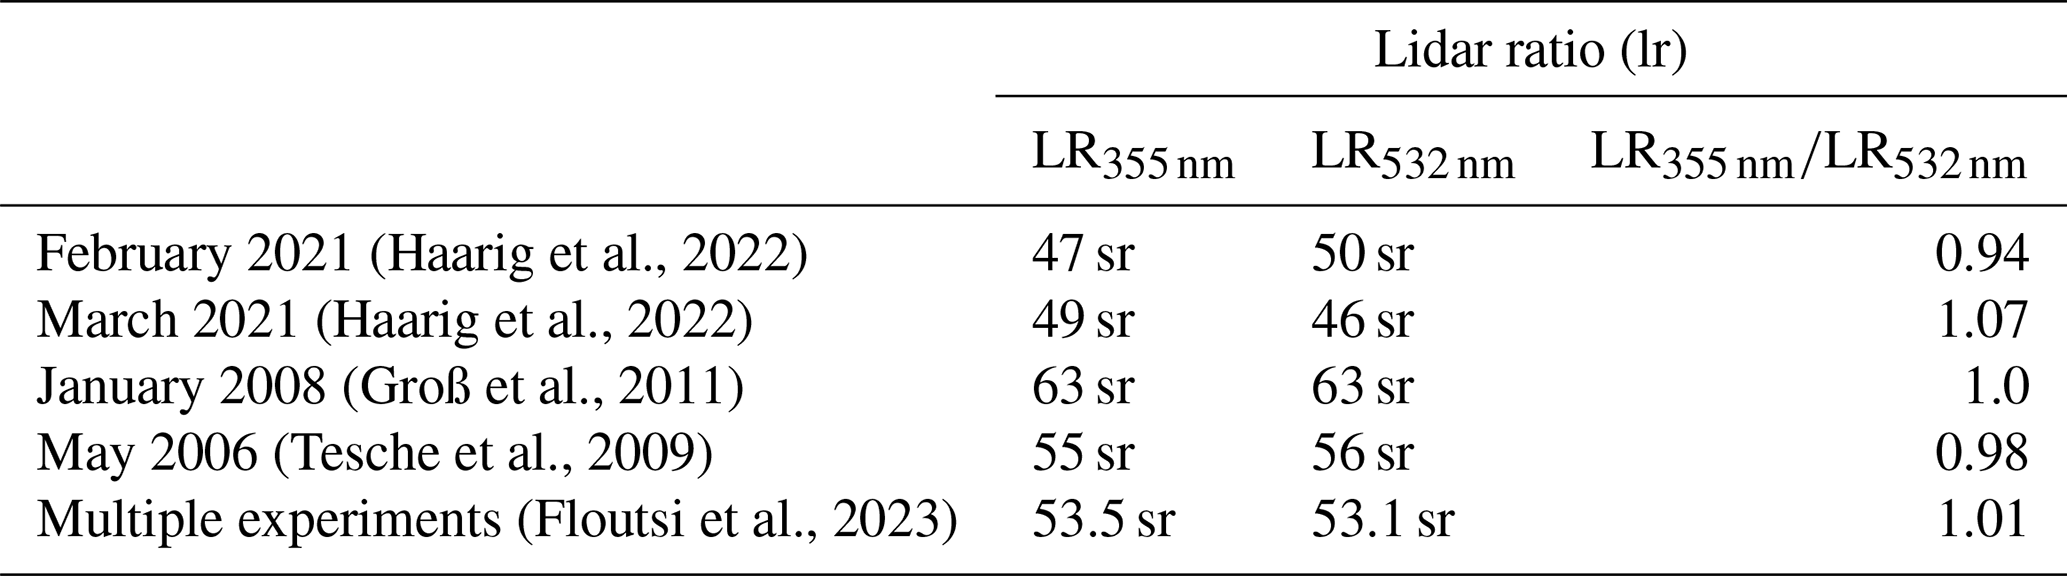
Based on the information supplied in Table 1, it is assumed that , thereby justifying the selection of a lidar ratio of 63.5 sr for the correction of CALIOP extinction retrievals at 532 nm. The extinction coefficient α532(corr) is then corrected by multiplying it with , where LRupdated is set to 63.5 sr and LRCALIOP is extracted from each individual CALIOP profile. This scaling method is an approximation, as varying the lidar ratio can influence the lidar profile by impacting the backscatter retrieval during the Klett inversion process. This alteration in backscatter retrieval, in turn, affects the subsequent extinction retrieval.
Figure 9 displays the revised CALIOP AOD values, represented in green, which are obtained through the correction of extinction retrievals. By applying a correction factor of , the extinction and AOD values increase by 46 %. This augmentation is proportionally applied to both extinction and AOD, thereby measurements exhibiting larger AOD values witness a more significant increase during the correction and vice versa. As depicted in Fig. 9, a subset of CALIOP AOD values better align with the MODIS AOD following the correction. However, there remain CALIOP values that are significantly lower than the MODIS AOD values.
Figure 11 shows the vertical distribution of revised extinction profiles for all CALIOP measurements in Fig. 9 classified into two groups. Both groups capture dust aerosols starting from 1.65 km and dissipating at 5.85 km. The two sets of extinction profiles exhibit a strong similarity in terms of extinction magnitude above 2.4 km. Below 2.4 km, as marked by the red-shaded area, the two groups of extinction profiles present considerable discrepancies.
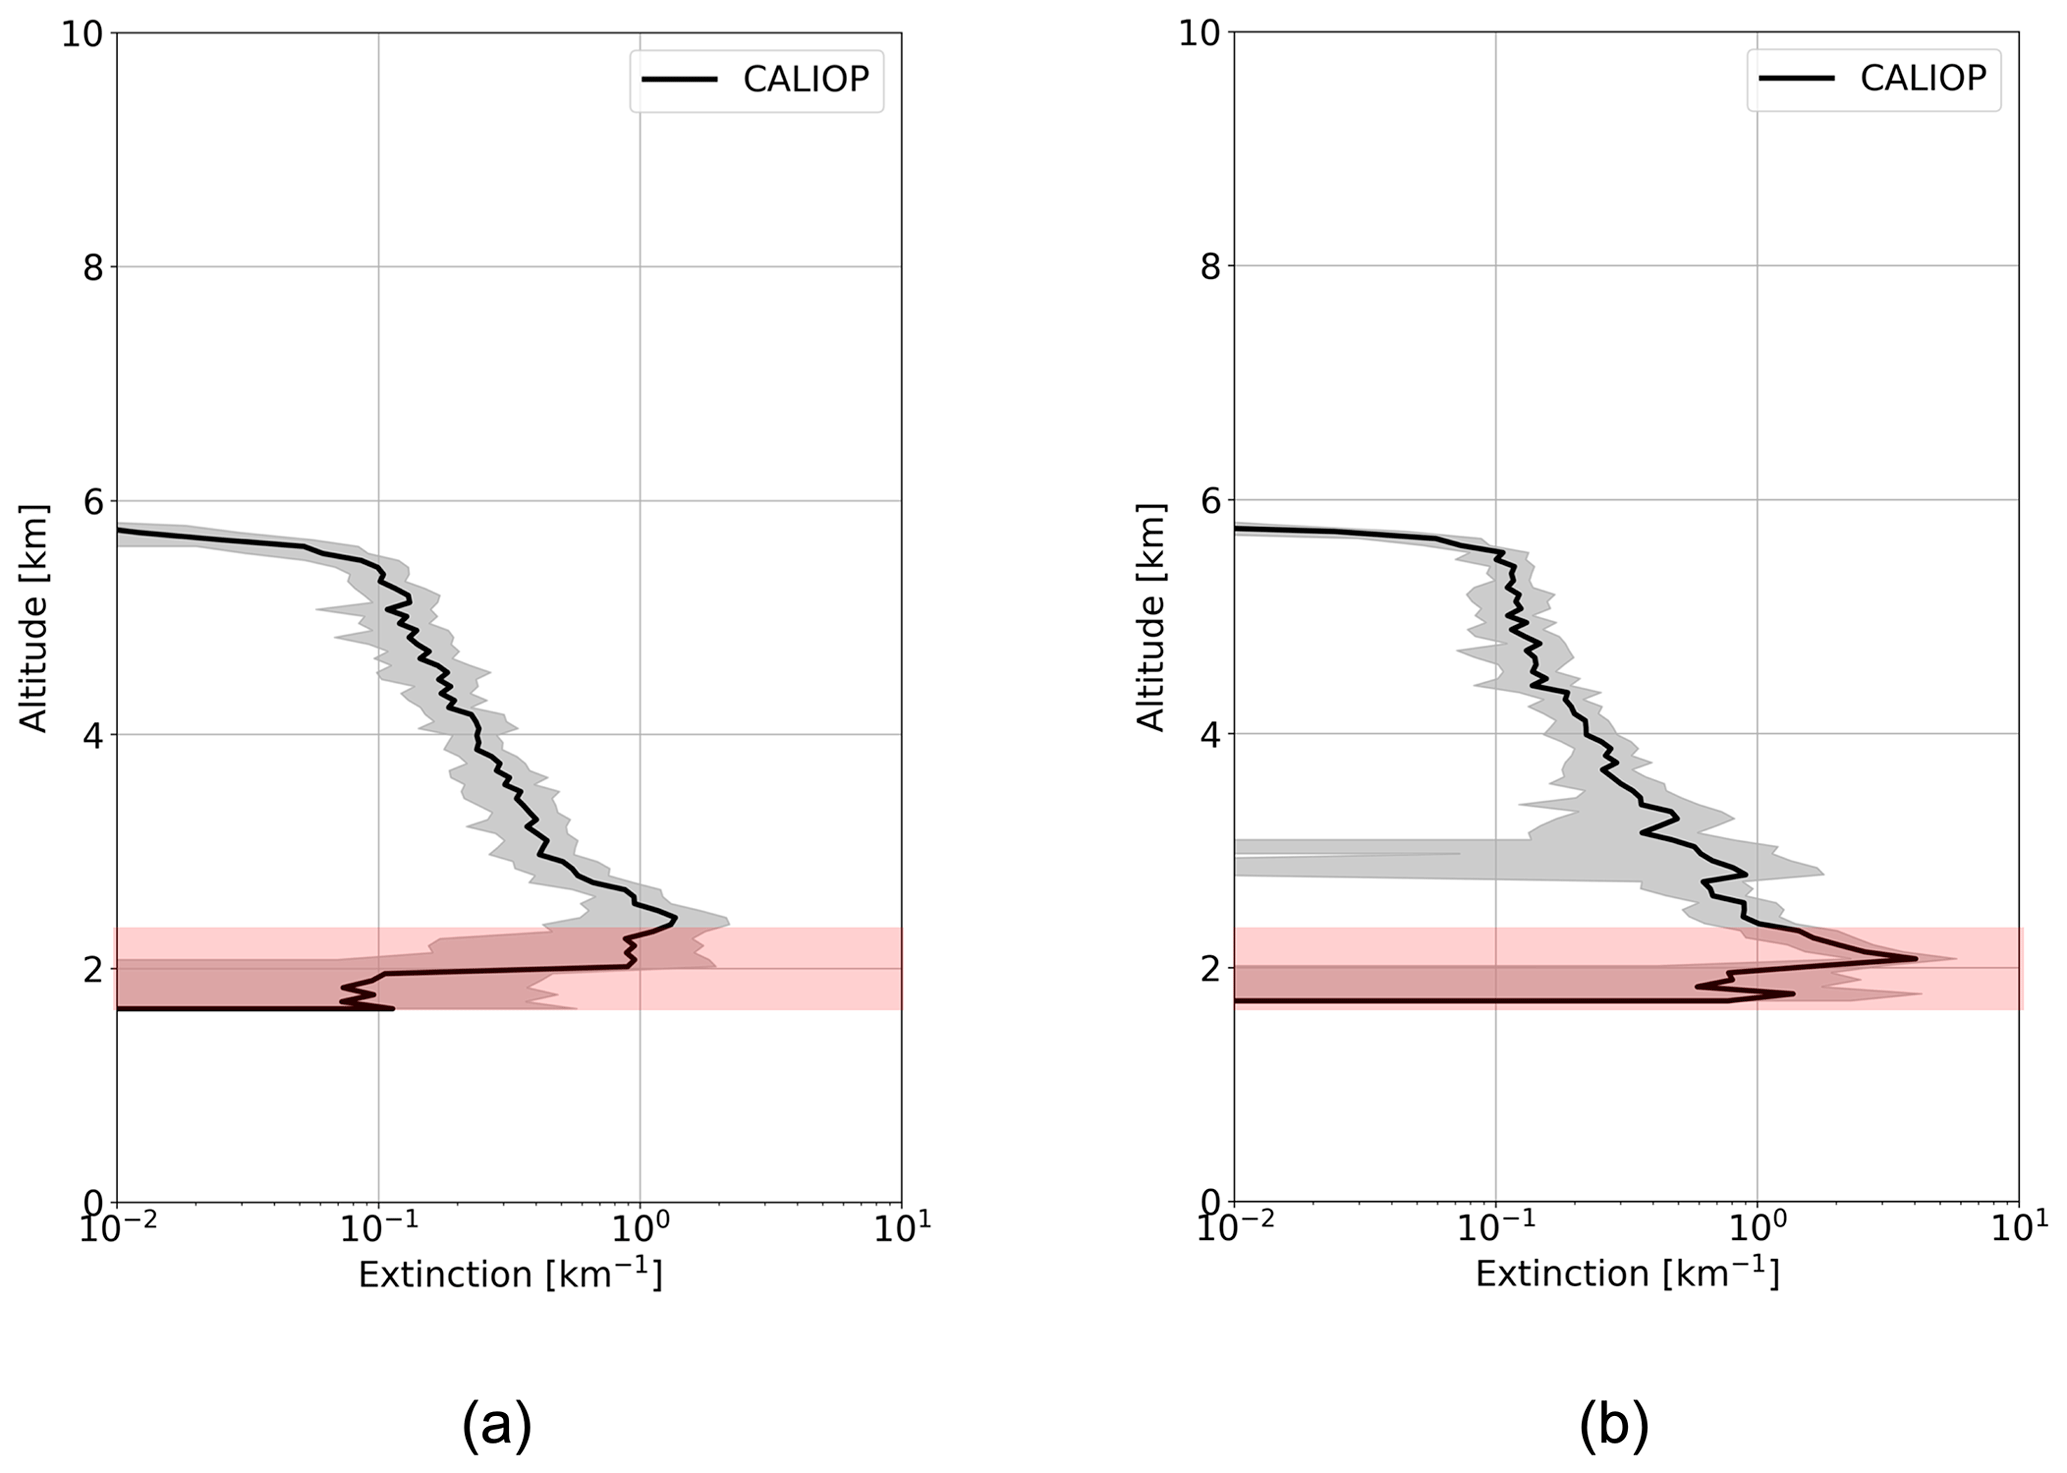
Figure 11Averaged CALIOP extinction profiles corresponding to the measurements illustrated in Fig. 9. (a) The average extinction profile for the 35 profiles with a column AOD less than 1.8. (b) The average extinction profile for the 24 profiles with a column AOD exceeding 1.8. Grey-shaded areas denote the standard deviation of extinction. Red highlights areas where notable discrepancies are observed between the two groups of extinction measurements.
Table 2Dust layer AOD for various CALIOP measurements as depicted in Fig. 11.
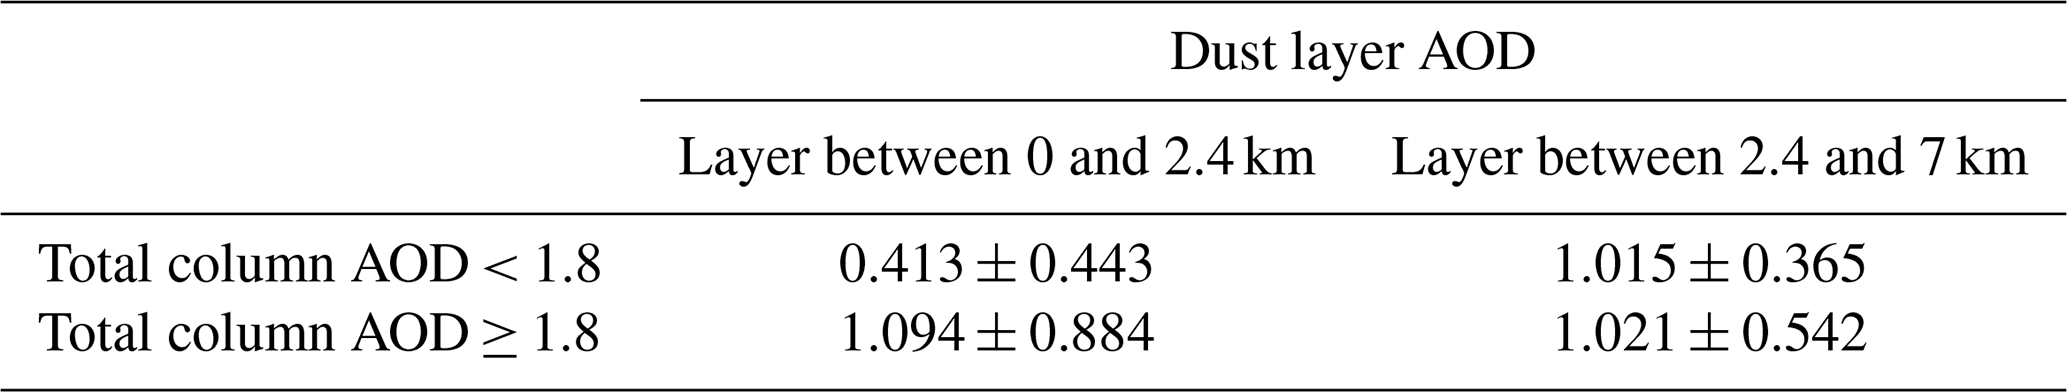
Table 2 gives the layer AOD values for both groups of revised CALIOP extinction profiles, those exhibiting higher (≥ 1.8) and lower (< 1.8) column AOD measurements. Within the dust layer between 2.4 and 7 km, both groups of measurements present similar layer AODs, 1.021 and 1.015, respectively. Pertaining to the dust layer below 2.4 km, CALIOP measurements begin to reveal the inherent limitation of lidar measurements – the potential for strong attenuation beneath dense aerosol/cloud layers. CALIOP measurements with a column AOD below 1.8 often include profiles that feature strong attenuation at the lower boundary of the dust layer, even after applying the described filtering strategy. Specifically, extinction profiles grouped under this threshold demonstrate an average layer AOD of 0.413 for the 0–2.4 km layer, with a considerable standard deviation reflecting the presence of strongly attenuated bins. In contrast, profiles with a column AOD of 1.8 or greater, which are free from such attenuation, exhibit a mean layer AOD of 1.015 in the same vertical range. It is this latter set of profiles that tends to yield AOD values consistent with those derived from MODIS observations, even though the marine boundary layer is excluded.
CALIOP, operating as a near-nadir-viewing instrument with a narrow cross-track coverage, suffers from limited temporal resolution, with a revisit time of ∼ 16 d. This limitation constrains CALIOP's capacity to track the localized vertical transport of plumes – such as ash, dust, and smoke – which are frequently linked with extensive horizontal transportation spanning several days to tens of days. Development and preparation for the launch of additional spaceborne atmospheric lidars continues. For instance, EarthCARE is scheduled for launch in 2024, with Aeolus-2 expected to follow near the end of the decade. The growing presence of atmospheric lidars in space is expected to enhance synergies among different lidars. This would potentially increase the quantity of available observations of aerosol vertical distribution, improving our ability to track the vertical transport of aerosols across various locales. Figure 12 presents a proof of concept illustrating the synergy between CALIOP and ALADIN in tracking the dust plume that penetrated the altitude layer between 4.5 and 6.5 km.
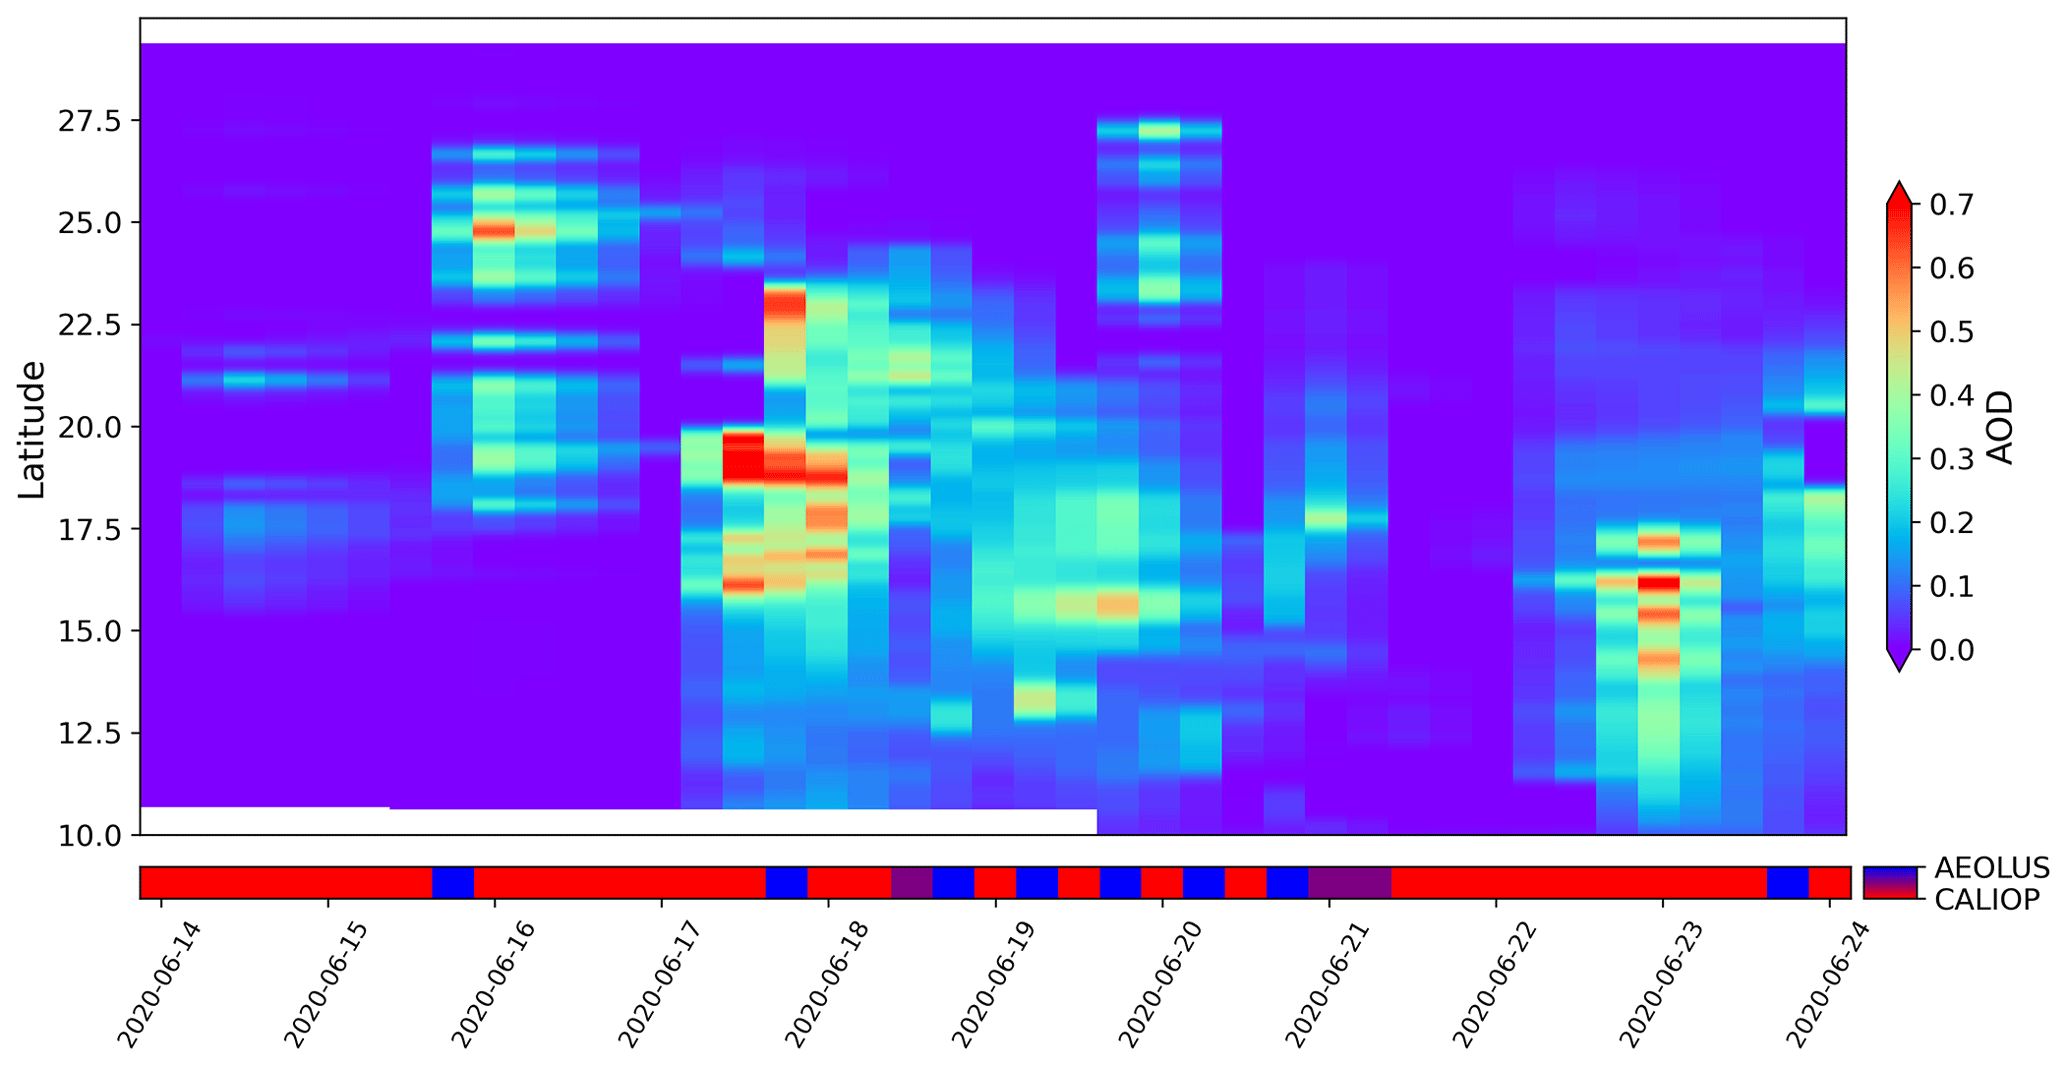
Figure 12Illustration of the synergy between CALIOP and ALADIN layer AOD within the 4.5–6.5 km altitude range, between 40° W and 20° W, covering 14 to 24 June 2020 (date format: year-month-day). This vertical layer includes 2 ALADIN bins and 33 CALIOP bins. The lower red–blue colour bar denotes the contributions from the two distinct lidars, with blue signifying ALADIN, red representing CALIOP, and purple indicating both. Both measurements have undergone cloud screening to ensure that this figure solely represents the evolution of dust aerosols within this layer.
As depicted in Fig. 12, the two satellites align well in detecting the dust aerosols that ascended to a height of 4.5–6.5 km on 16 and 17 June in the area of interest. The peak was noted by the end of 17 June, when the layer AOD surpassed 0.7. The dust aerosols remained confined within this region and were continuously observed by the two satellites over the subsequent 5 d. This observation is consistent with the findings in Dai et al. (2022), who used reanalysis data from the European Centre for Medium-Range Weather Forecasts and trajectory data from HYSPLIT to affirm that the dust plumes were transported within the northeasterly trade-wind zone between latitudes of 5 and 30° N and altitudes of 0 and 6 km.
In 2018, the first spaceborne HSRL ALADIN was launched on board the Aeolus satellite. This study assessed ALADIN's performance in retrieving the aerosol backscatter coefficient, extinction coefficient, and lidar ratio using its Level-2 SCAmb products. The aerosol retrievals from ALADIN and CALIOP were compared during the massive Saharan dust event of June 2020. This was the most intense dust event of the past 2 decades, lofting dust particles to over 6 km and transporting dust all the way to the Americas.
ALADIN does not possess the capability of measuring the particle depolarization ratio, constraining its ability to discriminate between aerosols and clouds. Our study integrates measurements from the SEVIRI instrument, on board the MSG geostationary satellite, as a dust feature mask. This operational feature ensures that a SEVIRI dust flag is available for every ALADIN observation, with a maximum temporal discrepancy of 7.5 min. This mask allows a more precise evaluation of ALADIN's observations by isolating data predominantly influenced by dust aerosols despite the low spatial resolution. This study demonstrates the importance of integrating observations from multiple platforms for optimal aerosol profiling in the context of dust events.
ALADIN only detects the co-polar component of backscattered signals, potentially leading to an underestimation of the backscatter coefficient. During the June 2020 Saharan dust case study, the co-polar component of the aerosol backscatter coefficient was converted to represent the total backscatter coefficient. An average taken between 14 and 24 June 2020 reveals a good agreement in backscatter and extinction coefficients from ALADIN and CALIOP, with both instruments showing dust ascending to 7 km. Discrepancies still persist between the two satellites' retrievals. These discrepancies can be attributed to (1) the spectral difference, with ALADIN retrieval operating at 355 nm and CALIOP at 532 nm; (2) the different overpass timings of the satellites; (3) the horizontal sampling distance – ALADIN covers 87 km, whereas CALIOP spans 5 km; and (4) uncertainties arising during the conversion from ALADIN's co-polar component to the total backscatter coefficient. When comparing extinction coefficients, an extra contributor to the discrepancy is the lidar ratio. While CALIOP assigned a predefined lidar ratio for dust, ALADIN's extinction retrieval operates independently of the lidar ratio.
A detailed analysis was conducted to compare the extinction coefficients obtained from collocated ALADIN and CALIOP orbits across various altitude layers. To align with ALADIN's observations, CALIOP's higher-vertical-resolution data were aggregated into these 1 km layers. For this extreme dust event, the quality-controlled ALADIN and CALIOP extinction retrievals converge well within the middle and top of the dust layer. However, in the bottom layer ranging from 2.4 to 3.4 km, ALADIN's extinction retrievals are strongly affected by diminished SNRs.
During this dust event, only one collocated orbit between CALIOP and MODIS was available for a comprehensive AOD comparison. For accuracy, this comparison intentionally omitted CALIOP profiles containing fully attenuated bins from the dust layer's base. Nonetheless, the findings reveal that CALIOP's column AOD is significantly lower than that observed by MODIS Aqua AOD. The lidar ratio is a key parameter in extinction retrievals, with potential to introduce biases that could lead to disparities in overall AOD calculations. The lidar ratios of dust aerosols were investigated based on observations between 18 and 19 June 2020. CALIOP used a lidar ratio averaging 43.5 sr. The lidar ratios derived from ALADIN observations showed large variability. Following rigorous filtering, the ALADIN dataset produced a mean lidar ratio of 63.5 sr for the same region and interval.
For this extreme dust event, by applying the ALADIN lidar ratio as a correction for the CALIOP extinction retrievals, the CALIOP-derived AOD retrievals increased by 46 %, resulting in a closer alignment of a substantial portion of the corrected CALIOP AOD with MODIS AOD. Nonetheless, certain CALIOP profiles continue to reflect AOD values that are significantly lower than those from MODIS. Separating these profiles based on the MODIS AOD revealed that discrepancies in overall AOD values between the two subsets were predominantly sourced from varying extinction retrievals beneath 2.4 km altitude. Given the dense dust concentration in this layer, CALIOP signals are susceptible to attenuation, leading to potential anomalies in both extinction and consequent AOD calculations.
This investigation additionally offers a demonstrative application of combining ALADIN and CALIOP observations to derive the vertical transport of aerosols. This methodology serves as a preliminary illustration of the potential collaborative benefits of employing multiple spaceborne lidars to delineate aerosols' spatial trajectories. Such demonstration has significant implications for forthcoming spaceborne HSRL missions, including the ESA EarthCARE's ATLID lidar, set for a 2024 launch, and the anticipated Aeolus-2, set for deployment by the end of this decade.
Aeolus baseline 2A11 data were obtained from the ESA Aeolus Online Dissemination System (https://aeolus-ds.eo.esa.int/oads/access/collection/Level_2A_aerosol_cloud_optical_products/, ESA, 2022). CALIOP data were obtained from the NASA Langley Research Center Atmospheric Science Data Center (https://doi.org/10.5067/CALIOP/CALIPSO/CAL_LID_L2_05kmAPro-Standard-V4-21, NASA/LARC/SD/ASDC, 2018).
RS, AP, and RGG were responsible for conceptualization and methodology. AP and RGG supervised this study. RS performed formal analysis and visualization. RS prepared the original draft. RS, AP, and RGG reviewed and edited the paper. All authors contributed to replying to the reviewers' comments.
The contact author has declared that none of the authors has any competing interests.
Publisher’s note: Copernicus Publications remains neutral with regard to jurisdictional claims made in the text, published maps, institutional affiliations, or any other geographical representation in this paper. While Copernicus Publications makes every effort to include appropriate place names, the final responsibility lies with the authors.
This article is part of the special issue “Aeolus data and their application (AMT/ACP/WCD inter-journal SI)”. It is not associated with a conference.
This study was funded through NERC's support of the National Centre for Earth Observation (award no. NE/R016518/1). This work used JASMIN, the UK collaborative data analysis facility.
This research has been supported by the National Centre for Earth Observation (grant no. NE/R016518/1).
This paper was edited by Ulla Wandinger and reviewed by four anonymous referees.
Abril-Gago, J., Guerrero-Rascado, J. L., Costa, M. J., Bravo-Aranda, J. A., Sicard, M., Bermejo-Pantaleón, D., Bortoli, D., Granados-Muñoz, M. J., Rodríguez-Gómez, A., Muñoz-Porcar, C., Comerón, A., Ortiz-Amezcua, P., Salgueiro, V., Jiménez-Martín, M. M., and Alados-Arboledas, L.: Statistical validation of Aeolus L2A particle backscatter coefficient retrievals over ACTRIS/EARLINET stations on the Iberian Peninsula, Atmos. Chem. Phys., 22, 1425–1451, https://doi.org/10.5194/acp-22-1425-2022, 2022. a, b, c
Altaratz, O., Koren, I., Remer, L., and Hirsch, E.: Review: Cloud invigoration by aerosols – Coupling between microphysics and dynamics, Atmos. Res., 140-141, 38–60, https://doi.org/10.1016/j.atmosres.2014.01.009, 2014. a
Amiridis, V., Wandinger, U., Marinou, E., Giannakaki, E., Tsekeri, A., Basart, S., Kazadzis, S., Gkikas, A., Taylor, M., Baldasano, J., and Ansmann, A.: Optimizing CALIPSO Saharan dust retrievals, Atmos. Chem. Phys., 13, 12089–12106, https://doi.org/10.5194/acp-13-12089-2013, 2013. a
Ansmann, A., Petzold, A., Kandler, K., Tegen, I., Wendisch, M., Müller, D., Weinzierl, B., Müller, T., and Heintzenberg, J.: Saharan Mineral Dust Experiments SAMUM-1 and SAMUM-2: what have we learned?, Tellus B, 63, 403–429, https://doi.org/10.1111/j.1600-0889.2011.00555.x, 2011. a
Ashpole, I. and Washington, R.: An automated dust detection using SEVIRI: A multiyear climatology of summertime dustiness in the central and western Sahara, J. Geophys. Res.-Atmos., 117, D08202, https://doi.org/10.1029/2011JD016845, 2012. a, b
Baars, H., Herzog, A., Heese, B., Ohneiser, K., Hanbuch, K., Hofer, J., Yin, Z., Engelmann, R., and Wandinger, U.: Validation of Aeolus wind products above the Atlantic Ocean, Atmos. Meas. Tech., 13, 6007–6024, https://doi.org/10.5194/amt-13-6007-2020, 2020. a
Baars, H., Radenz, M., Floutsi, A. A., Engelmann, R., Althausen, D., Heese, B., Ansmann, A., Flament, T., Dabas, A., Trapon, D., Reitebuch, O., Bley, S., and Wandinger, U.: Californian Wildfire Smoke Over Europe: A First Example of the Aerosol Observing Capabilities of Aeolus Compared to Ground-Based Lidar, Geophys. Res. Lett., 48, e2020GL092194, https://doi.org/10.1029/2020GL092194, 2021. a, b
Bellouin, N., Quaas, J., Gryspeerdt, E., Kinne, S., Stier, P., Watson-Parris, D., Boucher, O., Carslaw, K. S., Christensen, M., Daniau, A.-L., Dufresne, J.-L., Feingold, G., Fiedler, S., Forster, P., Gettelman, A., Haywood, J. M., Lohmann, U., Malavelle, F., Mauritsen, T., McCoy, D. T., Myhre, G., Mülmenstädt, J., Neubauer, D., Possner, A., Rugenstein, M., Sato, Y., Schulz, M., Schwartz, S. E., Sourdeval, O., Storelvmo, T., Toll, V., Winker, D., and Stevens, B.: Bounding Global Aerosol Radiative Forcing of Climate Change, Rev. Geophys., 58, e2019RG000660, https://doi.org/10.1029/2019RG000660, 2020. a
Burton, S. P., Ferrare, R. A., Hostetler, C. A., Hair, J. W., Rogers, R. R., Obland, M. D., Butler, C. F., Cook, A. L., Harper, D. B., and Froyd, K. D.: Aerosol classification using airborne High Spectral Resolution Lidar measurements – methodology and examples, Atmos. Meas. Tech., 5, 73–98, https://doi.org/10.5194/amt-5-73-2012, 2012. a
Burton, S. P., Ferrare, R. A., Vaughan, M. A., Omar, A. H., Rogers, R. R., Hostetler, C. A., and Hair, J. W.: Aerosol classification from airborne HSRL and comparisons with the CALIPSO vertical feature mask, Atmos. Meas. Tech., 6, 1397–1412, https://doi.org/10.5194/amt-6-1397-2013, 2013. a
Dai, G., Sun, K., Wang, X., Wu, S., E, X., Liu, Q., and Liu, B.: Dust transport and advection measurement with spaceborne lidars ALADIN and CALIOP and model reanalysis data, Atmos. Chem. Phys., 22, 7975–7993, https://doi.org/10.5194/acp-22-7975-2022, 2022. a
Dubovik, O., Sinyuk, A., Lapyonok, T., Holben, B. N., Mishchenko, M., Yang, P., Eck, T. F., Volten, H., Muñoz, O., Veihelmann, B., van der Zande, W. J., Leon, J.-F., Sorokin, M., and Slutsker, I.: Application of spheroid models to account for aerosol particle nonsphericity in remote sensing of desert dust, J. Geophys. Res.-Atmos., 111, D11208, https://doi.org/10.1029/2005JD006619, 2006. a
Ehlers, F., Flament, T., Dabas, A., Trapon, D., Lacour, A., Baars, H., and Straume-Lindner, A. G.: Optimization of Aeolus' aerosol optical properties by maximum-likelihood estimation, Atmos. Meas. Tech., 15, 185–203, https://doi.org/10.5194/amt-15-185-2022, 2022. a, b, c
ESA: Aeolus Online Dissemination System, https://aeolus-ds.eo.esa.int/oads/access/collection/Level_2A_aerosol_cloud_optical_products/, last access: 5 December 2022. a
Feofilov, A. G., Chepfer, H., Noël, V., Guzman, R., Gindre, C., Ma, P.-L., and Chiriaco, M.: Comparison of scattering ratio profiles retrieved from ALADIN/Aeolus and CALIOP/CALIPSO observations and preliminary estimates of cloud fraction profiles, Atmos. Meas. Tech., 15, 1055–1074, https://doi.org/10.5194/amt-15-1055-2022, 2022. a, b
Flamant, P., Dabas, A., Martinet, P., Lever, V., Flament, T., Trapon, D., Olivier, M., Cuesta, J., and Huber, D.: Aeolus L2A Algorithm Theoretical Baseline Document, Particle optical properties product, version 5.7, https://earth.esa.int/eogateway/catalog/aeolus-l2a-aerosol-cloud-optical-product (last access: 20 December 2023), 2020a. a
Flamant, P., Dabas, A., Martinet, P., Lever, V., Flament, T., Trapon, D., Olivier, M., Cuesta, J., and Huber, D.: Aeolus L2A Algorithm Theoretical Baseline Document, Particle optical properties product, version 5.7, https://earth.esa.int/eogateway/catalog/aeolus-l2a-aerosol-cloud-optical-product (last access: 20 December 2023), 2020b. a
Flament, T., Trapon, D., Lacour, A., Dabas, A., Ehlers, F., and Huber, D.: Aeolus L2A aerosol optical properties product: standard correct algorithm and Mie correct algorithm, Atmos. Meas. Tech., 14, 7851–7871, https://doi.org/10.5194/amt-14-7851-2021, 2021. a, b, c
Floutsi, A. A., Baars, H., Engelmann, R., Althausen, D., Ansmann, A., Bohlmann, S., Heese, B., Hofer, J., Kanitz, T., Haarig, M., Ohneiser, K., Radenz, M., Seifert, P., Skupin, A., Yin, Z., Abdullaev, S. F., Komppula, M., Filioglou, M., Giannakaki, E., Stachlewska, I. S., Janicka, L., Bortoli, D., Marinou, E., Amiridis, V., Gialitaki, A., Mamouri, R.-E., Barja, B., and Wandinger, U.: DeLiAn – a growing collection of depolarization ratio, lidar ratio and Ångström exponent for different aerosol types and mixtures from ground-based lidar observations, Atmos. Meas. Tech., 16, 2353–2379, https://doi.org/10.5194/amt-16-2353-2023, 2023. a
Francis, D., Fonseca, R., Nelli, N., Cuesta, J., Weston, M., Evan, A., and Temimi, M.: The Atmospheric Drivers of the Major Saharan Dust Storm in June 2020, Geophys. Res. Lett., 47, e2020GL090102, https://doi.org/10.1029/2020GL090102, 2020. a
Ghan, S. J., Liu, X., Easter, R. C., Zaveri, R., Rasch, P. J., Yoon, J.-H., and Eaton, B.: Toward a Minimal Representation of Aerosols in Climate Models: Comparative Decomposition of Aerosol Direct, Semidirect, and Indirect Radiative Forcing, J. Climate, 25, 6461–6476, https://doi.org/10.1175/JCLI-D-11-00650.1, 2012. a
Gkikas, A., Gialitaki, A., Binietoglou, I., Marinou, E., Tsichla, M., Siomos, N., Paschou, P., Kampouri, A., Voudouri, K. A., Proestakis, E., Mylonaki, M., Papanikolaou, C.-A., Michailidis, K., Baars, H., Straume, A. G., Balis, D., Papayannis, A., Parrinello, T., and Amiridis, V.: First assessment of Aeolus Standard Correct Algorithm particle backscatter coefficient retrievals in the eastern Mediterranean, Atmos. Meas. Tech., 16, 1017–1042, https://doi.org/10.5194/amt-16-1017-2023, 2023. a, b, c, d, e
Groß, S., Wiegner, M., Freudenthaler, V., and Toledano, C.: Lidar ratio of Saharan dust over Cape Verde Islands: Assessment and error calculation, J. Geophys. Res.-Atmos., 116, D15203, https://doi.org/10.1029/2010JD015435, 2011. a
Haarig, M., Ansmann, A., Engelmann, R., Baars, H., Toledano, C., Torres, B., Althausen, D., Radenz, M., and Wandinger, U.: First triple-wavelength lidar observations of depolarization and extinction-to-backscatter ratios of Saharan dust, Atmos. Chem. Phys., 22, 355–369, https://doi.org/10.5194/acp-22-355-2022, 2022. a, b
Kim, M.-H., Kim, S.-W., Yoon, S.-C., and Omar, A. H.: Comparison of aerosol optical depth between CALIOP and MODIS-Aqua for CALIOP aerosol subtypes over the ocean, J. Geophys. Res.-Atmos., 118, 13241–13252, https://doi.org/10.1002/2013JD019527, 2013. a
Kim, M.-H., Omar, A. H., Vaughan, M. A., Winker, D. M., Trepte, C. R., Hu, Y., Liu, Z., and Kim, S.-W.: Quantifying the low bias of CALIPSO's column aerosol optical depth due to undetected aerosol layers, J. Geophys. Res.-Atmos., 122, 1098–1113, https://doi.org/10.1002/2016JD025797, 2017. a, b, c
Kim, M.-H., Omar, A. H., Tackett, J. L., Vaughan, M. A., Winker, D. M., Trepte, C. R., Hu, Y., Liu, Z., Poole, L. R., Pitts, M. C., Kar, J., and Magill, B. E.: The CALIPSO version 4 automated aerosol classification and lidar ratio selection algorithm, Atmos. Meas. Tech., 11, 6107–6135, https://doi.org/10.5194/amt-11-6107-2018, 2018. a, b, c
Kim, M.-H., Kim, S.-W., and Omar, A. H.: Dust Lidar Ratios Retrieved from the CALIOP Measurements Using the MODIS AOD as a Constraint, Remote Sens.-Basel, 12, 251, https://doi.org/10.3390/rs12020251, 2020. a
Kipling, Z., Stier, P., Johnson, C. E., Mann, G. W., Bellouin, N., Bauer, S. E., Bergman, T., Chin, M., Diehl, T., Ghan, S. J., Iversen, T., Kirkevåg, A., Kokkola, H., Liu, X., Luo, G., van Noije, T., Pringle, K. J., von Salzen, K., Schulz, M., Seland, Ø., Skeie, R. B., Takemura, T., Tsigaridis, K., and Zhang, K.: What controls the vertical distribution of aerosol? Relationships between process sensitivity in HadGEM3–UKCA and inter-model variation from AeroCom Phase II, Atmos. Chem. Phys., 16, 2221–2241, https://doi.org/10.5194/acp-16-2221-2016, 2016. a
Koffi, B., Schulz, M., Bréon, F.-M., Griesfeller, J., Winker, D., Balkanski, Y., Bauer, S., Berntsen, T., Chin, M., Collins, W. D., Dentener, F., Diehl, T., Easter, R., Ghan, S., Ginoux, P., Gong, S., Horowitz, L. W., Iversen, T., Kirkevåg, A., Koch, D., Krol, M., Myhre, G., Stier, P., and Takemura, T.: Application of the CALIOP layer product to evaluate the vertical distribution of aerosols estimated by global models: AeroCom phase I results, J. Geophys. Res.-Atmos., 117, D10201, https://doi.org/10.1029/2011JD016858, 2012. a
Legras, B., Duchamp, C., Sellitto, P., Podglajen, A., Carboni, E., Siddans, R., Grooß, J.-U., Khaykin, S., and Ploeger, F.: The evolution and dynamics of the Hunga Tonga–Hunga Ha'apai sulfate aerosol plume in the stratosphere, Atmos. Chem. Phys., 22, 14957–14970, https://doi.org/10.5194/acp-22-14957-2022, 2022. a
Liu, Z., Omar, A., Vaughan, M., Hair, J., Kittaka, C., Hu, Y., Powell, K., Trepte, C., Winker, D., Hostetler, C., Ferrare, R., and Pierce, R.: CALIPSO lidar observations of the optical properties of Saharan dust: A case study of long-range transport, J. Geophys. Res.-Atmos., 113, D07207, https://doi.org/10.1029/2007JD008878, 2008. a
Mamouri, R. E., Ansmann, A., Nisantzi, A., Kokkalis, P., Schwarz, A., and Hadjimitsis, D.: Low Arabian dust extinction-to-backscatter ratio, Geophys. Res. Lett., 40, 4762–4766, https://doi.org/10.1002/grl.50898, 2013. a
Markus, T., Neumann, T., Martino, A., Abdalati, W., Brunt, K., Csatho, B., Farrell, S., Fricker, H., Gardner, A., Harding, D., Jasinski, M., Kwok, R., Magruder, L., Lubin, D., Luthcke, S., Morison, J., Nelson, R., Neuenschwander, A., Palm, S., Popescu, S., Shum, C., Schutz, B. E., Smith, B., Yang, Y., and Zwally, J.: The Ice, Cloud, and land Elevation Satellite-2 (ICESat-2): Science requirements, concept, and implementation, Remote Sens. Environ., 190, 260–273, https://doi.org/10.1016/j.rse.2016.12.029, 2017. a
McGill, M. J., Yorks, J. E., Scott, V. S., Kupchock, A. W., and Selmer, P. A.: The Cloud-Aerosol Transport System (CATS): a technology demonstration on the International Space Station, in: Lidar Remote Sensing for Environmental Monitoring XV, edited by: Singh, U. N., International Society for Optics and Photonics, SPIE, 9612, p. 96120A, https://doi.org/10.1117/12.2190841, 2015. a
Mishchenko, M. I. and Hovenier, J. W.: Depolarization of light backscattered by randomly oriented nonspherical particles, Opt. Lett., 20, 1356–1358, https://doi.org/10.1364/OL.20.001356, 1995. a
Mona, L., Amodeo, A., Pandolfi, M., and Pappalardo, G.: Saharan dust intrusions in the Mediterranean area: Three years of Raman lidar measurements, J. Geophys. Res.-Atmos., 111, D16203, https://doi.org/10.1029/2005JD006569, 2006. a
Müller, D., Hostetler, C. A., Ferrare, R. A., Burton, S. P., Chemyakin, E., Kolgotin, A., Hair, J. W., Cook, A. L., Harper, D. B., Rogers, R. R., Hare, R. W., Cleckner, C. S., Obland, M. D., Tomlinson, J., Berg, L. K., and Schmid, B.: Airborne Multiwavelength High Spectral Resolution Lidar (HSRL-2) observations during TCAP 2012: vertical profiles of optical and microphysical properties of a smoke/urban haze plume over the northeastern coast of the US, Atmos. Meas. Tech., 7, 3487–3496, https://doi.org/10.5194/amt-7-3487-2014, 2014. a
Myhre, G., Samset, B. H., Schulz, M., Balkanski, Y., Bauer, S., Berntsen, T. K., Bian, H., Bellouin, N., Chin, M., Diehl, T., Easter, R. C., Feichter, J., Ghan, S. J., Hauglustaine, D., Iversen, T., Kinne, S., Kirkevåg, A., Lamarque, J.-F., Lin, G., Liu, X., Lund, M. T., Luo, G., Ma, X., van Noije, T., Penner, J. E., Rasch, P. J., Ruiz, A., Seland, Ø., Skeie, R. B., Stier, P., Takemura, T., Tsigaridis, K., Wang, P., Wang, Z., Xu, L., Yu, H., Yu, F., Yoon, J.-H., Zhang, K., Zhang, H., and Zhou, C.: Radiative forcing of the direct aerosol effect from AeroCom Phase II simulations, Atmos. Chem. Phys., 13, 1853–1877, https://doi.org/10.5194/acp-13-1853-2013, 2013. a
NASA/LARC/SD/ASDC: CALIPSO Lidar Level 2 Aerosol Profile, V4-21, NASA Langley Atmospheric Science Data Center DAAC [data set], https://doi.org/10.5067/CALIOP/CALIPSO/CAL_LID_L2_05kmAPro-Standard-V4-21, 2018. a
Nisantzi, A., Mamouri, R. E., Ansmann, A., Schuster, G. L., and Hadjimitsis, D. G.: Middle East versus Saharan dust extinction-to-backscatter ratios, Atmos. Chem. Phys., 15, 7071–7084, https://doi.org/10.5194/acp-15-7071-2015, 2015. a
Nowottnick, E. P., Colarco, P. R., Welton, E. J., and da Silva, A.: Use of the CALIOP vertical feature mask for evaluating global aerosol models, Atmos. Meas. Tech., 8, 3647–3669, https://doi.org/10.5194/amt-8-3647-2015, 2015. a
Oikawa, E., Nakajima, T., and Winker, D.: An Evaluation of the Shortwave Direct Aerosol Radiative Forcing Using CALIOP and MODIS Observations, J. Geophys. Res.-Atmos., 123, 1211–1233, https://doi.org/10.1002/2017JD027247, 2018. a
Omar, A. H., Winker, D. M., Vaughan, M. A., Hu, Y., Trepte, C. R., Ferrare, R. A., Lee, K.-P., Hostetler, C. A., Kittaka, C., Rogers, R. R., Kuehn, R. E., and Liu, Z.: The CALIPSO Automated Aerosol Classification and Lidar Ratio Selection Algorithm, J. Atmos. Ocean. Tech., 26, 1994–2014, https://doi.org/10.1175/2009JTECHA1231.1, 2009. a
Papagiannopoulos, N., Mona, L., Alados-Arboledas, L., Amiridis, V., Baars, H., Binietoglou, I., Bortoli, D., D'Amico, G., Giunta, A., Guerrero-Rascado, J. L., Schwarz, A., Pereira, S., Spinelli, N., Wandinger, U., Wang, X., and Pappalardo, G.: CALIPSO climatological products: evaluation and suggestions from EARLINET, Atmos. Chem. Phys., 16, 2341–2357, https://doi.org/10.5194/acp-16-2341-2016, 2016. a
Pappalardo, G., Amodeo, A., Apituley, A., Comeron, A., Freudenthaler, V., Linné, H., Ansmann, A., Bösenberg, J., D'Amico, G., Mattis, I., Mona, L., Wandinger, U., Amiridis, V., Alados-Arboledas, L., Nicolae, D., and Wiegner, M.: EARLINET: towards an advanced sustainable European aerosol lidar network, Atmos. Meas. Tech., 7, 2389–2409, https://doi.org/10.5194/amt-7-2389-2014, 2014. a
Paschou, P., Siomos, N., Tsekeri, A., Louridas, A., Georgoussis, G., Freudenthaler, V., Binietoglou, I., Tsaknakis, G., Tavernarakis, A., Evangelatos, C., von Bismarck, J., Kanitz, T., Meleti, C., Marinou, E., and Amiridis, V.: The eVe reference polarisation lidar system for the calibration and validation of the Aeolus L2A product, Atmos. Meas. Tech., 15, 2299–2323, https://doi.org/10.5194/amt-15-2299-2022, 2022. a, b
Rogers, R. R., Vaughan, M. A., Hostetler, C. A., Burton, S. P., Ferrare, R. A., Young, S. A., Hair, J. W., Obland, M. D., Harper, D. B., Cook, A. L., and Winker, D. M.: Looking through the haze: evaluating the CALIPSO level 2 aerosol optical depth using airborne high spectral resolution lidar data, Atmos. Meas. Tech., 7, 4317–4340, https://doi.org/10.5194/amt-7-4317-2014, 2014. a
Schmetz, J., Pili, P., Tjemkes, S., Just, D., Kerkmann, J., Rota, S., and Ratier, A.: AN INTRODUCTION TO METEOSAT SECOND GENERATION (MSG), B. Am. Meteorol. Soc., 83, 977–992, https://doi.org/10.1175/1520-0477(2002)083<0977:AITMSG>2.3.CO;2, 2002. a
Schuster, G. L., Vaughan, M., MacDonnell, D., Su, W., Winker, D., Dubovik, O., Lapyonok, T., and Trepte, C.: Comparison of CALIPSO aerosol optical depth retrievals to AERONET measurements, and a climatology for the lidar ratio of dust, Atmos. Chem. Phys., 12, 7431–7452, https://doi.org/10.5194/acp-12-7431-2012, 2012. a, b
Shipley, S. T., Tracy, D. H., Eloranta, E. W., Trauger, J. T., Sroga, J. T., Roesler, F. L., and Weinman, J. A.: High spectral resolution lidar to measure optical scattering properties of atmospheric aerosols. 1: Theory and instrumentation, Appl. Optics, 22, 3716–3724, https://doi.org/10.1364/AO.22.003716, 1983. a
Spinhirne, J. D., Palm, S. P., Hart, W. D., Hlavka, D. L., and Welton, E. J.: Cloud and aerosol measurements from GLAS: Overview and initial results, Geophys. Res. Lett., 32, L22S03, https://doi.org/10.1029/2005GL023507, 2005. a
Stoffelen, A., Pailleux, J., Källén, E., Vaughan, J. M., Isaksen, L., Flamant, P., Wergen, W., Andersson, E., Schyberg, H., Culoma, A., Meynart, R., Endemann, M., and Ingmann, P.: The Atmospheric Dynamics Mission for Global Wind Field Measurement, B. Am. Meteorol. Soc., 86, 73–88, https://doi.org/10.1175/BAMS-86-1-73, 2005. a
Sugimoto, N., Nishizawa, T., Shimizu, A., and Jin, Y.: The Asian Dust and Aerosol Lidar Observation Network (AD-Net), in: Light, Energy and the Environment, Optica Publishing Group, EW2A.1, https://doi.org/10.1364/EE.2016.EW2A.1, 2016. a
Sun, K., Dai, G., Wu, S., Reitebuch, O., Baars, H., Liu, J., and Zhang, S.: Correlation between marine aerosol optical properties and wind fields over remote oceans with use of spaceborne lidar observations, EGUsphere [preprint], https://doi.org/10.5194/egusphere-2023-433, 2023. a
Tackett, J. L., Kar, J., Vaughan, M. A., Getzewich, B. J., Kim, M.-H., Vernier, J.-P., Omar, A. H., Magill, B. E., Pitts, M. C., and Winker, D. M.: The CALIPSO version 4.5 stratospheric aerosol subtyping algorithm, Atmos. Meas. Tech., 16, 745–768, https://doi.org/10.5194/amt-16-745-2023, 2023. a
Tesche, M., Ansmann, A., MüLLER, D., Althausen, D., Mattis, I., Heese, B., Freudenthaler, V., Wiegner, M., Esselborn, M., Pisani, G., and Knippertz, P.: Vertical profiling of Saharan dust with Raman lidars and airborne HSRL in southern Morocco during SAMUM, Tellus B, 61, 144–164, https://doi.org/10.1111/j.1600-0889.2008.00390.x, 2009. a
Textor, C., Schulz, M., Guibert, S., Kinne, S., Balkanski, Y., Bauer, S., Berntsen, T., Berglen, T., Boucher, O., Chin, M., Dentener, F., Diehl, T., Easter, R., Feichter, H., Fillmore, D., Ghan, S., Ginoux, P., Gong, S., Grini, A., Hendricks, J., Horowitz, L., Huang, P., Isaksen, I., Iversen, I., Kloster, S., Koch, D., Kirkevåg, A., Kristjansson, J. E., Krol, M., Lauer, A., Lamarque, J. F., Liu, X., Montanaro, V., Myhre, G., Penner, J., Pitari, G., Reddy, S., Seland, Ø., Stier, P., Takemura, T., and Tie, X.: Analysis and quantification of the diversities of aerosol life cycles within AeroCom, Atmos. Chem. Phys., 6, 1777–1813, https://doi.org/10.5194/acp-6-1777-2006, 2006. a
van Zadelhoff, G.-J., Donovan, D. P., and Wang, P.: Detection of aerosol and cloud features for the EarthCARE atmospheric lidar (ATLID): the ATLID FeatureMask (A-FM) product, Atmos. Meas. Tech., 16, 3631–3651, https://doi.org/10.5194/amt-16-3631-2023, 2023. a
Wandinger, U., Tesche, M., Seifert, P., Ansmann, A., Müller, D., and Althausen, D.: Size matters: Influence of multiple scattering on CALIPSO light-extinction profiling in desert dust, Geophys. Res. Lett., 37, L10801, https://doi.org/10.1029/2010GL042815, 2010. a
Wang, N., Zhang, K., Shen, X., Wang, Y., Li, J., Li, C., Mao, J., Malinka, A., Zhao, C., Russell, L. M., Guo, J., Gross, S., Liu, C., Yang, J., Chen, F., Wu, L., Chen, S., Ke, J., Xiao, D., Zhou, Y., Fang, J., and Liu, D.: Dual-field-of-view high-spectral-resolution lidar: Simultaneous profiling of aerosol and water cloud to study aerosol–cloud interaction, P. Natl. Acad. Sci. USA, 119, e2110756119, https://doi.org/10.1073/pnas.2110756119, 2022. a
Watson-Parris, D., Schutgens, N., Winker, D., Burton, S. P., Ferrare, R. A., and Stier, P.: On the Limits of CALIOP for Constraining Modeled Free Tropospheric Aerosol, Geophys. Res. Lett., 45, 9260–9266, https://doi.org/10.1029/2018GL078195, 2018. a
Welton, E. J., Campbell, J. R., Spinhirne, J. D., and Scott III, V. S.: Global monitoring of clouds and aerosols using a network of micropulse lidar systems, in: Lidar Remote Sensing for Industry and Environment Monitoring, edited by: Singh, U. N., Asai, K., Ogawa, T., Singh, U. N., Itabe, T., and Sugimoto, N., International Society for Optics and Photonics, SPIE, 4153, 151–158, https://doi.org/10.1117/12.417040, 2001. a
Winker, D., Couch, R., and McCormick, M.: An overview of LITE: NASA's Lidar In-space Technology Experiment, P. IEEE, 84, 164–180, https://doi.org/10.1109/5.482227, 1996. a
Winker, D. M., Pelon, J., Coakley, J. A., Ackerman, S. A., Charlson, R. J., Colarco, P. R., Flamant, P., Fu, Q., Hoff, R. M., Kittaka, C., Kubar, T. L., Treut, H. L., Mccormick, M. P., Mégie, G., Poole, L., Powell, K., Trepte, C., Vaughan, M. A., and Wielicki, B. A.: The CALIPSO Mission: A Global 3D View of Aerosols and Clouds, B. Am. Meteorol. Soc., 91, 1211–1230, https://doi.org/10.1175/2010BAMS3009.1, 2010. a, b
Young, S. A., Vaughan, M. A., Garnier, A., Tackett, J. L., Lambeth, J. D., and Powell, K. A.: Extinction and optical depth retrievals for CALIPSO's Version 4 data release, Atmos. Meas. Tech., 11, 5701–5727, https://doi.org/10.5194/amt-11-5701-2018, 2018. a
https://navigator.eumetsat.int/product/EO:EUM:DAT:MSG:CLM (last access: 5 December 2022).
https://navigator.eumetsat.int/product/EO:EUM:CM:MSG:CMA_SEVIRI_V001 (last access: 5 December 2022).
- Abstract
- Introduction
- Data and methods
- Case study: June 2020 Saharan dust event
- Lidar ratio and extinction retrievals
- Vertical transport of dust aerosol
- Conclusions
- Data availability
- Author contributions
- Competing interests
- Disclaimer
- Special issue statement
- Acknowledgements
- Financial support
- Review statement
- References