the Creative Commons Attribution 4.0 License.
the Creative Commons Attribution 4.0 License.
Absolute radiance calibration in the UV and visible spectral range using atmospheric observations during twilight
Thomas Wagner
Jānis Puķīte
We present an improved radiance calibration method for UV–Vis spectroscopic instruments with a narrow field of view (up to a few degrees) based on the calibration method by Wagner et al. (2015). The updated method uses only measurements during the twilight period instead of several hours as for the original method. The calibration is based on the comparison of measurements and simulations of the radiance of zenith-scattered sunlight. The main advantage of our method compared to radiance calibration methods in the laboratory is that the calibration can be directly applied in the field. This allows routine radiance calibrations whenever the sky is clear during twilight. The calibration can also be performed retrospectively and will thus be applicable for the large number of existing data sets. Also, potential changes in the instrument properties during transport from the laboratory to the field are avoided. The new version of the calibration method presented here has two main advantages. First, the required measurement period can be rather short (only a few minutes during twilight for cloud-free conditions). Second, even without knowledge of the aerosol optical depth (AOD), the errors in the calibration method are rather small, especially in the UV spectral range where they range from about 4 % at 340 nm to 8 % at 420 nm. If the AOD is known, the uncertainties are even smaller (about 3 % at 340 nm to 4 % at 420 nm). For visible wavelengths, good accuracy is only obtained if the AOD is approximately known with uncertainties from about 4 % at 420 nm to 10 % between about 550 and 700 nm (generally the AOD is nevertheless smaller in the visible than in the UV spectral range). One shortcoming of the method is that it is not possible to determine the AOD exactly at the time of the (twilight) measurements because AOD observations from sun photometer measurements or the MAX-DOAS (Multi-AXis Differential Optical Absorption Spectroscopy) measurements are usually not meaningful for such high solar zenith angle (SZA). But the related uncertainty can be minimised by repeating the radiance calibrations during the twilight periods of several days.
- Article
(7176 KB) - Full-text XML
- BibTeX
- EndNote
Measurements of the atmospheric radiance are important for many applications, e.g. atmospheric remote sensing, studies of atmospheric photochemistry, optimisation of the energy yield of photovoltaic cells, the classification of sky conditions, determination of absorbing properties of aerosols or the quantification of biologically relevant UV doses (for more details see e.g. Riechelmann et al., 2013, and Wagner et al., 2015). For some of these applications (e.g. atmospheric photochemistry or the energy yield of photovoltaic cells), the relative uncertainties in the radiance measurements will cause similar relative uncertainties in the derived quantities. For other quantities, however, the relationship can be non-linear: for example, a 5 % error in the measured radiance can lead to errors in the derived aerosol single-scattering albedo of up to 10 % (Dubovik et al., 2000) or to a change in the number of detected optically thick clouds (Wagner et al., 2014, 2016) of up to 15 %.
Usually, measurements of the spectral radiance are calibrated in the laboratory using calibrated light sources (e.g. Pissulla et al., 2009; Yu et al., 2014; Niedzwiedz et al., 2021). Uncertainties in the calibration procedures typically range from 3 % to 10 % (Wuttke et al., 2006; Pissulla et al., 2009). However, in comparison studies differences between individual instruments up to 30 % have been reported (Pissulla et al., 2009). One particular problem arises from the fact that during transport of the instrument from the laboratory to the field the instrument properties might change.
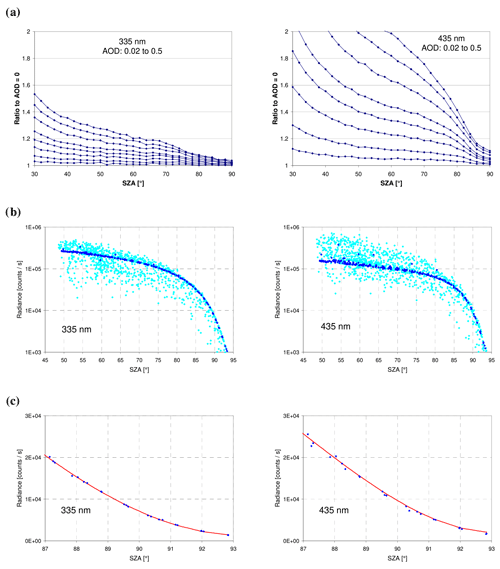
Figure 1(a) Ratio of the simulated zenith radiance for different aerosol optical depths to the radiance for an atmosphere without aerosols as a function of the SZA for 335 nm (left) and 435 nm (right). Data are taken from Fig. 5 in Wagner et al. (2015). In that study simulations were only performed for SZA up to 90∘. AOD values are 0.02, 0.05, 0.1, 0.15, 0.2, 0.3, 0.4 and 0.5. At 90∘ SZA, the variation in the radiance is smallest (about 4 % at 335 nm and 11 % at 435 nm). (b) Measured zenith radiances from 19 September to 18 October 2022 in Mainz, Germany, for all sky conditions (light blue) and clear-sky conditions (dark blue). (c) Radiances during cloud-free conditions together with a fitted polynomial (for SZA between 85 and 93∘). Note that in (b) a logarithmic y axis is used because the data span more than 2 orders of magnitude.
In this study we build on a recently introduced radiance calibration method using atmospheric radiance measurements in the zenith direction (Wagner et al., 2015). In the original study, the radiance calibration was performed by the comparison of measured and simulated zenith radiances under favourable conditions (cloud-free sky, stable aerosol conditions). But in contrast to rather long measurement periods needed with the original method (several hours), the updated method can be applied for much shorter periods (usually a few minutes) during twilight (thus measurements at lower solar zenith angles, SZAs, are not required in the new method). The original and the updated method are based on the comparison of atmospheric radiance measurements to atmospheric radiative transfer simulations for a cloud-free atmosphere and low and stable aerosol abundance. One important advantage compared to calibration measurements in the laboratory is that the calibration can be applied directly in the field without the need to transport the instrument to the laboratory and back. Compared to the original method (Wagner et al., 2015), the updated method also requires less specific and less stable atmospheric conditions, especially with respect to the aerosol load. Moreover, during twilight, aerosols have a rather weak effect on the observed radiance (Fig. 1a), especially in the UV. The small influence of atmospheric aerosols on the zenith-scattered solar radiance in the UV can be explained by the fact that during twilight the altitude from which the solar light is scattered into the instrument increases with decreasing wavelength because of the increased probability of Rayleigh scattering (Fig. 2). Thus, scattering by aerosols (which usually reside close to the surface) does not substantially increase the observed radiance (as is shown later in Sect. 2.3, the phase function and the single-scattering albedo might still have a relatively strong effect). Another advantage of the new method is that the pointing accuracy is much less important compared to the original method. In Fig. 1b measured zenith radiances from MAX-DOAS measurements during September and October 2022 are shown. The light-blue dots represent all measurement conditions, whereas the dark-blue dots represent only clear-sky conditions (4.5 d). Like for the simulated radiances, the measured zenith radiances for clear-sky conditions also show only small variations, especially during twilight. Between 88 and 90∘, the deviation from a fitted polynomial (within the SZA interval 85 to 93∘) is about ±1.5 % and ±4 % at 345 at 445 nm, respectively (Fig. 1c). During these clear days, the aerosol optical depth (AOD) measured by a sun photometer at the same location (https://aeronet.gsfc.nasa.gov/new_web/index.html, last access: 20 December 2023) varied between 0.08 and 0.18 at 340 nm and between 0.05 and 0.13 at 440 nm.
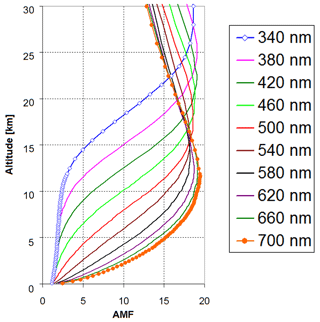
Figure 2Altitude dependence of the box air mass factors (AMFs) for observations of zenith-scattered sunlight during twilight (averages for simulations at a SZA of 89 and 90∘). Box AMFs close to unity indicate an almost vertical light path. Simulations are performed for an atmosphere without aerosols.
In this study we explore the applicability of the new method mainly based on radiative transfer simulations; in particular we determine the optimum SZA range. We also quantify the remaining uncertainties caused by incomplete knowledge of the atmospheric state, the position of the instrument, the surface albedo, and possible errors in the measurements and radiative transfer simulations.
The paper is structured as follows. In Sect. 2 the radiative transfer simulations are described, and sensitivity studies on the influence of atmospheric aerosols on the zenith-scattered sunlight during twilight are presented. In Sect. 3 the new method is applied to measurements, and the results are compared to the calibration results of the original study. Section 4 provides a summary and conclusions.
In the first part of this section the radiative transfer model and the atmospheric settings used for the simulations are introduced. In the following parts the effects of aerosols and of other atmospheric and measurement parameters on the simulated zenith-scattered radiances are explored. Based on these results the optimum SZA range for the application of the method is determined, and the remaining uncertainties are quantified.
2.1 Radiative transfer model and atmospheric scenarios
In the original study, the radiative transfer model MCARTIM-3 (Deutschmann et al., 2011) was used. MCARTIM is a full spherical Monte Carlo model, for which, however, under twilight conditions the noise can become rather high. Thus, in this study we decided to use the radiative transfer model SCIATRAN (version 3.8.11; Rozanov et al., 2017; Mei et al., 2023; https://www.iup.uni-bremen.de/sciatran/, last access: 20 December 2023) in order to minimise the uncertainties due to noise of the simulations and the computational effort. We use SCIATRAN in sphericity mode and considered polarisation and refraction (in the ray-tracing calculations). For the sensitivity studies (Sect. 2), also rotational Raman scattering is considered. A Lambertian surface albedo was used. For the conditions of this paper, the zenith-scattered radiances during twilight simulated by both models agree within ±1 %. Other radiative transfer models with similar capabilities could also be used for the radiance calibration.
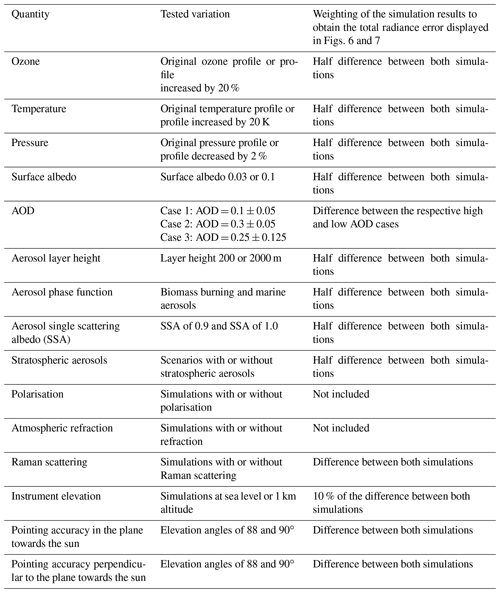
Table 1Settings used for the radiative transfer simulations.
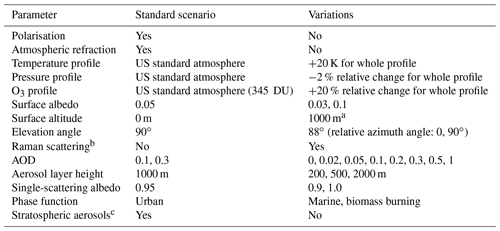
a The aerosol layer is also shifted by 1000 m. b For the investigation of the effect of Raman scattering the simulated spectra are convoluted with a full with at half maximum (FWHM) of 0.6 nm, and then the average of the radiance for ±0.25 nm around the selected wavelength is taken. c AOD of 0.012 between 18 and 33 km; see Wagner et al. (2021).
For the radiative transfer simulations the vertical resolution was 50 m below 2 km, about 1 km between 2 and 18 km, and up to a few kilometres above. Further settings of the simulations are summarised in Table 1. Zenith radiances are simulated for the SZA range from 85 to 93∘ for the wavelength range 340 to 700 nm (in steps of 40 nm).
2.2 Dependence on the AOD
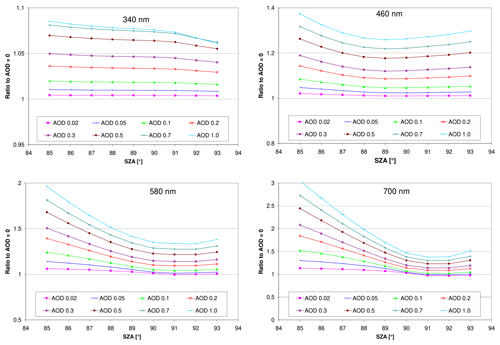
The dependence of the simulated radiance on the AOD for the standard settings (Table 1) is shown in Fig. 3 and Fig. A1 in the Appendix. The effect of the AOD increases towards longer wavelengths with deviations of about 7 % and 30 % at 340 and 700 nm, respectively (for a SZA of 90∘ and an AOD of 0.5 compared to an AOD of 0). This is a result of the increase in the penetration depth of the direct sunlight into the atmosphere towards longer wavelengths. Thus scattering by aerosols (in addition to Rayleigh scattering) becomes increasingly important towards longer wavelengths. Here it is worth noting that in general the AOD decreases with increasing wavelength. Another important finding is that for wavelengths below about 500 nm, the smallest effects of aerosols are found for SZA around 89 to 90∘. This is also confirmed by measurements (see Fig. A2 in the Appendix). For longer wavelengths, the smallest effects are found for slightly larger SZA (up to 92∘).
2.3 Uncertainties caused by other atmospheric and surface properties
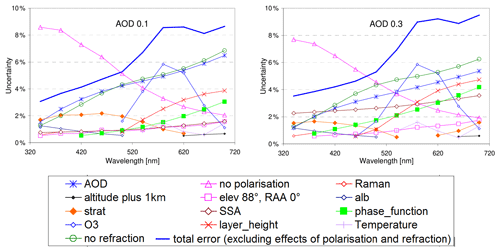
In addition to the dependence on the AOD, in this section, the effect of other important properties is investigated. Here assumptions about the variability range of the different quantities were made (see Table 2) which should be representative of typical atmospheric conditions. In specific cases, some of these properties might be outside the assumed ranges (e.g. for events with desert dust or biomass burning plumes). Such extreme cases should be avoided for the application of the calibration method. In Figs. 4 and A3 the ratios of the simulated radiances compared to those of the corresponding standard scenarios (see Table 1) for two selected AODs (0.1 and 0.3) are shown. These AODs were chosen because they represent typical conditions in most parts of the world. It is again found that overall the uncertainties increase towards longer wavelengths with deviations of about ±3 % and ±8 % at 340 and 700 nm, respectively (for a SZA of 90∘). For short wavelengths, the effect of stratospheric aerosols and variations in the aerosol single-scattering albedo is the strongest on the simulated radiances. Towards longer wavelengths, the effects of the aerosol phase function and the ozone absorption (Chappuis band) becomes increasingly important. From these findings it is concluded that for the radiative transfer simulations, the correct ozone total column for the day(s) of the measurements should be used (especially for wavelengths between about 500 and 650 nm). Overall, again, for SZA around 89 to 90∘ the smallest deviations are found.
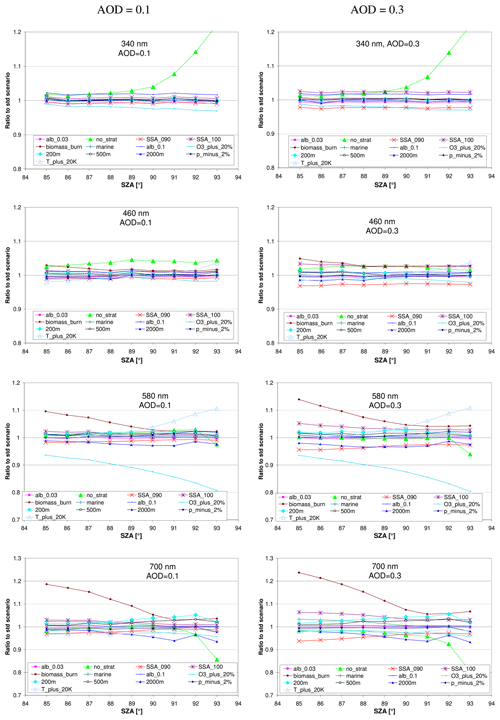
Figure 4Ratio of the simulated radiance for different aerosol properties and further input parameters compared to the radiances for the corresponding standard scenarios for AOD of 0.1 (left) and 0.3 (right) as a function of the SZA. Note the different y axes. Results for additional wavelengths are shown in Fig. A3 in the Appendix.
2.4 Uncertainties related to errors in the instrument properties or the chosen options of the radiative transfer simulations
In this section the effect of the altitude of the instrument, its elevation angle calibration and the chosen options of the radiative transfer model (consideration of polarisation, Raman scattering or atmospheric refraction) are investigated. Of course, the altitude of the instrument is usually well known and could be exactly considered in the radiative transfer simulations. However, if for simplicity the radiances for the standard scenario given in Table 3 were used, it will be useful to know how strongly the altitude of the instrument affects the measured radiances. In Figs. 5 and A4 the ratios of the simulated radiances for these modifications compared to the radiances for the standard settings are shown. At short wavelengths, the neglect of polarisation in the radiative transfer simulations has the strongest effect (up to 10 %). At longer wavelengths, a wrong altitude of the instrument and the neglect of refraction become especially important. From these findings it is concluded that polarisation and refraction have to be taken into account for the radiative transfer simulations. For wavelengths above about 500 nm, the exact altitude of the measurement site should also be used. Then the remaining uncertainties range from about 1 % at 340 nm to 3 % at 700 nm, respectively. The deviations due to the neglect of Raman scattering in the radiative transfer simulations for short wavelengths are caused by the increased probability for multiple scattering and are related to the specific location of the chosen wavelength. At 340 nm the sun spectrum has a local maximum, whereas at 380 and 420 nm it has a local minimum (Fraunhofer line).
Table 3Zenith-scattered normalised radiances (simulated radiance divided by the solar irradiance) at a SZA of 89 and 90∘ for different wavelengths, AODs and the standard settings (see Table 1). For the simulations, polarisation and atmospheric refraction were taken into account. The total ozone column was 345 DU.
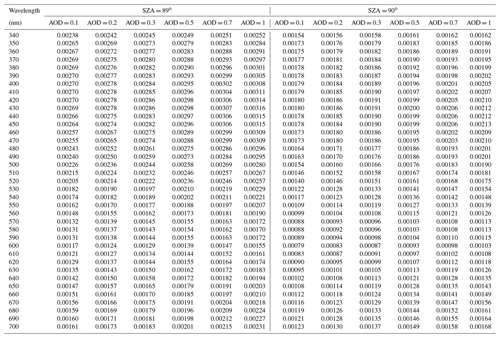
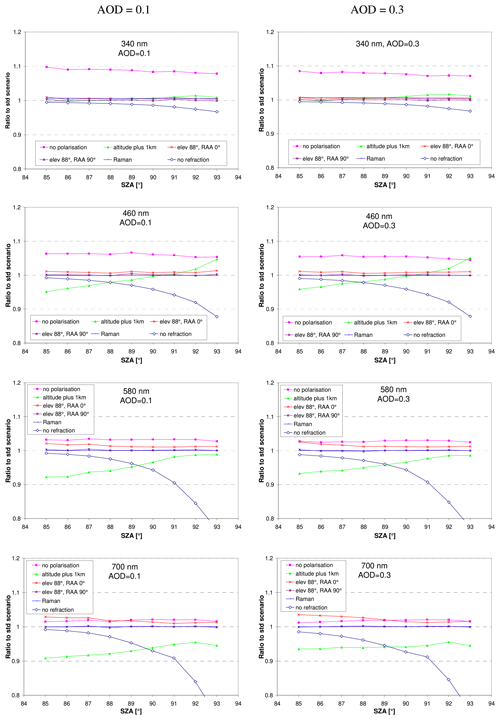
Figure 5Ratio of the simulated radiances for different instrumental properties and chosen options of the radiative transfer simulations compared to the radiances of the corresponding standard scenarios for AOD of 0.1 (left) and 0.3 (right) as a function of the SZA. Note the different y axes. Results for additional wavelengths are shown in Fig. A4 in the Appendix.
2.5 Quantification of the uncertainties
This section summarises the different uncertainties investigated in the subsections before. The resulting errors are quantified for the SZA range from 89 to 90∘, for which overall the smallest uncertainties were found.
In the first subsection (Sect. 2.5.1) the errors are quantified for situations when the AOD is known, e.g. from sun photometer observations (Volz, 1959; Tanre et al., 1988; Kaufman et al., 1994; Holben et al., 1998; and references therein) or MAX-DOAS measurements themselves (e.g. Hönninger et al., 2004; Wagner et al., 2004; Frieß et al., 2006; Irie et al., 2008; Clémer et al., 2010; and references therein). Again, two scenarios, one with an AOD of 0.1 ± 0.05 and another with an AOD of 0.3 ± 0.05, were chosen. To account for possible temporal changes in the AOD (MAX-DOAS and AERONET inversions are usually restricted to SZA < 80∘), the radiance calibration measurements might be carried out during the twilight period on several succeeding days.
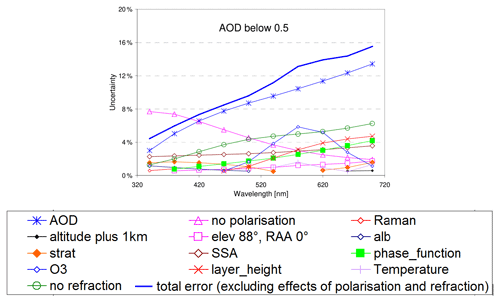
In the second subsection (Sect. 2.5.2) larger uncertainties for the AOD are assumed (0.25 ± 0.125). This case represents typical aerosol loads for most parts of the globe (except very polluted locations) and might still allow useful radiance calibrations in the UV for situations when the AOD is unknown.
The uncertainties are quantified by variations in the corresponding input parameters as summarised in Tables 1 and 2. Note that the deviations caused by the neglect of polarisation and atmospheric refraction are not included in the calculation of the total error because it is assumed that for the application of our method only radiative transfer simulations are used, which consider both options.
2.5.1 Uncertainties if AOD is known
Figure 6 summarises the individual and total uncertainties for the cases when the AOD is known within ±0.05 (for the specific assumptions see Table 2). The sub-figures show the error budgets for AODs of 0.1 and 0.3, which represent typical aerosol abundances. The assumptions for the individual error sources (see Table 2) are a little bit arbitrary but should represent realistic measurement conditions. Users of the method should check whether these assumptions are realistic for their measurements (especially the total ozone column) and could adjust them if needed. The total error is calculated from the individual errors by assuming that all errors are independent (excluding the effects of polarisation and atmospheric refraction because only radiative transfer models considering both options should be used). For both scenarios, with the assumptions made in Table 2, the remaining dominant error source for almost all cases is the uncertainty in the AOD. Overall the resulting total uncertainties are still rather small, ranging from ±3 % for 340 nm (AOD = 0.1) to about ±10 % for 700 nm (AOD = 0.3). Here it should be taken into account that the AOD usually decreases towards longer wavelengths. Thus the total errors for high AOD and long wavelengths probably overestimate the uncertainties for typical scenarios.
2.5.2 Uncertainties if AOD is not known
Figure 7 summarises the individual and total uncertainties for typical cases when the AOD is not known. For the simulations an AOD of 0.25 ± 0.125 was assumed. Again, the dominant error source (except the effect of polarisation and refraction) is the uncertainty in the AOD, and the uncertainties are much larger than for the two cases with known AOD discussed above. However, for the UV radiances the uncertainties are still rather small, about ±4 % at 340 nm and ±8 % at 420 nm.
The validation of the method using measured data is difficult because without dedicated campaigns, reference data sets at the same location as the DOAS measurements are usually not available. Thus, like in the original study (Wagner et al., 2015), we apply the method to the MAX-DOAS measurements made with the MPIC instrument during the CINDI (I) campaign in Cabauw, the Netherlands, during the morning of 24 June 2009 (Piters et al., 2012). This procedure enables a direct comparison of the calibration results of the original and refined method. The MPIC MAX-DOAS instrument is a so-called mini MAX-DOAS instrument which covers the spectral range from 312 to 458 nm with a spectral resolution between 0.45 and 0.8. Its field of view is about 1.2∘. The spectral characteristics of the instrument were exactly taken into account in the calibration procedure as described in detail in Wagner et al. (2015).
The calibration factors are derived from the comparison of the measured radiances (in “counts” per second) to the simulated radiances (W m−2 nm−1 sr−1). For the simulations, the settings for the standard scenario were selected (see Table 1), but also atmospheric refraction was considered.
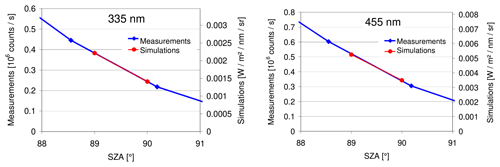
Figure 8Examples of the determination of the calibration factors for two selected wavelengths. The linearly interpolated measurement results (blue) are compared to the linearly interpolated simulation results for the standard scenario (red).
For the measurements on 24 June 2009 no zenith measurements were conducted exactly at SZAs of 89 and 90∘ because of the rather long elevation sequences (in addition to the zenith view, one elevation sequence also included 11 measurements in non-zenith direction). However, zenith measurements were taken close to those SZAs, i.e. at SZAs of 88.6 and 90.2∘. We linearly interpolated the radiances of the measurements at both SZAs and then compared them to the simulation results of SZAs of 89 and 90∘ (see Fig. 8) to obtain the calibration factors. The simulated normalised radiances for selected wavelengths and AODs for SZAs of 89 and 90∘ are given in Table 3.
The derived calibration factors are determined for two assumptions:
- a.
using the simulation results for an AOD of 0.25, assuming that no information on the AOD is available (see Sect. 2.5.2);
- b.
using the simulation results for the wavelength-dependent AOD derived from the simultaneous sun photometer observations (Wagner et al., 2015).
The ratios of the calibration factors for these assumptions versus the calibration factors from the original study are shown in Fig. 9. Because of the strong ozone absorption at high SZA, no reasonable calibration results with the refined method for wavelengths < 335 could be obtained. Overall slightly smaller calibration factors (between 2 % and 10 %) are obtained with the new method (red curve, for the case that the AOD is known) compared to the original method. This means that the calibrated spectra will have slightly higher radiances. The deviations are still within the uncertainty estimates of the original and new method (∼ 7 % for the old method and about 3 % to 5 % for the new method between 335 and 455 nm if the AOD is known). Interestingly, for these measurements, only slightly worse calibration results are obtained if no knowledge about the exact AOD is available (blue curve). This rather good agreement is probably caused by the fact that the true AODs (between ∼ 0.05 and 0.2, depending on wavelength; see Wagner et al., 2015) are close to the assumed AOD of 0.25.
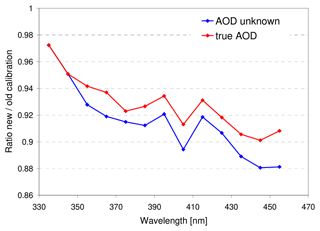
Figure 9Ratio of the calibration factors for the scenarios with unknown AOD (blue) and known AOD (red) versus the calibration factors of the original study (values < 1 mean that the new calibration leads to higher radiances).
Part of the differences might be attributed to the following reasons:
- a.
Due to the inclusion of many non-zenith angles in the elevation sequences, the SZA range between 89 and 90∘ is not well covered, leading to interpolation effects because only a linear interpolation was used. These interpolation effects might cause deviations up to about 2 %. In future applications, only zenith measurements should be performed for SZA > 89∘ to better capture the SZA dependence. It should be noted that for state-of-the-art measurements, this is already mostly implemented as a standard measurement routine.
- b.
The uncertainties caused by the electronic offset and dark current will be higher for measurements during twilight compared to measurements at higher SZA, which determined the calibration factors of the original method. Based on a blind region of the detector we estimated the error caused by possible wrong electronic offset and dark-current correction to be < 1 %.
- c.
For smaller SZA (like used in the original study) the effect of uncertainties in the scattering phase function is larger than for SZA close to 90∘. And this source of uncertainty increases with wavelength. This might at least partly explain the increasing deviation between both calibrations with increasing wavelengths.
Also slight deviations (1 % to 3 %) between the calibration factors of the new method using either the simulation results of this study (using SCIATRAN) or the simulation results of the original study (using MCARTIM) are found. Part of these deviations are caused by larger interpolation errors using the old simulation results because they were made in steps of 2∘ SZA (compared to 1∘ in this study). The direct comparison of the results of both radiative transfer models for the considered viewing geometry and atmospheric scenario yields deviations < 1 %.
Comparison to independent measurements
Figure 10 presents a comparison of the calibrated radiance spectrum measured on 24 June 2009 at 06:54 UTC at a SZA = 61∘ (blue) and a radiance spectrum measured in the zenith direction under similar atmospheric conditions (clear sky, SZA = 62∘) on 2 May 2007 in Hanover, Germany. We selected this measurement for comparison because we found no better-suited example for the validation of our method in the scientific literature. This reference spectrum was measured by an instrument specifically designed for atmospheric radiance measurements (Wuttke et al., 2006; Seckmeyer et al., 2009) and was calibrated using a calibration light source. The instrument took part in international comparison studies and was shown to comply with NDSC (Network for the Detection of Stratospheric Change) standards (Wuttke et al., 2006). The sun–earth distances were quite similar for both measurements. Although the observation geometries and atmospheric conditions are similar for both measurements, slight deviations can still be expected because of the slightly different atmospheric aerosol load. Unfortunately, there was no sun photometer observation available directly at the Hanover measurement site, but from the AERONET station in Hamburg (about 130 km north of Hanover) a slightly lower AOD compared to Cabauw was found (0.13 compared to 0.17 at 360 nm, 0.10 compared to 0.12 at 440 nm). This difference could explain about 2 % to 3 % higher radiances in Cabauw compared to Hanover. Note that the measurement in Hanover was scaled by a factor of 0.985 to account for the effect of the slightly different viewing geometries (exact zenith view and SZA of 62∘ compared to 85∘ elevation angle and SZA of 61∘ of our measurement; see Wagner et al., 2015). The bottom of Fig. 10 shows the ratio of both measurements (after the radiances were averaged over intervals of 10 nm). Overall, good agreement is found, with the measurements at Cabauw on average about 5 % higher. About half of this difference can be attributed to the different aerosol loads as described above. Part of the deviations (especially for the high-frequency structures) are probably also related to the fact that the values of the reference spectrum from Hanover were manually extracted from the figure in Seckmeyer et al. (2009) because the spectral data were not available.
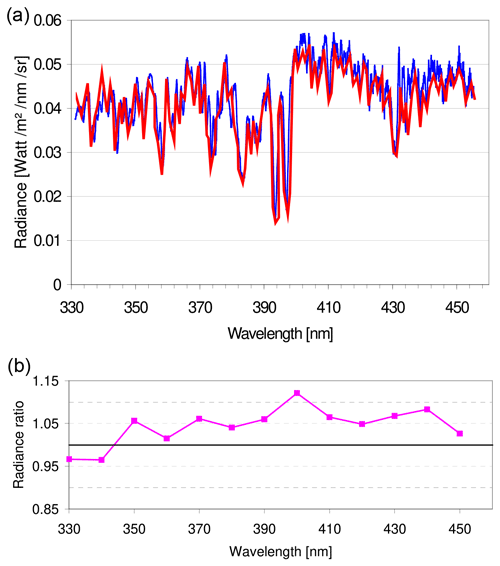
Figure 10(a) Comparison of a calibrated spectrum (blue), measured on 24 June 2009 at 06:54 UTC, at a SZA of 61∘ to an independent measurement under similar conditions (red) on 2 May 2007 in Hanover, Germany (clear sky; SZA: 62∘; Seckmeyer et al., 2009). The measurement in Hanover was scaled by a factor of 0.985 to account for the effect of the slightly different viewing geometries: the measurements in Hanover were made at exact zenith view and a SZA of 62∘, while our measurements were made at 85∘ elevation and a SZA of 61∘ (the figure is similar to Fig. 9 in Wagner et al., 2015). (b) Ratio of both measurements (10 nm averages of the MAX-DOAS measurement are divided by the corresponding averages of the reference measurement in Hanover).
In this study we present an improved radiance calibration method compared to our previous study (Wagner et al., 2015). The updated method uses only a short period of measurements (during twilight), whereas in the original method a much longer period (a few hours) on a day with stable aerosol conditions was required. The updated method has two main advantages. First, because of the much shorter measurement period, the method can be used on all days with cloud-free conditions during sunrise and sunset. Second, even without knowledge about the aerosol load, the errors in the calibration method are rather small, especially in the UV spectral range (ranging from about 4 % at 340 nm to 8 % at 420 nm). If the AOD is known, the uncertainties are even smaller (ranging from about 3 % at 340 nm to 4 % at 420 nm). For larger wavelengths, good accuracy is only obtained if the AOD is known (ranging from about 4 % at 420 nm to 10 % between about 550 and 700 nm). Here it should be noted that usually the AOD in the visible spectral range is systematically smaller compared to the UV.
Another important advantage is that the new calibration method can be applied retrospectively to the large number of existing zenith–sky DOAS measurements.
One disadvantage of the method is that it is not possible to determine the AOD exactly for the time of the (twilight) measurements because AOD observations from sun photometer measurements or the MAX-DOAS measurements are only possible for SZAs smaller than about 80 to 85∘. Thus the AOD measured by these methods might differ from the AOD during twilight. One possibility of minimising the related uncertainty is to carry out the radiance calibration during the twilight periods of several days. Then the errors caused by variations in the AOD might largely cancel out. By comparing the results from several days, the potential effect of clouds far away from the measurement site (but still in the path of the direct sunlight) could also be identified, and contaminated measurements could be removed. Another limitation of the method is that especially for situations with enhanced AOD (see results for AOD of 0.3 in Figs. 4 and A3) the aerosol properties (phase function and single-scattering albedo) can have a relatively strong effect. Such situations (e.g. desert dust events or biomass burning plumes) should be excluded from the application of the calibration technique.
A few more aspects should be mentioned. First, the variation in the earth–sun distance should be taken into account (as was done in this and the original study; see Wagner et al., 2015). If this effect is neglected errors up to about 3.2 % can arise. Second, care should be taken for the exact calculation of the SZA. Especially during twilight, small errors in the computer time and/or the latitude/longitude settings can lead to considerable errors in the SZA calculation. Third, care should also be taken that the saturation level of the detector during twilight is similar to that of typical measurements (at smaller SZA). This was the case for the measurements used in this study. Otherwise, non-linearities of the detector and/or the read-out electronics could lead to systematic errors. Fourth, for a meaningful comparison to the twilight measurements, atmospheric refraction and polarisation have to be taken into account in the radiative transfer simulations. Especially for wavelengths between about 500 and 650 nm, the total ozone column used in the radiative transfer should match the true ozone column during the measurements.
The main advantage of our method compared to radiance calibration methods in the laboratory is that the calibration can be applied directly in the field. This allows routine radiance calibrations whenever the sky is cloud-free during twilight. Also, potential changes in the instrument properties during transport from the laboratory to the field are avoided.
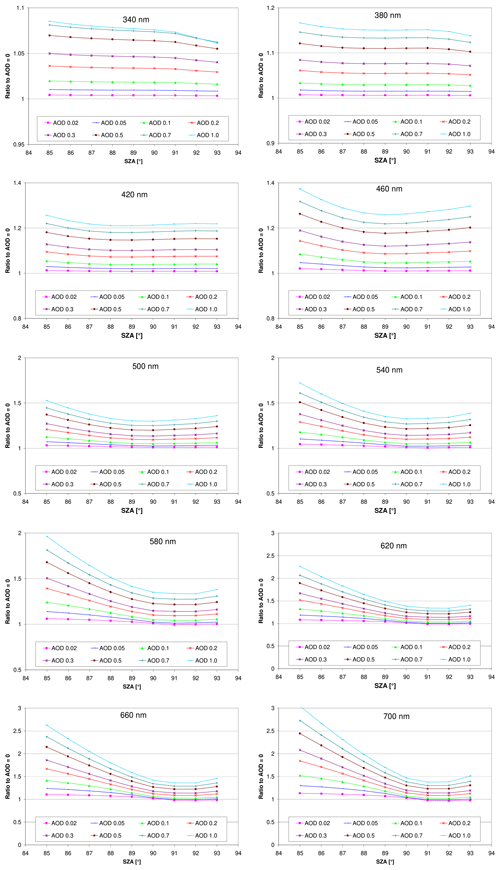
Figure A1Ratio of the simulated radiances for different AODs compared to the simulation results without aerosols as a function of the SZA for the standard scenario; see Table 1. Note the different y axes.
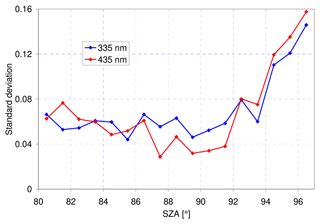
Figure A2Variation in the measured radiances on 36 mostly clear days during February and March 2021 (pre-monsoon season) at Greater Noida (India). Shown are the standard deviations within 1∘ bins after the SZA dependence was removed by a fitted polynomial. During the measurement period the AOD (at 550 nm, observed by MODIS) varied between 0.3 and 1.7. The measurements were carried out by Manish Sharma at Sharda University.

Figure A3Ratio of the simulated radiance for different aerosol properties and further input parameters compared to the radiances for the corresponding standard scenarios for AOD of 0.1 (left) and 0.3 (right) as a function of the SZA. Note the different y axes.
The radiative transfer model SCIATRAN version 3.8.11 was used. It was developed at the University of Bremen and can be obtained via https://www.iup.uni-bremen.de/sciatran/ (SCIATRAN working group, 2023).
TW developed the idea and wrote the paper. JP performed the radiative transfer simulations and provided valuable input on the interpretation of the results.
At least one of the (co-)authors is a member of the editorial board of Atmospheric Measurement Techniques. The peer-review process was guided by an independent editor, and the authors also have no other competing interests to declare.
Publisher’s note: Copernicus Publications remains neutral with regard to jurisdictional claims made in the text, published maps, institutional affiliations, or any other geographical representation in this paper. While Copernicus Publications makes every effort to include appropriate place names, the final responsibility lies with the authors.
We want to thank the organisers of the Cabauw Intercomparison Campaign of Nitrogen Dioxide measuring Instruments (CINDI) in summer 2009 (https://www.knmi.nl/kennis-en-datacentrum/project/cindi, last access: 20 December 2023), especially Ankie Piters and Marc Kroon. We thank Bas Henzing and his staff for their effort in establishing and maintaining the Cabauw AERONET site used in this investigation. The radiance measurements at Hanover (Fig. 9) were copied from a publication by Seckmeyer et al. (2009). We used the radiative transfer model SCIATRAN version 3.8.11 developed at the University of Bremen (https://www.iup.uni-bremen.de/sciatran/). The measurements used to create Fig. A2 were conducted by Manish Sharma at Sharda University in Greater Nioda, India.
The article processing charges for this open-access publication were covered by the Max Planck Society.
This paper was edited by Joanna Joiner and reviewed by two anonymous referees.
Clémer, K., Van Roozendael, M., Fayt, C., Hendrick, F., Hermans, C., Pinardi, G., Spurr, R., Wang, P., and De Mazière, M.: Multiple wavelength retrieval of tropospheric aerosol optical properties from MAXDOAS measurements in Beijing, Atmos. Meas. Tech., 3, 863–878, https://doi.org/10.5194/amt-3-863-2010, 2010.
Deutschmann, T., Beirle, S., Frieß, U., Grzegorski, M., Kern, C., Kritten, L., Platt, U., Pukite, J., Wagner, T., Werner, B., and Pfeilsticker, K.: The Monte Carlo Atmospheric Radiative Transfer Model McArtim: Introduction and Validation of Jacobians and 3D Features, J. Quant. Spectrosc. Ra., 112, 1119–1137, https://doi.org/10.1016/j.jqsrt.2010.12.009, 2011.
Dubovik, O., Smirnov, A., Holben, B. N., King, M. D., Kaufman, Y. J., Eck, T. F., and Slutsker, I.: Accuracy assessments of aerosol optical properties retrieved from Aerosol Robotic Network (AERONET) sun and sky radiance measurements, J. Geophys. Res., 105, 9791–9806, 2000.
Frieß, F., Monks, P. S., Remedios, J. J., Rozanov, A., Sinreich, R., Wagner, T., and Platt, U.: MAX-DOAS O4 measurements: A new technique to derive information on atmospheric aerosols. (II) Modelling studies, J. Geophys. Res., 111, D14203, https://doi.org/10.1029/2005JD006618, 2006.
Holben, B. N., Eck, T. F., Slutsker, I., Tanré, D., Buis, J. P., Setzer, A., Vermote, E., Reagan, J. A., Kaufman, Y. J., Nakajima, T., Lavenu, F., Jankowiak, I., and Smirnov, A.: AERONET – A federated instrument network and data archive for aerosol characterization, Remote Sens. Environ., 66, 1–16, 1998.
Hönninger, G., von Friedeburg, C., and Platt, U.: Multi axis differential optical absorption spectroscopy (MAX-DOAS), Atmos. Chem. Phys., 4, 231–254, https://doi.org/10.5194/acp-4-231-2004, 2004.
Irie, H., Kanaya, Y., Akimoto, H., Iwabuchi, H., Shimizu, A., and Aoki, K.: First retrieval of tropospheric aerosol profiles using MAX-DOAS and comparison with lidar and sky radiometer measurements, Atmos. Chem. Phys., 8, 341–350, https://doi.org/10.5194/acp-8-341-2008, 2008.
Kaufman, Y. J., Gitelson, A., Karnieli, A., Ganor, E., Fraser, R. S., Nakajima, T., Mattoo, S., and Holben, B. N.: Size distribution and scattering phase function of aerosol particles retrieved from sky brightness measurements, J. Geophys. Res., 99, 10341–10356, 1994.
Mei, L., Rozanov, V., Rozanov, A., and Burrows, J. P.: SCIATRAN software package (V4.6): update and further development of aerosol, clouds, surface reflectance databases and models, Geosci. Model Dev., 16, 1511–1536, https://doi.org/10.5194/gmd-16-1511-2023, 2023.
Niedzwiedz, A., Duffert, J., Tobar-Foster, M., Quadflieg, E., and Seckmeyer, G.: Laboratory calibration for multidirectional spectroradiometers, Meas. Sci. Technol., 32, 095902, https://doi.org/10.1088/1361-6501/abeb93, 2021.
Pissulla, D., Seckmeyer, G., Cordero, R. R., Blumthaler, M., Schallhart, B., Webb, A., Kift, R., Smedley, A., Bais, A. F., Kouremeti, N., Cede, A., Hermang, J., and Kowalewskig, M.: Comparison of atmospheric spectral radiance measurements from five independently calibrated systems, Photochem. Photobio., 8, 516–527, 2009.
Piters, A. J. M., Boersma, K. F., Kroon, M., Hains, J. C., Van Roozendael, M., Wittrock, F., Abuhassan, N., Adams, C., Akrami, M., Allaart, M. A. F., Apituley, A., Beirle, S., Bergwerff, J. B., Berkhout, A. J. C., Brunner, D., Cede, A., Chong, J., Clémer, K., Fayt, C., Frieß, U., Gast, L. F. L., Gil-Ojeda, M., Goutail, F., Graves, R., Griesfeller, A., Großmann, K., Hemerijckx, G., Hendrick, F., Henzing, B., Herman, J., Hermans, C., Hoexum, M., van der Hoff, G. R., Irie, H., Johnston, P. V., Kanaya, Y., Kim, Y. J., Klein Baltink, H., Kreher, K., de Leeuw, G., Leigh, R., Merlaud, A., Moerman, M. M., Monks, P. S., Mount, G. H., Navarro-Comas, M., Oetjen, H., Pazmino, A., Perez-Camacho, M., Peters, E., du Piesanie, A., Pinardi, G., Puentedura, O., Richter, A., Roscoe, H. K., Schönhardt, A., Schwarzenbach, B., Shaiganfar, R., Sluis, W., Spinei, E., Stolk, A. P., Strong, K., Swart, D. P. J., Takashima, H., Vlemmix, T., Vrekoussis, M., Wagner, T., Whyte, C., Wilson, K. M., Yela, M., Yilmaz, S., Zieger, P., and Zhou, Y.: The Cabauw Intercomparison campaign for Nitrogen Dioxide measuring Instruments (CINDI): design, execution, and early results, Atmos. Meas. Tech., 5, 457–485, https://doi.org/10.5194/amt-5-457-2012, 2012.
Riechelmann, S., Schrempf, M., and Seckmeyer, G.: Simultaneous measurement of spectral sky radiance by a non-scanning multidirectional spectroradiometer (MUNDIS), Meas. Sci. Technol., 24, 125501, https://doi.org/10.1088/0957-0233/24/12/125501, 2013.
Rozanov, V. V., Dinter, T., Rozanov, A. V., Wolanin, A., Bracher, A., and Burrows, J. P.: Radiative transfer modeling through terrestrial atmosphere and ocean accounting for inelastic processes: Software package SCIATRAN, J. Quant. Spectrosc. Ra., 194, 65–85, 2017.
SCIATRAN working group: SCIATRAN radiative transfer model and retrieval algorithm, University of Bremen, https://www.iup.uni-bremen.de/sciatran/ (last access: 20 December 2023), 2023.
Seckmeyer, G., Smolskaia, I., Pissulla, D., Bais, A. F., Tourpali, K., Meleti, C., and Zerefos, C.: Solar UV: measurements and trends, in: Twenty Years of Ozone Decline, Proceedings of the Symposium for the 20th Anniversary of the Montreal Protocol, Athens, Greece, 23–26 September 2007, edited by: Zerefos, C., Contopoulos, G. and Skalkeas, G., Part VI, Springer, the Netherlands, 359–368, https://doi.org/10.1007/978-90-481-2469-5, 2009.
Tanre, D., Deuaux, C., Herman, M., and Santer, R.: Radiative properties of desert aerosols by optical ground-based measurements at solar wavelengths, J. Geophys. Res., 93, 14223–14231, 1988.
Volz, F. E.: Photometer mit Selen-Photoelement zur spektralen Messung der Sonnenstrahlung und zur Bestimmung der Wellenlangenabhängigkeit der Dunsttrübung, Arch. Meteorol. Geophys. Bioklimatol., Ser. B, l0, 100–131, 1959.
Wagner, T., Dix, B., von Friedeburg, C., Frieß, U., Sanghavi, S., Sinreich, R., and Platt, U.: MAX-DOAS O4 measurements – a new technique to derive information on atmospheric aerosols. (I) Principles and information content, J. Geophys. Res., 109, D22205, https://doi.org/10.1029/2004JD004904, 2004.
Wagner, T., Apituley, A., Beirle, S., Dörner, S., Friess, U., Remmers, J., and Shaiganfar, R.: Cloud detection and classification based on MAX-DOAS observations, Atmos. Meas. Tech., 7, 1289–1320, https://doi.org/10.5194/amt-7-1289-2014, 2014.
Wagner, T., Beirle, S., Dörner, S., Penning de Vries, M., Remmers, J., Rozanov, A., and Shaiganfar, R.: A new method for the absolute radiance calibration for UV–vis measurements of scattered sunlight, Atmos. Meas. Tech., 8, 4265–4280, https://doi.org/10.5194/amt-8-4265-2015, 2015.
Wagner, T., Beirle, S., Remmers, J., Shaiganfar, R., and Wang, Y.: Absolute calibration of the colour index and O4 absorption derived from Multi AXis (MAX-)DOAS measurements and their application to a standardised cloud classification algorithm, Atmos. Meas. Tech., 9, 4803–4823, https://doi.org/10.5194/amt-9-4803-2016, 2016.
Wagner, T., Dörner, S., Beirle, S., Donner, S., and Kinne, S.: Quantitative comparison of measured and simulated O4 absorptions for one day with extremely low aerosol load over the tropical Atlantic, Atmos. Meas. Tech., 14, 3871–3893, https://doi.org/10.5194/amt-14-3871-2021, 2021.
Wuttke, S., Seckmeyer, G., Bernhard, G., Ehramjian, J., McKenzie, R., Johnston, P., and O'Neill, M.: New spectroradiometers complying with the NDSC standards, J. Atmos. Ocean. Tech., 23, 241–251, 2006.
Yu, X., Sun, Y., Fang, A., Qi, W., and Liu, C.: Laboratory spectral calibration and radiometric calibration of hyper-spectral imaging spectrometer, The 2014 2nd Int. Conf. on Systems and Informatics (ICSAI 2014), 15–17 November 2014, Shanghai, China, 871–875, https://doi.org/10.1109/ICSAI.2014.7009407, 2014.
- Abstract
- Introduction
- Radiative transfer simulations
- Application to measurements and comparison to results from previous calibration method
- Summary and conclusions
- Appendix A
- Code and data availability
- Author contributions
- Competing interests
- Disclaimer
- Acknowledgements
- Financial support
- Review statement
- References


