the Creative Commons Attribution 4.0 License.
the Creative Commons Attribution 4.0 License.
 | 13 May 2024
IMK–IAA MIPAS retrieval version 8: CH4 and N2O
Norbert Glatthor
Thomas von Clarmann
Bernd Funke
Maya García-Comas
Udo Grabowski
Michael Höpfner
Sylvia Kellmann
Michael Kiefer
Alexandra Laeng
Andrea Linden
Manuel López-Puertas
Gabriele P. Stiller
Using the IMK–IAA data processor, methane and nitrous oxide distributions were retrieved from version-8 limb emission spectra recorded with the Michelson Interferometer for Passive Atmospheric Sounding (MIPAS). The dataset includes measurements from the nominal, upper troposphere–lower stratosphere, middle-atmosphere, upper-atmosphere and noctilucent-cloud observation modes. The processing differs from the previous version-5 data with respect to the atmospheric state variables that are jointly retrieved along with the target gases CH4 and N2O, the treatment of the radiance offset, the selection of microwindows, the regularization, the spectroscopic data used and the treatment of horizontal variability of the atmospheric state. Besides the regular data product, a coarse-grid representation of the profiles with unity averaging kernels is available, as well as a specific research product for middle-atmosphere measurements resulting from a slightly different retrieval approach. The CH4 errors are dominated by the large spectroscopic uncertainty for line intensities, which probably is too pessimistic, and estimated to be 21 %–34 % in the altitude range 6–68 km for northern midlatitude summer day conditions. The N2O errors are 7 %–17 % below 45 km. At higher altitudes they increase strongly due to nearly vanishing N2O amounts. Analysis of the horizontal averaging kernels reveals that for both gases the horizontal resolution is sampling-limited; i.e., information is not smeared over consecutive limb scans. Zonal-mean seasonal composites of both CH4 and N2O exhibit the typical distribution of source gases with strong upwelling in the tropics and subsidence above the winter poles. Comparison with the previous data version shows several improvements: first, the vertical resolution of the retrieved CH4 (N2O) profiles has generally been significantly enhanced and varies between 2.5 (2.5) and 4 (5) km at altitudes between 10 and 60 km, with the best resolution around 30 km for both species. Secondly, the number of non-converged retrievals has been clearly reduced, and thirdly, formerly strongly oscillating profiles are now considerably smoother.
- Article
(4632 KB) - Full-text XML
-
Supplement
(10290 KB) - BibTeX
- EndNote


Both methane (CH4) and nitrous oxide (N2O) are so-called source gases. That is to say, they are produced on the Earth's surface, and they survive the transport into the stratosphere, since they are chemically quite inert. There, they are decomposed by photolysis and reaction with radicals. N2O also has an additional source in the upper mesosphere–lower thermosphere (Funke et al., 2008; Sheese et al., 2016; Kelly et al., 2018). The main sink reaction of stratospheric methane is oxidation by the hydroxyl radical OH. Further sink reactions include reaction with excited atomic oxygen (O(1D)), atomic chlorine and photolysis. The primary sink reaction of stratospheric nitrous oxide involves O(1D), but photolysis also plays a role (Brasseur and Solomon, 2005).
Both CH4 and N2O act as greenhouse gases. Their global warming potential per molecule exceeds that of CO2 (Myhre et al., 2014). Beyond this, both species contribute indirectly to stratospheric ozone destruction: methane is a source of stratospheric water vapor and thus has an impact on the possibility of heterogeneous chemistry via polar stratospheric cloud formation (Shindell, 2001). Nitrous oxide is a source of reactive nitrogen (Ravishankara et al., 2009).
Due to their relatively long stratospheric lifetimes, CH4 and N2O are suitable as tracers of stratospheric circulation. Low volume mixing ratios (VMRs) of these species at a given altitude are a sign of a subsided air mass (see, e.g., Toon et al., 1992 or Funke et al., 2014). Volk et al. (1996) use these gases to analyze lower stratospheric transport, and von Clarmann et al. (2021) use these species to infer middle-stratospheric circulation by inversion of the continuity equation.
CH4 and N2O can be measured either by air-sampling techniques (e.g., Volk et al., 1996) or by remote sensing. Since any remote observation, whose line of sight runs through the entire atmosphere (ground-based or nadir measurements), is dominated by the tropospheric contribution of these gases, occultation and limb emission measurements are considered superior for investigating stratospheric dynamics. The list of space missions which have measured one or both of these species includes the Atmospheric Trace Molecule Spectroscopy (ATMOS; Gunson et al., 1996), the Halogen Occultation Experiment (HALOE; Park et al., 1996; Grooß and Russell III, 2005), the Atmospheric Chemistry Experiment/Fourier Transform Spectrometer (ACE-FTS; Strong et al., 2008; De Mazière et al., 2008; Sheese et al., 2016), the Microwave Limb Sounder on Aura (Aura-MLS; Lambert et al., 2007; Livesey et al., 2011), the Sub-Millimetre Radiometer on Odin (Odin-SMR; Urban et al., 2005a, b) and the Solar Occultation for Ice Experiment (SOFIE; Rong et al., 2016), as well as the SCanning Imaging Absorption spectroMeter for Atmospheric CHartographY (SCIAMACHY; Noël et al., 2016) and the Michelson Interferometer for Passive Atmospheric Sounding (Fischer et al., 2008) on Envisat. A comparison of most of these measurements can be found in Hegglin and Tegtmeier (2017).
Earlier IMK–IAA MIPAS retrievals of CH4 and N2O were provided by Glatthor et al. (2005), von Clarmann et al. (2009b) and Plieninger et al. (2015). Bias problems with these data (Laeng et al., 2015; Plieninger et al., 2016) and the availability of MIPAS version-8 spectra triggered the work on a new CH4 and N2O data set.
After a brief introduction to the MIPAS instrument (Sect. 2), we describe the retrieval of CH4 and N2O with a strong focus on improvements with respect to preceding data versions (Sect. 3). In Sect. 4 the error budget is presented, and vertical as well as horizontal averaging kernels are discussed. Results are presented in Sect. 5 and discussed in the light of seasonal composites, improved convergence, decreased profile oscillations and comparison with a former validation study (Plieninger et al., 2016). We conclude with a brief discussion of the new dataset and identify open problems that could not yet be solved.
The Michelson Interferometer for Passive Atmospheric Sounding (MIPAS) was a payload of the Envisat research satellite of the European Space Agency (ESA). Envisat performed 14.4 polar sun-synchronous orbits per day, enabling measurements with global coverage. MIPAS relied on the measurement technique of mid-infrared Fourier transform spectrometry operating in limb-viewing geometry (Fischer et al., 2008). The spectral coverage was 4.1 to 14.6 µm (685–2410 cm−1). In the first phase of the mission, from June 2002 to March 2004, MIPAS measured at a full spectral resolution (FR) of 0.025 cm−1 (unapodized). After a technical defect of the interferometer slide, spectra were recorded at a reduced spectral resolution (RR) of 0.0625 cm−1 (unapodized) from January 2005 to April 2012.
While the ESA provides their own data product (Dinelli et al., 2021; Raspollini et al., 2022), in this paper recent improvements of the retrieval of CH4 and N2O from MIPAS radiance spectra version 8.03 with the level-2 data processor developed and operated by the Institute of Meteorology and Climate Research (IMK) in cooperation with the Instituto de Astrofísica de Andalucía (IAA) are discussed. Improvements with respect to calibration of the version-8.03 radiance spectra and their relevance to the retrieval are discussed in Kiefer et al. (2021, 2023). Here we concentrate on the progress made with respect to level-2 processing, i.e., the inference of volume mixing ratios from the radiance spectra and related data characterization.
This paper covers data from both the FR and the RR mission phases and includes measurements recorded in the nominal (NOM), upper troposphere–lower stratosphere (UTLS-1), middle-atmosphere (MA), upper-atmosphere (UA) and noctilucent-cloud (NLC) measurement modes. An overview of these modes can be found in the MIPAS mission plan (Oelhaf, 2008). The respective data versions are V8H_CH4_61 and V8H_N2O_61 for FR measurements, V8R_CH4_261 and V8R_N2O_261 for RR NOM measurements, V8R_CH4_161 and V8R_N2O_161 for UTLS-1 measurements, V8R_CH4_662 and V8R_N2O_662 for UA, and V8R_CH4_762 and V8R_N2O_762 for NLC measurements. For MA measurements, we offer two co-existing data versions. The versions V8R_CH4_561 and V8R_N2O_561 are more consistent with NOM measurements, while V8R_CH4_562 and V8R_N2O_562 are better suited for use in combination with UA measurements (more details in Sect. 3.6). Table 1 gives an overview of the different version-8 CH4 and N2O data products.
Table 1List of CH4 and N2O data products. “Retrieval lin/log” indicates retrieval of VMR or of log(VMR).
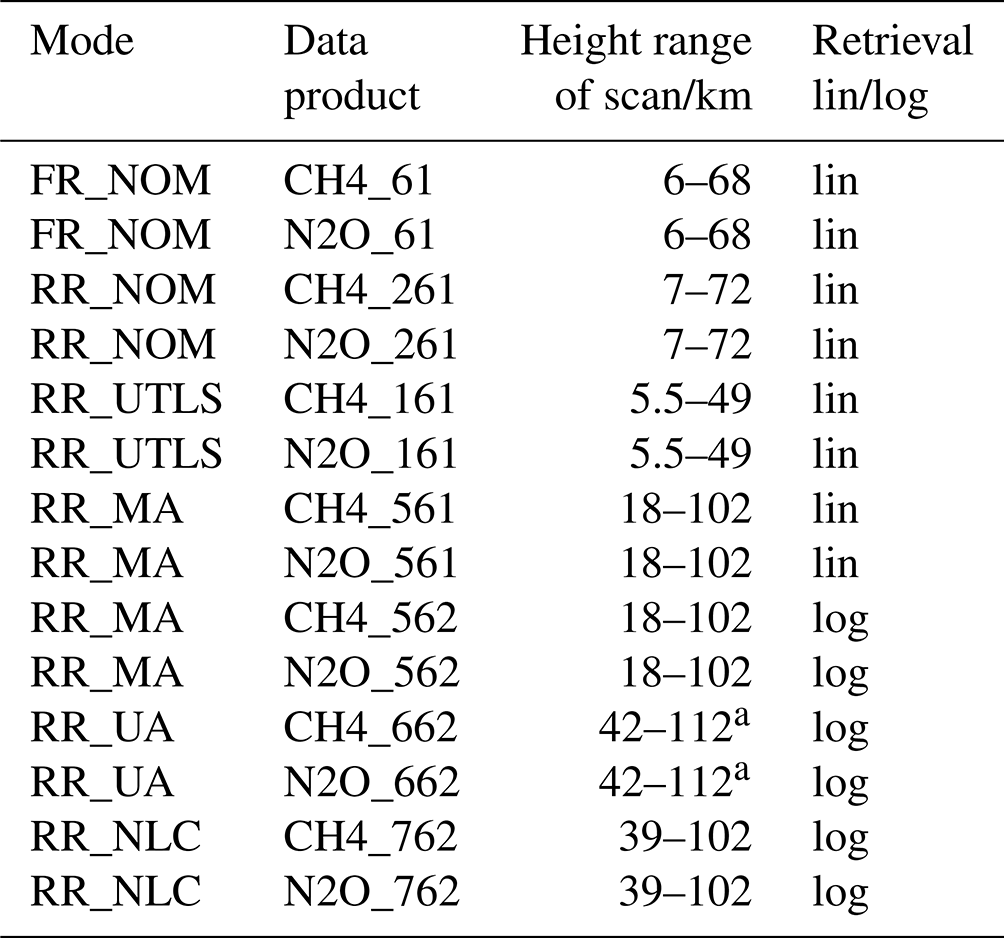
a Height range used for retrievals. The complete scan of measurements extends up to 172 km.
The retrieval relies on constrained multi-target least-squares fitting as described by von Clarmann et al. (2003, 2009b). The radiative transfer model in use is the Karlsruhe Optimized and Precise Radiative Transfer Algorithm KOPRA (Stiller, 2000). The retrieval of CH4 and N2O is part of a sequential procedure and follows the retrieval of temperature and tangent altitude corrections (Kiefer et al., 2021), ozone (Kiefer et al., 2023), water vapor (Kiefer et al., 2024), and HNO3 (Stiller et al., 2024). The results of these preceding V8 retrievals are used for the retrieval of CH4 and N2O. For modeling of the radiance contribution of species, which follow later in the retrieval chain, data version-5 mixing ratios are used.
Both MIPAS IMK–IAA CH4 and N2O profiles always had a high bias in the troposphere and the lower stratosphere with respect to ground-based in situ measurements and remote measurements in other spectral regions (Laeng et al., 2015; Plieninger et al., 2016). Among other changes, the high methane bias of data versions V5H_CH4_20, V5R_CH4_220 and V5R_CH4_221 was reduced by discarding saturated methane lines, resulting in a remaining bias of the order 0.1–0.2 ppmv. The high bias of V5H_N2O_20, V5R_N2O_220 and V5R_N2O_221 could be lowered to ∼ 20 ppbv (Plieninger et al., 2016). However, there was a price to pay in that for resulting data versions V5H_CH4_21, V5H_N2O_21, V5R_CH4_224, V5R_CH4_225, V5R_N2O_224 and V5R_N2O_225, the vertical resolution of both species was considerably deteriorated in the altitude range from 10 to 20 km. The goal of version-8 processing was to improve the vertical resolution relative to version 5 without increasing the high bias again.
Another issue with previous data versions was the frequent non-convergence of the retrievals in situations of non-monotonous decrease in CH4 and N2O with altitude or of pronounced horizontal inhomogeneities of the atmospheric state. Such conditions were typically encountered when the line of sight of the measurement passed through the boundary of the polar vortex. In consequence, V8 processing aimed at a higher convergence rate even under extreme atmospheric conditions. In many cases of non-convergence, the target quantities in the course of the iteration flipped back and forth between two solutions, which were associated with approximately the same value of the cost function. In this case, application of an oscillation detection proved to be a particularly useful feature. The oscillation detector calculates the mean of the two solutions as initial guess of the next iteration. More details are given in Kiefer et al. (2021). Beside a second improvement presented in Sect. 3.1, this intervention led to a considerable decrease in the fraction of non-converged retrievals.
Like for previous CH4 and N2O retrievals, a more restrictive cloud filter than for temperature and tangent altitude retrieval was used for the V8 data version. As for the temperature and tangent altitude retrieval (Kiefer et al., 2021), a minimum spectral radiance ratio of 4 between analysis windows around 792 and 833 cm−1 was required to accept spectra as cloud-free. In addition to this, for CH4 and N2O retrieval, spectra were discarded when the ratio of the mean spectral radiances between the analysis windows 1246.3–1249.1 and 1232.3–1234.4 cm−1 was less than 1.8. Due to this more stringent cloud filter, MIPAS CH4 and N2O profiles often do not reach as far down as, e.g., those of temperature, O3 or HNO3. Mostly they end at one tangent altitude further above.
The most relevant changes in the V8 retrieval setup compared to the earlier data versions are related to the selection of microwindows, the spectroscopic data, the regularization, the treatment of horizontal variability and the modeling of the zero offset. Some purely technical adjustments resulting in a higher numerical precision of the entire V8 retrieval chain have already been reported by Kiefer et al. (2021, 2023). In the following we discuss the specific retrieval settings relevant to the combined V8 CH4 and N2O retrieval.
3.1 The unknowns of the retrieval
Since CH4 and N2O have a lot of overlapping lines, profiles of both species are obtained together in a co-target retrieval. For NOM measurements, their profiles are sampled on a discrete retrieval grid, with a grid width of 1 km between 4 and 70 km and additional levels at 75, 80, 90, 100 and 120 km. For the MA, UA and NLC measurement modes, the retrieval grid also has a 1 km spacing up to 70 km, a 2 km spacing from 70 to 90 km altitude, a 2.5 km spacing between 90 and 95 km, a 5 km spacing between 95 and 110 km, and an additional level at 120 km. In the V8 retrievals, for the first time, horizontal mixing ratio gradients of both target gases are additionally retrieved along with the other unknowns (see Sect. 3.2). This procedure turned out to be the second essential means to improving the convergence rate. Further, an altitude- and microwindow-dependent background continuum (Sect. 3.1.1), which had proven adequate in previous data versions, and a radiance offset correction (Sect. 3.1.2) are retrieved. Contrary to the previous data version, the interfering species H2O and HNO3 are no longer joint-fitted along with CH4 and N2O, but the profiles of their prior V8 retrievals are used instead. This change saves computation time and has hardly any influence on the retrieved CH4 and N2O profiles. For modeling of O3 signatures, the previously retrieved V8 profiles are used as well. The interfering species C2H2, C3H6O (acetone), CFC-113, ClONO2, COF2, H2O2, HCN, HOCl, N2O5, NO2 and SO2 are modeled by use of the respective V5 profiles, since they are at a later position in the V8 retrieval chain. For the modeling of CO2 and CF4, climatological profiles are used. The same applies for COF2, H2O2 and HOCl during the period of RR measurements, for which V5 retrievals are not available.
Although some of the microwindows used for CH4 and N2O retrieval (see Sect. 3.4) contain prominent lines of the water vapor isotopologue HDO, it is not jointly retrieved. Instead it is modelled using the retrieved H20 profile, scaled by the HITRAN factor for the HDO portion in Standard Mean Ocean Water (SMOW). Test calculations showed that a joint fit of HDO mostly led to changes of the order of 1 % or less in the lower parts of the CH4 and N2O profiles only.
3.1.1 Background continuum
Since the first MIPAS retrievals, a background continuum is fitted to minimize that part of the residual between measured and modeled spectra which cannot be explained by the contribution of trace gas transitions (von Clarmann et al., 2003). This continuum is realized by a wavenumber-independent absorption cross-section per microwindow and altitude. The background continuum has been considered up to the altitude of 58 km since the last data version (for details, see Kiefer et al., 2021). Above, the continuum is forced towards zero by a diagonal term of the regularization matrix (see Sect. 3.3). For evaluation of UTLS-1 measurements, the continuum is retrieved for altitudes up to 44 km only because in this mode, the upper end of the limb scan is already at about 50 km altitude.
3.1.2 Radiance offset
To correct for a potentially non-perfect zero-level calibration of the spectra, an additive radiance offset is fitted along with the target variables. The radiance offset correction fitted in previous data versions was allowed to be microwindow-dependent but forced to be altitude-constant. Now it is allowed to be altitude-dependent as well because Kleinert et al. (2018) have shown that the offset increases with decreasing altitude, which they attribute to stray light from Earth or clouds. Thus, the instrumental performance can be reproduced better by this change. We use a priori information on the offset as provided by Kleinert et al. (2018). This is necessary because at higher altitudes radiative transfer is close to linear, which makes the background continuum and the radiance offset practically indistinguishable. Without an a priori constraint this would lead to instabilities in the retrieval.
3.2 Horizontal gradients
Traditional limb sounding retrieval methods assume a spherically homogeneous atmosphere where the atmospheric state varies with altitude only. This assumption, however, can be inadequate and contributed to convergence failures in various previous CH4 and N2O retrievals in the vortex boundary region. Ideally, this problem would be solved by a fully tomographic retrieval (see, e.g., Carlotti et al., 2001, 2006; Steck et al., 2005). But in combination with accurate radiative transfer modeling, the computational workload involved in this case can be obstructive. Thus, in the V8 retrieval of temperature and line-of-sight, a 3D temperature a priori field is scaled to the retrieved profile values, and in addition a horizontal temperature gradient is determined for the upper range of the retrieval altitudes (see Kiefer et al., 2021). This information is used in the CH4 and N2O retrievals.
Several approaches to model the horizontal inhomogeneity of the retrieved trace gases – among others of CH4 and N2O – were tested as well. One of them was to import the information on the horizontal structure of trace gas fields from previous MIPAS data versions. However, none of the approaches improved the χ2 of the spectral fit or led to better consistency with the overall 3D structures found in previous data versions. Therefore these approaches were finally discarded. Instead, the horizontal gradients of the CH4 and N2O mixing ratios are jointly retrieved along with the mixing ratios, continuum and offset at the nominal geolocation. The fitting of the horizontal CH4 and N2O gradients as unknowns is done by including the respective Jacobians in the fitting procedure. These gradients are applied within a range of ± 400 km around the tangent points. No additional assumptions are made. As mentioned above, besides the use of an oscillation detector within the retrieval iterations this treatment also leads to a larger fraction of converged retrievals. A comparison between the V5 and V8 convergence rates is given in Sect. 5.2.
3.3 Regularization
As usual for IMK–IAA MIPAS data evaluation, the regularization of the V8 methane and nitrous oxide retrieval consists in the use of a smoothing term based on a squared first-order difference operator (see, e.g., Tikhonov, 1963; Twomey, 1963; Phillips, 1962), for NOM and UTLS-1 measurements in combination with a flat all-zero a priori profile (for handling of the other modes, see Sect. 3.6). In order to avoid large negative mixing ratios at high altitudes, an additional diagonal term is included in the regularization matrix, which pushes the result towards the a priori profile. This follows the idea of an optimal estimation or maximum a posteriori retrieval (Rodgers, 2000). This diagonal term is employed at the five highest vertical grid points for CH4 and the two uppermost grid points for N2O only. With this modification, which had already been implemented by Plieninger et al. (2015) for version-5 retrievals, the Tikhonov-type smoothing regularization can be reduced at altitudes above 70 km without risking retrieval instabilities. The formalism to control the altitude dependence of the smoothing constraint used here is described by Kiefer et al. (2021, their Eq. 3) and replaces the approach by Steck and von Clarmann (2001) that was previously used.
3.4 Microwindows
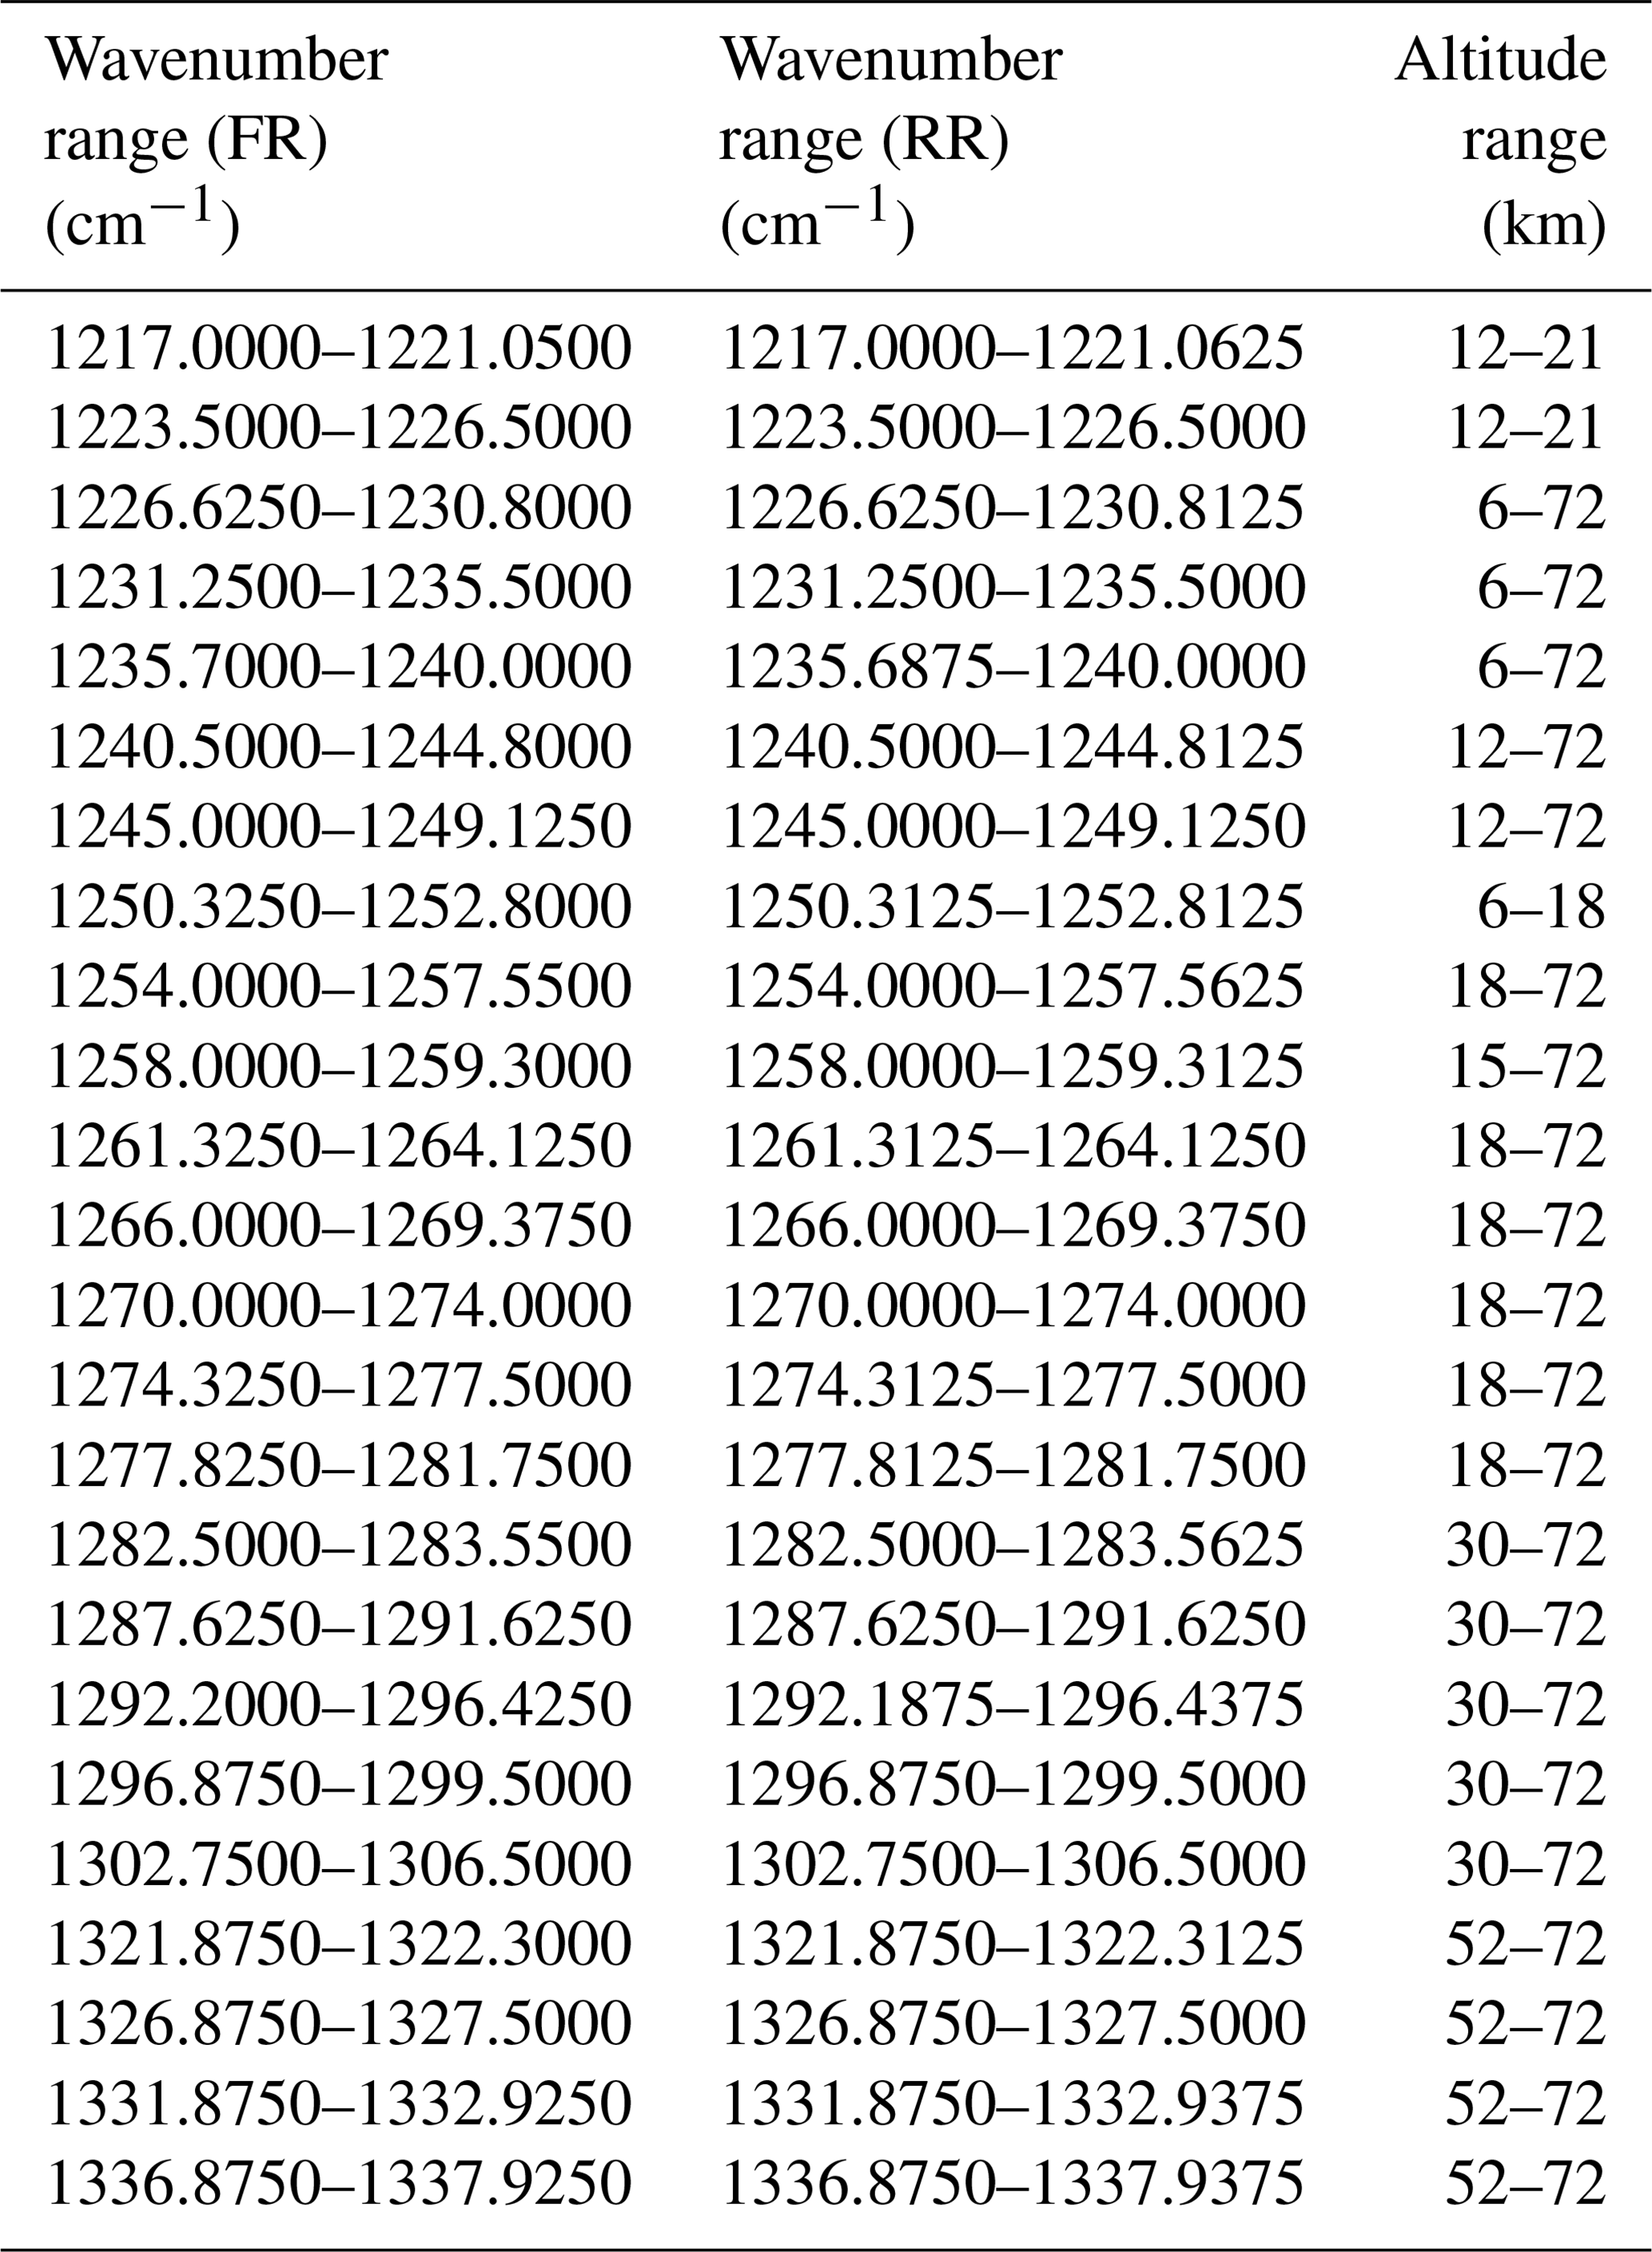
MIPAS retrievals of CH4 and N2O use the spectral region around 1300 cm−1 in the MIPAS B-band. The most prominent spectral lines in this region belong to the CH4 ν4 band and the N2O ν1 band. In comparison to the previous retrieval setups (V5H_CH4_21, V5H_N2O_21, V5R_CH4_224 and V5R_N2O_224; see Plieninger et al., 2015), the number of spectral grid points used for the retrieval of CH4 and N2O has been considerably enlarged, both by increasing the wavenumber range used for analysis to 1217.0–1337.9375 cm−1 and by taking into account more CH4 and N2O lines. Especially the latter change leads to a considerably better altitude resolution in the UTLS region. The new setup consists of 24 microwindows. In order to reduce saturation effects, only microwindows between 1217 and 1260 cm−1 are used at tangent altitudes below 16.5 km. Microwindows at higher wavenumbers containing stronger lines are subsequently added at higher tangent altitudes.
The microwindows used for nominal-mode retrievals (FR and RR) are listed in Table 2. These analysis windows are not always used completely over the full height range. Generally, at lower altitudes spectral grid points with appreciable interferences by other species are discarded, depending on the strength of the interference, while at stratospheric altitudes and above, the full windows are used. The microwindows applied for MA, UA and NLC retrievals are slightly different in the lower atmosphere.
Table 2Microwindows used for MIPAS CH4 and N2O retrieval for full (first column) and reduced (second column) spectral resolution.
3.5 Spectroscopy
While former MIPAS level-2 processing relied largely on older spectroscopic data of the HITRAN database (e.g., HITRAN08 for V5 CH4 and N2O, Rothman et al., 2009), for version-8 data processing, generally the HITRAN2016 (Gordon et al., 2017) line list was used. In the spectral range of our CH4 and N2O retrievals, the HITRAN2016 methane line intensities are only somewhat larger than those of HITRAN2008 – about 1 % for weak lines but clearly below 1 % for strong lines. This leads to a very small reduction of up to 0.02 ppmv in retrieved CH4 mixing ratios. The spectroscopic data for N2O have hardly changed between HITRAN2008 and HITRAN2016 in the spectral region 1200–1340 cm−1. For O3 and HNO3, versions pf3.32 and pf4.45 of the MIPAS spectroscopy were used, respectively. In the latter database, the HNO3 band in the 7.6 µm region is thoroughly adjusted to the band in the 11 µm region, which is essential in order to use the HNO3 prefit.
Although line coupling in the CH4 ν3 and ν4 bands has been investigated by Tran et al. (2006), the HITRAN2016 database does not include the relevant data. Thus, line mixing effects are not considered. Resulting retrieval errors are deemed negligible because Tran et al. (2006) report very small effects in radiance spectra of the CH4 ν4 band modeled for satellite applications. Beyond this, the effects are largely masked by the signal of interfering species, particularly H2O, N2O and CO2. The Q branch, where line-mixing effects are most relevant, is used in our retrieval at altitudes above 28.5 km only. At these low pressures, line mixing is even less of an issue.
3.6 MA, UA and NLC retrieval settings
The retrievals for MA, UA and NLC observation modes differ from those of the NOM measurements with respect to the following settings: the consideration of non-local thermodynamic equilibrium (non-LTE) emissions (López-Puertas and Taylor, 2001), the definition of the state vector, and the regularization chosen.
For CH4 and N2O retrievals from measurements recorded in the NOM and UTLS-1 measurement modes, the local thermodynamic equilibrium approximation is adequate. The situation is different for MA, UA and NLC measurements, where non-LTE emissions of CH4, N2O and H2O have to be considered. Non-LTE populations are computed with the Generic RAdiative traNsfer AnD non-LTE population Algorithm (GRANADA; Funke et al., 2012), which is part of the retrieval iteration in the sense that GRANADA is fed during each iteration with the updated guess values of the relevant atmospheric state variables. For N2O, the following transitions are considered for non-LTE: 0200-0000, 1000-0000, 0310-0110, 1110–0110, 1200–0200, 1220–0220 and 2000–1000. In retrospective, however, related non-LTE contributions were found to be negligibly small with effects of about 0.1 nW (cm2sr cm−1)−1. For CH4, the transitions 0001–0000, 0100–0000, 0002–0001 and 0101–0100 are considered. Only transitions involving the fundamental band were found to show a sizable signal difference associated with non-LTE effects. The most important non-LTE contributions are associated with the 0100–0000 and the 0200–0100 transitions of the interfering species H2O.
While in NOM, UTLS-1 and the first version of MA retrievals (see Sect. 2) the mixing ratios of trace constituents are retrieved, in the second version of MA retrievals (see below), as well as in UA and NLC retrievals, their logarithm is retrieved. The effect of this redefinition of the formal state variables is that the regularization is implicitly self-adaptive to the abundance of the species. This turned out to be advantageous because of the large dynamic range of mixing ratios, especially when high altitudes are included. Instead of an all-zero a priori profile as used in the NOM retrievals, gas-dependent a priori profiles are used. For CH4, these are taken from a climatology generated with the Whole Atmosphere Community Climate Model (WACCM; Marsh, 2011; Marsh et al., 2013) version 4. For N2O, geolocated output from a specified dynamics WACCM run is used up to the altitude of 90 km. Above 100 km the a priori mixing ratio is set to 20 ppbv, which corresponds to the climatological mean of ACE-FTS profiles (Sheese et al., 2016). Between 90 and 100 km the N2O a priori profile is a smooth transition between the WACCM value at 90 km and the climatological mean of 20 ppbv used above 100 km.
For the MA retrievals, we offer two coexisting data versions. Version V8R_CH4_561 and V8R_N2O_561 uses retrieval settings nearly completely consistent with those of the NOM retrievals. The major difference is consideration of non-LTE. Another difference is a slight change of the CH4 constraint above 70 km altitude. This data version is suggested to be used in combination with NOM measurements, when data users intend to fill gaps in the latter dataset with MA data.
Version V8R_CH4_562 and V8R_N2O_562 is more compatible with UA measurements. The main difference to version V8R_CH4_561 and V8R_N2O_561 is that instead of the mixing ratios of the target gases, their logarithms are retrieved. Further, only measurements from tangent altitudes at and above 40 km are used. Instead of all-zero a priori profiles, the same a priori profiles as for the UA retrievals are used above 40 km. Like for the UA and NLC retrievals, the constraint has been adjusted for logarithmic retrievals. Further, a strong diagonal constraint is added to profile values below 35 km altitude in order to tie the results in this altitude range to the V8R_CH4_561 and V8R_N2O_561 data that are used as a priori information here.
The additional data product V8R_CH4_562 and V8R_N2O_562 is not meant to supersede the data product V8R_CH4_561 and V8R_N2O_561. Within their diagnostic data (error estimates and averaging kernels), we consider both data versions valid. As already mentioned above, the version 561 data are recommended to be used in combination with NOM data and the version 562 data in combination with UA and NLC data.
The MIPAS data characterization presented here includes the error budget as well as vertical and horizontal averaging kernel matrices.
4.1 Error budget
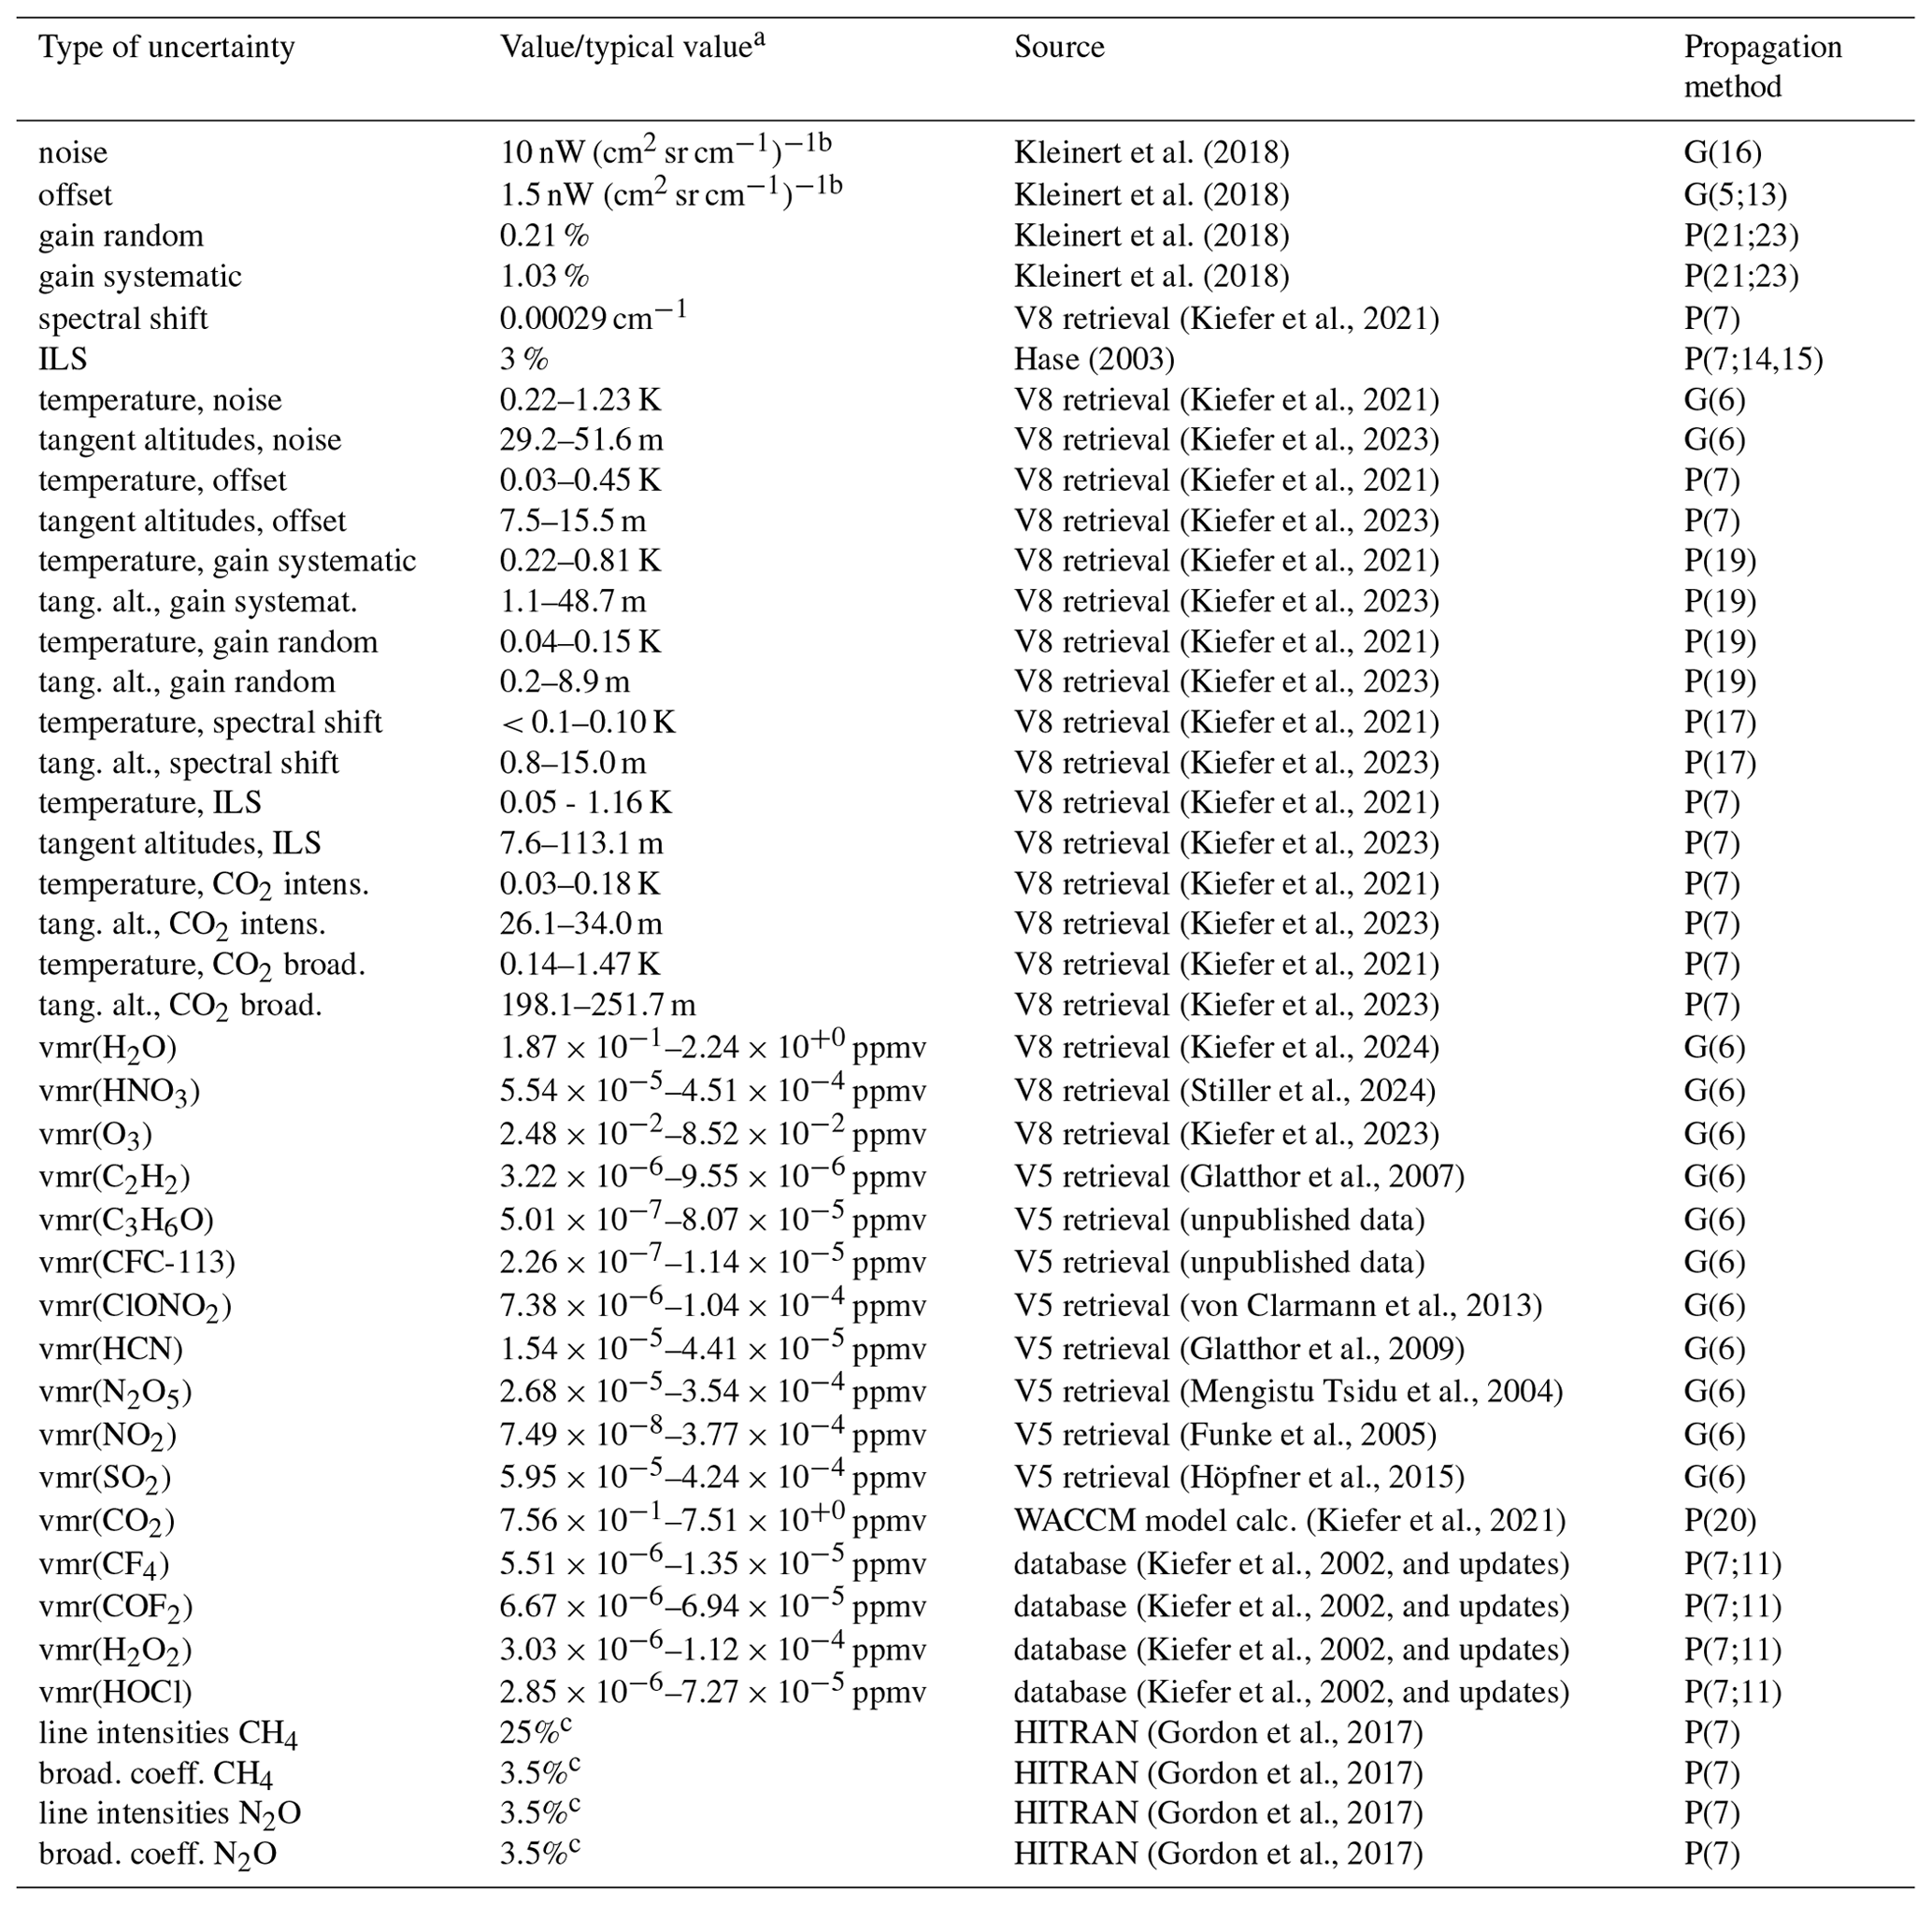
Error analysis for both CH4 and N2O complies with the recommendations for unified error reporting by von Clarmann et al. (2020) and follows the methodology presented in von Clarmann et al. (2022). Relevant error sources and assumptions on their ingoing uncertainties are compiled in Tables 3 and 4 for FR and RR measurements, respectively. In detail, these tables contain instrumental uncertainties; noise errors from retrievals of temperature, line of sight and prefitted gases; other uncertainties propagated from retrieval of temperature; and line of sight and spectroscopic uncertainties. The error ranges for ingoing noise errors were calculated for daytime northern midlatitude summer conditions.
Each error source in our error estimation is assumed to be given as 1σ uncertainty. However, transformation of the uncertainty intervals of spectroscopic parameters reported in HITRAN2016 into this quantity leaves room for some interpretation. As a reasonable assumption, we decided to regard the average of the lower and upper bound of the intervals reported as 1σ error bars. If this should turn out to be inadequate, the data user will have to rescale the respective error components of our CH4 and N2O profiles.
For estimation of spectroscopic uncertainties, each CH4 and N2O line is disturbed in intensity and air-broadened half-width according to its HITRAN error code. For the dominant CH4 transitions in the analysis windows used here, HITRAN2016 (Gordon et al., 2017) reports error code 3 for line intensity, corresponding to uncertainties larger than 20 %. Thus, we perturbed the intensities of the strongest CH4 lines by 25 %. However, the error estimates for these lines are probably too pessimistic, and an error code of 5 (5 %–10 %) might be more adequate (Iouli Gordon, personal communication, 2023). Application of this error code would lead to considerably lower estimated CH4 errors. For the air-broadened half-widths, error code 6 is reported for strong CH4 lines, which corresponds to uncertainties between 2 % and 5 %. Thus, for these lines the air-broadened half-widths are perturbed by 3.5 %. For previous MIPAS data versions we used uncertainty estimates by Jean-Marie Flaud and Chiara Piccolo (personal communication, 2002), which were much more optimistic with respect to uncertainties in line intensity (2 %–4 % for the strongest CH4 lines). However, our estimation of uncertainties in air-broadened half-widths was much more conservative then, namely 25 %. Interestingly, the combined effect of both ways of disturbing the CH4 lines leads to approximately the same spectroscopy-related uncertainty of the retrieved methane mixing ratios in the altitude range up to 30 km. But at higher altitudes, our former error estimates led to a much lower spectroscopic error because the air broadening becomes more and more unimportant. For strong N2O lines, HITRAN assigns error code 6 (2 %–5 %) both to line intensities and the air-broadened half-widths. Following our approach this transforms to 1σ uncertainties of 3.5 % used for perturbation of both line parameters.
Kleinert et al. (2018)Kleinert et al. (2018)Kleinert et al. (2018)Kleinert et al. (2018)(Kiefer et al., 2021)Hase (2003)(Kiefer et al., 2021)(Kiefer et al., 2023)(Kiefer et al., 2021)(Kiefer et al., 2023)(Kiefer et al., 2021)(Kiefer et al., 2023)(Kiefer et al., 2021)(Kiefer et al., 2023)(Kiefer et al., 2021)(Kiefer et al., 2023)(Kiefer et al., 2021)(Kiefer et al., 2023)(Kiefer et al., 2021)(Kiefer et al., 2023)(Kiefer et al., 2021)(Kiefer et al., 2023)(Kiefer et al., 2024)(Stiller et al., 2024)(Kiefer et al., 2023)(Glatthor et al., 2007)(von Clarmann et al., 2013)(von Clarmann et al., 2012)(Versick et al., 2012)(Glatthor et al., 2009)(von Clarmann et al., 2012)(Mengistu Tsidu et al., 2004)(Funke et al., 2005)(Höpfner et al., 2015)(Kiefer et al., 2021)(Kiefer et al., 2002, and updates)(Gordon et al., 2017)(Gordon et al., 2017)(Gordon et al., 2017)(Gordon et al., 2017)Table 3Assumed ingoing uncertainties (FR-NOM): minimum and maximum ingoing noise errors for temperature, tangent altitude and VMR of interfering species were available from the preceding retrievals of these quantities (northern midlatitude summer day conditions). Minimum and maximum ingoing propagated errors for offset, gain, shift, instrumental line shape (ILS) and CO2 spectroscopy are taken from the error estimation for temperature and line of sight. In the “Propagation method” column, “G” refers to generalized Gaussian error propagation in a matrix formalism and “P” to error estimation via perturbance spectra. The numbers in parentheses refer to the equation in von Clarmann et al. (2022), in which the respective ingoing error is applied.

a For height-dependent uncertainties, typical values (min/max) are reported. b Unapodized. c Uncertainties of the dominant CH4 and N2O lines used for retrieval.
Table 4Assumed ingoing uncertainties (RR-NOM): for details, see Table 3. Ingoing uncertainties for RR-MA and RR-UA retrievals are not included in this table because V5 prefits were not available for these modes, and climatological profiles were used. Maximum ingoing uncertainties for RR-MA and RR-UA-V8 retrievals of temperature and O3 at altitudes above 90 km are 7.41 K and 0.28 ppmv, respectively.
a For height-dependent uncertainties, typical values (min/max) are reported. b Unapodized. c Uncertainties of the dominant CH4 and N2O lines used for retrieval.
We do not include the smoothing error in the error budget because it is easily misinterpreted (von Clarmann, 2014). Instead, our CH4 and N2O profiles should be conceived as estimates of the smoothed true profile (see Rodgers, 2000, his Sect. 3.2.1, for a discussion of this concept).
Error profiles representing the effect of measurement noise, provided by the retrievals, are reported separately for each single CH4 and N2O profile in the database. In addition, the database includes estimates of the total random, total systematic and total error. These are evaluated for typical atmospheric conditions (northern/southern, polar/midlatitude/tropics, winter/spring/summer/autumn, day/night), and to each CH4 and N2O profile the representative error estimates are assigned. In cases of multiplicative error components, the representative error estimates are adjusted to the actual profile. In total, 34 different atmospheric states are taken into account, each of them represented by about 30 geolocations. Following the recommendations of TUNER (Towards Unified Error Reporting; von Clarmann et al., 2020), we categorize each error source either as chiefly random or as chiefly systematic. For mixed errors, which cause both bias and scatter (“headache errors”), both components are reported separately. We aggregate the resulting random and systematic error components separately. The whole set of mean error estimates for each of the different atmospheric conditions is compiled in the Supplement.
As an example, we present the error estimation for daytime northern midlatitude summer. Figure 1 shows height profiles of the total error, total systematic and random errors, and the major single error components as a percentage of the mean CH4 and N2O profiles for this atmospheric scenario. The components “ILS”, “spectro” and “gain” are regarded as systematic errors, although the gain error has a small random component as well. The other components are considered random. The numerical values as well as the respective absolute errors can be found in the Supplement.
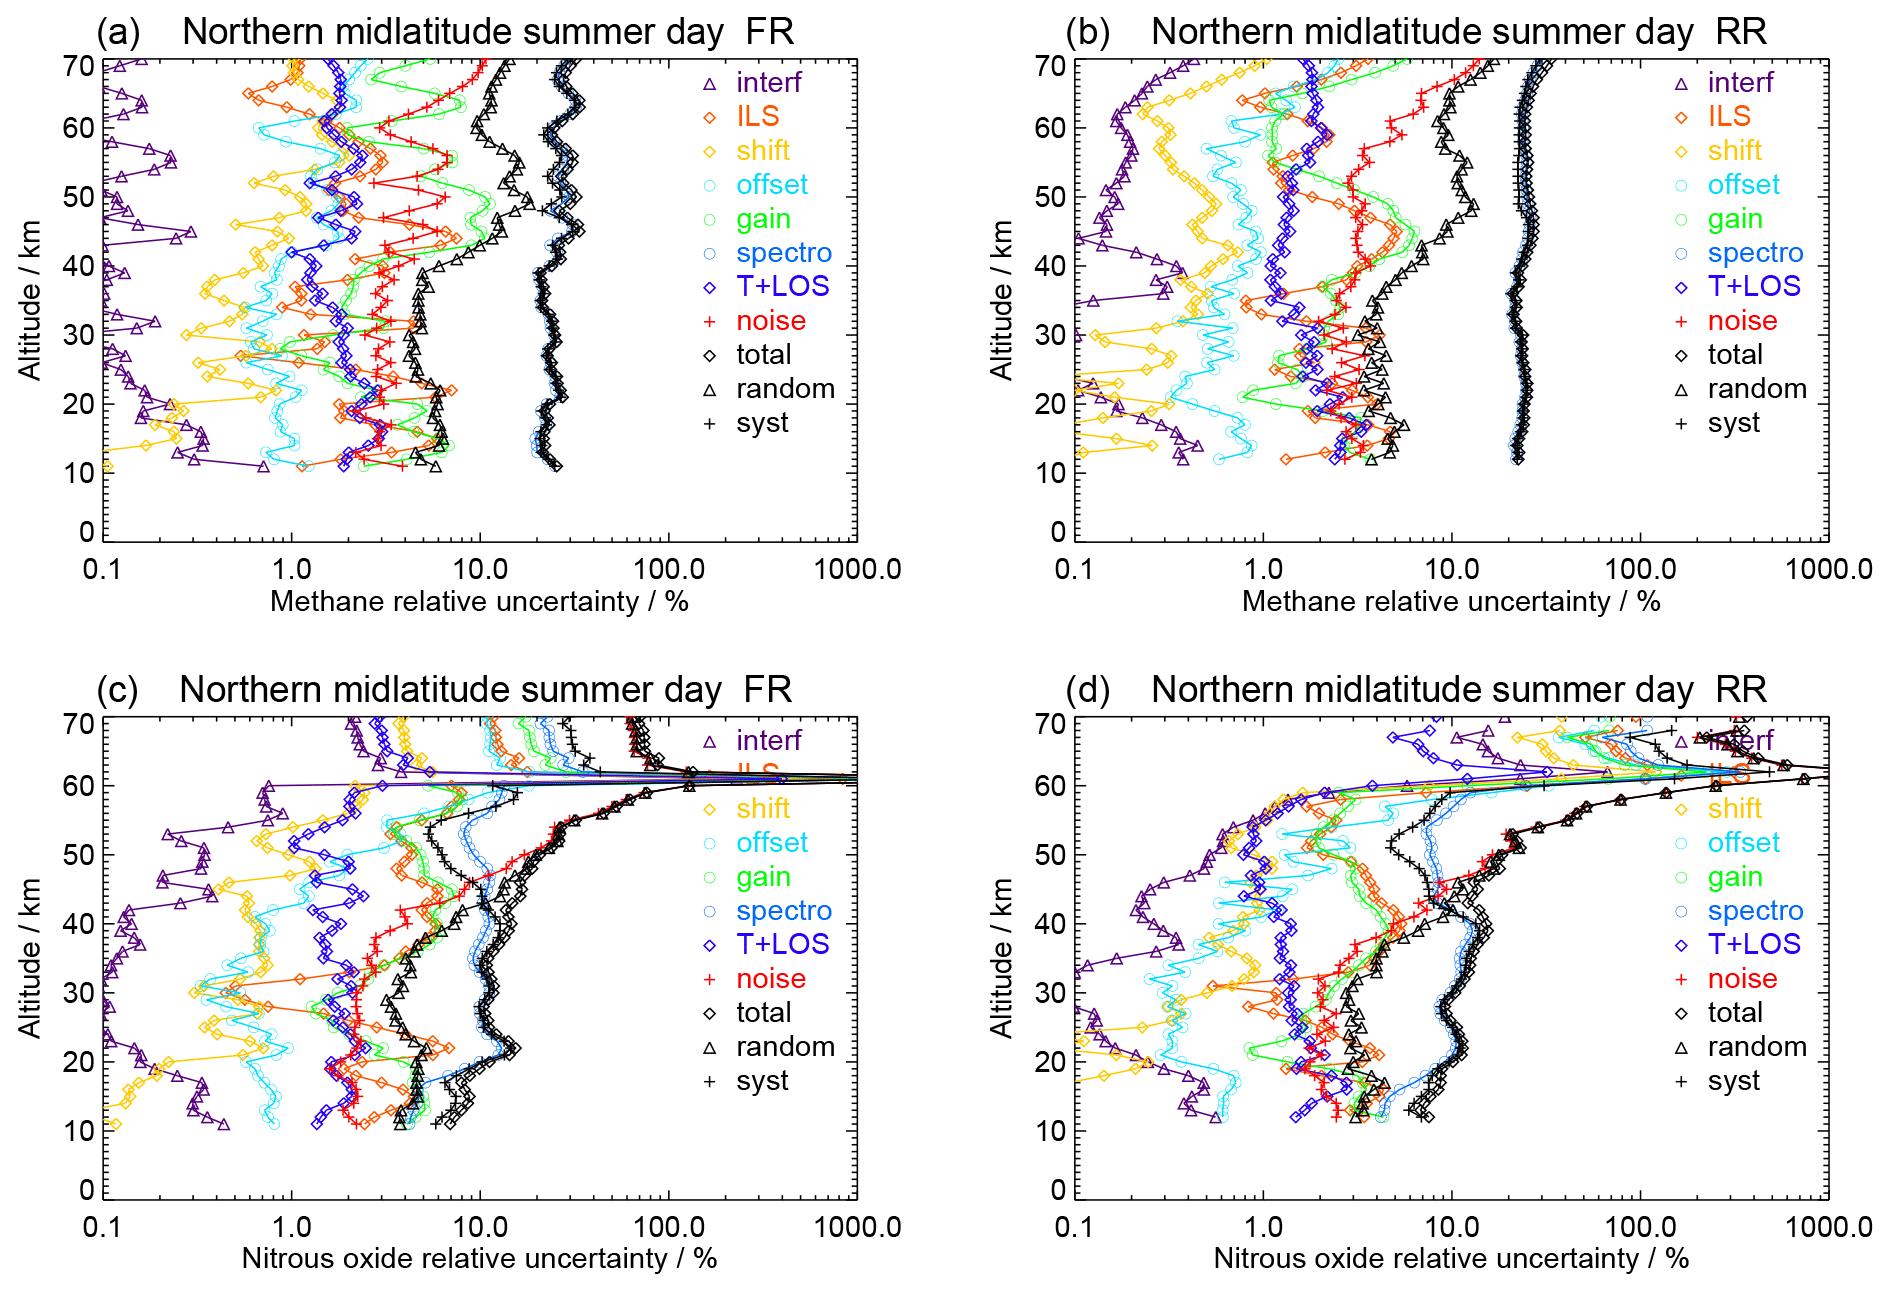
Figure 1CH4 error budget for daytime northern midlatitude summer conditions for (a) FR and (b) RR data, shown as a percentage of the respective mean CH4 profile. All error estimates are 1σ uncertainties. Error contributions are marked “total”, “random” and “syst” for the total, total random and total systematic error; further “T+LOS” for the propagated error from the T+LOS retrieval; “noise” for the error due to spectral noise; “spectro” for the spectroscopic error; “gain” for residual gain calibration uncertainties (MIPAS bands A and B); “shift” for the spectral shift error; “ILS” for the instrument line shape error; “offset” for the error due to spectral offset; and “interf” for the error due to interfering gases. Information on the ingoing uncertainties can be found in the text and in Tables 3 and 4. Panels (c) and (d) are the same as the top row but for N2O.
The total CH4 error is rather large and does not vary much over the altitude range 12 to 68 km, namely between 21 % and 34 % for FR (Fig. 1a) and between 21 % and 30 % for RR measurements (Fig. 1b). The reason is the dominance of the spectroscopic error, which nearly accounts for the whole systematic and total error. Consequently, the systematic error is much higher than the random error at altitudes up to 45 km and mostly still twice as high at the altitudes above. The random error is around 4 %–6 % below 40 km and increases up to 15 % at higher altitudes. Up to 40 km the noise error accounts for half or more of the random error. At several of the higher altitudes, the contribution of the other random errors becomes larger. Other noteworthy error components are the gain error, which around 45 km amounts up to 10 % for FR and up to 6 % for RR measurements, and the ILS error, which at 45 km is 7 % for FR and 5 % for RR measurements. However, at most other altitudes these errors are considerably lower. Uncertainties in temperature and line of sight cause an error of 1 %–3 %. The error due to uncertainties in interfering species (H2O, O3 and 14 other species) is below 0.4 % for both FR and RR measurements and at various altitudes, even as low as 0.1 %.
Up to 45 km, the total N2O error is 7 %–17 % for FR (Fig. 1c) and 8 %–16 % for RR measurements (Fig. 1d). At the altitudes above, the error increases strongly: at 56 km it amounts to 45 %–46 %; towards the upper end of the scans it ranges from 73 % to more than 100 % for the FR mode, and it is completely above 100 % for the RR mode. Thus the total N2O error is clearly lower than the CH4 error at lower altitudes but considerably higher at the upper altitudes. The reason for the lower relative errors up to 48 km is the smaller spectroscopic uncertainty. At the altitudes above, the N2O signal becomes very weak, leading to a strong increase in the relative noise error. Consequently, the systematic error exceeds the random error up to about 40 km, while at the altitudes above, spectral noise becomes increasingly dominant. The main systematic error components are spectroscopic, gain and ILS errors. Up to 56 km, the spectroscopic error is 4 %–12 % for the FR and 4 %–13 % for the RR mode, the gain error is 1 %–7 % (FR) and 1 %–5 % (RR), and the ILS error is 0.4 %–7 % (FR) and 1 %–5 % (RR). At the altitudes above, these errors generally increase strongly. The main random errors are spectral noise and uncertainties in temperature and line of sight. Up to 42 km, spectral noise ranges from 2 % to 4 % (FR) and from 2 % to 7 % (RR) and increases strongly above. For both modes the error resulting from uncertainties in temperature and line of sight is 1 %–2 % up to 56 km and somewhat higher above. Up to 56 km the error caused by uncertainties in interfering species is just around 0.1 % at various altitudes and 1 % at the most. At the uppermost altitudes it increases to 3 % for FR and to 18 % for RR measurements.
Tangent altitude errors are partly correlated in the altitude domain, random across different limb scans and fully systematic across different gases. Spectroscopic errors of the target gases are systematic in altitude and in time, except for effects caused by the modulation of the initially systematic errors by variations of the atmospheric state. Gain errors are predominantly systematic in altitude and over one calibration period but random over longer time periods. ILS errors are chiefly systematic in altitude and time. Errors caused by spectral noise are uncorrelated in time, while the non-diagonal gain matrix of the retrieval causes correlations in the altitude domain.
For the other atmospheric conditions, the error estimates only show moderate deviations from the example presented here in the altitude range 12 to 60 km. This applies to NOM measurement mode retrievals as well as to all other measurement modes. Somewhat larger deviations can be found at the upper ends of the scans due to stronger variations in mixing ratios. Further, the errors for MA and UA measurements above 70 km are mostly larger than 100 % (see Supplement).
4.2 Profile averaging kernels and vertical resolution
Our characterization of the vertical resolution and the content of a priori information of the CH4 and N2O profiles relies on the averaging kernel matrices (Rodgers, 2000). Figure 2 shows the averaging kernel rows of CH4 and N2O NOM retrievals, respectively, referring to measurements recorded at full spectral resolution at 55.70° N on 10 October 2003 (left column) and at reduced spectral resolution at 41.02° N on 26 December 2009 (right column). In the troposphere and through the whole stratosphere, the averaging kernels are well-behaved in the sense that they are fairly symmetric and peak at the nominal altitudes for both modes and gases. However, at higher altitudes they become somewhat asymmetric, and the peaks of the N2O averaging kernels (AKs) are increasingly displaced from their nominal to lower heights.
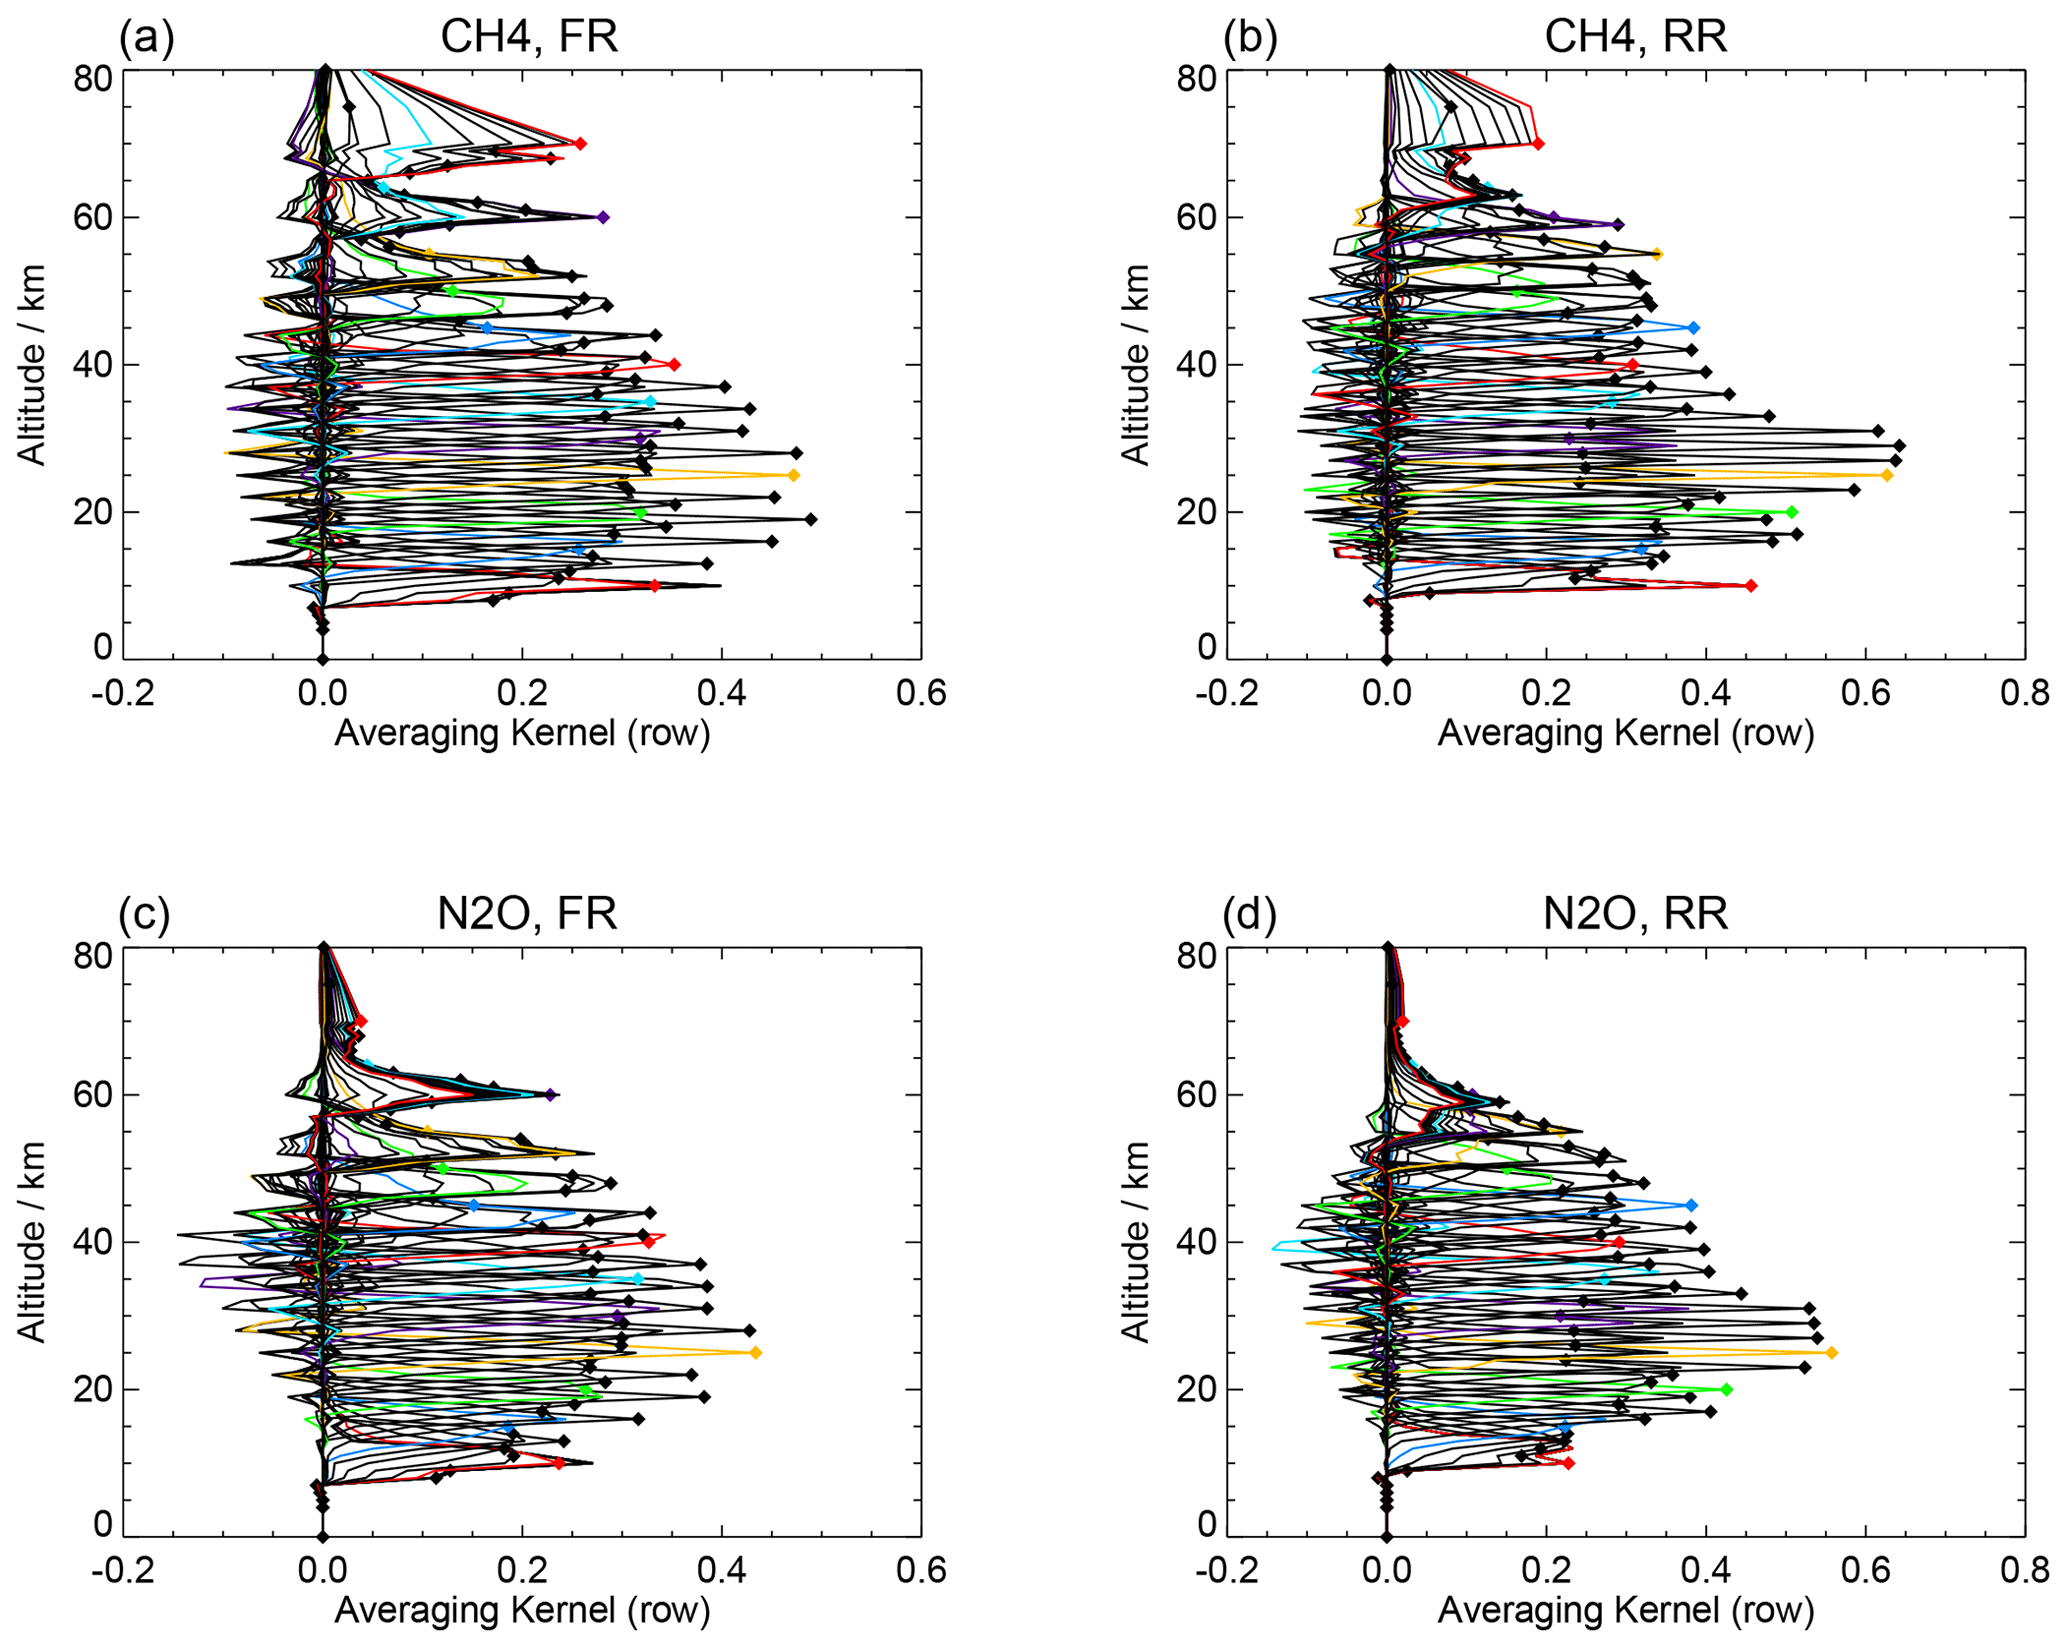
Figure 2Rows of the averaging kernels belonging (a) to a CH4 profile measured at full spectral resolution (FR) at 55.70° N, 170.0° E on 10 October 2003 and (b) to a CH4 profile measured at reduced spectral resolution (RR) at 41.02° N, 98.74° E on 26 December 2009. Panels (c) and (d) are the same as the top row but for N2O. The diamonds indicate the nominal retrieval height. If the nominal retrieval height is located at the peak of the averaging kernel row, there is no vertical information displacement.
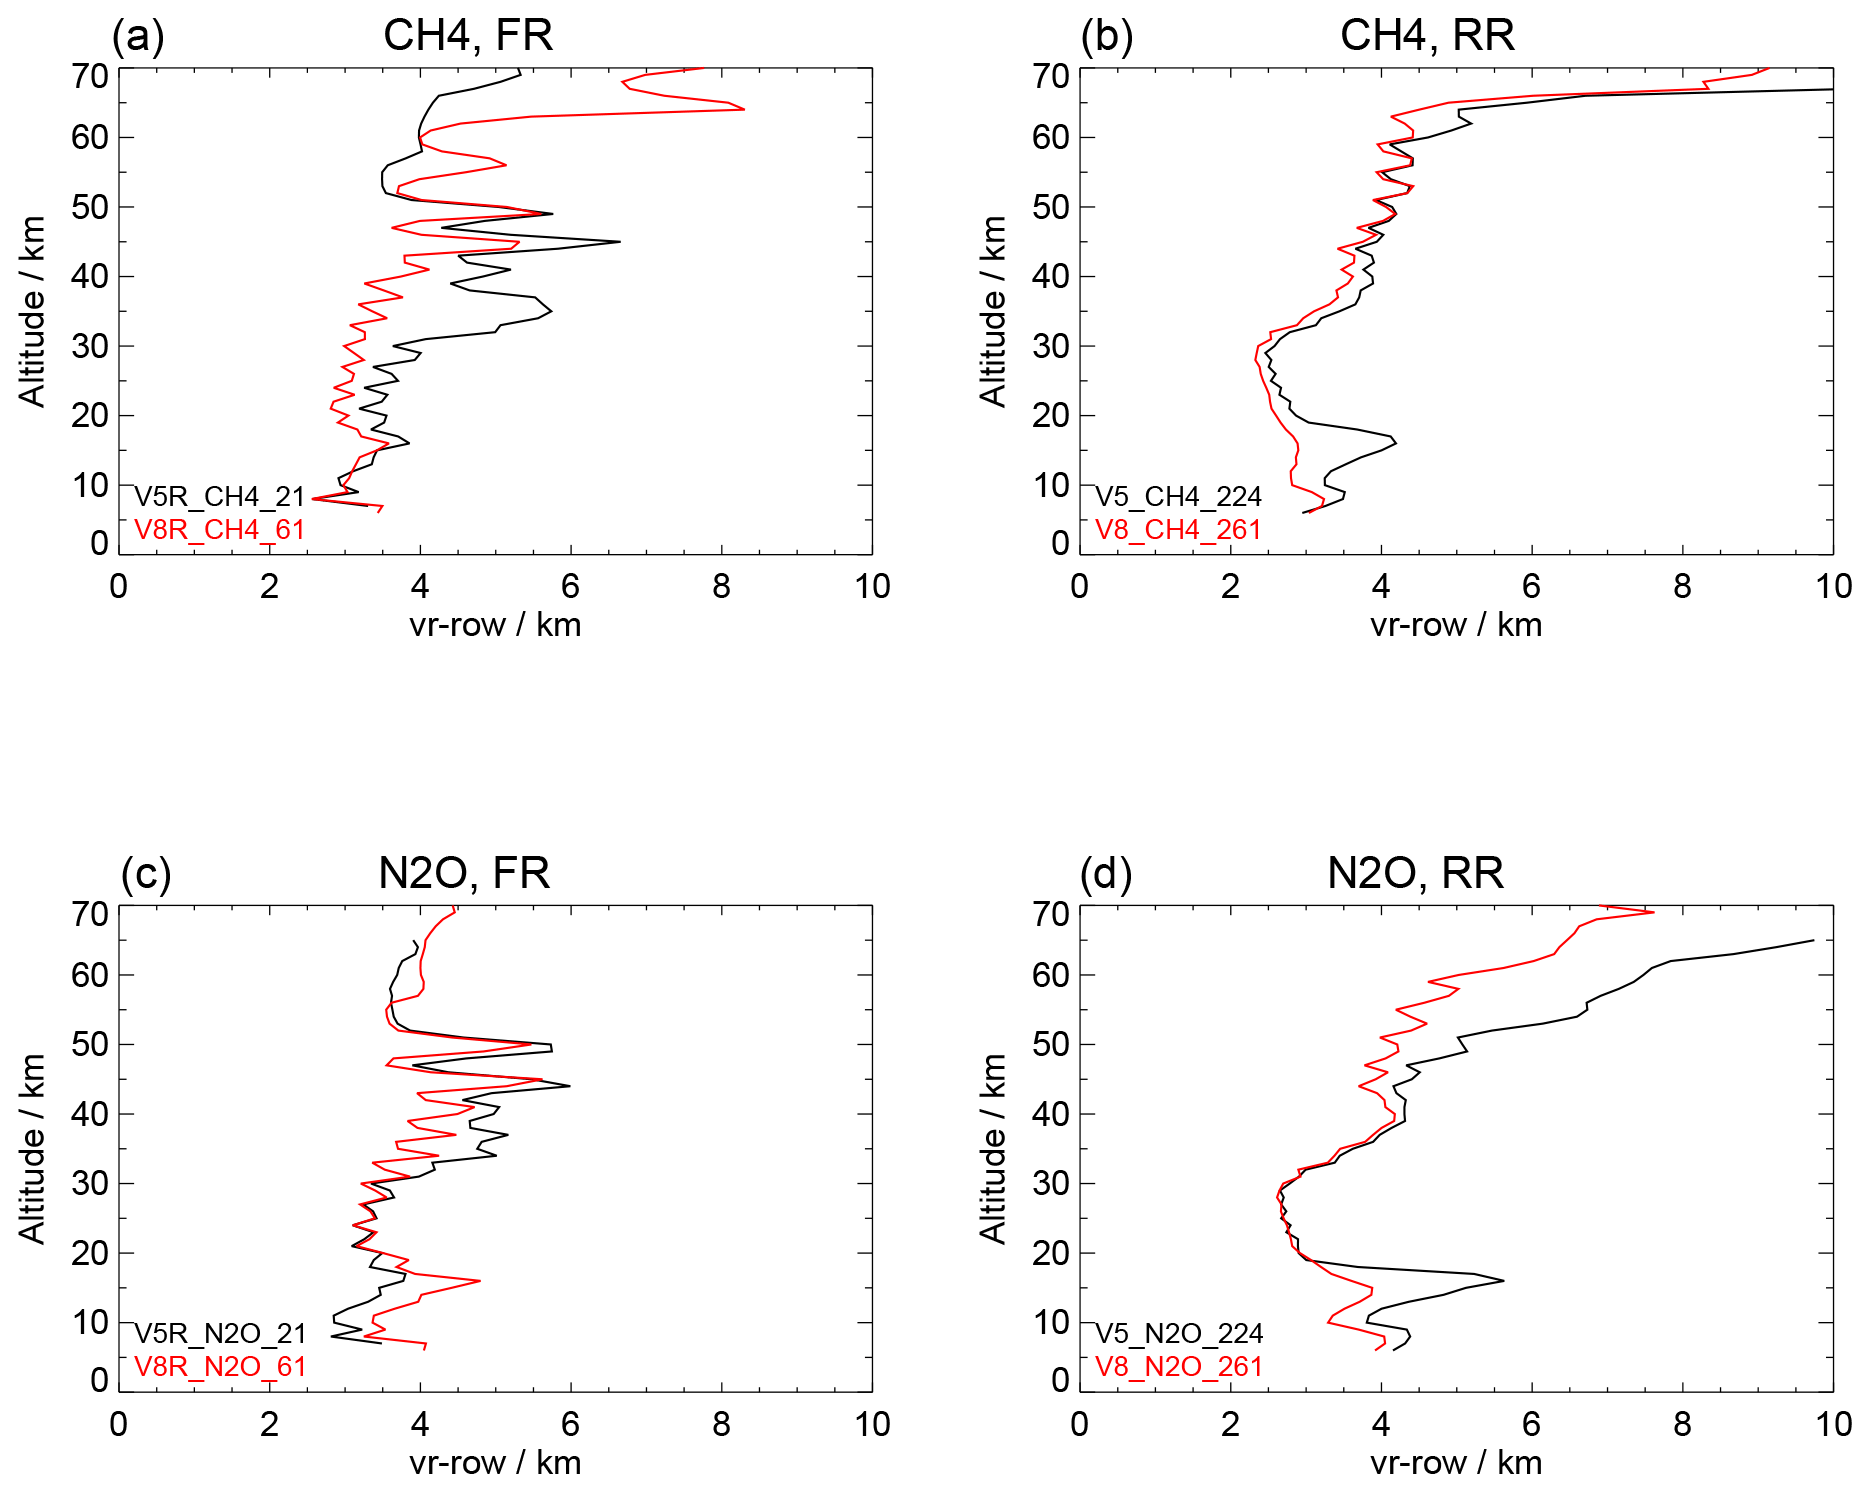
Figure 3(a) Vertical resolution of the CH4 data product V5H_CH4_21 (black) and of the new data product V8H_CH4_61 (red), averaged over orbits 1753–1765 of the full spectral resolution period (FR). (b) Vertical resolution of the CH4 data products V5R_CH4_224 (black) and V8R_CH4_261 (red), averaged over orbits 29031–29051 of the reduced spectral resolution period (RR). Panels (c) and (d) are the same as the top row but for N2O.
Figure 3 shows the vertical resolution of CH4 and N2O profiles in terms of the full width at half maximum (FWHM) of the rows of the averaging kernels, obtained with the latest V5 and V8 retrieval setup. For the measurements at full spectral resolution (left column), the V8 setup has improved in the altitude region 15 to 45 km for CH4 and between 32 and 42 km for N2O. Below 15 km, the vertical resolution of N2O has become slightly worse. Numerically, for the measurements with full spectral resolution, the vertical resolution of the V8 CH4 (N2O) retrievals varies between 3 (3) and 4.5 (5) km at altitudes between 10 and 50 km. For the measurements at reduced spectral resolution (right column) the V8 setup exhibits a large improvement in the altitude range 10 to 20 km for both gases and above 45 km for N2O. For this mode the vertical resolution obtained with the V8 setup varies between 2.5 (2.5) and 4 (5) km at altitudes between 10 and 65 km, with the best resolution at 30 km altitude for both species.
Table 5Horizontal information distribution for CH4 full-resolution (FR) measurements on 29 April 2003 and reduced-resolution (RR) measurements on 18 September 2009.
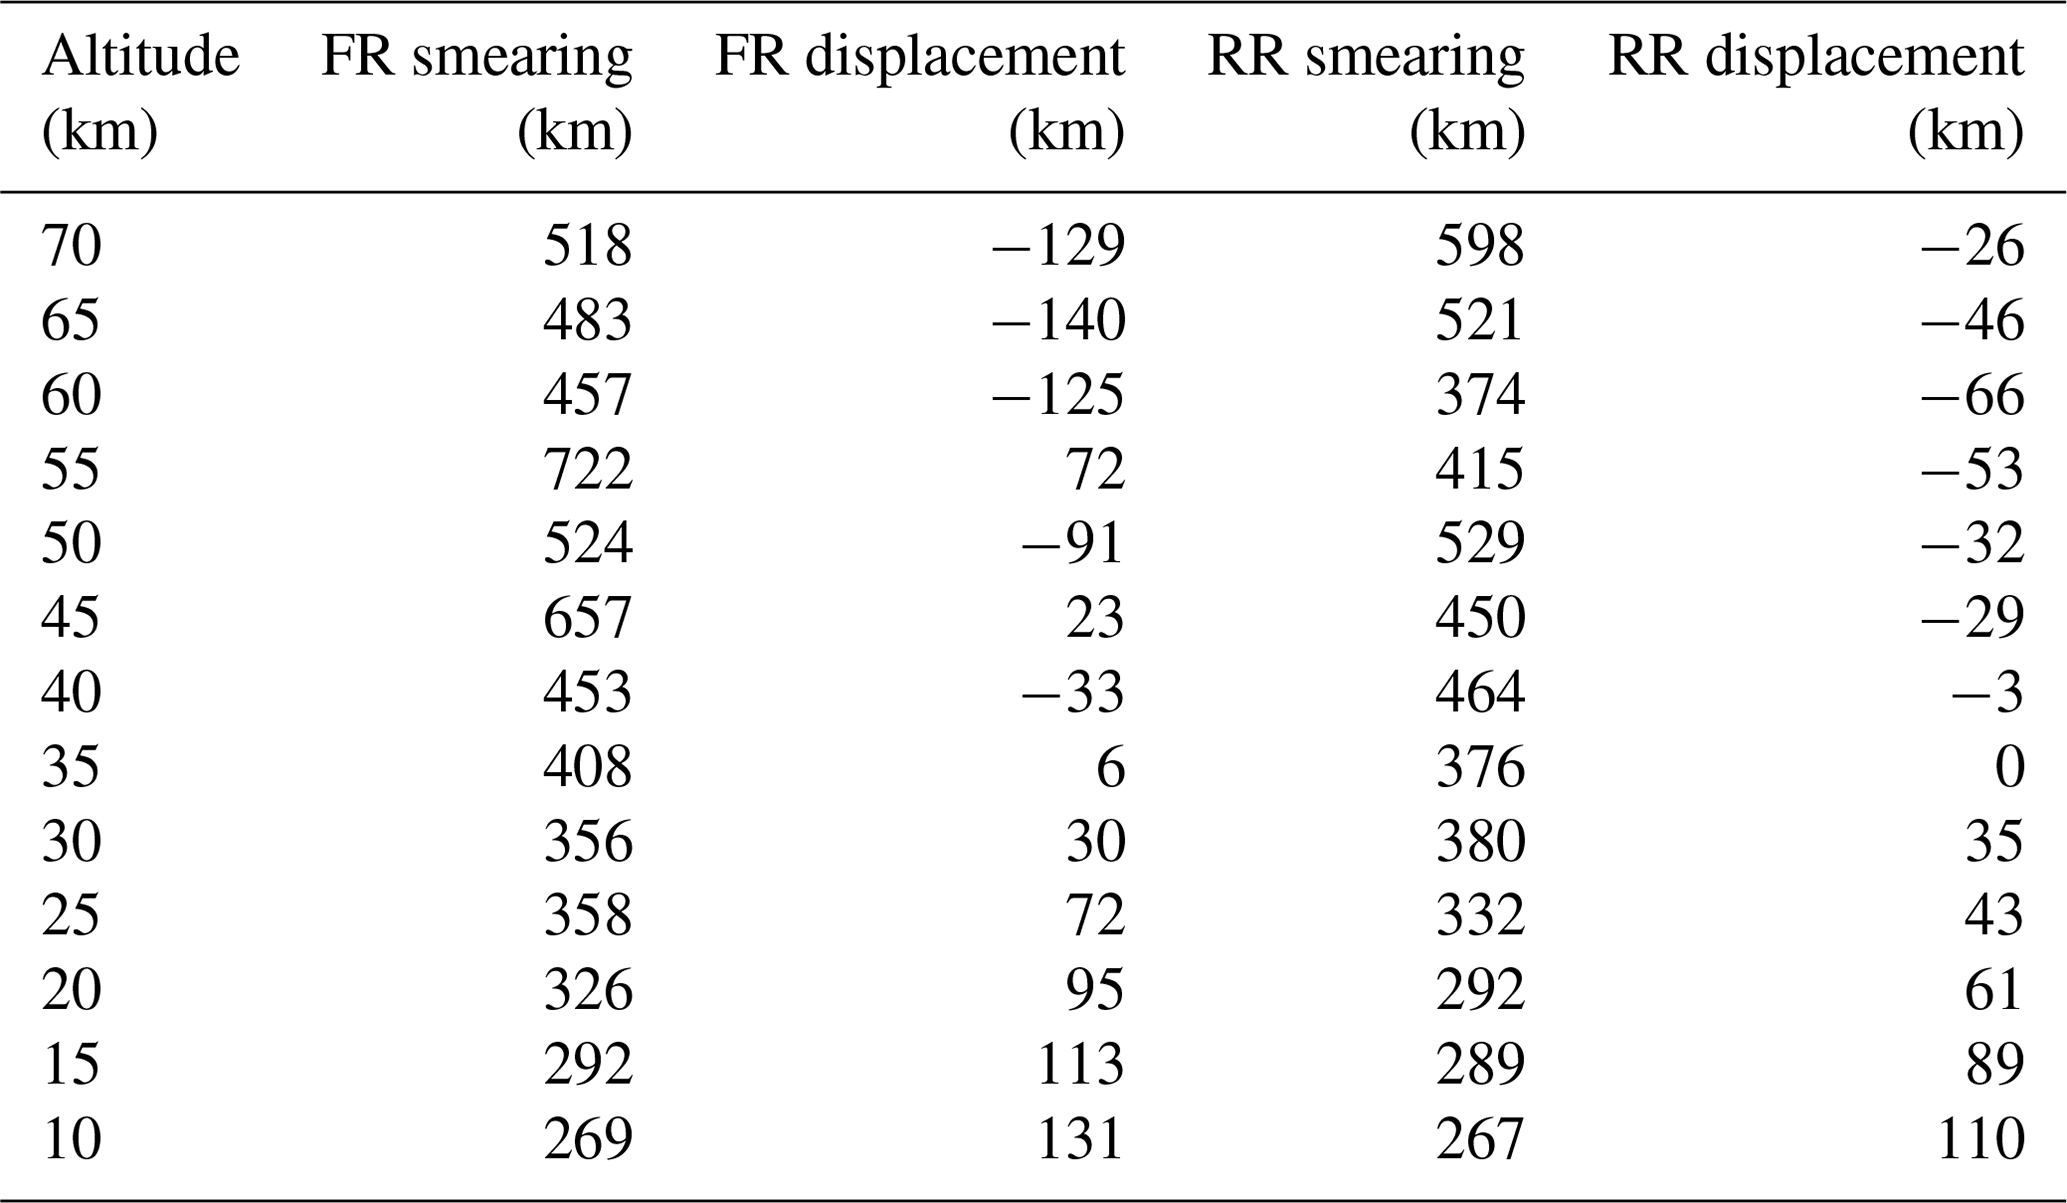
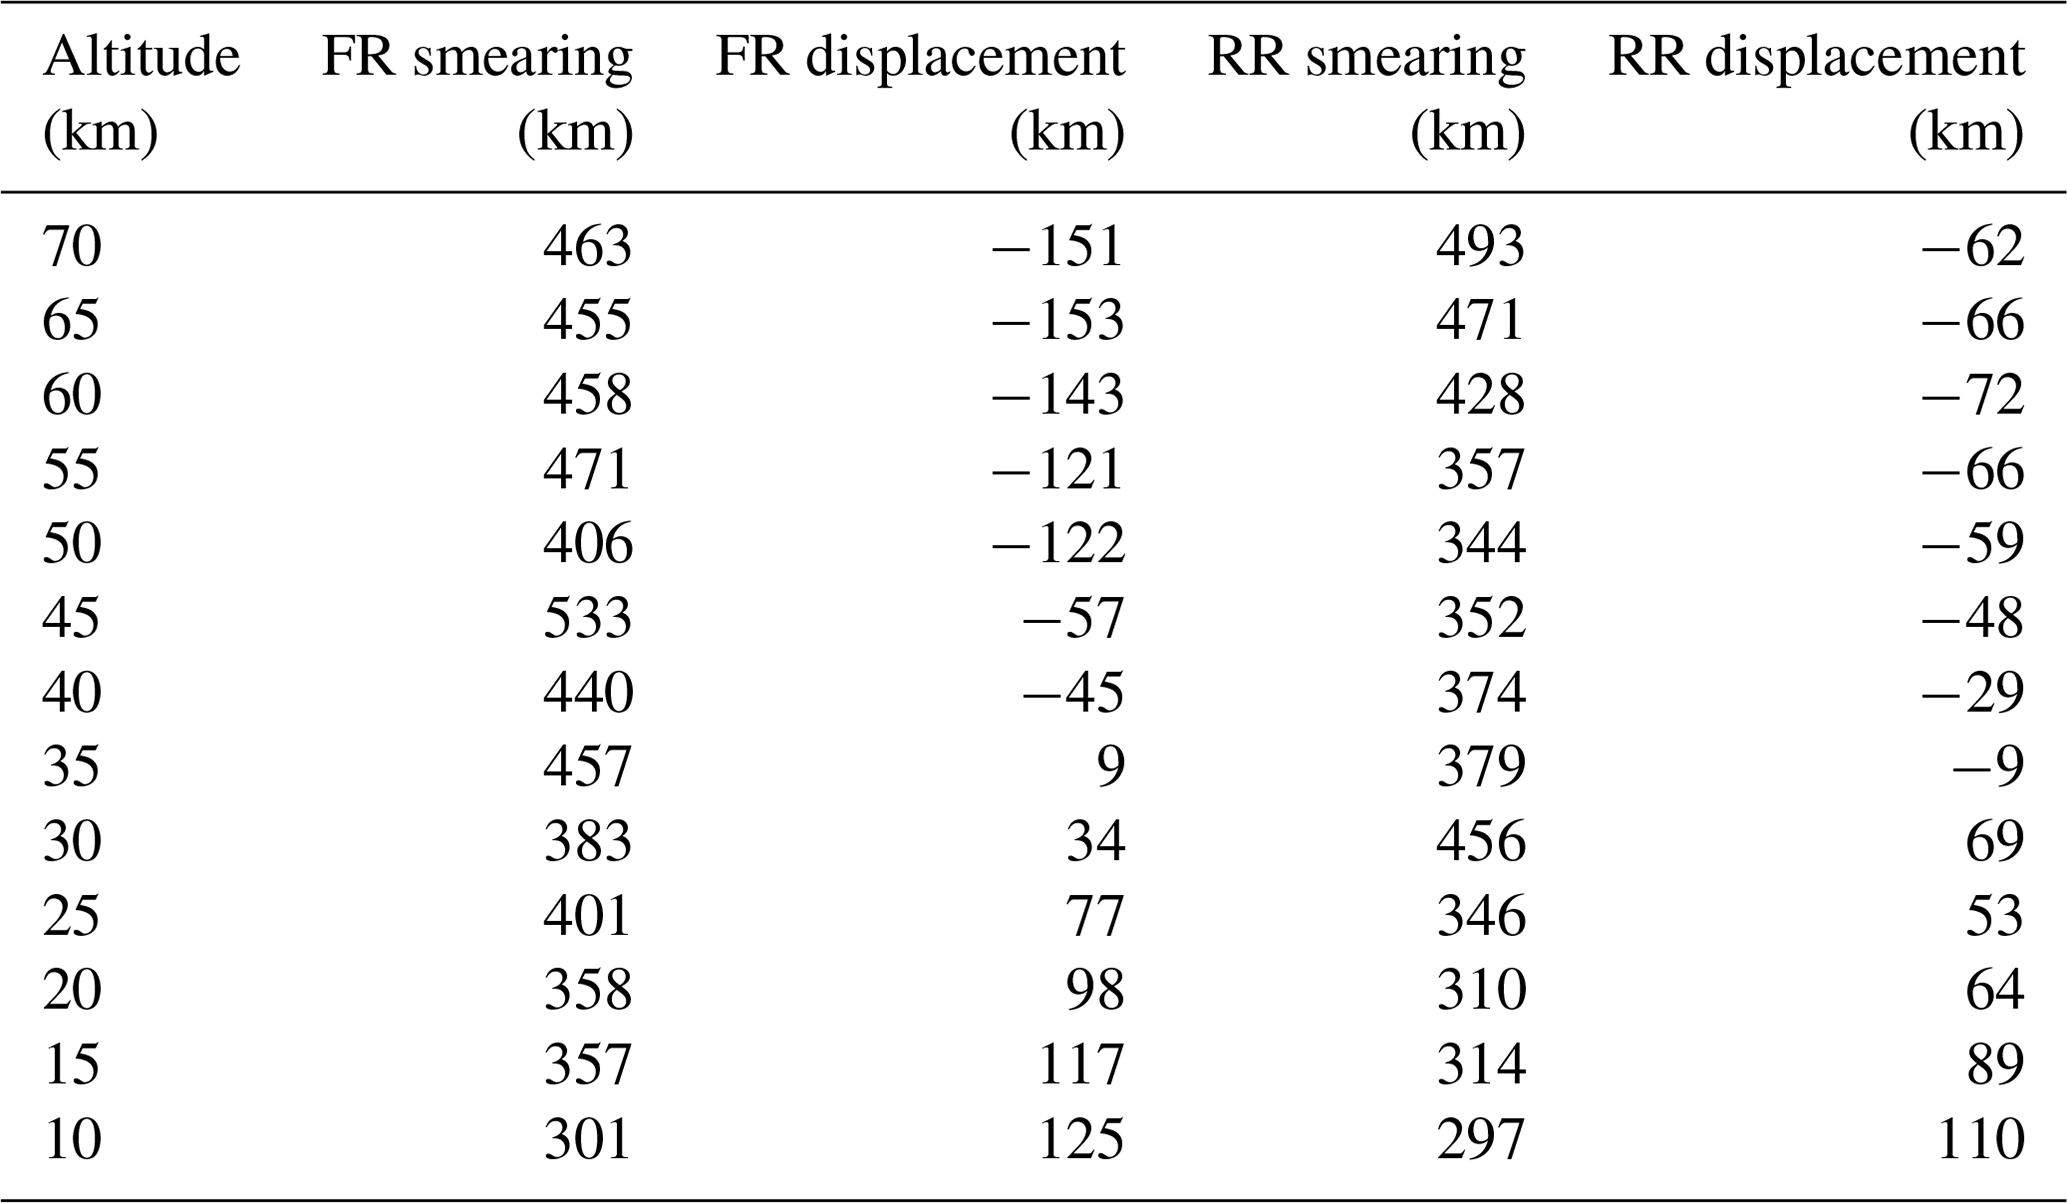
Table 6Horizontal information distribution for N2O full-resolution (FR) measurements on 29 April 2003 and reduced-resolution (RR) measurements on 18 September 2009.
4.3 Horizontal averaging kernels
Since in limb sounding the line of sight extends over long horizontal distances in the atmosphere, horizontal averaging kernels are an issue. The horizontal averaging kernels are calculated from 2D Jacobians provided by the radiative transfer forward model KOPRA, operated in a 2D mode, for the specified atmosphere. From these 2D Jacobians, the 2D averaging kernels are calculated as proposed by von Clarmann et al. (2009a, their Eq. 5). The way to calculate these 2D averaging kernels thus follows exactly the rationale behind the well-established profile averaging kernels, except that 2D Jacobians are used. Some more information on the technical application of this concept used here can be found in Kiefer et al. (2023).
We report the horizontal smearing in terms of the full width at half maximum of the horizontal component of the 2D averaging kernels and the information displacement both for CH4 (Table 5) and N2O (Table 6). The displacement is the horizontal distance between the nominal geolocation of the measurement and the point where most information comes from, calculated as the averaging-kernel-weighted mean horizontal coordinate. The sign convention is such that positive values indicate displacements towards the satellite. The 2D averaging kernels presented here have been calculated for a limb scan, recorded on 29 April 2003 at 47.9° S, 39.8° W, for FR measurements and a limb scan, recorded on 18 September 2009 at 57.1° S, 176.1° W, for RR measurements.
For both gases and the majority of altitudes shown, the horizontal smearing is less than or comparable to the horizontal distance between two subsequent limb scans, which is about 500 km for FR and 400 km for RR measurements. The only exceptions occur at the altitudes around 45 km as well as at the uppermost altitudes. This implies that the horizontal resolution is generally limited by the horizontal sampling of the measurements and not by the horizontal information smearing. Moreover, the information displacement is also fairly small, mostly below 100 km for CH4 and below 125 km for N2O, which is well below the horizontal distance between two limb scans. Nevertheless, in atmospheric situations with strong horizontal gradients, like at the boundary of the polar vortices, this displacement might be an issue and should be considered for, e.g., comparisons to highly resolving models.
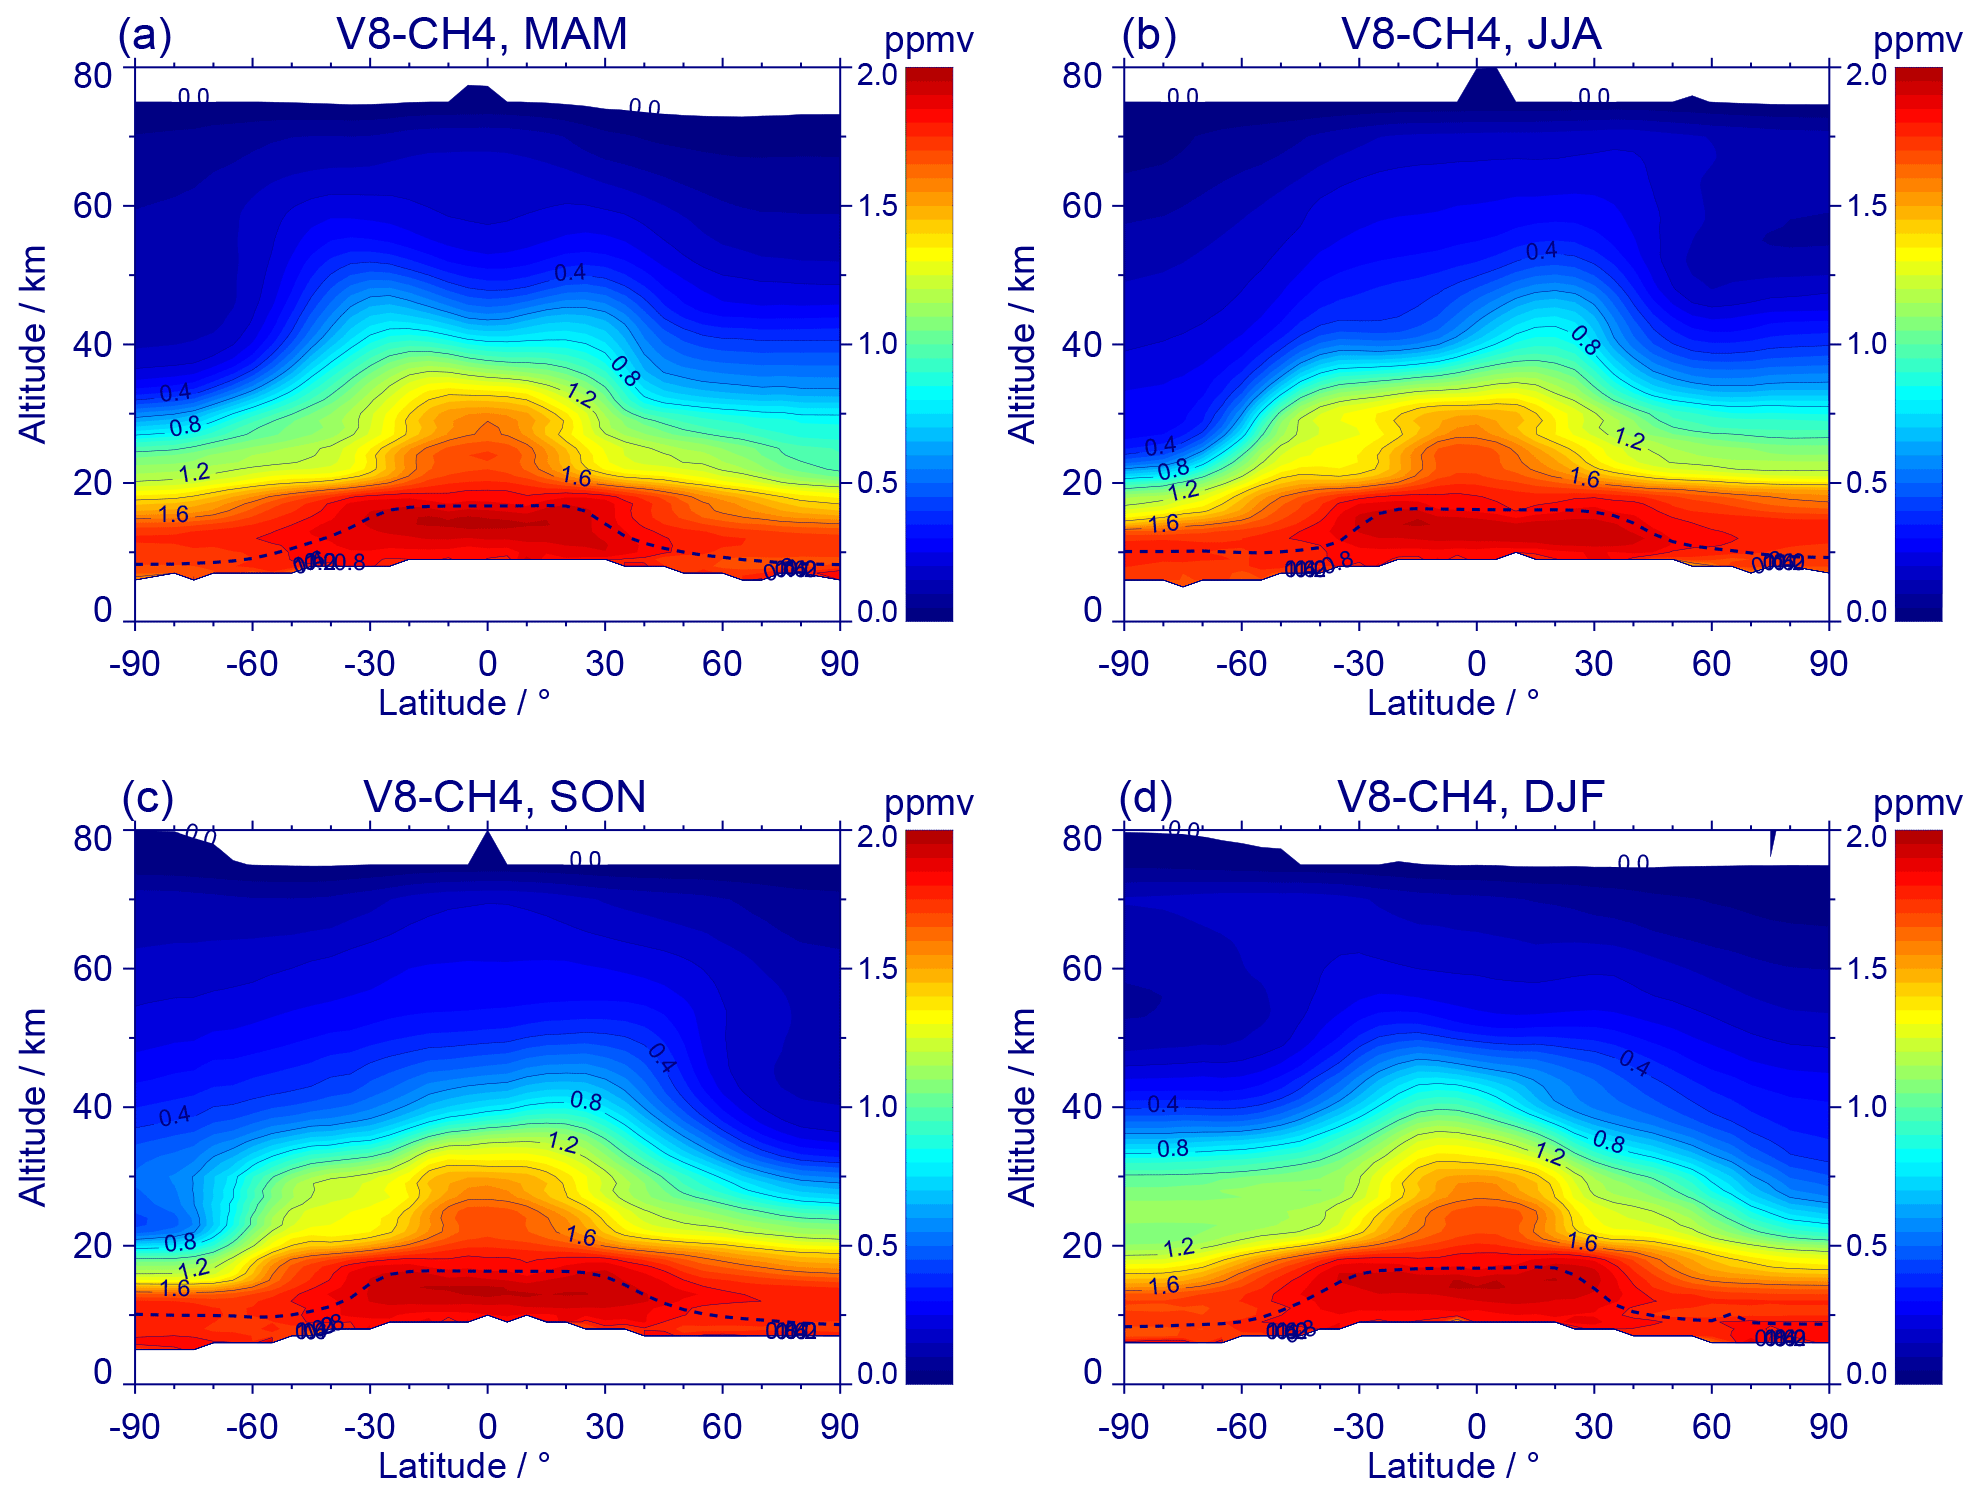
Figure 4Zonal-mean seasonal composites of V8-CH4 retrieved from NOM FR and NOM RR measurements (2002–2012) during March to May (a), June to August (b), September to November (c) and December to February (d). The dotted line indicates the seasonal mean thermal tropopause.
5.1 Seasonal composites
In Figs. 4 and 5 we show zonal-mean seasonal composites of CH4 and N2O retrieved in the NOM HR and NOM RR modes (V8H_CH4_61, V8R_CH4_161, V8R_CH4_261, V8H_N2O_61, V8R_N2O_161, V8R_N2O_261) during the period 2002–2012. Both distributions exhibit the typical features of a tropospheric trace gas with maximum VMRs in the troposphere, strong upwelling in the tropics with sharp latitudinal gradients at ± 20° in the lower to middle stratosphere (so-called tropical pipe; Plumb, 1996) and downwelling above the winter poles. The tropospheric VMRs are somewhat higher between 40° S and 40° N than at higher latitudes, namely by 0.1–0.2 ppmv for CH4 and by 20–30 ppbv for N2O.
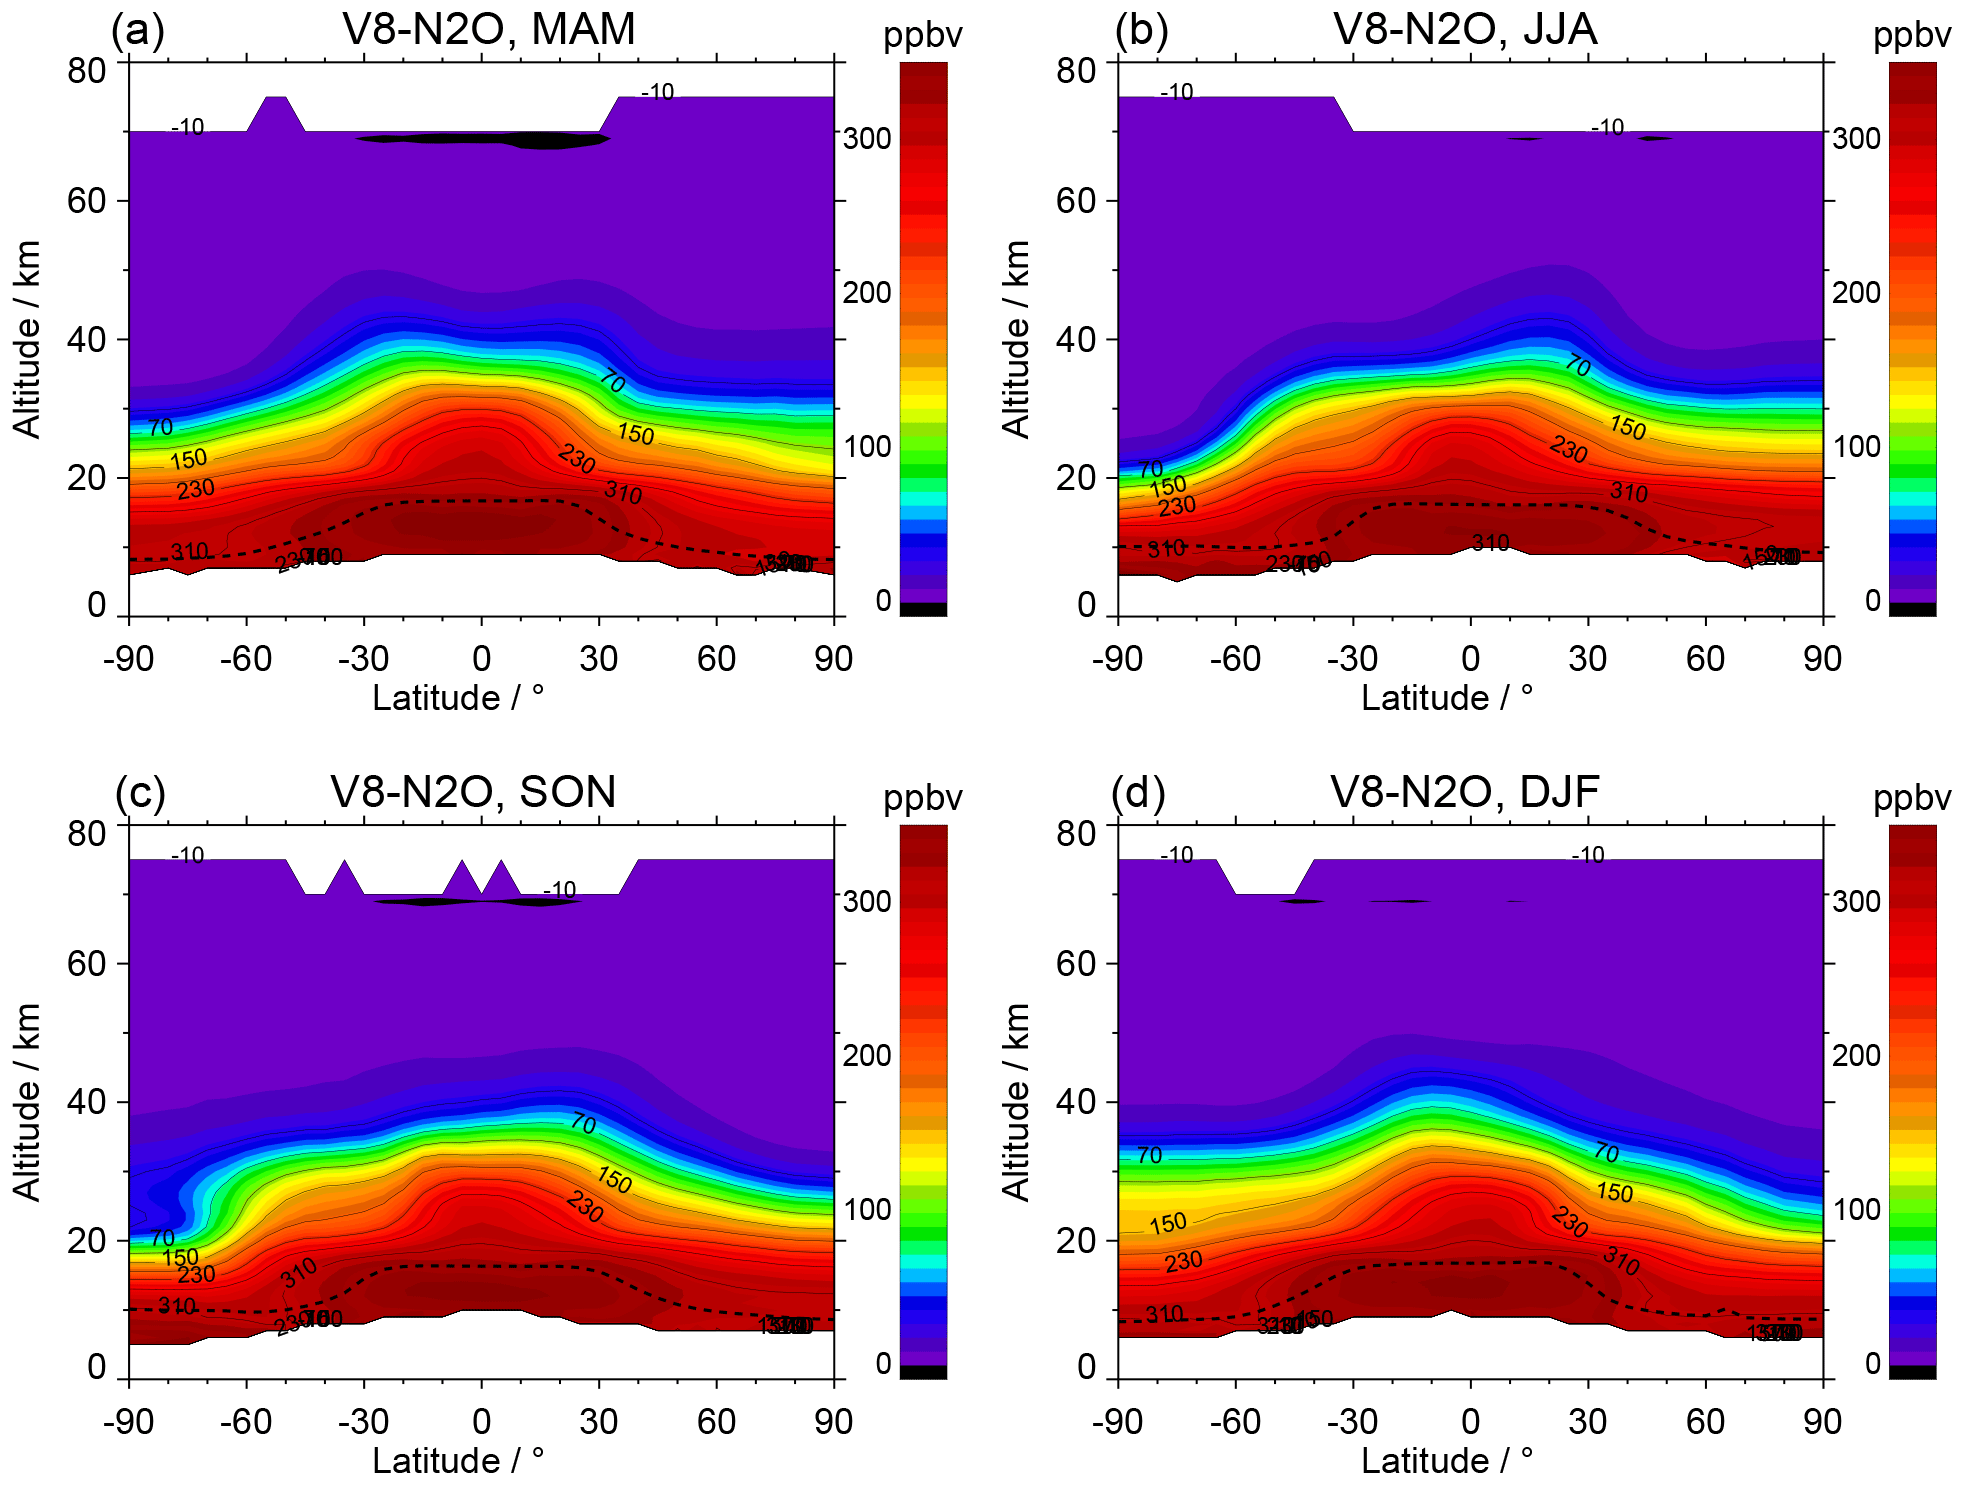
Figure 5Zonal-mean seasonal composites of V8 N2O retrieved from NOM FR and NOM RR measurements (2002–2012) during March to May (a), June to August (b), September to November (c) and December to February (d). The dotted line indicates the seasonal mean thermal tropopause.
The upwelling in the tropical lower to middle stratosphere exhibits slight latitudinal asymmetries characterized by a “nose” in the 1.6 ppmv contour line of CH4, which, e.g., during boreal and austral summer indicates transport towards the respective winter hemisphere. At higher altitudes there are larger-scale seasonal differences. During March to May, for both gases, a double peak is visible at 40–50 km with maxima at 30° S and 30° N and a local minimum at the Equator. This feature has already been detected in CH4 measurements of the Stratospheric And Mesospheric Sounder (SAMS) from 1979 on the NIMBUS 7 satellite (Jones and Pyle, 1984). The sharp meridional gradient in stratospheric CH4 around 60° S, with very low VMRs extending much further down than at northern high latitudes, reflects the beginning formation of the Antarctic vortex. During June to August the southern tropical peak above 40 km has disappeared both for CH4 and N2O and is replaced by a kind of shoulder in the altitude range 30–40 km. Just below, the weak vertical and meridional gradient, identifiable, e.g., from the wide distance between the 1.4 and 1.2 ppmv methane isolines, marks the formation of a pronounced surf zone in the southern winter hemisphere. In contrast, the northern peak has expanded even more upwards, showing the beginning formation of the Brewer–Dobson cell of the next northern winter. Caused by progressed subsidence in the Antarctic vortex, low CH4 and N2O VMRs have subsided further downward at high southern latitudes. During September to November, the northern tropical maximum is at somewhat lower altitudes than during summer. In the altitude range of 30–40 km, there is a moderate southward decline of the contour lines up to the edge of the Antarctic vortex at 70° S, which still exists below 30 km. In the upper stratosphere, the Antarctic vortex has largely been replaced by midlatitude air masses. In the Northern Hemisphere the beginning of the buildup of the Arctic vortex is visible in the upper stratosphere. The period December to February has several similarities to June to August, if mirrored at the Equator. Above 40 km there is a maximum at 20° S but not quite as distinct as the northern tropical maximum during boreal summer. The Arctic vortex reflects progressed subsidence but not as strong as its southern hemispheric counterpart during June to August.
5.2 Major improvements with respect to preceding versions
To illustrate improvements achieved with respect to convergence failures and profile oscillations, we compare latitude–height cross sections of CH4 data versions V5R_CH4_224 and V8R_CH4_261 for two selected orbits (Fig. 6). The top row shows the CH4 distribution along orbit 29041 of 19 September 2007. With the old setup, convergence was not achieved for seven scans through the Antarctic vortex marked by white vertical stripes (Fig. 6a). However, due to the use of the oscillation detector and modeling of horizontal CH4 and N2O gradients, the number of non-converged scans is reduced to just one with the V8 retrieval setup (Fig. 6b). In general, this treatment leads to a much larger fraction of converged retrievals. For FR measurements, the portion of non-converged retrievals is reduced from 8.4 % to 0.3 %. For RR measurements, this number is lowered from 0.36 % to 0.10 %. While for RR measurements the fraction of non-converged retrievals had also been rather low for the previous dataset, it has to be considered that these – like in our example – were not randomly distributed but associated with situations characterized by large horizontal inhomogeneities, such as vortex boundary conditions, where they cause sizable data gaps. Hence, this reduction in non-converged profiles is a significant improvement.
The use of horizontal CH4 and N2O gradients also leads to smoother profiles at geolocations, where formerly retrieved profiles had been strongly oscillating. This, e.g., can be seen in the CH4 distributions along orbit 30832 of 23 January 2008 (bottom row). For this orbit, retrievals are especially complicated at the edge of the inclined Arctic vortex around 70° N, where vertical profiles have local maxima around 30 km. In this region the dataset V5R_CH4_224 exhibits strong oscillations (Fig. 6c), which have disappeared in the V8 data (Fig. 6d). For a more detailed picture, Fig. 7 shows single CH4 profiles for two scans in this critical region. While the V5R profiles are strongly oscillating between 20 and 30 km with unphysically high vertical frequency, the V8R profiles are much smoother in this height region.
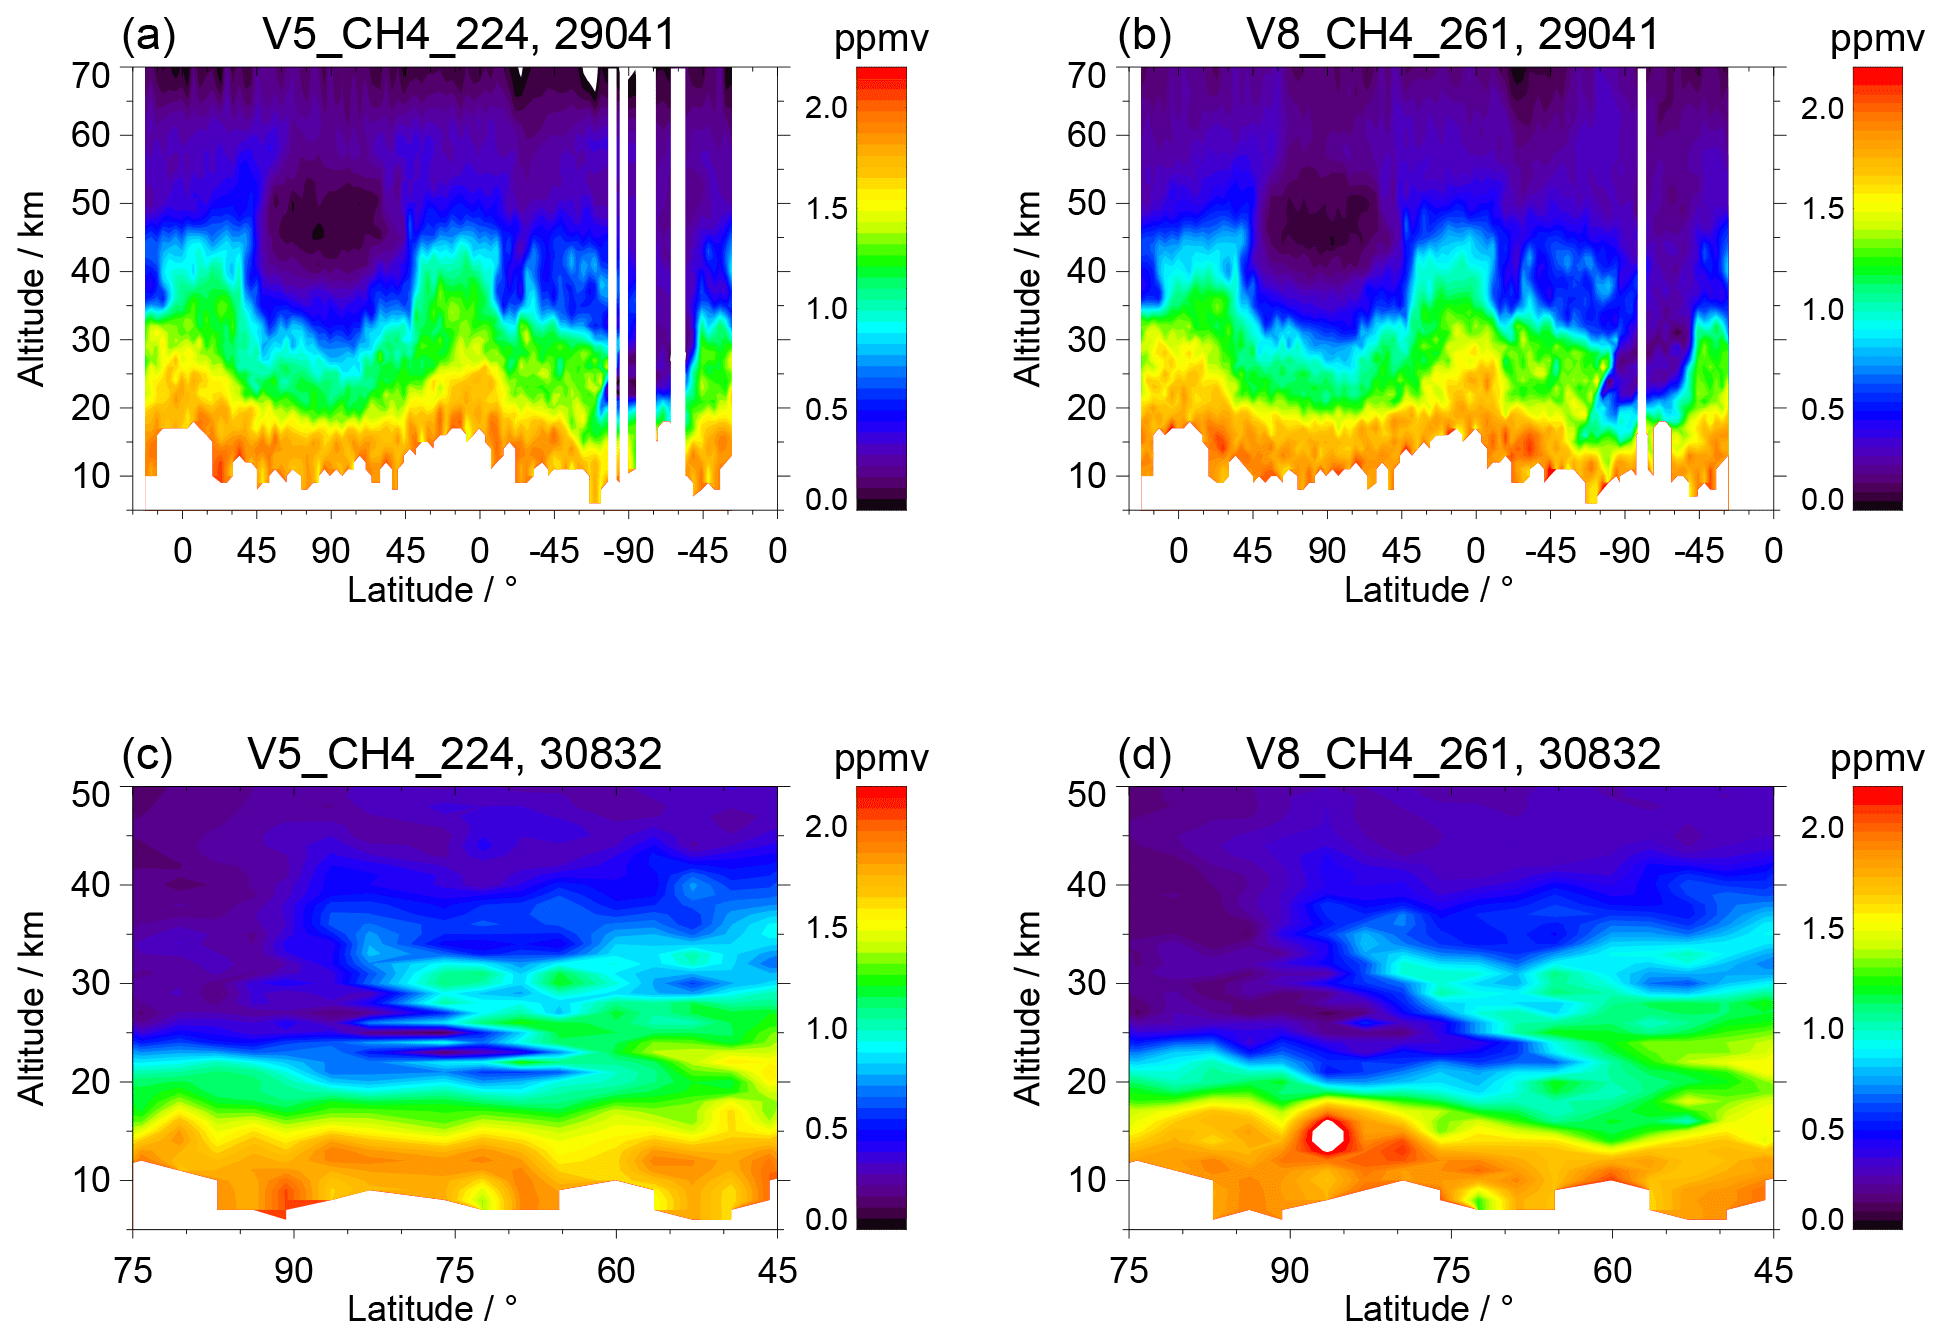
Figure 6(a) Latitude–height cross section of CH4 version V5R_CH4_224, measured on 19 September 2007, along orbit 29041. The white areas around 90° S represent scans with non-converged retrievals. (b) Same as (a) but for version V8R_CH4_261, where the number of non-converged scans has reduced to one. (c) Latitude–height cross section of CH4 version V5R_CH4_224, measured on 23 January 2008, along the northern part of orbit 30832. Around 75° N at the descending part of the orbit (90–45° N) there are strongly oscillating profiles. (d) Same as (c) but for version V8R_CH4_261. The profiles around 75° N are considerably smoother.
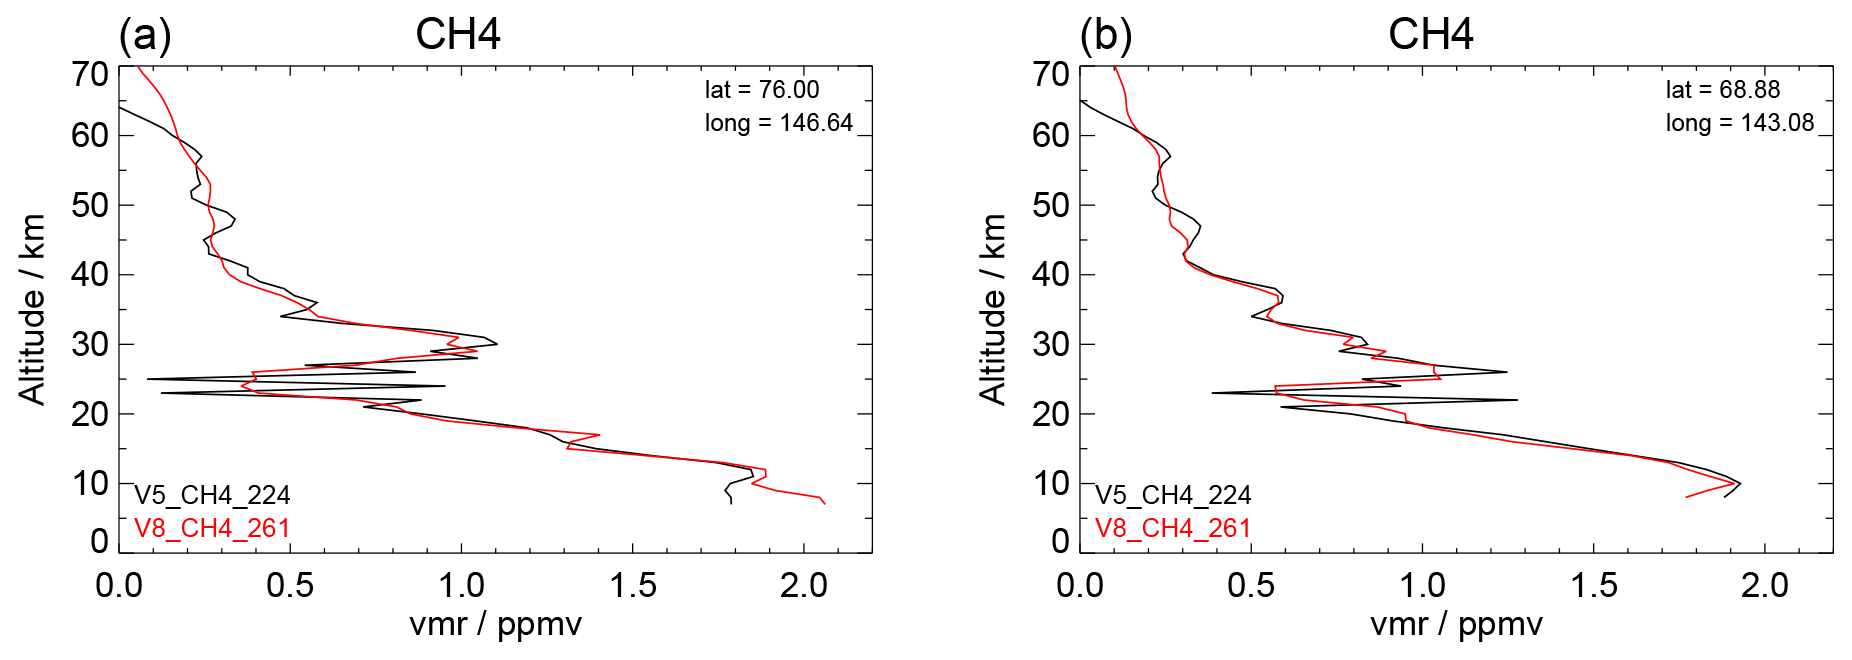
Figure 7CH4 profiles of orbit 30832, obtained at (a) 76.00° N and at (b) 68.88° N with retrieval setups V5R_CH4_224 (black) and V8R_CH4_261 (red). The new retrieval setup including horizontal CH4 and N2O gradients leads to considerably reduced oscillations.
5.3 Delta validation
The previous CH4 and N2O datasets were extensively validated by comparison with other satellite data and ground-based measurements (Plieninger et al., 2016). The outcome of this validation was that, below 25 km, there was likely a positive bias against other satellite measurements: 0.1 to 0.2 ppmv for CH4 and up to 30 ppbv for N2O. To check if the positive bias is still present in the V8 datasets, we limit ourselves to a delta validation against the preceding dataset. That is to say, instead of validating the new data product from the scratch, we analyze the degree to which issues identified in Plieninger et al. (2016) are removed or increased in the new data product.
Figure 8 (top row) shows zonal-mean differences between V8 and V5 CH4, averaged over the full-resolution period and the reduced-resolution period. We abstain from presenting seasonal composites because apart from the Antarctic region, the differences are rather similar in every season. The deviations between the FR data (Fig. 8a) consist of oscillations of up to ± 0.15 ppmv in the altitude range of 5–40 km and smaller oscillations above. The positive differences at 30 km apparently increase the bias between V5 data and validation experiments at this altitude shown by Plieninger et al. (2016, their Figs. 9, 10, 11), while the negative differences at 40 km have the opposite effect. At lower altitudes, a delta validation becomes more ambiguous because the V8–V5 differences are latitude-dependent. At 20 km they are negative at low latitudes and positive at high northern latitudes, but at 10 km it is the opposite. Thus, at 20 km there seems to be better agreement with the validation experiments in the tropics and a deterioration in the northern extra-tropics, but at 10 km it seems to be the other way round. Except for the lowermost altitudes, the differences at high southern latitudes are mostly negative up to the altitude of 40 km, which generally tends to improve the agreement with validation experiments.
The CH4 differences of the RR period (Fig. 8b) show some similar features to those of the FR period, namely negative values at 40 km and positive values at 30 km. However, there are also clear deviations: first, a much broader band of positive differences at the lower end of the latitudinal cross section as well as positive values between 10 and 20 km, extending from the tropics towards midlatitudes. Second, there is better agreement at high southern latitudes above 20 km. The positive differences below 20 km lead to an increase in the high bias of ∼ 0.15 ppmv in this altitude region shown in Plieninger et al. (2016) by about 0.1 ppmv. The negative difference between 35 and 45 km compensates for a slight positive bias in the previous CH4 dataset. The positive bias above 65 km is due to a deficiency in the V5 data, which exhibit a kink in the profile shape at this altitude. In summary the CH4 bias at all altitudes is well below the total error presented in Sect. 4.1.
The V8–V5 differences in N2O of the FR period (Fig. 8c) are spatially well correlated with those of CH4. Slight deviations are a small downward shift of the mid-stratospheric positive differences to 27 km and restriction to the tropics. The negative differences at 10 km lead to a reduction of the high bias of the V5 data at this altitude against ACE-FTS (Plieninger et al., 2016, their Fig. 13) by ∼ 15 ppbv. The small negative differences just below 20 km and the positive differences around 27 km apparently also reduce the bias against ACE-FTS, while the positive V8–V5 differences at 20 km rather lead to an increased bias.
The main differences between V8 and V5 N2O of the RR period (Fig. 8d) are a nearly global band of up to 20 ppbv oscillating between 10 and 20 km and a region of up to 15 ppbv at tropical and midlatitudes around 27 km. The negative differences at 10 km are much weaker than for the FR period. There are also some spatial correlations with the V8–V5 differences in CH4 of the RR period. Generally, the positive V8–V5 differences lead to an enhancement of the high bias against ACE-FTS and MLS as presented in Plieninger et al. (2016) for the altitude region below 30 km. At the altitudes of 10 km in the tropics, this might cause an increase in the bias against ACE-FTS from 25 to 40 ppbv. This bias is larger than the total N2O error presented in Sect. 4.1 for the lowermost altitudes.
Since there is a generally good consistency between V5 data of the FR and RR periods both for CH4 and N2O, the deviations between the left-hand (panels a and c) and the right-hand plots (panels b and d) in Fig. 8, especially in the lower atmosphere, indicate an offset in the volume mixing ratios between the V8 data of the two periods. The deviations are largest at high latitudes around 10 km and in the tropics around 15 km, with CH4 differences between RR and FR data of 10 %–15 % and of 5 %, respectively. For N2O, the respective RR–FR differences are 7 % and 2 %. However, at higher altitudes the consistency between V8 RR and FR data is good.
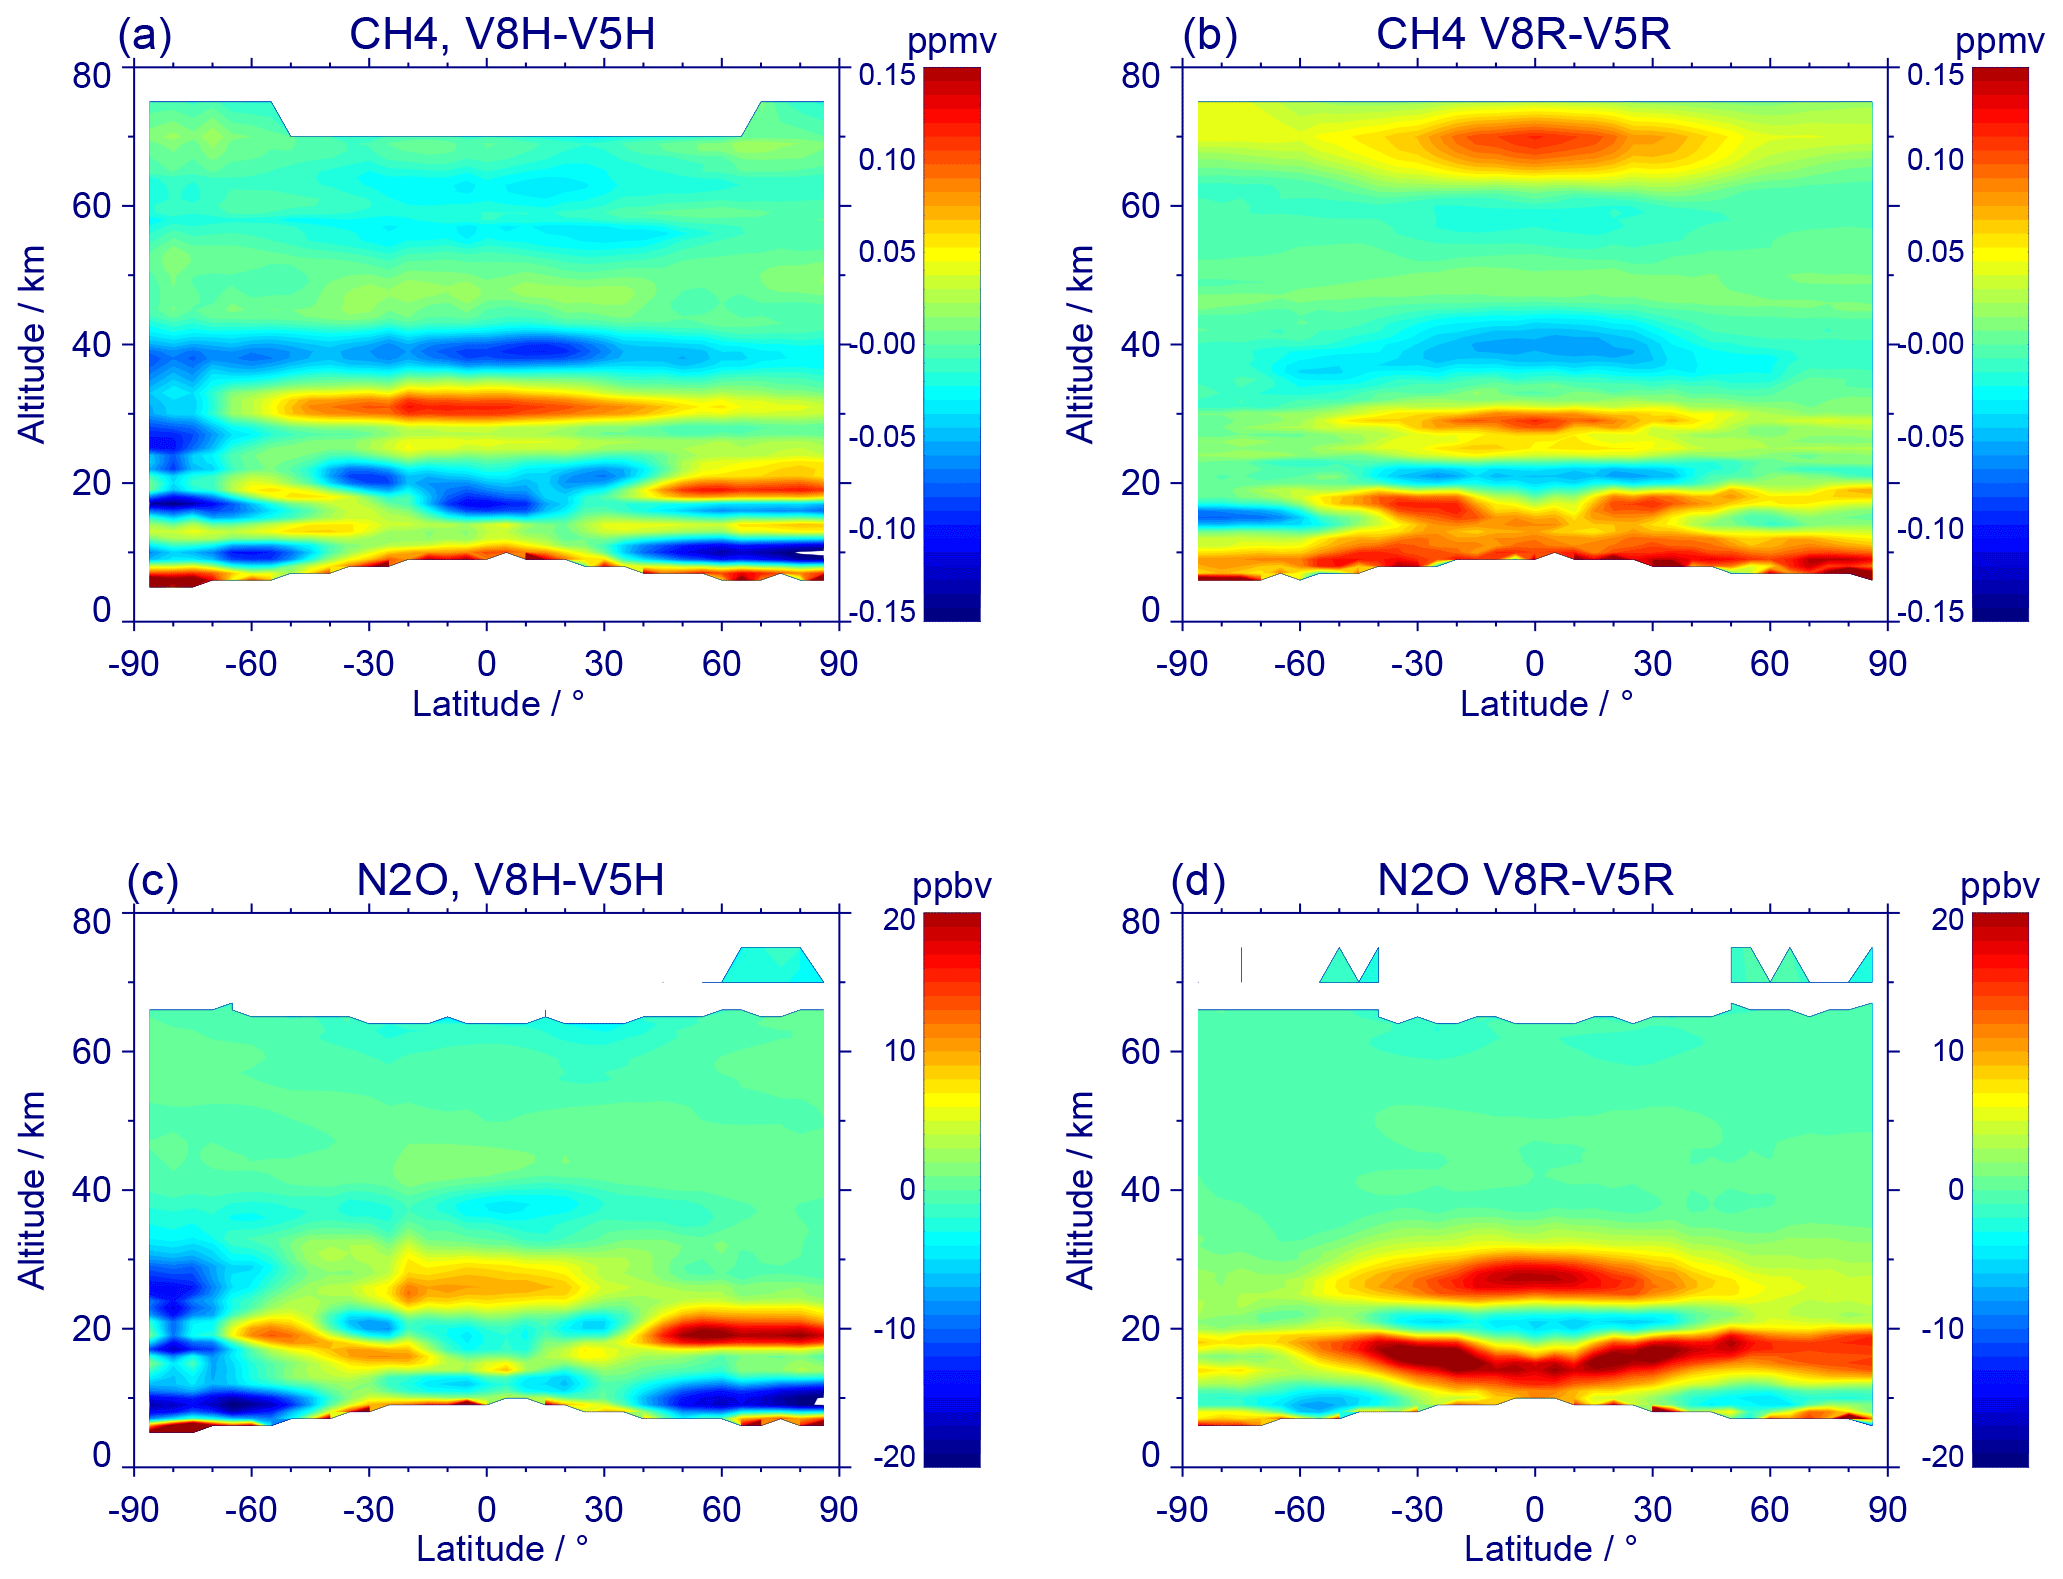
Figure 8(a) Zonal-mean differences between MIPAS V8 and V5 CH4 measurements at full (FR) spectral resolution (V8H_CH4_61, V5H_CH4_21) averaged over the period July 2002 to March 2004. (b) Zonal-mean differences between MIPAS V8 and V5 CH4 measurements at reduced (RR) spectral resolution (V8R_CH4_161, V5R_CH4_261, V5R_CH4_120, V5R_CH4_224/225) averaged over the period January 2005 to April 2012. Panels (c) and (d) are the same as the top row but for N2O.
5.4 Coarse grid results
Quantitative application of the standard CH4 and N2O results obtained from regularized retrievals requires educated data users, who are familiar with the averaging kernel formalism. In order to make the use of MIPAS data within comparisons to model data easier, we provide an alternative representation on a coarser vertical grid of 23 pressure levels: 1000, 700, 400, 250, 150, 100, 50, 30, 15, 10, 5, 3, 1.5, 1, 0.5, 0.3, 0.1, 0.03, 0.01, 0.003, 0.001, 0.0003, and 0.00003 hPa. These values are a subset of a grid often used by chemistry-climate modelers (Eyring et al., 2013). In this representation, all information on the vertical resolution is included in the vertical grid, and no averaging kernels need to be considered (von Clarmann et al., 2015). These data are generated by maximum likelihood retrievals on a vertical grid coarse enough that effectively no regularization is required. The averaging kernels associated with these retrievals are unity by definition. Contrary to the standard retrievals which represent mixing ratios at levels, and where linear variation in altitude is assumed between the levels, the coarse grid data are given as mean layer values. The boundaries of these layers are defined by pressure values, and the grid is constant for the entire dataset. This makes interpolation unnecessary and simplifies comparison with model results or time series analysis.
In Fig. 9 we compare the results of the standard (left) and of the coarse grid retrieval (right) for orbit 30863 from 25 January 2008. The main spatial features detected in the standard retrieval are also resolved in the coarse grid retrieval for CH4 (top row) as well as for N2O (bottom row). However, due to the coarser vertical grid, very fine spatial structures become blurry. This, e.g., becomes apparent in the CH4 distribution at and above 30 km (10 hPa) in the region of the Arctic vortex north of 60° N.
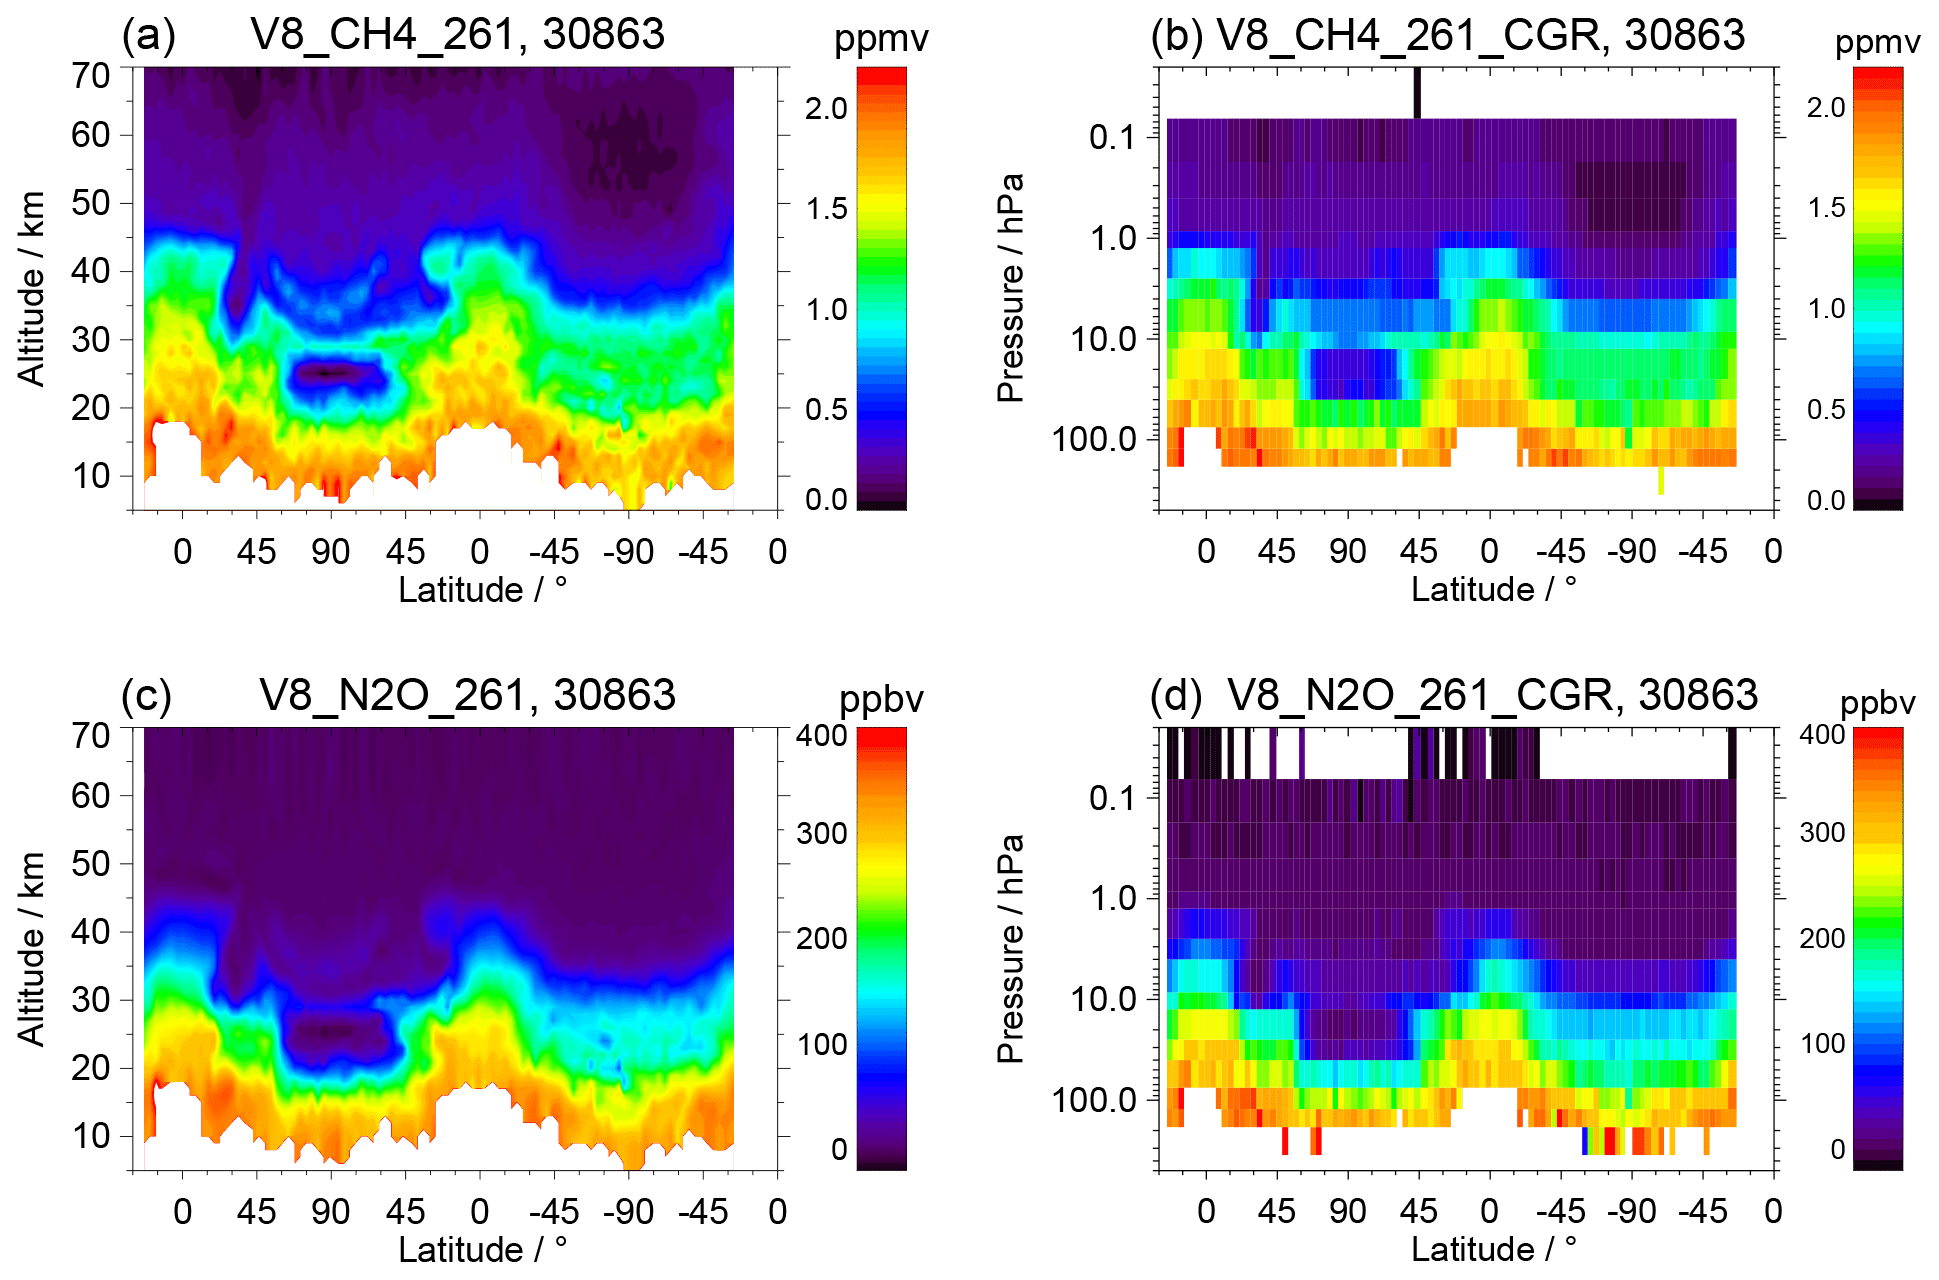
Figure 9(a) Latitude–height cross section of standard CH4 retrieval (V8R_CH4_261) from measurements on 25 January 2008, along orbit 30863. (b) Corresponding coarse grid retrieval. Panels (c) and (d) are the same as the top row but for N2O.
We presented MIPAS IMK–IAA methane and nitrous oxide data based on the most recent version-8 level-1b spectra and processed using an improved retrieval approach. After description of the new retrieval setup, we performed a comprehensive error assessment considering the formalism outlined in the TUNER report (von Clarmann et al., 2020). Due to the large uncertainties in line intensity given in HITRAN2016 – which probably are too pessimistic – the total CH4 error is between 21 % and 34 % in the altitude range 6–68 km for the atmospheric scenario presented (northern midlatitude summer day). For the same atmospheric conditions, the total N2O error grows from 7 % at 12 km to 17 % at 45 km. At the altitudes above, the error increases strongly due to very low N2O signatures. We consider MIPAS version-V8 CH4 and N2O data versions as superior over preceding versions. The main reasons are the following:
-
The data are based on better-calibrated level-1B spectra. In particular, trends are supposed to be less affected by instrumental drifts.
-
The vertical resolution generally is better than that of the preceding version. This has been achieved by use of more CH4 and N2O lines in the retrieval setup.
-
The fraction of converged retrievals has been increased. This has been achieved by application of an oscillation detector within the iterations of the retrieval and by additional retrieval of horizontal CH4 and N2O gradients. In particular, in situations where the line of sight crossed the boundary of the polar vortex, i.e., where, due to polar subsidence, very different mixing ratios were encountered at the same altitude in front of and behind the tangent point, non-consideration of the oscillation detector and of horizontal gradients had prevented retrievals from converging.
However, below 10 km, the V8_CH4_261 retrievals at all latitudes result in up to 0.1 ppmv higher volume mixing ratios than the already high biased V5 data. The same applies for the altitude regions around 15 and 25–30 km at low latitudes and midlatitudes. On the other hand the agreement with validation experiments seems to be improved at 20 and 40 km. For V8_CH4_61 retrievals the positive differences to the V5 data below 10 km and around 15 km are less pronounced. For V8R_N2O_261 retrievals the high bias in V5 N2O is increased by up to 20 ppbv in a nearly global band oscillating between 10 and 20 km altitude and by up to 15 ppbv at low latitudes around 27 km. For V8H_N2O_61 retrievals the increase in the bias in these regions is clearly less distinct. Further, the negative differences between the FR data at 10 km reduce the high bias in V5 N2O found at this altitude.
We suspect that the high bias of both gases to a large part might be due to the spectroscopic data used, which suffer from large uncertainties. The high bias of N2O presumably has additional yet unidentified causes, since it clearly exceeds the reported spectroscopic uncertainties. Further, we attribute the observed oscillations in the V8–V5 differences, which are partly correlated between CH4 and N2O, to the better vertical resolution in V8 profiles.
The problem of uncertain spectroscopic data is not so severe in the case of ground-based and a couple of spaceborne instruments that measure CH4 in solar absorption using the ν3 band near 3000 cm−1. A lot of work went into improving the accuracy of the spectroscopic data in that region. Emission spectroscopy, however, has to use longer wavelengths where the Planck function at terrestrial temperatures has values, which are high enough to provide a sufficiently large signal. We urge the spectroscopic community to devote a similar effort to the ν4 region to improve satellite measurements of CH4 by emission instruments.
MIPAS CH4 and N2O data can be downloaded from the KITopen repository (https://doi.org/10.35097/1948, Glatthor et al., 2024a, and https://doi.org/10.35097/1949, Glatthor et al., 2024b, respectively).
The supplement related to this article is available online at: https://doi.org/10.5194/amt-17-2849-2024-supplement.
NG developed the retrieval setup and finalized the paper. TvC wrote the initial draft of the paper. Together with GPS, he organized the related activities. BF developed the retrieval setup for middle- and upper-atmosphere measurement modes. MGC and MLP contributed to non-LTE-related issues. UG coded and maintained the retrieval software. MH helped to solve problems with the horizontal averaging kernels. SK and ALi performed the retrievals. MK performed the error estimation. ALa and GPS identified deficiencies in previous data versions fixed in the current version. All authors discussed strategies and results and contributed to the writing of the paper.
At least one of the (co-)authors is a member of the editorial board of Atmospheric Measurement Techniques. The peer-review process was guided by an independent editor, and the authors also have no other competing interests to declare.
Publisher’s note: Copernicus Publications remains neutral with regard to jurisdictional claims made in the text, published maps, institutional affiliations, or any other geographical representation in this paper. While Copernicus Publications makes every effort to include appropriate place names, the final responsibility lies with the authors.
This article is part of the special issue “IMK–IAA MIPAS version 8 data: retrieval, validation, and application (ACP/AMT inter-journal SI)”. It is not associated with a conference.
Spectra used for this work were provided by the European Space Agency. We would like to thank the MIPAS Quality Working Group for enlightening discussions and Claus Zehner for helpful support. A large number of the prefit profiles used for the CH4 and N2O retrievals discussed here are based upon computations done in the frame of a Bundesprojekt (grant MIPAS_V7) on the Cray XC40 “Hazel Hen” of the High-Performance Computing Center Stuttgart (HLRS) of the University of Stuttgart. The IAA team acknowledges financial support from the Agencia Estatal de Investigación of the Ministerio de Ciencia, Innovación y Universidades, through the project PID2019-110689RB-I00, as well as the Centre of Excellence “Severo Ochoa” award to the Instituto de Astrofísica de Andalucía (CEX2021-001131-S).
This research has been supported by the Bundesministerium für Wirtschaft und Energie (grant no. 50EE1547 (SEREMISA)).
The article processing charges for this open-access publication were covered by the Karlsruhe Institute of Technology (KIT).
This paper was edited by Christian von Savigny and reviewed by Chris Boone and two anonymous referees.
Brasseur, G. and Solomon, S.: Aeronomy of the Middle Atmosphere–Chemistry and Physics of the Stratosphere and Mesosphere, Atmospheric and Oceanographic Sciences Library 32, Springer, P.O. Box 17, 3300 AA Dordrecht, The Netherlands, ISBN 978-1-4020-3284-4, third edn., https://doi.org/10.1007/1-4020-3824-0, 2005. a
Carlotti, M., Dinelli, B. M., Raspollini, P., and Ridolfi, M.: Geo–fit approach to the analysis of limb–scanning satellite measurements, Appl. Opt., 40, 1872–1885, https://doi.org/10.1364/AO.40.001872, 2001. a
Carlotti, M., Brizzi, G., Papandrea, E., Prevedelli, M., Ridolfi, M., Dinelli, B. M., and Magnani, L.: GMTR: Two–dimensional geo–fit multitarget retrieval model for Michelson Interferometer for Passive Atmospheric Sounding/Environmental Satellite observations, Appl. Opt., 45, 716–727, https://doi.org/10.1364/AO.45.000716, 2006. a
De Mazière, M., Vigouroux, C., Bernath, P. F., Baron, P., Blumenstock, T., Boone, C., Brogniez, C., Catoire, V., Coffey, M., Duchatelet, P., Griffith, D., Hannigan, J., Kasai, Y., Kramer, I., Jones, N., Mahieu, E., Manney, G. L., Piccolo, C., Randall, C., Robert, C., Senten, C., Strong, K., Taylor, J., Tétard, C., Walker, K. A., and Wood, S.: Validation of ACE-FTS v2.2 methane profiles from the upper troposphere to the lower mesosphere, Atmos. Chem. Phys., 8, 2421–2435, https://doi.org/10.5194/acp-8-2421-2008, 2008. a
Dinelli, B. M., Raspollini, P., Gai, M., Sgheri, L., Ridolfi, M., Ceccherini, S., Barbara, F., Zoppetti, N., Castelli, E., Papandrea, E., Pettinari, P., Dehn, A., Dudhia, A., Kiefer, M., Piro, A., Flaud, J.-M., López-Puertas, M., Moore, D., Remedios, J., and Bianchini, M.: The ESA MIPAS/Envisat level2-v8 dataset: 10 years of measurements retrieved with ORM v8.22, Atmos. Meas. Tech., 14, 7975–7998, https://doi.org/10.5194/amt-14-7975-2021, 2021. a
Eyring, V., Lamarque, J.-F., Hess, P., Arfeuille, F., Bowman, K., Chipperfield, M. P., Duncan, B., Fiore, A., Gettelman, A., Giorgetta, M. A., Granier, C., Hegglin, M., Kinnison, D., Kunze, M., Langematz, U., Luo, B., Martin, R., Matthes, K., Newman, P. A., Peter, T., Robock, A., Ryerson, T., Saiz-Lopez, A., Salawitch, R., Schultz, M., Shepherd, T. G., Shindell, D., Staehelin, J., Tegtmeier, S., Thomason, L., Tilmes, S., Vernier, J.-P., Waugh, D. W., and Young, P. J.: Overview of IGAC/SPARC Chemistry–Climate Model Initiative (CCMI) Community Simulations in Support of Upcoming Ozone and Climate Assessments, SPARC Newsletter, 40, 48–66, http://www.aparc-climate.org/wp-content/uploads/2017/12/SPARCnewsletter_No40_Jan2013_web.pdf (last access: 29 April 2024), 2013. a
Fischer, H., Birk, M., Blom, C., Carli, B., Carlotti, M., von Clarmann, T., Delbouille, L., Dudhia, A., Ehhalt, D., Endemann, M., Flaud, J. M., Gessner, R., Kleinert, A., Koopman, R., Langen, J., López-Puertas, M., Mosner, P., Nett, H., Oelhaf, H., Perron, G., Remedios, J., Ridolfi, M., Stiller, G., and Zander, R.: MIPAS: an instrument for atmospheric and climate research, Atmos. Chem. Phys., 8, 2151–2188, https://doi.org/10.5194/acp-8-2151-2008, 2008. a, b
Funke, B., López-Puertas, M., von Clarmann, T., Stiller, G. P., Fischer, H., Glatthor, N., Grabowski, U., Höpfner, M., Kellmann, S., Kiefer, M., Linden, A., Mengistu Tsidu, G., Milz, M., Steck, T., and Wang, D. Y.: Retrieval of stratospheric NOx from 5.3 and 6.2 μm nonlocal thermodynamic equilibrium emissions measured by Michelson Interferometer for Passive Atmospheric Sounding (MIPAS) on Envisat, J. Geophys. Res., 110, D09302, https://doi.org/10.1029/2004JD005225, 2005. a, b
Funke, B., García-Comas, M., López-Puertas, M., Glatthor, N., Stiller, G. P., von Clarmann, T., Semeniuk, K., and McConnell, J. C.: Enhancement of N2O during the October–November 2003 solar proton events, Atmos. Chem. Phys., 8, 3805–3815, https://doi.org/10.5194/acp-8-3805-2008, 2008. a
Funke, B., López-Puertas, M., García-Comas, M., Kaufmann, M., Höpfner, M., and Stiller, G. P.: GRANADA: A Generic RAdiative traNsfer AnD non-LTE population algorithm, J. Quant. Spectrosc. Radiat. Transfer, 113, 1771–1817, https://doi.org/10.1016/j.jqsrt.2012.05.001, 2012. a
Funke, B., López-Puertas, M., Stiller, G. P., and von Clarmann, T.: Mesospheric and stratospheric NOy produced by energetic particle precipitation during 2002–2012, J. Geophys. Res.-Atmos., 119, 4429–4446, https://doi.org/10.1002/2013JD021404, 2014. a
Glatthor, N., von Clarmann, T., Fischer, H., Funke, B., Grabowski, U., Höpfner, M., Kellmann, S., Kiefer, M., Linden, A., Milz, M., Steck, T., Stiller, G. P., Mengistu Tsidu, G., and Wang, D. Y.: Mixing processes during the Antarctic vortex split in September/October 2002 as inferred from source gas and ozone distributions from ENVISAT-MIPAS, J. Atmos. Sci., 62, 787–800, https://doi.org/10.1175/JAS-3332.1, 2005. a
Glatthor, N., von Clarmann, T., Fischer, H., Funke, B., Grabowski, U., Höpfner, M., Kellmann, S., Kiefer, M., Linden, A., Milz, M., Steck, T., and Stiller, G. P.: Global peroxyacetyl nitrate (PAN) retrieval in the upper troposphere from limb emission spectra of the Michelson Interferometer for Passive Atmospheric Sounding (MIPAS), Atmos. Chem. Phys., 7, 2775–2787, https://doi.org/10.5194/acp-7-2775-2007, 2007. a, b
Glatthor, N., von Clarmann, T., Stiller, G. P., Funke, B., Koukouli, M. E., Fischer, H., Grabowski, U., Höpfner, M., Kellmann, S., and Linden, A.: Large-scale upper tropospheric pollution observed by MIPAS HCN and C2H6 global distributions, Atmos. Chem. Phys., 9, 9619–9634, https://doi.org/10.5194/acp-9-9619-2009, 2009. a, b
Glatthor, N., von Clarmann, T., Funke, B., García-Comas, M., Grabowski, U., Höpfner, M., Kellmann, S., Kiefer, M., Laeng, A., Linden, A., López-Puertas, M., and Stiller, G. P.: IMK/IAA MIPAS retrievals version 8: CH4, the data set, Karlsruhe Institute of Technology [data set], https://doi.org/10.35097/1948, 2024a. a
Glatthor, N., von Clarmann, T., Funke, B., García-Comas, M., Grabowski, U., Höpfner, M., Kellmann, S., Kiefer, M., Laeng, A., Linden, A., López-Puertas, M., and Stiller, G. P.: IMK/IAA MIPAS retrievals version 8: N2O, the data set, Karlsruhe Institute of Technology [data set], https://doi.org/10.35097/1949, 2024b. a
Gordon, I. E., Rothman, L. S., Hill, C., Kochanov, R. V., Tan, Y., Bernath, P. F., Birk, M., Boudon, V., Campargue, A., Chance, K. V., Drouin, B. J., Flaud, J.-M., Gamache, R. R., Hodges, J. T., Jacquemart, D., Perevalov, V. I., Perrin, A., Shine, K. P., Smith, M.-A. H., Tennyson, J., Toon, G. C., Tran, H., Tyuterev, V. G., Barbe, A., Császár, A. G., Devi, V. M., Furtenbacher, T., Harrison, J. J., Hartmann, J.-M., Jolly, A., Johnson, T. J., Karman, T., Kleiner, I., Kyuberis, A. A., Loos, J., Lyulin, O. M., Massie, S. T., Mikhailenko, S. N., Moazzen-Ahmadi, N., Müller, H. S. P., Naumenko, O. V., Nikitin, A. V., Polyansky, O. L., Rey, M., Rotger, M., Sharpe, S. W., Sung, K., Starikova, E., Tashkun, S. A., Vander Auwera, J., Wagner, G., Wilzewski, J., Wcisło, P., Yu, S., and Zak, E. J.: The HITRAN 2016 molecular spectroscopic database, J. Quant. Spectrosc. Radiat. Transfer, 203, 3–69, https://doi.org/10.1016/j.jqsrt.2017.06.038, 2017. a, b, c, d, e, f, g, h, i, j
Grooß, J.-U. and Russell III, J. M.: Technical note: A stratospheric climatology for O3, H2O, CH4, NOx, HCl and HF derived from HALOE measurements, Atmos. Chem. Phys., 5, 2797–2807, https://doi.org/10.5194/acp-5-2797-2005, 2005. a
Gunson, M. R., Abbas, M. M., Abrams, M. C., Allen, M., Brown, L. R., Brown, T. L., Chang, A. Y., Goldman, A., Irion, F. W., Lowes, L. L., Mahieu, E., Manney, G. L., Michelsen, H. A., Newchurch, M. J., Rinsland, C. P., Salawitch, R. J., Stiller, G. P., Toon, G. C., Yung, Y. L., and Zander, R.: The Atmospheric Trace Molecule Spectroscopy (ATMOS) experiment: Deployment on the ATLAS Space Shuttle missions, Geophys. Res. Lett., 23, 2333–2336, https://doi.org/10.1029/96GL01569, 1996. a
Hase, F.: The instrument line shape of MIPAS, Oral presentation at the 2nd MIPAS Quality Working Group Meeting, Florence, 3 Dec. 2003, 2003. a, b
Hegglin, M. I. and Tegtmeier, S. (Eds.): The SPARC Data Initiative: Assessment of stratospheric trace gas and aerosol climatologies from satellite limb sounders, SPARC Report No. 8, WCRP-5/2017, SPARC, https://doi.org/10.3929/ethz-a-010863911, 2017. a
Höpfner, M., Boone, C. D., Funke, B., Glatthor, N., Grabowski, U., Günther, A., Kellmann, S., Kiefer, M., Linden, A., Lossow, S., Pumphrey, H. C., Read, W. G., Roiger, A., Stiller, G., Schlager, H., von Clarmann, T., and Wissmüller, K.: Sulfur dioxide (SO2) from MIPAS in the upper troposphere and lower stratosphere 2002–2012, Atmos. Chem. Phys., 15, 7017–7037, https://doi.org/10.5194/acp-15-7017-2015, 2015. a, b
Jones, R. L. and Pyle, J. A.: Observations of CH4 and N2O by the NIMBUS 7 SAMS: A comparison with in situ data and two-dimensional numerical model calculations, J. Geophys. Res., 89, 5263–5279, https://doi.org/10.1029/JD089iD04p05263, 1984. a
Kelly, K. K., Chipperfield, M. P., Plane, J. M. C., Feng, W., Sheese, P. E., Walker, K. A., and Boone, C. D.: An Explanation for the Nitrous Oxide Layer Observed in the Mesopause Region, Geophys. Res. Lett., 45, 7818–7827, https://doi.org/10.1029/2018GL078895, 2018. a
Kiefer, M., von Clarmann, T., and Grabowski, U.: State parameter Data Base for MIPAS Data Analysis, Adv. Space Res., 30, 2387–2392, https://doi.org/10.1016/S0273-1177(02)80284-8, 2002. a, b, c, d, e
Kiefer, M., von Clarmann, T., Funke, B., García-Comas, M., Glatthor, N., Grabowski, U., Kellmann, S., Kleinert, A., Laeng, A., Linden, A., López-Puertas, M., Marsh, D. R., and Stiller, G. P.: IMK/IAA MIPAS temperature retrieval version 8: nominal measurements, Atmos. Meas. Tech., 14, 4111–4138, https://doi.org/10.5194/amt-14-4111-2021, 2021. a, b, c, d, e, f, g, h, i, j, k, l, m, n, o, p, q, r, s, t, u, v, w, x, y, z, aa, ab
Kiefer, M., von Clarmann, T., Funke, B., García-Comas, M., Glatthor, N., Grabowski, U., Höpfner, M., Kellmann, S., Laeng, A., Linden, A., López-Puertas, M., and Stiller, G. P.: Version 8 IMK–IAA MIPAS ozone profiles: nominal observation mode, Atmos. Meas. Tech., 16, 1443–1460, https://doi.org/10.5194/amt-16-1443-2023, 2023. a, b, c, d, e, f, g, h, i, j, k, l, m, n, o, p, q, r, s, t, u, v
Kiefer, M., García-Comas, M., Glatthor, N., Funke, B., Grabowski, U., Kellmann, S., Laeng, A., Linden, A., López-Puertas, M., Stiller, G. P., and von Clarmann, T.: Version 8 IMK/IAA MIPAS water vapour profiles, in preparation, 2024. a, b, c
Kleinert, A., Birk, M., Perron, G., and Wagner, G.: Level 1b error budget for MIPAS on ENVISAT, Atmos. Meas. Tech., 11, 5657–5672, https://doi.org/10.5194/amt-11-5657-2018, 2018. a, b, c, d, e, f, g, h, i, j
Laeng, A., Plieninger, J., von Clarmann, T., Grabowski, U., Stiller, G., Eckert, E., Glatthor, N., Haenel, F., Kellmann, S., Kiefer, M., Linden, A., Lossow, S., Deaver, L., Engel, A., Hervig, M., Levin, I., McHugh, M., Noël, S., Toon, G., and Walker, K.: Validation of MIPAS IMK/IAA methane profiles, Atmos. Meas. Tech., 8, 5251–5261, https://doi.org/10.5194/amt-8-5251-2015, 2015. a, b
Lambert, A., Read, W. G., Livesey, N. J., Santee, M. L., Manney, G. L., Froidevaux, L., Wu, D. L., Schwartz, M. J., Pumphrey, H. C., Jimenez, C., Nedoluha, G. E., Cofield, R. E., Cuddy, D. T., Daffer, W. H., Drouin, B. J., Fuller, R. A., Jarnot, R. F., Knosp, B. W., Pickett, H. M., Perun, V. S., Snyder, W. V., Stek, P. C., Thurstans, R. P., Wagner, P. A., Waters, J. W., Jucks, K. W., Toon, G. C., Stachnik, R. A., Bernath, P. F., Boone, C. D., Walker, K. A., Urban, J., Murtagh, D., Elkins, J. W., and Atlas, E.: Validation of the Aura Microwave Limb Sounder middle atmosphere water vapor and nitrous oxide measurements, J. Geophys. Res., 112, D24S36, https://doi.org/10.1029/2007JD008724, 2007. a
Livesey, N. J., Read, W. G., Froidevaux, L., Lambert, A., Manney, G. L., Pumphrey, H. C., Santee, M. L., Schwartz, M. J., Wang, S., Cofeld, R. E., Cuddy, D. T., Fuller, R. A., Jarnot, R. F., Jiang, J. H., Knosp, B. W., Stek, P. C., Wagner, P. A., and Wu, D. L.: EOS MLS Version 3.3 Level 2 data quality and description document, Tech. rep., Jet Propulsion Laboratory, https://mls.jpl.nasa.gov/data/v3-3_data_quality_document.pdf (last access: 15 April 2024), d-33509, 2011. a
López-Puertas, M. and Taylor, F. W.: Non-LTE Radiative Transfer in the Atmosphere, World Scientific Pub., Singapore, https://doi.org/10.1142/4650, 2001. a
Marsh, D. R.: Chemical-dynamical coupling in the mesosphere and lower thermosphere, in: Aeronomy of the Earth's atmosphere and ionosphere, edited by Abdu, M. A. and Pancheva, D., Vol. 2, in: IAGA Special Sopron Book, 3–17, https://doi.org/10.1007/978-94-007-0326-1, ISBN 978-94-007-0326-1, Springer, Dordrecht, 1st Edn., 2011. a
Marsh, D. R., Mills, M. J., Kinnison, D. E., Lamarque, J.-F., Calvo, N., and Polvani, L. M.: Climate change from 1850 to 2005 simulated in CESM1(WACCM), J. Climate, 26, 7372–7391, https://doi.org/10.1175/JCLI-D-12-00558.1, 2013. a
Mengistu Tsidu, G., von Clarmann, T., Stiller, G. P., Höpfner, M., Fischer, H., Glatthor, N., Grabowski, U., Kellmann, S., Kiefer, M., Linden, A., Milz, M., Steck, T., Wang, D.-Y., and Funke, B.: Stratospheric N2O5 in the austral spring 2002 as retrieved from limb emission spectra recorded by the Michelson Interferometer for Passive Atmospheric Sounding (MIPAS), J. Geophys. Res., 109, D18301, https://doi.org/10.1029/2004JD004856, 2004. a, b
Myhre, G., Shindell, D., Bréon, F., Collins, W., Fuglestvedt, J., Huang, J., Koch, D., Lamarque, J.-F., Lee, D., Mendoza, B., Nakajima, T., Robock, A., Stephens, G., Takemura, T., and Zhang, H.: Anthropogenic and Natural Radiative Forcing, in: Climate Change 2013: The Physical Science Basis. Contribution of Working Group I to the Fifth Assessment Report of the Intergovernmental Panel on Climate Change, edited by: Stocker, T. F., Qin, D., Plattner, G.-K., Tignor, M., Allen, S. K., Boschung, J., Nauels, A., Xia, Y., Bex, V., and Midgley, P. M., Chap. 8, 659–740, Cambridge University Press, Cambridge, United Kingdom and New York, NY, USA, https://doi.org/10.1017/CBO9781107415324.018, 2014. a
Noël, S., Bramstedt, K., Hilker, M., Liebing, P., Plieninger, J., Reuter, M., Rozanov, A., Sioris, C. E., Bovensmann, H., and Burrows, J. P.: Stratospheric CH4 and CO2 profiles derived from SCIAMACHY solar occultation measurements, Atmos. Meas. Tech., 9, 1485–1503, https://doi.org/10.5194/amt-9-1485-2016, 2016. a
Oelhaf, H.: MIPAS Mission Plan, Tech. Rep. ENVI-SPPA-EOPG-TN-07-0073, ESA, https://earth.esa.int/eogateway/documents/20142/37627/MIPAS+Mission+Plan.pdf/3e3885c3-7ed9-8470-368c-addb63f65047 (last access: 16 April 2024), 2008. a
Park, J. H., Russell III, J. M., Gordley, L. L., Drayson, S. R., Benner, D. C., McInerney, J. M., Gunson, M. R., Toon, G. C., Sen, B., Blavier, J.-F., Webster, C. R., Zipf, E. C., Erdman, P., Schmidt, U., and Schiller, C.: Validation of Halogen Occultation Experiment CH4 measurements from the UARS, J. Geophys. Res., 101, 10183–10203, https://doi.org/10.1029/95JD02736, 1996. a
Phillips, D.: A Technique for the numerical solution of certain integral equations of first kind, J. Ass. Comput. Mat., 9, 84–97, https://doi.org/10.1145/321105.321114, 1962. a
Plieninger, J., von Clarmann, T., Stiller, G. P., Grabowski, U., Glatthor, N., Kellmann, S., Linden, A., Haenel, F., Kiefer, M., Höpfner, M., Laeng, A., and Lossow, S.: Methane and nitrous oxide retrievals from MIPAS-ENVISAT, Atmos. Meas. Tech., 8, 4657–4670, https://doi.org/10.5194/amt-8-4657-2015, 2015. a, b, c
Plieninger, J., Laeng, A., Lossow, S., von Clarmann, T., Stiller, G. P., Kellmann, S., Linden, A., Kiefer, M., Walker, K. A., Noël, S., Hervig, M. E., McHugh, M., Lambert, A., Urban, J., Elkins, J. W., and Murtagh, D.: Validation of revised methane and nitrous oxide profiles from MIPAS–ENVISAT, Atmos. Meas. Tech., 9, 765–779, https://doi.org/10.5194/amt-9-765-2016, 2016. a, b, c, d, e, f, g, h, i, j
Plumb, R. A.: A ”tropical pipe” model of stratospheric transport, J. Geophys. Res.-Atmos., 101, 3957–3972, https://doi.org/10.1029/95jd03002, 1996. a
Raspollini, P., Arnone, E., Barbara, F., Bianchini, M., Carli, B., Ceccherini, S., Chipperfield, M. P., Dehn, A., Della Fera, S., Dinelli, B. M., Dudhia, A., Flaud, J.-M., Gai, M., Kiefer, M., López-Puertas, M., Moore, D. P., Piro, A., Remedios, J. J., Ridolfi, M., Sembhi, H., Sgheri, L., and Zoppetti, N.: Level 2 processor and auxiliary data for ESA Version 8 final full mission analysis of MIPAS measurements on ENVISAT, Atmos. Meas. Tech., 15, 1871–1901, https://doi.org/10.5194/amt-15-1871-2022, 2022. a
Ravishankara, A. R., Daniel, J. S., and Portmann, R. W.: Nitrous Oxide (N2O): The Dominant Ozone–Depleting Substance Emitted in the 21st Century, Science, 326, 123–125, https://doi.org/10.1126/science.1176985, 2009. a
Rodgers, C. D.: Inverse Methods for Atmospheric Sounding: Theory and Practice, Vol. 2, in: Series on Atmospheric, Oceanic and Planetary Physics, edited by: Taylor, F. W., World Scientific, https://doi.org/10.1142/3171, Singapore, New Jersey, London, Hong Kong, https://doi.org/10.1142/3171, 2000. a, b, c
Rong, P. P., Russell III, J. M., Marshall, B. T., Siskind, D. E., Hervig, M. E., Gordley, L. L., Bernath, P. F., and Walker, K. A.: Version 1.3 AIM SOFIE measured methane (CH4): Validation and Seasonal Climatology, J. Geophys. Res., 121, 13158–13179, https://doi.org/10.1002/2016JD025415, 2016. a
Rothman, L. S., Gordon, I. E., Barbe, A., Benner, D. C., Bernath, P. F., Birk, M., Boudon, V., Browng, L. R., Campargueh, A., Champion, J.-P., Chance, K., Coudert, L. H., Dana, V., Devi, V. M., Fally, S., Flaud, J.-M., Gamache, R. R., Goldman, A., , Jacquemart, D., Kleiner, I., Lacome, N., Lafferty, W. J., Mandin, J.-Y., Massie, S., Mikhailenko, S. N., Miller, C. E., Moazzen-Ahmadi, N., Naumenko, O. V., Nikitin, A. V., Orphal, J., Perevalov, V. I., Perrin, A., Predoi-Cross, A., Rinsland, C. P., Rotger, M., Šimečková, M., Smith, M. A. H., Sung, K., Tashkun, S. A., Tennyson, J., Toth, R. A., Vandaele, A. C., and Van der Auwera, J.: The HITRAN 2008 molecular spectroscopic database, J. Quant. Spectrosc. Radiat. Transfer, 110, 533–572, https://doi.org/10.1016/j.jqsrt.2009.02.013, 2009. a
Sheese, P. E., Walker, K. A., Boone, C. D., Bernath, P. F., and Funke, B.: Nitrous oxide in the atmosphere: First measurements of a lower thermospheric source, Geophys. Res. Lett., 43, 2866–2872, https://doi.org/10.1002/2015GL067353, 2016. a, b, c
Shindell, D. T.: Climate and ozone response to increased stratospheric water vapor, Geophys. Res. Lett., 28, 1551–1554, https://doi.org/10.1029/1999GL011197, 2001. a
Steck, T. and von Clarmann, T.: Constrained profile retrieval applied to the obervation mode of the Michelson Interferometer for Passive Atmospheric Sounding, Appl. Opt., 40, 3559–3571, https://doi.org/10.1364/AO.40.003559, 2001. a
Steck, T., Höpfner, M., von Clarmann, T., and Grabowski, U.: Tomographic retrieval of atmospheric parameters from infrared limb emission observations, Appl. Opt., 44, 3291–3301, https://doi.org/10.1364/AO.44.003291, 2005. a
Stiller, G. P. (Ed.): The Karlsruhe Optimized and Precise Radiative Transfer Algorithm (KOPRA), Forschungszentrum Karlsruhe, Karlsruhe, https://doi.org/10.5445/IR/270048971, https://doi.org/10.5445/IR/270048971, 22.02.11, LK 01, Wissenschaftliche Berichte, FZKA-6487 (Dezember 2000), 2000. a
Stiller, G. P., von Clarmann, T., Funke, B., García-Comas, M., Glatthor, N., Grabowski, U., Kellmann, S., Kiefer, M., Laeng, A., Linden, A., and López-Puertas, M.: Version 8 IMK/IAA MIPAS reactive nitrogen, in preparation, 2024. a, b, c
Strong, K., Wolff, M. A., Kerzenmacher, T. E., Walker, K. A., Bernath, P. F., Blumenstock, T., Boone, C., Catoire, V., Coffey, M., De Mazière, M., Demoulin, P., Duchatelet, P., Dupuy, E., Hannigan, J., Höpfner, M., Glatthor, N., Griffith, D. W. T., Jin, J. J., Jones, N., Jucks, K., Kuellmann, H., Kuttippurath, J., Lambert, A., Mahieu, E., McConnell, J. C., Mellqvist, J., Mikuteit, S., Murtagh, D. P., Notholt, J., Piccolo, C., Raspollini, P., Ridolfi, M., Robert, C., Schneider, M., Schrems, O., Semeniuk, K., Senten, C., Stiller, G. P., Strandberg, A., Taylor, J., Tétard, C., Toohey, M., Urban, J., Warneke, T., and Wood, S.: Validation of ACE-FTS N2O measurements, Atmos. Chem. Phys., 8, 4759–4786, https://doi.org/10.5194/acp-8-4759-2008, 2008. a
Tikhonov, A.: On the solution of incorrectly stated problems and method of regularization, Dokl. Akad. Nauk. SSSR, 151, 501–504, 1963. a
Toon, G. C., Farmer, C. B., Shaper, P. W., Lowes, L. L., Norton, R. H., Schoeberl, M. R., Lait, L. R., and Newman, P. A.: Evidence for Subsidence in the 1989 Arctic Winter Stratosphere from Airborne Infrared Composition Measurements, J. Geophys. Res., 97, 7963–7970, https://doi.org/10.1029/91JD03115, 1992. a
Tran, H., Flaud, P.-M., Gabard, T., Hase, F., von Clarmann, T., Camy-Peyret, C., Payan, S., and Hartmann, J.-M.: Model, software and database for line–mixing effects in the ν3 and ν4 bands of CH4 and tests using laboratory and planetary measurements–I: N2 (and air) broadenings and the earth atmosphere, J. Quant. Spectrosc. Radiat. Transfer, 101, 284–305, https://doi.org/10.1016/j.jqsrt.2005.11.020, 2006. a, b
Twomey, S.: On the Numerical Solution of Fredholm Integral Equations of the First Kind by the Inversion of the Linear System Produced by Quadrature, J. ACM, 10, 97–101, https://doi.org/10.1145/321150.321157, 1963. a
Urban, J., Lautié, N., Flochmoën, E. L., Jiménez, C., Eriksson, P., de La Noë, J., Dupuy, E., Ekström, M., El Amraoui, L., Frisk, U., Murtagh, D., Olberg, M., and Ricaud, P.: Odin/SMR limb observations of stratospheric trace gases: Level 2 processing of ClO, N2O, HNO3, and O3, J. Geophys. Res., 110, D14307, https://doi.org/10.1029/2004JD005741, 2005a. a
Urban, J., Lautié, N., Flochmoën, E. L., Jiménez, C., Eriksson, P., de La Noë, J., Dupuy, E., El Amraoui, L., Frisk, U., Jégou, F., Murtagh, D., Olberg, M., Ricaud, P., Camy-Peyret, C., Dufour, G., Payan, S., Huret, N., Pirre, M., Robinson, A. D., Harris, N. R. P., Bremer, H., Kleinböhl, A., Küllmann, K., Künzi, K., Kuttippurath, J., Ejiri, M. K., Nakajima, H., Sasano, Y., Sugita, T., Yokota, T., Piccolo, C., Raspollini, P., and Ridolfi, M.: Odin submillimeter radiometer limb observations of stratospheric trace gases: Validation of N2O, J. Geophys. Res., 110, D09301, https://doi.org/10.1029/2004JD005394, 2005b. a
Versick, S., Stiller, G. P., von Clarmann, T., Reddmann, T., Glatthor, N., Grabowski, U., Höpfner, M., Kellmann, S., Kiefer, M., Linden, A., Ruhnke, R., and Fischer, H.: Global stratospheric hydrogen peroxide distribution from MIPAS-Envisat full resolution spectra compared to KASIMA model results, Atmos. Chem. Phys., 12, 4923–4933, https://doi.org/10.5194/acp-12-4923-2012, 2012. a
Volk, C. M., Elkins, J. W., Fahey, D. W., Salawitch, R. J., Dutton, G. S., Gilligan, J. M., Proffitt, M. H., Loewenstein, M., Podolske, J. R., Minschwaner, K., Margitan, J. J., and Chan, K. R.: Quantifying Transport Between the Tropical and Mid-Latitude Lower Stratosphere, Science, 272, 1763–1768, https://doi.org/10.1126/science.272.5269.1763, 1996. a, b
von Clarmann, T.: Smoothing error pitfalls, Atmos. Meas. Tech., 7, 3023–3034, https://doi.org/10.5194/amt-7-3023-2014, 2014. a
von Clarmann, T., Glatthor, N., Grabowski, U., Höpfner, M., Kellmann, S., Kiefer, M., Linden, A., Mengistu Tsidu, G., Milz, M., Steck, T., Stiller, G. P., Wang, D. Y., Fischer, H., Funke, B., Gil-López, S., and López-Puertas, M.: Retrieval of temperature and tangent altitude pointing from limb emission spectra recorded from space by the Michelson Interferometer for Passive Atmospheric Sounding (MIPAS), J. Geophys. Res., 108, 4736, https://doi.org/10.1029/2003JD003602, 2003. a, b
von Clarmann, T., De Clercq, C., Ridolfi, M., Höpfner, M., and Lambert, J.-C.: The horizontal resolution of MIPAS, Atmos. Meas. Tech., 2, 47–54, https://doi.org/10.5194/amt-2-47-2009, 2009a. a
von Clarmann, T., Höpfner, M., Kellmann, S., Linden, A., Chauhan, S., Funke, B., Grabowski, U., Glatthor, N., Kiefer, M., Schieferdecker, T., Stiller, G. P., and Versick, S.: Retrieval of temperature, H2O, O3, HNO3, CH4, N2O, ClONO2 and ClO from MIPAS reduced resolution nominal mode limb emission measurements, Atmos. Meas. Tech., 2, 159–175, https://doi.org/10.5194/amt-2-159-2009, 2009b a, b
von Clarmann, T., Funke, B., Glatthor, N., Kellmann, S., Kiefer, M., Kirner, O., Sinnhuber, B.-M., and Stiller, G. P.: The MIPAS HOCl climatology, Atmos. Chem. Phys., 12, 1965–1977, https://doi.org/10.5194/acp-12-1965-2012, 2012. a, b
von Clarmann, T., Funke, B., López-Puertas, M., Kellmann, S., Linden, A., Stiller, G. P., Jackman, C. H., and Harvey, V. L.: The solar proton events in 2012 as observed by MIPAS, Geophys. Res. Lett., 40, 1–5, https://doi.org/10.1002/grl.50119, 2013. a, b
von Clarmann, T., Glatthor, N., and Plieninger, J.: Maximum likelihood representation of MIPAS profiles, Atmos. Meas. Tech., 8, 2749–2757, https://doi.org/10.5194/amt-8-2749-2015, 2015. a
von Clarmann, T., Degenstein, D. A., Livesey, N. J., Bender, S., Braverman, A., Butz, A., Compernolle, S., Damadeo, R., Dueck, S., Eriksson, P., Funke, B., Johnson, M. C., Kasai, Y., Keppens, A., Kleinert, A., Kramarova, N. A., Laeng, A., Langerock, B., Payne, V. H., Rozanov, A., Sato, T. O., Schneider, M., Sheese, P., Sofieva, V., Stiller, G. P., von Savigny, C., and Zawada, D.: Overview: Estimating and reporting uncertainties in remotely sensed atmospheric composition and temperature, Atmos. Meas. Tech., 13, 4393–4436, https://doi.org/10.5194/amt-13-4393-2020, 2020. a, b, c
von Clarmann, T., Grabowski, U., Stiller, G. P., Monge-Sanz, B. M., Glatthor, N., and Kellmann, S.: The middle atmospheric meridional circulation for 2002–2012 derived from MIPAS observations, Atmos. Chem. Phys., 21, 8823–8843, https://doi.org/10.5194/acp-21-8823-2021, 2021. a
von Clarmann, T., Glatthor, N., Grabowski, U., Funke, B., Kiefer, M., Kleinert, A., Stiller, G. P., Linden, A., and Kellmann, S.: TUNER-compliant error estimation for MIPAS: methodology, Atmos. Meas. Tech., 15, 6991–7018, https://doi.org/10.5194/amt-15-6991-2022, 2022. a, b