the Creative Commons Attribution 4.0 License.
the Creative Commons Attribution 4.0 License.
 | 24 May 2024
Enhancing mobile aerosol monitoring with CE376 dual-wavelength depolarization lidar
Maria Fernanda Sanchez Barrero
Ioana Elisabeta Popovici
Philippe Goloub
Stephane Victori
Qiaoyun Hu
Benjamin Torres
Thierry Podvin
Luc Blarel
Gaël Dubois
Fabrice Ducos
Eric Bourrianne
Aliaksandr Lapionak
Lelia Proniewski
Brent Holben
David Matthew Giles
Anthony LaRosa
We present the capabilities of a compact dual-wavelength depolarization lidar to assess the spatiotemporal variations in aerosol properties aboard moving vectors. Our approach involves coupling the lightweight Cimel CE376 lidar, which provides measurements at 532 and 808 nm and depolarization at 532 nm, with a photometer to monitor aerosol properties. The assessments, both algorithmic and instrumental, were conducted at ATOLL (ATmospheric Observatory of LiLle) platform operated by the Laboratoire d'Optique Atmosphérique (LOA), in Lille, France. An early version of the CE376 lidar co-located with the CE318-T photometer and with a multi-wavelength Raman lidar were considered for comparisons and validation. We developed a modified Klett inversion method for simultaneous two-wavelength elastic lidar and photometer measurements. Using this setup, we characterized aerosols during two distinct events of Saharan dust and dust smoke aerosols transported over Lille in spring 2021 and summer 2022. For validation purposes, comparisons against the Raman lidar were performed, demonstrating good agreement in aerosol properties with relative differences of up to 12 % in the depolarization measurements. Moreover, a first dataset of CE376 lidar and photometer performing on-road measurements was obtained during the FIREX-AQ (Fire Influence on Regional to Global Environments and Air Quality) field campaign deployed in summer 2019 over the northwestern USA. By lidar and photometer mapping in 3D, we investigated the transport of released smoke from active fire spots at William Flats (northeast WA, USA). Despite extreme environmental conditions, our study enabled the investigation of aerosol optical properties near the fire source, distinguishing the influence of diffuse, convective, and residual smoke. Backscatter, extinction profiles, and column-integrated lidar ratios at 532 and 808 nm were derived for a quality-assured dataset. Additionally, the extinction Ångström exponent (EAE), color ratio (CR), attenuated color ratio (ACR), and particle linear depolarization ratio (PLDR) were derived. In this study, we discuss the capabilities (and limitations) of the CE376 lidar in bridging observational gaps in aerosol monitoring, providing valuable insights for future research in this field.
- Article
(11324 KB) - Full-text XML
- BibTeX
- EndNote


Improving knowledge of the spatiotemporal distribution of aerosols and their local, regional, and global impact, as well as reducing the uncertainties in the aerosol properties, is fundamental to quantify their radiative impacts (Boucher et al., 2013). Thus, following aerosol transport from the emission sources and evaluating of their complex horizontal and vertical distribution are therefore needed. Negative effects on human health and the economy are attributed to aerosols as well, increasing the demand for continuous air quality control to develop early-warning systems as more frequent and extreme environmental events are detected (Papagiannopoulos et al., 2020; Seneviratne et al., 2021). Photometer and lidar instruments are convenient tools to assess aerosol properties and their impact on climate. To this end, the development of networks plays a key role in aerosol monitoring. Some examples are the AERONET network (AErosol RObotic NETwork; Holben et al., 1998) for photometers; EARLINET (European Aerosol Research Lidar Network; Pappalardo et al., 2014; Sicard et al., 2015), now part of ACTRIS ERIC (Aerosol, Clouds and Trace gases Research Infrastructure; European Research Infrastructure Consortium), for Raman lidars; and MPLNet (Micro-Pulse Lidar Network; Welton et al., 2001) for micro-pulse lidars. Studies conducted with multiple network sites allowed the assessment of the variability in the aerosol properties at a regional level, like dust outbreaks (Ansmann et al., 2003; Papayannis et al., 2008; López-Cayuela et al., 2023) or long-range transport of biomass burning smoke episodes (Nicolae et al., 2013; Adam et al., 2020). However, instruments at fixed sites are restricted by their local conditions and position with respect to the aerosol sources. Furthermore, some regions that are difficult to access, such as oceans or mountains, remain unexplored. Thus, the deployment of mobile laboratories (aboard ship cruises and airplanes or in cars) provided a solution to fill these observational gaps in networks (Smirnov et al., 2009; Tesche et al., 2009; Müller et al., 2014; Bohlmann et al., 2018; Popovici et al., 2018; Yin et al., 2019).
In recent years, the multispectral Sun–sky–lunar Cimel CE318-T photometer (Barreto et al., 2016), widely used in AERONET sites and designed by the Cimel company, has been fully adapted for automatic Sun or lunar tracking during movement aboard ships (Yin et al., 2019). The ship-borne CE318-T photometer is operational and has continuously provided aerosol optical depth (AOD) data since January 2021 aboard the Marion Dufresne research vessel in the framework of the MAP-IO (Marion Dufresne Atmospheric Program Indian Ocean). Likewise, the PLASMA (Photomètre Léger Aéroporté pour la Surveillance des Masses d'Air; Karol et al., 2013) photometer was developed exclusively to track the Sun in movement and has been deployed aboard aircraft and vehicles during field campaigns (Popovici, 2018; Popovici et al., 2018, 2022; Hu et al., 2019; Mascaut et al., 2022). The ship-borne CE318-T and PLASMA photometers have been adapted and developed, respectively, in the framework of AGORA-LAB, a common Laboratoire d'Optique Atmosphérique (LOA)/Cimel laboratory (https://www.agora-lab.fr/, last access: 24 October 2023).
Lidar systems are mostly large and complex and require considerable space, regular maintenance, and controlled operational conditions. Upgrades for mobile applications are frequently linked to instrumental modifications and/or the creation of adapted laboratory platforms or transportable containers. Examples are the multiwavelength PollyXT lidars, within the network PollyNET (Althausen et al., 2013; Engelmann et al., 2016), set up in temperature-controlled containers for 24/7 operation, and the micro-pulse lidars from MPLNet, which are automatic and compact systems that can be easily transported. Studies conducted with lidars aboard mobile vectors showed the possibilities of supporting satellite-based observations (Burton et al., 2013; Warneke et al., 2023) and air quality assessment in urban–rural transitions and complex topographies (Royer et al., 2011; Pal et al., 2012; Dieudonné et al., 2015; Shang et al., 2018; Popovici, 2018; Popovici et al., 2022; Chazette and Totems, 2023). Hence, a description of a compact and light mobile system, which integrated a lidar and a Sun photometer was first presented by Popovici et al. (2018). This unique system, deployed by LOA, included the Cimel CE370 mono-wavelength elastic lidar and the PLASMA Sun photometer. For several field campaigns, the integrated system performed on-road mobile measurements (Popovici et al., 2018, 2022), showing the versatility of such a system for aerosol characterization. For that reason, we propose the newest model of Cimel lightweight lidar, the CE376 dual-wavelength lidar, for the enhancement of aerosol properties.
The CE376 lidar measures attenuated backscatter profiles at 532 and 808 nm and depolarization at 532 nm. Algorithmic and instrumental assessment took place at the ATOLL (ATmospheric Observatory of LiLle) platform. METIS, an early version of the CE376 lidar, has been continuously performing observations since 2019. In addition, METIS is co-located with a CE318-T photometer and with a high-power multi-wavelength Raman lidar, LILAS (LIlle Lidar AtmosphereS), part of ACTRIS ERIC, which are also considered for comparison and validation. Multiple studies performed on simultaneous two-wavelength lidar measurements proposed inversion schemes by establishing a constant ratio between wavelengths, and/or requiring the aerosol extinction-to-backscatter ratios, i.e., the lidar ratio (LR), to be known a priori and constant (Potter, 1987; Ackermann, 1997, 1999; Kunz, 1999; Vaughan, 2004; Lu et al., 2011). Therefore, we propose an inversion scheme with a two-wavelength modified Klett inversion, using AOD and the extinction Ångström exponent (EAE) from the photometer to constrain the retrievals. Both forms of the Klett solution, backward and forward integration (Weitkamp, 2005), are used according to detection limits at each wavelength. Profiles of the EAE, color ratio (CR), and particle linear depolarization ratio (PLDR) are derived later. In addition, the attenuated total backscatter and attenuated color ratio (ACR) are derived directly from the measurements. Moreover, the aerosol retrievals are validated through comparison with LILAS Raman lidar, and we establish the reliability of our results. Our study not only outlines the findings but also discusses the limitations and future implications of our approach.
A first dataset of co-located CE376 lidar and photometer mobile observations has been obtained during the FIREX-AQ (Fire Influence on Regional to Global Environments and Air Quality) field campaign organized over the northwestern US in summer 2019 (Warneke et al., 2018). This campaign, led by NASA and NOAA, focused on investigating the chemistry and transport of smoke from wildfires and agricultural burning, in addition to the multiple in situ instruments deployed in fixed platforms around the region and aboard aircraft (Warneke et al., 2023). Remote sensing instruments were installed in both stationary and mobile DRAGON payloads (Distributed Regional Aerosol Gridded Observations Networks; Holben et al., 2018). Thus, two mobile platforms (two sport utility vehicles, SUVs) called DMU-1 and DMU-2 (Dragon Mobile Unit) were equipped with lidars and photometers. The dual-wavelength CE376 lidar and ship-borne CE318-T photometer were installed aboard DMU-1, and the mono-wavelength CE370 lidar and PLASMA photometer were installed on board DMU-2. Both DMUs performed on-road mobile observations around major fire sources and were able to follow the smoke plumes. Height-resolved optical properties of fresh smoke aerosols close to active fire sources were derived despite extreme environmental conditions (e.g., hot and dry ambient temperatures), which limited the performance of the instruments. Hence, in this work, we present aerosol properties mapped for selected case studies during the William Flats fire in northeastern Washington State. Both DMU-1 and DMU-2 are considered for the analysis. Notably, our study provides 3D mapping and the temporal evolution of aerosol properties, showcasing the relevance of coupling the CE376 lidar and CE318-T photometer during this measurement campaign.
The main objective of this work is to show the capabilities of a compact dual-wavelength depolarization lidar to assess the spatiotemporal distribution of aerosol properties, particularly when it is aboard moving vectors and co-located with a photometer. Thus, we explore both capabilities and limitations of CE376 in detail, demonstrating how our study contributes to filling observational gaps within aerosol monitoring networks. This paper is organized as follows. The description of the instruments used is presented in Sect. 2. An extensive description of the methodology applied to derive aerosol properties, using the two-wavelength depolarization lidar and photometer, is presented in Sect. 3. The result section is divided in two parts; Sect. 4 provides the outcomes of the algorithmic and instrumental assessments that occurred at Lille, France. We present two case studies for events of dust and dust–smoke transported over Lille and the validation of aerosol retrievals with comparisons against a Raman lidar. Section 5 shows 3D mapping and the temporal evolution of aerosol properties using the dual-wavelength CE376 lidar and the CE318-T photometer mobile observations for the first time. Case studies from the FIREX-AQ campaign present the optical properties of fresh smoke aerosols close to the source. Finally, Sect. 6 summarizes the results and presents the conclusions and perspectives of this work. The instrumental algorithmic limitations and the uncertainties are discussed throughout the different sections.
This section is dedicated to the description of the mobile remote sensing instruments used in this study. Section 2.1 presents the new Cimel CE376 lidar with up to two wavelengths and depolarization channels. Section 2.2 describes the two photometers that were integrated to mobile systems to derive aerosols optical properties.
2.1 Lidars
The CE370 lidar is an eye-safe micro-pulse lidar (Pelon et al., 2008; Mortier et al., 2013; Popovici et al., 2018) operating at 532 nm with 20 µJ pulse energy at 4.7 kHz repetition rate (Table 1). The CE370 is designed with a shared transmitter–receiver telescope connected through a 10 m optical fiber to the control and acquisition system. The backscattered signal is detected by photon counting with an avalanche photodiode (APD). The CE370 lidar was designed by Cimel Electronique to monitor aerosol and cloud properties up to 15–20 km, with a vertical resolution of 15 m. For several field campaigns, the CE370 lidar that embarked on mobile platforms has demonstrated the viability to characterize vertical aerosol properties in movement (Popovici et al., 2018, 2022). Therefore, the latest lidar model, CE376, operable up to two wavelengths, is proposed to replace the CE370 lidar and continue the developments towards mobile aerosol monitoring (https://www.cimel.fr/solutions/ce376/, last access: 24 October 2023). In comparison to the CE370, the CE376 lidar is designed to support up to two wavelengths and depolarization measurements within different model configurations (G is for green; GP is for green polarized; GPN is for green polarized near-infrared; N is for near-infrared). In this study, we use the CE376 GPN (green polarized near-infrared) model that is described as follows.
Table 1System specifications for the mobile lidars.
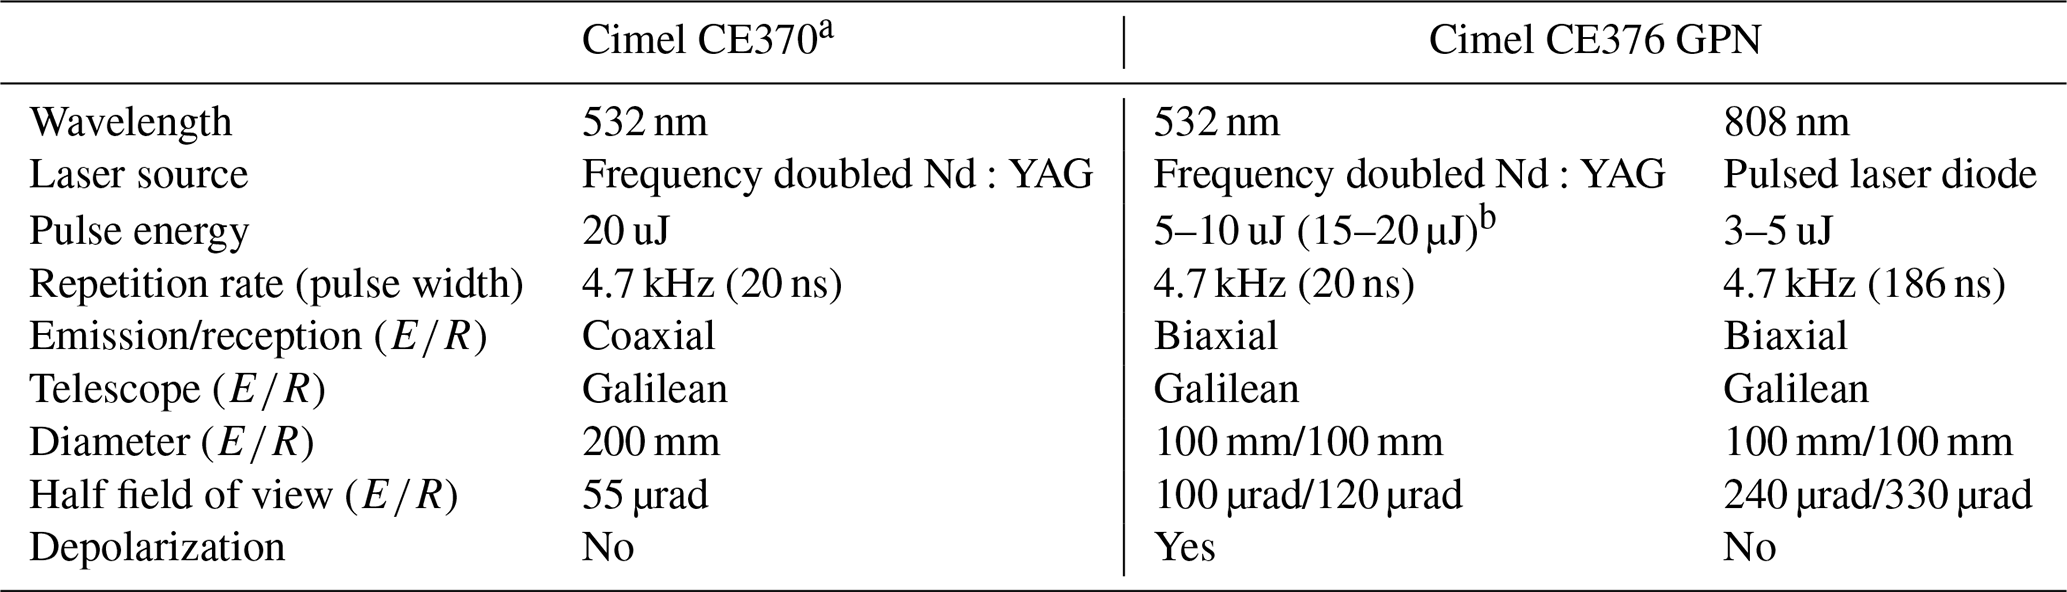
a Cimel CE370 is no longer commercially available. b Systems used in this work had higher pulse energy.
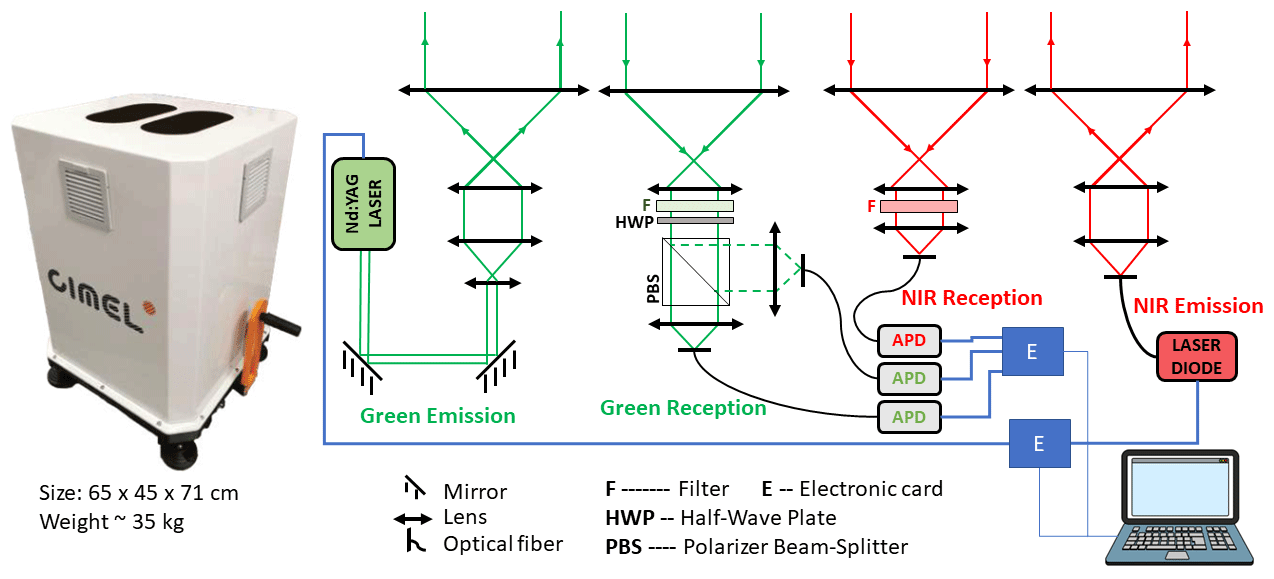
Figure 1CE376 GPN lidar and its 2D design. The optical design of the biaxial systems at 532 nm (green emission/reception) and 808 nm (NIR emission/reception) and layout of the control/acquisition system through electronic cards are shown in a simplified plan. Source: https://www.cimel.fr/solutions/ce376/ (last access: 21 November 2023).
The CE376 GPN lidar is an autonomous, lightweight, and compact micro-pulse lidar. The lidar operates at two wavelengths, 532 and 808 nm, with 5–10 and 3–5 µJ pulse energy, respectively, at a repetition rate of 4.7 kHz (Table 1). Measurements of elastic backscattered light at both wavelengths and depolarization at 532 nm are acquired. For both systems used in this work (METIS and FIREX-AQ), the laser source at 532 nm has been replaced with one of a higher pulse energy (not eye-safe) to increase the signal-to-noise ratio (SNR). The emission–reception design consists of two Galilean telescopes in a biaxial configuration. The simplified 2D layout of the lidar system is presented in Fig. 1. Light pulses at 532 nm from a frequency-doubled Nd:YAG laser source are transmitted through an arrangement of dichroic mirrors and collimation lenses on the green emission system. Similarly, a simplified optical system including a pulsed narrow bandpass laser diode source (manufactured by DILAS laser diodes; now coherent), optical fiber, and collimation lenses emits light pulses in the near-infrared (NIR) at 808 nm (linewidth 0.4 nm). The elastic backscattered light is collected, collimated, and filtered in the reception at each emitted wavelength and detected with APDs in photon counting mode. Electronic cards developed by Cimel communicate with the control and acquisition software.
Linear depolarization measurements at 532 nm are also acquired by separation in the parallel (co-polarized) and perpendicular (cross-polarized) components of the backscattered light using a polarizing beam-splitter cube (PBS) in the reception. The PBS is a Thorlabs CCM1-PBS25-532 device with reflectivities Rp and Rs and transmittances Tp and Ts (subscripts p and s for parallel and perpendicular polarized light with respect to the PBS incident plane). A manually rotating mount with half-wave plate (HWP) in front of the PBS controls the polarization angle of the incident light with a precision of 2°. Measured signals behind the PBS on the reflected and transmitted branches are named parallel (//) or perpendicular (⊥), according to the reception configuration. More details on the depolarization measurements can be found in Sect. 3.1.1.
For mobile applications, the CE376 lidar is coupled with a GPS module to derive the exact position during measurements. The integration of the geolocation and lidar observations is accounted for in the data pre-processing, as described in Sect. 3.1.2.
2.2 Photometers
The Cimel CE318-T photometer has been adapted for mobile applications. The PLASMA photometer has been developed exclusively for mobile observations. Both instruments follow and meet the AERONET standards and are included in automatic data processing chains. Therefore, automatic near-real time (NRT) aerosol properties are retrieved (https://aeronet.gsfc.nasa.gov/, last access: 23 October 2023) without cloud screening as data level 1.0 and with cloud screening as data level 1.5. It is important to note that AERONET cloud screening was formulated for stationary instruments, and some additional uncertainty in the cloud screening technique may either identify thin clouds as aerosols, or vice versa, especially in the presence of smoke or dust plumes. Furthermore, cirrus cloud screening employed by AERONET Version 3 may be further limited (Giles et al., 2019). After calibration, quality-assured data at level 2.0 are also acquired (Smirnov et al., 2000; Giles et al., 2019). In this work, data level 2.0 is used for stationary measurements (Sect. 4), and data level 1.5 is used for mobile measurements (Sect. 5). Both photometers are used in this work and are briefly described below.
The Sun–sky–lunar Cimel CE318-T photometer developed by Cimel Electronique (Barreto et al., 2016) performs both daytime and nighttime observations. Direct solar/lunar measurements are collected automatically through nine channels (340, 380, 440, 500, 670, 870, 936, 1020, and 1640 nm), deriving spectral AOD with an accuracy of 0.01. EAE is determined by pairs of AOD values at different wavelengths, providing information on the size distribution of aerosols (Kusmierczyk-Michulec, 2002). Moreover, multi-angular sky radiance measurements are acquired in the almucantar plane during daytime. Aerosol microphysical properties, such as the volume size distribution (VSD), complex refractive index, and single-scattering albedo can be also derived through inversion procedures (Dubovik and King, 2000). In the last few years, the photometer has been adapted for mobile measurements aboard cruise ships to cover oceans. The ship-borne CE318-T described by Yin et al. (2019) and developed at LOA, in the framework of AGORA-Lab, enables AOD acquisition during movement. The system is coupled with a compass and GPS modules, obtaining information on the date, time, geolocation, heading, pitch, and roll to target the Sun/Moon continuously. With the help of an accelerated tracking feedback loop, the system switches to its regular tracking mode to improve measurement quality. Downward sky radiances are also measured with additional information (from GPS and a compass) for each almucantar angle to have accurate knowledge of the observation geometry. The ship-borne CE318-T has been operational and continuously measuring since January 2021 on board the Marion Dufresne research vessel, as part of MAP-IO (Marion Dufresne Atmospheric Program – Indian Ocean) project (http://www.mapio.re, last access: 9 October 2023). Likewise, a second instrument with upgraded software has been installed, and it has been performing measurements since April 2023 aboard Marion Dufresne. In this paper, we will show the integration of the CE318-T photometer and CE376 lidar with measurements at a fixed location (Sect. 4) and for the first time on board a car during FIREX-AQ campaign (Sect. 5).
The sun-tracking photometer, PLASMA, developed by LOA and SNO/PHOTONS, has the capability of performing direct solar radiation measurements during movement. The instrument is easy to set up and transport due to its light and compact design (∼ 5 kg and 23 cm height). PLASMA has nine spectral channels at 339, 379, 440, 500, 674, 870, 1019, and 1643 nm and 937 nm for water vapor measurements. Spectral AOD with an accuracy of 0.01 and EAE are derived from the direct solar radiation measurements (Karol et al., 2013). A more detailed description of the instrument and its application to airborne measurements are presented by Karol et al. (2013). PLASMA, on board an aircraft during AEROMARINE field campaign at Réunion island (Mascaut et al., 2022), shows the alternative use of the instrument to obtain AOD and EAE vertical profiles during the aircraft's ascendent/descendent trajectories. The integration of PLASMA and CE370 lidar performing on-road mobile measurements (Popovici et al., 2018, 2022; Hu et al., 2019) has been carried out during several campaigns. Likewise, PLASMA and CE370 lidar were coupled to perform mobile measurements during the FIREX-AQ campaign (Sect. 5).
In this article, we describe extensively the methodology applied to derive aerosol optical properties from measurements of the CE376 GPN lidar, simply named CE376 hereafter. Detailed descriptions of the methods and corrections applied to the mono-wavelength CE370 lidar can be found in previous works (Pelon et al., 2008; Mortier et al., 2013; Popovici et al., 2018). For this study, two early versions of CE376 are used, with one performing continuous observations at Lille, France, and the other installed on board a mobile platform during the FIREX-AQ field campaign. Data treatment and quality assurance for both types of measurements, a fixed location, and an on-board mobile platform follow the same steps, with exceptions mainly for the determination of molecular contributions.
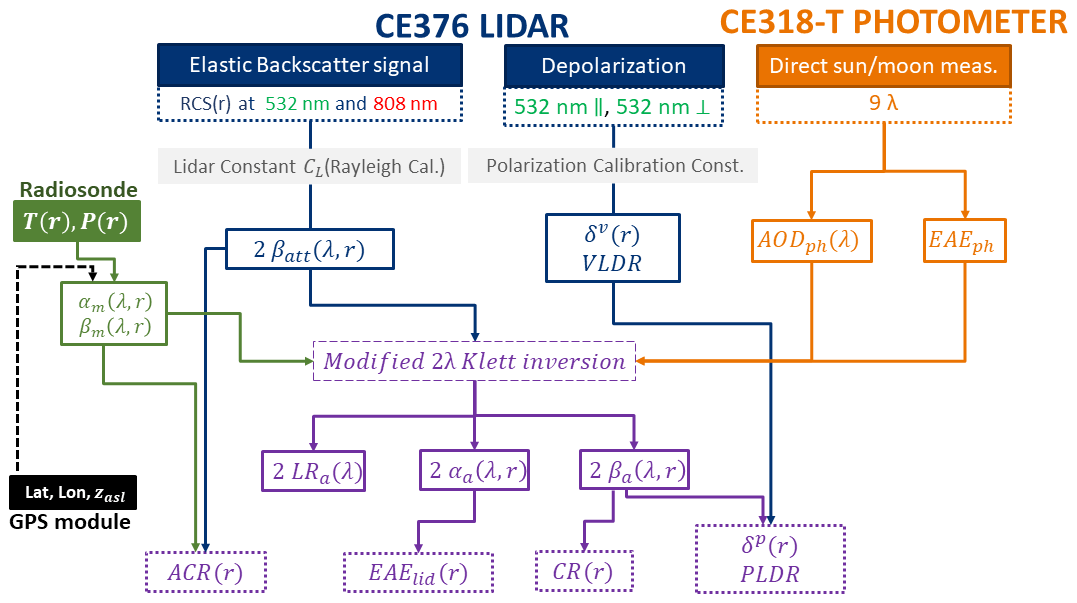
Figure 2Block diagram of the methodology combining measurements from the CE376 lidar and CE318-T photometer.
In this section, details from pre-processing to aerosol optical property retrievals are presented. Section 3.1 describes the atmospheric parameters derived directly from the observations. The volume linear depolarization ratio (VLDR) is described in Sect. 3.1.1. The total attenuated backscatter is described in Sect. 3.1.2, and the ACR definition is presented in Sect. 3.1.3. Section 3.2 presents the inversion methods applied to obtain aerosol optical properties. The methodology described below is summarized with a block diagram in Fig. 2, showing the atmospheric optical properties derived from the CE376 and CE318-T measurements.
3.1 Lidar data processing
The light backscattered by molecules and aerosols at a distancer from the lidar is collected by a telescope and detected by photon counting with an APD. Considering the lidar equation (Kovalev and Eichinger, 2004; Weitkamp, 2005), the detected elastic backscattered signal can be described as Eq. (1).
The range-corrected signal (RCS) (Ph s−1 m2) is the detected signal after background, range dependence (r2), and overlap O(r) corrections. RCS profiles are obtained for each detection channel of the CE376, i.e., for co- (parallel) and cross-polarized (perpendicular) signals at 532 nm, and , respectively, and total signal at 808 nm, RCS(808,r). The right-hand side of Eq. (1) is therefore described only in terms of atmospheric optical properties correlated to the measured signal RCS through a calibration constant CL,λ (in Ph s−1 m3 sr). The term β(r) is the backscatter coefficient (). T2(λ,r) is the non-dimensional two-way atmospheric transmittance defined in Eq. (2), where α(r) is the extinction coefficient (m−1). Subscripts m and a represent contributions of molecules and aerosols, respectively. Background noise and overlap corrections at each detection channel are applied in the same way as for CE370 lidar and are described in previous works (Pelon et al., 2008; Mortier et al., 2013; Popovici et al., 2018).
The integral in Eq. (2) is also known as AOD, and it is directly measured by photometer for the total atmospheric column. Therefore, hereafter subscripts ph and lid will be used to differentiate optical properties from photometer and lidar, respectively. The AODph for the lidar wavelengths, 532 and 808 nm, are interpolated by following the Ångström law using AODph at 440 nm and EAEph (440/870 nm).
The main sources of uncertainties in the RCS profiles come from the overlap correction in the lower troposphere and from the background irradiance in the higher atmosphere (Sassen and Dodd, 1982; Welton and Campbell, 2002; Guerrero-Rascado et al., 2010; Popovici et al., 2018; Sicard et al., 2020; Córdoba-Jabonero et al., 2021). For RCS at 532 nm from both CE376 systems used in this work, considerable underestimations in the incomplete overlap region (< 2.5 km) are observed for temperatures below 17 °C and above 35 °C, adding an error into the lower range of the profiles. The profiles and RCS(808,r) are the most affected by the solar background, reducing the detection limits by day. The relative error induced by the APD in photon counting mode is less than 5 %.
For mobile observations, a GPS module is coupled to the CE376 lidar. The geolocation is measured with high temporal resolution (1 s). For each RCS profile, we determine its latitude, longitude, and altitude above sea level () by comparing recorded times for both GPS and lidar. We derive the velocity of the mobile platform from the geolocation and time to flag the stationary and mobile measurements for further analysis. In Sect. 5, case studies of mobile observations within a complex topography are presented. Thus, we paid special attention to pairing the geolocation and RCS profiles to properly assess the complexity of the terrain.
3.1.1 Volume linear depolarization ratio
The total RCS and VLDR, δv(r), at 532 nm are derived following the methods described by Freudenthaler et al. (2009). Rotating the HWP, the angle φ between the plane of polarization of the laser and the incident plane of the PBS can be changed for two arrangements (φ = 0 or 90°). For commercial PBS cubes (Rs > Rp and Tp > Ts), the system configuration at φ = 0° is defined when the parallel polarized signal is measured in the transmitted branch of the PBS. Moreover, to reduce noise and errors from cross-talk effects, the configuration φ = 90° can be also considered. The relative amplification factor V∗ is calculated using the ± 45° calibration (Freudenthaler et al., 2009) under cloud-free and stable atmospheric conditions.
The HWP rotates the angle of the incident polarization plane φ by means of 2θ with a θ precision of 2°. The error induced by the uncertainty in φ represents less than 5 % of the error in V∗ for VLDR values up to 0.3 (Fig. 2; Freudenthaler et al., 2009). Moreover, to improve depolarization measurements, wire grid polarizers can be added to the PBS to reduce the cross-talk. However, additional errors during the calibration and in regular measurements can come from polarizing optical components that need detailed characterization (Freudenthaler, 2016) and which are not considered in this work. For current versions of the CE376, a motorized PBS mount is integrated.
3.1.2 Total attenuated backscatter
For quality assurance of lidar profiles, we follow the standard Rayleigh fit procedure (Freudenthaler et al., 2018), meaning that we normalize RCS(λ,r) to the molecular profile at a distance rref, where we assume a free-aerosol zone, i.e., . The molecular backscatter coefficients βm(λ,r) and the two-way molecular transmittance are calculated using the pressure and temperature profiles from standard atmosphere models or from available radiosonde data. This method is recurrently applied to signals from each channel of the CE376, especially during night time when SNR is higher. Moreover, we use the same considerations to determine the calibration constant CL,λ for total signals RCS(532,r) and RCS(808,r). Hence, Eq. (3) can be derived from Eq. (1).
The aerosol transmittance term can be calculated if AODph is available. Assuming that no aerosols are present above rref, we have . If there are no changes in the lidar system configuration, the CL,λ stability over time is mainly controlled by the laser energy and the opto-mechanical stability. Then the total attenuated backscatter βatt(λ,r) is defined by Eq. (4).
3.1.3 Attenuated color ratio
The CR, defined as the ratio of aerosol backscatter at two different wavelengths, has been used to discriminate clouds from aerosol layers and eventually for aerosol-typing (Omar et al., 2009; Burton et al., 2013; Wang et al., 2020; Qi et al., 2021). In particular, CALIPSO (Cloud–Aerosol Lidar and Infrared Pathfinder Satellite Observation) algorithms use the layer mean total attenuated backscatter as a first approximation of the aerosol backscatter and define the layer-integrated attenuated color ratio as . Then both layer-integrated features are used for the classification of stratospheric aerosols (Vaughan et al., 2004; Omar et al., 2009; Kim et al., 2018). Similarly, the attenuated total backscatter corrected by the two-way molecular transmittance term is considered a first approximation of the aerosol backscatter. Therefore, the ACR for all the ranges is defined by Eq. (5).
The ACR contains information of molecules and aerosols and mostly provides insights into the aerosol size. For a purely molecular atmosphere, the ACR is reduced to the ratio of molecular backscatter coefficients and ACR ∼ 0.19. Clouds are generally composed of large particles, compared to the lidar wavelengths, so the backscatter and extinction coefficients are not expected to show spectral variation. Therefore, ACR values for clouds are likely to be close to 1. Assuming that only one type of aerosol is present and homogeneously distributed in the atmospheric column, the exponential term goes nearly constant, and the ACR is controlled by the ratio . Under this rough assumption, ACR values for aerosols are between 0 and 1, with low values for fine aerosols and close to 1 for large particles.
3.2 Aerosol optical properties
By solving the Eq. (1) and assuming a constant LR, we derive βa(λ,r), as in Eq. (6) (Weitkamp, 2005), which is well-known as Klett solution (Klett, 1985). A constant extinction-to-backscatter ratio of for molecules at all wavelengths is considered. For mobile measurements, we also consider surface altitude () for each RCS profile to model correctly the molecular profiles, βm(λ,r) and αm(λr).
The boundary conditions are given by the position of rb, and therefore, two forms of the Klett solution are specified. The far end with backward integration given by rb=rref is well known as the backward (BW) solution and takes the same considerations as for the Rayleigh fit (Sect. 3.1.2). It is the most used form of the Klett solution, but it has an obvious difficulty when defining rref. The near-end solution with a forward integration or forward (FW) solution is given by rb=ro, where ro is close to the ground. Thus, the total backscatter is , assuming that aerosol transmittance close to the ground is roughly 1. Due to the incomplete overlap and the lidar's instability, especially for high power and complex systems, the FW solution is usually not considered. However, it can be applied to measurements from ceilometer-type systems like the 808 nm channel of CE376, which has available measurements close to the ground and a stable configuration. On the other hand, the effective LR can be derived, for both BW and FW, based on iterative calculation of the solution and constraint by available AODph (Mortier et al., 2013).
During nighttime measurements, the detection limits (using SNR = 1.5 on 30 min averaged profiles) for all CE376 channels is higher than 10 km, so we can usually meet an aerosol-free zone (rref) for both 532 and 808 nm wavelengths. Therefore, the BW Klett solution can be applied for both wavelengths. Nevertheless, during daytime, the strong solar background light limits the detection to ∼ 10 km and below 4 km for 532 and 808 nm, respectively. Thus, the BW Klett solution for 532 nm can still be applied but not for 808 nm. However, the blind zone and complete overlap are below 150 m and ∼ 1 km, respectively, for 808 nm, which is in contrast with 400 m and ∼ 2.5 km, respectively for 532 nm. Therefore, we consider the FW Klett solution to be suitable for RCS profiles at 808 nm during daytime. Taking all these considerations into account, we propose a modified two-wavelength inversion scheme as follows:
- a.
A BW Klett solution is applied to RCS total signals and constrained by AODph at both wavelengths 532 and 808 nm. The rref for each wavelength is searched automatically within a threshold a priori defined (e.g., 6 to 10 km) and determined by minimizing the root mean square error with respect to the molecular signal. We derive LR(λ), βa(λr), and αa(λr) at both wavelengths.
- b.
A FW Klett solution (when rref(532)>rlim(808)) is applied to RCS at 808 nm if the rref determined for 532 nm is higher than the detection limit (rlim) for 808 nm. We constrain the solution by an estimated AOD at 808 nm (AODest). AODest, defined in Eq. (7), is derived from the lidar retrievals at 532 nm and the interpolated EAEph for the pair of wavelengths 532 and 808 nm.
- c.
An extinction Ångström exponent profile (EAElid) is derived from 2αa(λr) and defined as . This parameter gives insights into the vertical distribution of the aerosol size; EAE values close to 0 indicate the dominant presence of coarse-mode aerosols, and values higher than 1 are related to the fine-mode aerosols.
- d.
The color ratio (CR) is defined as the ratio between the aerosol backscatter at 808 and 532 nm , and it is described in Sect. 3.1.3, along with the ACR.
- e.
The particle linear depolarization ratio (PLDR) is defined by Eq. (11), where the molecular depolarization ratio δm is the theoretical value according to the bandwidth of the filter in front the half-wave plate in a CE376 system (δm∼0.004). is known as the backscatter ratio, and δv(r) is the VLDR profile derived directly from depolarization measurements (Sect. 3.1.1). Furthermore, PLDR gives insights into the vertical distribution of the aerosol shape; low values (close to 0) indicate the predominant presence of spherical aerosols. Values above 0.20 correspond to the predominant presence of non-spherical aerosols like dust or ice crystals in cirrus clouds.
A first evaluation of uncertainties at each step in the data processing is approached using first-order derivatives. Thus, error propagation guidelines presented in the literature were followed (Russell et al., 1979; Sasano et al., 1985; Kovalev, 1995, 2004; Welton and Campbell, 2002; Morille et al., 2007; Rocadenbosch et al., 2012; Sicard et al., 2020). The main error sources are related to the overlap function estimation, background noise, lidar constant, and depolarization calibrations. Therefore, standard deviations from the overlap function and calibrations are considered and propagated from the RCS and VLDR to the aerosol retrievals. The uncertainty into the LR is roughly estimated by the convergence within the AOD uncertainties (0.01) in the iterative Klett solution. Errors in the molecular optical properties are negligible. Furthermore, relative errors greater than 15 % in the extinction coefficients at both wavelengths result in absolute uncertainties above 0.5 in EAE (Hu et al., 2019).
The data processing and inversion scheme presented in this section are the first steps towards near-real-time observations integrating the CE376 lidar and CE318-T photometer. Therefore, the capabilities for continuous monitoring of aerosol properties in fixed and mobile observatories are enhanced and presented through case studies in the following sections.
In this section, we present the analysis and validation of data from an early version of the CE376 lidar, which is operational at a fixed location in the metropolitan area of Lille, France. In Sect. 4.1, a description of the site and instruments used for this study are presented. Selected case studies and validation of optical properties derived from the CE376 measurements presented through comparisons with a reference lidar are presented in Sect. 4.2.
4.1 ATOLL observatory
METIS is an early version of CE376 that is continuously performing at ATOLL at the University of Lille (50.61° N, 3.14° E; 60 ). The platform is also equipped with online in situ and other remote sensing instruments providing valuable information on aerosol properties and cloud–aerosol interactions. The ATOLL platform is one of the AERONET calibration centers, and it is an ACTRIS ERIC facility. The location is mainly influenced by urban–industrial emissions, marine aerosols (∼ 80 km from the nearest coast), and seasonal pollen outbreaks (Veselovskii et al., 2021). Likewise, events of long-range transport impact the region with aerosols from Saharan mineral dust storms (Veselovskii et al., 2022), North American wildfires (Hu et al., 2019, 2022), and volcanic eruptions (Mortier et al., 2013).
METIS has been operational at the ATOLL platform since 2019 in the framework of AGORA-Lab. METIS depolarization measurements setup currently follows a configuration with φ = 90°, measuring the parallel component on the PBS reflected branch. Wire grid polarizers behind the PBS branches are used to reduce the cross-talk in the signals (Tp ∼ 1, Ts ∼ 0 and Rp ∼ 0, Rs ∼ 1). The continuous measurements are ensured by setting the lidar in a temperature-controlled room and using a high-transmittance glass on the roof. Moreover, METIS is collocated with a CE318-T photometer and with LILAS ACTRIS lidar, which are both considered for this study.
LILAS is a high-powered Mie–Raman depolarization–fluorescence lidar that has been developed and upgraded by LOA and Cimel since 2013. From its simultaneous multiple wavelength measurements, the following independent height-resolved optical properties are derived: three backscatter (355, 532, and 1064 nm), two extinction (355 and 532 nm), three particle depolarization ratio (355, 532, and 1064 nm), and one fluorescence backscatter (at 466 nm) profiles. A detailed description of the LILAS system, retrievals, and uncertainties can be found in previous works (Bovchaliuk et al., 2016; Hu et al., 2019, 2022; Veselovskii et al., 2022). The aerosol optical properties derived with METIS at 532 nm are validated by intercomparisons with LILAS.
Molecular coefficients are modeled using radiosonde measurements from three stations near Lille, depending on availability. Beauvechain (50.78° N, 4.76° E; Belgium) and Herstmonceux (50.90° N, 0.32° E; England) from the Wyoming University database (https://weather.uwyo.edu/upperair/sounding.html, last access: 23 October 2023) and Trappes (48.77° N, 1.99° E; France) from the Météo-France database (https://donneespubliques.meteofrance.fr/, last access: 23 October 2023). Beauvechain is the closest site, about 120 km away from Lille, Herstmonceux is 200 km away, and Trappes is 240 km away from Lille.
4.2 Continuous observations and comparisons with reference lidar
Since the installation of METIS at ATOLL, several studies and instrumental assessments have taken place in order to improve mainly the depolarization measurements. From the first comparisons of METIS and LILAS, an important bias between depolarization measurements was detected (> 20 %). The roof glass window was tempered, had an anti-reflective coating, and suffered from deformations due to its size and weight. All of these aspects created biases in the depolarization measurements. Currently, a frame designed to contain four windows has been installed instead and avoids deformations due to the glass weight. The glass material was also changed to an extra-clear glass, and the windows are attached to the frame using silicone in order to avoid adding stress to the glass.
In the following case studies, continuous observations of METIS and comparisons with LILAS are presented with METIS under two different conditions of measurement. The first case is METIS without a roof window during an event of Saharan dust transported over Lille in spring 2021. The second case is METIS in the current configuration for continuous measurements during a recent event of dust and smoke transported over Lille in summer 2022.
4.2.1 Saharan dust transport over Lille (31 March to 2 April 2021)
Saharan dust layers transported over Lille are frequently observed and monitored with both METIS and LILAS. One of these events took place from 31 March to 2 April 2021. An overview of the METIS and photometer measurements is presented in Fig. 3. During this event, the roof window of METIS was open on 1 April beginning at 07:00 UTC and represented by the dotted black line in Fig. 3a and b. The impact of the roof window on the depolarization measurements can be observed, as VLDR values are higher by 0.02 when METIS is used with the roof window. For this case, only VLDR values without window are considered for analysis.
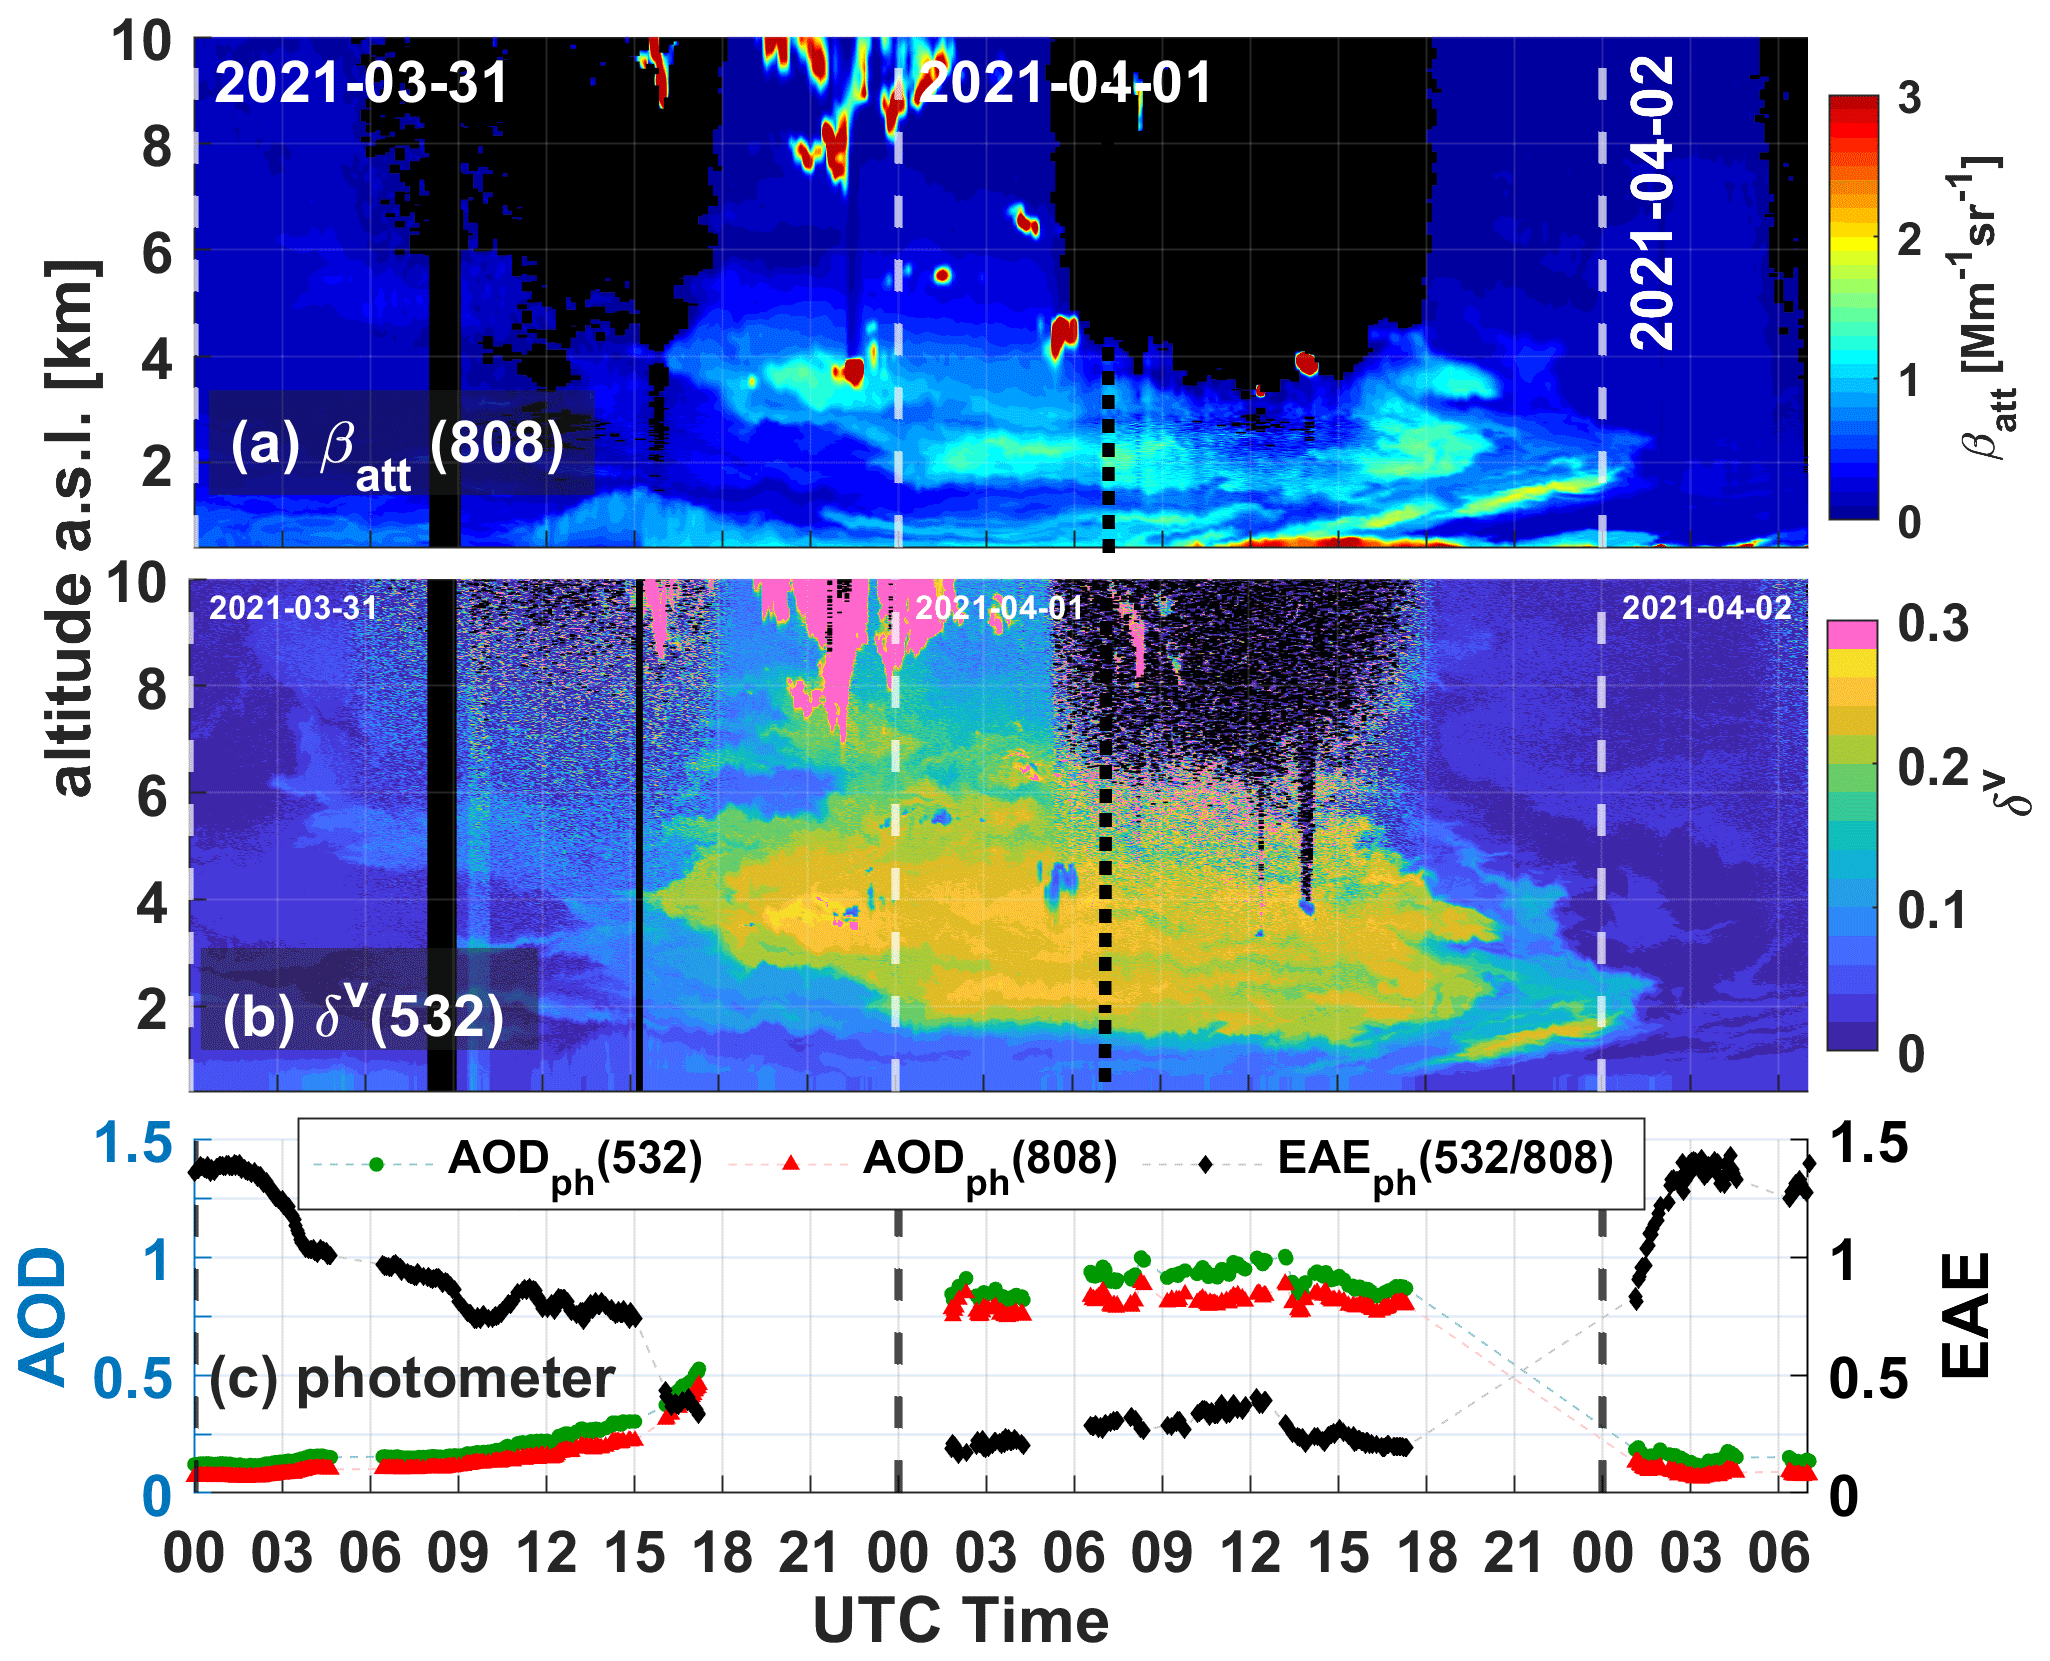
Figure 3Overview of synergetic measurements of METIS lidar and CE318-T photometer during an event of Saharan dust transport from 31 March 2021 to 2 April 2021. Height–temporal variation in panel (a) is βatt at 808 nm, (b) VLDR is at 532 nm, and (c) the time series of AODph at 532 and 808 nm with EAEph (532/808 nm) as derived from the photometer. The dashed black line in panels (a) and (b) indicates the change in the measurements conditions for METIS lidar.
The dust event had a period of strong aerosol loading during the night of 31 March 2021 to the afternoon of 1 April 2021. Intrusions of aerosol layers between 1.5 and 8 were observed, with high VLDR values, on average 0.20 ± 0.04 (1 April 2021 at 07:00–19:00 UTC), indicating the presence of non-spherical aerosols. AODph values at 532 and 808 nm increase up to 1 and 0.9, respectively. EAEph (532/808 nm) decreases from 1.4 to 0.2 and is associated with the increase in the coarse-mode particles concentration. Additionally, the VSD derived from photometer observations during 1 April 2021 (Fig. 4) shows the strong predominance of aerosols in the coarse mode with an effective radius of 1.7 µm. Thus, with the identified non-spherical coarse particles, the presence of dust is suggested and corroborated by ancillary analysis using back-trajectories (not shown here). Towards the night of 1–2 April 2021, the dust layers slowly vanish, while a peak of pollution develops close to the surface. A shallow boundary layer (< 500 m) with a strong inversion at the top constrains the mixing of dust within the boundary layer. During the day of 2 April, the EAEph (532/808 nm) increases up to 1.5, and the VLDR decreases below 0.1.
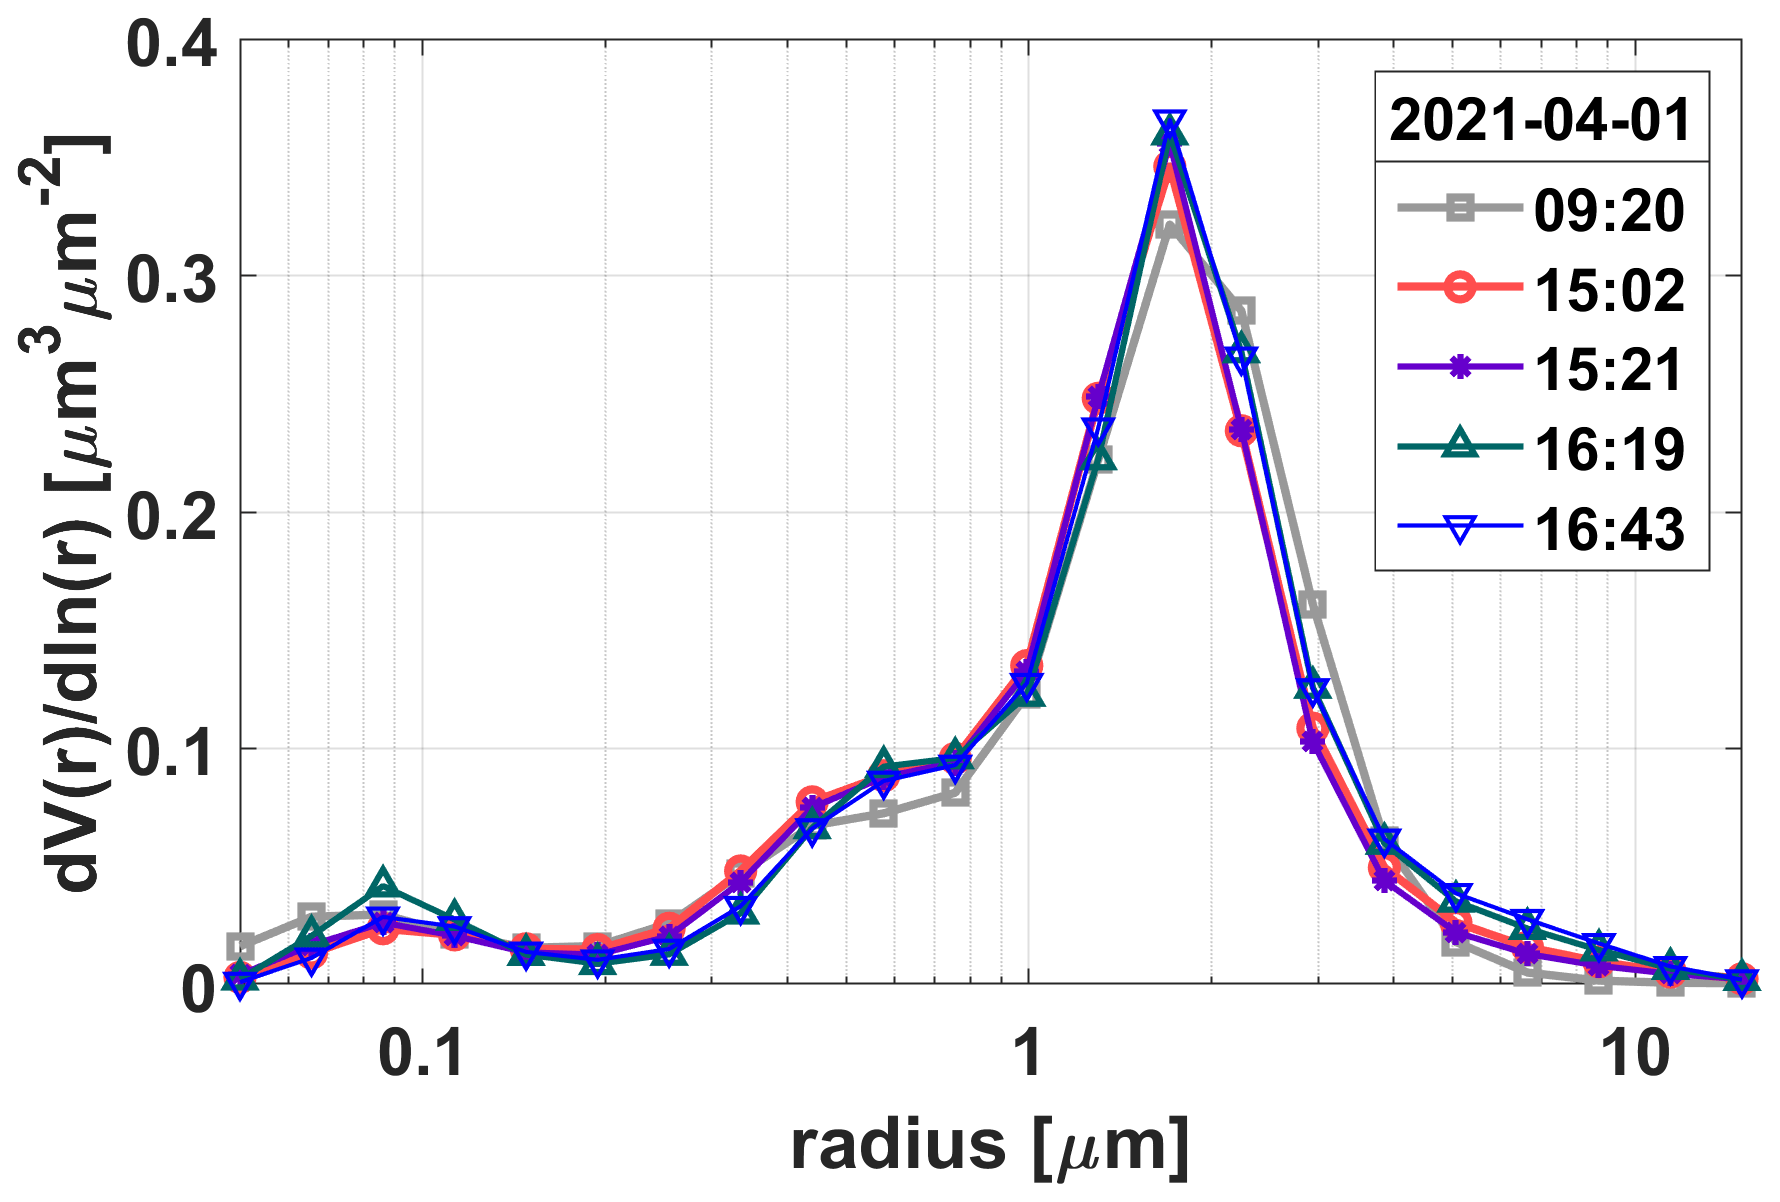
Figure 4VSD derived from CE318-T photometer sky almucantar measurements during 1 April 2021 at ATOLL. Data are level 2 from AERONET version 3 algorithms (Sinyuk et al., 2020).
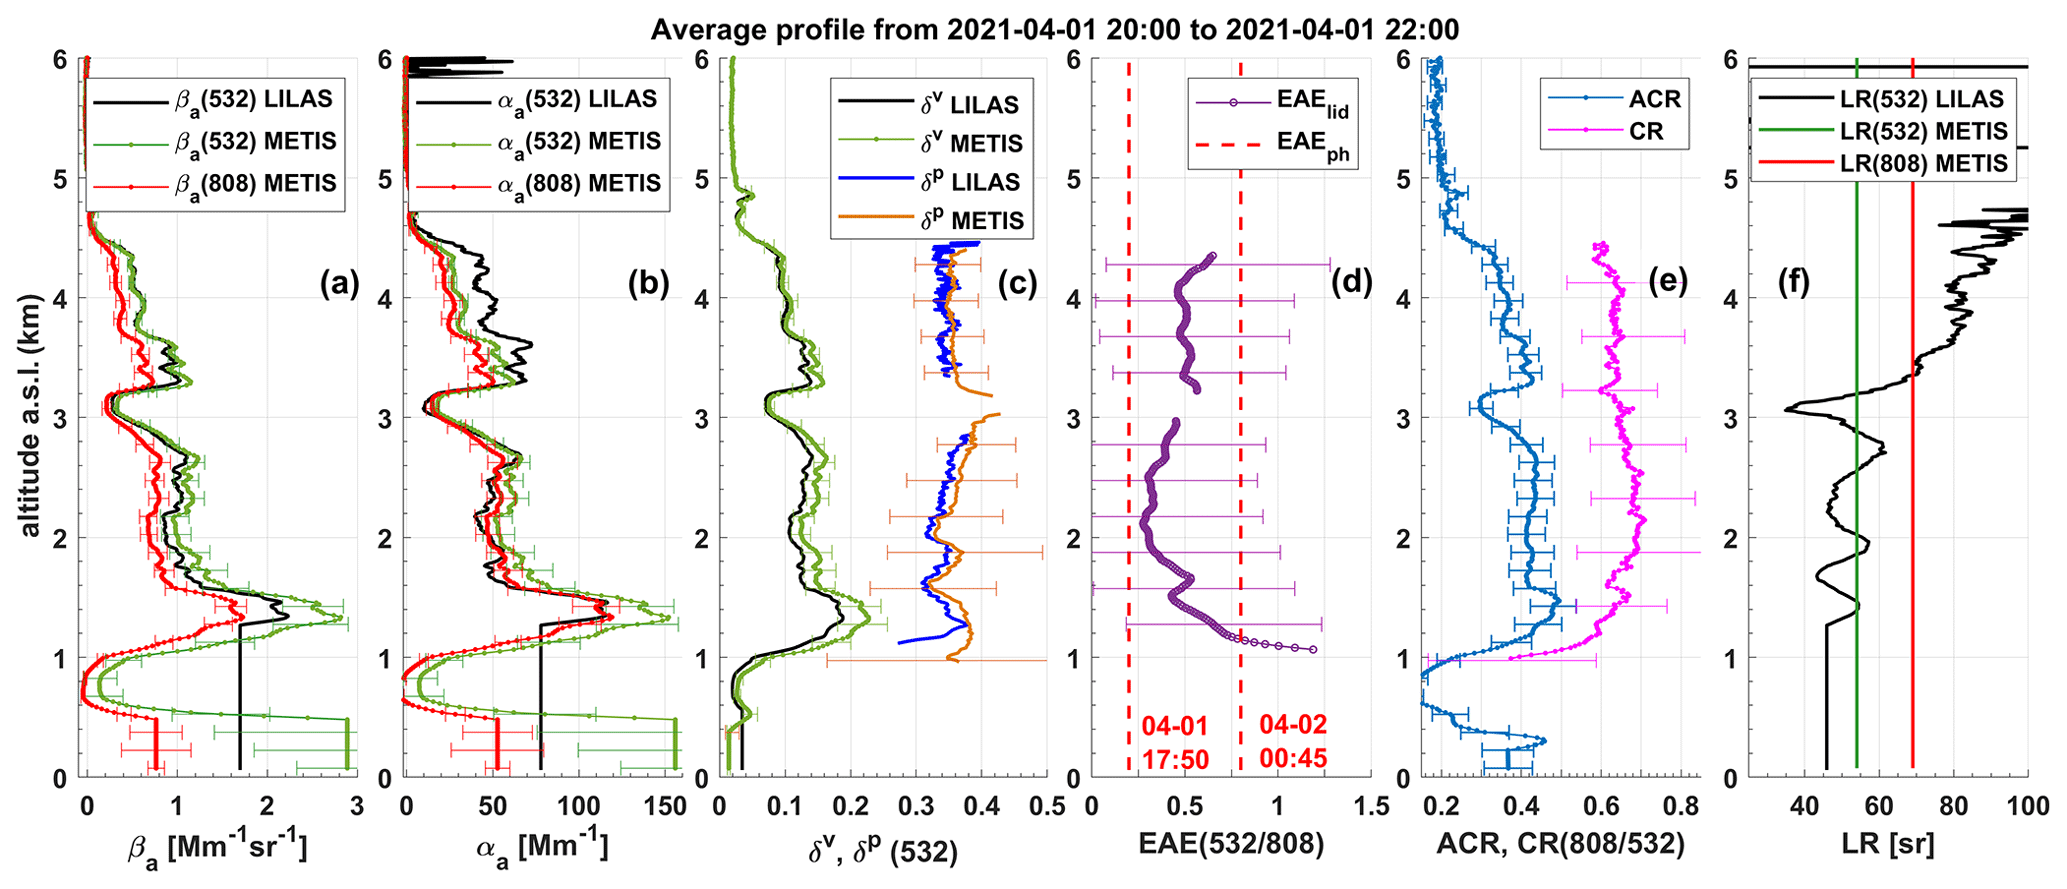
Figure 5Aerosol optical properties derived from METIS CE376 lidar and intercomparison with LILAS Raman lidar retrievals for the averaged measurements between 20:00 and 22:00 UTC on 1 April 2021. Vertical profiles of (a) backscatter, (b) extinction, and (f) LR at 532 and 808 nm for METIS and at 532 nm for LILAS; (c) VLDR and PLDR at 532 nm for METIS and LILAS; (d) EAE (532/808 nm) from METIS and the two closest values from photometer given in dashed red lines; and (e) ACR and CR (808/532 nm) for METIS.
For comparisons of METIS and LILAS, averaged profiles on 1 April between 20:00 and 22:00 UTC were used when Raman measurements from LILAS were available. Aerosol optical properties were derived with the modified two-wavelength method for METIS CE376 lidar, and Raman inversion is used for LILAS. Molecular coefficients were calculated using the radiosonde data taken at 00:00 UTC on 2 April 2021 from the station Herstmonceux. Lunar measurements were not acquired until later that night, so the two closest pairs of AODph were considered to constrain the inversion for METIS on 1 April 2021 at 17:50 and on 2 April 2021 at 00:45 UTC. Hence, backscatter and extinction profiles at 532 and 808 nm for METIS and at 532 nm for LILAS were retrieved and are presented in Fig. 5a and b. VLDR and PLDR at 532 nm for both lidars are also compared (Fig. 5c), as well as LR (Fig. 5f). The ACR and CR of 808–532 nm from METIS are presented (Fig. 5e), as well as EAE (532/808) nm from METIS and the photometer (Fig. 5d). The first 2 km of the RCS at 532 nm are influenced by relative errors of 5 % at 2 km going towards 20 % at 500 m due to the overlap estimations. In the case of RCS at 808 nm, the influence of the overlap error goes from 5 % at 1 km towards 10 % at 150 m. Therefore, to avoid artifacts in the retrievals, RCS values below 500 m are considered constant for both wavelengths. Likewise, PLDR, EAE, and CR values are not shown when the aerosol backscatter at 532 nm is less than 0.3 and below 500 m.
Backscatter and extinction profiles comparisons show good agreement between the Cimel CE376 elastic lidar and LILAS Raman lidar. The differences in the extinction observed are related to the constant LR of 54 ± 3 sr for METIS retrievals at 532 nm. From the profile of LR at 532 nm for LILAS (Fig. 5f), we can see that the first layer between 1.5–3 is 48 sr on average, which is in contrast with 72 sr for the second layer between 3.3–4.7 Thus, a better agreement in the lower layer than within the second layer, especially for extinction coefficients, is observed. From METIS retrievals, the first layer extinction values are on average 61 ± 14 and 52 ± 10 Mm−1 at 532 and 808 nm, respectively. Extinction values in the second layer are in contrast slightly lower, with 43 ± 3 and 35 ± 6 Mm−1 at 532 and 808 nm, respectively. The LR at 808 nm that resulted from the retrievals is 69 ± 4 sr. Absolute differences up to 0.03 for the METIS PLDR profile with respect to LILAS are observed. METIS shows VLDR and PLDR values within the two layers of 0.14 ± 0.02 and 0.36 ± 0.05, respectively, which is comparable to values reported in previous works for Saharan dust transport (Ansmann et al., 2003; Haarig et al., 2022; Floutsi et al., 2023). Lower EAE values (0.4) were observed for the first layer compared to 0.5 for the second layer. The ACR (808/532 nm) and CR (808/532 nm) profiles show values of 0.42 ± 0.05 and 0.69 ± 0.14, respectively, for the lower layer and 0.38 ± 0.04 and 0.65 ± 0.12 at the second layer. These results suggest the presence of two different air masses with larger dust aerosols in the lower layer, which is also shown in the LR profile from LILAS lidar.
METIS showed PLDR values 10 % higher than LILAS under the same operational conditions. This bias comes from differences in the optical design proper to the instruments and that METIS uses a manual half-wave plate for the polarization calibration, while LILAS uses a motorized PBS mount with an obvious higher precision.
4.2.2 Saharan dust and smoke transport over Lille (17 to 20 July 2022)
Several heat waves crossed Europe during spring–summer 2022, meaning that air masses from the equatorial region (North Africa) moved northwards, pushing temperatures up in several areas, especially in western Europe. The unusual long periods of heat during spring intensified the dry conditions for the summer. Moreover, due to the dry vegetation, extreme high temperatures, and high winds, multiple fires were ignited in southwestern Europe in July–August 2022. Unprecedented wildfires started on 12 July 2022 in the Gironde department, southwestern France, and intensified during a heat wave passing and strong winds over ∼ 270 km2 of burned surface which accounted for the highest forest losses in France. During this event, biomass burning smoke injected to the atmosphere by the wildfires mixed with the mineral dust transported within the hot air masses originating over northern Africa. Therefore, at the time that the heat wave traversed Lille, we detected both dust and smoke in the atmospheric column. For this case, METIS was performing measurements under the current operational conditions, i.e., adapted roof window and air conditioning. To assess the continuity of the aerosol optical properties, the closest data points from the photometer are used to constrain the inversion when measurements from photometer are not available.
An overview of the derived aerosol properties from METIS and photometer is presented in Fig. 6 for the period of 17 to 20 July 2022 when the dust and smoke particles were detected up to 6 km altitude. From height–temporal variations in Fig. 6a–d, two periods can be distinguished during the event. On 17 July 2022, a predominant layer of ∼ 1.5 km width appears that is quite homogeneously distributed and is observed between 2 and 5 , in contrast to the three compacted layers detected from 18 until 19 July 2022 12:00 UTC. Contrary to the complexity observed with the lidar, the temporal series from the photometer are quite stable (Fig. 6e).
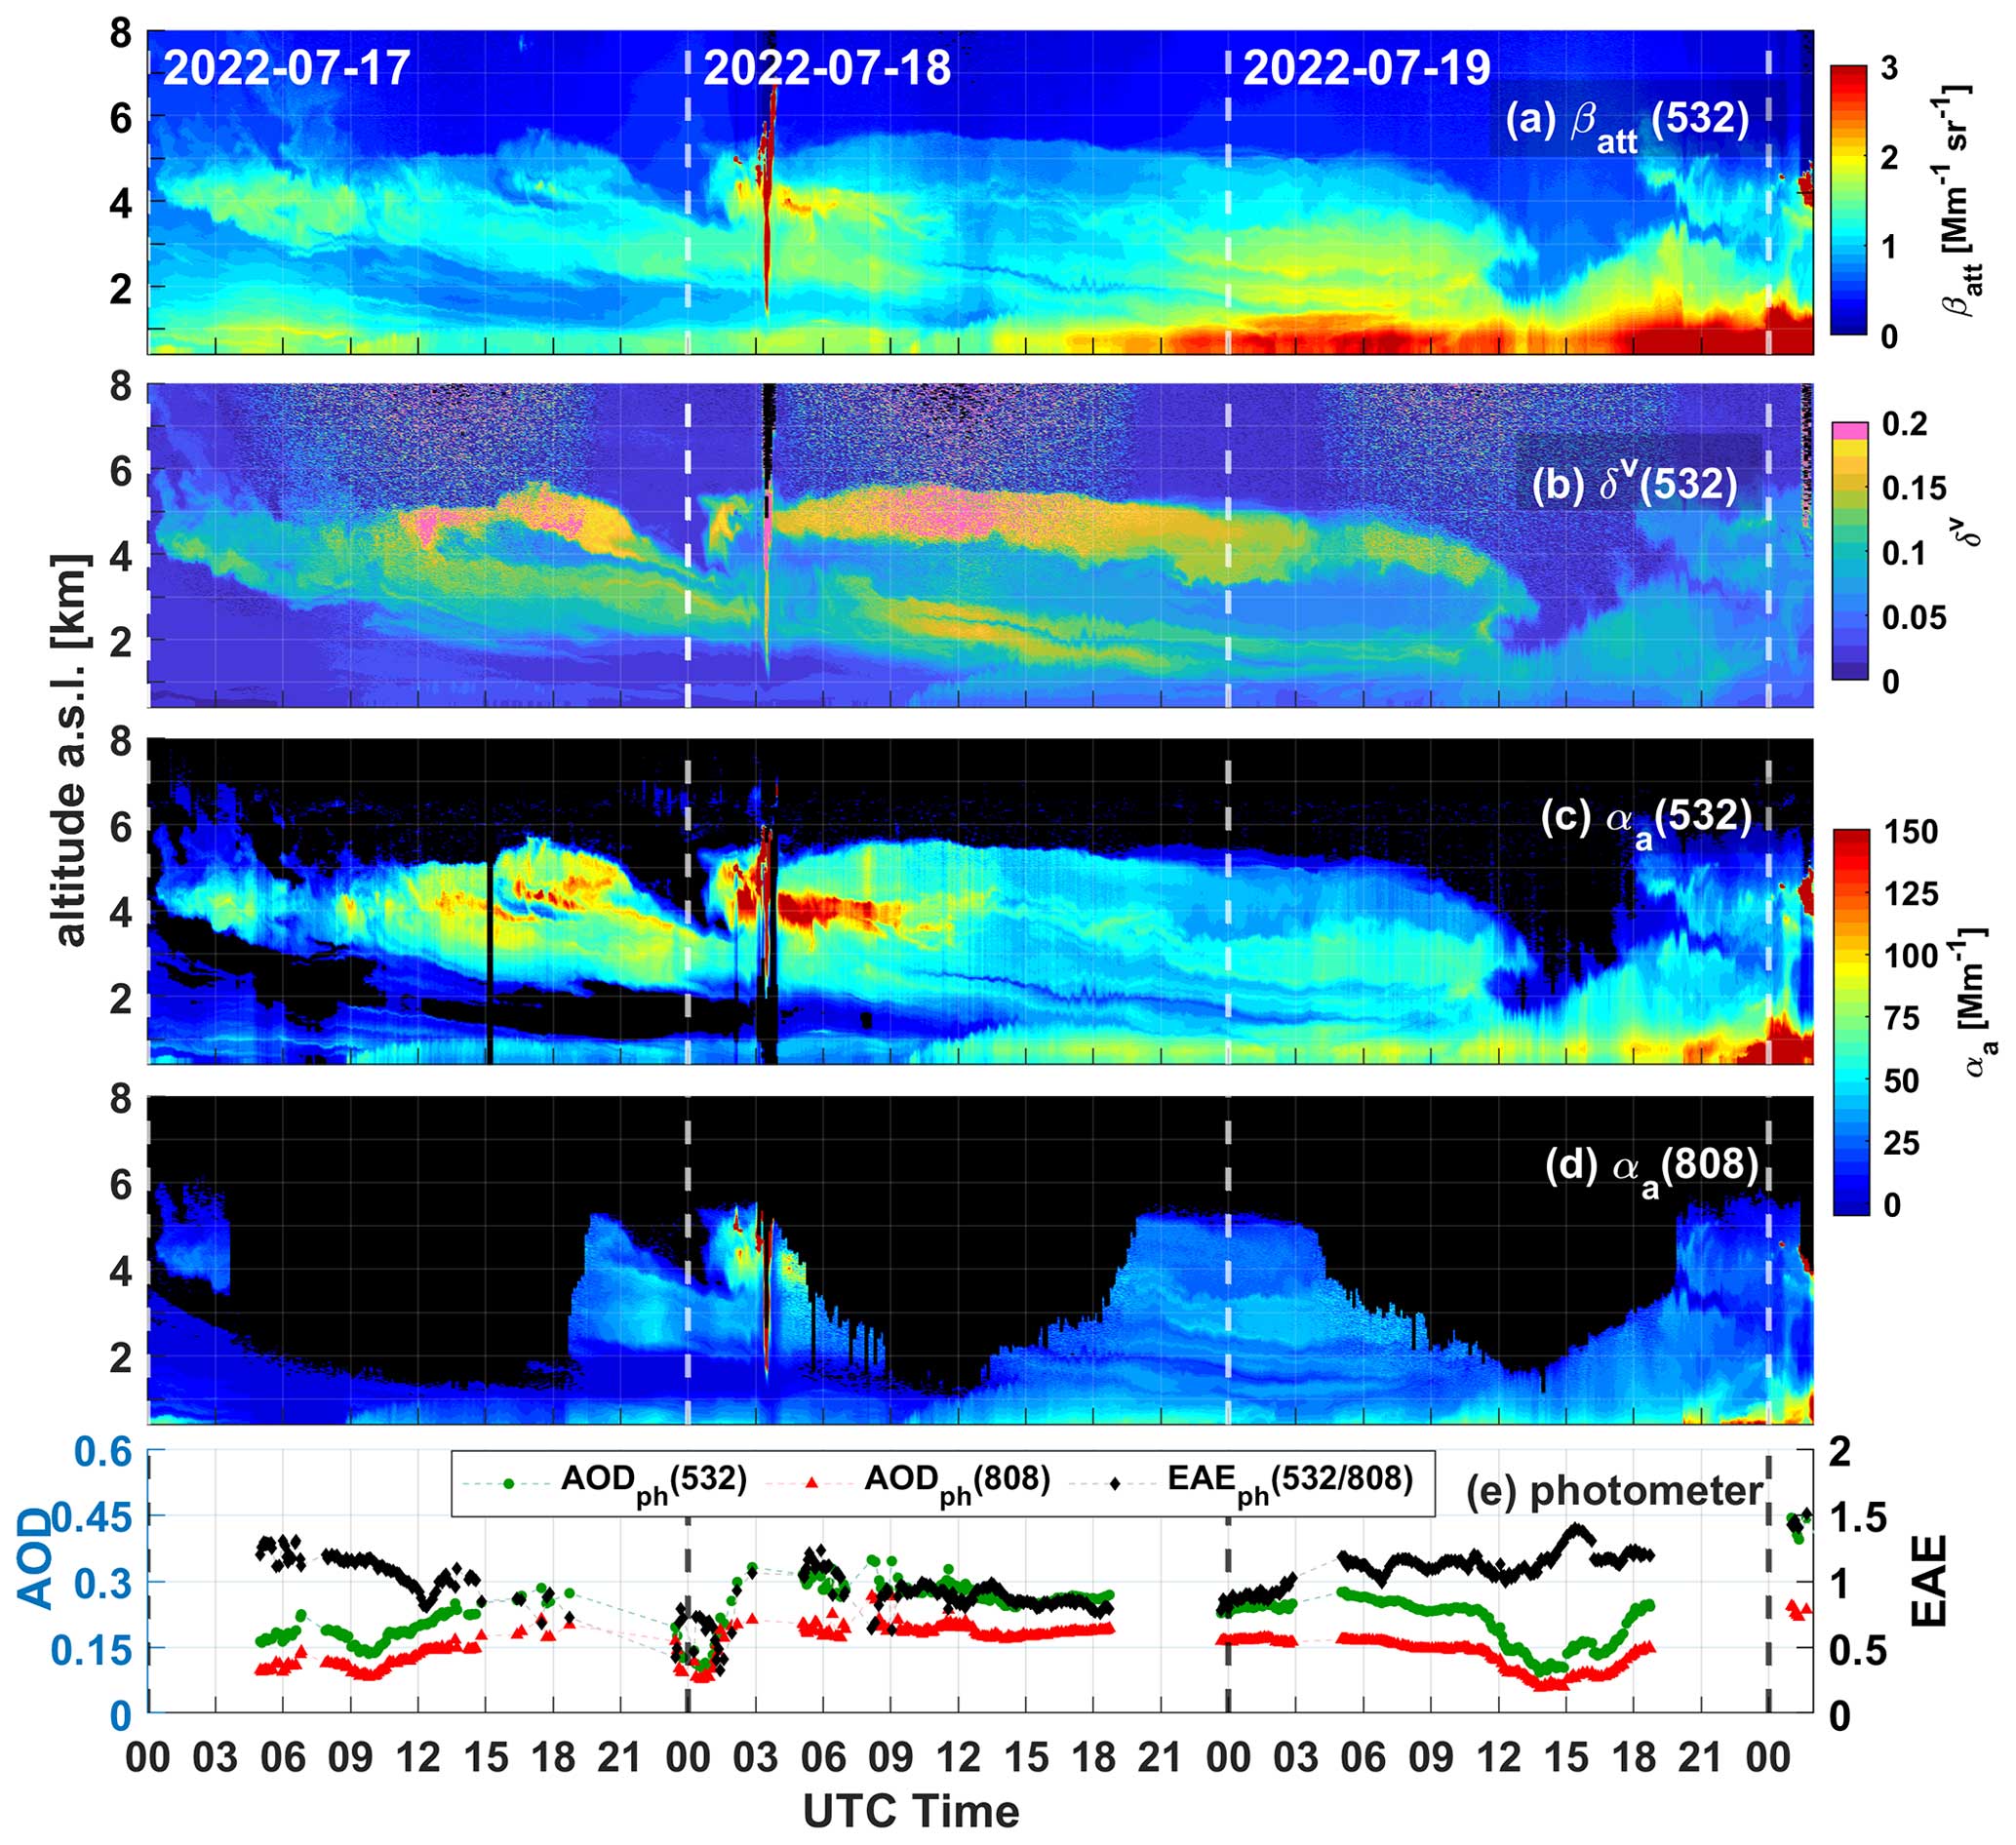
Figure 6Overview of atmospheric optical properties from synergetic measurements of METIS lidar and CE318-T Sun/lunar photometer at ATOLL platform from 17 to 20 July 2022. Height–temporal variation in the (a) βatt and (b) VLDR at 532 nm, aerosol extinction at (c) 532 nm and (d) 808 nm, and (e) time series of AODph at 532 and 808 nm with EAEph 532/808,nm, southwestern France, derived from the photometer.
For the first period on 17 July 2022, aerosol optical properties are on average 0.10 ± 0.01 for VLDR, 68 ± 12 Mm−1 (76 ± 34 sr) for extinction (LR) at 532 nm, and 44 ± 9 Mm−1 (33 ± 14 sr) for extinction (LR) at 808 nm, respectively, for the layer at 3–4.5 Only data from 18:00 to 24:00 UTC are considered for 808 nm. During the second period on 18–19 July 2022, the layer from the day before, now reduced to 0.5 km width, is descending from 3 towards 1 and accompanied by two separated layers above it. In particular, we focus our attention on the afternoon of 18 July 2022 to the early morning of 19 July 2022, where quite stable AODph and EAEph are observed. LR is on average 47 ± 6 and 35 ± 8 sr at 532 and 808 nm, respectively. The second layer (2.4–3.2 ) shows lower VLDR values of 0.07 ± 0.01 and higher extinction (50 ± 3 Mm−1 at 532 nm and 36 ± 2 Mm−1 at 808 nm) than the other two layers. The third layer (3.2–4.5 ) is, in comparison, characterized by higher VLDR (0.12 ± 0.02) and lower extinction (40 ± 2 Mm−1 at 532 nm and 25 ± 1 Mm−1 at 808 nm). VLDR values are similar to those observed towards the end of the pure dust event presented in Sect. 4.2.1. Towards 12:00 UTC on 19 July 2022, the three layers disappear while the boundary layer height increases and probably mixes with the layer closer to the ground.
The VSD distributions during the event (Fig. 7) showed the predominance of three aerosol sizes, namely one in the fine mode centered at 0.11 µm radius, and two in the coarse mode centered at 1.7 µm and 5 µm. On 18 July 2022 (Fig. 7b), five VSDs were retrieved, all having a higher concentration than the day before (Fig. 7a); only one VSD in the morning is offset with higher values (0.15 µm) for the fine-mode peak. On 19 July 2022 (Fig. 7c), seven VSDs were retrieved, with four of them in the morning showing the same shape as the ones from 18 July. The rest of the VSDs show higher contribution at 5 µm size, representing the conditions after 15:00 UTC on 19 July which correspond to a drop in the AOD values and the vanishing of the layers. Therefore, the presence of both smoke (fine-mode) and dust (coarse-mode) aerosols is suggested during the entire event (Fig. 7) and confirmed by the ancillary analysis using back-trajectories (not shown here) with mainly two different stages in the aerosol vertical distributions (Fig. 6).
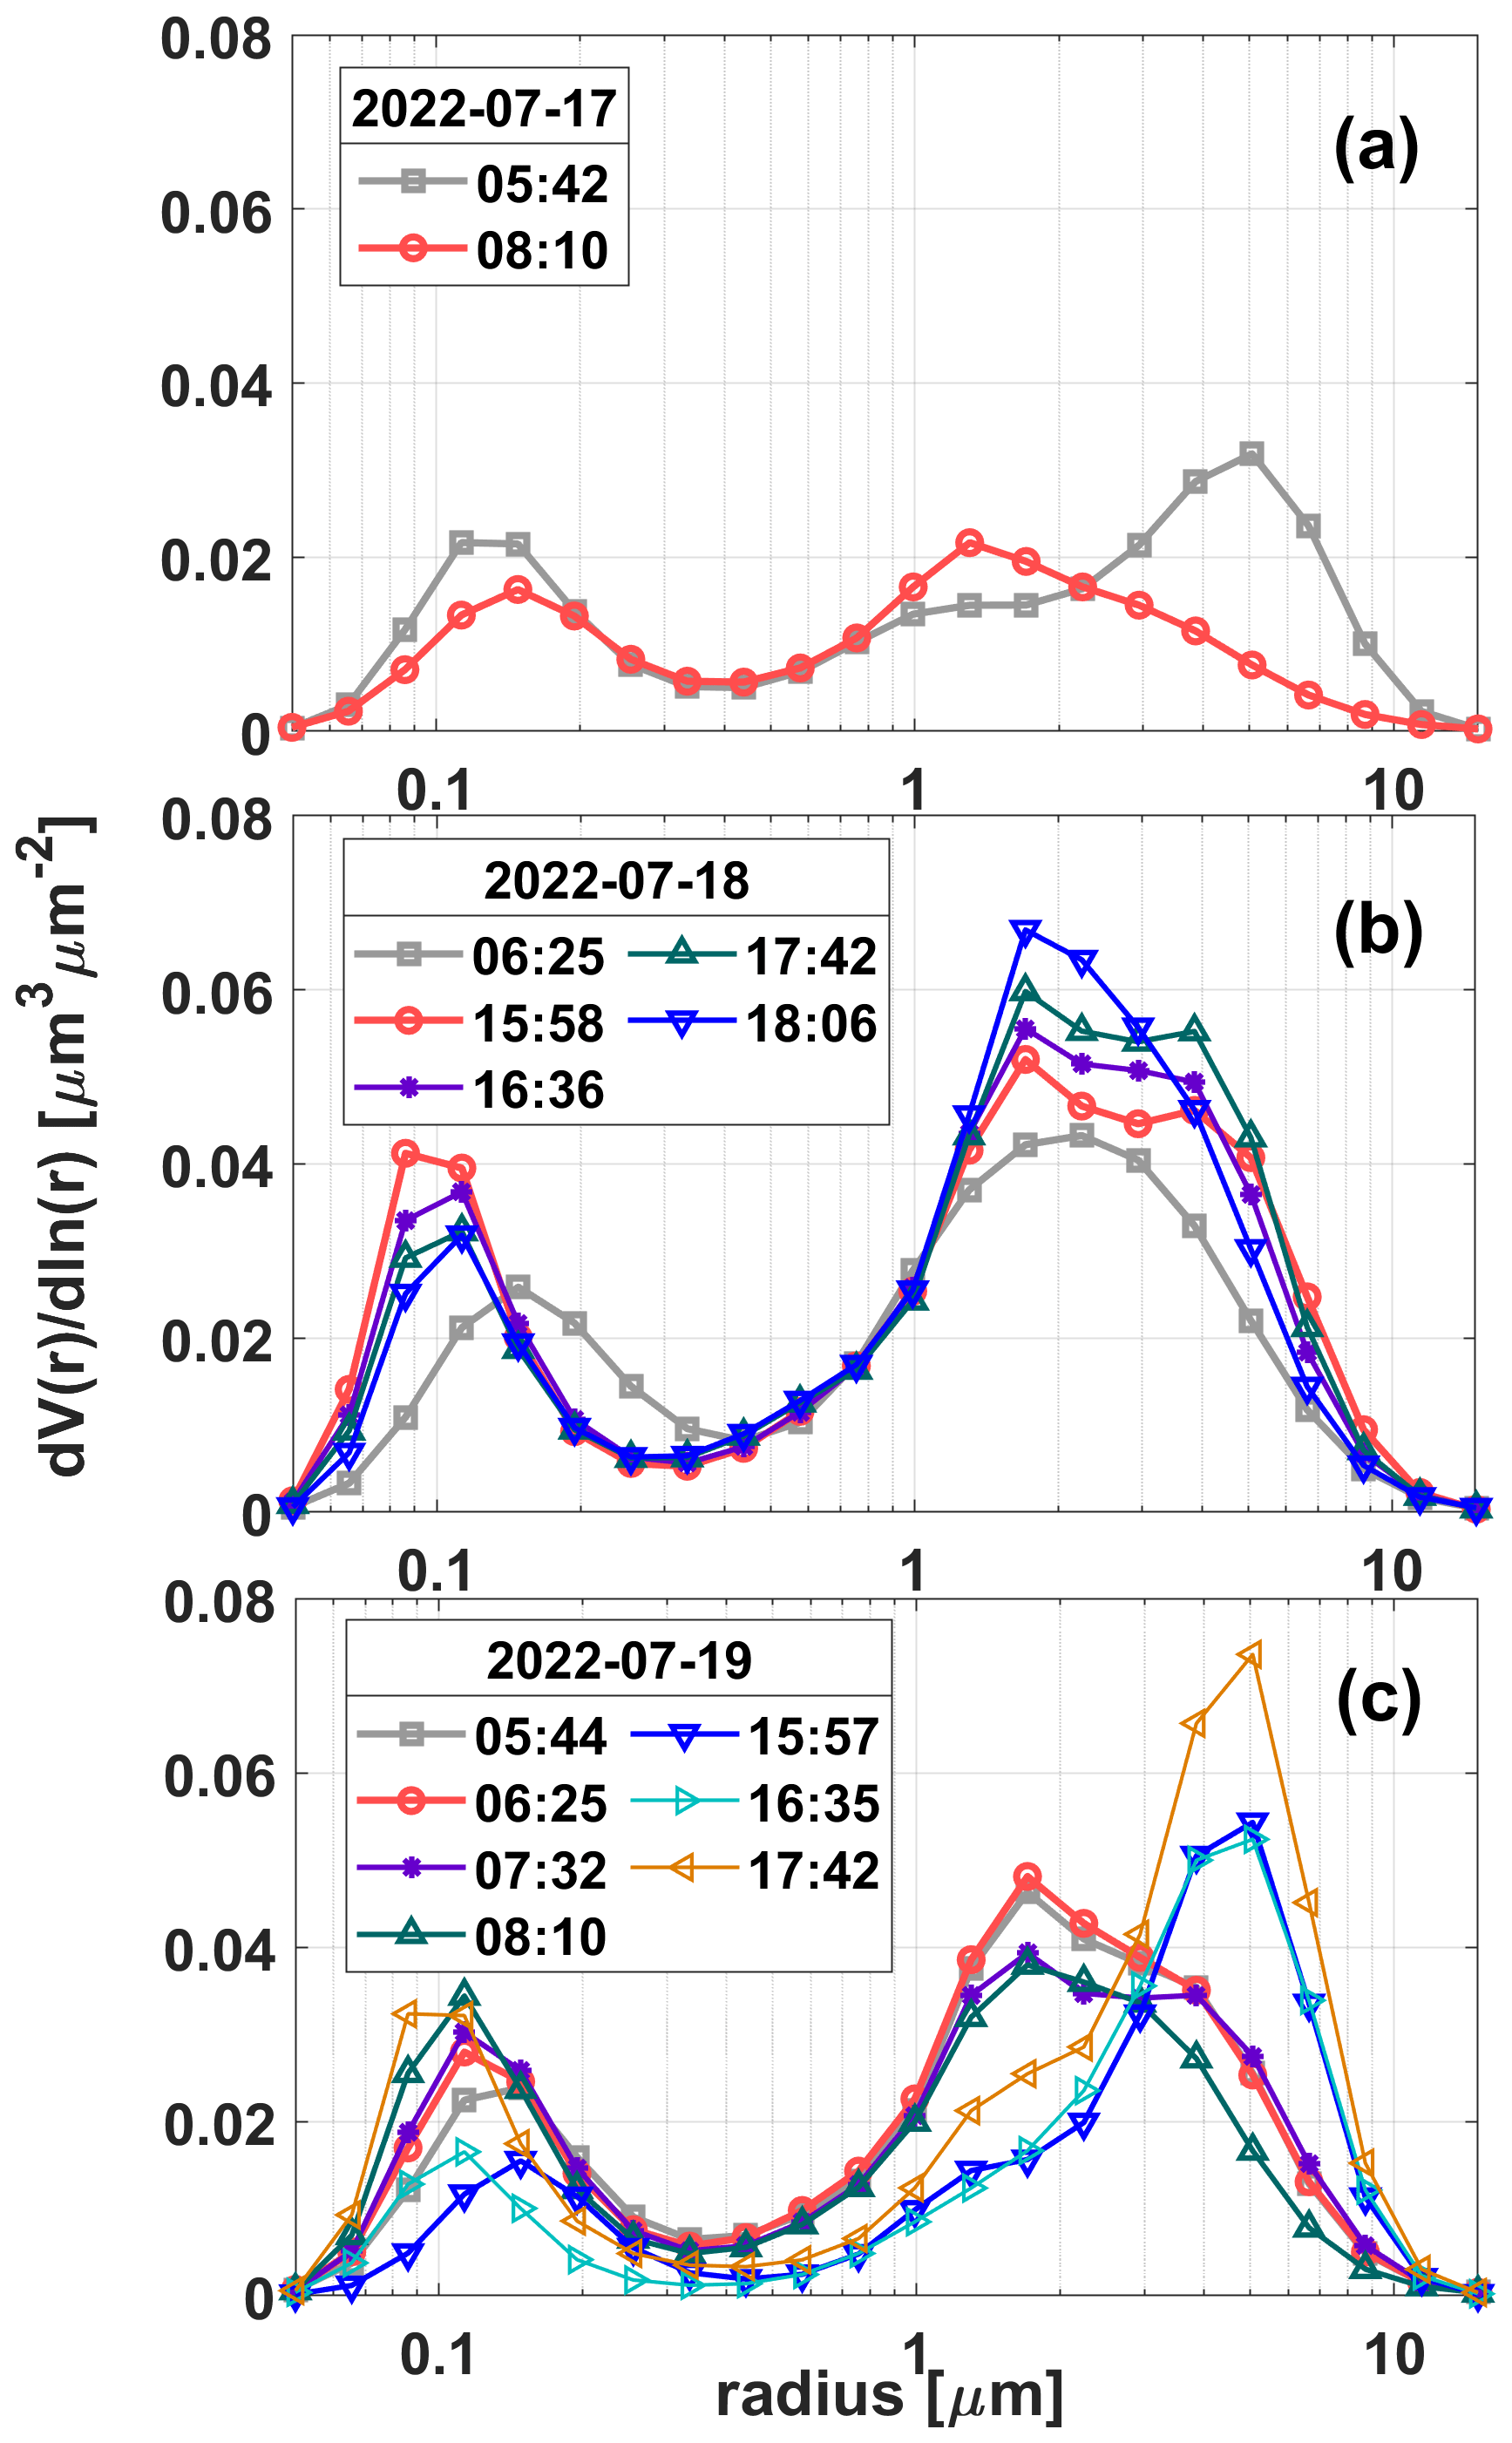
Figure 7VSD derived from CE318-T photometer sky almucantar measurements during (a) 17 July 2022, (b) 18 July 2022, and (c) 19 July 2022 at ATOLL. Data are level 2 from AERONET version 3 algorithms (Sinyuk et al., 2020).
For comparisons of METIS and LILAS, averaged profiles between 01:00 and 03:00 UTC on 19 July 2022 are used (when Raman measurements from LILAS are available). The lunar measurements available are averaged during the same time period to constrain the inversion for METIS. During this event, LILAS lidar got affected by the extreme environmental conditions, so a higher incomplete overlap is acknowledged, and we will not consider retrieval comparisons below 1.7 km. Also, METIS overlap corrections induce errors in the first 2 km of the RCS at 532 nm from 3 % at 2 km going towards 20 % at 600 m. For RCS at 808 nm, the influence of the overlap error goes from 5 % at 600 m towards 20 % at 100 m. For derived properties using both RCS, values are therefore considered constant below 600 m. Once again, PLDR, EAE, and CR values are not shown when the aerosol backscatter at 532 nm is less than 0.3 and at altitudes below 600 m.
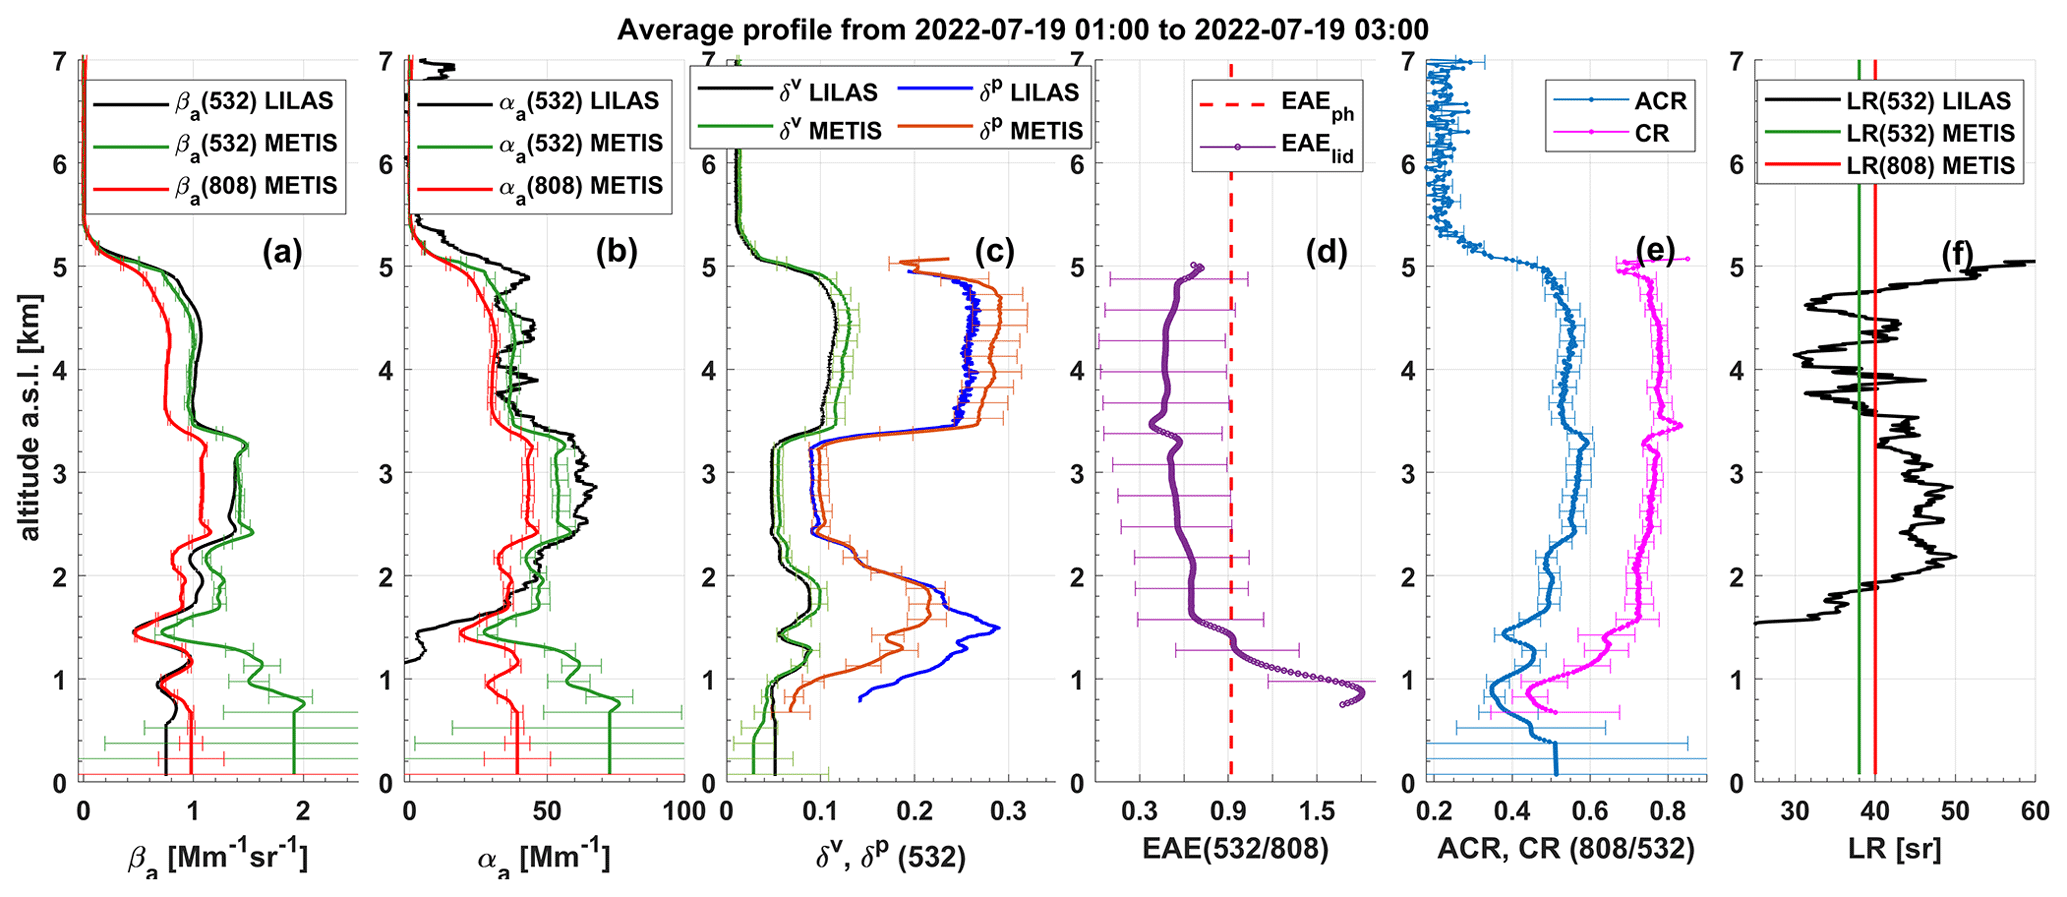
Figure 8Aerosol optical properties derived from METIS and comparison with LILAS retrievals. Same as Fig. 5 but for the averaged measurements between 01:00 and 03:00 UTC on 19 July 2022.
Backscatter coefficient (Fig. 8a) and depolarization ratio (Fig. 8c) comparisons show good agreement between both lidars above 2 , with an obvious influence of the vertically constant LR assumption on METIS for the retrieval of backscatter profiles. The extinction coefficients (Fig. 8b) and consequently the EAE (Fig. 8d) are the most impacted (LR values of 38 ± 2 sr for 532 nm and 40 ± 2 sr for 808 nm), showing the limitation of the inversion method under complex scenarios. However, VLDR and PLDR values calculated from METIS are highly sensitive to the change in the dust–smoke composition within the layers. The first layer between 1.6–2 and the third layer between 3.5–5 showed PLDR (VLDR) values on average 0.20 ± 0.02 (0.09 ± 0.01) and 0.27 ± 0.03 (0.12 ± 0.01), respectively, and both layers have a predominant dust presence. In contrast, the second layer (2.4–3.2 ) yields the unique presence of smoke aerosols with PLDR (VLDR) of 0.09 ± 0.01 (0.05 ± 0.01), which is in accordance with reported values of fresh smoke transported 1 d from the source (Balis et al., 2003; Ansmann et al., 2009; Tesche et al., 2009b; Alados-Arboledas et al., 2011). Therefore, EAE values (Fig. 8d) are expected to be higher than 1 for the second layer, which is not the case due to the use of vertically constant LR. Moreover, ACR values directly derived from METIS measurements are influenced by the aerosol attenuation but are still sensitive to the different layers, in contrast to the CR profile derived from the inversion. Furthermore, the limitations discussed can be reduced by adding iterative processes to obtain layer-independent LR, as proposed by Lu et al. (2011).
Thanks to the operational improvements for the roof window of METIS, a reduced relative PLDR bias of 12 % with respect to LILAS is achieved. The results shown here are evidence of the relevant upgrades in the CE376 system relative to the previous model CE370 for an enhanced aerosol characterization. Furthermore, the algorithmic assessment presented in the first part of the results provided us with necessary tools to evaluate the data acquired during the FIREX-AQ campaign.
In this work, we presented the dual-wavelength CE376 lidar that gives access to valuable information on the particles size with the measurements at two wavelengths and on aerosol shape using the depolarization measurements. The capabilities of the instrument regarding the continuous monitoring and characterization of aerosols have been presented in Sect. 4. Furthermore, the CE376 lidar is automatic, lightweight, and compact, which are favorable attributes for its installation in a reduced space. In comparison with bulky high-power lidars, the CE376 does not demand constant maintenance or high-power consumption. Therefore, the CE376 has been proposed to continue the developments on remote sensing mobile exploratory platforms.
In this section, we present a first dataset obtained with the CE376 lidar and photometer on board a mobile platform during the FIREX-AQ campaign in summer 2019. The general description of the campaign's mobile component is presented in Sect. 5.1, with an overview of the spatiotemporal variability in the smoke optical properties observed during the campaign (Sect. 5.1.1). Combined mobile–stationary measurements during the William Flats fire are presented in Sect. 5.2 through case studies.
5.1 FIREX-AQ Dragon Mobile Unit
The extensive field campaign FIREX-AQ, led by NOAA and NASA, was created with broad science targets (Warneke et al., 2023) and mainly focusing on investigating the chemistry and transport of smoke from wildfires and agricultural burning with the aim of improving weather, air quality, and climate forecasts. FIREX-AQ has been organized during summer 2019 over the northwestern US, where intense wildfires and agricultural fires seasonally occur. In order to evaluate and study the smoke properties at the source and its transport on a local and regional scale, remote sensing instruments were installed in both stationary and mobile DRAGON (Distributed Regional Aerosol Gridded Observations Networks) payloads, in addition to the permanent AERONET sites (Holben et al., 2018). In total, three DRAGON networks were installed in Missoula (Montana), Taylor Ranch (Idaho), and McCall (Idaho), and two mobile units with photometer–lidar were deployed.
The two mobile units called DMU-1 and DMU-2 (Dragon Mobile Unit), both equipped with a photometer and lidar, performed on-road mobile measurements around major fires sources. The installation of the remote sensing instruments in the DMUs followed the design of the MAMS (Mobile Aerosol Monitoring System) platform (Popovici et al., 2018). DMU-2 was equipped with CE370 mono-wavelength lidar and PLASMA Sun photometer, both tested and used in prior mobile campaigns (Popovici et al., 2018; Hu et al., 2019; Popovici et al., 2022). DMU-1 was equipped with an early version of CE376, a two-wavelength polarization lidar, and with the CE318-T Sun–sky–lunar photometer (ship-borne CE318-T). Depolarization measurements at 532 nm followed a configuration with φ = 0°, measuring the parallel component on the PBS transmitted branch (Rs > Rp with Rs ∼ 1, Tp > Ts and considering and ). The measurements were taken through an open hatch in the rooftop of the vehicles, so there was no influence of a window on the depolarization measurements. The temperature control inside both mobile units was not possible during mobile measurements (only using the car's air conditioning), so stationary and in-movement measurements were alternated with pauses to preserve the instruments' performance, especially during daytime when extremely high temperatures and dry conditions were met. Particularly for the 532 nm channels of the CE376 lidar, the overlaps were affected by the daily evolution of temperatures that varied some days from 15 °C during nighttime to 40 °C during daytime. Therefore, only quality-assured data are considered for the inversion scheme in this work. Moreover, the temperature effect was accounted for in the overlap correction from where relative errors of 10 % at 2 km that increased to 30 % at 400 m are estimated and propagated on the derived aerosol properties.
5.1.1 Overview of smoke optical property distribution
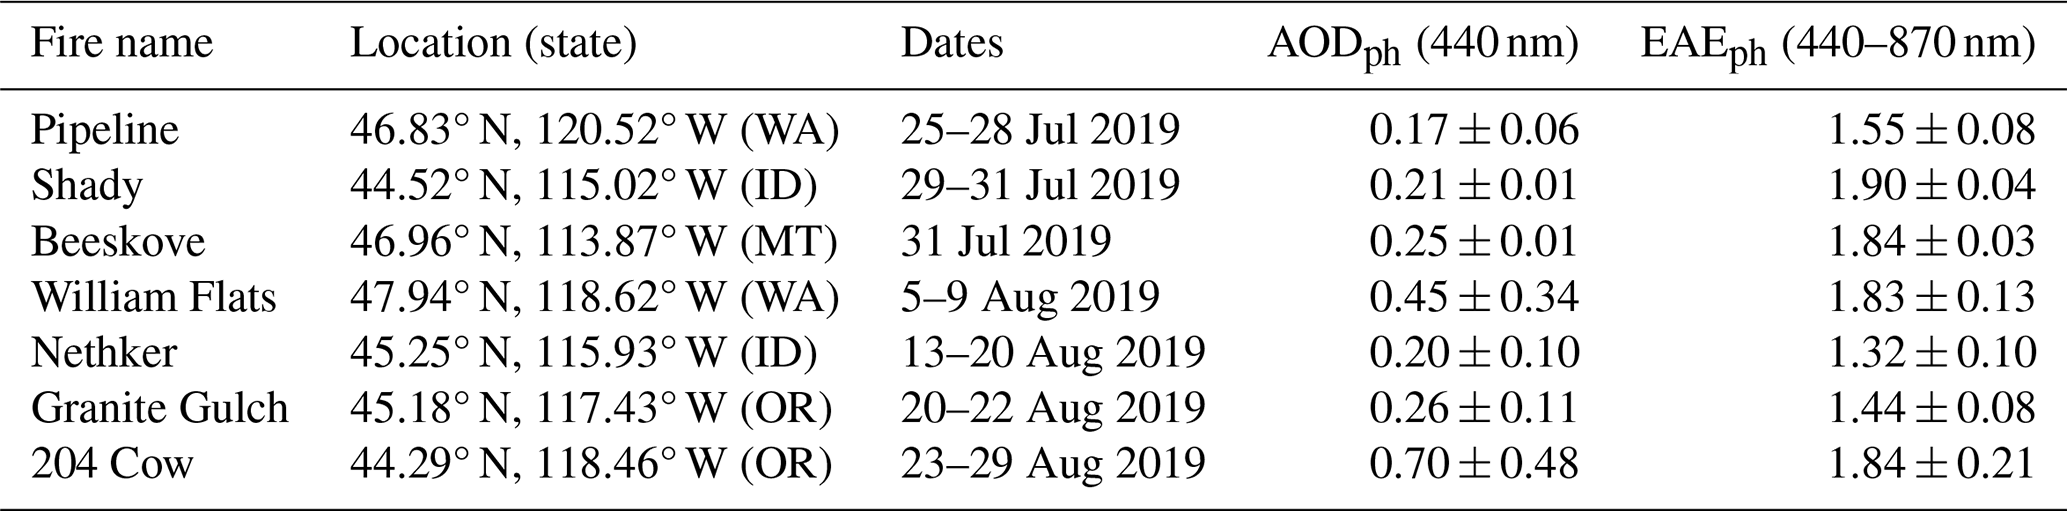
Both DMUs performed measurements along the roads around the major fire sources. Although the extreme conditions, such as high temperatures, topography, and the presence of thick smoke plumes, limited the performance of the instruments, we were able to investigate smoke optical properties close to the source and downwind. A general overview of the column-integrated optical properties during the campaign is provided by photometer mobile observations around seven fire sources (Table 2). Measurements in and out of smoke plumes within ∼ 150 km from the fires are presented as average values of AODph (440 nm) and EAEph (440–870 nm). The high concentration of fine-mode aerosols (expected for fresh smoke) is detected at a regional level, with EAEph (440/870 nm) always higher than 1.3 and varying 5 % from the averages at each fire. On the other hand, measured AODph (440 nm) values are varying up to 40 % from the averages at each fire, showing a non-homogeneous distribution of aerosols around the source.
Table 2Overview of photometer measurements embarked upon on board DMU-1 (CE318-T) and DMU-2 (PLASMA). Averaged measurements around seven fires sources during the FIREX-AQ campaign.
Adding measurements from the lidar system, a more elaborated study of the spatiotemporal distribution of aerosol properties can be addressed. Therefore, optical properties derived from lidar and photometer measurements are presented in Sect. 5.2 through case studies during William Flats fire.
5.2 William Flats fire at WA, USA (6 to 7 August 2019)
The western US was affected by a persistent deep trough of low pressure in the months prior to FIREX-AQ, resulting in elevated soil/vegetation moisture when the fire season began, which controlled the regional fire spread. However, during the first days of the campaign (22 July–5 August 2019), high-pressure (anticyclone) weather conditions controlled the moisture transport in the mid-troposphere with a wide spread of cloud cover and thunderstorms. Combined with dry conditions in the lower troposphere, precipitation normally evaporated before reaching the ground, allowing the ignition of various fires due to lightning strikes. A low-pressure trough approaching from the west (W) on 6–9 August 2019 broke the high-pressure ridge and increased the surface wind speed gradually. William Flats fire, hereafter abbreviated as WFF, in the northeast (NE) of Washington state was in particular controlled by the unique synoptic weather conditions, with fire spread and smoke release progressively increasing as the low pressure approached. A more detailed description of the synoptic meteorological conditions dominating the campaign can be found in Warneke et al. (2023). Moreover, a camping base has been installed at Fort Spokane (47.905° N, 118.308° W; 430 m a.s.l.), which is located on the east (E) side of the WFF at ∼ 15 km from the source and separated by the Columbia River.
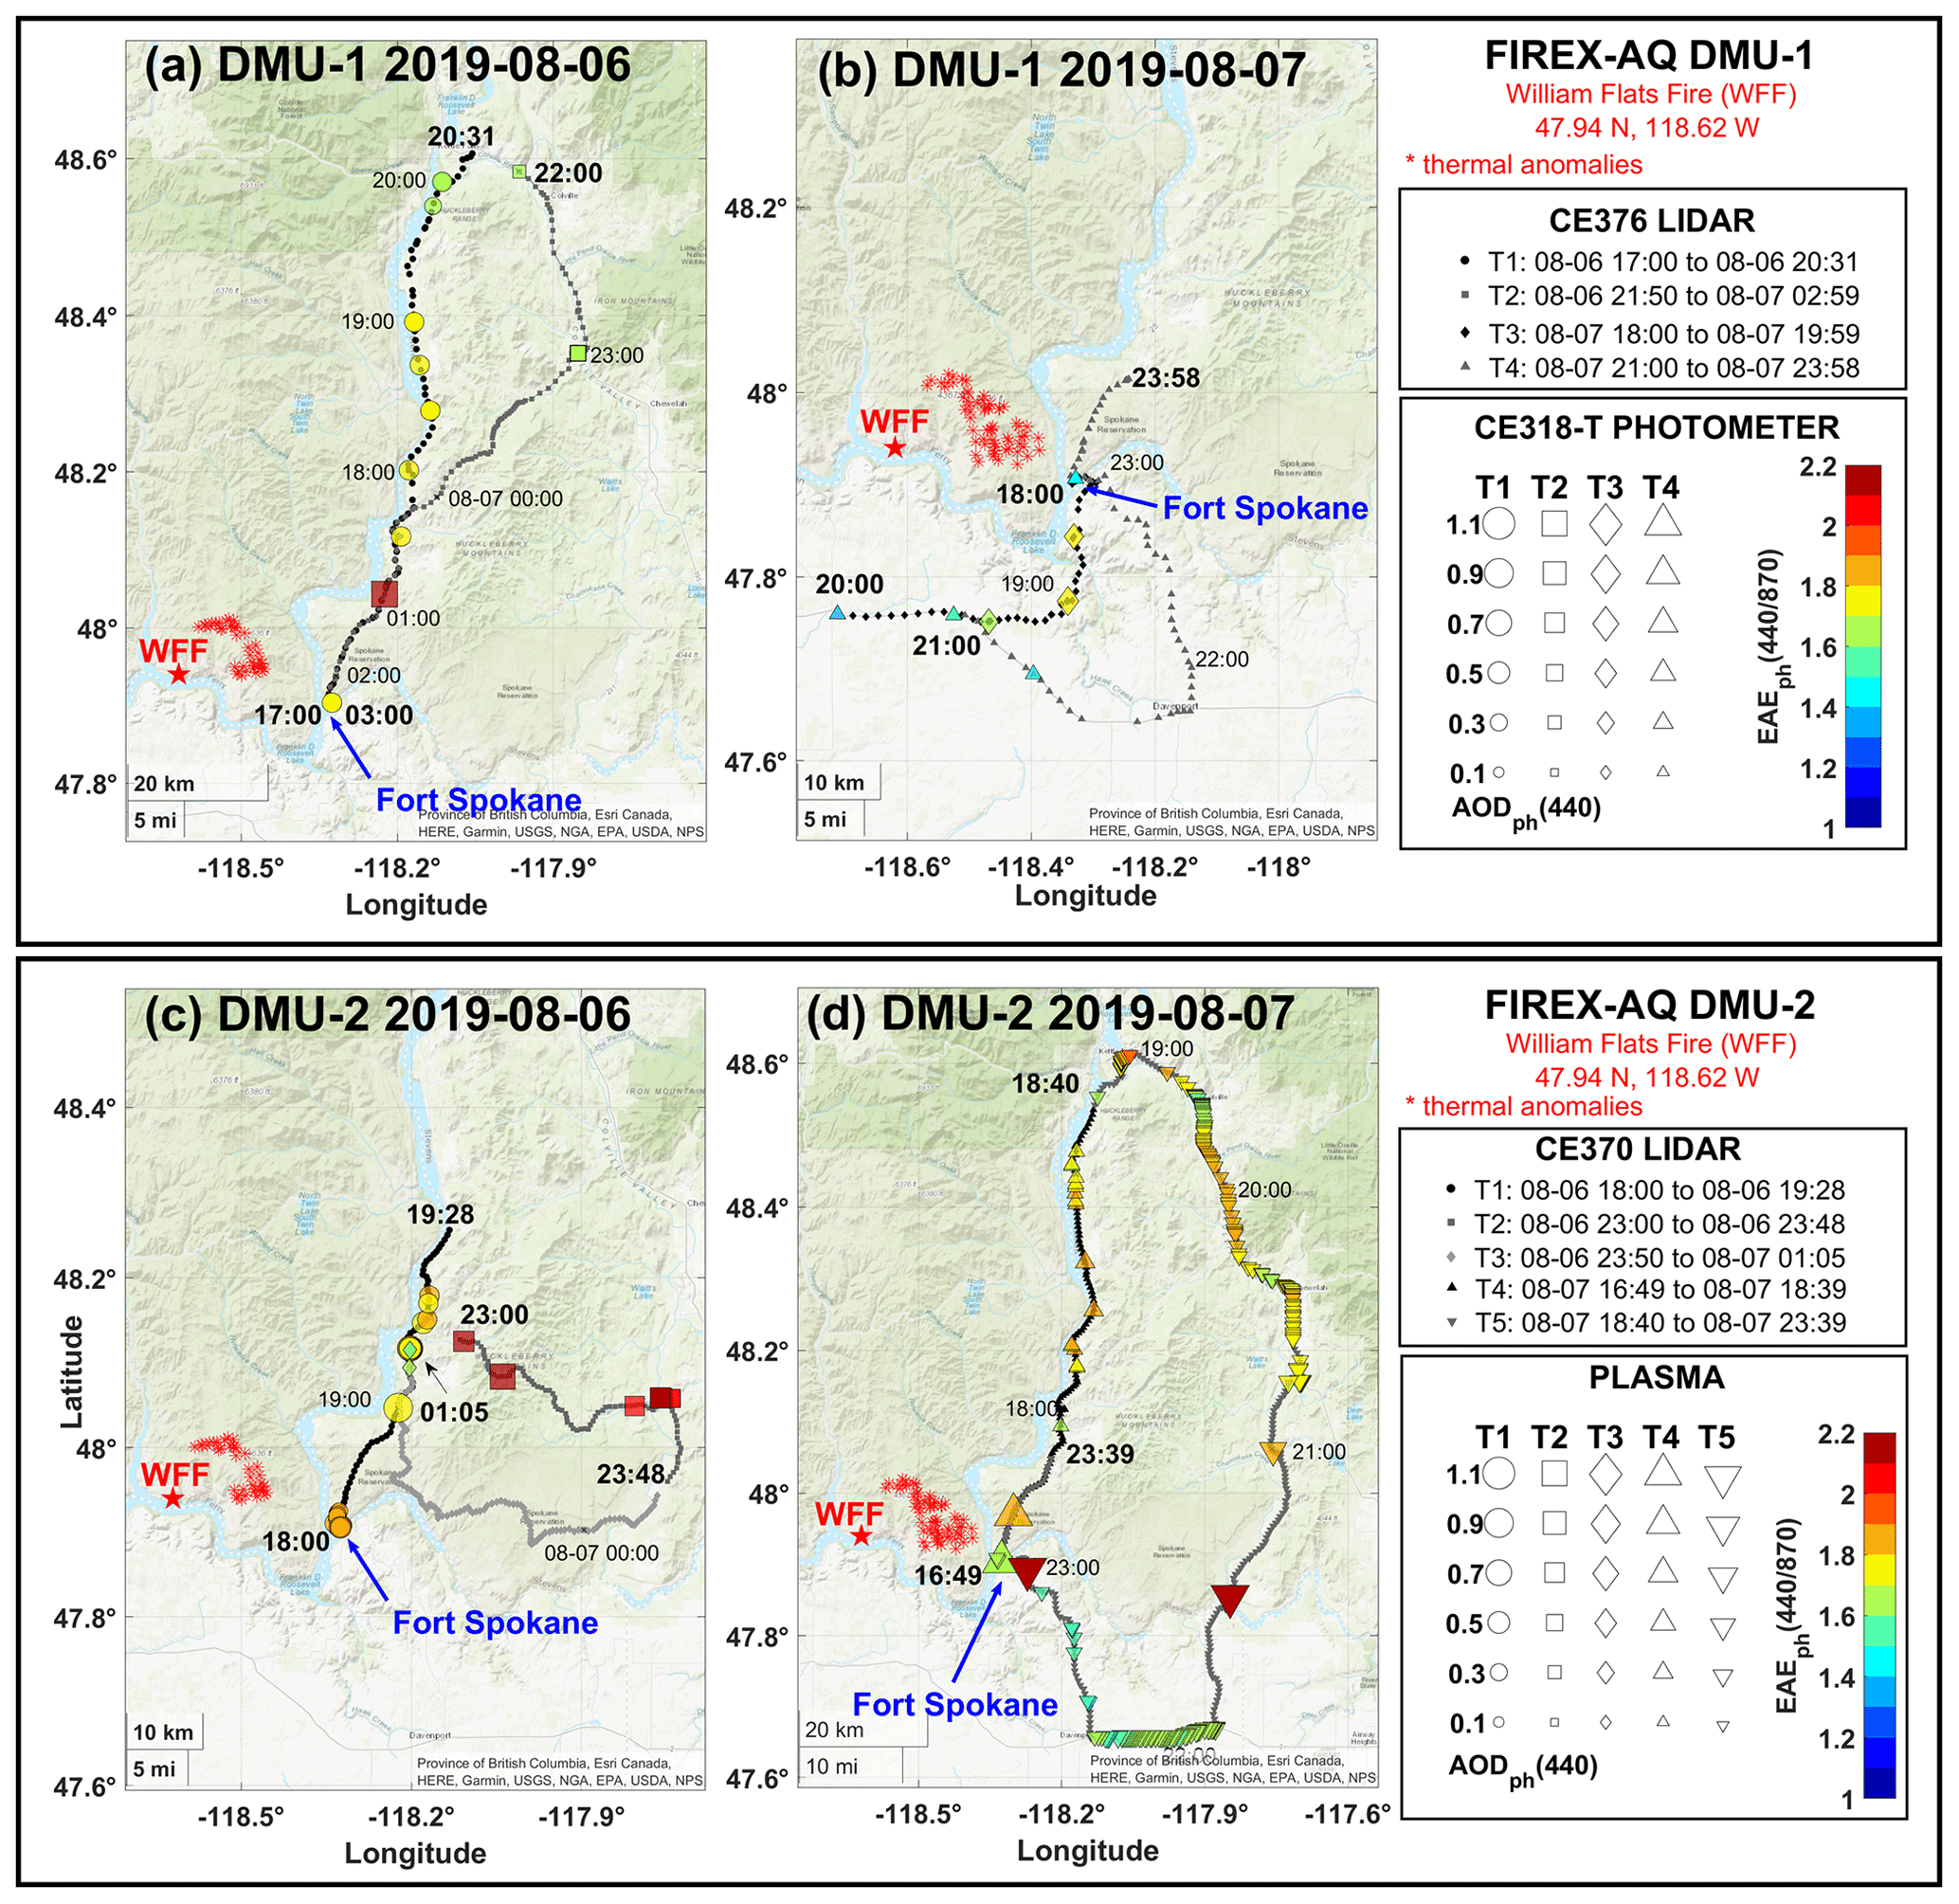
Figure 9Mobile observations around the WFF during 6 and 7 August 2019 (in UTC). GPS tracks of DMU-1 and DMU-2 are presented in the top and bottom panels, respectively. For each trajectory (T), a different symbol is used. Photometer measurements are presented with color-coded symbols, EAEph (440/870) represented by the color and AODph (440) by the symbol size. The ignition point of the WFF is represented by a red star. The extension of the fire is represented by thermal anomalies from MODIS AQUA/TERRA detected during each day.
Mobile observations from selected on-road trajectories completed during 6–7 August 2019 are examined to reveal the distribution of aerosol properties around the active WFF. Thus, the GPS track of lidar measurements and the photometer observations from both DMU-1 and DMU-2 are displayed in Fig. 9. The selected trajectories (T) for DMU-1 (T1 to T4), in the top panel, and for DMU-2 (T1 to T5), in the bottom panel, are represented by different symbols. The time used to cover each of them is indicated in the legend and also at the top of the maps, and all times are in UTC (local time + 7 h). In addition, the AODph values at 440 nm from both photometers are given by the symbol size, and EAEph values at 440–870 nm are color-coded. To simplify the reading of this section, AODph values refer to AODph values at 440 nm, and EAEph values refer to EAEph values at 440–870 nm when wavelengths are not specified. The fire ignition point is indicated in the maps with a red star symbol, and Fort Spokane is shown with a blue arrow. The extension of the active fire for each day are represented with the thermal anomalies, or hot spots, from the satellite-based sensor MODIS (Moderate Resolution Imaging Spectroradiometer). The MODIS Thermal anomalies product is derived from the Terra and Aqua satellites, and it is available to the public through NASA Worldview (https://wvs.earthdata.nasa.gov, last access: 23 October 2023).
The CE318-T photometer aboard DMU-1 was adapted and used for the ship-borne type of mobile measurements, i.e., for slow motion, before the campaign. Therefore, some difficulties were faced when using a car, especially due to the velocity and the complexity of the terrain and roads. The sun-tracking and geolocation communication were not fast enough for these particular conditions. As a solution, stationary measurements of 5 to 15 min were performed along the DMU-1 trajectories to increase the density of observations with CE318-T photometer. On the other hand, PLASMA Sun photometer was able to successfully perform on-road observations, with difficulties mainly due to the presence of mountains when Sun elevations are low and in presence of dense smoke plumes. Differences in both photometer performances are clear in Fig. 9. In general, both DMU-1 and DMU-2 observations during 6–7 August 2019 show the predominance of fine aerosols with EAEph values always higher than 1.4, as well as high variability in the aerosol distribution with AODph ranging from 0.1 to 1.1. For a further interpretation of the photometer mobile observations, it is convenient to mention the solar azimuth during the WFF. Hence, at sunrise (∼ 13:40 UTC), the azimuth is 68° (NEE); at solar noon (∼ 21:00 UTC), it is 180.4° (S) with an elevation of 58.7°; and at sunset (∼ 04:40+1 d UTC), the azimuth is 292° (WNW). In the following sub-sections, the analysis of mobile observations from DMU-1 and DMU-2 for each day are presented.
5.2.1 Three-dimensional spatiotemporal variation in the smoke properties
On 6 August 2019, the WFF was spread to the NE from its ignition point, with hot spot land elevations ranging around 0.7–1.2 (Fig. 9a and c). Plumes of emitted smoke were mostly moving to easterly direction with respect to the source. When approaching sunset (∼ 04:40+1 d UTC), the smoke release progressively increased with the temperature rising. Hence, the spatiotemporal distribution of aerosols along the trajectories for both DMU-1 (top panel) and DMU-2 (bottom panel) is presented in Fig. 10. For each trajectory, the 3D spatiotemporal distribution of βatt at 532 nm is plotted on top of the 3D digital elevation model (DEM) map of the region. The DEM used is the product with 1 arcsec global coverage (∼ 30 m resolution) from Shuttle Radar Topography Mission (SRTM) that is available through Earth Explorer interface of United States Geological Survey (USGS, https://earthexplorer.usgs.gov/, last access: 23 October 2023). Moreover, both βatt and DEM maps are color-coded, and each one has its own color bar scale. In the same way as in Fig. 9a and c, red points represent the thermal anomalies and show the extension of the active WFF detected on 6 August 2019.
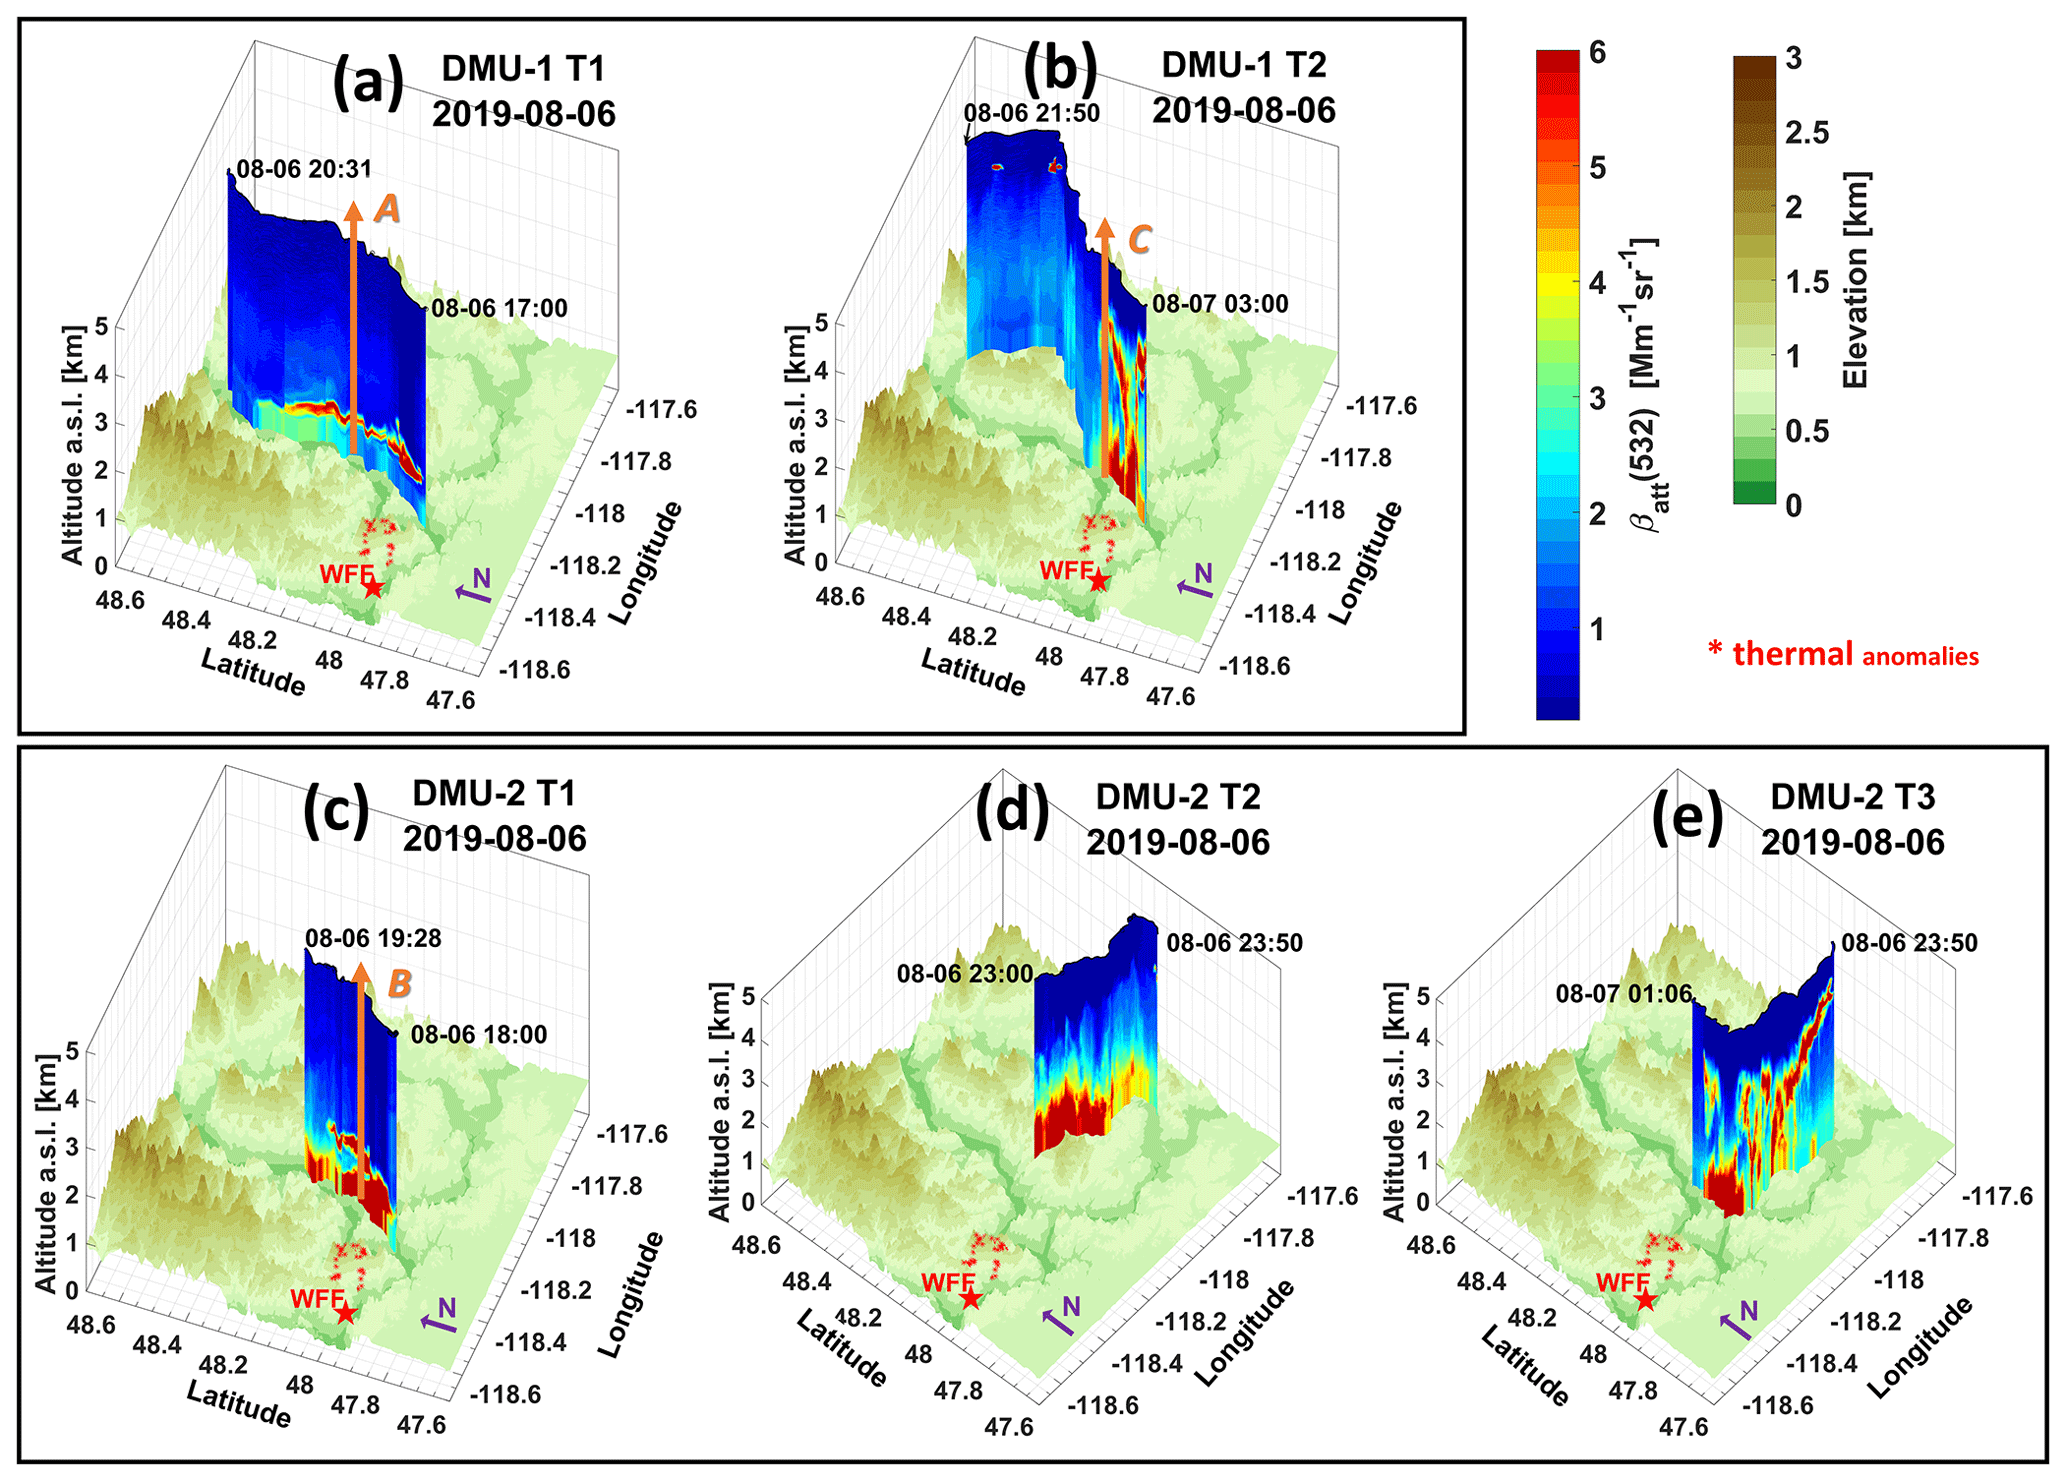
Figure 10Spatiotemporal distribution of total attenuated backscatter at 532 nm for the trajectories during 6 August 2019 from Fig. 9. Trajectories of DMU-1 (CE376 lidar) are presented in the top panel and DMU-2 (CE370 lidar) in the bottom panel. The lidar trajectories are plotted in the top DEM from SRTM at 1 arcsec resolution (∼ 30 m). The ignition point of the WFF is represented by a red star and the extension of the active fire by MODIS thermal anomalies. Orange arrows represent the selected profiles for further analysis in Fig. 12.
During 6 August 2019, residual smoke in all the trajectories was detected up to 4 , and higher AODph and EAEph values were identified under the presence of dense smoke plumes. The Columbia River acted like an air canal with the prevailing valley winds in the morning (De Wekker and Kossmann, 2015; Whiteman, 2000), directing a diffused smoke plume northward. The trajectory of DMU-1 T1 (Fig. 10a) covered ∼ 80 km between 17:00 and 20:31 UTC along the Columbia riverside going from Fort Spokane to Kettle Falls (48.60° N, 118.06° W). AODph ranged within 0.2–0.3, and EAEph was higher than 1.6 (Fig. 9a). DMU-2 T1 (Fig. 10c) covered 40 km of the same route between 18:00 and 19:28 UTC, starting with 30 min of stationary measurements at Fort Spokane. AODph values within 0.3–0.7 and EAEph above 1.7 were observed (Fig. 9c). During both trajectories, azimuthal solar angles vary from 101 to 153° (E to S), meaning that both photometers were taking measurements towards the east side of the WFF against the movement of the vehicles and limited by the mountain slopes. Hence, both DMUs followed and measured the diffuse smoke plume with 1 h time difference. DMU-2 T1 lidar–photometer measurements indicate an increase in smoke release and accumulation northward, with higher AODph and βatt (below 2 ) values.
The trajectory DMU-1 T2 (Fig. 10b and also Fig. 9a) was completed from 21:50 to 02:59 UTC, i.e., in the afternoon, and covered ∼ 100 km on the way back to Fort Spokane from Kettle Falls, passing through the Colville River basin. Hence, the residual smoke that is well mixed up to 4 is contained along the valley, showing AODph varying between 0.3–0.5 and EAEph of 1.6 (solar azimuth 206 to 292°, i.e., photometer pointing to the east side of the WFF towards the WFF). Approaching Fort Spokane, the development of a convective smoke plume was observed (Fig. 10b). One exceptional sampling of the dense smoke plume was possible at ∼ 01:00 UTC and 20 km east, away from the fire, with an AODph of 1.1 and EAEph of 2.2 (Fig. 9a). DMU-2 T2 (Fig. 10d and also Fig. 9c) performed measurements in the afternoon from 23:00 to 23:48 UTC, going downwind of the WFF and covering ∼ 50 km horizontally to the east (solar azimuth 228 to 245°, i.e., towards the WFF). This trajectory in particular shows how smoke accumulated and settled across the valleys. High AODph values above 0.7 and EAEph values above 2 (Fig. 9c) were observed. DMU-2 T3 (Fig. 10e) also completed during the afternoon (23:50–01:05 UTC), covering the return route to Fort Spokane. While it got closer to the source, higher values of βatt (> 6 ) were detected from 4 towards the ground level. Although no photometer data are available due to presence of the thick smoke plume, the lidar provides a glimpse of the convective smoke plume transect. The smoke plume raised up to 4.2 at 50 km away (horizontally to the east) from its source and ∼ 3 km higher than the active fire and above the mountain ridges.
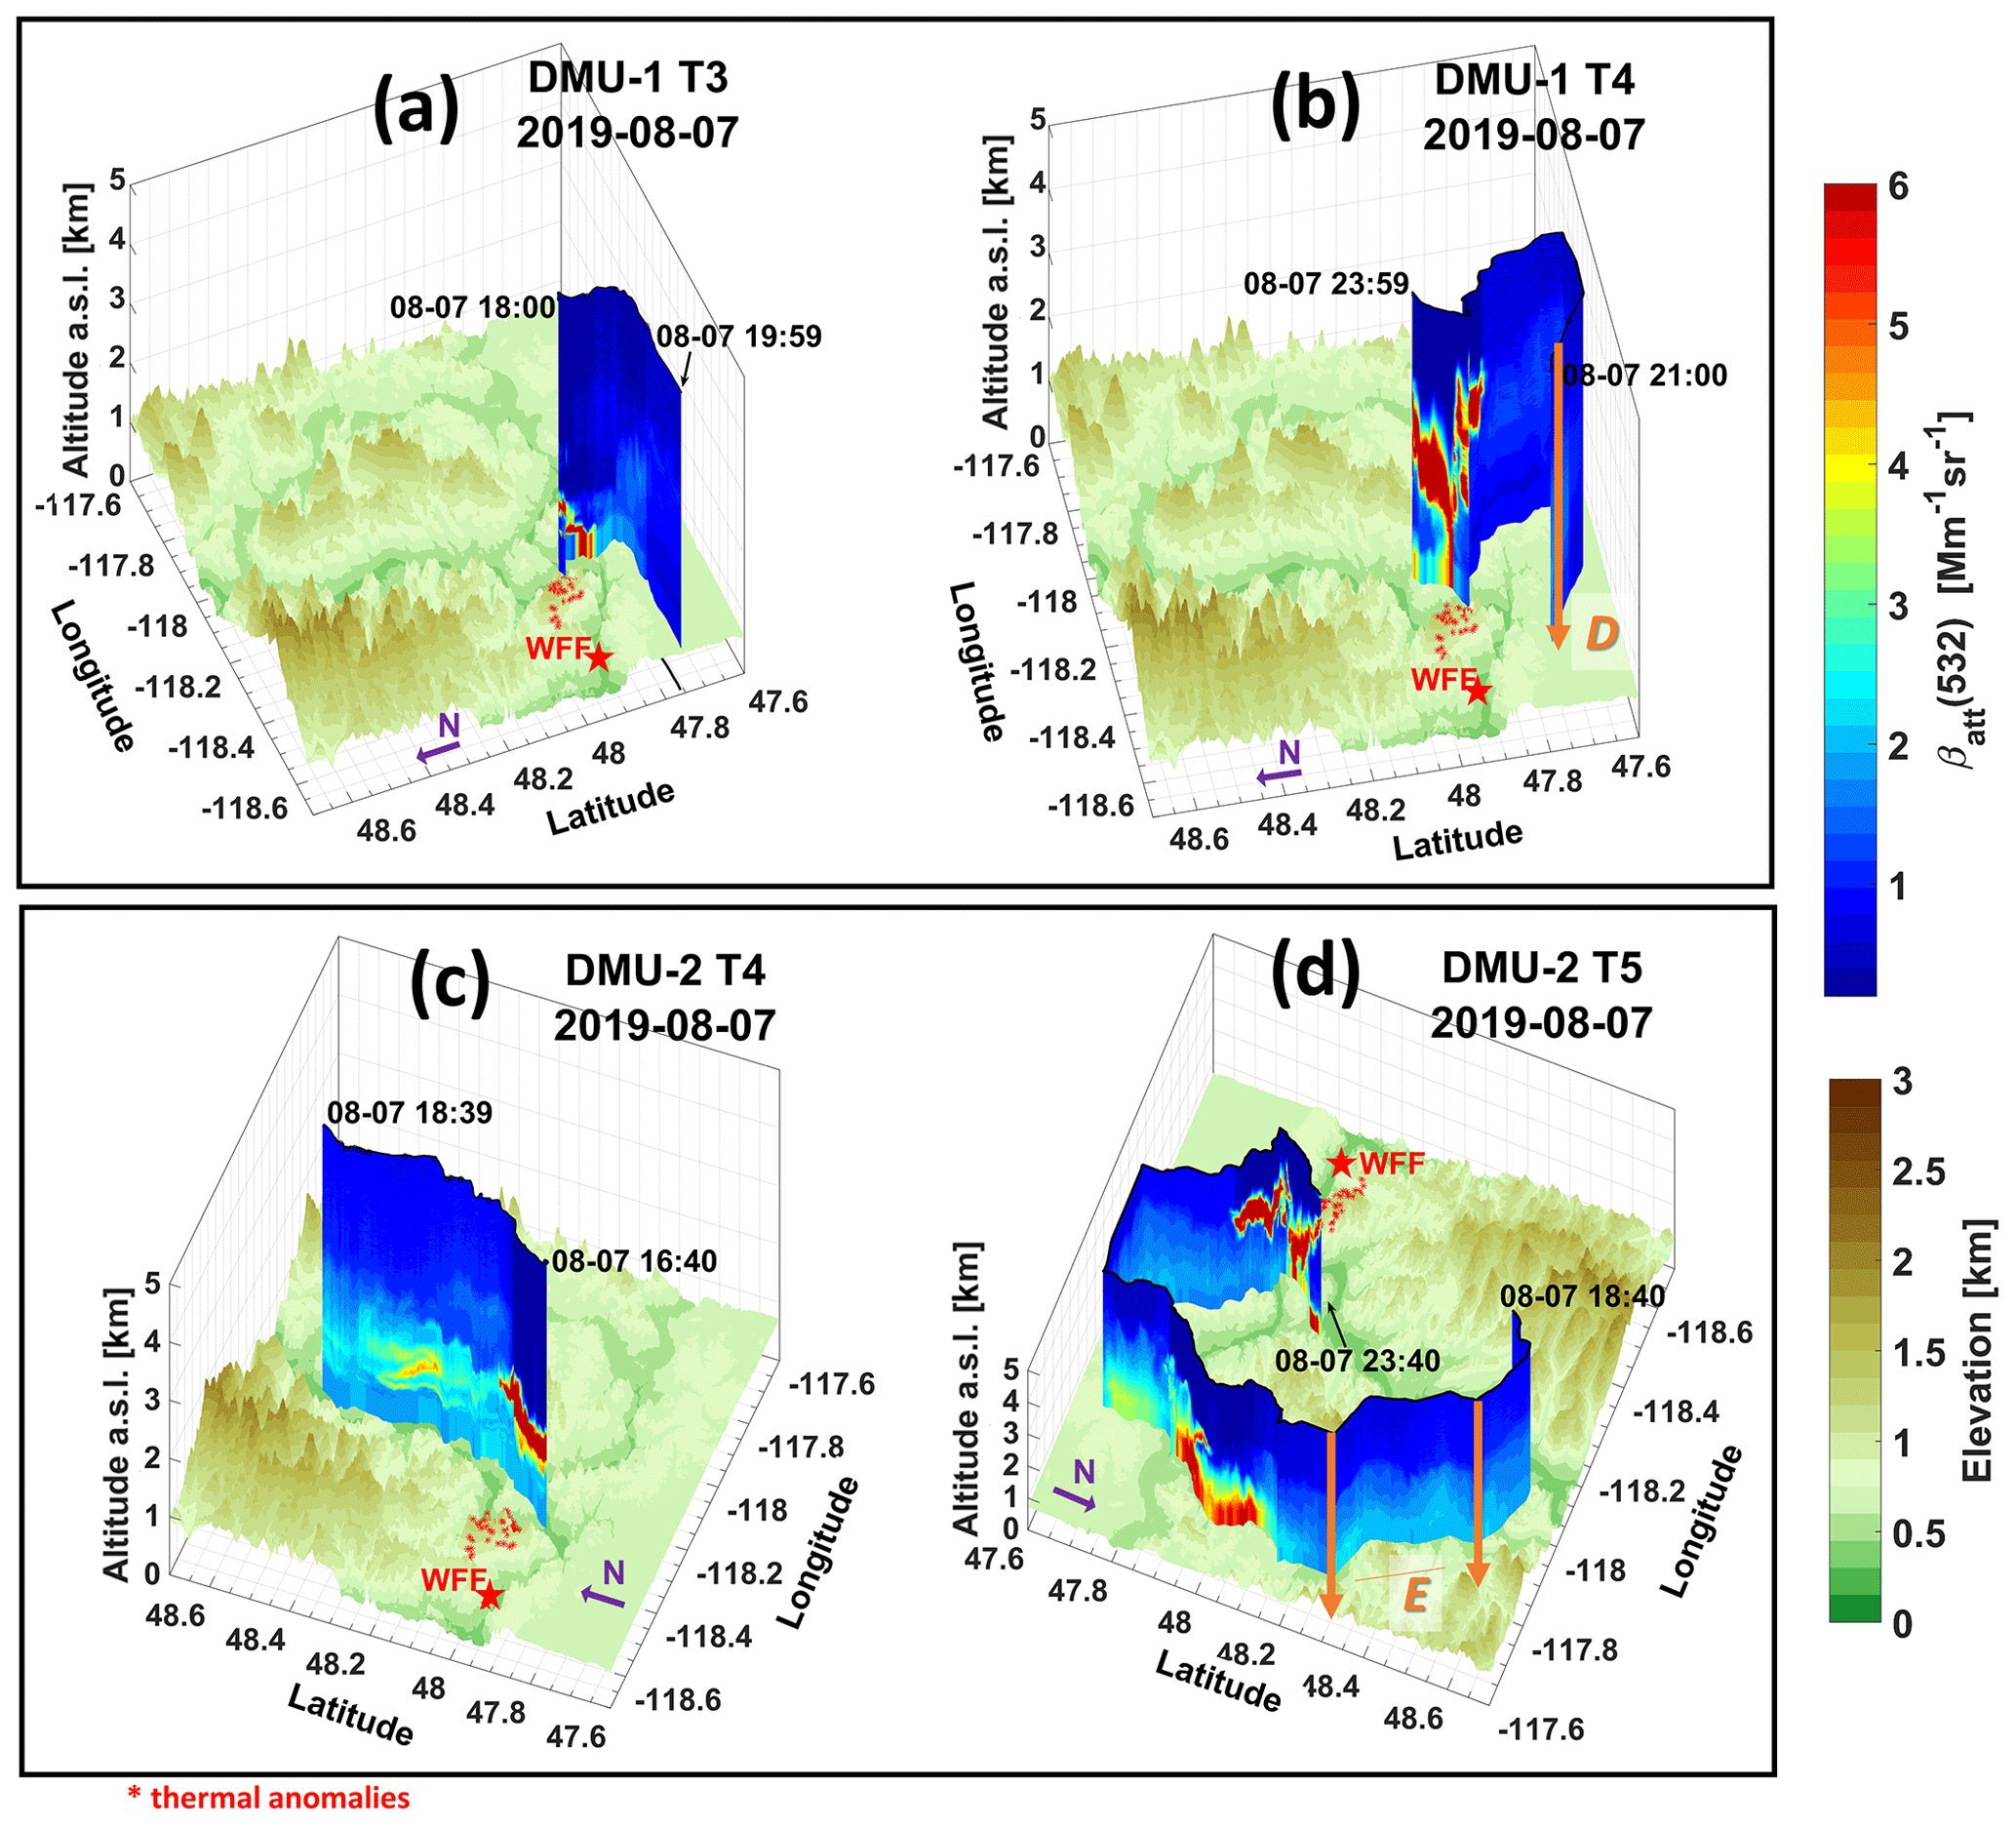
Figure 11Spatiotemporal distribution of total attenuated backscatter at 532 nm. Same as Fig. 10 but for the trajectories during 7 August 2019.
During 7 August 2019, the WFF extended towards the east, getting closer to the Columbia River ridge, and more hot spots were detected than the day before (Fig. 9b and d). Through the day, smoke convective plumes moved, mostly influenced by the strong winds, towards the easterly direction and slightly to the SE. In the afternoon, black and white ash depositions were reported, in addition to cloud formation observed close to sunset (∼ 04:40+1 d UTC). At that point, the presence of heavy smoke plumes saturated the lidar signals and restricted photometer measurements close to the source. Therefore, trajectories were performed mostly outside of the smoke plumes. Similar to the lidar observations presented in Fig. 10, 3D spatiotemporal distributions of βatt at 532 nm for all the trajectories during 7 August 2019 are presented in Fig. 11.
The trajectory DMU-1 T3 (Fig. 11a) covered ∼ 40 km from Fort Spokane to the south of the WFF between 18:00 to 19:58 UTC. DMU-1 T4 (Fig. 11b) covered ∼ 70 km of the route (from S to E side of the WFF) between 21:00 and 23:59 UTC. For both trajectories, few data points from photometer were collected and might not represent the same conditions for the zenithal lidar measurements. The photometer is looking towards the SE to the SW from the WFF, against the wind's flow. AODph ranging between 0.1–0.2 and EAEph above 1.6 were observed (Fig. 9b), which are indicative of the low loading of residual smoke in the southern region of the WFF. Both trajectories seen by the lidar show no direct influence of the smoke release on the S–SE of the WFF and present considerably lower values of βatt. Nevertheless, similar to observations on 6 August 2019, a convective smoke plume reaching up to 4 is observed in the afternoon (Fig. 11b).
On the other hand, the trajectory DMU-2 T4 (Fig. 11c) is covering the NNE of the WFF along the Columbia riverside and following the smoke plume. DMU-2 T4 covered ∼ 80 km from Fort Spokane to Kettle Falls, from 16:49 to 18:39 UTC, and with AODph ranging within 0.1–0.3 and EAEph 1.6–1.8, with higher AOD values being measured closer to the fire. This time, the vertical extent of the smoke plume is ∼ 200 m higher, and it is denser than the day before. But in the same way as the day before, the Columbia River is the main driver of the channeling effect of the smoke towards the north in the morning. The trajectory DMU-2 T5 (Fig. 11d and also Fig. 9d) covered ∼ 200 km between 18:40 to 23:40 UTC from Kettle Falls (80 km NNE from the WFF) towards Davenport (47.65° N, 118.15° W; ∼ 40 km SE of the WFF) going through valleys and returning to Fort Spokane. Along the way, DMU-2 measured residual smoke accumulated in the NE valley basins, with AODph around 0.3 and EAEph of 1.6–1.8. In addition, residual smoke, SE of the WFF, was measured with lower values of AODph around 0.1–0.3 and EAEph 1.5–1.6. During this transect, the DMU-2 crossed the smoke plume twice, once at 21:20–21:23 UTC 40 km downwind of the WFF, and the second time at 23:00 UTC about 15 km away from the WFF. From the DMU-2 T5 3D aerosol distribution (Fig. 11d) and photometer (Fig. 9d), one can see the effect of the diffuse smoke from the WFF on the NE region that is characterized by its mountains and valleys.
The complex topography, combined with the prevailing synoptic conditions (low-pressure trough approaching from the west), has important effects on the development of fire (Whiteman, 2000). While the river basin acted almost independently in the morning, channeling smoke northward, we noticed how the evolving boundary layer is coupled to the mountain wind systems. The diffused smoke is mixed and subsided along the valleys, with higher aerosol loading closer to the fire downwind. Moreover, fire emissions get stronger while temperatures rise up, permitting the convective loft of the smoke above the mountain ridges. On 7 August 2019, the convective smoke evolved into the formation of pyrocumulus clouds. For further analysis, in the following section we present aerosol properties of selected datasets from the trajectories presented here.
5.2.2 Aerosol properties for selected profiles
From the DMU-1 and DMU-2 trajectories on 6–7 August 2019, selected coincident lidar and photometer data are averaged over 5 to 15 min and are used to enhance the aerosol characterization presented so far. The selected times are displayed in Figs. 10 and 11 by orange arrows in the 3D βatt quick-look. In Fig. 12, we present the profiles of aerosol properties for each selected dataset differentiated by color. Hence, we show profiles of backscatter, extinction at 532 and 808 nm, and profiles of PLDR, EAE, and ACR. For the lidar retrievals, data below 400 m are considered constant due to high uncertainties (> 30 %) in RCS at 532 nm. Molecular coefficients are calculated using radiosonde measurements at Spokane station (47.68° N, 117.63° W) from the Wyoming University database (https://weather.uwyo.edu/upperair/sounding.html). The detection limit is defined at SNR = 1 for all channels to extract more information, in particular from 808 nm.
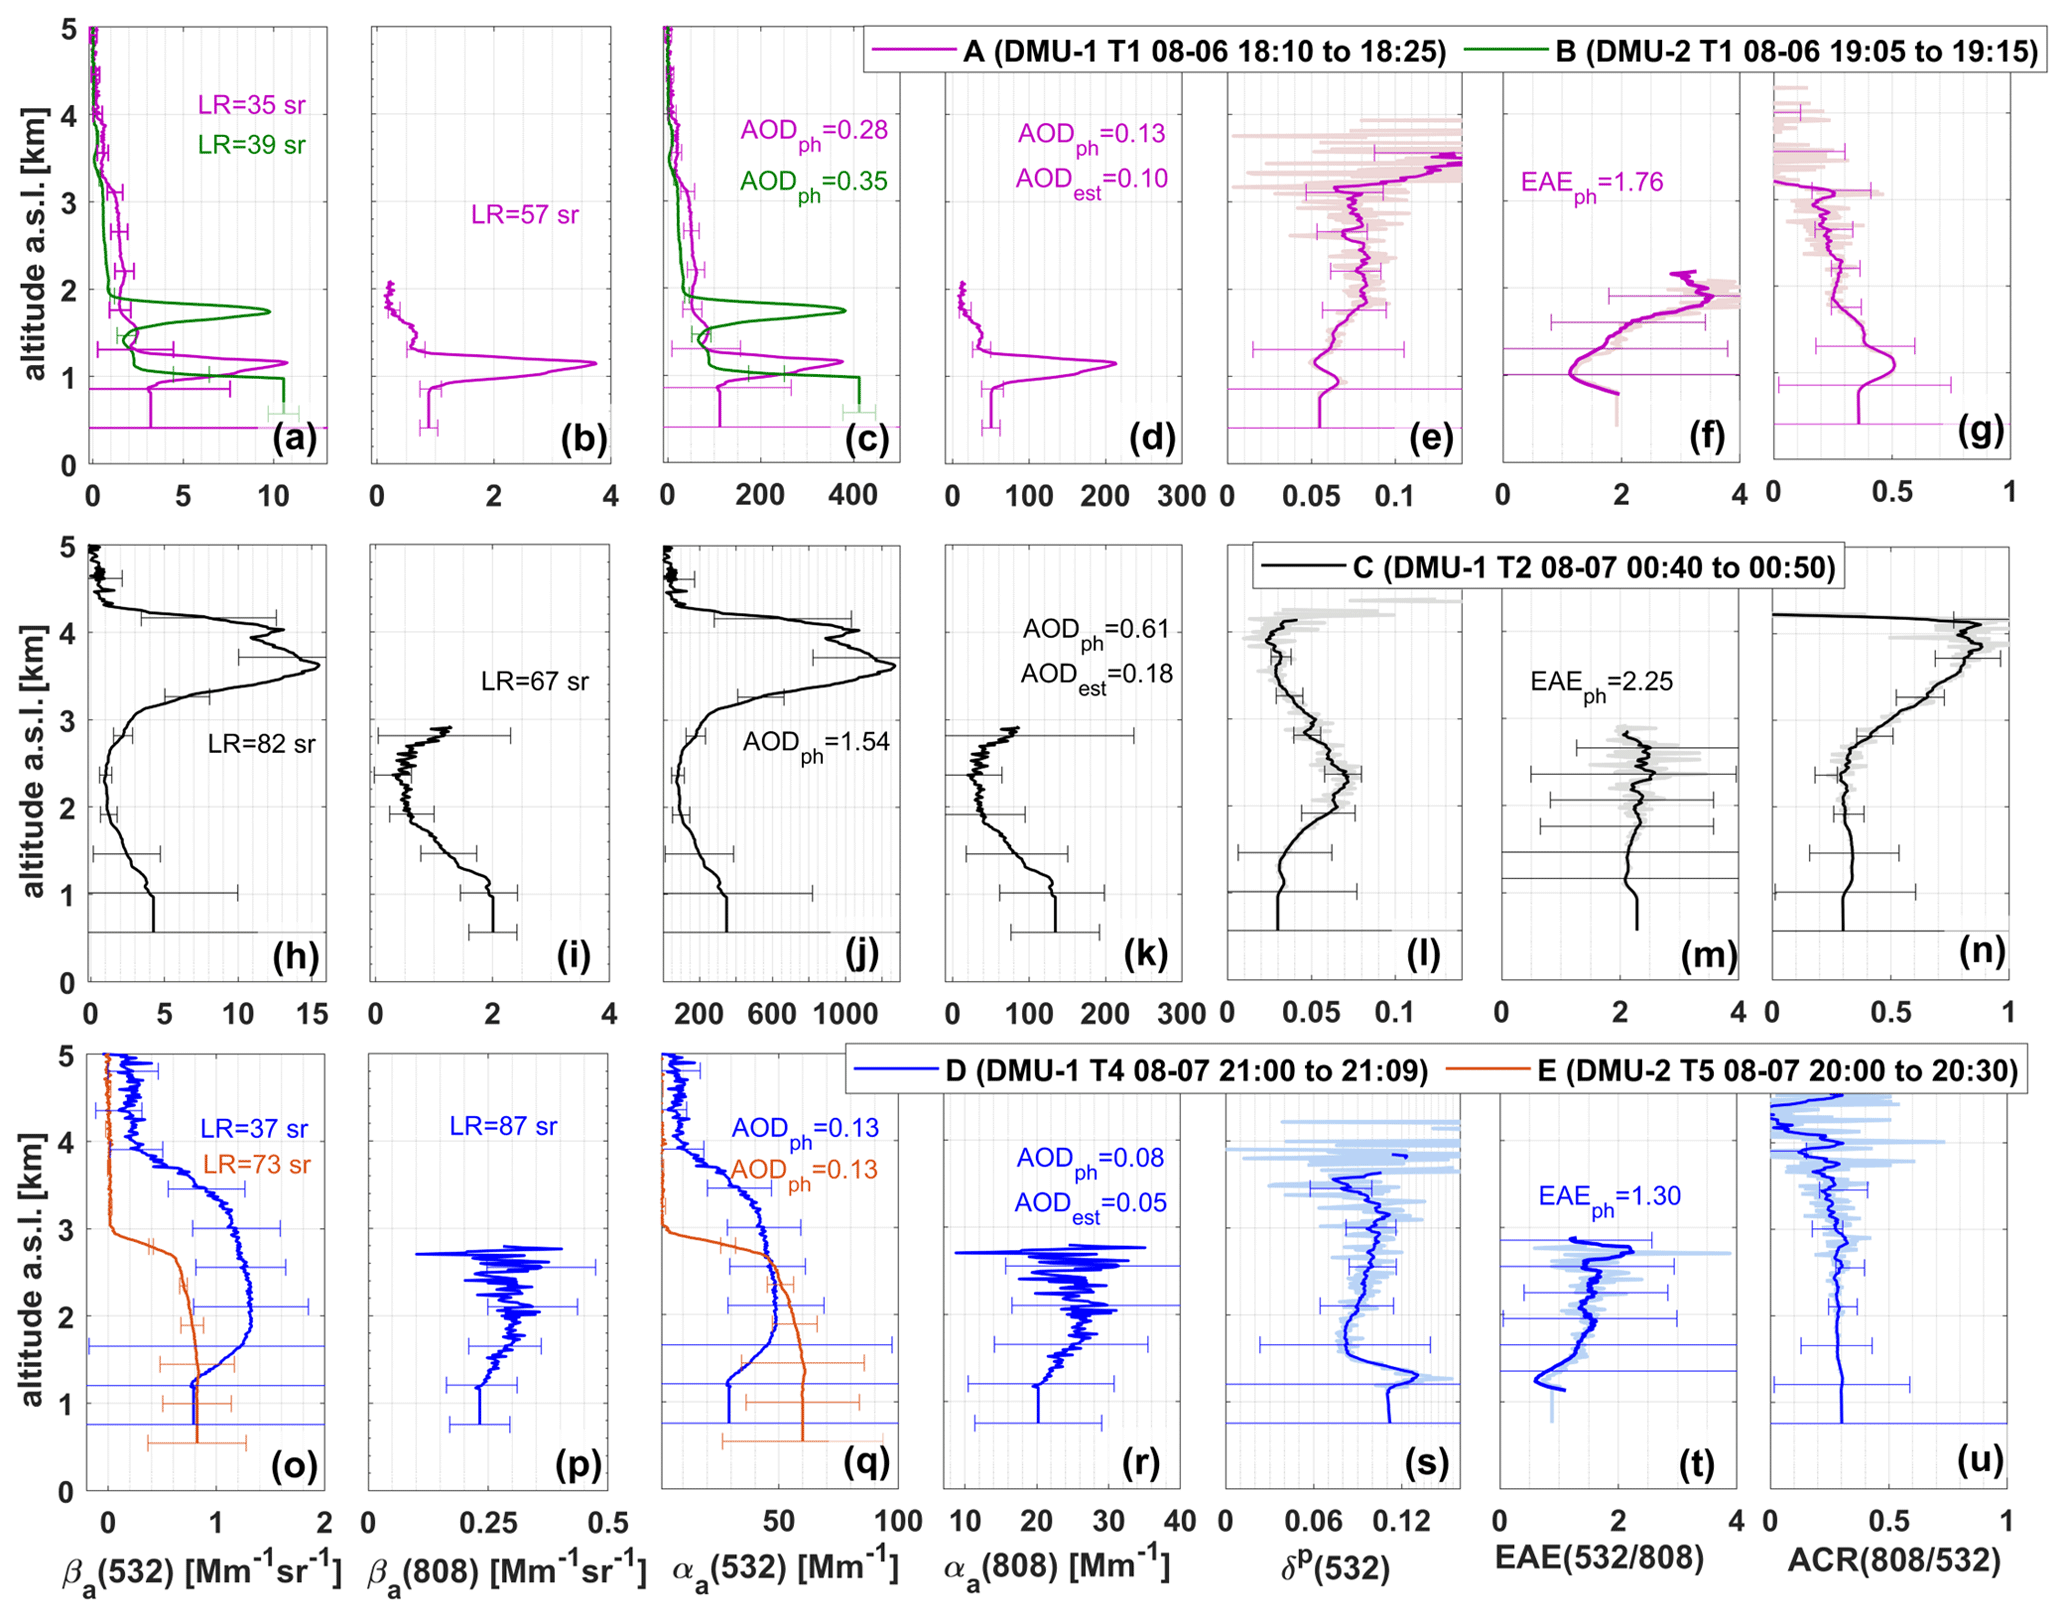
Figure 12Profiles of aerosol optical properties from averaged selected datasets of both DMU-1 and DMU-2 mobile observations during 6 and 7 August 2019. The selected data are displayed in Figs. 10 and 11 by orange arrows in the 3D βatt distributions. Each dataset is differentiated by color. Profiles of backscatter at 532 nm (a, h, and o) and 808 nm (b, i, and p), extinction at 532 nm (c, j, and q) and 808 nm (d, k, and r), PLDR (e, l, and s), EAE (f, m, and t), and ACR (g, n, and u).
Detection limits for 808 and 532 nm cross-polarized channels from CE376 are below 2 and 3–4 km, respectively, due to the high solar background. Nevertheless, we were able to study the diffuse smoke plume transported along the Columbia River with retrieval profiles from selected data. The dataset A, attained during DMU-1 T1, is shown in Fig. 12a–g, and dataset B, from DMU-2 T1, is shown in Fig. 12a and c. The dataset A corresponds to the averaged CE376 lidar data from 18:10 to 18:25 UTC on 6 August 2019 that is located 40 km away and to the NNE of the WFF. AODph from the CE318-T photometer were 0.28 and 0.13 at 532 and 808 nm, respectively; EAEph(532/808) was 1.76; and the calculated AODest at 808 nm is 0.1. The smoke plume is identified at 1–1.3 with maximum values of extinction at 1.14 Thus, extinction values of 370 ± 70 Mm−1 (with LR = 35 ± 1 sr) at 532 nm (Fig. 12c), and 207 ± 20 Mm−1 (with LR = 57 ± 4 sr) at 808 nm (Fig. 12d) were observed. Other aerosol properties inside the smoke plume were 0.06 ± 0.04 for PLDR (Fig. 12e), 1.2 for EAE (Fig. 12f), and 0.5 ± 0.3 for ACR (Fig. 12g). On the other hand, dataset B corresponds to averaged CE370 lidar data from 19:05 to 19:15 UTC on 6 August 2019, ∼ 1 h after dataset A was obtained. Dataset B is located 25 km to the NNE and away from the WFF, with values of 0.35 for AODph at 532 nm and 1.7 for EAEph (440/870). The smoke plume is identified at 1.6–1.9 with maximum values of extinction at 1.71 Values of 380 ± 20 Mm−1 (with LR = 39 ± 1 sr) for extinction at 532 nm were derived. The identified smoke plumes for both datasets are almost the same, except for the altitude. The higher extinction below 1 for dataset B is related to the increase in the smoke released through the day. Moreover, a layer of residual smoke at 2–3 is detected for both cases with less, but still noticeable, intensity for dataset B. PLDR in the residual layer (0.08 ± 0.02) is in agreement with reported values of fresh smoke transported 1 d from source (Balis et al., 2003; Ansmann et al., 2009; Tesche et al., 2009b; Alados-Arboledas et al., 2011). Despite the high uncertainties that are attached to the profiles in the few first hundreds of meters, ACR values (Fig. 12g) suggest the presence of bigger aerosols in the smoke plume at 1 than in the residual layer at 2–3 , similar to EAE. The observed bigger aerosols could be related to the release of fine-ash particles (sizes of 1–2 µm) within the smoke plume (Adachi et al., 2022).
The dataset C shown in Fig. 12h–n, obtained during DMU-1 T2, corresponds to averaged CE376 lidar data from 00:40 to 00:50 UTC toward sunset on 6 August 2019. This dataset, located 20 km east of the WFF, is particularly interesting because it provides information on the convective smoke plume. Values of 1.54 and 0.61 for AODph at 532 and 808 nm, respectively, were detected by the photometer, as well as an EAEph(532/808) of 2.25 and calculated AODest at 808 nm of 0.18 (below the smoke plume). The convective plume is identified at 3–4.3 , with maximum values of extinction at 3.57 (Fig. 12j). Thus, 1270 ± 330 Mm−1 (with LR = 82 ± 2 sr) for extinction at 532 nm was observed. Inside the plume, a decrease in the PLDR (Fig. 12l) from 0.05 ± 0.01 to 0.03 ± 0.01 is detected, in addition to values progressively increasing from 0.4 ± 0.1 to 0.9 ± 0.1 for ACR (Fig. 12n). Both parameters suggest the predominance of big spherical particles towards the smoke layer top, which could be related to the fast increase in the coating mass of soot particles within minutes from emission. In contrast, dataset D shown in Fig. 12o–u, located 25 km south of the WFF (21:00 to 21:09 UTC on 7 August 2019), and dataset E shown in Fig. 12o and q, located 60 km NE of the WFF (20:00 to 20:30 UTC on 7 August 2019), present residual smoke. Both datasets have values of 0.13 for AODph at 532 nm. Dataset D shows a residual layer extending up to 4 , with average values of 44 ± 17 Mm−1 (with LR = 37 ± 3 sr) for extinction at 532 nm (Fig. 12q) and 28 ± 15 Mm−1 (with LR = 87 ± 15 sr) at 808 nm (Fig. 12r). Moreover, PLDR is 0.09 ± 0.03 (Fig. 12s), EAE is 1.5 (Fig. 12t), and ACR is 0.3 ± 0.1 (Fig. 12u). One notices that ACR values are constant within the residual layer, suggesting that smoke is well mixed. Dataset E shows that the residual smoke in the NE side of the WFF is going up to 3 with a LR of 73 ± 7 sr, which is higher than for dataset D.
In this study, we presented the enhanced capabilities of the Cimel CE376 lidar, a compact dual-wavelength depolarization elastic lidar, for the assessment of spatiotemporal variability in the aerosol properties, especially when deployed aboard moving platforms and co-located with a photometer. Our approach involved a modified two-wavelength Klett inversion constrained by photometer measurements, optimizing the use of synergetic observations. Comprehensive algorithmic and instrumental assessments, including improvements in continuous depolarization measurements, were conducted at the ATOLL observatory. Our findings were organized into two primary parts with the aerosol properties resulting from the case studies at the ATOLL observatory in Lille, France (Sect. 4), and around the William Flats fire in northwestern US during the FIREX-AQ campaign (Sect. 5). Aerosol optical properties obtained in both sections are summarized in Table 3.
Table 3Overview of the aerosol properties retrieved from the CE376 lidar and CE318-T photometer for the case studies presented in this work. The estimated uncertainties are in parentheses. For observations at the ATOLL platform, aerosol properties are specified for each layer detected in both case studies, namely aged dust (L1 and L2) and dust smoke (L1, L2, and L3). For the FIREX-AQ campaign, the position with respect to the WFF is included.
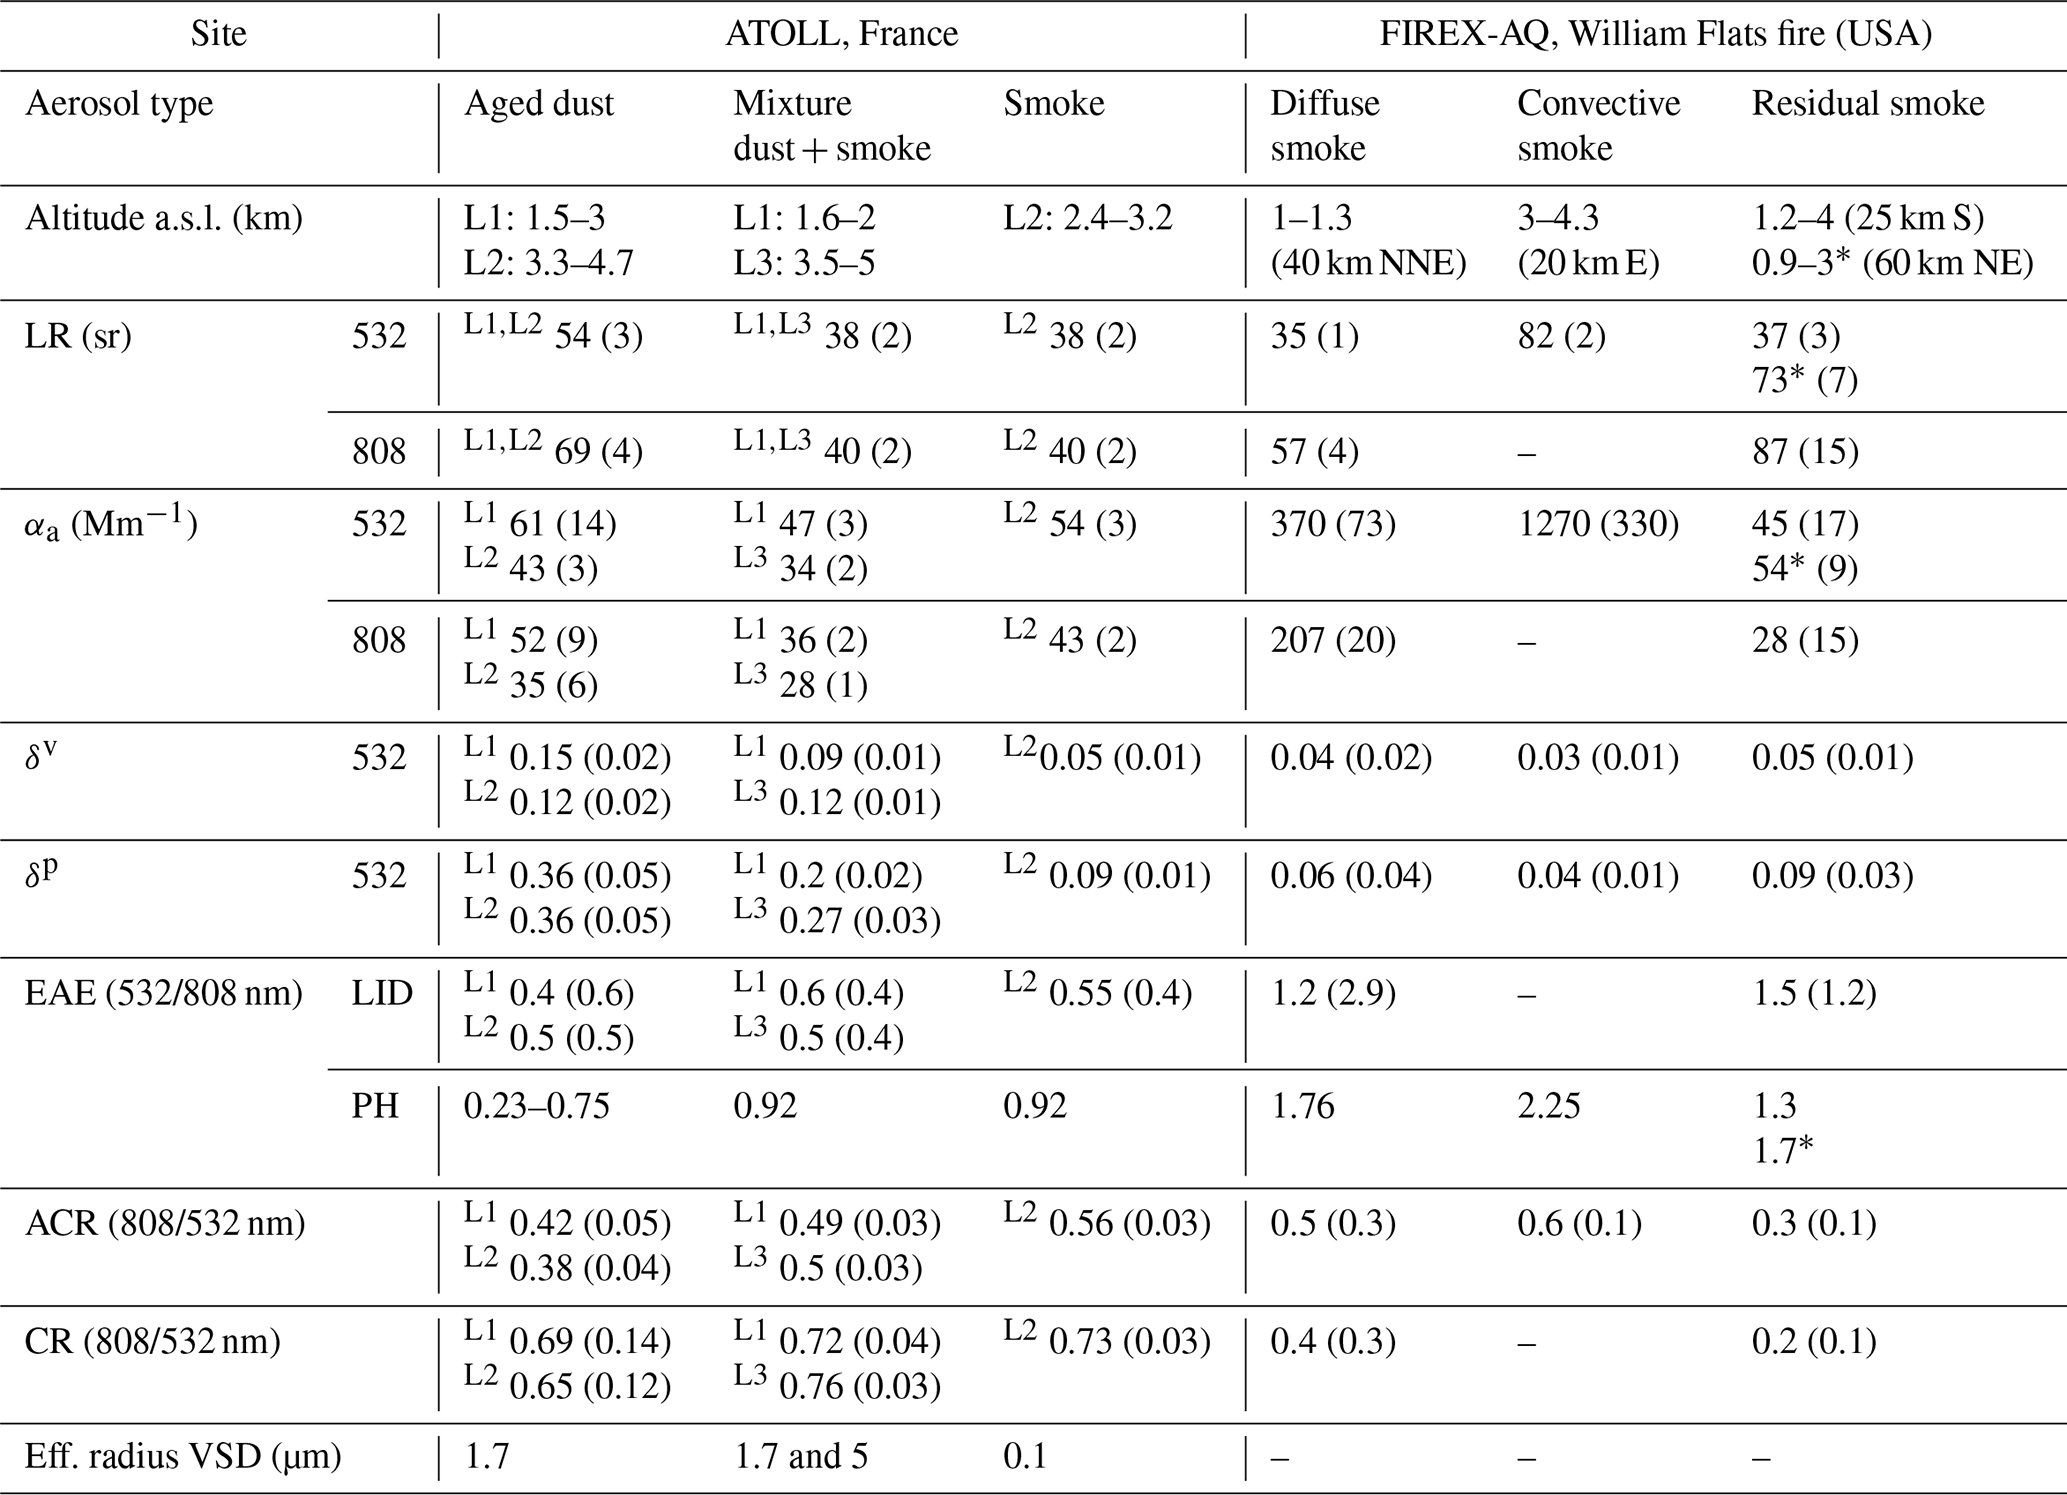
∗ Aerosol properties retrieved from the CE370 lidar and PLASMA photometer.
Both algorithmic and instrumental assessments of CE376 were tested through case studies (Sect. 4), encompassing events involving aged dust and mixed dust and smoke over Lille (Table 3). Despite the operational limitations, we achieved a relative VLDR bias of 12 % compared to LILAS Raman lidar, and we showcased CE376's ability for the continuous monitoring of aerosol properties. The limitations of our retrieval approach were also evaluated, owing mainly to the assumption of a constant LR in the atmospheric column, where EAE and CR are the most affected. The unusual event of stratified dust and smoke transported over Lille highlights the importance of depolarization measurements for aerosol typing within the different aerosol layers, demonstrating CE376's reliability – even in challenging scenarios.
We also presented for the first time ground-based lidar and photometer mobile observations, mapping smoke aerosol properties near the source during the FIREX-AQ campaign in 2019 (Sect. 5). Our study focuses on the William Flats fire (WFF) in Washington state, which presented unique and challenging environmental conditions for the exploratory platforms. The 3D mapping of lidar and photometer observations enabled the identification of aerosol properties in diffuse, convective, and residual smoke layers near the WFF (Table 3). The study revealed the capabilities of CE376 aboard mobile platforms to characterize the smoke aerosol optical properties. At the same time, we acknowledged the limitations of the CE376 lidar and photometer in harsh environmental conditions (complex topography, high temperatures, and thick smoke plumes).
With the demonstrated versatility of the CE376 lidar for monitoring aerosol properties, we look ahead at bridging observational gaps within networks. Therefore, upcoming mobile campaigns (aboard ship cruises, trains, and cars) and permanent sites in the Southern Hemisphere are planned to include the upgraded, more robust, version of the CE376 lidar. The installation of a CE376 lidar aboard Marion Dufresne research vessel, in the framework of MAP-IO, is planned in 2024. Moreover, the Polar POD (https://www.polarpod.fr/, last access: 24 October 2023), a floating scientific platform that will circle the Earth around Antarctica, will include a CE376 automatic lidar, along with several other installed scientific instruments. Additionally, ongoing research involving advanced retrieval methods like GRASP (Generalized Retrieval of Aerosol and Surface Properties), combining spectral AOD and downward sky radiance from CE318-T photometers and RCS at two wavelengths from CE376, are underway. These advancements mark significant steps in enhancing our understanding of aerosol dynamics and environmental monitoring.
Data from the photometer are available at the AERONET website (https://aeronet.gsfc.nasa.gov/, NASA GSFC, 2023). Radiosonde data are accessible via the Wyoming University database (https://weather.uwyo.edu/upperair/sounding.html, University of Wyoming, 2023) and Météo-France database (https://donneespubliques.meteofrance.fr/, Météo-France, 2023.). The data of DEM from SRTM are available from Earth Explorer interface of the USGS (https://doi.org/10.5066/F7PR7TFT, U.S. Geological Survey, 2023). The MODIS thermal anomalies product is available from NASA Worldview (https://wvs.earthdata.nasa.gov/, EOSDIS, 2023). Lidar data used in this paper are available upon request to the corresponding author.
MFSB analyzed the CE370 and CE376 lidar data, prepared the figures, and wrote the article. PG, SV, and IEP supervised the work and contributed to the writing of the article. DMG revised the paper. PG, SV, IEP, LB, BH, and BT designed and conceptualized the project of lidar and photometer mobile applications. PG, IEP, LB, EB, QH, and TP conceived and performed the experiments at ATOLL platform. MFSB developed the CE376 algorithmic assessments initiated by IEP. IEP, TP, LP, MFSB, and EB supported the instrumental assessments of CE376 lidar. QH and TP performed the experiments with LILAS, and QH analyzed the data. FD and QH developed and supported the LILAS algorithms. PG, IEP, LB, TP, GD, LP, BH, AL, ALR, and DMG conducted the experiments and supported the installation of instruments aboard DMU-1 and DMU-2 during FIREX-AQ.
The contact author has declared that none of the authors has any competing interests.
Publisher's note: Copernicus Publications remains neutral with regard to jurisdictional claims made in the text, published maps, institutional affiliations, or any other geographical representation in this paper. While Copernicus Publications makes every effort to include appropriate place names, the final responsibility lies with the authors.
The authors would like to thank ANRT (Association Nationale de la Recherche et de la Technologie) France and Cimel for supporting the research development in the framework of the CIFRE (grant no. 2020/0442) thesis by Maria Fernanda Sanchez Barrero. We also thank the H2020/GRASP-ACE Marie Skłodowska-Curie project for funding. The authors acknowledge the generous support from the NOAA AC4 program from FIREX FireLab and FIREX-AQ. The authors thank AERONET (NASA GSFC) and the Service National d'Observation PHOTONS/AERONET-EARLINET and Cimel, as well as NASA AERONET staff for coordination with the U.S. Forest Service; Fire Chemistry Lab; and the University of Idaho Taylor Ranch Wilderness School staff for setting up, maintaining, and decommissioning the stationary DRAGON networks.
This research has been supported by the CaPPA project (Chemical and Physical Properties of the Atmosphere), funded by the ANR (French National Research Agency) through the PIA (Programme d'Investissement d'Avenir), under contract no. ANR-11LABX-0005-01; ANRT (Association Nationale de la Recherche et de la Technologie) France (CIFRE, grant no. 2020/0442); the European Commission (EU Horizon 2020, GRASP-ACE (grant no. 778349)); the Regional Council Hauts-de-France (project CLIMIBIO); and FEDER (European Funds for Regional Economic Development).
This paper was edited by Daniel Perez-Ramirez and reviewed by two anonymous referees.
Ackermann, J.: Two-wavelength lidar inversion algorithm for a two-component atmosphere, Appl. Optics, 36, 5134, https://doi.org/10.1364/AO.36.005134, 1997.
Ackermann, J.: Analytical solution of the two-frequency lidar inversion technique, Appl. Optics, 38, 7414, https://doi.org/10.1364/AO.38.007414, 1999.
Adachi, K., Dibb, J. E., Scheuer, E., Katich, J. M., Schwarz, J. P., Perring, A. E., Mediavilla, B., Guo, H., Campuzano-Jost, P., Jimenez, J. L., Crawford, J., Soja, A. J., Oshima, N., Kajino, M., Kinase, T., Kleinman, L., Sedlacek, A. J., Yokelson, R. J., and Buseck, P. R.: Fine Ash-Bearing Particles as a Major Aerosol Component in Biomass Burning Smoke, J. Geophys. Res.-Atmos., 127, e2021JD035657, https://doi.org/10.1029/2021JD035657, 2022.
Adam, M., Nicolae, D., Stachlewska, I. S., Papayannis, A., and Balis, D.: Biomass burning events measured by lidars in EARLINET – Part 1: Data analysis methodology, Atmos. Chem. Phys., 20, 13905–13927, https://doi.org/10.5194/acp-20-13905-2020, 2020.
Alados-Arboledas, L., Müller, D., Guerrero-Rascado, J. L., Navas-Guzmán, F., Pérez-Ramírez, D., and Olmo, F. J.: Optical and microphysical properties of fresh biomass burning aerosol retrieved by Raman lidar, and star-and sun-photometry, Geophys. Res. Lett., 38, L01807, https://doi.org/10.1029/2010GL045999, 2011.
Althausen, D., Engelmann, E., Baars, H., Heese, B., Kanitz, T., Komppula, M., Giannakaki, E., Pfüller, A., Silva, A. M., Preißler, J., Wagner, F., Rascado, J. L., Pereira, S., Lim, J. H., Ahn, J. Y., Tesche, M., and Stachlewska, I. S.: PollyNET – a network of multiwavelength polarization Raman lidars, in: Proc. SPIE 8894, Lidar Technologies, Techniques, and Measurements for Atmospheric Remote Sensing IX, 88940I, 22 October 2013, Dresden, Germany, 8894, https://doi.org/10.1117/12.2028921, 2013.
Ansmann, A., Bösenberg, J., Chaikovsky, A., Comerón, A., Eckhardt, S., Eixmann, R., Freudenthaler, V., Ginoux, P., Komguem, L., Linné, H., Márquez, M. Á. L., Matthias, V., Mattis, I., Mitev, V., Müller, D., Music, S., Nickovic, S., Pelon, J., Sauvage, L., Sobolewsky, P., Srivastava, M. K., Stohl, A., Torres, O., Vaughan, G., Wandinger, U., and Wiegner, M.: Long-range transport of Saharan dust to northern Europe: The 11-16 October 2001 outbreak observed with EARLINET: Saharan dust transport over Europe, J. Geophys. Res., 108, 4783, https://doi.org/10.1029/2003JD003757, 2003.
Ansmann, A., Baars, H., Tesche, M., Müller, D., Althausen, D., Engelmann, R., Pauliquevis, T., and Artaxo, P.: Dust and smoke transport from Africa to South America: Lidar profiling over Cape Verde and the Amazon rainforest, Geophys. Res. Lett., 36, L11802, https://doi.org/10.1029/2009GL037923, 2009.
Balis, D. S., Amiridis, V., Zerefos, C., Gerasopoulos, E., Andreae, M., Zanis, P., Kazantzidisa, A., Kazadzis, S., and Papayannis, A: Raman lidar and sunphotometric measurements of aerosol optical properties over Thessaloniki, Greece during a biomass burning episode, Atmos. Environ., 37, 4529–4538, https://doi.org/10.1016/S1352-2310(03)00581-8, 2003.
Barreto, Á., Cuevas, E., Granados-Muñoz, M.-J., Alados-Arboledas, L., Romero, P. M., Gröbner, J., Kouremeti, N., Almansa, A. F., Stone, T., Toledano, C., Román, R., Sorokin, M., Holben, B., Canini, M., and Yela, M.: The new sun-sky-lunar Cimel CE318-T multiband photometer – a comprehensive performance evaluation, Atmos. Meas. Tech., 9, 631–654, https://doi.org/10.5194/amt-9-631-2016, 2016.
Bohlmann, S., Baars, H., Radenz, M., Engelmann, R., and Macke, A.: Ship-borne aerosol profiling with lidar over the Atlantic Ocean: from pure marine conditions to complex dust–smoke mixtures, Atmos. Chem. Phys., 18, 9661–9679, https://doi.org/10.5194/acp-18-9661-2018, 2018.
Boucher, O., Randall, D., Artaxo, P., Bretherton, C., Feingold, G., Forster, P., Kerminen, V.-M., Kondo, Y., H. Liao, Lohmann, U., Rasch, P., Satheesh, S. K., Sherwood, S., Stevens, B., and Zhang, X. Y.: Clouds and Aerosols, in: Climate Change 2013: The Physical Science Basis. Contribution of Working Group I to the Fifth Assessment Report of the Intergovernmental Panel on Climate Change, Cambridge University Press, Cambridge, United Kingdom and New York, NY, USA, 2013.
Bovchaliuk, V., Goloub, P., Podvin, T., Veselovskii, I., Tanre, D., Chaikovsky, A., Dubovik, O., Mortier, A., Lopatin, A., Korenskiy, M., and Victori, S.: Comparison of aerosol properties retrieved using GARRLiC, LIRIC, and Raman algorithms applied to multi-wavelength lidar and sun/sky-photometer data, Atmos. Meas. Tech., 9, 3391–3405, https://doi.org/10.5194/amt-9-3391-2016, 2016.
Burton, S. P., Ferrare, R. A., Vaughan, M. A., Omar, A. H., Rogers, R. R., Hostetler, C. A., and Hair, J. W.: Aerosol classification from airborne HSRL and comparisons with the CALIPSO vertical feature mask, Atmos. Meas. Tech., 6, 1397–1412, https://doi.org/10.5194/amt-6-1397-2013, 2013.
Chazette, P. and Totems, J.: Lidar Profiling of Aerosol Vertical Distribution in the Urbanized French Alpine Valley of Annecy and Impact of a Saharan Dust Transport Event, Remote Sens.-Basel, 15, 1070, https://doi.org/10.3390/rs15041070, 2023.
Córdoba-Jabonero, C., Ansmann, A., Jiménez, C., Baars, H., López-Cayuela, M.-Á., and Engelmann, R.: Experimental assessment of a micro-pulse lidar system in comparison with reference lidar measurements for aerosol optical properties retrieval, Atmos. Meas. Tech., 14, 5225–5239, https://doi.org/10.5194/amt-14-5225-2021, 2021.
De Wekker, S. F. J. and Kossmann, M.: Convective Boundary Layer Heights Over Mountainous Terrain – A Review of Concepts, Front. Earth Sci., 3, 77, https://doi.org/10.3389/feart.2015.00077, 2015.
Dieudonné, E., Chazette, P., Marnas, F., Totems, J., and Shang, X.: Lidar profiling of aerosol optical properties from Paris to Lake Baikal (Siberia), Atmos. Chem. Phys., 15, 5007–5026, https://doi.org/10.5194/acp-15-5007-2015, 2015.
Dubovik, O. and King, M. D.: A flexible inversion algorithm for retrieval of aerosol optical properties from Sun and sky radiance measurements, J. Geophys. Res., 105, 20673–20696, https://doi.org/10.1029/2000JD900282, 2000.
Engelmann, R., Kanitz, T., Baars, H., Heese, B., Althausen, D., Skupin, A., Wandinger, U., Komppula, M., Stachlewska, I. S., Amiridis, V., Marinou, E., Mattis, I., Linné, H., and Ansmann, A.: The automated multiwavelength Raman polarization and water-vapor lidar PollyXT: the neXT generation, Atmos. Meas. Tech., 9, 1767–1784, https://doi.org/10.5194/amt-9-1767-2016, 2016.
EOSDIS: Worlview: Fires and Thermal Anomalies (Day and Night), Earth Observing System Data and Information System [data set], https://wvs.earthdata.nasa.gov/ (last access: 23 October 2023), 2023.
Floutsi, A. A., Baars, H., Engelmann, R., Althausen, D., Ansmann, A., Bohlmann, S., Heese, B., Hofer, J., Kanitz, T., Haarig, M., Ohneiser, K., Radenz, M., Seifert, P., Skupin, A., Yin, Z., Abdullaev, S. F., Komppula, M., Filioglou, M., Giannakaki, E., Stachlewska, I. S., Janicka, L., Bortoli, D., Marinou, E., Amiridis, V., Gialitaki, A., Mamouri, R.-E., Barja, B., and Wandinger, U.: DeLiAn – a growing collection of depolarization ratio, lidar ratio and Ångström exponent for different aerosol types and mixtures from ground-based lidar observations, Atmos. Meas. Tech., 16, 2353–2379, https://doi.org/10.5194/amt-16-2353-2023, 2023.
Freudenthaler, V.: About the effects of polarising optics on lidar signals and the Δ90 calibration, Atmos. Meas. Tech., 9, 4181–4255, https://doi.org/10.5194/amt-9-4181-2016, 2016.
Freudenthaler, V., Esselborn, M., Wiegner, M., Heese, B., Tesche, M., Ansmann, A., Müller, D., Althausen, D., Wirth, M., Fix, A., Ehret, G., Knippertz, P., Toledano, C., Gasteiger, J., Garhammer, M., and Seefeldner, M.: Depolarization ratio profiling at several wavelengths in pure Saharan dust during SAMUM 2006, Tellus B, 61, 165–179, https://doi.org/10.1111/j.1600-0889.2008.00396.x, 2009.
Freudenthaler, V., Linné, H., Chaikovski, A., Rabus, D., and Groß, S.: EARLINET lidar quality assurance tools, Atmos. Meas. Tech. Discuss. [preprint], https://doi.org/10.5194/amt-2017-395, in review, 2018.
Giles, D. M., Sinyuk, A., Sorokin, M. G., Schafer, J. S., Smirnov, A., Slutsker, I., Eck, T. F., Holben, B. N., Lewis, J. R., Campbell, J. R., Welton, E. J., Korkin, S. V., and Lyapustin, A. I.: Advancements in the Aerosol Robotic Network (AERONET) Version 3 database – automated near-real-time quality control algorithm with improved cloud screening for Sun photometer aerosol optical depth (AOD) measurements, Atmos. Meas. Tech., 12, 169–209, https://doi.org/10.5194/amt-12-169-2019, 2019.
Guerrero-Rascado, J. L., Costa, M. J., Bortoli, D., Silva, A. M., Lyamani, H., and Alados-Arboledas, L.: Infrared lidar overlap function: an experimental determination, Opt. Express, 18, 20350, https://doi.org/10.1364/OE.18.020350, 2010.
Haarig, M., Ansmann, A., Engelmann, R., Baars, H., Toledano, C., Torres, B., Althausen, D., Radenz, M., and Wandinger, U.: First triple-wavelength lidar observations of depolarization and extinction-to-backscatter ratios of Saharan dust, Atmos. Chem. Phys., 22, 355–369, https://doi.org/10.5194/acp-22-355-2022, 2022.
Holben, B. N., Eck, T. F., Slutsker, I., Tanré, D., Buis, J. P., Setzer, A., Vermote, E., Reagan, J. A., Kaufman, Y. J., Nakajima, T., Lavenu, F., Jankowiak, I., and Smirnov, A.: AERONET—A Federated Instrument Network and Data Archive for Aerosol Characterization, Remote Sens. Environ., 66, 1–16, https://doi.org/10.1016/S0034-4257(98)00031-5, 1998.
Holben, B. N., Kim, J., Sano, I., Mukai, S., Eck, T. F., Giles, D. M., Schafer, J. S., Sinyuk, A., Slutsker, I., Smirnov, A., Sorokin, M., Anderson, B. E., Che, H., Choi, M., Crawford, J. H., Ferrare, R. A., Garay, M. J., Jeong, U., Kim, M., Kim, W., Knox, N., Li, Z., Lim, H. S., Liu, Y., Maring, H., Nakata, M., Pickering, K. E., Piketh, S., Redemann, J., Reid, J. S., Salinas, S., Seo, S., Tan, F., Tripathi, S. N., Toon, O. B., and Xiao, Q.: An overview of mesoscale aerosol processes, comparisons, and validation studies from DRAGON networks, Atmos. Chem. Phys., 18, 655–671, https://doi.org/10.5194/acp-18-655-2018, 2018.
Hu, Q., Goloub, P., Veselovskii, I., Bravo-Aranda, J.-A., Popovici, I. E., Podvin, T., Haeffelin, M., Lopatin, A., Dubovik, O., Pietras, C., Huang, X., Torres, B., and Chen, C.: Long-range-transported Canadian smoke plumes in the lower stratosphere over northern France, Atmos. Chem. Phys., 19, 1173–1193, https://doi.org/10.5194/acp-19-1173-2019, 2019.
Hu, Q., Goloub, P., Veselovskii, I., and Podvin, T.: The characterization of long-range transported North American biomass burning plumes: what can a multi-wavelength Mie–Raman-polarization-fluorescence lidar provide?, Atmos. Chem. Phys., 22, 5399–5414, https://doi.org/10.5194/acp-22-5399-2022, 2022.
Karol, Y., Tanré, D., Goloub, P., Vervaerde, C., Balois, J. Y., Blarel, L., Podvin, T., Mortier, A., and Chaikovsky, A.: Airborne sun photometer PLASMA: concept, measurements, comparison of aerosol extinction vertical profile with lidar, Atmos. Meas. Tech., 6, 2383–2389, https://doi.org/10.5194/amt-6-2383-2013, 2013.
Kim, M.-H., Omar, A. H., Tackett, J. L., Vaughan, M. A., Winker, D. M., Trepte, C. R., Hu, Y., Liu, Z., Poole, L. R., Pitts, M. C., Kar, J., and Magill, B. E.: The CALIPSO version 4 automated aerosol classification and lidar ratio selection algorithm, Atmos. Meas. Tech., 11, 6107–6135, https://doi.org/10.5194/amt-11-6107-2018, 2018.
Klett, J. D.: Lidar inversion with variable backscatter/extinction ratios, Appl. Optics, 24, 1638, https://doi.org/10.1364/AO.24.001638, 1985.
Kovalev, V. A.: Sensitivity of the lidar solution to errors of the aerosol backscatter-to-extinction ratio: influence of a monotonic change in the aerosol extinction coefficient, Appl. Optics, 34, 3457, https://doi.org/10.1364/AO.34.003457, 1995.
Kovalev, V. A.: Distortions of the extinction coefficient profile caused by systematic errors in lidar data, Appl. Optics, 43, 3191, https://doi.org/10.1364/AO.43.003191, 2004.
Kovalev, V. A. and Eichinger, W. E.: Elastic Lidar: Theory, Practice and Analysis methods, John Wiley & Sons, 2004.
Kunz, G. J.: Two-wavelength lidar inversion algorithm, Appl. Optics, 38, 1015, https://doi.org/10.1364/AO.38.001015, 1999.
Kusmierczyk-Michulec, J.: Empirical relationships between aerosol mass concentrations and Ångström parameter, Geophys. Res. Lett., 29, 1145, https://doi.org/10.1029/2001GL014128, 2002.
López-Cayuela, M. Á., Córdoba-Jabonero, C., Bermejo-Pantaleón, D., Sicard, M., Salgueiro, V., Molero, F., Carvajal-Pérez, C. V., Granados-Muñoz, M. J., Comerón, A., Couto, F. T., Barragán, R., Zorzano, M.-P., Bravo-Aranda, J. A., Muñoz-Porcar, C., Costa, M. J., Artíñano, B., Rodríguez-Gómez, A., Bortoli, D., Pujadas, M., Abril-Gago, J., Alados-Arboledas, L., and Guerrero-Rascado, J. L.: Vertical characterization of fine and coarse dust particles during an intense Saharan dust outbreak over the Iberian Peninsula in springtime 2021, Atmos. Chem. Phys., 23, 143–161, https://doi.org/10.5194/acp-23-143-2023, 2023.
Lu, X., Jiang, Y., Zhang, X., Wang, X., and Spinelli, N.: Two-wavelength lidar inversion algorithm for determination of aerosol extinction-to-backscatter ratio and its application to CALIPSO lidar measurements, Journal of Quantitative Spectroscopy and Radiative Transfer, 112, 320–328, https://doi.org/10.1016/j.jqsrt.2010.07.013, 2011.
Mascaut, F., Pujol, O., Verreyken, B., Peroni, R., Metzger, J. M., Blarel, L., Podvin, T., Goloub, P., Sellegri, K., Thornberry, T., Duflot, V., Tulet, P., and Brioude, J.: Aerosol characterization in an oceanic context around Reunion Island (AEROMARINE field campaign), Atmos. Environ., 268, 118770, https://doi.org/10.1016/j.atmosenv.2021.118770, 2022.
Météo-France: Catalogue: Observations In situ: Altitude: Observations d'altitude (Radio sondages), Météo-France, https://donneespubliques.meteofrance.fr/ (last access: 23 October 2023), 2023.
Morille, Y., Haeffelin, M., Drobinski, P., and Pelon, J.: STRAT: An Automated Algorithm to Retrieve the Vertical Structure of the Atmosphere from Single-Channel Lidar Data, J. Atmos. Ocean. Tech., 24, 761–775, https://doi.org/10.1175/JTECH2008.1, 2007.
Mortier, A., Goloub, P., Podvin, T., Deroo, C., Chaikovsky, A., Ajtai, N., Blarel, L., Tanre, D., and Derimian, Y.: Detection and characterization of volcanic ash plumes over Lille during the Eyjafjallajökull eruption, Atmos. Chem. Phys., 13, 3705–3720, https://doi.org/10.5194/acp-13-3705-2013, 2013.
Müller, D., Hostetler, C. A., Ferrare, R. A., Burton, S. P., Chemyakin, E., Kolgotin, A., Hair, J. W., Cook, A. L., Harper, D. B., Rogers, R. R., Hare, R. W., Cleckner, C. S., Obland, M. D., Tomlinson, J., Berg, L. K., and Schmid, B.: Airborne Multiwavelength High Spectral Resolution Lidar (HSRL-2) observations during TCAP 2012: vertical profiles of optical and microphysical properties of a smoke/urban haze plume over the northeastern coast of the US, Atmos. Meas. Tech., 7, 3487–3496, https://doi.org/10.5194/amt-7-3487-2014, 2014.
NASA GSFC: AERONET (AErosol RObotic NETwork) program, https://aeronet.gsfc.nasa.gov/ (last access: 23 October 2023), 2023.
Nicolae, D., Nemuc, A., Müller, D., Talianu, C., Vasilescu, J., Belegante, L., and Kolgotin, A.: Characterization of fresh and aged biomass burning events using multiwavelength Raman lidar and mass spectrometry: biomass burning aerosols from lidar & AMS, J. Geophys. Res. Atmos., 118, 2956–2965, https://doi.org/10.1002/jgrd.50324, 2013.
Omar, A. H., Winker, D. M., Vaughan, M. A., Hu, Y., Trepte, C. R., Ferrare, R. A., Lee, K.-P., Hostetler, C. A., Kittaka, C., Rogers, R. R., Kuehn, R. E., and Liu, Z.: The CALIPSO Automated Aerosol Classification and Lidar Ratio Selection Algorithm, J. Atmos. Ocean. Tech., 26, 1994–2014, https://doi.org/10.1175/2009JTECHA1231.1, 2009.
Pal, S., Xueref-Remy, I., Ammoura, L., Chazette, P., Gibert, F., Royer, P., Dieudonné, E., Dupont, J.-C., Haeffelin, M., Lac, C., Lopez, M., Morille, Y., and Ravetta, F.: Spatio-temporal variability of the atmospheric boundary layer depth over the Paris agglomeration: An assessment of the impact of the urban heat island intensity, Atmos. Environ., 63, 261–275, https://doi.org/10.1016/j.atmosenv.2012.09.046, 2012.
Papagiannopoulos, N., D'Amico, G., Gialitaki, A., Ajtai, N., Alados-Arboledas, L., Amodeo, A., Amiridis, V., Baars, H., Balis, D., Binietoglou, I., Comerón, A., Dionisi, D., Falconieri, A., Fréville, P., Kampouri, A., Mattis, I., Mijić, Z., Molero, F., Papayannis, A., Pappalardo, G., Rodríguez-Gómez, A., Solomos, S., and Mona, L.: An EARLINET early warning system for atmospheric aerosol aviation hazards, Atmos. Chem. Phys., 20, 10775–10789, https://doi.org/10.5194/acp-20-10775-2020, 2020.
Papayannis, A., Amiridis, V., Mona, L., Tsaknakis, G., Balis, D., Bösenberg, J., Chaikovski, A., De Tomasi, F., Grigorov, I., Mattis, I., Mitev, V., Müller, D., Nickovic, S., Pérez, C., Pietruczuk, A., Pisani, G., Ravetta, F., Rizi, V., Sicard, M., Trickl, T., Wiegner, M., Gerding, M., Mamouri, R. E., D'Amico, G., and Pappalardo, G.: Systematic lidar observations of Saharan dust over Europe in the frame of EARLINET (2000–2002), J. Geophys. Res., 113, D10204, https://doi.org/10.1029/2007JD009028, 2008.
Pappalardo, G., Amodeo, A., Apituley, A., Comeron, A., Freudenthaler, V., Linné, H., Ansmann, A., Bösenberg, J., D'Amico, G., Mattis, I., Mona, L., Wandinger, U., Amiridis, V., Alados-Arboledas, L., Nicolae, D., and Wiegner, M.: EARLINET: towards an advanced sustainable European aerosol lidar network, Atmos. Meas. Tech., 7, 2389–2409, https://doi.org/10.5194/amt-7-2389-2014, 2014.
Pelon, J., Mallet, M., Mariscal, A., Goloub, P., Tanré, D., Bou Karam, D., Flamant, C., Haywood, J., Pospichal, B., and Victori, S.: Microlidar observations of biomass burning aerosol over Djougou (Benin) during African Monsoon Multidisciplinary Analysis Special Observation Period 0: Dust and Biomass-Burning Experiment, J. Geophys. Res., 113, D00C18, https://doi.org/10.1029/2008JD009976, 2008.
Popovici, I.: Aerosol spatial and temporal variability as seen by Mobile Aerosol Monitoring System (MAMS), PhD thesis, Université de Lille, https://theses.fr/2018LILUR070 (last access: 1 October 2021), 2018.
Popovici, I. E., Goloub, P., Podvin, T., Blarel, L., Loisil, R., Unga, F., Mortier, A., Deroo, C., Victori, S., Ducos, F., Torres, B., Delegove, C., Choël, M., Pujol-Söhne, N., and Pietras, C.: Description and applications of a mobile system performing on-road aerosol remote sensing and in situ measurements, Atmos. Meas. Tech., 11, 4671–4691, https://doi.org/10.5194/amt-11-4671-2018, 2018.
Popovici, I. E., Deng, Z., Goloub, P., Xia, X., Chen, H., Blarel, L., Podvin, T., Hao, Y., Chen, H., Torres, B., Victori, S., and Fan, X.: Mobile On-Road Measurements of Aerosol Optical Properties during MOABAI Campaign in the North China Plain, Atmosphere, 13, 21, https://doi.org/10.3390/atmos13010021, 2022.
Potter, J. F.: Two-frequency lidar inversion technique, Appl. Optics, 26, 1250, https://doi.org/10.1364/AO.26.001250, 1987.
Qi, S., Huang, Z., Ma, X., Huang, J., Zhou, T., Zhang, S., Dong, Q., Bi, J., and Shi, J.: Classification of atmospheric aerosols and clouds by use of dual-polarization lidar measurements, Opt. Express, 29, 23461, https://doi.org/10.1364/OE.430456, 2021.
Rocadenbosch, F., Frasier, S., Kumar, D., Lange Vega, D., Gregorio, E., and Sicard, M.: Backscatter Error Bounds for the Elastic Lidar Two-Component Inversion Algorithm, IEEE T. Geosci. Remote, 50, 4791–4803, https://doi.org/10.1109/TGRS.2012.2194501, 2012.
Royer, P., Chazette, P., Sartelet, K., Zhang, Q. J., Beekmann, M., and Raut, J.-C.: Comparison of lidar-derived PM10 with regional modeling and ground-based observations in the frame of MEGAPOLI experiment, Atmos. Chem. Phys., 11, 10705–10726, https://doi.org/10.5194/acp-11-10705-2011, 2011.
Russell, P. B., Swissler, T. J., and McCormick, M. P.: Methodology for error analysis and simulation of lidar aerosol measurements, Appl. Optics, 18, 3783, https://doi.org/10.1364/AO.18.003783, 1979.
Sasano, Y., Browell, E. V., and Ismail, S.: Error caused by using a constant extinction/backscattering ratio in the lidar solution, Appl. Optics, 24, 3929, https://doi.org/10.1364/AO.24.003929, 1985.
Sassen, K. and Dodd, G. C.: Lidar crossover function and misalignment effects, Appl. Optics, 21, 3162, https://doi.org/10.1364/AO.21.003162, 1982.
Seneviratne, S. I., Zhang, X., Adnan, M., Badi, W., Dereczynski, C., Di Luca, A., Ghosh, S., Iskandar, I., Kossin, J., Lewis, S., and Otto, F., Pinto, I., Satoh, M., Vicente-Serrano, S. M., Wehner, M., and Zhou, B.: Weather and Climate Extreme Events in a Changing Climate, in: Climate Change 2021 – The Physical Science Basis: Working Group I Contribution to the Sixth Assessment Report of the Intergovernmental Panel on Climate Change, Cambridge University Press, Cambridge, United Kingdom and New York, NY, USA, https://doi.org/10.1017/9781009157896, 2021.
Shang, X., Chazette, P., and Totems, J.: Analysis of a warehouse fire smoke plume over Paris with an N2 Raman lidar and an optical thickness matching algorithm, Atmos. Meas. Tech., 11, 6525–6538, https://doi.org/10.5194/amt-11-6525-2018, 2018.
Sicard, M., D'Amico, G., Comerón, A., Mona, L., Alados-Arboledas, L., Amodeo, A., Baars, H., Baldasano, J. M., Belegante, L., Binietoglou, I., Bravo-Aranda, J. A., Fernández, A. J., Fréville, P., García-Vizcaíno, D., Giunta, A., Granados-Muñoz, M. J., Guerrero-Rascado, J. L., Hadjimitsis, D., Haefele, A., Hervo, M., Iarlori, M., Kokkalis, P., Lange, D., Mamouri, R. E., Mattis, I., Molero, F., Montoux, N., Muñoz, A., Muñoz Porcar, C., Navas-Guzmán, F., Nicolae, D., Nisantzi, A., Papagiannopoulos, N., Papayannis, A., Pereira, S., Preißler, J., Pujadas, M., Rizi, V., Rocadenbosch, F., Sellegri, K., Simeonov, V., Tsaknakis, G., Wagner, F., and Pappalardo, G.: EARLINET: potential operationality of a research network, Atmos. Meas. Tech., 8, 4587–4613, https://doi.org/10.5194/amt-8-4587-2015, 2015.
Sicard, M., Rodríguez-Gómez, A., Comerón, A., and Muñoz-Porcar, C.: Calculation of the Overlap Function and Associated Error of an Elastic Lidar or a Ceilometer: Cross-Comparison with a Cooperative Overlap-Corrected System, Sensors, 20, 6312, https://doi.org/10.3390/s20216312, 2020.
Smirnov, A., Holben, B. N., Eck, T. F., Dubovik, O., and Slutsker, I.: Cloud-Screening and Quality Control Algorithms for the AERONET Database, Remote Sens. Environ., 73, 337–349, https://doi.org/10.1016/S0034-4257(00)00109-7, 2000.
Smirnov, A., Holben, B. N., Slutsker, I., Giles, D. M., McClain, C. R., Eck, T. F., Sakerin, S. M., Macke, A., Croot, P., Zibordi, G., Quinn, P. K., Sciare, J., Kinne, S., Harvey, M., Smyth, T. J., Piketh, S., Zielinski, T., Proshutinsky, A., Goes, J. I., Nelson, N. B., Larouche, P., Radionov, V. F., Goloub, P., Krishna Moorthy, K., Matarrese, R., Robertson, E. J., and Jourdin, F.: Maritime Aerosol Network as a component of Aerosol Robotic Network, J. Geophys. Res., 114, D06204, https://doi.org/10.1029/2008JD011257, 2009.
Sinyuk, A., Holben, B. N., Eck, T. F., Giles, D. M., Slutsker, I., Korkin, S., Schafer, J. S., Smirnov, A., Sorokin, M., and Lyapustin, A.: The AERONET Version 3 aerosol retrieval algorithm, associated uncertainties and comparisons to Version 2, Atmos. Meas. Tech., 13, 3375–3411, https://doi.org/10.5194/amt-13-3375-2020, 2020.
Tesche, M., Ansmann, A., MüLLER, D., Althausen, D., Mattis, I., Heese, B., Freudenthaler, V., Wiegner, M., Esselborn, M., Pisani, G., and Knippertz, P.: Vertical profiling of Saharan dust with Raman lidars and airborne HSRL in southern Morocco during SAMUM, Tellus B, 61, 144–164, https://doi.org/10.1111/j.1600-0889.2008.00390.x, 2009.
University of Wyoming: Upper air: Sounding, University of Wyoming, Department of Atmospheric Science [data set], https://weather.uwyo.edu/upperair/sounding.html (last access: 23 October 2023), 2023.
U.S. Geological Survey: USGS EROS Archive – Digital Elevation – Shuttle Radar Topography Mission (SRTM) 1 Arc-Second Global, USGS [data set], https://doi.org/10.5066/F7PR7TFT, 2023.
Vaughan, M.: Algorithm for retrieving lidar ratios at 1064 nm from space-based lidar backscatter data, Proceedings, Laser Radar Technology for Remote Sensing, 12 January 2004, Barcelona, Spain, Proc. SPIE 5240, https://doi.org/10.1117/12.510770, 2004.
Vaughan, M. A., Young, S. A., Winker, D. M., Powell, K. A., Omar, A. H., Liu, Z., Hu, Y., and Hostetler, C. A.: Fully automated analysis of space-based lidar data: an overview of the CALIPSO retrieval algorithms and data products, Proceedings, Laser Radar Techniques for Atmospheric Sensing, 4 November 2004, Maspalomas, Canary Islands, Spain, Proc. SPIE 5575, https://doi.org/10.1117/12.572024, 2004.
Veselovskii, I., Hu, Q., Goloub, P., Podvin, T., Choël, M., Visez, N., and Korenskiy, M.: Mie–Raman–fluorescence lidar observations of aerosols during pollen season in the north of France, Atmos. Meas. Tech., 14, 4773–4786, https://doi.org/10.5194/amt-14-4773-2021, 2021.
Veselovskii, I., Hu, Q., Goloub, P., Podvin, T., Barchunov, B., and Korenskii, M.: Combining Mie–Raman and fluorescence observations: a step forward in aerosol classification with lidar technology, Atmos. Meas. Tech., 15, 4881–4900, https://doi.org/10.5194/amt-15-4881-2022, 2022.
Wang, D., Stachlewska, I. S., Delanoë, J., Ene, D., Song, X., and Schüttemeyer, D.: Spatio-temporal discrimination of molecular, aerosol and cloud scattering and polarization using a combination of a Raman lidar, Doppler cloud radar and microwave radiometer, Opt. Express, 28, 20117, https://doi.org/10.1364/OE.393625, 2020.
Warneke, C., Schwarz, J. P., Ryerson, T., Crawford, J., Dibb, J., Lefer, B., Roberts, J., Trainer, M., Murphy, D., Brown, S., Brewer, A., Gao, R.-S., and Fahey, D.: Fire Influence on Regional to Global Environments and Air Quality (FIREX-AQ), NOAA/NASA [White Paper], https://csl.noaa.gov/projects/firex-aq/whitepaper.pdf (last access: 20 November 2023), 2018.
Warneke, C., Schwarz, J. P., Dibb, J., Kalashnikova, O., Frost, G., Al-Saad, J., Brown, S. S., Brewer, Wm. A., Soja, A., Seidel, F. C., Washenfelder, R. A., Wiggins, E. B., Moore, R. H., Anderson, B. E., Jordan, C., Yacovitch, T. I., Herndon, S. C., Liu, S., Kuwayama, T., Jaffe, D., Johnston, N., Selimovic, V., Yokelson, R., Giles, D. M., Holben, B. N., Goloub, P., Popovici, I., Trainer, M., Kumar, A., Pierce, R. B., Fahey, D., Roberts, J., Gargulinski, E. M., Peterson, D. A., Ye, X., Thapa, L. H., Saide, P. E., Fite, C. H., Holmes, C. D., Wang, S., Coggon, M. M., Decker, Z. C. J., Stockwell, C. E., Xu, L., Gkatzelis, G., Aikin, K., Lefer, B., Kaspari, J., Griffin, D., Zeng, L., Weber, R., Hastings, M., Chai, J., Wolfe, G. M., Hanisco, T. F., Liao, J., Campuzano Jost, P., Guo, H., Jimenez, J. L., Crawford, J., and The FIREX-AQ Science Team: Fire Influence on Regional to Global Environments and Air Quality (FIREX-AQ), J. Geophys. Res.-Atmos., 128, https://doi.org/10.1029/2022JD037758, 2023.
Weitkamp, C. (Ed.): Lidar: range-resolved optical remote sensing of the atmosphere, Springer, New York, 455 pp., ISBN 0387400753, 2005.
Welton, E. J. and Campbell, J. R.: Micropulse Lidar Signals: Uncertainty Analysis, J. Atmos. Ocean. Tech., 19, 2089–2094, https://doi.org/10.1175/1520-0426(2002)019<2089:MLSUA>2.0.CO;2, 2002.
Welton, E. J., Campbell, J. R., Spinhirne, J. D., and Scott, V. S.: Global monitoring of clouds and aerosols using a network of micropulse lidar systems, Second International Asia–Pacific Symposium on Remote Sensing of the Atmosphere, Environment, and Space, 13 February 2001, Sendai, Japan, Proc. SPIE 4153, https://doi.org/10.1117/12.417040, 2001.
Whiteman, C. D.: Mountain meteorology: fundamentals and applications, Oxford Univ. Press, New York, NY, 355 pp., ISBN 0195132718, 2000.
Yin, Z., Ansmann, A., Baars, H., Seifert, P., Engelmann, R., Radenz, M., Jimenez, C., Herzog, A., Ohneiser, K., Hanbuch, K., Blarel, L., Goloub, P., Dubois, G., Victori, S., and Maupin, F.: Aerosol measurements with a shipborne Sun–sky–lunar photometer and collocated multiwavelength Raman polarization lidar over the Atlantic Ocean, Atmos. Meas. Tech., 12, 5685–5698, https://doi.org/10.5194/amt-12-5685-2019, 2019.