the Creative Commons Attribution 4.0 License.
the Creative Commons Attribution 4.0 License.
 | 27 May 2024
Use of an uncrewed aerial system to investigate aerosol direct and indirect radiative forcing effects in the marine atmosphere
Patricia K. Quinn
Timothy S. Bates
Derek J. Coffman
James E. Johnson
Lucia M. Upchurch
An uncrewed aerial system (UAS) has been developed for observations of aerosol and cloud properties relevant to aerosol direct and indirect forcing in the marine atmosphere. The UAS is a Hybrid Quadrotor–fixed-wing aircraft designed for launch and recovery from a confined space such as a ship deck. Two payloads, clear sky and cloudy sky, house instrumentation required to characterize aerosol radiative forcing effects. The observing platform (UAS plus payloads) has been deployed from a ship and from a coastal site for observations in the marine atmosphere. We describe here details of the UAS, the payloads, and first observations from the TowBoatU.S. Richard L. Becker (March 2022) and from the Tillamook UAS Test Range (August 2022). The development of this UAS technology for flights from ships and coastal locations is expected to greatly increase observations of aerosol radiative effects in the marine boundary layer over both temporal and spatial scales.
- Article
(4414 KB) - Full-text XML
- BibTeX
- EndNote


Atmospheric aerosol particles affect Earth's radiation budget directly by scattering and absorbing incoming solar radiation and indirectly by taking up water and forming cloud droplets. The chemical composition of the particles determines, in part, whether they scatter incoming solar radiation back to space, which leads to cooling at Earth's surface, or absorb radiation and warm layers within the atmosphere (e.g., Li et al., 2022). The amount of heating depends on the vertical distribution of the absorbing aerosol layer, whether it is located above or below clouds, and the albedo of the surface (Takemura et al., 2002; Haywood and Ramaswamy, 1998). Whether particles act as cloud condensation nuclei (CCN) and nucleate cloud droplets depends on their size and chemical composition (Lohmann and Feichter, 2005). If the particles are large enough and contain sufficient soluble material, an increase in the particle number can lead to an increase in the cloud droplet number concentration and cloud albedo, thereby leading to a cooling at Earth's surface. The degree to which aerosol direct and indirect forcing are cooling the planet and offsetting warming by greenhouse gases is highly uncertain. According to the Intergovernmental Panel on Climate Change (IPCC), aerosols contribute the largest uncertainty in quantifying present-day climate change (IPCC, 2021).
Vertical profiles of aerosol and cloud properties are required to improve models and decrease uncertainties, particularly over oceans due to the susceptibility of marine clouds to small changes in aerosol concentrations (Rosenfeld et al., 2019). While satellite observations have the advantage of providing global coverage, in situ observations have the highest level of accuracy available to constrain radiative forcing and reduce uncertainties in forcing estimates (Li et al., 2022). Crewed aircraft have been used for the past several decades to characterize horizontal and vertical distributions of aerosol and cloud properties relevant to radiative forcing (e.g., Russell et al., 1999; Yoon and Kim, 2006; Zhang et al., 2017). These measurements come at a relatively high cost and require extensive logistical coordination.
Uncrewed aerial systems (UASs) have the advantages of lower costs and flexibility and frequency of flights compared to crewed aircraft. In addition, they offer higher spatial resolution due to their relatively slow flight speed. UASs have been used since the mid-2000s to measure aerosol and cloud properties relevant to radiative forcing including the particle number concentration and size distribution, light absorption, aerosol optical depth, and the cloud droplet number and effective radius. These measurements have been made with vertical takeoff and landing (VTOL) UASs, either quadcopters (Brady et al., 2016) or hexacopters (e.g., Chilinski et al., 2016; Aurell et al., 2017), or fixed-wing UASs (Corrigan et al., 2008; Bates et al., 2013). The VTOL UASs that have been used have the advantage of not needing a catapult or runway to be launched and recovered but typically have short endurance (< 30 min) and a limited altitude ceiling (∼ 1 km). The fixed-wing aircraft that have been used require a launch and recovery apparatus or a runway but have the advantage of longer duration (hours) and can reach high altitudes of 3 km or more. While some VTOL UASs used can carry relatively heavy payloads (6 kg or more), they can only do so for ∼ 15 min, while some of the fixed-wing UASs can carry heavy payloads for hours.
We report here on measurements of aerosol and cloud properties using a Hybrid Quadrotor–fixed-wing UAS, the fixed-wing vertical take-off and landing (VTOL) rotator (FVR), developed by L3Harris Latitude Engineering. The Hybrid Quadrotor–fixed-wing concept combines the advantages of fixed-wing flight with the ability to take off and land vertically, thus eliminating the need for a runway and allowing for launch and recovery from ships and other confined spaces. The FVR-55 has an endurance of more than 4 h and a height ceiling of at least 3 km and can carry a 6 kg payload. The NOAA Pacific Marine Environmental Laboratory (PMEL) has developed two UAS payloads – one for the measurement of aerosol properties relevant to direct radiative forcing (clear sky) and one for the measurement of aerosol and cloud properties relevant to indirect forcing (cloudy sky). The FVR-55 and instrumentation in the two payloads are described herein along with the results of its first shipboard and coastal flights.
2.1 FVR-55
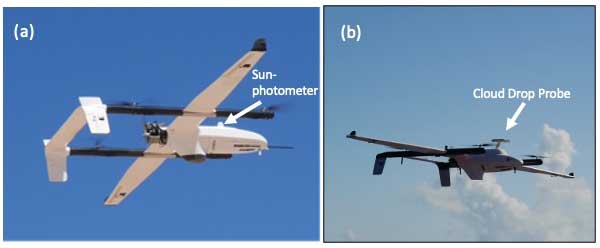
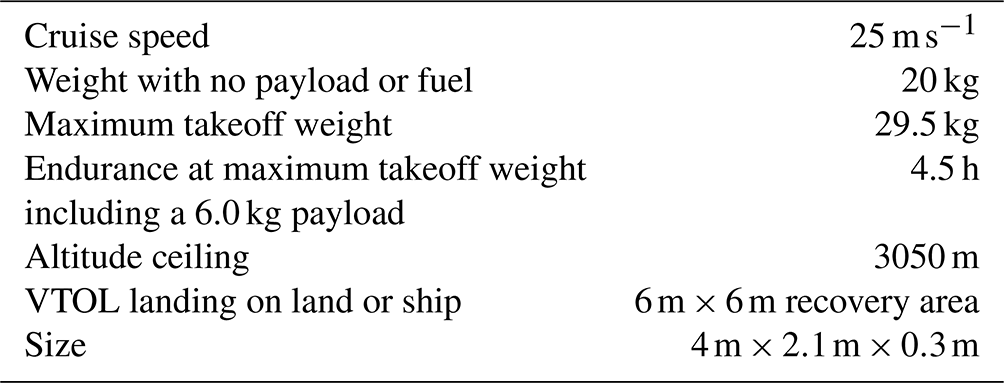
The FVR-55, a class II medium endurance UAS, was developed by Latitude Engineering (since acquired by L3Harris) with support from NOAA Phase I and II SBIR (Small Business Innovation Research) awards (see Fig. 1). The focus of the SBIR award was a UAS able to carry a 5.5 kg payload and have a flight ceiling of up to 3 km, an endurance of 3 h or more, and a pusher engine. The Hybrid Quadrotor–fixed-wing design of the FVR-55 combines the high-power density of electric motors and propellers with the high-energy density of a piston engine and liquid fuel. The electric quadrotor system is used during launch and recovery (high power, short endurance), and the gas engine is used for fixed-wing flight (low power, long endurance). The aircraft has an empty weight of 20 kg and a maximum takeoff weight of 29.5 kg. It cruises at 25 m s−1. See Table 1 for a full list of specifications. A Cloud Cap Piccolo autopilot flight controller is used for autonomous flight. In the case of a lost link, the avionics guides the UAS on its return to a predetermined base location and, if communication is not re-established, assists in landing at an established target. A mobile ground control station (Windows tablet or laptop with a data link) provides ground command and control. A differential GPS (dGPS) system is used for computing the aircraft's heading to circumvent the challenges created by the hull of a ship distorting Earth's magnetic field. The fuselage of the FVR-55 was designed for a maximum spacing of the two dGPS antennas to increase the accuracy of the computed heading. VTOL motors and propellers provide enough overall power for the FVR-55 to handle turbulence created by relative wind blowing over the superstructure of a ship. A “pusher engine” is used to minimize contamination of sample air in flight by exhausting the engine aft while the UAS flies forward. When the flight track includes circles or spirals, engine contamination can occur, but it is readily identifiable by short-lived increases in the particle number concentration. We removed all data during these contaminated periods. Individual payloads are integrated into a nose cone to allow for easy swapping of payloads between flights. Payloads are powered at 12 V DC from the plane with 200 W of power available.
2.2 Payloads
2.2.1 Inlet, sample airflow, and data acquisition
An isokinetic inlet is mounted on the nose cone of the FVR-55 to bring sample air into the payload under a vacuum (see Fig. 2). No changes in the particle number concentration coinciding with the UAS transitioning from large spirals (1 to 2 km) to level-leg flights were observed, indicating the performance of the isokinetic inlet was not impacted by a spiral flight pattern. Since particle number concentrations are dominated by the submicron size range, this metric does not rule out effects in supermicron size ranges. In addition, the slow air speed of the UAS (25 m s−1) is expected to decrease impacts of the flight pattern on transmission of submicron particle through the inlet into the payload. Wind tunnel tests are planned for the determination of the particle passing efficiency as a function of air speed and particle size.
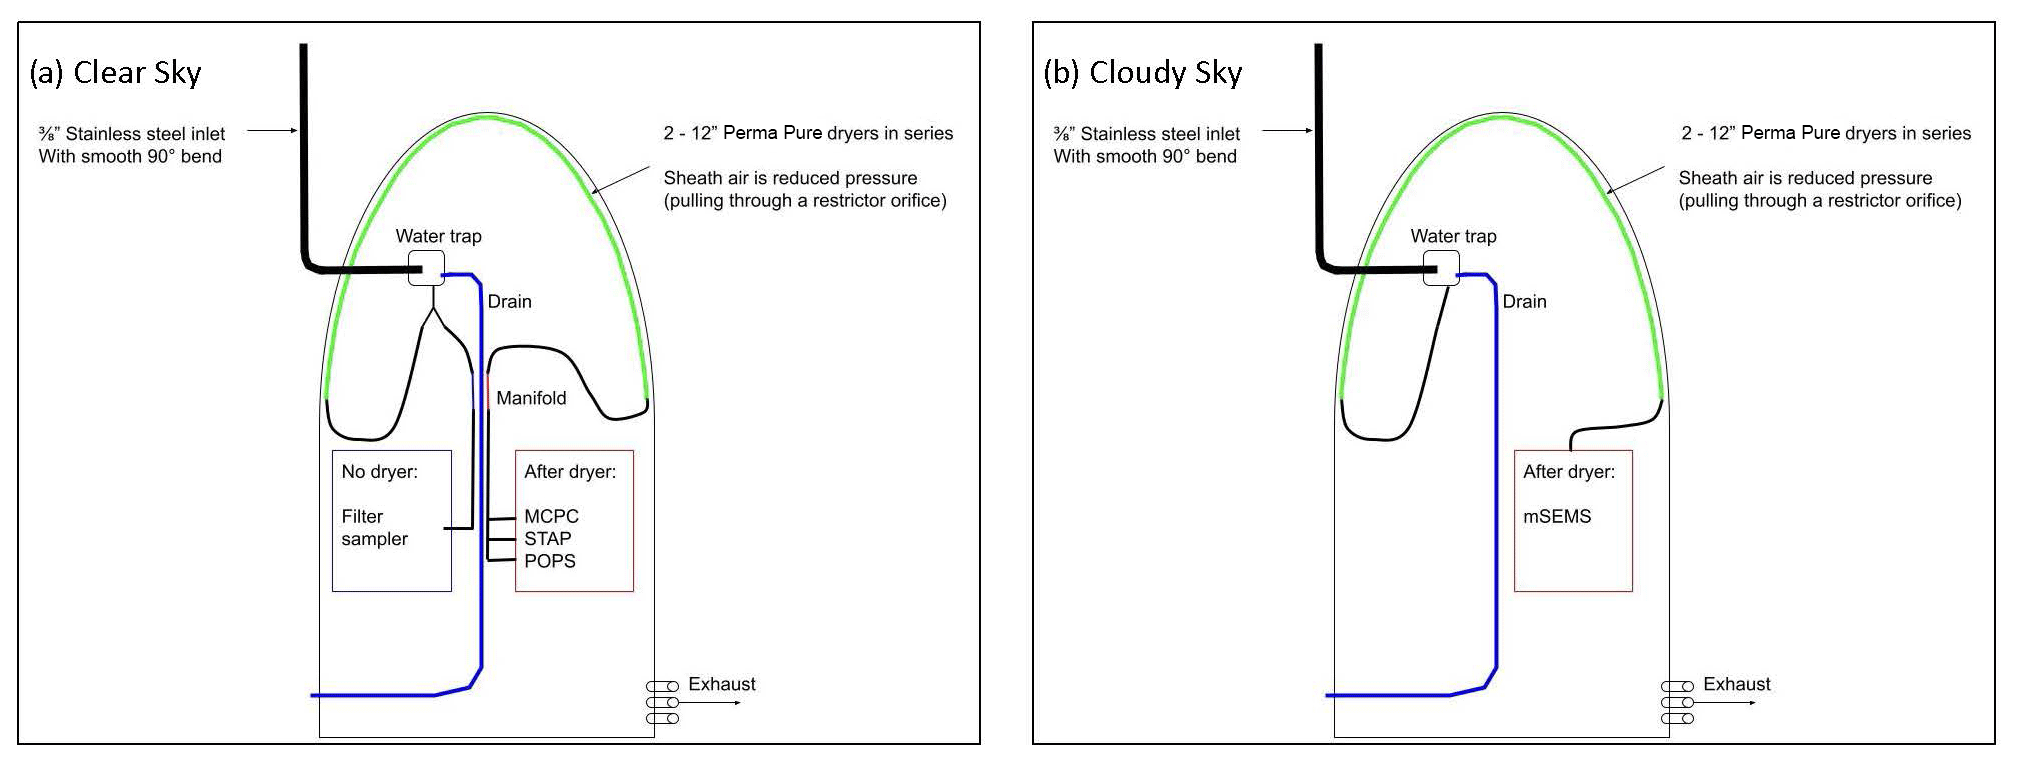
Figure 2Flow diagrams for (a) clear-sky and (b) cloudy-sky payloads. MCPC: Mixing Condensation Particle Counter, STAP: Single Channel Tricolor Absorption Photometer, POPS: Portable Optical Particle Spectrometer, mSEMS: miniaturized Scanning Electrical Mobility Sizer.
Sample air first encounters an inline water trap where water droplets are removed through impaction. The water trap has two outlets – one outlet is for the sample line, which is under a vacuum. The larger outlet exhausts condensate through a drain line that also allows for excess ram air to passively exit the sampling system. Individual instruments subsample off of the sample inlet. For the clear-sky payload, a Perma Pure dryer is located downstream of the water trap and upstream of all instruments except the filter sampler (Fig. 2a). For the cloudy-sky payload, a Perma Pure dryer is located downstream of the water trap and upstream of the mSEMS (Fig. 2b). A restricting orifice and filter on the inlet of the Perma Pure sheath air combined with a vacuum on the outlet of the sheath air were used to remove moisture from the sample stream. Instruments are cooled in flight by airflow through vent shafts cut into the nose cone frame. More details about the instruments in each payload are provided in Sects. 2.2.2 (clear sky) and 2.2.3 (cloudy sky).
The data acquisition (DAQ) systems for the two payloads use different hardware and software but have the same functionality. The clear-sky payload DAQ is an Arduino-based system that uses LabVIEW software to collect data and control the sensors. The cloudy-sky payload uses a Raspberry Pi running Python software to do the same. Both DAQ systems collect and save data locally (on the aircraft) and also send data back to a ground station via a Silvus radio link in near real time. This communication link allows for command and control of the sensors during flight as well as the ability to save a second copy of the data on the ground.
Table 2Measured parameters and instrumentation in the clear-sky payload.
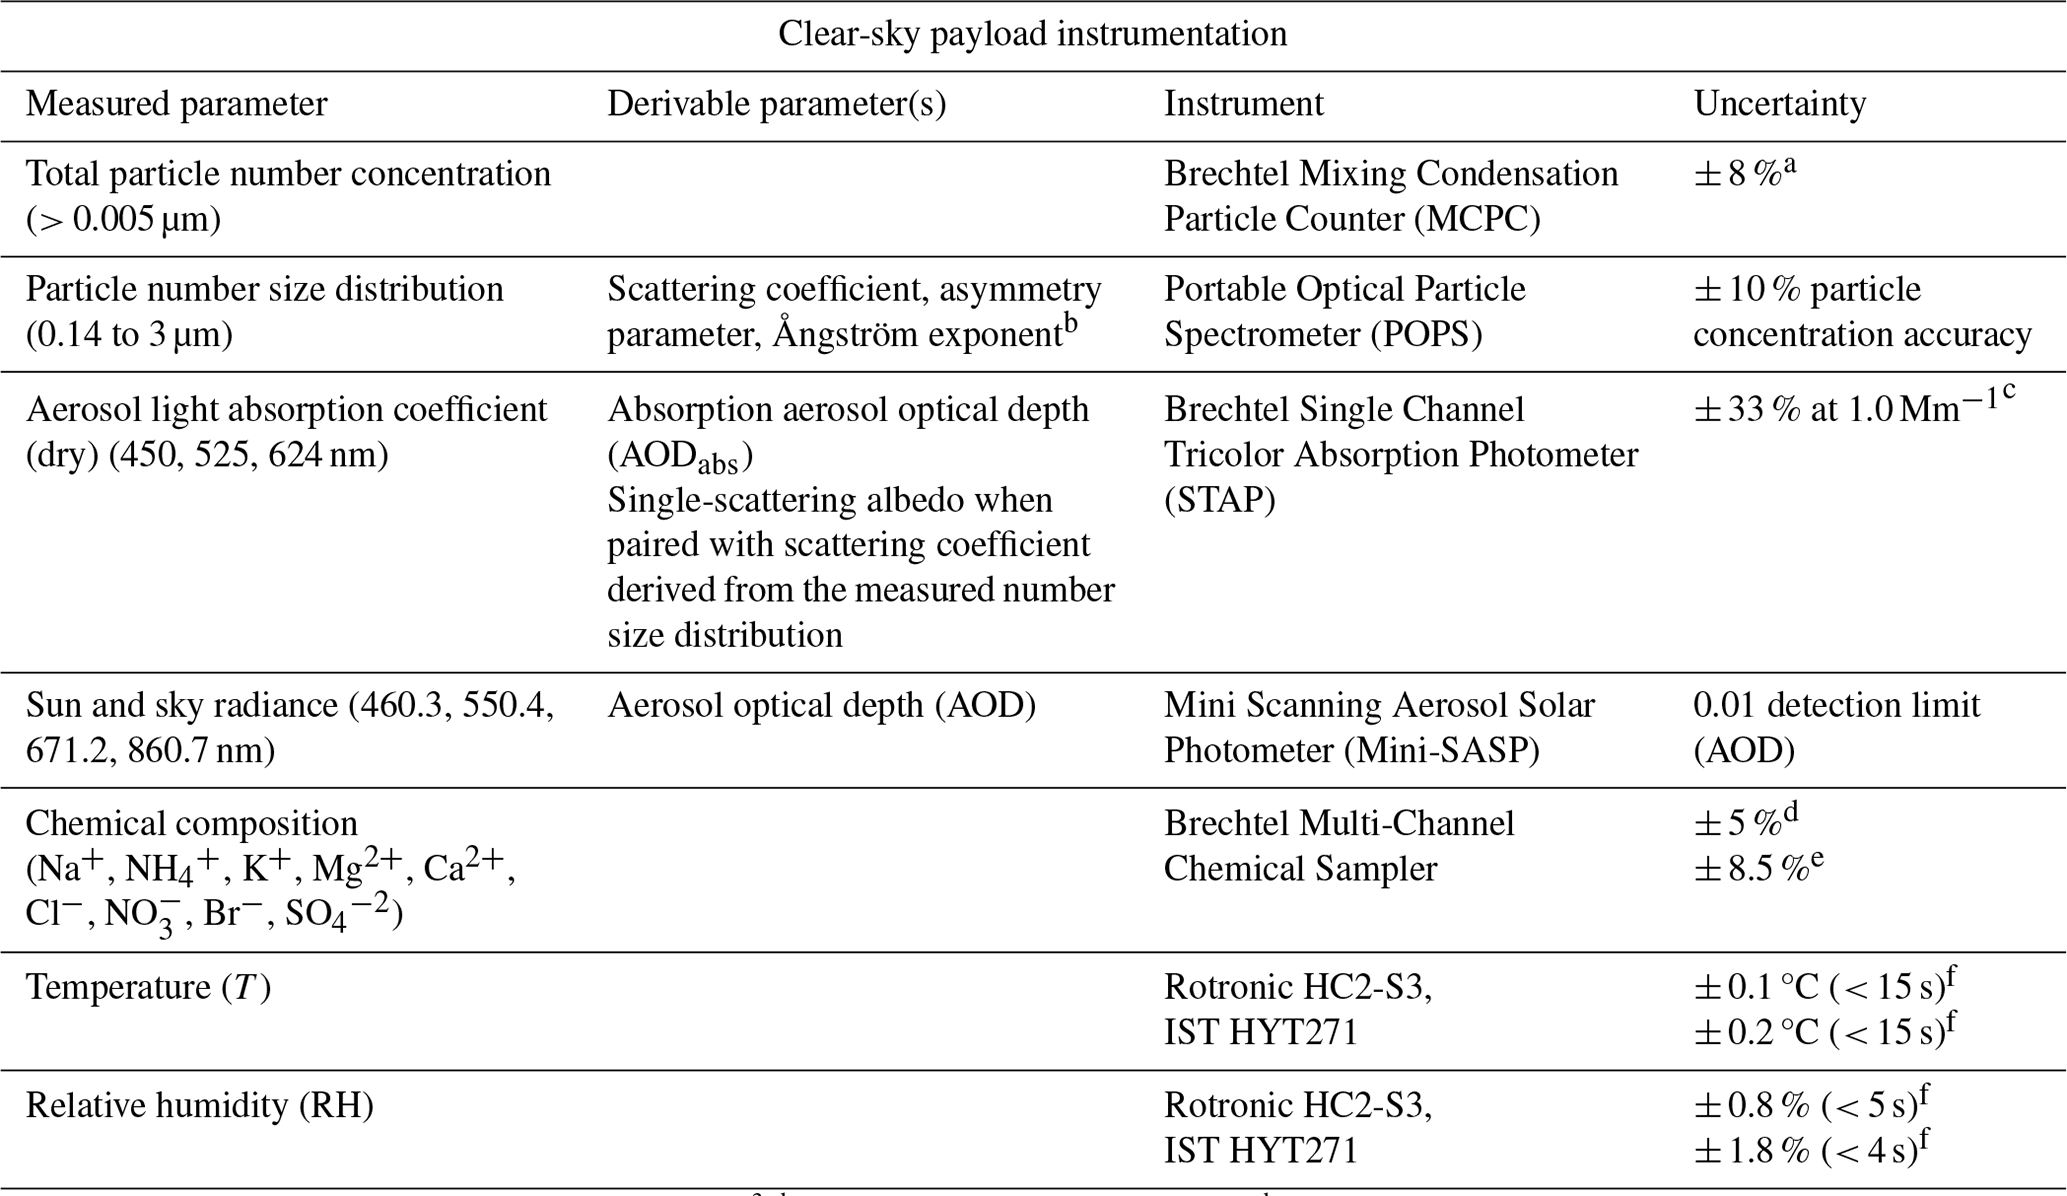
a Coincidence-corrected concentration uncertainty at 10 000 cm−3. b Using Mie theory. c Bates et al. (2013). d Sample flow accuracy (uncertainty due to chemical sampler only). e Overall uncertainty for the measurement of inorganic ions. f Time response.
2.2.2 Clear-sky payload
The clear-sky payload was designed to measure aerosol properties required for quantification of aerosol direct radiative effects. All of the initial instruments in the payload were built by Brechtel Manufacturing Inc. (BMI; Haywood, California; ACCESS model 9400, Aerosol Counting, Composition, Extinction and Sizing System) under a NOAA SBIR award. The payload was first flown on a MANTA C1 UAS from Ny-Ålesund, Svalbard, Norway, in 2011 (Bates et al., 2013). The instruments include a Mixing Condensation Particle Counter (MCPC) for measuring the total particle number or condensation nuclei (CN) concentration, a three-wavelength Single Channel Tricolor Absorption Photometer (STAP) for measuring the aerosol light absorption coefficient, and a multi-channel filter sampler for the collection of aerosol samples for post-flight chemical analysis. Two instruments were added to the payload in 2014 including a Printed Optical Particle Spectrometer (POPS) for the measurement of the particle number size distribution (0.14 to 3 µm) (Telg et al., 2017) and a Mini Scanning Aerosol Solar Photometer (Mini-SASP) for the measurement of sun and sky radiance (Murphy et al., 2016). The payload also includes Rotronic HC2-S3 and Innovative Sensor Technology (IST) HYT271 temperature and humidity sensors. The updated version of the clear-sky payload was flown during a second campaign from Ny-Ålesund in 2015 (Telg et al., 2017). A Perma Pure dryer is plumbed into the sample line to provide dried air to the MCPC, STAP, and POPS. The RH of the sampled air downstream of the dryer was 34 % ± 1.6 %, ∼ 8 % lower than ambient RH, for results reported here from a high-altitude flight off the coast of Oregon in August 2022. The clear-sky payload plus the FVR-55 nose cone weighs 6 kg. The Mini-SASP mounted on top of the FVR-55 nose cone is shown in Fig. 1a. Table 2 lists the instruments in the clear-sky payload that were integrated into the FVR-55 nose cone. Sampling rates were 1 s for all real-time instruments, while filter samples were collected over a period of minutes to hours. Further details on each instrument are provided below. Comparisons between the clear-sky payload and benchtop instruments are presented in Sect. 3.
Table 3Measured parameters and instrumentation in the cloudy-sky payload.
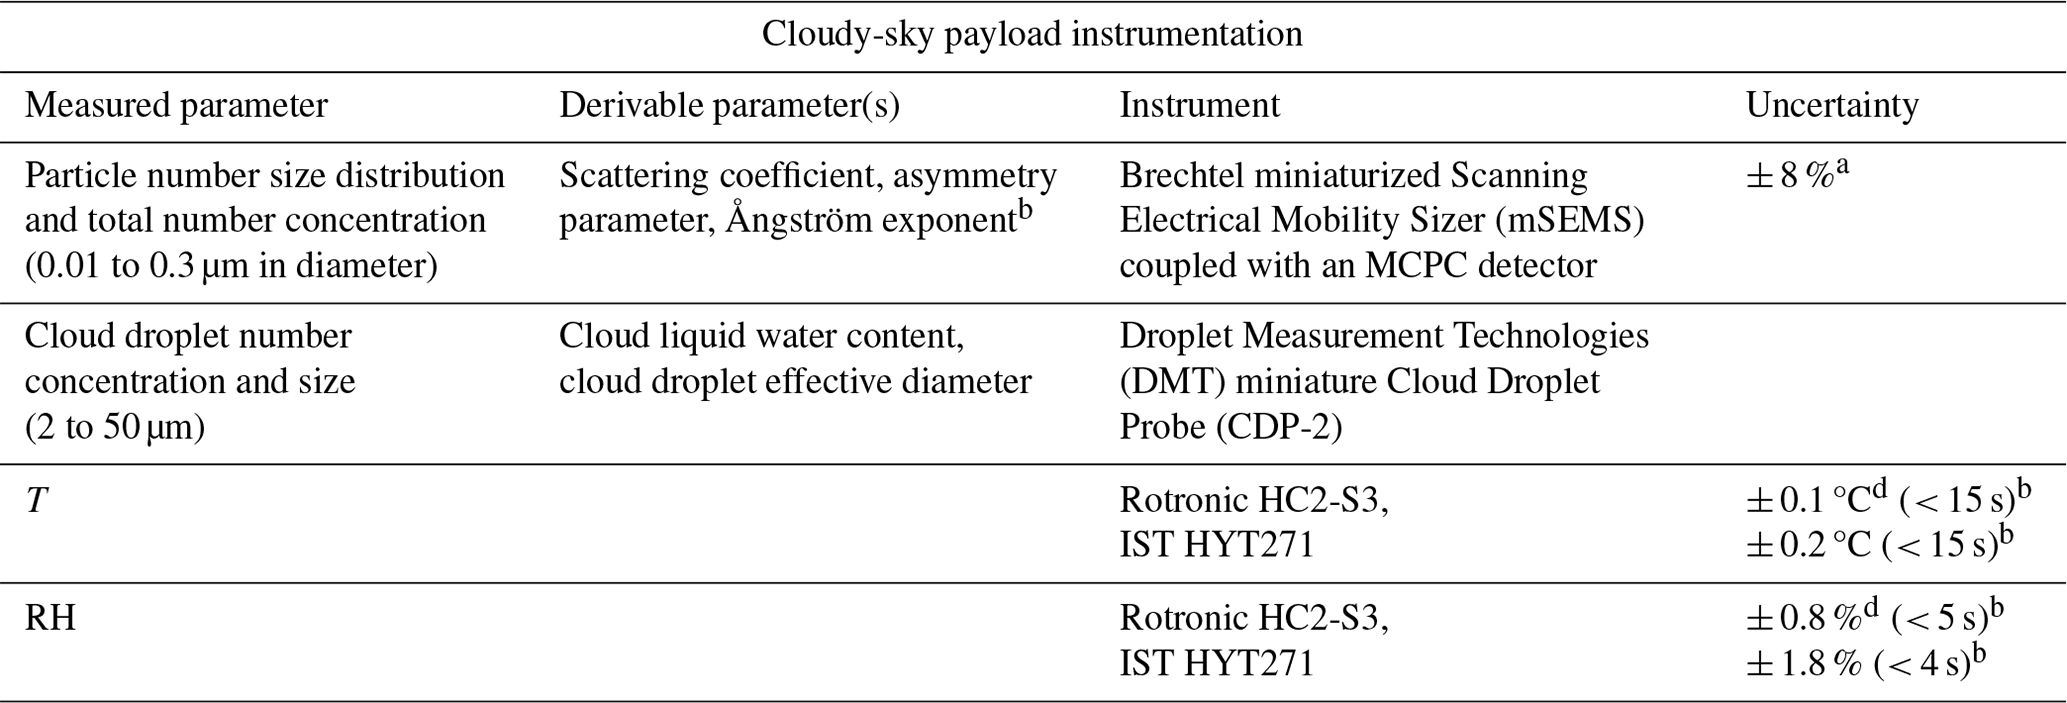
a Coincidence-corrected concentration uncertainty at 10 000 cm−3. b Response time.
The MCPC (modified BMI model 1710) has a 0.18 s response time, grows particles in a butanol-saturated flow, and counts particles larger than 5 nm in diameter. Modifications to the butanol handling components of the commercial model 1710 were implemented to address the high-vibration environment of the UAS (Bates et al., 2013). The MCPC has a ± 8 % coincidence-corrected uncertainty for a particle concentration of 10 000 cm−3.
The STAP provides real-time measurements of the aerosol light absorption coefficient at 450, 525, and 624 nm. Light is transmitted from an LED source through a sample and a reference filter. The filter transmission is the ratio of the signals from the two filters. The light absorption coefficient is proportional to the rate of decrease in light transmittance divided by the flow rate of air through the filter (Bond et al., 1999). The raw data are averaged into 60 s values for the calculation of the rate of decrease in light transmittance. The minimum detectable level (MDL), defined as the peak-to-peak noise with the instrument running particle-free air, is 0.2 Mm−1. Errors in the STAP measurement include noise in the transmission value, uncertainty in the measured flow rate, and uncertainty in the measured filter spot area (Anderson et al., 1999). A quadrature sum of these errors yields a relative uncertainty of ± 33 % at 1.0 Mm−1. In addition, light scattering by particles collected on the sample filter can lead to an overestimation of absorption values by ∼ 2 % of the observed scattering coefficient (Bond et al., 1999). A correction for scattering was not performed on the data collected in August 2022. The temperature and relative humidity of the sample airflow drawn into the STAP was 12 ± 1.6 °C and 34 % ± 1.6 %, respectively, for conditions encountered off of the coast of Oregon in August 2022.
The Brechtel Multi-Channel Chemical Sampler has eight filter holders (13 mm diameter) and a magnetically driven rotary valve manifold that distributes the vacuum from a central pump to each of the sampling channels. A remote serial command is used to move the rotary valve to a new sampling channel in flight. The sample flow rate is 2.5 L min−1, which is measured by the pressure drop through a laminar flow element. One of the eight channels can be used to maintain flow when a filter sample is not being collected; 13 mm Millipore Fluoropore 1.0 µm PTFE membrane filters were used for sample collection. For the measurements reported here, filters were extracted post-flight in a 17 % methanol water solution for analysis by ion chromatography (IC). The volume of liquid used to extract the filters was minimized to 1 mL to increase the sensitivity of the method. Filters were sonicated for 30 min. The filter extract was injected into a Metrohm 940 Professional IC Vario with 889 IC Sample Center autosamplers and analyzed for inorganic cations (Na+, , K+, Ca2+, Mg2+) and anions (Cl−, , ). A Metrosep C 6 100/4.0 mm column, a 2 mmol HNO3 eluent, and a flow rate of 0.9 mL min−1 were used for the cation analysis. Metrosep A Supp 5 250/4.0 and Phenomenex Star-Ion A300 100/4.6 mm columns in serial, a 1 mmol NaHCO3 and 5 mmol Na2CO3 eluant, and a flow rate of 0.7 mL min−1 were used for the anion analysis. Sources of uncertainty in the chemical analysis include the air volume sampled (± 5 %), the extract liquid volume (± 3.5 %), 2 times the standard deviation of the blank, and the precision and calibration of the method (± 5 %). Total average overall uncertainty was ± 8.5 %. Only ion concentrations above 2 times the standard deviation of the filter blank are reported here.
Particle number size distributions from 0.14 to 3.0 µm in diameter were measured with a POPS (Telg et al., 2017). The POPS detects and sizes single particles based on the dependence of the scattering intensity on particle size. A 405 nm laser diode is used as a light source. The light-scattering signal is collected at scattering angles between 38 and 142° (Gao et al., 2016). As for the MCPC and the STAP, the temperature and RH of the sample air drawn into the POPS was 12 ± 1.6 °C and 34 % ± 1.6 %, respectively, for conditions encountered off of the coast of Oregon in August 2022. Uncertainty for the POPS is ∼ 10 % of the total particle concentration.
Sun and sky radiance were measured with a Mini-SASP at wavelengths of 460.3, 550.4, 671.2, and 860.7 nm (Murphy et al., 2016). Four independent telescopes, each with a unique interference filter, are housed in a single aluminum block. A heater is integrated with a temperature controller to minimize condensation and keep the photodiodes at an approximately constant temperature. The Mini-SASP scans the sky at the elevation angle of the sun. A full azimuth revolution is made in about 30 s, and measurements are made every 30 ms. The sun angle is corrected for the tilt of the UAS. Each revolution of the Mini-SASP's telescopes results in a distinct peak corresponding to the intensity of direct sunlight. The aerosol optical depth of an atmospheric layer on the slant path is the difference between the sun signal and Rayleigh scattering. Flight data from Svalbard in 2015 show a detection limit better than 0.01 in AOD for a vertical profile through the bottom few kilometers of the atmosphere.
2.2.3 Cloudy-sky payload
The cloudy-sky payload was designed to characterize the relationship between the cloud droplet number concentration and particle number concentration and size below, within, and above clouds. The cloudy-sky payload has a Brechtel miniaturized Scanning Electrical Mobility Sizer (mSEMS) for the measurement of the particle number size distribution (0.01 to 0.3 µm) and total particle number concentration. A Perma Pure dryer is plumbed into the sample line to provide dried air to the mSEMS. The RH of the sheath air was measured during operation. The RH of the dried sample air depended on ambient conditions but ranged from 35 % to 45 % for the flights from Tillamook. Operating conditions for the mSEMS included a sheath flow rate of 2.5 L min−1, a sample flow rate of 0.36 L min−1, and a size scan of 30 bins at 1 s per bin, resulting in a sampling rate of 30 s for each size distribution.
A miniature and lightweight DMT Cloud Droplet Probe (CDP-2) is used to measure the cloud droplet number concentration and size distribution between 2 and 50 µm. The payload also has Rotronic HC2-S3 and IST HYT271 temperature and humidity sensors. Cloudy-sky instrumentation and specifications are listed in Table 3. The cloudy-sky payload was integrated into an FVR-55 nose cone in March 2021 at the L3Harris facility in Tucson, Arizona. The payload then flew three flights on board the FVR-55 at the Florence Military Reservation up to an altitude of 2.6 km. The cloud droplet probe mounted on top of the FVR-55 nose cone is shown in Fig. 1b. Further details on each instrument are provided below. Comparisons between the cloudy-sky payload and benchtop instruments are presented in Sect. 3.
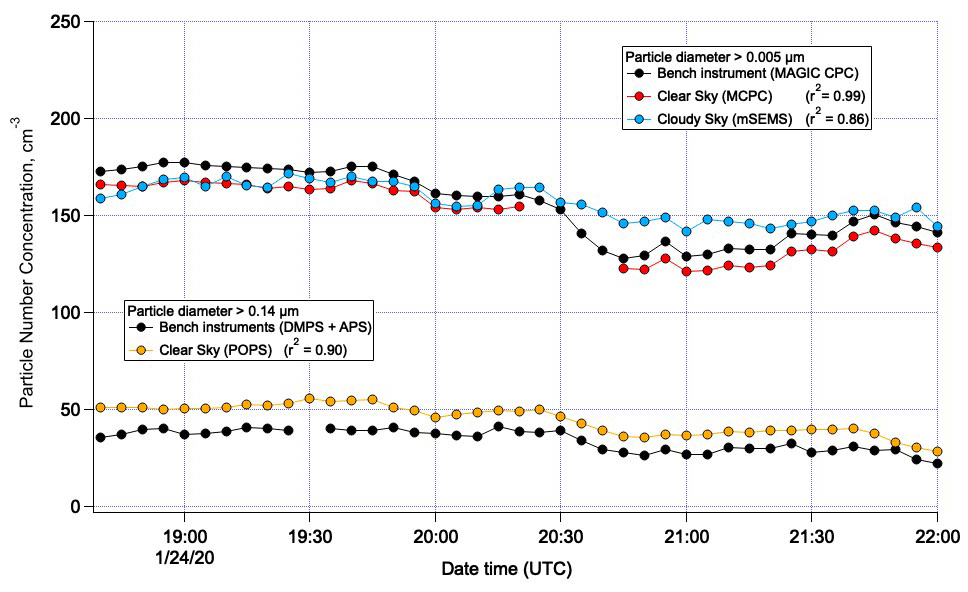
Figure 3Comparison of particle number concentrations between benchtop and payload instruments for diameters greater than 0.005 µm (top half of plot) and 0.14 µm (bottom half of plot) during ATOMIC on 24 January 2020. Coefficients of determination, r2, are for the regression between the payload CN concentration and the benchtop instrument used for each size range.
The Brechtel mSEMS (model 9404) provided particle number size distributions for diameters between 0.01 to 0.3 µm every 30 s. The total particle number concentration was obtained by integrating the number concentration over the measured size distribution. The RH of sample air drawn into the mSEMS was 45 % ± 0.74 %, which was ∼ 40 % below ambient RH, for the conditions encountered during flights off the coast of Oregon in August 2022. As for the clear-sky payload, the MCPC has an ± 8 % coincidence-corrected uncertainty for a particle concentration of 10 000 cm−3.
A DMT CDP-2 was mounted on the top of a FVR-55 nose cone for measurement of the cloud droplet number concentration for diameters from 2 to 50 µm and retrieval of liquid water content. Liquid water content was derived from the cloud droplet size distribution provided by the DMT CDP-2. The CDP-2 measures cloud droplet counts and sizes them into 30 bins from 2–30 µm. The count in each bin is converted to a concentration using the cross-sectional surface area of the sensing beam (0.24 µm2) and the speed of the aircraft to determine the volume of air sampled per second. Once the concentration is known, the volume of cloud droplets per volume is calculated and converted to mass per volume, assuming a density of 1.0.
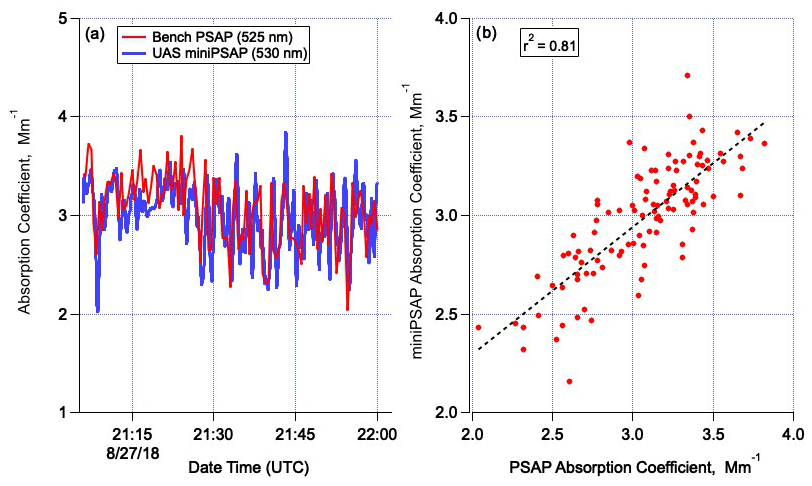
Figure 4Comparison of the benchtop Particle Soot Absorption Photometer (PSAP) and the clear-sky UAS STAP as (a) a time series and (b) a correlation plot. The comparison was done of ambient air at PMEL on 27 August 2018.
The degree of agreement between the benchtop and payload measurements of the particle number concentration and absorption coefficient were evaluated by calculating the relative difference between the measurements as
where xbench and xuas are the benchtop and UAS measured values, respectively. The overall experimental uncertainty was calculated as
where δxbench and δxuas are the uncertainties in the benchtop and UAS measurements, respectively, as reported in Tables 1 and 2 and taken from manufacturer specifications.
3.1 Particle number concentration
Particle number concentrations measured by the clear- and cloudy-sky payloads and benchtop instruments were compared during ATOMIC (Atlantic Tradewind Ocean–Atmosphere Mesoscale Interaction Campaign), a cruise in the tropical North Atlantic (Quinn et al., 2021). The comparison took place on 24 January 2020 from 18:40 to 22:00 UTC. For both the payload and the benchtop instruments, sample air was drawn through a 5 m mast 18 m above sea level and forward of the ship's stack. The mast was automatically rotated into the wind to maintain nominally isokinetic flow. Air entered the inlet through a 5 cm diameter hole and passed through a 7° expansion cone and then into the sampling mast with a 20 cm inner diameter. The flow through the mast was 1 m3 min−1. The transmission efficiency of the inlet for particles with aerodynamic diameters of < 6.5 µm is greater than 95 % (Bates et al., 2002). The bottom 1.5 m of the mast was heated so that the sample air was at an RH of 60 % ± 5 %. Stainless-steel tubes extending into the heated portion of the mast were connected to benchtop instrumentation and payload inlets with conductive silicone tubing.
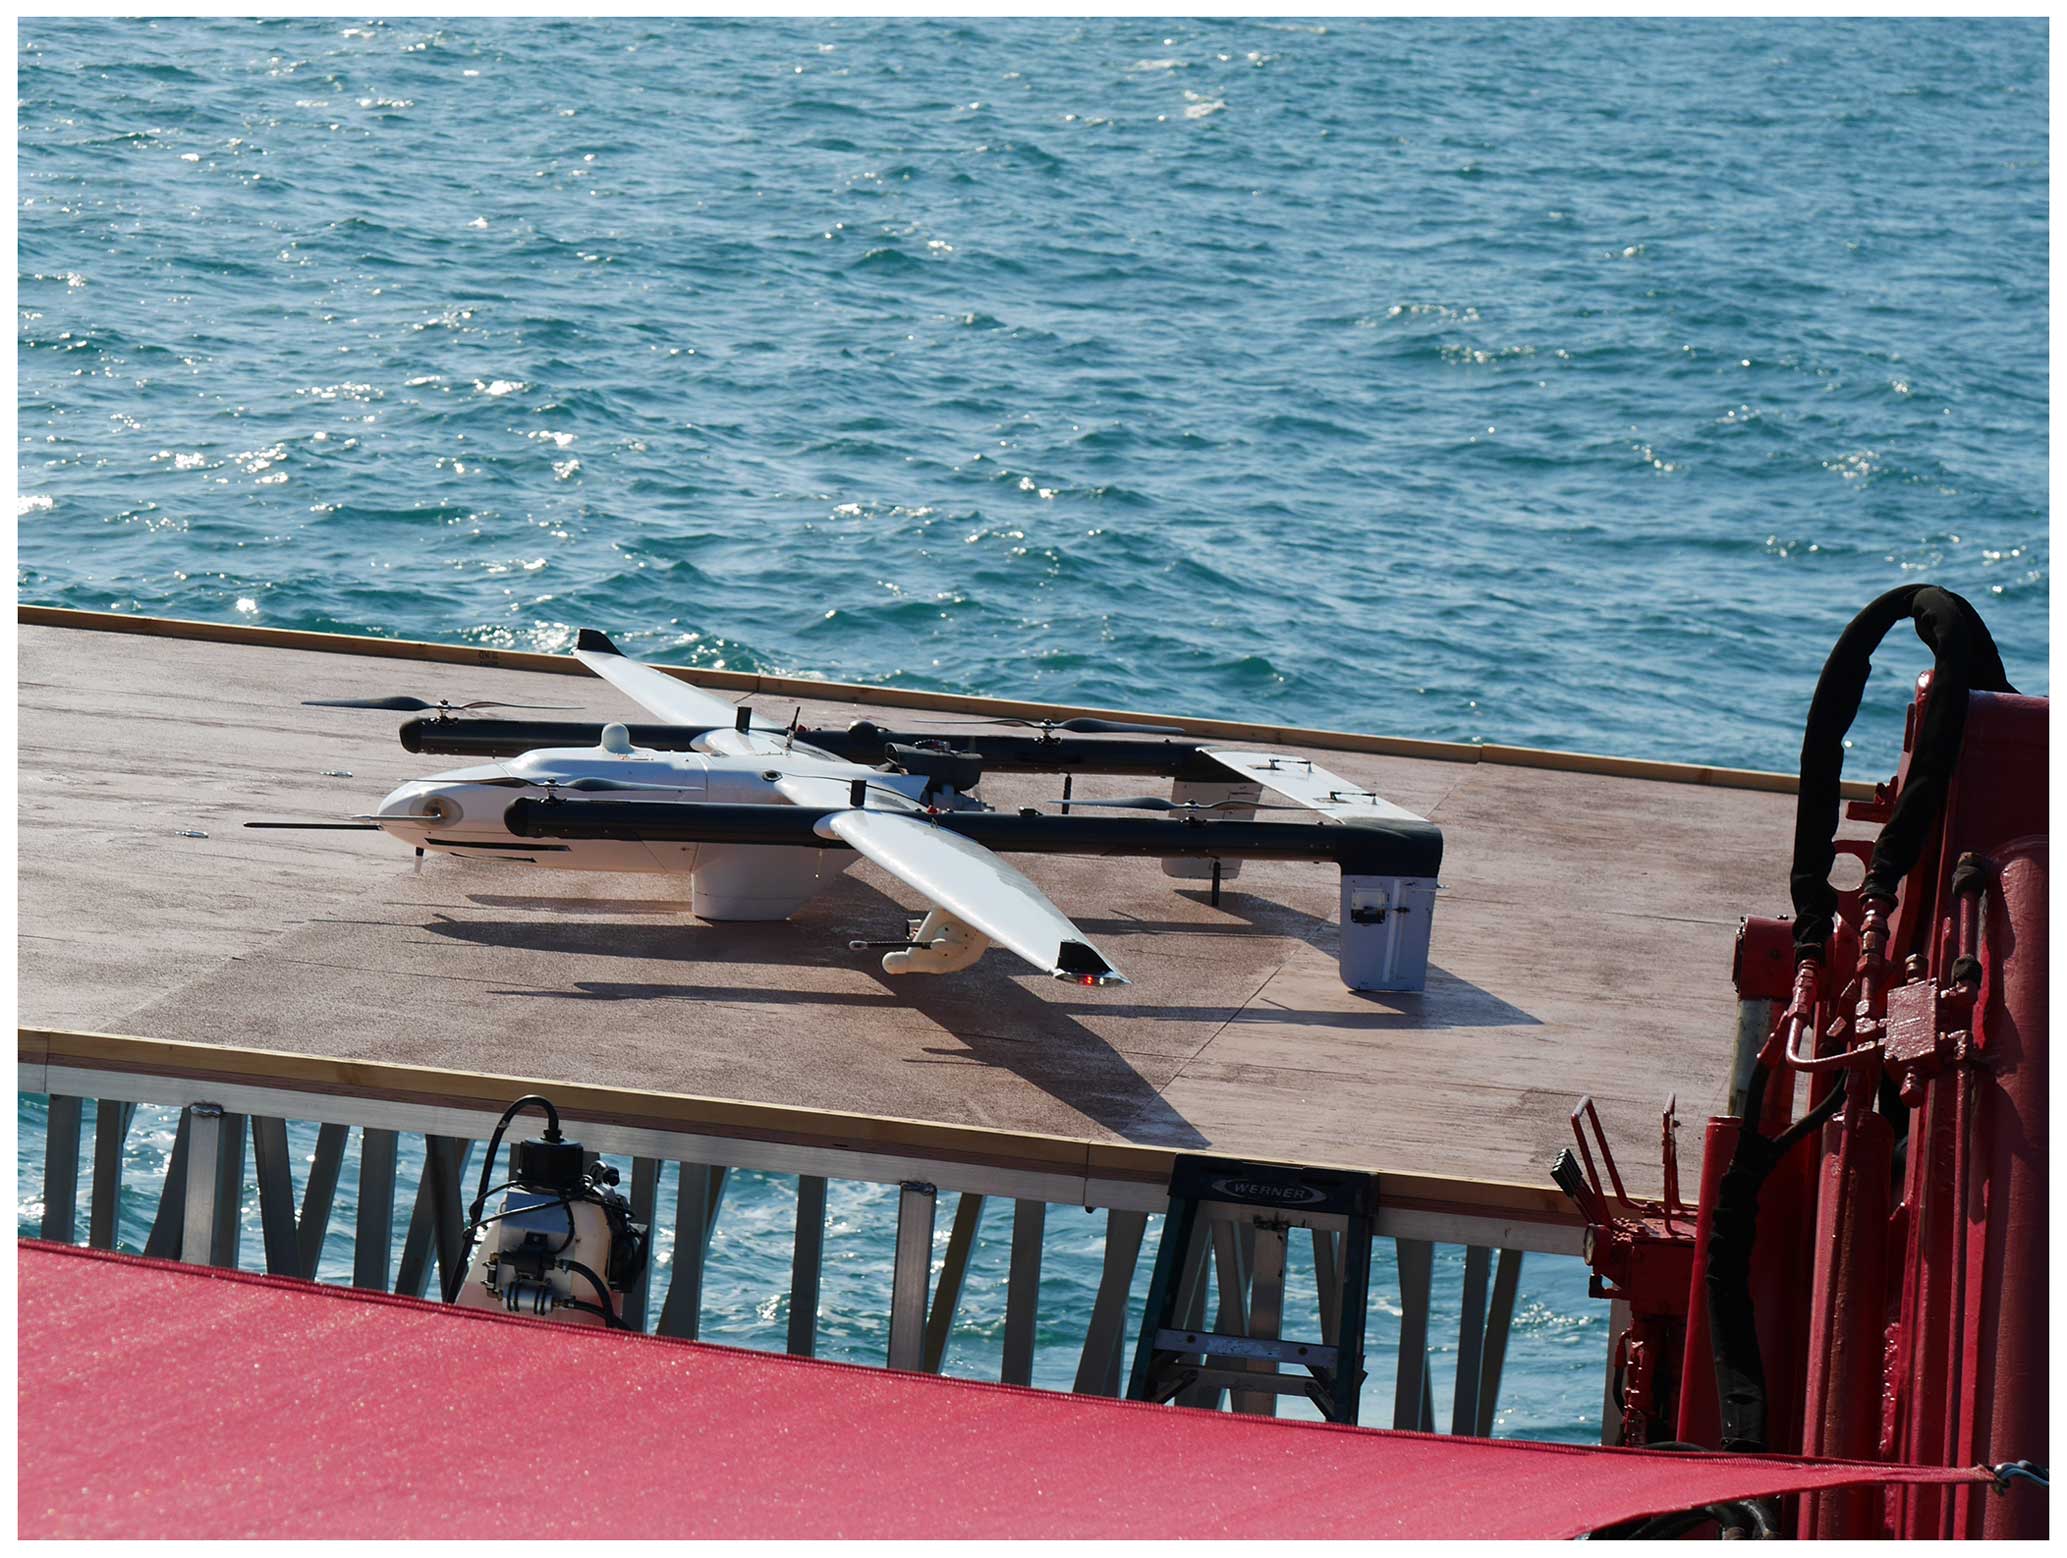
Figure 5FVR-55 with the clear-sky payload on board on the 6 m×6 m launch pad on the rear deck of the TowBoatU.S. Richard L. Becker.
Table 4Shipboard flight information including duration, payload configuration, flight pattern, wind speed, and ship heave.
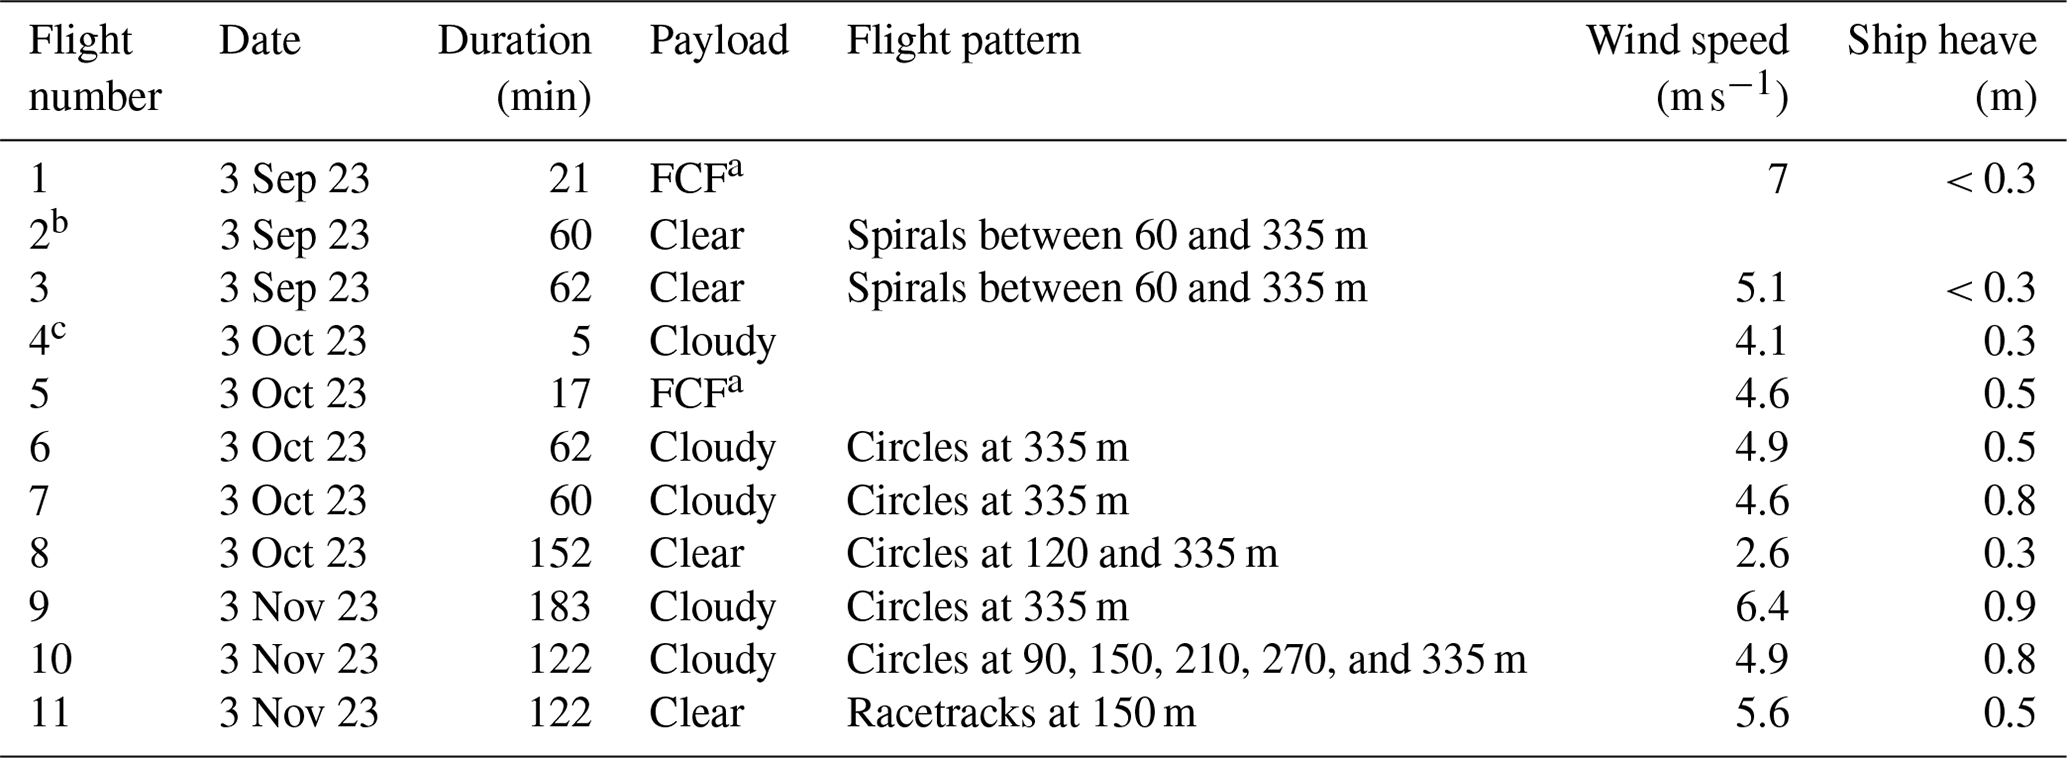
a Functional check flight. b Telemetry file corrupted. c Generator failure, flight aborted.
A benchtop MAGIC 210 particle counter, which measures particles with diameters greater than 0.005 µm, was compared to the clear-sky MCPC and the cloudy-sky mSEMS (Fig. 3, top of plot). Differential mobility particle sizers (DMPSs) and an aerodynamic particle sizer (APS) were used for the comparison to the clear-sky POPS for particles with diameters greater than 0.14 µm (Fig. 3, bottom of plot). A combination of an Aitken DMPS and an accumulation DMPS measures the size distribution between 0.002 and 0.8 µm in geometric diameter. The APS measures the size distribution between 0.85 and 10.37 µm in aerodynamic diameter. The DMPS and APS size distributions were merged by converting the APS data from aerodynamic to geometric values using calculated densities and associated water mass at 60 % RH based on the range of measured chemical compositions reported by Quinn et al. (2002). The DMPSs and APS are housed in a temperature-controlled box at the base of the inlet to maintain a uniform RH across all instruments. Given that the payloads and benchtop instruments were measured from a common inlet and the residence time in the tubing to the payloads was short, it is likely that RH differences in the sample air delivered to the payload and benchtop instruments were negligible over the comparison period. The payload data were averaged into 5 min time periods to match the DMPS–APS scan times.
The average difference between the benchtop MAGIC CPC and the clear-sky payload MCPC number concentration was 22 ± 42 cm−3, resulting in an average relative difference of 5.2 % ± 0.9 %. The relative difference is smaller than the overall experimental uncertainty of 9.5 % ± 0.09 %, indicating good agreement. The coefficient of determination (r2) for the comparison was 0.99. These results indicate that the trends in the two measures of number concentration agreed well. However, the benchtop instrument was consistently higher by about 5 %. Differences could be due to particle losses in sampling lines. Particle losses will be quantified in future experiments.
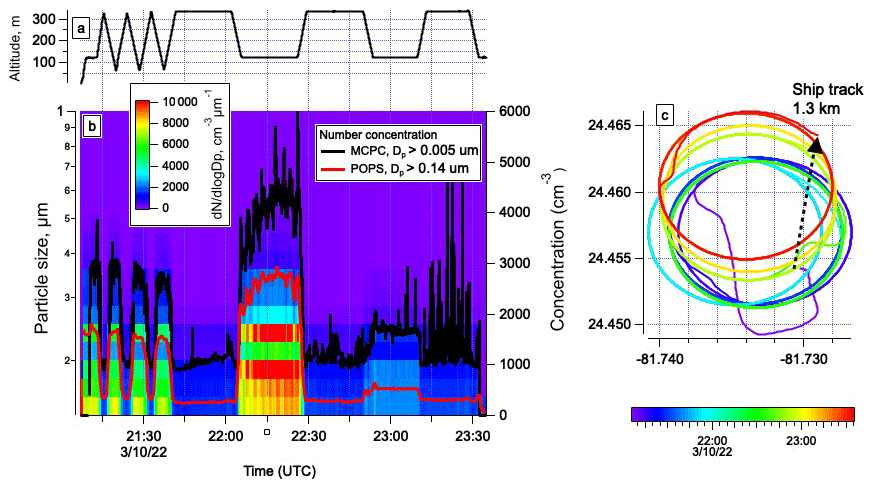
Figure 6Data from the clear-sky payload during flight 8 on 10 March 2022 offshore of Key West including (a) altitude, (b) the total particle number concentration for two size ranges (Dp>0.005 and 0.14 µm) and particle number size distribution, and (c) the flight track colored by time along the ship track.
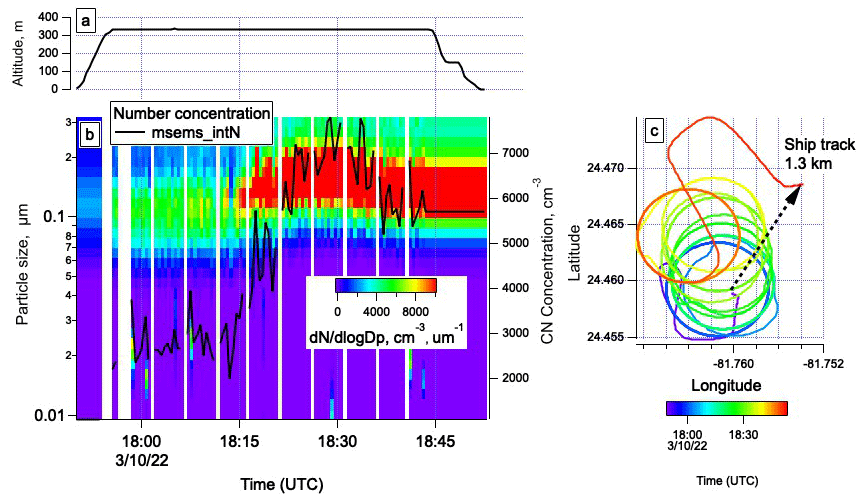
Figure 7Data from the cloudy-sky payload during flight 6 on 10 March 2022 offshore of Key West including (a) altitude, (b) the total particle number concentration and particle number size distribution, and (c) the flight track colored by time along the ship track. Msems_intN refers to the integral number concentration from the mSEMS number size distribution measurement.
The average difference between the benchtop MAGIC CPC and the cloudy-sky integrated number concentration from the mSEMS was −1.9 ± 9.8 cm−3, resulting in an average relative difference of −0.19 % ± 0.67 %. This difference is smaller than the overall experimental uncertainty of 10.2 % ± 0.72 %, indicating good agreement. A correlation between the two measurements resulted in an r2 value of 0.86. The mSEMS was, in general, lower than the MAGIC CPC for the first half of the comparison and higher for the second half, most likely due to changes in the mSEMS inversion routine during the experiment.
The average difference between the benchtop DMPS–APS and the clear-sky POPS for diameters greater than 0.14 µm was −11 ± 7.6 cm−3, resulting in an average relative difference of −31 % ± 6.7 %. The overall experimental uncertainty was 13 % ± 0.67 %, indicating a systemic difference resulting in consistently lower values measured by the DMPS–APS than the POPS, again likely associated with losses in sampling lines. The r2 value for the correlation was 0.90.
3.2 Absorption coefficient
The clear-sky STAP (525 nm) was compared to a Radiance Research PSAP (530 nm) at PMEL on 27 August 2018 from 21:06 to 22:00 UTC. The 5 m mast described above was used to deliver sample air to the benchtop PSAP and to the clear-sky payload. The benchtop PSAP was downstream of a Berner multi-jet cascade impactor with a 50 % aerodynamic cutoff diameter of 1.0 µm and a Perma Pure Nafion dryer (model PR-94). The clear-sky STAP also was downstream of a Perma Pure Nafion dryer so that both absorption signals were measured at < 25 % RH. Data were averaged to 30 s to minimize noise. A time series of the comparison and a correlation plot are shown in Fig. 4a and b, respectively. The average absolute difference between the benchtop PSAP and the UAS STAP was 0.11 ± 0.34 Mm−1. The average relative difference was 3.1 % ± 12 %, which was smaller than the overall experimental uncertainty of 32 % ± 3.9 %. The r2 value for the correlation was 0.81.
Table 5Tillamook UAS Test Range (TUTR) flight information including duration, payload configuration, and flight pattern. Time within clouds is based on a measured cloud droplet number concentration above 5 cm−3.
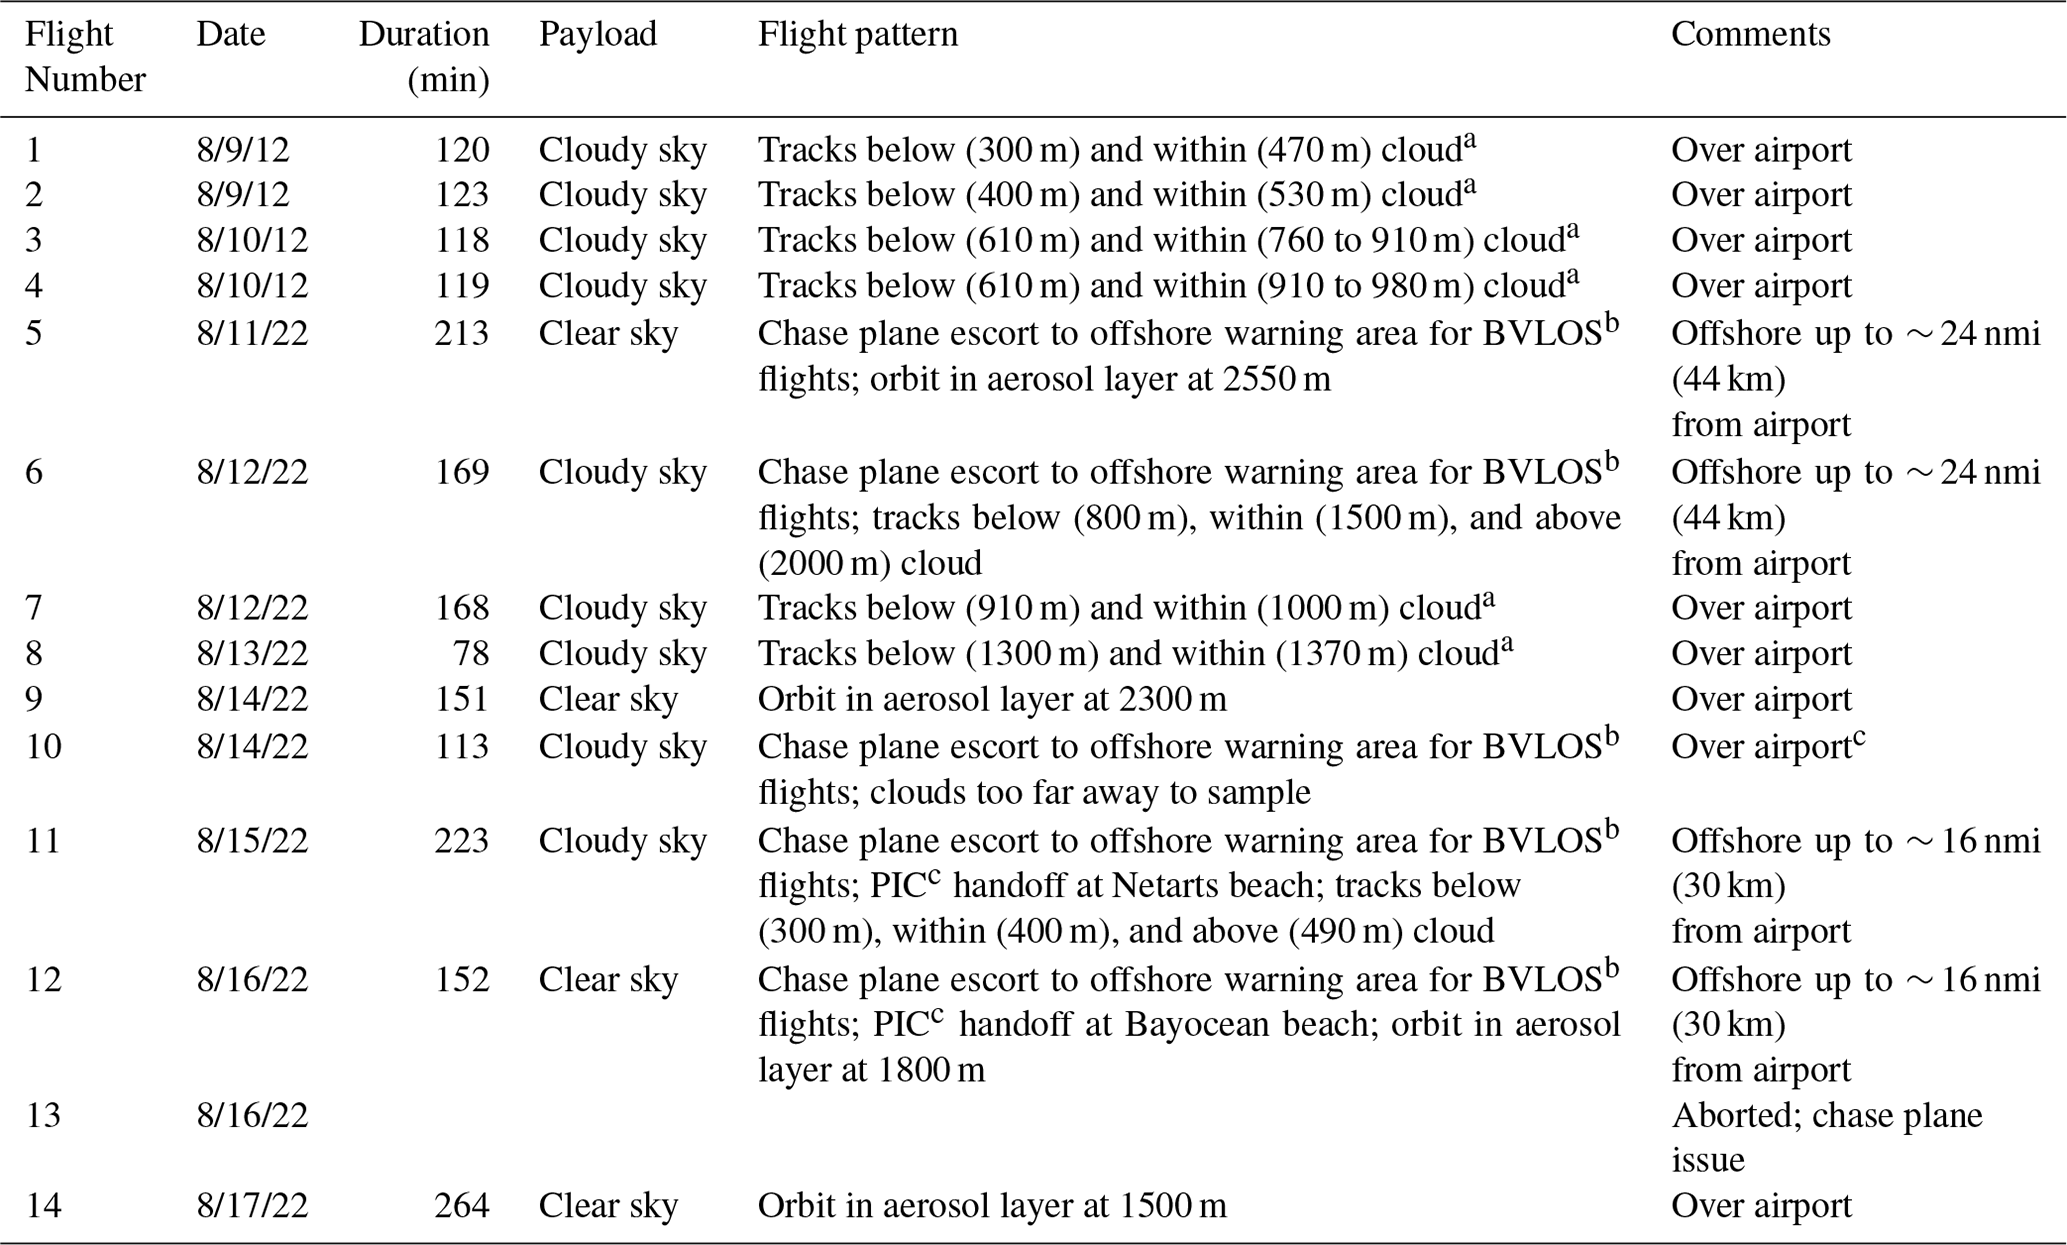
a Above-cloud flights were prevented by the line-of-sight COA over the airport. b Beyond visual line of sight. c Pilot in control.
3.3 Aerosol optical depth
Aerosol optical depth (AOD) from the Mini-SASP was compared to a Solar Light Microtops during flight 5 over the Tillamook airport. The lowest-altitude flight flown while the payload was still powered on before landing was 660 m. The Mini-SASP measured at 550.4 nm and the Microtops at 500 nm. The Mini-SASP AODs were adjusted to 500 nm using the Microtops-measured Ångström exponent. Between 22:45 and 22:50 UTC on 11 August 2022 the Microtops AOD averaged 0.08 ± 0.01, while the Mini-SASP measured 0.07 ± 0.02, indicating agreement within overall uncertainty. The lower average value for the Mini-SASP could be due to the higher altitude of the measurement. Due to the limited period of comparison, further tests are warranted.
4.1 First shipboard flights
The first shipboard flights of the FVR-55 with payloads on board took place from 9 to 11 March 2022 from the TowBoatU.S. Richard L. Becker off the coast of Key West, Florida. A 6 m×6 m launch pad was installed on the rear deck to minimize interference with boat superstructure during takeoff and landing (Fig. 5). A total of 11 flights were flown, including 2 functional check flights of the UAS, 4 with the clear-sky payload, and 5 with the cloudy-sky payload. The first two flights were conducted 25 nmi (46 km) northwest of Key West, with the remainder conducted 5 nmi (9.3 km) southeast of Key West. All were line-of-sight flights, with a maximum altitude of 360 m due to the certificate of authorization (COA) in place. Unfortunately, this low flight ceiling prevented clouds from being sampled. Table 4 provides a list of flights with the duration, payload configuration, flight pattern, wind speed, and ship heave. Wave heights during all flights were observed to be between 0.3 and 0.6 m. The ship speed was 1 to 4 m s−1.
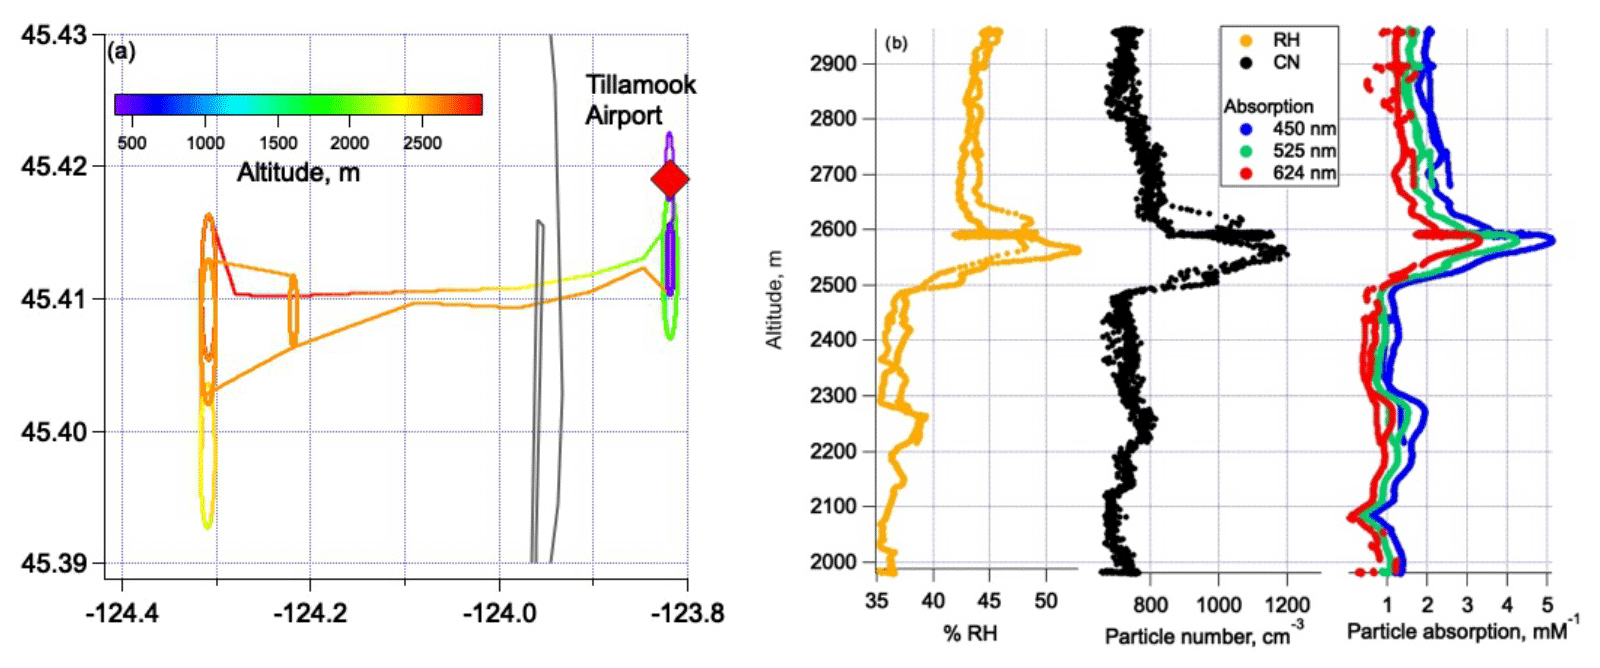
Figure 8Flight 5 track from the TUTR colored by (a) altitude and (b) vertical profiles of RH, the particle number concentration, and the absorption coefficient.
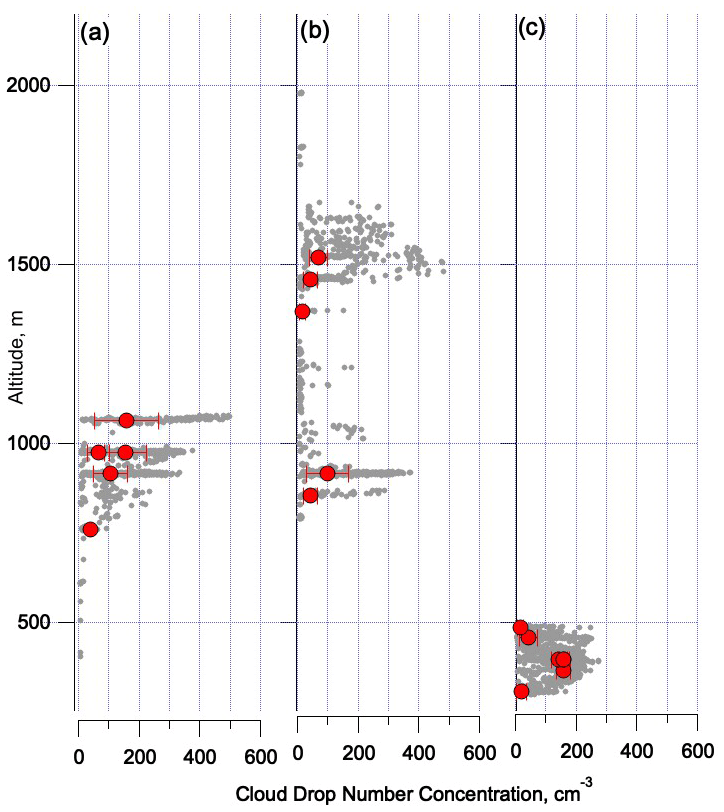
Figure 9Vertical profiles of cloud droplet number concentration for flights (a) 4, (b) 6, and (c) 11 from the TUTR. All data points are shown in grey, and level-leg-averaged points are shown in red.
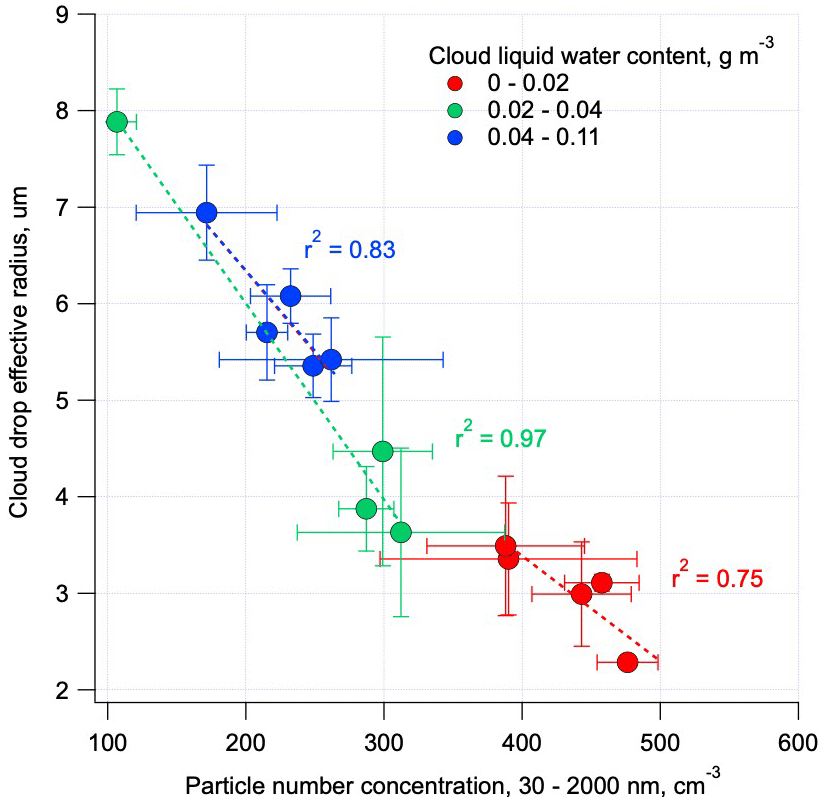
Figure 10Comparison of particle number concentration for diameters between 0.03 and 2.0 µm and cloud droplet effective radius averaged over the altitude level-leg data shown in Fig. 8. Data are binned by ranges of cloud liquid water content.
Three flights occurred on 10 March and 11 March, with both payloads being flown. With each payload in its own nose cone, the swapping of payloads between flights took 30 to 45 min. This time included readying the plane for the next flight (installing fresh batteries and refueling).
Examples of data collected during clear- and cloudy-sky payload flights are shown in Figs. 6 and 7, respectively.
The clear-sky payload was flown on flight 8. Initially four vertical profiles between 50 and 335 m were conducted to identify the altitude of aerosol layers. Circles were then flown, alternating between 335 and 120 m (Fig. 6a). Particle number concentrations decreased with height, ranging up to 5000 cm−3 at 120 m and decreasing to 1000 cm−3 at 335 m for diameters greater than 0.005 µm (Fig. 6b). Concentrations for diameters greater than 0.14 µm were lower by more than a factor of 2. This result is expected given the large number concentration at diameters less than 0.2 µm. The flight track colored by time and the ship track are shown in Fig. 6c. The ship traveled 1.3 km during the flight. The plane landed within ± 0.36 m of the programmed spot on the launch pad.
The cloudy-sky payload was flown on flight 6. After the initial ascent, circles were conducted at 335 m, the highest altitude allowed by the COA in place (Fig. 7a). Unfortunately, this altitude was below the cloud bottom, but the flight served as a test of the aerosol instrumentation on board. Initially particle number concentrations were around 3000 cm−3 but increased up to 8000 cm−3 after about 30 min of flight time (Fig. 7b). As the number concentration increased, the mean size of the particles shifted from about 0.12 to 0.16 µm. The flight track colored by time and the ship track during the flight are shown in Fig. 7c. The ship traveled 1.3 km during the flight with the plane landing within ± 0.76 m of the designated spot on the launch pad.
4.2 First flights in clouds
The FVR-55 with payloads on board was flown from the Tillamook UAS Test Range (TUTR) in cooperation with the Near Space Corporation (NSC) between 9 and 17 August 2022. TUTR is located at the Tillamook, Oregon, airport about 10 km from the coast. Flights were conducted over the airport and in offshore warning areas up to 40 km from the airport under the NSC COA. Line-of-sight flights over the airport were conducted up to 1370 m with the help of visual observers. For the offshore BVLOS flights, a chase plane escorted the FVR-55 through non-controlled airspace to the warning areas. NSC personnel communicated flights to the local Federal Aviation Administration (FAA) air traffic control (Seattle center) and managed airspace deconfliction. Mission control was based out of the Tillamook airport control tower. The science team directed the pilot in control (PIC) to adjust flight tracks based on incoming, real-time data from the payloads. Five flights with the clear-sky payload and nine flights with the cloudy-sky payload were conducted for a total of 38.5 flight hours (see Table 5).
The track from flight 5 with the clear-sky payload on board is shown in Fig. 8 along with vertical profiles of the RH, particle number concentration, and aerosol absorption coefficient. The presence of an aerosol layer at ∼ 2550 m is clear based on the increased particle number concentration and aerosol absorption. The increase by a factor of 4 in absorption relative to values above and below the layer indicates the aerosol was likely made up of smoke. Results from the filter sample collected in the aerosol layer show that non-sea-salt potassium, a tracer of biomass burning, was elevated at 0.04 µg m−3. HYSPLIT trajectory analysis indicates the sampled air mass was transported northward along the Oregon coast where several fires were burning according to the NASA FIRMS (Fire Information for Resource Management System) website (https://firms.modaps.eosdis.nasa.gov/map/#t:adv;d:today;@-117.1,41.0,6.0z, last access: 29 April 2024).
Vertical profiles of the cloud droplet number concentration for flights 4, 6, and 11 are shown in Fig. 9. All data points are shown in grey, and level-leg-averaged points are shown in red. Particle number concentrations for diameters between 0.03 and 0.3 µm were derived from the integral of the mSEMS size distribution. A lognormal fit was applied to the size distributions to extend the size range up to 2.0 µm to encompass the entirety of the accumulation mode. The relationship between the particle number concentration and cloud droplet effective radius for the averaged level-leg data from the three flights is shown in Fig. 10. The particle number concentration and cloud droplet size were well correlated (r2=0.75 to 0.97) for all ranges of cloud liquid water contents sampled. An increase in the particle number concentration corresponded to a decrease in the cloud droplet size as expected for the first indirect or Twomey effect (Twomey, 1977). Future data analysis will be done to explore relationships between the aerosol number concentration and size, cloud droplet number concentration and size, and liquid water content for clouds at different altitudes.
The initial results described here indicate that the FVR-55 UAS with clear- and cloudy-sky payloads on board offers a unique platform for observations relevant to aerosol direct and indirect radiative forcing. This observing platform is deployable at sea with a lower cost and greater flight frequency than a crewed aircraft. Potential applications of this technology extend beyond aerosol–cloud observations to marine mammal assessments, harmful algal blooms, and radiative impacts from forest fires.
Next steps include upgrading to the larger L3Harris Fixed Wing VTOL Rotator, the FVR-90. The clear- and cloudy-sky payloads will be integrated into FVR-90 nose cones, which will allow for the addition of instruments and longer flight endurance. The planned added instruments include upward- and downward-looking pyranometers to assess direct connections between the particle number and concentration, cloud droplet concentration and size, and radiation. In addition, instrumentation will be added to both payloads for the measurement of particle number size distributions from 5 nm to 3 µm. Although larger, the FVR-90 is operable from a ship, thereby fulfilling the need of aerosol, cloud, and radiation measurements in the marine atmosphere.
Flight data are publicly available at https://data.pmel.noaa.gov/pmel/erddap/search/index.html?searchFor=Tillamook2022 (NOAA PMEL, 2024).
PKQ and TSB designed the experiments. DJC and JEJ built and operated the payloads. LMU analyzed the chemical data. PKQ prepared the manuscript with contributions from all co-authors.
The contact author has declared that none of the authors has any competing interests.
Publisher's note: Copernicus Publications remains neutral with regard to jurisdictional claims made in the text, published maps, institutional affiliations, or any other geographical representation in this paper. While Copernicus Publications makes every effort to include appropriate place names, the final responsibility lies with the authors.
We thank Aaron Farber and the entire L3Harris Latitude Engineering team for developing, fabricating, and flying the FVR-55. We thank the caption and crew of the TowBoatU.S. Richard L. Becker and Chuck Bagnato and Eric Waters from the Tillamook UAS Test Range for their contributions toward successful flights. We thank Alexander Smirnov of the NASA Goddard Space Flight Center (GSFC) for the Microtops calibration, processing, and data quality assurance. We also thank the NOAA Office of Marine and Aviation Operations (OMAO) UAS Division for logistical support. This is PMEL contribution no. 5537.
This research has been supported by NOAA's Earth Radiation Budget (ERB) Initiative and Office of Marine and Aviation Operations (OMAO).
This paper was edited by Hang Su and reviewed by two anonymous referees.
Anderson, T. L., Covert, D. S., Wheeler, J. D., Harris, J. M., Perry, K. D., Trost, B. E., Jaffe, D. J., and Ogren, J.: Aerosol backscatter fraction and single scattering albedo: Measured values and uncertainties at a coastal station in the Pacific Northwest, J. Geophys. Res.-Atmos., 104, 26793–76807, 1999.
Aurell, J., Mitchell, W., Chirayath, V., Jonsson, J., Tabor, D., and Gullett, B.: Field determination of multipollutant, open area combustion source emission factors with a hexacopter unmanned aerial vehicle, Atmos. Environ., 166, 433–440, 2017.
Bates, T. S., Coffman, D. J., Covert, D. S., and Quinn, P. K.: Regional marine boundary layer aerosol size distributions in the Indian, Atlantic and Pacific Oceans: A comparison of INDOEX measurements with ACE-1 and ACE-2, and Aerosols99, J. Geophys. Res.-Atmos., 107, 8026, https://doi.org/10.1029/2001JD001174, 2002.
Bates, T. S., Quinn, P. K., Johnson, J. E., Corless, A., Brechtel, F. J., Stalin, S. E., Meinig, C., and Burkhart, J. F.: Measurements of atmospheric aerosol vertical distributions above Svalbard, Norway, using unmanned aerial systems (UAS), Atmos. Meas. Tech., 6, 2115–2120, https://doi.org/10.5194/amt-6-2115-2013, 2013.
Bond, T. C., Anderson, T. L., and Campbell, D.: Calibration and intercomparison of filter-based measurements of visible light absorption by aerosols, Aerosol Sci. Tech., 30, 582–600, 1999.
Brady, J. M., Stokes, M. D., Bonnardel, J., and Bertram, T. H.: Characterization of a Quadrotor Unmanned Aircraft System for Aerosol-Particle-Concentration Measurements, Environ. Sci. Technol., 50, 1376–1383, 2016.
Chilinski, M. T., Markowicz, K. M., and Markowicz, J.: Observation of vertical variability of black carbon concentration in lower troposphere on campaigns in Poland, Atmos. Environ., 137, 155–170, 2016.
Corrigan, C. E., Roberts, G. C., Ramana, M. V., Kim, D., and Ramanathan, V.: Capturing vertical profiles of aerosols and black carbon over the Indian Ocean using autonomous unmanned aerial vehicles, Atmos. Chem. Phys., 8, 737–747, https://doi.org/10.5194/acp-8-737-2008, 2008.
Gao, R. S., Telg, H., McLaughlin, R., Ciciora, S. J., Watts, L., Richardson, M. S., Schwarz, J. P., Perring, A. E., Thornberry, D. T., Rollins, A. W., Markovic, M. Z., Bates, T. S., Johnson, J. E., and Fahey, D. W.: A Light-Weight, High-Sensitivity Particle Spectrometer for PM2.5 Aerosol Measurements, Aerosol Sci. Tech., 50, 88–99, 2016.
Haywood, J. and Ramaswamy, V.: Global sensitivity studies of the direct radiative forcing due to anthropogenic sulfate and black carbon aerosols, J. Geophys. Res.-Atmos., 103, 6043–6058, 1998.
IPCC: Climate Change 2021: The Physical Science Basis. Contribution of Working Group I to the Sixth Assessment Report of the Intergovernmental Panel on Climate Change, edited by: Masson-Delmotte, V., Zhai, P., Pirani, A., Connors, S. L., Péan, C., Berger, S., Caud, N., Chen, Y., Goldfarb, L., Gomis, M. I., Huang, M., Leitzell, K., Lonnoy, E., Matthews, J. B. R., Maycock, T. K., Waterfield, T., Yelekçi, O., Yu, R., and Zhou, B., Cambridge University Press, Cambridge, United Kingdom and New York, NY, USA, 2391 pp., https://doi.org/10.1017/9781009157896, 2021.
Li, J., Carlson, B. E., Yung, Y. L., Lv, D., Hansen, J., Penner, J., Liao, H., Ramaswamy, V., Kahn, R., Zhang, P., Dubovik, O., Ding, A., Lacis, A. A., Zhang, L., and Dong, Y.: Scattering and absorbing aerosols in the climate system, Nat. Rev. Earth Environ., 3, 363–379, 2022.
Lohmann, U. and Feichter, J.: Global indirect aerosol effects: a review, Atmos. Chem. Phys., 5, 715–737, https://doi.org/10.5194/acp-5-715-2005, 2005.
Murphy, D. M., Telg, H., Eck, T. F., Rodriguez, J., Stalin, S. E., and Bates, T. S.: A miniature scanning sun photometer for vertical profiles and mobile platforms, Aerosol Sci. Tech., 50, 11–16, https://doi.org/10.1080/02786826.2015.1121200, 2016.
NOAA PMEL: Tillamook 2022, PMEL Atmospheric Chemistry Tillamook UAS Data, NOAA PMEL [data set], https://data.pmel.noaa.gov/pmel/erddap/search/index.html?searchFor=Tillamook2022 (last access: 29 April 2024), 2024.
Quinn, P. K., Coffman, D. J., Bates, T. S., Miller, T. L., Johnson, J. E., Welton, E. J., Neusüß, C., Miller, M., and Sheridan, P. J.: Aerosol optical properties during INDOEX 1999: Means, variability, and controlling factors, J. Geophys. Res.-Atmos., 107, 8020, https://doi.org/10.1029/2000JD000037, 2002.
Quinn, P. K., Thompson, E. J., Coffman, D. J., Baidar, S., Bariteau, L., Bates, T. S., Bigorre, S., Brewer, A., de Boer, G., de Szoeke, S. P., Drushka, K., Foltz, G. R., Intrieri, J., Iyer, S., Fairall, C. W., Gaston, C. J., Jansen, F., Johnson, J. E., Krüger, O. O., Marchbanks, R. D., Moran, K. P., Noone, D., Pezoa, S., Pincus, R., Plueddemann, A. J., Pöhlker, M. L., Pöschl, U., Quinones Melendez, E., Royer, H. M., Szczodrak, M., Thomson, J., Upchurch, L. M., Zhang, C., Zhang, D., and Zuidema, P.: Measurements from the RV Ronald H. Brown and related platforms as part of the Atlantic Tradewind Ocean-Atmosphere Mesoscale Interaction Campaign (ATOMIC), Earth Syst. Sci. Data, 13, 1759–1790, https://doi.org/10.5194/essd-13-1759-2021, 2021.
Rosenfeld, D., Zhu, Y., Wang, M., Zheng, Y., Goren, T., and Yu, S.: Aerosol-driven droplet concentrations dominate coverage and water of low-level clouds, Science, 363, 26793–26807, https://doi.org/10.1126/science.aav0566, 2019.
Russell, P. B., Hobbs, P. V., and Stowe, L. L.: Aerosol properties and radiative effects in the United States East Coast haze plume: An overview of the Tropospheric Aerosol Radiative Forcing Observational Experiment (TARFOX), J. Geophys. Res.-Atmos., 104, 2213–2222, 1999.
Takemura, T., Nakajima, T., Dubovik, O., Holben, B. N., and Kinne, S.: Single-scattering albedo and radiative forcing of various aerosol species with a global three-dimensional model, J. Climate, 15, 333–352, 2002.
Telg, H., Murphy, D. M., Bates, T. S., Johnson, J. E., Quinn, P. K., Giardi, F., and Gao, R. S.: A practical set of miniaturized instruments for vertical profiling of aerosol physical properties, Aerosol Sci. Tech., 51, 715–723, 2017.
Twomey, S.: The influence of pollution on the shortwave albedo of clouds, J. Atmos. Sci., 34, 1149–1152, 1977.
Yoon, S.-C. and Kim, J.: Influences of relative humidity on aerosol optical properties and aerosol radiative forcing during ACE-Asia, Atmos. Environ., 40, 4328–4338, 2006.
Zhang, Y., Forrister, H., Liu, J., Dibb, J., Anderson, B., Schwarz, J., Perring, A. E., Jimenez, J., Campuzano-Jost, P., Wang, Y., Nenes, A., and Weber, R. J.: Top-of-atmosphere radiative forcing affected by brown carbon in the upper troposphere, Nat. Geosci., 10, 486–489, 2017.