the Creative Commons Attribution 4.0 License.
the Creative Commons Attribution 4.0 License.
In-flight characterization of a compact airborne quantum cascade laser absorption spectrometer
Lenard Lukas Röder
Uwe Parchatka
Rainer Königstedt
Daniel Crowley
Frank Kunz
Ralf Wittkowski
Jos Lelieveld
Horst Fischer
Here, we report on the development of a new quantum cascade laser infrared absorption spectroscopy (QLAS) instrument, the Airborne Tropospheric Tracer In-situ Laser Absorption spectrometer (ATTILA), for atmospheric trace-gas measurements on board of the German High-Altitude Long-range Observatory (HALO) aircraft. Its small and light design makes it suitable for airborne measurements up to approximately 150 hPa of ambient pressure (13–14 km). The dual laser instrument can measure several trace gases simultaneously in two 36.4 m path astigmatic Herriott cells with a data acquisition frequency of 1 Hz. We describe the measurement method and the data acquisition of ATTILA and its in-flight performance by focusing on potential sources of influences on the signal, which we investigated with a dedicated test flight during which the instrument sampled from a constant source. We show that linear critical influences associated with challenging movement patterns can be corrected afterwards, while nonlinear limitations can be minimized by appropriate calibration frequencies and integrated time intervals. During the recent aircraft campaign CAFE Brazil (Chemistry of the Atmosphere Field Experiment in Brazil) from December 2022 to January 2023, carbon monoxide (CO) measurements from ATTILA show a good agreement of a R2 of 0.89 with simultaneous CO measurements from an established IR spectrometer for airborne measurements, the TRacer In Situ TDLAS (tunable diode laser absorption spectroscopy) for Atmospheric Research (TRISTAR), at a 10 s time resolution. First dynamical characteristics and tracer distributions of CO and methane (CH4) over the Amazon rainforest can be identified with ATTILA measurements with a total measurement uncertainty of 10.1 % and 17.5 % for calibration gas mixing ratios of 153 and 1990 ppbv and a data accuracy of 0.3 % and 5.5 % for a data acquisition frequency of 1 Hz for CO and CH4, respectively.
- Article
(5627 KB) - Full-text XML
-
Supplement
(4032 KB) - BibTeX
- EndNote
Laser spectroscopic measurement techniques have been developed considerably in the past 2 decades, improving their resolution, accuracy, and stability for trace-gas measurements in the atmosphere (Werle, 1998). These advantages, and many more, make laser spectroscopy a highly efficient technique for measuring trace gases compared to classic chemical and chromatographic measurement techniques (Li et al., 2013). Tunable diode laser absorption spectroscopy (TDLAS) and the more efficient quantum cascade laser infrared absorption spectroscopy (QLAS) have been proven to be reliable measurement techniques in numerous publications (Faist et al., 1994; Kormann et al., 2002; Fried and Richter, 2006; McManus et al., 2010; Tuzson et al., 2020; Pal and Pradhan, 2021, and citations within). Especially for airborne measurements, a lightweight and compact design that can withstand the extremely difficult measurement conditions caused by abrupt changes in acceleration, direction, and height is very important (Richter et al., 2015; Catoire et al., 2017). Through the work of Röder et al. (2024) we also know that on airborne-platform instrumental characteristics can behave differently compared to the laboratory. QLAS and TDLAS trace-gas measurements have been proven to be very valuable for detecting and understanding small-scale atmospheric chemistry, radiative effects, transport processes, and their overall impact on the Earth's climate (Fried et al., 2008). A reliable spectrometer for airborne measurements is the TRacer In Situ TDLAS for Atmospheric Research (TRISTAR), which performed successfully in a large number of field campaigns and research flights measuring tropospheric and stratospheric carbon monoxide (CO), carbon dioxide (CO2), methane (CH4), nitrous oxide (N2O), and formaldehyde (HCHO) (Wienhold et al., 1998; Schiller et al., 2008; Tadic et al., 2017; Tomsche et al., 2019). Since the work of Tomsche et al. (2019), TRISTAR has been further improved, which is described in the study of Röder et al. (2024).
Airborne measurements can generate high-resolution and small-scale data even in remote locations, for example, in the tropics, where high cloud coverage complicates satellite-based measurements (Reiche et al., 2016, and citations within). Nevertheless, besides these advantages, experimental challenges such as vibrations, weight, and size limitations, pressure and temperature fluctuations during research flights, and complicated measurement modes for operation have prompted further investigations for suitable instrumentation (Li et al., 2013).
In the following, we present the Airborne Tropospheric Tracer In-situ Laser Absorption spectrometer, in short ATTILA, which has been specifically developed for airborne trace-gas measurements on board of the High-Altitude Long-range Observatory (HALO) aircraft. It is equipped with two room-temperature quantum cascade lasers that measure CO, CH4, and N2O in a two-cell system, which is described in more detail in Sect. 2. ATTILA conducted measurements during the CAFE Brazil (Chemistry of the Atmosphere Field Experiment in Brazil) campaign in December 2022 and January 2023, which took place above the Amazon rainforest region. In the scope of the campaign, a test flight was performed to investigate instrument behavior in the face of extreme airborne challenges in more detail. The doubling of simultaneous trace-gas measurements of the well-known TRISTAR spectrometer and the newly developed spectrometer ATTILA allows a comparison and quantification of the data quality, as well as some first insights into the atmospheric composition and trace-gas distribution over the Amazon rainforest.
ATTILA is a custom-built two-cell mid-infrared room-temperature quantum cascade laser absorption spectrometer constructed in 2019 at the Max Planck Institute for Chemistry to measure trace gases in the atmosphere on board of the research aircraft HALO. It is designed to further improve airborne measurements considering the limitations of weight and size for small aircraft. ATTILA is mounted in a 19 in. (48.26 cm) box and is small in size (48 cm × 27 cm × 55 cm) with a total weight of only 20.6 kg (excluding the pump). It holds two optical frames mounted in parallel inside of it. Figure 1 shows a picture of the instrument setup inside the box. The instrument is layered into two sections. On the top layer, the two optical frames, the flow systems, and the tubing are mounted. In the bottom layer the electronic devices are located. Those two layers are separated by a 4.5 mm thick aluminum plate and are ventilated by four fans located on the front of the instrument, which is in the picture on the right-hand side.
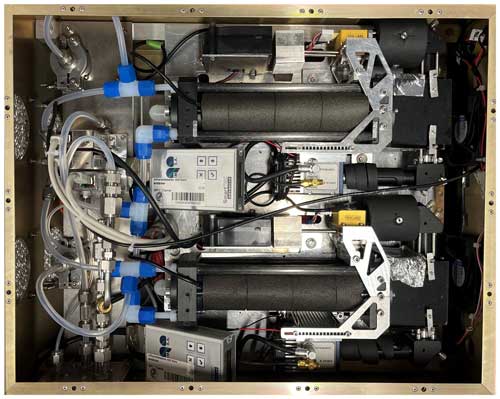
Figure 1Picture of the top view of the measurement setup of ATTILA with the front of the instrument directed towards the right side. In the upper part of the picture the optical unit measuring CH4 and N2O with the laser HHL-446 is located, and in the lower part, CO and N2O can be measured with the HHL-442 laser.
In the following the individual parts of the ATTILA instrument are described in more detail.
2.1 Optical and electrical setup
Figure 2 shows an overview of the schematic setup of the IR spectrometer. The two optical frames each consist of an astigmatic Herriott cell (HC; Herriott and Schulte, 1965; McManus et al., 1995), a quantum cascade laser (QCL), and a mid-infrared detector, as well as mirrors and lenses directing the laser beam in the optical section. Multipass absorption cells are often used to provide long optical pathways in an optimized compact volume (Zahniser et al., 1995). The total airflow of 0.2 L min−1 is controlled by two compound mass flow controllers (MFCs) (Bronkhorst, IQ+FLOW) separating the gas flow into the two cells with 0.1 L min−1 each. Furthermore, for calibration measurements another MFC leads 0.3 L min−1 of an external gas bottle into the ambient tube, where 0.2 L min−1 is separated into the two HCs again and 0.1 L min−1 prevents ambient air influence.
The two QCLs (Alpes Lasers, HHL-series, Lausanne, Switzerland) can measure CO (2190.0175 cm−1; Li et al., 2015) and N2O (2190.3498 cm−1; Toth, 2004) in one cell (Li et al., 2013) and CH4 (1256.6 cm−1; Ba et al., 2013) and N2O (1255.42 cm−1; Toth, 2004) in the second cell. The N2O lines are mainly used to track the line center position of the spectra throughout atmospheric measurements due to its long lifetimes in the troposphere with only a small vertical gradient (Crutzen and Ehhalt, 1977). Both lasers are functional for laser temperatures up to 60 °C but are cooled down to 26.5 °C for operation. Each laser is controlled by a laser controller (Wavelength Electronics, WTC3243 and WTC3293), which adjusts the current and temperature of the laser. An integrated Peltier junction and an NTC temperature sensor (model 10K4CG) together with the above-mentioned fans ensure temperature stability. As the two optical frames are identical in their setup, the following description will focus only on one frame, as shown schematically in Fig. 3.
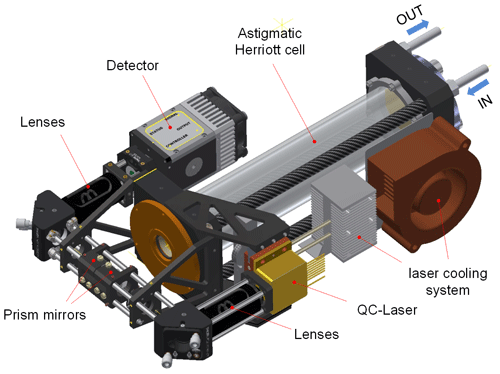
Figure 3Sketch of the full optical setup for one cell including the astigmatic Herriott cell, the laser, and detector as well as the directing mirrors.
First, the laser beam passes two anti-reflection-coated plano-convex lenses to compensate for the divergence and focus it onto an adjustable plane mirror with an elliptical shape (Thorlabs, 12.7 mm (PFE05-P01)), which projects the laser beam on a right-angle prism mirror (Thorlabs, 12.5 mm (MRA12-P01)). Here, the laser beam is guided through an entrance window (Edmund Optics, TECHSPEC CaF2 20 mm) and a coupling hole of the front mirror onto the left side of the back mirror of the two opposing astigmatic mirrors (Aerodyne, AMAC-36) of the HC. The correct adjustment of the HC is done with an optical visible adjustment laser at 635 nm (Thorlabs, HLS635) to see and achieve the specifically needed Lissajous pattern (Zahniser et al., 1995) on the two mirrors. This pattern is formed by the different horizontal and vertical radii of the curvature of Rx = 246.0 mm and Ry = 269.4 mm, respectively, of the two concave mirrors with diameters of 3.8 cm. They need to be rotated exactly by 62.55° to each other, considering their orientation, with the focus of the first entering beam in the middle of the cell. This alignment results in a multipass state where the laser beam is reflected 182 times back and forth which covers a distance of 36.4 m inside the compact HC with a length of 199.91 mm. With increasing path length, the signal-to-noise ratio (SNR) increases until the loss of the many reflections becomes important (Werle and Slemr, 1991). With a volume of 250 mL, the astigmatic HC provides an effective SNR compared to other HC types (Zahniser et al., 1995). Furthermore, between 3 to 10 µm the mirrors for the CO–N2O cell are coated with silver, which provides a reflectivity of 99.2 % with a minimum of 99 % (Tafelmaier, Dünnschicht-Technik GmbH, Germany). For the same range but with a golden coating, the mirrors of the CH4–N2O cell have a reflectivity of around 99 % (Tafelmaier, Dünnschicht-Technik GmbH, Germany). One potential limitation of the HC can be optical interference fringes produced by scattering in the cell which degrade the effective SNR and can disturb the molecular absorption lines through a similar free spectral range. More features of the HC can be found in McManus et al. (1995) and Zahniser et al. (1995).
When the laser beam passes the HC, it gets partly absorbed by the trace gas of interest until it exits the cell through the entrance hole again. Through two valves above the back mirror side of the HC the sampled air inside the cell can be exchanged. The input valve which is controlled by the above-mentioned MFCs brings either ambient or calibration gas into the cell on the front mirror side. Behind the output valve a pump (VACUUBRAND, diaphragm pump – MD 1 VARIO-SP) is attached to reduce and keep the pressure inside the cells at 50 hPa continuously, which is detected by a pressure sensor (Dekont, VCC200) connected to the input valve. Furthermore, a PT-100 temperature sensor is mounted on top of the HC, detecting the temperature of the cell.
After exiting the HC through the front mirror hole the laser beam is directed with a prism and an adjustable elliptical mirror through a single lens and focused onto a room-temperature infrared-sensitive photovoltaic semiconductor detector (VIGO System S.A., PIP-DC-20M-F-M4). The beam slightly overshoots the detector entrance to compensate for potential beam misalignment due to vibrations.
For improved stability of the signal during vibrations and movements the optical frame is equipped with bracket reinforcements. Furthermore, several black isolating covers on top of the laser pathways reduce temperature fluctuations and laser scattering.
2.2 Signal processing and analysis software
The characteristics of the signal are processed, controlled, and read out by a single-board controller (National Instruments, CompactRIO sbRIO-9627). The controller includes a real-time processor, a field-programmable gate array (FPGA), which modulates the frequency on top of a voltage ramp including an offset to scan the targeted spectrum range. This is done by using the wavelength modulation spectroscopy (WMS) technique, described in Fried and Richter (2006). The triangular ramp provides two spectra, an upwards- and downwards-directed spectrum of the measured signal. With a sine wave modulation frequency of 17.86 kHz, a ramp is generated with 4096 discrete steps and scanned within 28.7 ms in each direction. Therefore, the frequency of the triangular wave is 17.4 Hz. This provides a scanning frequency of approx. 35 000 samples per second for each tracer of interest, after which the ramp is reduced by a quarter resulting in a 1024-point spectrum. The modulation depths for CO and CH4 have been chosen empirically to maximize the signal-to-noise ratio. This digital command is converted into an analogue signal via a digital–analog converter (DAC) and transferred through an analog output to the laser controller. Then, the laser controller can adjust the temperature and current of the infrared laser to perform the wavelength scan of the signal to generate an absorption spectrum when passing the HC. After detecting the absorbed signal, a pre-amplifier forwards the amplified signal through an analog input back into the sbRIO-9627, where the signal gets digitized by an analog–digital converter (ADC) again. Here, a digital lock-in amplifier demodulates and phase shifts the signal with the doubled initial modulation frequency (2f) to match the phase of the measured signal. Both the modulation and demodulation are performed by a LabVIEW (Laboratory Virtual Instrument Engineering Workbench)-controlled real-time FPGA system that is free of any jitter caused by software processes. The 2f harmonic signal provides a nearly constant baseline in the absorption-free region and a maximum at the center of the line (Fried and Richter, 2006). This ensures a minimization of electronic noise and an independency of the baseline of the spectra. Therefore, background calibrations and background subtraction are not necessary. Only a source with constant and known gas concentrations is needed to calculate the final gas mixing ratios. After the lock-in amplifier, a low-pass filter generates the DC signal with 1024 channels and an absorption spectrum which can be visualized in the corresponding software LabVIEW. The signal processing methodology and setup have a resolution time of 1 Hz with a duty cycle of 100 % for each tracer of interest, thereby facilitating the real-time visualization of precise concentrations of trace gases present in the sampled air. Additionally, a linear regression scheme calculates real concentration values, cs, with the slope of the correlation between the fit of the 2f absorption spectrum Ss and the calibration spectrum Scal multiplied by the known calibration gas concentration ccal as follows (Fried and Richter, 2006):
A huge advantage of the processing is the flexibility of the modulation and fitting settings. Every parameter can be digitally adjusted to achieve the best result. The current settings have been chosen after intensive laboratory test runs and have proven themselves during the campaign.
In addition to the online signal processing, a specialized analysis software was developed using IGOR Pro (WaveMetrics) for comprehensive postprocessing of the raw spectra. The software features automated filtering, exact positioning of the absorption lines, and background subtraction, if necessary, while also facilitating a precise linear fit to a calibration spectrum. Moreover, linear cell pressure variances as well as nonlinear Lambert–Beer effects can be corrected and overall precise mixing ratios of a species of interest can be determined. Furthermore, 1D and 2D visualization of the spectra with time can be used to recapitulate and correct for drift behavior or abrupt changes in the background induced by, e.g., temperature and pressure changes as well as the movements of the aircraft (Schiller et al., 2008). Further analysis and noise reduction opportunities have been discussed in Röder and Fischer (2022) and citations within.
2.3 Instrument setup on board of HALO
ATTILA is developed for aircraft measurements, specifically on board of the research aircraft HALO. During field campaigns, it is mounted in a 19 in. (48.26 cm) measurement frame rack together with the Nitrogen Oxide Analyzer for HALO (NOAH), described by Tadic et al. (2020) and Nussbaumer et al. (2021). Both instruments sample continuously over a 6.28 m long bypass from the top of the aircraft through a forward-facing stainless steel trace-gas inlet (TGI). The Teflon-coated tubing channels the ambient air through in. (1.27 cm) PFA (perfluoroalkoxy alkane) tubes until it exits the aircraft again through a second TGI. After 4.57 m of this tubing, 0.2 L min−1 is led through a 1.27 m long in. (0.635 cm) tube into the ATTILA instrument, located 0.16 m before the nitrogen oxide analyzer samples 3.0 L min−1 from the bypass. Figure 4 shows a sketch of the gas flow. As the ambient air enters the spectrometer, the air is separated into the two HCs through two MFCs as described above.
For in-flight calibrations, a 2 L EMS gas bottle filled with compressed air is used. It is stored below the rack during the flight. The exact concentrations of the compressed air are characterized with a primary standardized gas bottle beforehand. During the calibration mode, one MFC leads the calibration gas with a flow of approximately 0.3 L min−1 into the other two MFCs, which separate the flow into the cells with 0.1 L min−1 each. Due to this overflow of 0.1 L min−1 between calibration and ambient measurements, the calibration gas steams slightly into the ambient and exhaust lines which prevents these lines from influencing the measurements. A critical orifice is built inside the connecting tube towards the exhaust so that the latter does not influence ambient measurements.
Within the CAFE Brazil campaign from November 2022 to January 2023, 22 flights have been performed with HALO, including 2 test flights during the preparation phase at the German Aerospace Center (DLR) in Oberpfaffenhofen, Germany; 4 transit flights with a stop-over at Sal, Cabo Verde; and 16 research flights over the Amazon rainforest based in Manaus, Brazil. The first test flight was used to investigate the in-flight behavior of ATTILA. Therefore, continuous calibration gas measurements were performed during this test flight on 22 November 2022 in the preparation phase of the CAFE Brazil campaign. This test flight was specifically planned to investigate the behavior of individual instruments in response to in-flight environmental changes like temperature and pressure, as well as extreme aircraft movements, and has already been used for instrument characterization in the studies of Hamryszczak et al. (2023) and Röder et al. (2024). Hence, various flight levels and different vertical velocities and accelerations, as well as the variation in yaw, pitch, and roll angles, have been performed. At 10:30 UTC the aircraft departed. Before, the instrument was running for approx. 2 h in the aircraft to warm up. The final approach of HALO for that test flight was at 14:23 UTC. Several instrument flight parameters are shown in Figs. 5 and 6 and are discussed to determine the systematic influences on the signal.
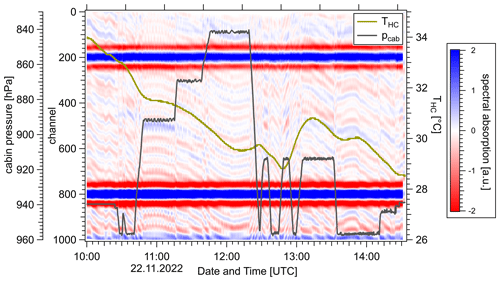
Figure 5The 2D spectrum of the upwards-directed ramp signal of the CO–N2O laser showing the channels versus the time of the first test flight on 22 November 2022 with the N2O absorption line in the bottom (channel 800) and the CO absorption line displayed in the top (channel 200) of the graph. The color scale is adjusted to values close to zero to show a stronger contrast of the background signal. Blue colors indicate positive values, hence absorption of the signal, and red colors negative values of the 2f spectrum. The yellow line shows the temperature on top of the HC during the whole flight. In grey, the cabin pressure is displayed, measured at the ATTILA rack. The HALO aircraft was in the air from 10:30–14:23 UTC.
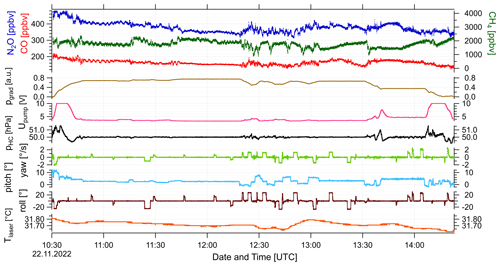
Figure 6Compilation of instrument and flight parameters over time from the test flight on 22 November 2022. Shown are the laser temperature of the CO–N2O laser (Tlaser, orange line), the voltage of the pump (Upump, pink line), the mean HC pressure calculated over both cells (pHC, black line), and the roll (dark red line) and pitch (light blue) angles as well as the yaw angle rate per second (light green) of the HALO aircraft during that flight. As the ocher line the pressure gradient calculated as the ratio of the ambient pressure and the cabin pressure as is displayed. Note that the tracer concentrations of CO in red, N2O in blue, and CH4 in green in the top panel of the graph are not yet corrected by pressure and Lambert–Beer. A linear calibration fit has been used from only one calibration before the flight. Throughout the whole flight ATTILA was running on calibration mode sampling only from a gas bottle with 161 ± 9 ppbv of CO, 358 ± 22 ppbv of N2O, and 2025 ± 7 ppbv of CH4, including the accuracy of the bottle.
Starting with Fig. 5, the 2D 2f raw spectra with the absorption lines of CO and N2O are shown in blue in the channels 200 and 800, respectively, over time. Additionally, the temperature of the HC THC and the cabin pressure pcab of the aircraft measured at the rack are added as yellow and grey lines, respectively. Please note that the spectrum in Fig. 5 is already processed with a pre-filter and the absorption lines are locked and shifted according to their line maximum. The background signal has not been shifted. By focusing on the background signal between channels 300 and 700, thus between the absorption lines of CO and N2O, interference on the signal can be addressed. The long-term drift behavior of the spectra correlates well with the change in the temperature inside the HC. THC changes during the test flight by about 6 °C peak to peak. These changes are influenced by the cabin temperature which fluctuates in the same range even with the air conditioning control system on board of the HALO aircraft. The postprocessing of the signal includes a shift in the absorption lines by locking the signal on its line maximum. With this, the drift behavior of the signal can be corrected, which can be seen in Fig. 5. Furthermore, temperature changes have a small impact on the laser temperature and its operating point and therefore the intensity of the signal. Looking at the laser temperature of the CO–N2O laser in Fig. 6 in the lowermost panel, the temperature change correlates well with the one from THC. A variation in temperature further influences the optical setup by expansion of the material to induce etalon structures through interference. These interference fringes can influence the absorption signal amplitude via nonlinear constructive and destructive interference, which are much harder to identify. Slow changes in the fringe structure, such as temperature changes mentioned above, can be approximated linearly and thus be counteracted by frequent calibrations.
Moreover, a change in pressure can have an influence on the signal. There are two influences known which lead to different assumptions: first a change in ambient pressure and second a change in cabin pressure. First, when the ambient pressure changes, the pumping has to adjust to the new pressure gradient to keep the flow stable. This is done by varying the voltage of the pump from approx. 4 V up to its maximum of 10 V. The pump voltage, the HC pressure, and the pressure gradient calculated from the ratio of the ambient to the cabin pressure are shown in Fig. 6. Especially for fast altitude changes during, e.g., departure or landing, these disturbances are visible in the cell pressure, spectra, and concentration. At constant flight levels and slow altitude changes, the pump can easily regulate the cell pressure to keep it constant at 50 hPa. Cell pressure instabilities are linear and hence can be corrected in the data processing.
Secondly, Fig. 5 shows that the cabin pressure of the aircraft fluctuates even in constant flight levels of about 4 hPa. This influences the spectra and hence the measured concentration by inducing sine-structured short-term fluctuations. This can be seen especially between 10:48 and 11:15 UTC. Looking at the three different flight levels between 10:48 and 12:18 UTC, the cabin pressure fluctuations do not change but their influence on the signal does, as can be seen in the mixing ratio in Fig. 6. Hence, we see that pressure instability has an effect on the interference fringes. This effect is not linear and still needs to be investigated.
In the first half of the test flight the aircraft mostly flies straight, which can be seen from the roll and pitch angles and the yaw angle rate displayed in Fig. 6. Small aircraft movements only have minor influences on the signal. In the second half of the flight from 12:30 UTC onwards extreme aircraft movements involving abrupt changes to varying roll, pitch, and yaw angles are carried out. These aircraft movements create disturbances in the signal through, e.g., centrifugal forces which can have an effect on the optical setup and hence the signal. The mixing ratio in Fig. 6 shows a strong impact of aircraft movements on the signal. However, these extreme aircraft movements are, if possible, avoided during measurement flights to provide as stable conditions as possible for airborne measurements. Nevertheless, another important factor causing small instrumental movements might be atmospheric turbulence, which is not shown here.
In general, influences on the signal are mostly induced by temperature and pressure changes and aircraft movements (Fried and Richter, 2006), which create linear and nonlinear effects, as described above. As it is mostly a combination of variables that influence the signal, disentangling these effects of individual parameters is difficult. Nevertheless, temperature drift behavior, pressure effects, and short-term disturbances can be corrected by frequent calibration measurements and averaging (Richter et al., 2015). To investigate the appropriate calibration frequency, different calibration intervals have been tried out in the postprocessing of the test flight, assuming that parts of the calibration gas measurements are calibrations and others are ambient measurements. The tracer concentrations shown in Fig. 6 are not yet drift-corrected. Their mean values are 163 ± 14, 378 ± 30, and 1768 ± 235 ppbv for CO, N2O, and CH4, respectively.
For the optimal drift correction different calibration intervals have been tried out in the postprocessing of the test flight data. The drift-corrected mixing ratios for different calibration intervals for CO, N2O, and CH4 can be found in the Supplement in Figs. S1, S2, and S3, respectively. The higher the interval, the better drift influences can be corrected, but fewer ambient measurements are done and more calibration gas is needed. The drift correction clearly depends on the positioning of the calibrations and the interference at that time. A measure for this is the reproducibility R. For this, a mean value of each calibration measurement is calculated and investigated for their accuracy and shift over time. Low R indicates similar mean values of each calibration and hence small drift behavior. R varied from 0.71 % to 8.54 % for different calibration frequency scenarios from every 85 min to every 2 min. After drift correction, the relative statistical error of the calibrations provides the mean precision P, which is 2.63 ±0.47 % for all scenarios. For the choice of the appropriate calibration interval those different scenarios have been compared and an automated interval of 20 min was chosen as an optimal trade-off between drift counteraction, duty cycle, and calibration gas consumption. The duration of the calibrations are 60 s, where the first 15 s are not taken into account in the analysis to ensure sufficient flushing time of the cell. With 20 min of calibration frequency the mean values of the corrected mixing ratios are 160 ± 10, 357 ± 14, and 2029 ± 197 ppbv for CO, N2O, and CH4, respectively. Therefore, they are in the range of the standard errors of the calibration gas, which are for CO 161 ± 9 ppbv, for N2O 358 ± 22 ppbv, and for CH4 2025 ± 7 ppbv. This calibration setting was adopted for the rest of the campaign.
The long-established TRISTAR instrument (e.g., Wienhold et al., 1998; Schiller et al., 2008; Tadic et al., 2017; Tomsche et al., 2019) was deployed simultaneously to ATTILA within the CAFE Brazil campaign, measuring also CO and N2O. Both IR spectrometers operated throughout the whole campaign without any technical malfunctions. A comparison of these two IR spectrometers has been done to investigate the instrumental performance of the newly developed spectrometer. This is especially important for future planning, as ATTILA can take over CO measurements and TRISTAR could be modified to measure other trace gases like, e.g., formaldehyde due to its high stability and precision. Please note that the general measurement focus of the instrument is on CO, as the N2O absorption line is only used to track the spectra on its right position, especially at high altitudes where CO concentrations are markedly lower. The CH4 data will be shown in the next section.
The total in-flight measurement uncertainty MU over the whole campaign is estimated by using R and P, described in Sect. 3 and calculated as follows:
Another measure for data comparison is the accuracy Acc, representing the standard error of the in-flight calibration gas. Acc of the secondary standard used as calibration gas during the flights is calculated via
including the reproducibility of the primary standard measurements RF, the standard deviation divided by the number of points of the secondary standard measurements, and the primary standard error over its mean content. The primary standard errors are given by the manufacturer (Luxfer Gas Cylinders Ltd., Colwick, Nottingham, England) as 0.36, 0.21, and 0.24 ppbv for CO, N2O, and CH4, respectively.
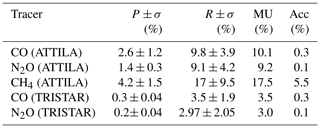
MU is in the lower percent range for both instruments, as shown in Table 1. In comparison to the performance of TRISTAR, ATTILA's MU is increased by a factor of 3. Acc is for all tracers in the per mille range, except for CH4 which is at 5.5 %.
Table 1Mean precision P, reproducibility R including their 1σ, and the total measurement uncertainty MU calculated using Eq. (2) for all research flights of the CAFE Brazil campaign for the ATTILA and TRISTAR spectrometers. The accuracy Acc of the secondary standard used as calibration gas during the flights is calculated using Eq. (3).
For the comparison, a time resolution adjustment has been made. As an example, a section of the research flight number 14 on 12 January 2023 is shown in Fig. 7 where extreme CO concentrations could be measured with both instruments, as the aircraft flew through several fresh biomass burning plumes at a low altitude in the boundary layer of about 760 m. In Fig. 7 two smaller plumes are displayed with high concentrations above 1000 ppbv. There is a delay of 5 s visible between the two instruments, which is due to the differences in their flow rate and cell volumes. TRISTAR has a flow rate of 3 L min−1 and hence exchanges the sampled air much faster than ATTILA. This time delay of 5 s has been corrected for further analysis of the ATTILA data. Another consequence of the time resolution difference is that TRISTAR measures higher concentrations in a short extreme event which ATTILA can only see smoothed out with its flow of 0.2 L min−1. High-frequency features below 5 s cannot be measured with ATTILA. This, specifically, shows the first peak at 16:47:45 UTC of the biomass burning event displayed in Fig. 7. Nevertheless, these flow limitations are only a few seconds, which is still a good time resolution for airborne measurements.
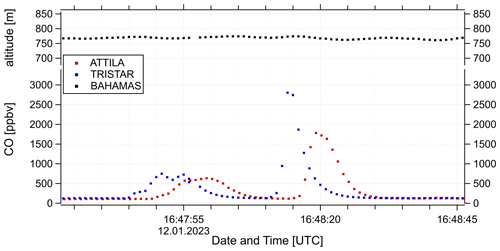
Figure 7Timeline of CO mixing ratios from ATTILA in red and TRISTAR in blue measured during flight number 14 on 12 January 2023. In black, the GPS altitude from the BAHAMAS instrument (DLR, Oberpfaffenhofen, Germany) during the flight is displayed. All data are at 1 Hz resolution. The CO measurements have been fully processed and corrected by drift, pressure change, and Lambert–Beer.
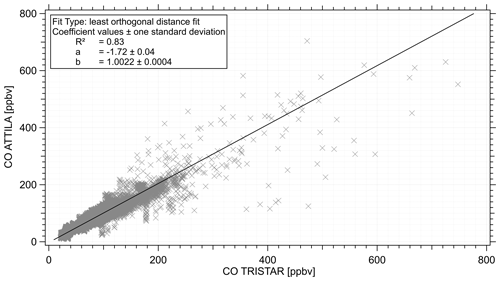
Figure 8Correlation of all CO ambient measurements from ATTILA on the y axis and from TRISTAR on the x axis over the whole CAFE Brazil campaign, excluding the two test flights. The data have been fully processed and corrected. A least orthogonal distance fit, displayed as a black line, has been performed, including the MU values presented in Table 1. Outliers are mostly related to extreme aircraft movements during takeoffs and landings.
In Fig. 8 the correlation of all CO measurements throughout the whole campaign from both IR spectrometers is displayed. Additionally, a least orthogonal distance fit has been performed, including their MUs (Table 1). The scale has been slightly adjusted to focus on typical atmospheric concentrations instead of extreme events. Except for some outliers, which can be related to extreme aircraft movements and changes during some takeoffs and landings, the 1 Hz measurements agree quite well with a slope of 1.0022 ± 0.0004 and a R2 of 0.83. The differences in the data sets are mainly due to their different instrumental noise. TRISTAR features a more robust design, a better insulation and temperature control through a heating plate, and a stabilized and more extensive optical system, and its operation can profit from many years of experience and further improvement of the spectrometer throughout numerous campaigns (Tomsche et al., 2019; Tadic et al., 2017; Schiller et al., 2008, and citations within). Therefore, fast atmospheric changes and unusual extreme events in the boundary layer with CO measurements higher than 600 ppbv can be better detected by the TRISTAR instrument. Nevertheless, an averaged time resolution of 10 s provides a R2 of 0.89 with a slope of 0.9811 ± 0.0003 and is an adequate time resolution eliminating nearly all the instrumental noise. The correlation of the 10 s averaged data is displayed in Fig. S4 in the Supplement.
In Fig. 9 the 1 Hz data have been binned into 500 m boxes from the whole campaign data set excluding the two test flights. In green and black the mean, median, and standard deviation of ATTILA and TRISTAR, respectively, are shown. A few assumptions can be made. First of all, below 1 km several extreme events have been measured due to anthropogenic emissions and biomass burning events. As explained above, due to TRISTAR's higher time resolution and flow, short-term changes in extreme mixing ratios can be detected better with TRISTAR, leading to a higher variation in the standard deviation near the surface compared to ATTILA CO measurements. Nevertheless, their mean values differ only by 7 ppbv. Furthermore, throughout the free troposphere above 2 km the instruments agree quite well in their mean values of differences up to maximum ±2 ppbv. Especially above 12 km the measurements are almost identical even with respect to their standard deviations and median values.
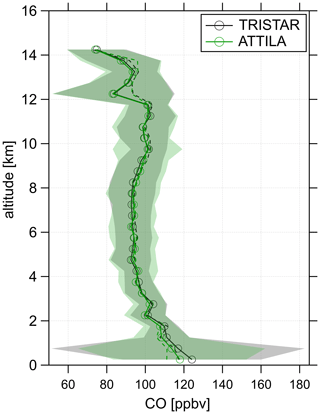
Figure 9Vertical profile of all CO measurements over the whole campaign, excluding the two test flights. Both profiles are binned in 500 m boxes measured by TRISTAR with black and ATTILA with green lines. Additionally, the medians are shown with dashed lines and the standard deviation of the measurements as shaded areas.
In conclusion, the ATTILA instrument is suitable for high-resolution measurements of atmospheric variations and can reliably detect atmospheric features during airborne measurements. In large part, due to its minimalist and robust design during airborne measurements, this instrument can be used for dynamical and chemical investigations of the atmosphere. Therefore, atmospheric spatial tracer distributions, vertical profiles, and qualitative indication of potential source and sink regions through chemical reactions can be investigated. For example, for flux measurements which require time resolutions smaller than 1 Hz and a high data quality (Nussbaumer et al., 2023), the ATTILA instrument still has to be improved.
With a base in Manaus, Brazil (3°6′ S, 60°1′ W), the CAFE Brazil aircraft campaign was carried out over the Amazon rainforest from December 2022 until the end of January 2023. Various instruments on board of the HALO aircraft measured about 50 different trace gases, radicals, and aerosol particle properties in 16 local flights over the Amazon rainforest region from a few meters above the forest up to about 15 km in altitude. In additional to the local research flights, four transfer flights with a stopover in Sal, Cabo Verde, and two test flights over Germany were carried out within the campaign. The main research focus lay on the investigation of oxidation processes and their control of new particle formation and particle growth over the rainforest region. Further objectives of the campaign were the investigation of the general distribution of the measured variables over the pristine forest as well as over regions influenced by anthropogenic activity and their transport through deep convection into the tropical tropopause layer (TTL) (Fueglistaler et al., 2009).
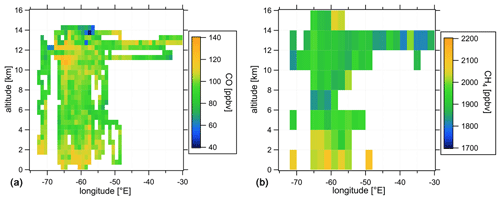
Figure 10Median of the meridional profiles of the CO (a) and CH4 (b) measurements of the CAFE Brazil campaign over the Amazon rainforest derived from ATTILA. The 1 Hz data are binned into a 1 ° × 0.5 km subset for CO and into a 2° × 2 km subset for CH4 due to differences in their MU values. Additionally, for methane the bins with less than 1000 data points have been removed for a better statistical representation.
In Fig. 10 meridional profiles of CO (left panel) and CH4 (right panel) measured by ATTILA over the Amazon rainforest from the CAFE Brazil campaign are shown. The bin size of those distributions was chosen according to the individual MUs of the trace-gas measurements presented in Table 1. Therefore, CO is binned into 1 ° × 0.5 km bins and CH4 into 2 ° × 2 km bins. All data are corrected by drift, cell pressure variations, and Lambert–Beer. The CH4 data are additionally corrected according to the water dilution effect, which is described in more detail in the study of Haracono et al. (2015).
Focusing on CO in the left panel of Fig. 10, we can see three regions of enhanced and two regions of lower CO concentrations. The enhanced values originate from anthropogenic emissions and biomass burning events which can be vertically transported by convection. Specifically, in the lower altitudes below approx. 3 km, in the boundary layer, mean values reach 140 ppbv. Mostly, these are located around 60° W, which indicates anthropogenic emissions of the city Manaus (3°6′ S, 60°1′ W) as well as extreme single biomass burning events, which have been captured around 4°5′ S, 62°5′ W. Those elevated concentrations are vertically transported from the boundary layer into the free troposphere through deep convection and could be probed in the outflow of those convective cells several times between 10 and 13 km mostly west of Manaus. During one research flight towards the east, another strong outflow event could be measured up to 14 km.
The lower concentrations are influenced by stratospheric air which gets transported and mixed downwards into the TTL. Two regions which are dominated by stronger stratospheric influence during the campaign are between 55 and 60° W above 13 km and around 69° W down to 12 km. That influence propagates quite deep into the free troposphere. This might be affected by gravity waves in the lee of the Andes but has not been investigated further in this study.
The mean concentration of CH4 over the whole meridional profile above the Amazon rainforest is 1932 ppbv. According to the NOAA database the monthly mean values for December 2022 and January 2023 are 1924.72 and 1922.16 ppbv, respectively (Lan et al., 2023). With an accuracy of 5.5 % (Table 1) for the CH4 data and taking into account that the NOAA mean value has been measured over the whole vertical atmospheric column above the remote marine surface, these values are in quite good agreement. Nevertheless, the vertical profile of CH4 also shows a different vertical distribution. Below 4 km the mean value is 2030 ppbv, and above it is 1907 ppbv. Hence, there might be a source of CH4 over the Amazon rainforest region. According to the global database from NOAA (Lan et al., 2023) there is a drastically increasing trend in atmospheric methane in the recent years. A modeling study by Zhang et al. (2023) using a wetland model, referring to the years 2000 to 2021, reports large increases in CH4 emissions since 2000 with the strongest increase in the years 2020 and 2021. Based on the satellite-borne NOAA database, Peng et al. (2022) suspected higher natural methane emissions, while anthropogenic emissions probably decreased over the COVID-19 lockdown. The positive feedback of natural methane emissions is suggested to be mostly from wetlands, as warming and more moisture through climate change can contribute to this effect. However, as the CAFE Brazil campaign generated a statistically representative and unique data set of in situ measurements over the Amazon rainforest, those increased CH4 values will be further investigated in another study.
In this study, a newly developed quantum cascade laser absorption spectrometer, named ATTILA, has been presented and intensively characterized in its in-flight measurement performance. This work not only describes the instrument's functional properties and technical setup, but it identifies possible data interference for airborne trace-gas measurements.
The advantages of the instrumental design are its low weight, size, and costs and its simplicity, which makes it an ideal airborne trace-gas IR spectrometer and possibly attractive for commercial use. This instrument features two cells, which allows simultaneous measurements of a minimum of two tracers. Based on a test flight from a recent airborne research campaign, CAFE Brazil, the instrument has been characterized and influences of extreme environmental changes on the signal could be identified. By identifying these influences, postprocessing of the signal allows for improvement in the data quality. Therefore, temperature drift behavior, linear pressure changes, and short-term fluctuations can be corrected to some extent through frequent calibrations, line-shifting, and appropriate averaging of the data. A comparison with a similar, more established IR spectrometer, TRISTAR, has been used to verify the overall assumption of the quality of the data set. It has been shown that despite ATTILA's minimalist design and the challenges of an airborne platform, the measurements are of high quality, especially at constant flight levels and high altitudes, as its main shortcomings are related to abrupt changes in altitude and extreme aircraft movements. Therefore, the compact IR spectrometer ATTILA is capable of providing detailed information about spatial distributions in the atmosphere. The data set from the CAFE Brazil campaign has been briefly presented and discussed, and atmospheric features could be derived in the CO and CH4 measurements over the Amazon rainforest. Especially for CO, only minor limitations of the data quality could be identified, and detailed atmospheric variations driven by dynamical processes could be located. For CH4, there are more limitations than for the CO measurements due to the optical setup. Nevertheless, a general overview of the CH4 vertical distribution over the Amazon rainforest with enhanced concentrations in lower altitudes could be shown.
Through more field experience, ATTILA can be further improved. The main limitations are the influences of abrupt aircraft movements which cause nonlinear etalon structures. These drawbacks can be addressed by more precise adjustment and improvement in the optical setup. With a more stable optical adjustment, the influences on the signal caused by fluctuating temperature and pressure or strong aircraft movements will be further reduced.
All data measured during the CAFE Brazil campaign and codes which have been used are available upon request. The BAHAMAS data can be found in the HALO database (https://doi.org/10.17616/R39Q0T, Gottschaldt and Rapp, 2017). The CO and CH4 data will be uploaded by the end of 2024.
The supplement related to this article is available online at: https://doi.org/10.5194/amt-17-3553-2024-supplement.
HF and LO designed the study; JL and HF planned the campaign; LO and LLR performed the measurements; LO and LLR processed and analyzed the data; UP, RK, DC, FK, RW, and HF designed the instrument; UP, RK, DC, LLR, and LO optimized the instrument; LO wrote the manuscript draft with contributions from all co-authors.
The contact author has declared that none of the authors has any competing interests.
Publisher’s note: Copernicus Publications remains neutral with regard to jurisdictional claims made in the text, published maps, institutional affiliations, or any other geographical representation in this paper. While Copernicus Publications makes every effort to include appropriate place names, the final responsibility lies with the authors.
The authors gratefully acknowledge the whole CAFE Brazil team, including the atmospheric department of the University of Frankfurt, Karlsruhe Institute of Technology, and the Deutsches Zentrum für Luft- und Raumfahrt (DLR) in Oberpfaffenhofen, whose support was essential for the project.
The article processing charges for this open-access publication were covered by the Max Planck Society.
This paper was edited by Glenn Wolfe and reviewed by two anonymous referees.
Ba, Y. A., Wenger, C., Surleau, R., Boudon, V., Rotger, M., Daumont, L., Bonhommeau, D. A., Tyuterev, V. G., and Dubernet, M.-L.: MeCaSDa and ECaSDa: Methane and ethene calculated spectroscopic databases for the virtual atomic and molecular data centre, J. Quant. Spectrosc. Ra., 130, 62–68, https://doi.org/10.1016/j.jqsrt.2013.05.001, 2013. a
Catoire, V., Robert, C., Chartier, M., Jacquet, P., Guimbaud, C., and Krysztofiak, G.: The SPIRIT airborne instrument: a three-channel infrared absorption spectrometer with quantum cascade lasers for in situ atmospheric trace-gas measurements, Appl. Phys. B, 123, 1–12, https://doi.org/10.1007/s00340-017-6820-x, 2017. a
Crutzen, P. J. and Ehhalt, D. H.: Effects of nitrogen fertilizers and combustion on the stratospheric ozone layer, Ambio, 6, 112–117, https://www.jstor.org/stable/4312257 (last access: 18 August 2023), 1977. a
Faist, J., Capasso, F., Sivco, D. L., Sirtori, C., Hutchinson, A. L., and Cho, A. Y.: Quantum cascade laser, Science, 264, 553–556, https://doi.org/10.1126/science.264.5158.553, 1994. a
Fried, A. and Richter, D.: Infrared absorption spectroscopy, in: Analytical Techniques for Atmospheric Measurement, Wiley Online Library, 72–146, https://doi.org/10.1002/9780470988510.ch2, 2006. a, b, c, d, e
Fried, A., Diskin, G., Weibring, P., Richter, D., Walega, J., Sachse, G., Slate, T., Rana, M., and Podolske, J.: Tunable infrared laser instruments for airborne atmospheric studies, Appl. Phys. B, 92, 409–417, https://doi.org/10.1007/s00340-008-3136-x, 2008. a
Fueglistaler, S., Dessler, A., Dunkerton, T., Folkins, I., Fu, Q., and Mote, P. W.: Tropical tropopause layer, Rev. Geophys., 47, 8755–1209, https://doi.org/10.1029/2008RG000267, 2009. a
Gottschaldt, K.-D. and Rapp, M.: HALO database (last update: 1 October 2020), German Aerospace Center (DLR) [data set], https://doi.org/10.17616/R39Q0T, 2017. a
Hamryszczak, Z., Dienhart, D., Brendel, B., Rohloff, R., Marno, D., Martinez, M., Harder, H., Pozzer, A., Bohn, B., Zöger, M., Lelieveld, J., and Fischer, H.: Measurement report: Hydrogen peroxide in the upper tropical troposphere over the Atlantic Ocean and western Africa during the CAFE-Africa aircraft campaign, Atmos. Chem. Phys., 23, 5929–5943, https://doi.org/10.5194/acp-23-5929-2023, 2023. a
Haracono, Y., Iwata, H., Sakabe, A., Ueyama, M., Takahashi, K., Nagano, H., Nakai, T., and Kosugi, Y.: Effects of water vapor dilution on trace gas flux, and practical correction methods, J. Agr. Meteorol., 71, 65–76, https://doi.org/10.2480/agrmet.D-14-00003, 2015. a
Herriott, D. R. and Schulte, H. J.: Folded Optical Delay Lines, Appl. Opt., 4, 883–889, https://doi.org/10.1364/AO.4.000883, 1965. a
Kormann, R., Fischer, H., Gurk, C., Helleis, F., Klüpfel, T., Kowalski, K., Königstedt, R., Parchatka, U., and Wagner, V.: Application of a multi-laser tunable diode laser absorption spectrometer for atmospheric trace gas measurements at sub-ppbv levels, Spectrochim. Acta A, 58, 2489–2498, https://doi.org/10.1016/S1386-1425(02)00066-5, 2002. a
Lan, X., Thoning, K., and Dlugokencky, E.: Trends in globally-averaged CH4, N2O, and SF6, NOAA Global Monitoring Laboratory measurements, https://doi.org/10.15138/P8XG-AA10, 2023. a, b
Li, G., Gordon, I. E., Rothman, L. S., Tan, Y., Hu, S.-M., Kassi, S., Campargue, A., and Medvedev, E. S.: Rovibrational line lists for nine isotopologues of the CO molecule in the X1Σ+ ground electronic state, Astrophys. J. Suppl. S., 216, 15, https://doi.org/10.1088/0067-0049/216/1/15, 2015. a
Li, J., Parchatka, U., and Fischer, H.: Development of field-deployable QCL sensor for simultaneous detection of ambient N2O and CO, Sensor. Actuat. B-Chem., 182, 659–667, https://doi.org/10.1016/j.snb.2013.03.073, 2013. a, b, c
McManus, J. B., Kebabian, P. L., and Zahniser, M. S.: Astigmatic mirror multipass absorption cells for long-path-length spectroscopy, Appl. Opt., 34, 3336–3348, https://doi.org/10.1364/AO.34.003336, 1995. a, b
McManus, J. B., Zahniser, M. S., Nelson Jr., D. D., Shorter, J. H., Herndon, S. C., Wood, E. C., and Wehr, R.: Application of quantum cascade lasers to high-precision atmospheric trace gas measurements, Opt. Eng., 49, 111124, https://doi.org/10.1117/1.3498782, 2010. a
Nussbaumer, C. M., Parchatka, U., Tadic, I., Bohn, B., Marno, D., Martinez, M., Rohloff, R., Harder, H., Kluge, F., Pfeilsticker, K., Obersteiner, F., Zöger, M., Doerich, R., Crowley, J. N., Lelieveld, J., and Fischer, H.: Modification of a conventional photolytic converter for improving aircraft measurements of NO2 via chemiluminescence, Atmos. Meas. Tech., 14, 6759–6776, https://doi.org/10.5194/amt-14-6759-2021, 2021. a
Nussbaumer, C. M., Place, B. K., Zhu, Q., Pfannerstill, E. Y., Wooldridge, P., Schulze, B. C., Arata, C., Ward, R., Bucholtz, A., Seinfeld, J. H., Goldstein, A. H., and Cohen, R. C.: Measurement report: Airborne measurements of NOx fluxes over Los Angeles during the RECAP-CA 2021 campaign, Atmos. Chem. Phys., 23, 13015–13028, https://doi.org/10.5194/acp-23-13015-2023, 2023. a
Pal, M. and Pradhan, M.: Quantum Cascade Laser Spectroscopy, Modern Techniques of Spectroscopy: Basics, Instrumentation, and Applications, Springer, 363–387, https://doi.org/10.1007/978-981-33-6084-6_14, 2021. a
Peng, S., Lin, X., Thompson, R. L., Xi, Y., Liu, G., Hauglustaine, D., Lan, X., Poulter, B., Ramonet, M., Saunois, M., Yin, Y., Zhang, Z., Zheng, B., and Ciais, P.: Wetland emission and atmospheric sink changes explain methane growth in 2020, Nature, 612, 477–482, https://doi.org/10.1038/s41586-022-05447-w, 2022. a
Reiche, J., Lucas, R., Mitchell, A. L., Verbesselt, J., Hoekman, D. H., Haarpaintner, J., Kellndorfer, J. M., Rosenqvist, A., Lehmann, E. A., Woodcock, C. E., Seifert, F. M., and Herold, M.: Combining satellite data for better tropical forest monitoring, Nat. Clim. Change, 6, 120–122, https://doi.org/10.1038/nclimate2919, 2016. a
Richter, D., Weibring, P., Walega, J. G., Fried, A., Spuler, S. M., and Taubman, M. S.: Compact highly sensitive multi-species airborne mid-IR spectrometer, Appl. Phys. B, 119, 119–131, https://doi.org/10.1007/s00340-015-6038-8, 2015. a, b
Röder, L. L. and Fischer, H.: Theoretical investigation of applicability and limitations of advanced noise reduction methods for wavelength modulation spectroscopy, Appl. Phys. B, 128, 1–10, https://doi.org/10.1007/s00340-021-07737-z, 2022. a
Röder, L. L., Ort, L. M., Lelieveld, J., and Fischer, H.: Determination of Temporal Stability and Instrument Performance of an airborne QCLAS via Allan-Werle-plots, Appl. Phys. B, https://doi.org/10.21203/rs.3.rs-3619758/v1, in review, 2024. a, b, c
Schiller, C., Bozem, H., Gurk, C., Parchatka, U., Königstedt, R., Harris, G., Lelieveld, J., and Fischer, H.: Applications of quantum cascade lasers for sensitive trace gas measurements of CO, CH4, N2O and HCHO, Appl. Phys. B, 92, 419–430, https://doi.org/10.1007/s00340-008-3125-0, 2008. a, b, c, d
Tadic, I., Parchatka, U., Königstedt, R., and Fischer, H.: In-flight stability of quantum cascade laser-based infrared absorption spectroscopy measurements of atmospheric carbon monoxide, Appl. Phys. B, 123, 1–9, https://doi.org/10.1007/s00340-017-6721-z, 2017. a, b, c
Tadic, I., Crowley, J. N., Dienhart, D., Eger, P., Harder, H., Hottmann, B., Martinez, M., Parchatka, U., Paris, J.-D., Pozzer, A., Rohloff, R., Schuladen, J., Shenolikar, J., Tauer, S., Lelieveld, J., and Fischer, H.: Net ozone production and its relationship to nitrogen oxides and volatile organic compounds in the marine boundary layer around the Arabian Peninsula, Atmos. Chem. Phys., 20, 6769–6787, https://doi.org/10.5194/acp-20-6769-2020, 2020. a
Tomsche, L., Pozzer, A., Ojha, N., Parchatka, U., Lelieveld, J., and Fischer, H.: Upper tropospheric CH4 and CO affected by the South Asian summer monsoon during the Oxidation Mechanism Observations mission, Atmos. Chem. Phys., 19, 1915–1939, https://doi.org/10.5194/acp-19-1915-2019, 2019. a, b, c, d
Toth, R.: Linelist of N2O parameters from 500 to 7500 cm−1, JPL online, https://mark4sun.jpl.nasa.gov/n2o.html (last access: 10 October 2023), 2004. a, b
Tuzson, B., Graf, M., Ravelid, J., Scheidegger, P., Kupferschmid, A., Looser, H., Morales, R. P., and Emmenegger, L.: A compact QCL spectrometer for mobile, high-precision methane sensing aboard drones, Atmos. Meas. Tech., 13, 4715–4726, https://doi.org/10.5194/amt-13-4715-2020, 2020. a
Werle, P.: A review of recent advances in semiconductor laser based gas monitors, Spectrochim. Acta A, 54, 197–236, https://doi.org/10.1016/S1386-1425(97)00227-8, 1998. a
Werle, P. and Slemr, F.: Signal-to-noise ratio analysis in laser absorption spectrometers using optical multipass cells, Appl. Opt., 30, 430–434, https://doi.org/10.1364/AO.30.000430, 1991. a
Wienhold, F., Fischer, H., Hoor, P., Wagner, V., Königstedt, R., Harris, G., Anders, J., Grisar, R., Knothe, M., Riedel, W., Liibken, F.-J., and Schilling, T.: TRISTAR-A tracer in-situ TDLAS for atmospheric research, Appl. Phys. B, 67, 411–417, http://hdl.handle.net/10315/4208 (last access: 18 September 2023), 1998. a, b
Zahniser, M. S., Nelson, D. D., McManus, B., Kebabian, P. L., Lloyd, D., Fowler, D., Jenkinson, D. S., Monteith, J. L., and Unsworth, M. H.: Measurement of trace gas fluxes using tunable diode laser spectroscopy, Philos. T. Roy. Soc. A, 351, 371–382, https://doi.org/10.1098/rsta.1995.0040, 1995. a, b, c, d
Zhang, Z., Poulter, B., Feldman, A. F., Ying, Q., Ciais, P., Peng, S., and Li, X.: Recent intensification of wetland methane feedback, Nat. Clim. Change, 13, 430–433, https://doi.org/10.1038/s41558-023-01629-0, 2023. a
- Abstract
- Introduction
- The ATTILA instrument
- Instrument performance based on test flight
- Instrument comparison for ambient data
- Results from CAFE Brazil
- Conclusions
- Code and data availability
- Author contributions
- Competing interests
- Disclaimer
- Acknowledgements
- Financial support
- Review statement
- References
- Supplement


