the Creative Commons Attribution 4.0 License.
the Creative Commons Attribution 4.0 License.
 | 20 Jun 2024
Cost-effective off-grid automatic precipitation samplers for pollutant and biogeochemical atmospheric deposition
Alessia A. Colussi
Daniel Persaud
Melodie Lao
Bryan K. Place
Rachel F. Hems
Susan E. Ziegler
Kate A. Edwards
Cora J. Young
An important transport process for particles and gases from the atmosphere to aquatic and terrestrial environments is through dry and wet deposition. An open-source, modular, off-grid, and affordable instrument that can automatically collect wet-deposition samples allows for more extensive deployment of deposition samplers in fieldwork and would enable more comprehensive monitoring of remote locations. Precipitation events selectively sampled using a conductivity sensor powered by a battery-based supply are central to off-grid capabilities. The prevalence of conductive precipitation – that which initially contains high solute levels and progresses through trace-level concentrations to ultrapure water in full atmospheric washout – depends on the sampling location but is ubiquitous. This property is exploited here to trigger an electric motor (via limit switches) to open and close a lid resting over a funnel opening. The motors are operated via a custom-built and modular digital logic control board, which has a low energy demand. All components, their design and rationale, and their assembly are provided for community use. The modularity of the control board allows the operation of up to six independent wet-deposition units, such that replicate measurements (e.g., canopy throughfall) or different collection materials for various targeted pollutants can be implemented as necessary.
We demonstrate that these platforms are capable of continuous operation off-grid for integrated monthly and bimonthly collections performed across the Newfoundland and Labrador Boreal Ecosystem Latitudinal Transect (47 to 53° N) during the growing seasons of 2015 and 2016. System performance was assessed through the measured power consumption from 115 V of alternating current (VAC; grid power) or 12 V of direct current from battery supplies during operation under both standby (40 or 230 mA, respectively) and in-use (78 or 300 mA, respectively) conditions. In the field, one set of triplicate samplers was deployed in the open to collect incident precipitation (open fall), while another set was deployed under the experimental forest canopy (throughfall). The proof-of-concept systems were validated with basic measurements of rainwater chemistry, which found (i) pH values ranging from 4.14 to 5.71 in incident open fall rainwater, (ii) conductivities ranging from 21 to 166 µS cm−1, and (iii) dissolved organic carbon concentrations in open fall and canopy throughfall of 16±10 and 22±12 mg L−1, respectively, with incident fluxes spanning 600 to 4200 mg C m−2 a−1 across the transect. Ultimately, this demonstrates that the customized precipitation sampling design of this new platform enables more universal accessibility of deposition samples for the atmospheric observation community – for example, those who have made community calls for targeting biogeochemical budgets and/or contaminants of emerging concern in sensitive and remote regions.
- Article
(2158 KB) - Full-text XML
-
Supplement
(2457 KB) - BibTeX
- EndNote


Atmospheric deposition is the central loss process for particles and gases to terrestrial and aquatic surfaces (Pacyna, 2008). Particles and gases can be deposited by both dry and wet deposition processes. Dry deposition is facilitated by the direct interaction of gases and particles with boundary layer surfaces such as water, vegetation, and/or soil, while wet deposition involves in-cloud scavenging and below-cloud interception of gases and aerosols by, e.g., rain droplets and snow crystals (Fowler, 1980; Lovett and Kinsman, 1990). Dry and wet deposition are global processes coupled to regional synoptic-scale conditions, but their relative importance depends on local sources and the global transport of atmospheric analytes of interest. Dry deposition consists of a variety of mechanisms for particles and gases, with fine-mode particles and their chemical constituents being more likely (compared to ultrafine- and coarse-mode particles) to undergo atmospheric long-range transport prior to being deposited (Farmer et al., 2021). Wet deposition occurs when such long-lived atmospheric particles and gases are included and/or scavenged into cloud water and transported to the surface of the Earth in precipitation (e.g., snow and rain). With the size and number of droplets in the atmosphere largely controlling the rate, wet deposition depends on a variety of meteorological factors affecting precipitation, such as the size distribution and concentration of ice- and droplet-nucleating particles, as well as the solubility, concentration, and reactivity of gases (Lovett, 1994). Ultimately, deposition plays an important role in pollutant distribution and the biogeochemical cycling of long-studied major nutrients (e.g., nitrogen and sulfur in acid rain) and those that are increasingly being recognized for their importance, such as dissolved organic carbon (DOC) (Meteorological Service of Canada, 2005; Vet et al., 2014; Safieddine and Heald, 2017; United States Environmental Protection Agency, 2020).
Recognizing the significance of atmospheric trace chemical deposition has led to the establishment of monitoring networks. For example, long-term wet-deposition monitoring networks, like the Canadian Air and Precipitation Monitoring Network (CAPMoN) and the National Atmospheric Deposition Program (NADP), aim to provide critical data on the spatial and temporal patterns of wet and dry deposition. As a result, this has allowed for the estimation of regional and continental deposition rates of species regulated by national or international policies (Lovett, 1994). Data from these networks have been critical to understanding the efficacy of policy to reduce environmental issues like acid rain (Likens and Butler, 2020). In particular, the Oslo and Geneva protocols have achieved an 80 % decrease in both North American and European SO2 emissions since 1980 (Grennfelt et al., 2020). Despite these successes, the reduction in acid deposition in ecosystems has been unexpectedly slow, leaving them sensitized and necessitating continued deposition monitoring (Stoddard et al., 1999; Kuylenstierna et al., 2001).
Over the past 60 years, the precipitation chemistry community has made advancements in deposition collectors to better understand atmospheric processes (Siksna, 1959). While bulk deposition collection (i.e., a collection bucket or jug fitted with a funnel open at all times; Hall, 1985) is both a simple and economically feasible sampling method utilized by monitoring networks, it is subject to bias through the collection of inputs other than atmospheric deposition (e.g., bird droppings, insects, plant debris). As a result, bulk collectors can overestimate total deposition and underestimate wet deposition in a variety of locations (Lindberg et al., 1986; Richter and Lindberg, 1988; Stedman et al., 1990). Sequential precipitation collection methods include manually segmenting samplers (requiring only a shelter, clean surface, and an operator) and linked collection vessels (sample containers that are filled in sequence via gravitational flow), amongst others, and have been developed to analyze rainwater composition and measure parameters such as pH and conductivity (Gatz et al., 1971; Reddy et al., 1985; Vermette and Drake, 1987; Laquer, 1990). Sequential sampler designs have also been adapted to collect precipitation in remote field sites (Germer et al., 2007; Sanei et al., 2010). Although it is a more costly and time-intensive method when compared to bulk deposition collection, the major appeal of measuring isolated wet deposition is the ability to isolate this individual atmospheric process. Further innovation, such as the use of sensors to automate the isolation of collected precipitation or the addition of polymeric mesh barriers to reduce debris input in windy environments (Lovett, 1994), can reduce bias and improve the preservation of samples, but commercial solutions often come at a substantial expense.
When targeting biogeochemically relevant species in deposition collectors, additional standard practices have been developed to improve the representativeness of sample composition. First, an appropriate monitoring site must be selected. Three categories of siting criteria, established by organizations such as CAPMoN and the NADP, are of particular importance: (i) site representativeness and physical characteristics, (ii) the distance from potential pollution sources, and (iii) operational requirements (Canadian Air and Precipitation Monitoring Network, 1985; National Atmospheric Deposition Program, 2009). This means that each site must be a location that receives precipitation representative of the hydrologic area; is ideally not within 500 m of local pollution sources, such as wood-burning stoves, garbage dumps, and vehicle parking lots; and is accessible for daily collections and maintenance and can be serviced by a reliable 115 V of alternating current (VAC) electrical power (Canadian Air and Precipitation Monitoring Network, 1985; National Atmospheric Deposition Program, 2009). Despite these guidelines, there are many reasonable scenarios in which these siting conditions cannot be met. As an example, remote sample collections are often required for global assessments on persistent contaminants or nutrients of biogeochemical importance. At remote locations, however, the sampling site may have no power provision, sample collection may be infrequent, and/or the infrastructure-bearing location itself may be a source of the targeted pollutants. As a result, innovation in collection strategies (such as time-integrated off-grid sampling, with modularity in the deployment of replicates) as well as materials for the quantitative collection of environmental targets is still needed to expand and/or modify networks to meet current and future monitoring and policy needs.
In biogeochemical cycles, for example, the improvement of constraints in atmospheric carbon linkages to terrestrial and aquatic processes is necessary. This would play a critical role in correctly assessing climate feedbacks and reducing uncertainty in Earth system models. The measurement of atmospheric DOC transport to surfaces has been limited, which has stopped the landscape-scale carbon balance from being obtained (Casas-Ruiz et al., 2023). The pool of compounds from which DOC is derived in the atmosphere has also been limited and has only recently seen an increase in research intensity. Reactive organic carbon (ROC) is defined as the sum of nonmethane organic gases and primary and secondary organic aerosols (Safieddine and Heald, 2017). The major removal mechanism of water-soluble organic compounds produced through oxidation from the atmosphere is the dry deposition of particle-bound pollutants and scavenging by rainfall (Jurado et al., 2004, 2005). When ROC is scavenged into rainfall, it becomes DOC and enters terrestrial and aquatic systems. Deposition measurements of ROC compounds are needed since they play a crucial role in the formation of secondary species such as ozone, particulate matter, and carbon dioxide (CO2) (Safieddine and Heald, 2017; Heald and Kroll, 2020).
There are several evolving drivers for studying atmospheric ROC; for example, light-absorbing organic carbon that can affect the global radiative balance and undergo photochemical transformations in the condensed phase (Saleh, 2020; Wang et al., 2021; Washenfelder et al., 2022; George, 2023). Reactive organic carbon can also influence cloud formation and contribute to precipitation acidity (Avery et al., 2006; Ramanathan and Carmichael, 2008). Measurements of speciated ROC are difficult due to the chemical complexity of emitted compounds and oxidation products (Heald and Kroll, 2020). To circumvent this, DOC can be monitored and quantified and then used as a proxy to estimate the total ROC in precipitation. However, quantitative measurements of DOC in precipitation samples are sparse due to its relatively low concentration of 0.1 to 10 mg C L−1 (Iavorivska et al., 2016; Safieddine and Heald, 2017). Recently, calls for carbon closure in the atmospheric processing of ROC have made this measurement increasingly important (Kroll et al., 2011; Heald et al., 2020; Barber and Kroll, 2021). Similarly, to obtain the net landscape or watershed carbon exchange, studies require effective methods for capturing and preserving atmospheric DOC deposition to constrain biogeochemical linkages at global interfaces, as outlined above.
In this work, we present the design of a custom-built automated array of precipitation samplers that can be operated both on- and off-grid for wet-deposition collection. The purpose of these samplers is to enable the cost-effective collection of integrated, water-soluble, conductive atmospheric constituents deposited in remote environments without grid power or routine access. A sensor interfaces with a custom-built motor control board capable of operating up to six independent wet-deposition units such that canopy throughfall (TF) and incident precipitation (open fall, OF) measurements can be collected in replicate. The materials used can be easily changed in order to optimize the collection and preservation of a wide array of target analytes, such as DOC, when using high-density polyethylene and mercuric chloride (HgCl2). We demonstrate that these platforms are capable of continuous operation off-grid for the monthly wet-deposition collection of precipitation across the Newfoundland and Labrador Boreal Ecosystem Latitudinal Transect (NL-BELT) during snow-free periods in 2015 and 2016. Extremes in system performance were evaluated by testing the power consumption of a sampling array from spring through fall when paired with a solar top-up system and during snow-free winter conditions using only a battery. The 2 years of field samples were collected using an array of six collection units, with triplicate collection of both incident precipitation and throughfall from rain passing through a forest canopy. Samples were analyzed to determine deposition volumes relative to total bulk volumes, the reproducibility of replicate samples, and the fraction of conductive rainfall within the total volume of precipitation at these remote sites. The captured fraction compared to the total volume deposited is used to gain insight into how these samplers can limit analyte dilution effects and improve method detection limits, such as by rejecting 50 % of the total volume delivered as ultrapure precipitation, leading to a factor of 2 improvement. Chemical parameters – pH, conductivity, and DOC fluxes – collected according to established preservation protocols were then compared to prior measurements to validate this proof-of-concept system. Measurement methods for the pH and conductivity of rainwater are very well-established in the literature and serve as a baseline reference to ensure that the samples collected by the new devices presented in this work are consistent with what is expected in samples from a remote coastal environment, given the selective sampling strategy. We then move away from these well-established parameters to quantify DOC fluxes using established biogeochemical preservation techniques for fresh water and groundwater to demonstrate the potential of these samplers when they are applied to the automated collection of analytes of emerging importance and interest in the remote locations of our latitudinal transect.
2.1 Precipitation sampling array components
Each automated precipitation sampling setup can be operated as an array; here, they are used in groups of up to six collection units (Fig. 1). A collection unit is a simple opaque doored box. The box protects the sample containers against exposure to direct sunlight and provides a mounting location for the funnel and lid while also facilitating the easy exchange of sample containers. The collection units can be fitted with stabilizing legs that allow them to be bolted to concrete or pinned by retaining rods when on soil. In both cases, this prevents sample tipping and loss during high winds or wildlife–sampler interactions (e.g., Figs. 2 and S1 in the Supplement). The collection of precipitation is facilitated by a funnel mounted through the top of the sampling unit. The funnel tip extends into the opening of the sample collection container placed inside. The connection can be sealed to better preserve volatile analytes with tubing that passes through a sealed grommet (P/N 9280K34, McMaster-Carr) to enter the sample collection container and minimize evaporative losses. Precipitation events are sampled selectively by modulating the position of a lid over the funnel with an electric motor. The collection unit motors are operated by a digital control board, which interfaces with a precipitation sensor and requires 12 V of direct current (VDC) power to be supplied to this system. Switches detecting the lid position ensure complete opening or closure of the funnel mouth for each collection unit.
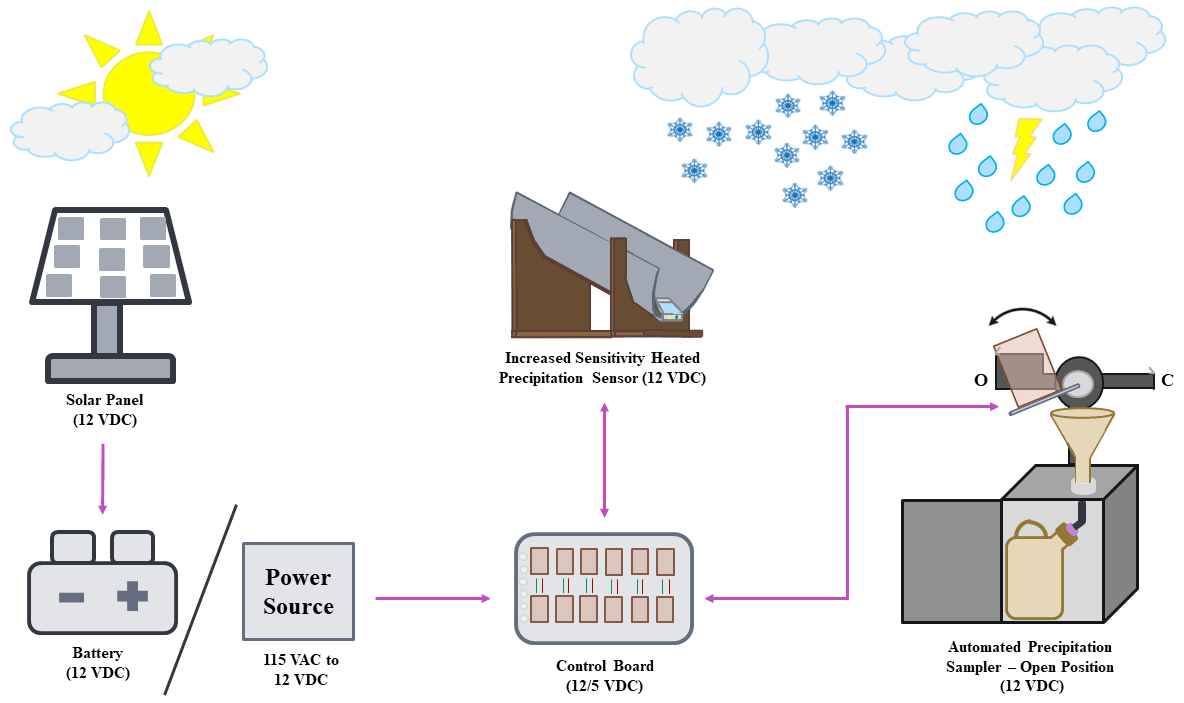
Figure 1Schematic of custom-built automated precipitation sampling array components for off-grid wet-deposition collection. The pink arrows denote the directions of the electrical signal and the power exchanged between components. The curved black arrow indicates the rotation of a motorized lid to obtain open (O) and closed (C) sampler configurations.
2.1.1 Collection units
The collection unit materials used to date have been 0.95 cm plywood and black polyacrylate sheeting. These materials have demonstrated high durability (on the order of 4 years) under field conditions (Figs. S1 and S2). Opaque materials were explicitly selected to minimize photochemical reactions and the growth of photosynthetic microorganisms within the sample. The dimensions of the collection unit are detailed in Fig. 2. Each can accommodate sample containers up to 20 L in volume for collection in locations with large monthly wet-deposition volumes, such as in Newfoundland and Labrador (Table 1).
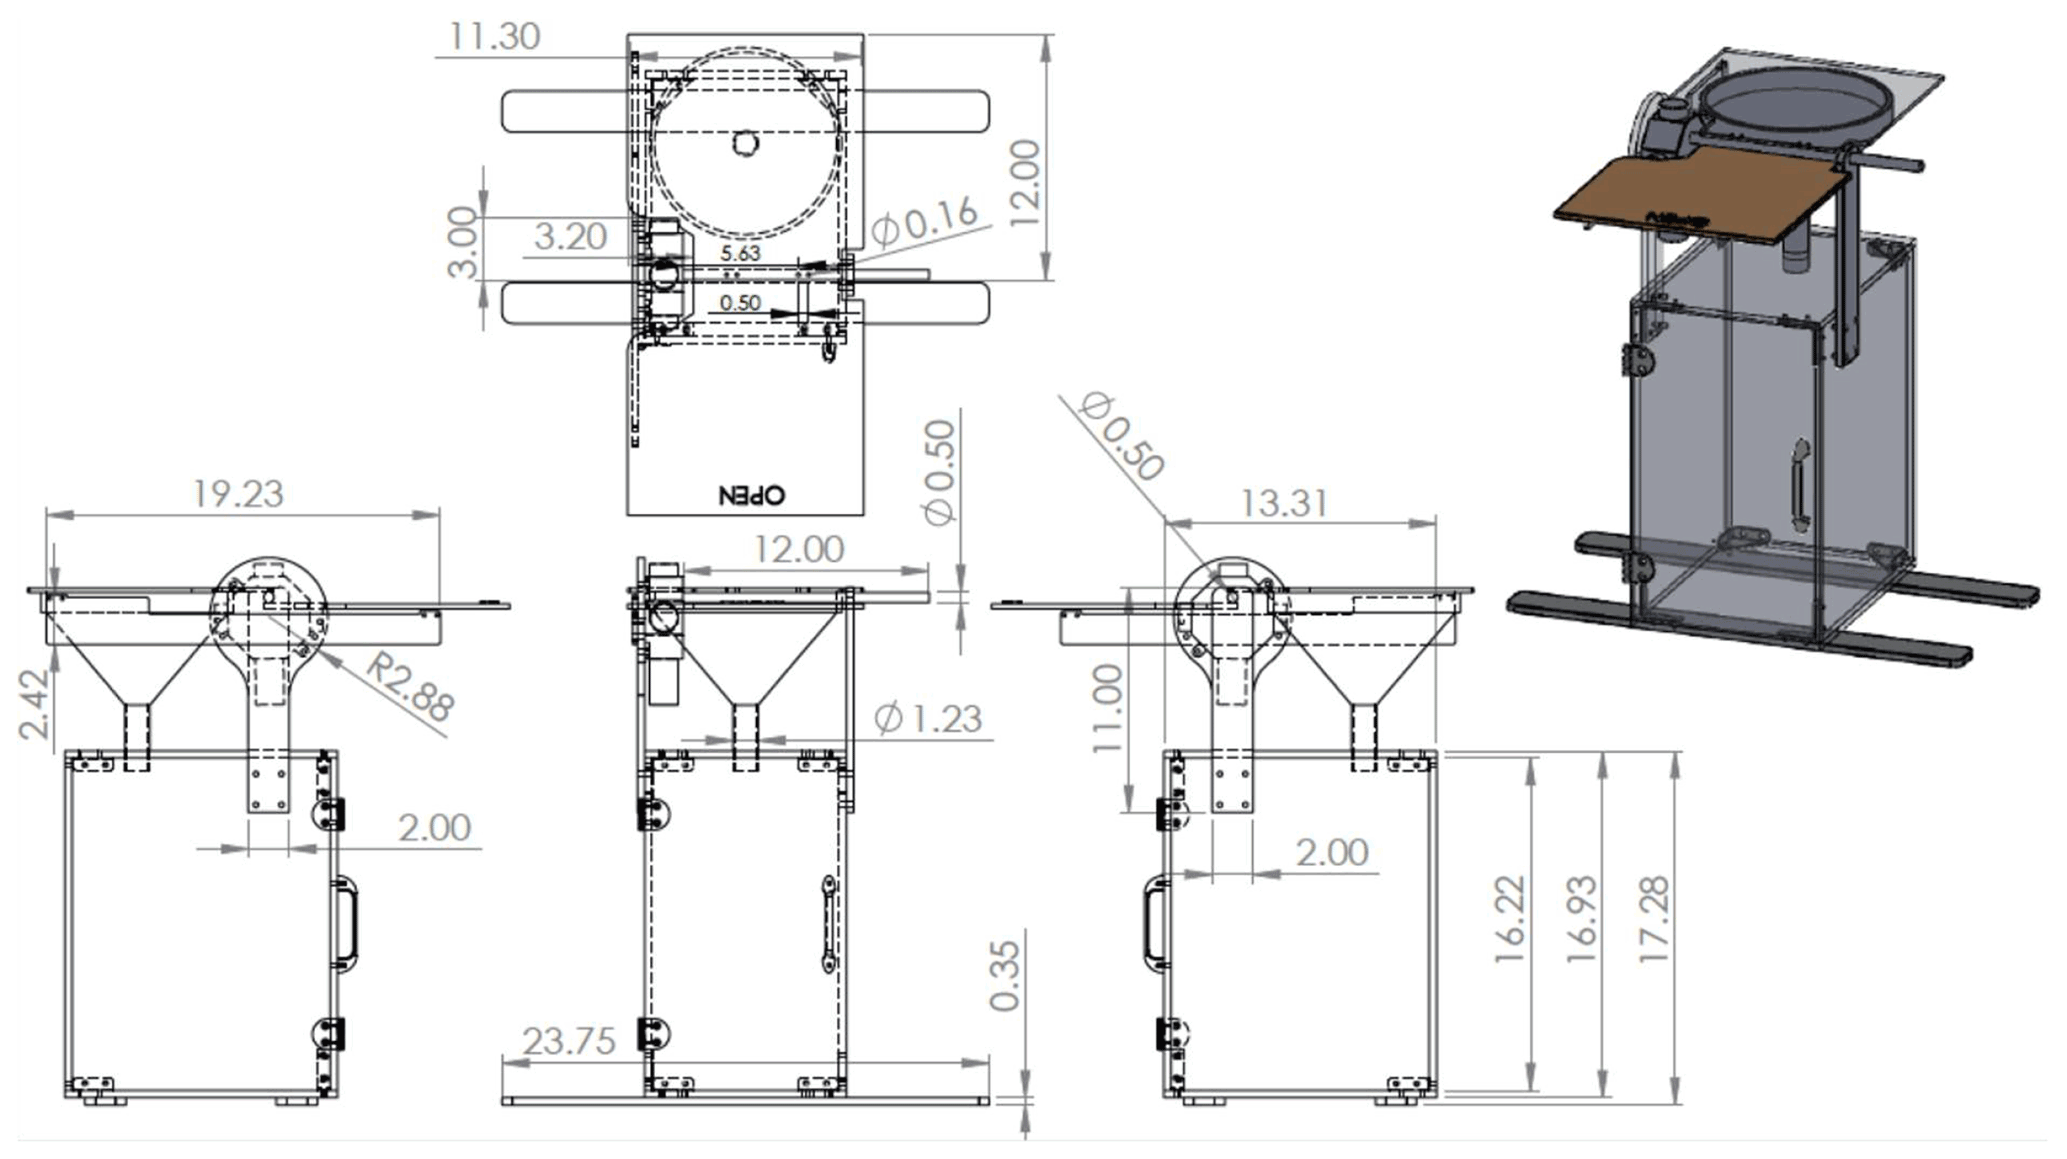
Figure 2Detailed collection unit schematic, with all dimensions provided in inches (1 in.=2.54 cm). Further specifications for the lid dimensions can be found in Fig. S3. The shaded 3D rendering depicts both open and closed states for the lid, the positioning of legs to secure it to surfaces, the placement of corner brackets, and the door handle and hinges.
The box panels can be joined using hardware inserts (P/N 1556A54 and 1088A31, McMaster-Carr, Aurora, OH), 3D-printed corners (Fig. S4), or along the box edges with screws if using wood. The door is attached with two hinges (P/N 1549A57, McMaster-Carr) and held closed with a magnetic contact (P/N1674A61; McMaster-Carr) or hooked latch. The electric motor controlling the lid is enclosed in a standard polyvinylchloride electrical junction box, which is attached to a short paddle mounted on one side of the collection unit. Here we used an electric worm-gear motor (12 VDC, 2 revolutions per minute; TS-32GZ370-1650; Tsiny Motor Industrial Co., Dong Guan, China) mounted inside the enclosure with matching hex bolts (P/N 91251A146, McMaster-Carr) that pass through the weather-tight cover, while the drive shaft protrudes through a 3/8 in. (0.95 cm) hole drilled in the cover. The drive shaft has a flat edge to affix the lid rod using a short set screw (Fig. S5) that is cemented semi-permanently in place with thread-locking compound (P/N 91458A112; Loctite Threadlocker Blue 242; McMaster-Carr). The lid rod is 3/8 in. (0.95 cm) aluminum, which is machined on one end to allow connection to the motor drive shaft (Fig. S5) and has four threaded holes along its length to affix the lid (Fig. S3). The lid rod passes through a second mounting paddle on the box that keeps the lid level and capable of isolating the funnel from the atmosphere in the absence of precipitation. The lids used here were made of 1/8 in. (0.318 cm) Lexan polycarbonate sheet.
Selective precipitation sampling is performed using a logic-based assessment of sensor and switch states (defined in Fig. S6) by the control board quadNOR gate chip (P/N DM74LS02, Fairchild Semiconductor), which activates the H-bridge motor driver chipset (Fig. S7). A 12 VDC signal drives the clockwise or counterclockwise rotation of the motor (installed in a suitable port of the junction box) via a cable from the control board, which passes through a weather-tight compression fitting (e.g., Home Depot stock keeping unit number (SKU#) 1000116446). The motor rotation signal is interrupted when the lid makes contact with one of two weather-tight limit switches (P/N SW1257-ND, Omron, Digi-Key Electronics, Thief River Falls, MN) mounted on opposite ends of a horizontal armature connected to the vertical motor mounting paddle (Fig. 2). The switches controlling the lid location ensure that the funnel is completely open or covered as necessary for precipitation collection. The funnels used in this work are 20 cm in diameter and made from high-density polyethylene (HDPE; Dynalon, P/N 71070-020, VWR International, Mississauga, ON). A 18×13 cm piece of filtration mesh (P/N 9265T49, McMaster-Carr) that was tied together as a fitted cone insert with Nylon thread (e.g., fishing line) to prevent large debris from entering the sampler containers when used, for example, in the collection of TF precipitation under a forest canopy when accompanying litterfall is also expected. The exit of the funnel directs the collected precipitation into the narrow-mouth opening of the container inside the collection unit, such as a 20 L HDPE jug or 10 L HDPE jerrican (Bel-Art Products; P/N 11215-314, VWR International).
2.1.2 Heated precipitation sensor
The detection of rain modulates the opening and closing of the collection units by an interdigitated resistive sensor (M152, Kemo Electronic GmbH, Geestland, Germany; Figs. S6 to S8). This approach is consistent with established precipitation detection techniques used by government monitoring programs (e.g., the Canadian Air and Precipitation Monitoring Network (CAPMoN); Canadian Air and Precipitation Monitoring Network, 1985). The rain sensor detects conductive deposition by monitoring for the completion of a conductive circuit when electrolytes bridge the connection between the interdigitated gold electrodes. The sensor is supplied with 12 VDC from the power system to trigger a relay when a precipitation conductance above 1 MΩ cm conductivity is detected (determined experimentally; see Sect. S1 in the Supplement). This is equivalent to approximately 8 µM sodium chloride. The sensor detection limit reflects an upper limit of precipitation ion loading because the design of the rain chute leads to an increase of more than a factor of 25 in the surface area on which solutes can accumulate to enhance the ionic content of the deposited water. An output of 12 VDC is sent to the digital control board by the relay when rain is sensed, or 0 VDC is sent in its absence, for signal processing and motor control (Fig. S7). When rain is sensed, the lids of the samplers in the array are simultaneously opened in < 5 s (this is dependent on the rotational rate of the lid motor). To increase the sensitivity of this sensor and to extend the sampling duration when conductive atmospheric constituents are completely washed out of the atmosphere, a sloped tin chute (e.g., Home Depot SKU# 1001110514) was added to extend the surface of the rain sensor. The sensor was placed at the end of the chute and sealed in place with caulking to allow water droplets to move easily from the chute onto the sensor.
The angle of the chute can be adjusted to control the momenta of collected droplets so that they collect on the sensor surface and only flow off it when the rate of precipitation exceeds the sensor's evaporation capability. When soil is available, two bent rods can be used to hold the chute at the optimized angle of 10° (Fig. S2). They are inserted into the soil, and the chute is affixed to the tops of the rods with zip ties passed through small holes drilled in the sides of the chute, which are subsequently sealed with caulking. When soil is unavailable, for example in urban environments, we have created a mounting frame to hold the chute at the optimized angle of 10° (Fig. S8). When precipitation is detected, the sensor surface draws a current of up to 1.0 ampere (A) into a heater to actively evaporate water from its surface so that it accurately detects the active periods of rain events. The heated sensor has undergone preliminary field tests and is also capable of detecting ice and snow, provided they contain electrolytes.
2.1.3 Power supply systems
The power for this system can be supplied from a battery at 12 VDC or using a 115 VAC to 12 VDC transformer power supply (P/N 285-1818-ND; TDK-Lambda Americas, Digi-Key Electronics). Depending on the duration of sampling and the time of year, the battery capacity can be changed to suit the power needs (Sect. 3.2.2). To provide sufficient power density over the 1- to 2-month-long collection periods in this study, the battery capacity was carefully matched, with top-up options implemented when prolonged or high-frequency precipitation was expected. Absorbent glass mat (AGM) marine deep-cycle batteries can withstand discharge events down to less than 60 % capacity and are robust under nearly all environmentally relevant temperatures ( to 40 °C). Additionally, these batteries interface easily with solar charging options as they are able to accept a high current input. Monthly collections in Newfoundland were powered with 76 amp-hour (Ah) AGM batteries (Motomaster Nautilus; Ultra XD group 24 high-performance AGM deep-cycle battery, 12 VDC) topped up by a 40 W solar panel interfaced with a charge controller to prevent overcharging (Coleman; model # 51840, max current of 8 A at 14 VDC).
For collections made every second month in Labrador, a 120 Ah battery with the same solar top-up strategy was used to ensure continuous operation. For either remote field deployment, batteries and charge controllers were housed in a Pelican™ case (model 1440, Ocean Case Co. Ltd., Enfield, NS) fitted with weather-tight bulkhead cord grips (P/N 7529K655, McMaster-Carr) through which charging and power cables were passed (Belden, Coleman; S/N 7004608, 70875227, Allied Electronics, Inc., Ottawa, ON). Humidity in all weatherproof cases was minimized by exchanging reusable desiccant packs (Ocean Case Co. Ltd.) when depleted batteries were exchanged for fully charged replacements. Solar panels were repositioned monthly to optimize their orientation for solar-power provision. Using either power source, the control board converts and distributes the 12 VDC to the other components in the precipitation sampling array.
2.1.4 Custom control board
A custom control board to operate a six-collection unit array was designed based on prior digital logic circuits for standalone collectors (VandenBoer, 2009). The 12 VDC battery or transformer output is supplied directly to the rain sensor and relay as well as to the motor drivers for lid opening (Fig. S9). Each collection unit is controlled independently to ensure the lids are fully opened or closed, thereby requiring six replicate motor driver control circuits that respond to their independent switch signals. The remainder of the signalling and digital logic operates on 5 VDC, which is produced by on-board voltage regulators (Micro Commercial Co.; P/N MC7805CT-BP, Digi-Key Electronics). The lid switches are provided with 0 and 5 VDC to indicate a collection unit open or closed status (Omron Electronics; P/N D2FW-G271M(D), Digi-Key Electronics). The signals from the sensor and switches connect to the board through four-conductor cable (Belden; S/N 70003678, Allied Electronics Inc.) passed through weather-tight bulkhead cord grips and secured to screw terminals (Fig. S9). The sensor and switch signal inputs interface with a quad-NOR-gate chipset (Texas Instruments; P/N 296-33594-5-ND, Digi-Key Electronics) to trigger the motor driver (STMicroelectronics; P/N 497-1395-5-ND, Digi-Key Electronics) such that it rotates or remains stationary. The additional resistors, capacitors, and diodes are necessary to maintain stable signalling throughout the printed circuit board (Fig. S9, Table S1 in the Supplement).
The custom control board was housed in a Pelican™ case (1400 NF; Pelican Zone, Mississauga, ON) fitted with cut-to-use foam inserts and a reusable desiccant pack that was also exchanged alongside those for the battery cases. All collection units, sensors, and power supply cables were passed through eight weather-tight bulkhead cord grips and fixed to screw terminals on the board. The opposing ends of the cables were fitted with weather-tight Bulgin Buccaneer 400 or 4000 series circular cable connectors (Table S2; Allied Electronics, Inc.) to allow easy field installation with mated connectors on the cables originating from each of the previously mentioned array components. Connected cables could then be buried in shallow soil trenches to reduce the attention of gnawing animals as well as potential entanglement hazards with other wildlife. Precipitation events were logged from the control boards using a HOBO four-channel analogue data logger (UX120-006M; Onset®, Bourne, MA) that records the sensor, switch, and motor voltages. The fourth channel is reserved to monitor battery or power supply voltages over time (Sect. 3.2).
2.2 Power demand and management tests
Power demand was calculated based on the cumulative component requirements prior to the selection of batteries. This was to ensure adequate capacity to collect samples over 1- to 2-month-long field deployments and to cope with an assumed worst-case scenario of 1 week of constant rain without solar-power charge restoration. Solar-panel power production capacity was determined based on the calculated energy required to recharge the battery. As a result, we selected a 40 W panel, which could complete the charging at 14 VDC with a week of direct sunlight at 8 h per day. The power demand for a six-sampler array was measured in standby and during operation with a digital power meter (Nashone PM90, Dalang Town, China) in real time when supplying 12 VDC with a transformer. Contrasting power demand tests were performed under different environmental conditions and power management configurations. The first was performed using the 76 Ah AGM battery with a solar top-up in an urban environment from July through August 2018, while the other was performed using a 103 Ah AGM battery alone from January through February 2019. The dataset can be found in Colussi et al. (2024).
2.3 Continuous monthly collection of remote samples at NL-BELT
One array of six automated collection units (three for OF and three for TF) was deployed within one forested experimental field site located in each of the four watershed regions of the NL-BELT (24 samplers in total) between 2015 and 2016. Additionally, between one and three total-deposition samplers were located at each of the four field sites (Table 1, Fig. S10). The watersheds span 5.5° latitude from the southernmost site, Grand Codroy (GC), through the colocated Pynn's Brook (PB) and Humber River Camp 10 (HR) sites to Salmon River (SR), the highest-latitude site on the island of Newfoundland. The northernmost forested watershed, Eagle River (ER), is located in southern Labrador, and extensive details characterizing each of the four sites can be found in Ziegler et al. (2017). All sampling locations are far from anthropogenic pollutant point sources, except for the ubiquitous presence of marine sea spray from the nearby marine coastlines. The total-deposition samplers were identical to the automatic collection units except that they were not fitted with a motor arm and lid, so they did not require a source of power. Three of the six automated samplers were deployed in the open at a distance from the forest stand equal to or greater than the height of the trees, in line with CAPMoN and NADP guidelines. The other three automated samplers were placed under the canopy to collect TF precipitation within the forest sites. These samplers actively collected wet deposition into integrated monthly (Newfoundland) or 2-month (Labrador) samples during snow-free periods (approximately June through November). The arrays were collected and stored during the winter months, while the total-deposition samplers remained in field locations year-round. It is also important to note that during the growing season, sample collections were made at the same time – that is, OF and TF deposition were collected on a single day at each sampling site and within a few days of each other across the transect. Collected sample volumes were compared between the automated samplers and total-deposition collectors for each collection interval as a check on proper function (i.e., less than or equal volumes in automated samples). During each site visit, the slope of the sensor was confirmed to be correct, sample containers were collected and replaced with clean units, the battery and desiccant packs were replaced with fully recharged devices, and the entire array was confirmed as being operational.
Table 1NL-BELT sampling site details (locations and identifiers) alongside data from long-term weather stations operated by Environment and Climate Change Canada (ECCC). Soil pH was determined from samples collected at the same time as precipitation. Mean annual temperature (MAT) was derived from ECCC climate normals. Annual total-deposition precipitation volumes were either measured for the 2015–2016 period (ECCC, this work) or calculated by the Oak Ridge National Lab DAYMET archive.
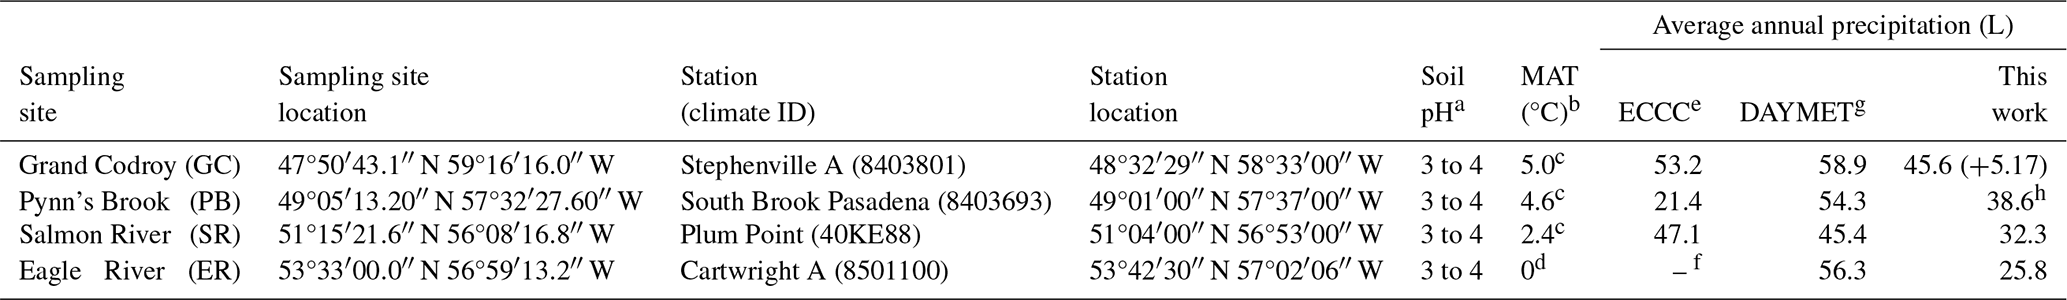
a Soil pH for the organic and mineral soil horizons, determined by the addition of 400 µL of aqueous 0.5 M CaCl2 to a 50:50 w/w slurry of dried soil in deionized water. Note: the four remote NL-BELT sites are dominated by balsam fir trees underlain by Humo-Ferric Podzol soil with a pH ranging between 3.0 and 4.5. b Environment Canada (2023). c At least 20 years of measurements. d The World Meteorological Organization's “3 and 5 rule” (i.e., no more than three consecutive and no more than a total of five missing for either temperature or precipitation). e Annual precipitation averages were determined using ECCC daily precipitation reports. f The large quantity of missing data for this location from January 2015 to December 2016 prevents any reliable estimate. g Estimated deposition rates were converted to volumes using DAYMET (Thornton et al., 1997, 2021, 2022). h Volumes were merged for 2015 and 2016 at PB and HR.
Sample preservation
Four of the six sample containers (two each for OF and TF) were biologically sterilized using 1 mL of a saturated aqueous solution of mercuric chloride (HgCl2) to preserve against biological growth and the loss of bioavailable nutrients over the collection periods. Unsterilized sample containers (without HgCl2) were used for measurements of recalcitrant species and to assess any matrix effects exerted on target analyte quantitation. The use of HgCl2 as a sample preservation technique is long-studied and well-established (Kirkwood, 1992; Kattner, 1999); thus, additional tests to verify the preservation of collected chemical species over time were not performed. The analysis of deposition collected in unsterilized and sterilized containers, however, serves as a method for internal sample validation – as does our evaluation of measurement outcomes in comparison to those reported within the literature. Collected sample volumes were measured with a 1000±10 mL graduated cylinder, and aliquots were collected for chemical analysis via transfer to precleaned 500 or 1000 mL HDPE containers (Nalgene, VWR International). Samples were stored at 4 °C before returning to the laboratory, where they were filtered with a 1000 mL Nalgene vacuum filtration system (P/N ZA-06730-53, ThermoFisher Scientific, Waltham, MA), fitted with 0.45 µm polyethersulfone (PES) filters (P/N HPWP 04700, EMD Millipore), to remove suspended solids. Filtered samples were transferred to new clean HDPE containers and stored for up to 2 months at 4 °C in a cold room until analysis. The target analytes in this work are non-volatile, and the described sample collection methods consider this property of the analytes as well as their interactions with container materials. The versatility of the system design allows for the use of different collection materials, keeper solvents for volatile organics, etc., so that the experimental design can be analyte specific, depending on the end-user needs. Sample preservation approaches should thus be identified by users of this new platform based on their scientific objectives and a review of the literature (Galloway and Likens, 1978; Peden et al., 1986; Dossett and Bowersox, 1999; Wetherbee et al., 2010). In addition to the internal validation approach described here, we aim to demonstrate that the precipitation samplers in this work are suitable for measuring conductive deposition on- and off-grid. Below, we highlight autonomous off-grid operations, determine the fraction of conductive rainfall collected from the total volume of precipitation, and validate our measurements through comparison to the literature.
2.4 Cleaning and preparation of sample containers
All sample collection and storage containers for the quantitative analysis of target analytes, as well as all sample handling apparatuses, were made of HDPE or polypropylene. Prior to use in handling samples, these were all acid washed in 10 % v/v HCl (P/N BDH7417-1, VWR International), followed by six sequential rinses with distilled water and 10 rinses with 18.2 MΩ cm deionized water (DIW; EMD Millipore Corporation, Billerica, MA, USA). Containers were dried by inversion on a clean benchtop protector overnight or with protection from dust using lint-free lab wipes over container openings when necessary. Field and method blanks were collected through the addition of DIW to cleaned containers, and/or sample handling devices, in order to quantify appropriate method detection limits and to identify any sources of systematic or random contamination. Blank subtraction was applied to measurements where appropriate.
2.5 Measurements of pH and conductivity
The pH and conductivity of each sample were determined using a Thermo Scientific™ Orion Versa Star meter (ORIVSTAR52) interfaced with a pH electrode (model: 8157BNUMD, Ultra pH/ATC triode, ROSS) and a four-electrode conductivity cell (model: 013005MD, DuraProbe, ROSS). Prior to use, the probes were calibrated daily with standard solutions specific for these probes (Thermo Scientific™ Orion™ conductivity standard 1413 and pH 4, 7, and 10 buffers) and then stored between analyses according to the manufacturer's directions. Aliquots of 15 mL of precipitation from archived samples were subsampled into 40 mL polypropylene Falcon tubes. This was followed by the immersion of a cleaned electrode for the conductivity measurement. Next, a pH probe measurement was performed to prevent conductivity bias due to potassium chloride migration across the glass frit of the pH probe. Readings were recorded once the signals had stabilized. The datasets can be found in Colussi et al. (2024).
2.6 Measurements of dissolved organic carbon (DOC)
Measurements of DOC were performed by catalytic combustion of samples in a platinum-bead-packed quartz furnace at 720 °C to quantitatively produce CO2, followed by non-dispersive infrared absorption spectrophotometry using a Shimadzu total organic carbon (model: TOC-V) analyzer and an autosampler (model: ASI-V). The cleaning of materials prior to DOC determination followed the same procedure as for the sample containers. Precipitation aliquots of at least 12 mL were transferred to clean and combusted (500 °C, 5 h) 40 mL borosilicate glass vials and then capped and stored at 4 °C until analysis. Prior to analysis, the vial caps were replaced with cleaned polytetrafluoroethylene-lined septa. Inorganic dissolved carbon (e.g., H2CO3) was purged from samples by acidification to pH 2 with HPLC-grade H3PO4 (20 % ) and bubbling with an inert carrier gas. Samples were analyzed in triplicate and quantified using calibrations spanning from 0.1 to 10 or from 10 to 100 ppm (mg C L−1) with potassium hydrogen phthalate (KHP), depending on the relative sample concentration range. Accuracy and precision were assessed using 1 and 10 ppm KHP check standards analyzed every 10 injections, respectively. Calibrations were performed at the beginning of every analysis day. The dataset can be found in Colussi et al. (2024).
In addition to the general design advantages, in the section that follows, we present the results for various physical and chemical parameters to validate this new open-source custom-built modular system. The power consumption and snow-free performance testing are used to demonstrate the off-grid capabilities of these samplers, as are the 2-year datasets. The lower power requirements are compared to existing commercial samplers and paired with solar top-up to prolong the use of the batteries and reduce the need to replace them on timescales shorter than the planned sampling duration (i.e., < 1 month). We then evaluate the automated wet-deposition volumes (the dilution of which during atmospheric washout events is prevented by the samplers) in comparison to the total volumes collected from colocated samplers to depict the fractionation by volume as a function of time. We also investigate the advantages of replicates collected across the four watersheds using deployments of triplicate samplers under field conditions. The ratio of collected TF to OF replicates highlights the ability of these samplers to capture the dynamic nature of precipitation interacting with forest canopies. Simple pH and conductivity measurements are then used as benchmarks to situate the NL-BELT data within the established literature to emphasize the robust operation of the samplers and the impact of the selective sampling. Fluxes of DOC are also interrogated across all four sampling sites as we demonstrate the potential of these samplers to make measurements of more complex analyte pools that are of current interest to the atmospheric measurement community.
3.1 General design advantages
While several precipitation collectors have been similarly developed to address specific scientific objectives – e.g., the quantitation of dust in wet and dry deposition (Laurent et al., 2015; Brahney et al., 2020) and the determination of ions and DOC in a tropical rainforest (Germer et al., 2007) and urban environments (Audoux et al., 2023) – we present a more general design for modular adaptability here. When compared to other precipitation collection apparatuses, the automated precipitation sampler developed in this work has several advantages. Most notable is the ability to collect integrated samples at remote locations by exploiting its off-grid capabilities. Our approach also maximizes the sensitivity of the rain sensor as long as electrolytes remain in the water reaching it. The chute ensures that even if the precipitation contains ultra-trace analyte quantities, it is still collected and quantified for an extended period when high-purity water may be deposited during an atmospheric washout event. The chute does this by accumulating, between rain events, water-soluble materials that require time to be completely washed off and through the release of ions from the material itself, which ages under environmental conditions. As the conductivity of the precipitation falls below the sensor threshold – conductive precipitation being that which initially contains high solute levels that progress through trace-level concentrations – the added ions from the chute prolong the collection of rain past this time point. In rainfall events where extended atmospheric washout occurs, i.e., where precipitation becomes ultrapure water, the sampler lids will eventually close, preventing the dilution of the sample while maintaining the collection of analytes of interest. A recent study has found that rainfall events could exhibit variability and that the lower atmosphere can be supplied with aerosols due to specific sources, atmospheric dynamics, and meteorological conditions (Audoux et al., 2023). If this occurs, the automated lid will reopen to sample the polluted air masses. In application to trace pollutants, this also reduces the methodological sample preparation time, as it decreases the extent to which additional handling steps, like solid-phase extraction, are required prior to analytical determinations.
The six replicate measurements used in each array provide a means of assessing sampling reproducibility (e.g., canopy TF has expected heterogeneity) and allows for multiple analyte classes to be targeted. Various analytes with different chemical properties and/or contamination considerations can be targeted by changing the materials used for the components that encounter the sample (i.e., lids, funnels, and sample holding containers). Replicate collection can also allow for selective sample preservation when quantifying deposited chemical species that may be reactive, volatile, or biologically transformed. The modularity of the overall system design also allows the collection units to be dismantled entirely and easily reassembled on-site, minimizing logistical issues and costs for transport to remote regions. Lastly, these collection units are cost-effective. We were able to produce four arrays, each consisting of six collection units, at a fraction of the cost of a single equivalent commercial off-grid automated precipitation sampling unit.
With the majority of commercial precipitation samplers requiring a source of electricity, on-grid sample collection necessitates high infrastructure costs and/or the positioning of samplers closer than desired to point sources of anthropogenic pollution. As a result, especially in remote locations, site selection becomes heavily restricted and expensive when factoring in all the standard criteria, particularly with respect to the need for an easily accessible power source. Thus, the off-grid capabilities of our samplers lend dexterity to these systems and make deposition sampling that follows standard siting guidelines, like those of CAPMoN or NADP but without power, more accessible to the global atmospheric research community (Vet et al., 2014). To further highlight and validate their capabilities, a series of fundamental performance parameters were collected and are discussed in detail in the sections that follow.
3.2 Power consumption and performance testing
3.2.1 Power consumption of the instrumental setup
The simplicity of the automated precipitation samplers allows for low power consumption during operation, which is particularly important for off-grid operation. The motors operating and rain sensor heating during active precipitation are the most energy-intensive elements of the system (Table 2). The integrated contribution of the motor over a month-long sampling period is, however, negligible compared to other components since it is operational for short periods of 5 to 10 s, with a current usage of only 38 mA. The continuous need to provide 5 VDC to the digital logic via a step-down from 12 VDC is actually the component of the setup that consumes the most power in the absence of rain. When the samplers are in the closed position, under rain-free conditions, the power consumption of the entire array is 4.66 watts (W) and 2.86 W for transformed 115 VAC and battery 12 VDC supplies, respectively. The provision of 12 VDC to the board with a transformer for the 115 VAC application results in greater total power requirements. These values increase to 10.00 and 5.04 W with the detection of a conductive liquid on the precipitation sensor, as the sensor surface is heated to capture the active period of the event. Based on the measured power consumption, a fully charged 103 Ah AGM battery would provide at most 447 h (or 18 d) in standby mode under rain-free conditions and 294 h (or 12 d) if the heated surface of the sensor is in continuous use (Table 2). The lower range limit is unlikely since the sensor only operates for the duration of a rain event, after which the battery is available for solar top-up again. In the fieldwork conducted here, battery life was extended through the addition of 40 W solar panels to the systems. The entire array was confirmed to be operational at the end of monthly (SR, PB, and GC) and 2-month (ER) integrated sampling periods on an ongoing basis, prior to exchange with a new fully charged battery, for 2 years.
Table 2Measured voltage, current, and power consumption of the rain sensor and circuitry in both the idle and maximally operational states when connected to a 12 VDC battery or transformed 115 VAC. Total power demand was measured for wet and dry sensor scenarios.
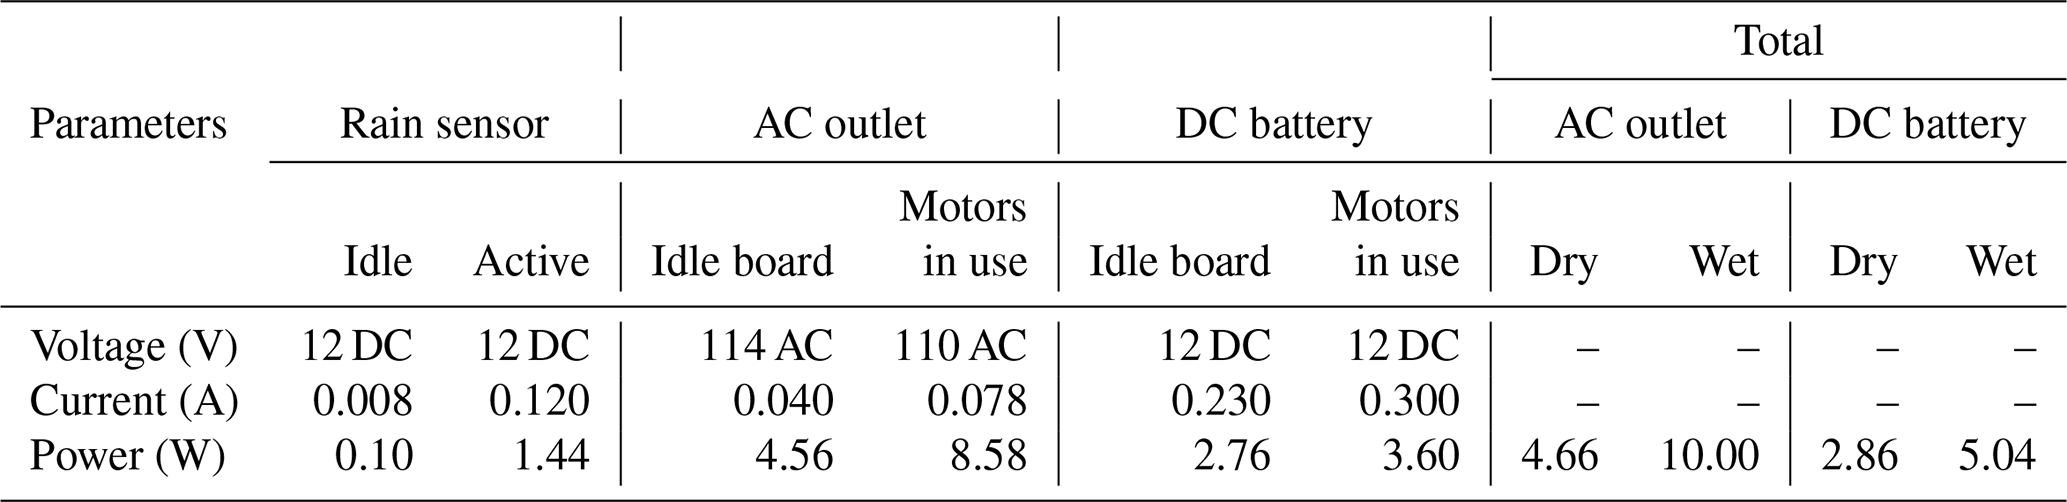
In comparison to two commercial samplers used by national monitoring networks, the power requirements of our new samplers are substantially lower. The first commercial sampler we reviewed draws a maximum of 2 A, with a ceramic heater housed within the sampler case that draws 0.8 A constantly, resulting in an upper-limit power demand of 230 W (at 115 VAC) and a lower limit of 92 W. The commercial sampler can be upgraded to utilize a thermostated space heater for winter operation, drawing an additional 4.2 A (480 W) and resulting in a maximum power demand of about 800 W when using a 115 VAC power supply. The second commercial precipitation sampler we reviewed is used by national monitoring networks and draws approximately 5 A, resulting in a power requirement of 575 W at 115 VAC. The commercial and standard precipitation samplers for deposition monitoring programs have much higher power requirements compared to those presented in this work. The commercial samplers utilize 80 to 100 times more power. With their lower power requirements, the new automated samplers prove to be advantageous in both on- and off-grid sampling yet are disadvantaged in being unable to collect snow in the winter.
3.2.2 Precipitation sampler performance tests and data logging
In addition to low power consumption during precipitation sampling, a supplied battery can obtain constant power renewal when outfitted with a solar top-up that is kept exposed to sunlight by proper orientation. At the NL-BELT, adjustments were made for this during sample collection at each site visit. During the solar top-up tests discussed below, the voltages of the sensor and batteries were consistently monitored. Over a test period of 22 d, no appreciable decline in battery performance of a 76 Ah unit was observed despite the detection of more than 10 rain events during that period (Fig. 3a).
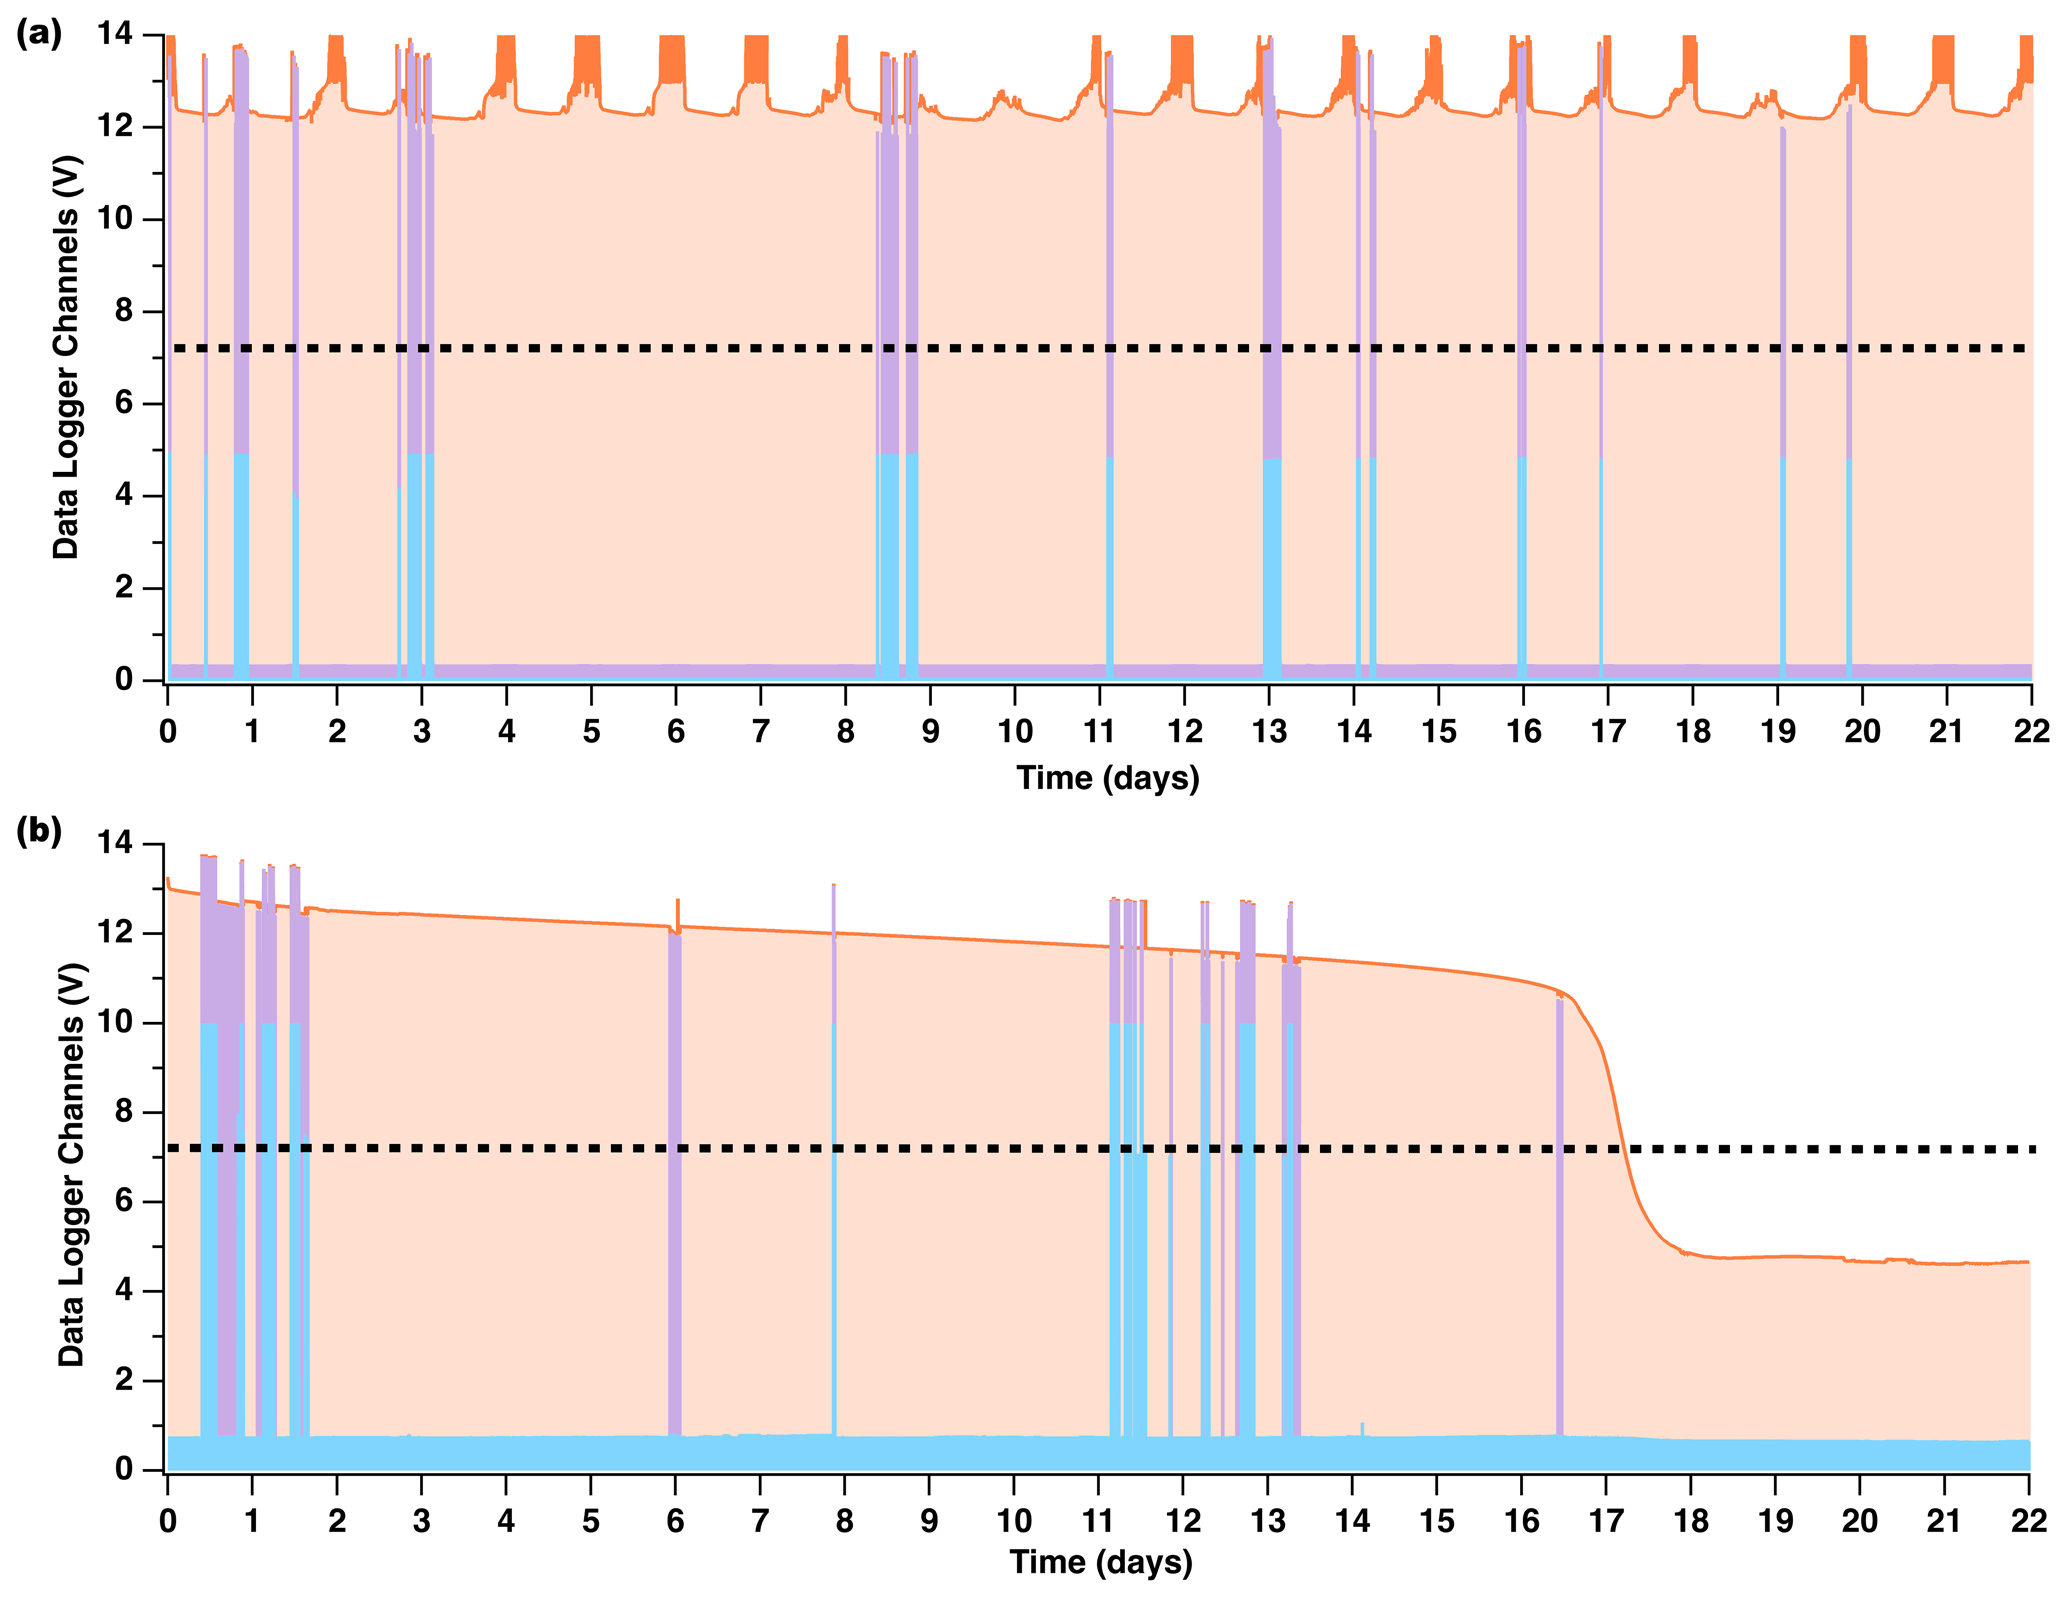
Figure 3Performance of off-grid precipitation samplers during sample collections (a) from 13 July to 7 August 2018 (when using a 76 Ah battery and a solar-panel top-up) and (b) from 22 January to 13 February 2019 (when using a 103 Ah battery and no solar panel). Battery voltage (shaded orange) is elevated above 12 VDC when charging, or it decreases over time when no solar panel is used and precipitation is sensed and collected. The 12 VDC rain sensor relay signal (purple) and the open sampling-lid switch voltage (blue) indicate active periods of detected precipitation. The dashed black line indicates the 60 % efficiency cutoff, 7.2 V, at which the battery should be recharged.
In comparison, winter sampling with these devices is not recommended without substantial investment in a sufficient power density provided by high-performance cold-weather batteries. The lack of sunlight during winter at higher latitudes also negates the use of an effective small-scale solar top-up. Our tests show that when the samplers were deployed without a solar backup under snow-free winter conditions (temperatures ranging from −17.8 to 7 °C), with a 103 Ah battery, the off-grid system only lasted for 17 d. At this point, the larger-capacity battery was fully depleted by frequent snow and rainfall – probably due to the heated precipitation sensor requiring additional energy to phase-change snow and ice to water and then to evaporate that water. This depletion occurred despite the battery being housed in an insulated enclosure during the test. In addition, on days 6 and 16, the precipitation sensor relay was activated but the lid did not rotate to the open position (Fig. 3b, blue trace). This could have been because the precipitation event was not intense enough for the lid to open fully and trigger the 5 V lid open switch or because of snow and ice buildup around the lids, resulting in them being unable to physically open. Overall, it may be possible to deploy these samplers during the winter if line power can be supplied. Such a deployment would further necessitate that the sampling funnel be heated (in addition to the sensor chute) to prevent snow and ice accumulation and render a liquid sample for collection in the jugs. A heated funnel would also prevent snow or ice accumulation on top of the automated lids. Together, such power-hungry requirements for winter operation exceed simple off-grid use with a battery package that is easily transported into and out of remote field sites.
3.3 Comparison of sample collection volumes
The automated samplers were colocated with total-deposition samplers and deployed across the experimental forests of four NL-BELT regions during the 2015 and 2016 growing seasons to observe deposition trends. In addition, we compare these observations to the long-term climate normals reported by ECCC and the estimated deposition at 1 km × 1 km resolution from the DAYMET reanalysis model (Table 1, Sect. S2). Three automated samplers were deployed in the open to collect incident precipitation (OF), and another three were deployed under the experimental forest site canopy (TF). The mean OF volumes of triplicate measurements from south to north were 1.42, 1.38, 1.31, and 0.79 L, whereas the corresponding TF volumes were generally similar in magnitude at 0.96, 0.98, 1.02, and 1.13 L, for the 2015–16 sampling period (Fig. 4). It is evident that the volume of precipitation decreased as the latitude increased for OF samples, whereas the opposite relationship was observed in TF samplers, although the absolute volumes are more comparable in magnitude. The total-deposition volumes collected were as expected; they decreased from south to north in agreement with the expectations from the long-term normals and were comparable to the estimates from the DAYMET model (Table 1), where the largest integrated volume of precipitation was collected at the lowest latitude (GC) and a lower amount was collected at the highest latitude (ER), with the intermediate sites (HR and PB) having the lowest inputs overall during this observation period. Total annual deposition volumes collected by our deployed samplers from south to north in 2015 were 39.5, 39.4, 31.9, and 17.5 L, while in 2016 they were 51.7, 37.8, 32.8, and 34.2 L. The total deposition volume collected from HR was used for comparison to automated sample volumes collected at PB in 2015, as both sites share the same watershed. This approach had to be taken, as the HR site was initially planned for full experimental use before becoming inaccessible in early 2015. The relative error between the two sites for samples collected in 2016 was ±15 % (24.6 L in PB and 32.2 L in HR), comparable to the reproducibility we observe for replicates collected within a given site (see below). The total-deposition samplers were installed in HR in late 2014, and the automated samplers were then set up at PB. Despite this, there is good agreement between the trends in deposition values predicted by DAYMET and the measured values, although the absolute amounts are systematically lower in all of our observations (Sect. S2). Regardless, by following the recommended siting criteria from the NADP and CAPMoN as best as possible, the very strong agreement of our temporal trends at both annual and monthly timescales with both comparators demonstrates the suitability of the total-deposition samplers and, therefore, the automated samplers for use in quantifying chemical species of atmospheric interest deposited into the experimental sites.
The wet-deposition volumes collected for the snow-free period using the automated precipitation samplers did not follow the trends in total deposition (Fig. 4) that might be expected (e.g., due to pollutant loading, rainfall quantity/rate, and scavenging processes). For the 2015 collection period from June through October, the summed volumes of OF precipitation from south to north across the NL-BELT were 25.4, 10.9, 20.4, and 2.2 L, while in 2016 they were 17.3, 30.4, 13.5, and 5.1 L. While the total and OF fractions would typically be much closer to unity in more-polluted regions, it would be expected that the differences in these remote NL-BELT field sites would be driven by complex non-linear processes that cannot be easily disentangled. Here we present three reasons as to why the measured OF wet deposition volumes do not follow the total-deposition trend across the transect. First, these samplers are designed specifically to collect only conductive precipitation (i.e., containing conductive atmospheric compounds), not total/bulk precipitation. As a result, the OF wet-deposition volume collected across the sites is mostly below 50 % of the total volume collected, while the TF volumes are similar in magnitude to or lower than the OF volumes (Fig. 4). The wet-deposition fraction collected was variable within and between regions; it was sometimes less than 10 % despite the large volumes collected in total, presumably due to the intense atmospheric washout that this region is well-known for. Second, the NL-BELT total-deposition trend estimated using the ECCC long-term climate normals represents a 30-year period (Bowering et al., 2022), while the automated volume measurements described here represent 2 years of targeted conductive-precipitation collection. The combined summed volumes of targeted conductive wet deposition across the 2015 and 2016 field seasons were 42.7, 41.3, 33.9, and 7.3 L, which somewhat better reflect the expected precipitation trends within the transect (Table 1). Lastly, our monthly automated wet-deposition sample collection periods occurred from June through November and so are temporally incomplete with respect to the substantial amount of precipitation volume deposited as snow during the winter (Table S3). The discrepancies between the long-term trends and our shorter-term observations therefore make sense, as they are sensitive to interannual changes in synoptic-scale transport and rainwater solute loadings, as exemplified by the volumes collected in SR in 2015 (Fig. 4b) and PB in 2016 (Fig. 4c). Overall, for the automated sampler observations on a per-year basis, there is no consistent trend between site latitude and the volume collected in either OF or TF. This is unsurprising, as they are dependent on the conditions that drive the rate of atmospheric washout and the presence of conductive solutes.
The automated OF wet-deposition volumes collected each year have peak values that range from 1 to 4 L, with an overall variability of ±33 % for any triplicate of samples across the entire dataset. Across our 33 sample collection periods, our replicate relative standard deviations (RSDs) follow a log-normal distribution where volume reproducibility is typically within ±12.5 % and almost always within ±31.5 % (Fig. S11). A few outliers with higher variability skew the overall view of volume precision. Out of 33 OF samples collected, 10 have RSDs greater than 40.5 %, with 2 of those 10 having RSDs greater than 100 %. Those values greater than 40.5 % had no systematic relationship with site or time of year. Wind speeds were considered as a possible source of variability. The prevailing winds over Atlantic Canada are known to be southwesterly in the summer – intensifying during the autumn months – and westerly to northwesterly in the winter (Bowyer, 1995; Jacob, 1999; Randall, 2015). Strong wind speeds (i.e., > 100 km h−1) could occur on an event basis during any time of the year and, thus, could contribute to the variability seen at each field site. Wind is known to generate bias in gauge-based precipitation measurements, as unshielded precipitation gauges can catch less than half of the amount caught by a shielded gauge (Colli et al., 2016). A more-reproducible windscreen design for obtaining rainfall rates – and, thus, volumes – could be considered in future deployments of our developed samplers, similar to recently reported innovations for smaller rainfall-rate devices (Kochendorfer et al., 2023). This would, however, increase costs and logistical considerations in deploying the developed devices, which currently operate synonymously to deposition systems employed by government monitoring programs. Our siting approach is consistent with those, which often deploy a single sampler without wind protection. Thus, by employing replicates, we are able to ascertain the environmental variability. In addition, the collection of replicate samples allows our observations to span a wider physical area, reducing the impact of confounding variables such as wind speed in comparison to a more typical sample size of 1 for many field collections. Imperfect siting and a lack of shielding is necessary where remote field sampling prevents the setting up of such infrastructure. As a result, the deployment of triplicate samplers provides researchers with a better opportunity to implement quality control, as they can reduce bias in the event of dynamic OF. While the effect of wind is reduced, additional factors can drive variability when the samplers are placed under a forest canopy for TF collection.
To demonstrate the canopy dynamics impacting interception volumes within the sampling sites, the ratio of throughfall to open fall (TF/OF) volumes was compared amongst our total pool of 31 samples. This group of samples encompassed the monthly average TF/OF values for each set of triplicate samplers, at all four sites, from 2015 to 2016. These measurements were then split into two separate populations – samples that have a TF/OF of less than 1 (n=24) and those that have a TF/OF of greater than 1 (n=7). The samplers were positioned identically between years, and no single sampler was reproducibly found in the second population. In the first population, the fraction collected was 56±21 % (ranging from 19 % to 88 %), likely due to the known processes of canopy and stem interception (Eaton et al., 1973; Howard et al., 2022). For example, in two young balsam fir–white birch mixed-forest stands, the amount of precipitation intercepted by the forest canopy in similar snow-free conditions was estimated to be 11±5 % (Hadiwijaya et al., 2021). In mature boreal forests, 9 % to 55 % of rainfall can be intercepted by the canopy (Pomeroy et al., 1999). Relevant to the deposition of atmospheric constituents, Pomeroy et al. (1999) also reported that up to 70% of intercepted rainfall may evaporate directly from the canopy, which can leave behind non-volatile rainfall solutes. Wet deposition that undergoes stemflow (SF) proceeds down the branches, stems, and/or trunks of a plant, transferring precipitation and nutrients from the canopy to the soil at the trunk or stem base (Ciruzzi and Loheide, 2021). These known mechanisms of canopy interception ultimately reduce the amount of precipitation reaching the ground as TF, thus explaining the smaller volumes found in our samplers compared to the OF measured simultaneously. In contrast, the fractions that ranged from 108 % to 424 %, averaging 186 %, demonstrate a different aspect of the highly dynamic nature of canopies, where they can sometimes intercept rainfall like an impermeable surface to act as a funnel, guiding large volumes of precipitation onto the ground or, in this case, into the TF samplers (Metzger et al., 2019).
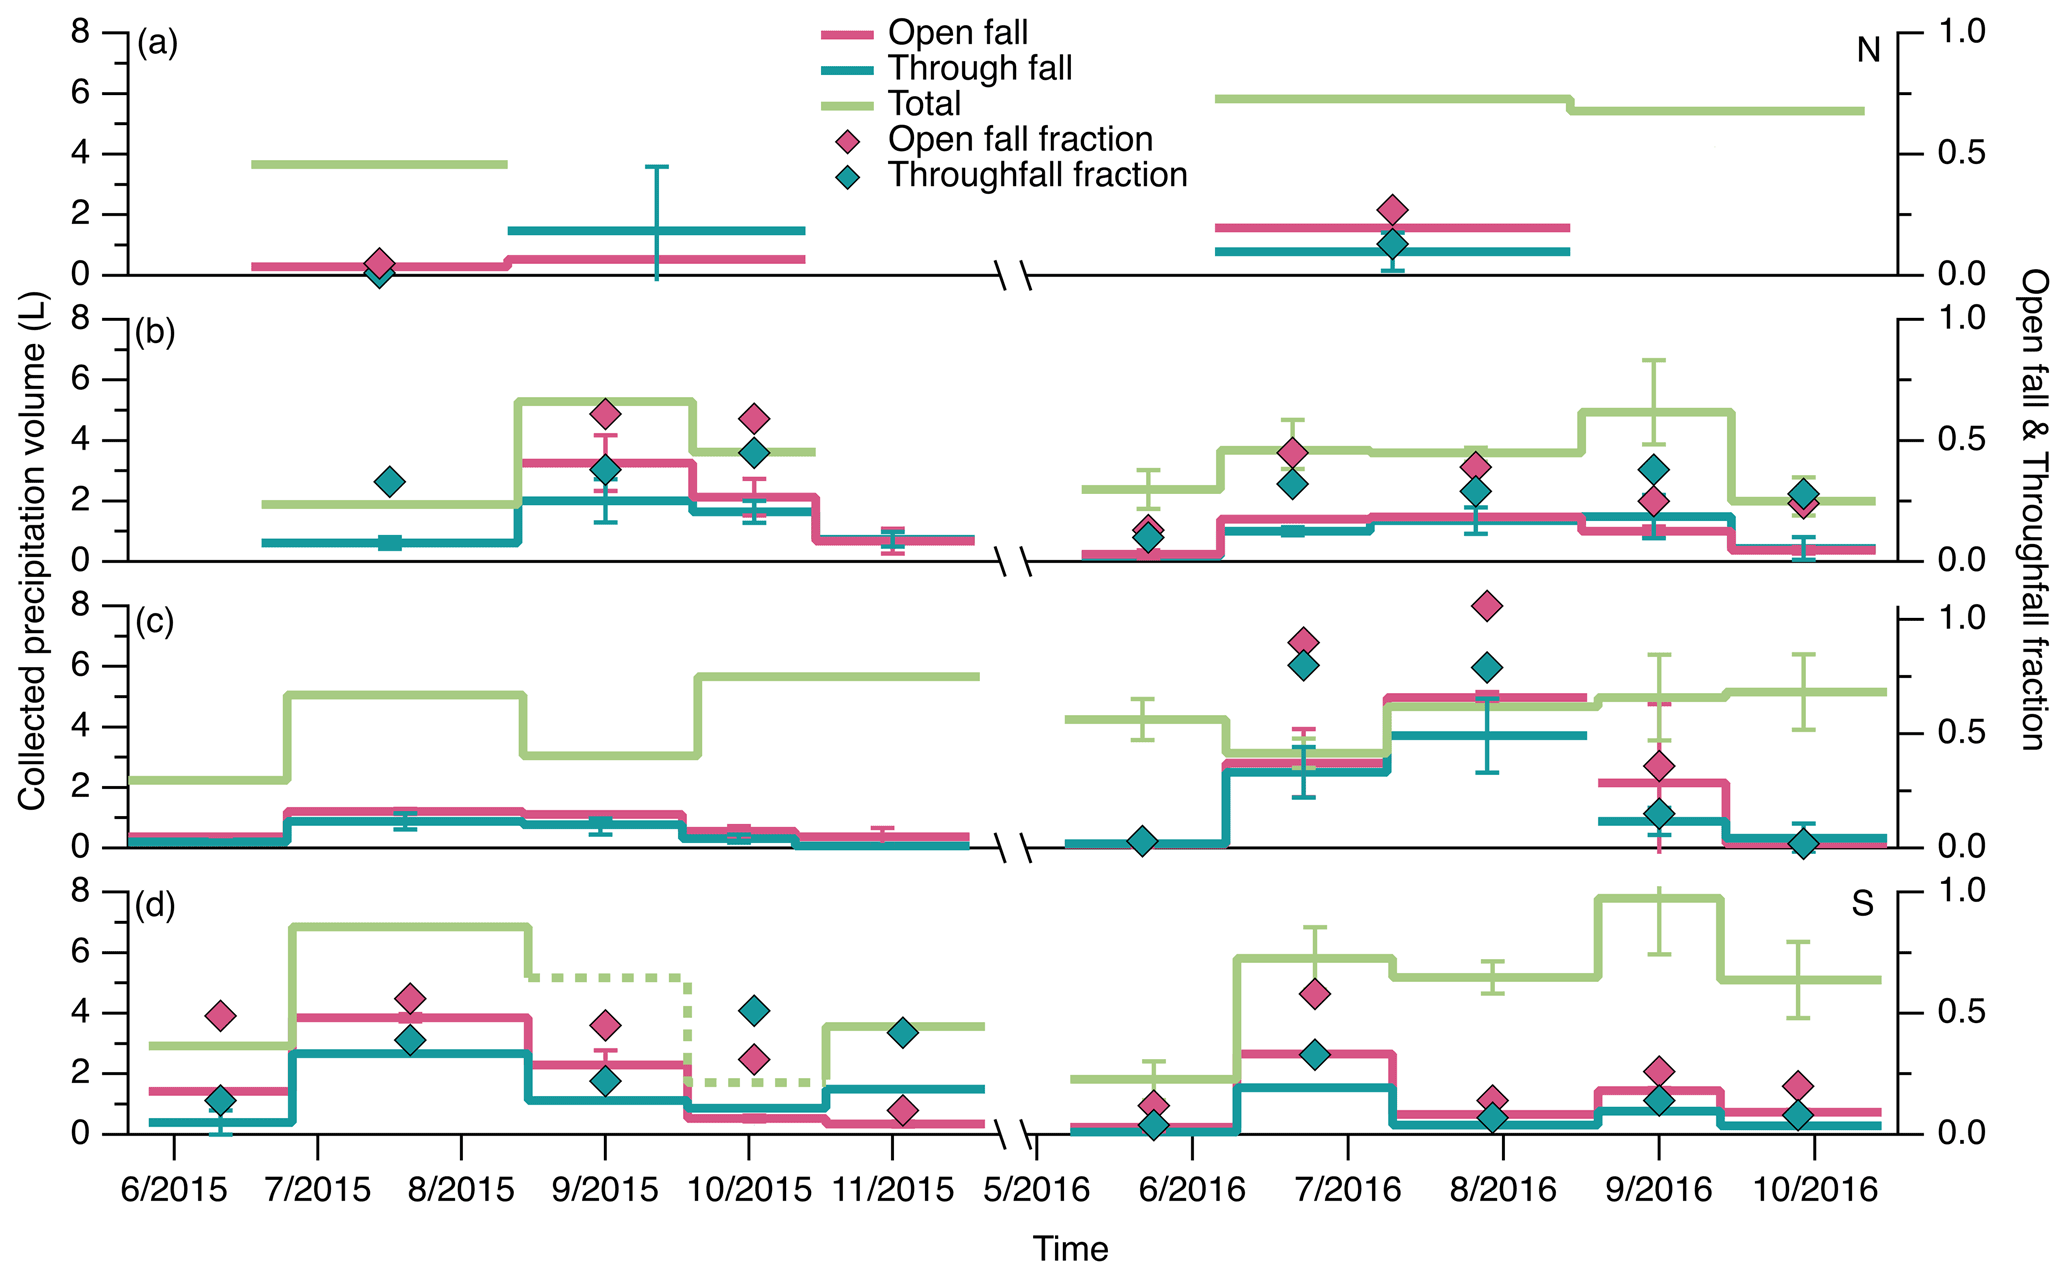
Figure 4Average volumes collected from replicate automated samplers deployed from June 2015 to October 2016 at the NL-BELT field sites (from north (N) to south (S)) (a) ER, (b) SR, (c) PB, and (d) GC. The red trace represents open fall, teal represents throughfall, and light green represents total deposition (the sum of conductive and non-conductive precipitation). The total-precipitation volumes depicted for PB from July 2015 to November 2015 were collected at the nearby HR site in the same watershed since no total-deposition measurements were in place at PB during this period. The missing volume for GC in 2015 was estimated from the linear relationship determined for ECCC stations and is presented as a broken line. The fraction of precipitation collected as open fall or throughfall, compared to the total deposition (right axis), is represented by diamonds of the corresponding colour. Error bars represent the standard deviation of three measurements from replicate samples. The axis break spans the winter months when the off-grid automated samplers were stored.
3.4 Characterizing chemical parameters from the NL-BELT
In addition to assessing physical parameters, chemical parameters were also evaluated in this work. Conductivity and pH are measurements commonly made on precipitation samples collected from the field, and so incorporating them into our analysis is useful for instrumental validation. Additionally, with increasing recognition of their importance as a proxy for ROC estimation and in biogeochemical carbon budget closure, DOC flux measurements were used to compare against a limited number of prior reports, each using different sampling or data interpretation strategies. These chemical measurements were also made in an underrepresented part of the world in terms of atmospheric deposition sampling and are useful additions to the overarching study of precipitation chemistry.
3.4.1 Precipitation pH
The deposition of atmospherically persistent pollutants and biogeochemically relevant species onto the Earth's surface, or even NO and SO historically, can affect the environmental health of soil, air, and water. The pH range of natural rainwater in equilibrium with atmospheric CO2 is expected to be between 5.0 to 5.6, so acid rain is defined by values lower than this (Han et al., 2019). Traditionally, the extent of acidity depended on the intercepted atmospheric concentrations of HNO3 and H2SO4. In any case, monitoring acidity and deposition is especially relevant in remote regions, where major uncertainties and gaps in deposition measurements and global ion concentrations exist (Escarré et al., 1999; Vet et al., 2014). A change in pH can modify the chemical states of many pollutants, altering their transport, bioavailability, and solubility (Guinotte and Fabry, 2008). For example, this can increase the exposure and toxicity of metals and nutrients in marine habitats, which can go undetected for longer periods in remote areas.
Most TF samples were observed to have slightly higher pH values than those from OF, which had pH values ranging from 4.14 to 5.71 (Fig. 5, Table 1). The TF precipitation pH, on average, ranged from 4.74 to 5.99, with rare exceptions falling outside of that range (e.g., in July and September 2015 at PB, the pH was 3.69 and 4.26, respectively, and in July 2015 at GC, the pH was 4.12). Excluding these exceptions, there are no major variations observed spatially between the four sites or temporally between seasons or years (Fig. 5). The pH values reported at each of the NL-BELT field sites are comparable to recent OF measurements made at CAPMoN sites in Nova Scotia and Newfoundland and Labrador, where the reported pH of precipitation ranged from 4.44 to 5.19 (Houle et al., 2022). The more-basic TF overall is expected, as it has been found that up to 90 % of the H3O+ in precipitation can be absorbed by leaves while it passes through the canopy (Cappellato et al., 1993). Foliar leaching, the release of ions from leaves, has been commonly reported for base cations such as Mg2+, K+, and Ca2+, while being minimally observed for other ions such as Cl− and SO (Carlson et al., 2003). Mechanisms for foliar leaching include the passive cation exchange of H3O+ with, for example, cells in the interior of the leaf (Burkhardt and Drechsel, 1997). Additionally, alkaline dust deposited on the leaves of the canopy can decrease the acidity of TF precipitation. Such dust can accumulate on leaf surfaces as a result of anthropogenic (i.e., industrial processes) or natural (i.e., wind erosion) sources (Csavina et al., 2012), so that precipitation passing through the canopy can interact with it (e.g., CaCO3), thus neutralizing acidic species and increasing the TF pH observed in our automated samplers.
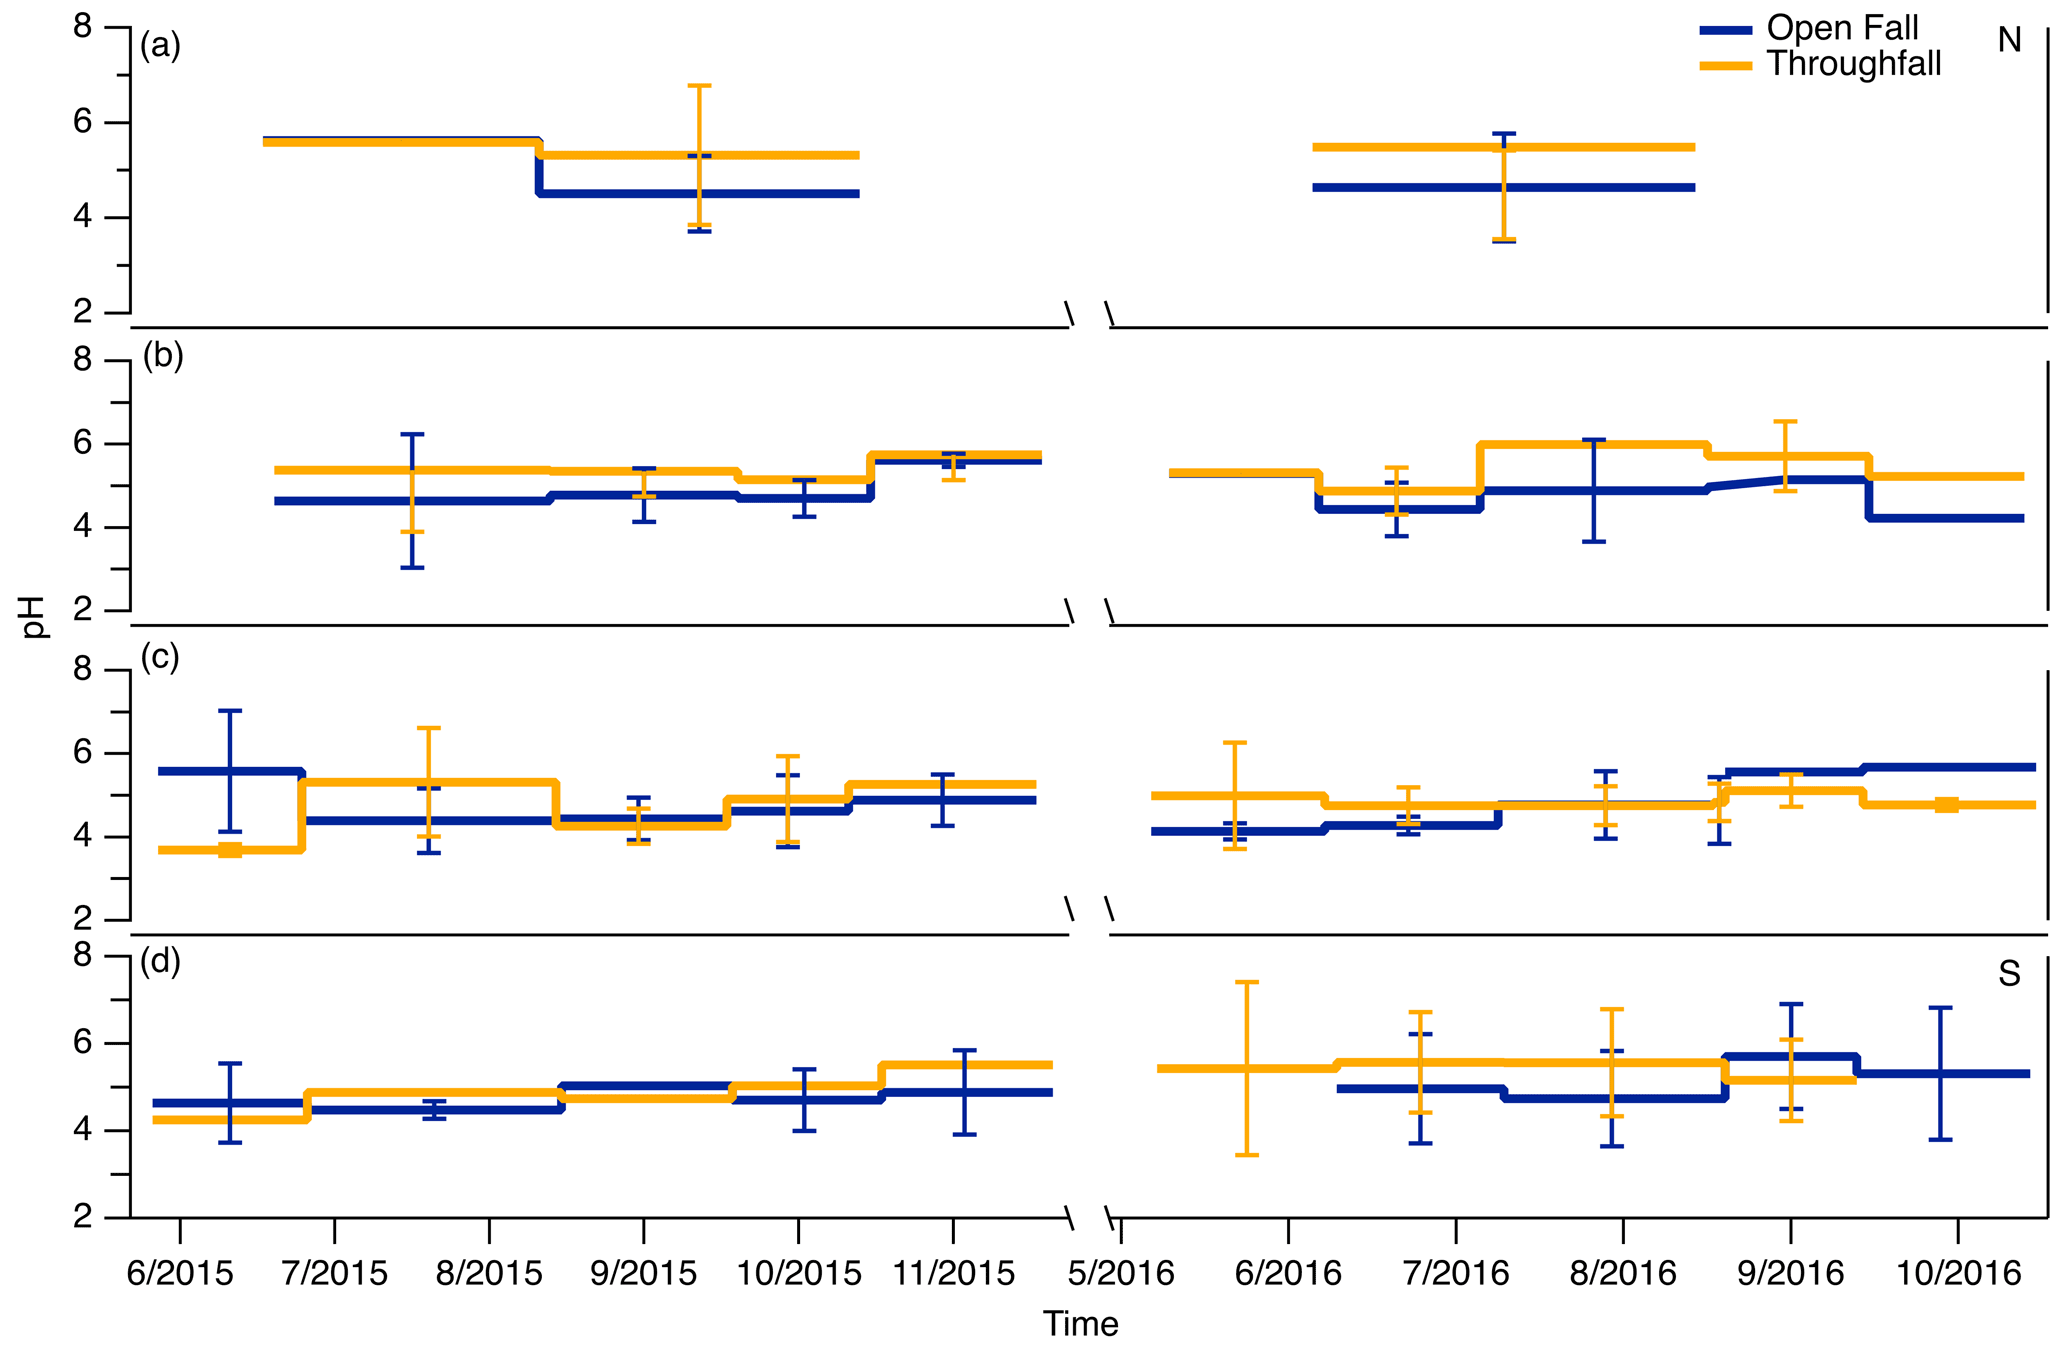
Figure 5Average pH values from replicate samples collected at the NL-BELT field sites (from north (N) to south (S)) (a) ER, (b) SR, (c) PB, and (d) GC from June 2015 to August 2016. Open fall collections are represented using a solid blue trace, whereas the orange trace is the pH of the precipitation collected as throughfall under the balsam fir canopy.
The pH of the collected precipitation appears to be similar in both TF and OF as a function of time despite the potential for foliar leaching and dust dissolution in the canopy. The same chemical components may be setting the pH, as these measurements do not vary much seasonally, geographically, or temporally. As pH is a long-studied measurement, its purpose in this work was to validate the sample quality obtained from our described collection approach rather than drive any scientific objective. Nevertheless, while the NL-BELT measurements demonstrate a recovery compared to rainwater pH in 1980s eastern North America prior to NOx and SO2 regulation (pH from 4.1 to 5.0; Barrie and Hales, 1984), the present-day pH remains lower than expected for natural rainwater (∼ 5.6; Boyd, 2020). Keeping in mind the successful environmental policies limiting SO2 and NOx, which have led to considerable decreases in atmospheric concentrations of H2SO4 and HNO3, a modern view on the trajectory of continental US cloud water composition and pH has recently been reported (Lawrence et al., 2023). Across the US and eastern Canada, measurements of anion molar charge equivalents have been lower than those of cations, with a potential explanation being an increase in the presence of weak organic acids, which commonly have pKa values near to 4 (Feng et al., 2021), an outcome we have also observed in aerosol sample chemical compositions from Atlantic Canada (Di Lorenzo et al., 2018). With the frequency of acid rain of pH < 5 decreasing over the past 20 years, these recently reported measurements depict that the deposition composition is shifting away from a “linear” chemical regime dominated by H3O+ and SO towards a “non-linear” regime designated by low acidity, moderate to high conductivity, potentially weak acid–base buffer systems, and increasing base cation and TOC concentrations (Lawrence et al., 2023). It would seem that the evolving chemical contributors to global rainwater pH remain an open line of investigation.
3.4.2 Precipitation conductivity
In all the OF and TF precipitation samples collected across all four NL-BELT sites, the average measured conductivity values ranged from 21 to 166 µS cm−1 and followed no apparent seasonal or temporal trend (Fig. 6). Additionally, the conductivities of both OF and TF also appear to vary across the field sites – only within the 2016 TF samples does the conductivity appear to increase with decreasing latitude. Yet, with the typical conductivity of surface and drinking waters being between 1 to 1000 µS cm−1 (Lin et al., 2017) and typically below 200 µS cm−1 in stream water measurements within the watersheds of each of the NL-BELT sites, our observations are comparable and fall within the expected range. Our field blanks – encompassing a variety of materials and apparatuses and our cleaning procedures – routinely produced conductivities of 9±5 µS cm−1. The conductivity of saturated HgCl2 in water (at 0.1 % vol/vol) was 13.6±0.4 µS cm−1, which is also comparable to but statistically higher than our field blanks (p=0.0015; unpaired t test) and less than what was observed for our samples ( for each site considered separately and also across all sites; unpaired t test). Even with this background correction applied, the conductivity values presented here are expected to be similar to or higher than what would typically be found in rainwater (4 to 150 µS cm−1; Beverland et al., 1997), as the rain sensor deliberately selects for precipitation containing ionic chemical components with a conductivity greater than 1.0 µS cm−1 while excluding pure water during atmospheric washout, which would dilute the dissolved solutes in the wet-deposition sample and lower the resulting conductivity values. The overall comparability between our range and those previously reported, where the lower limit is slightly higher in our dataset, demonstrates that the principle of operation of our instrument is robust. It decisively collects precipitation with the property of conductance, indicating the presence of dissolved ionic solutes of interest in relation to atmospheric chemical processes.
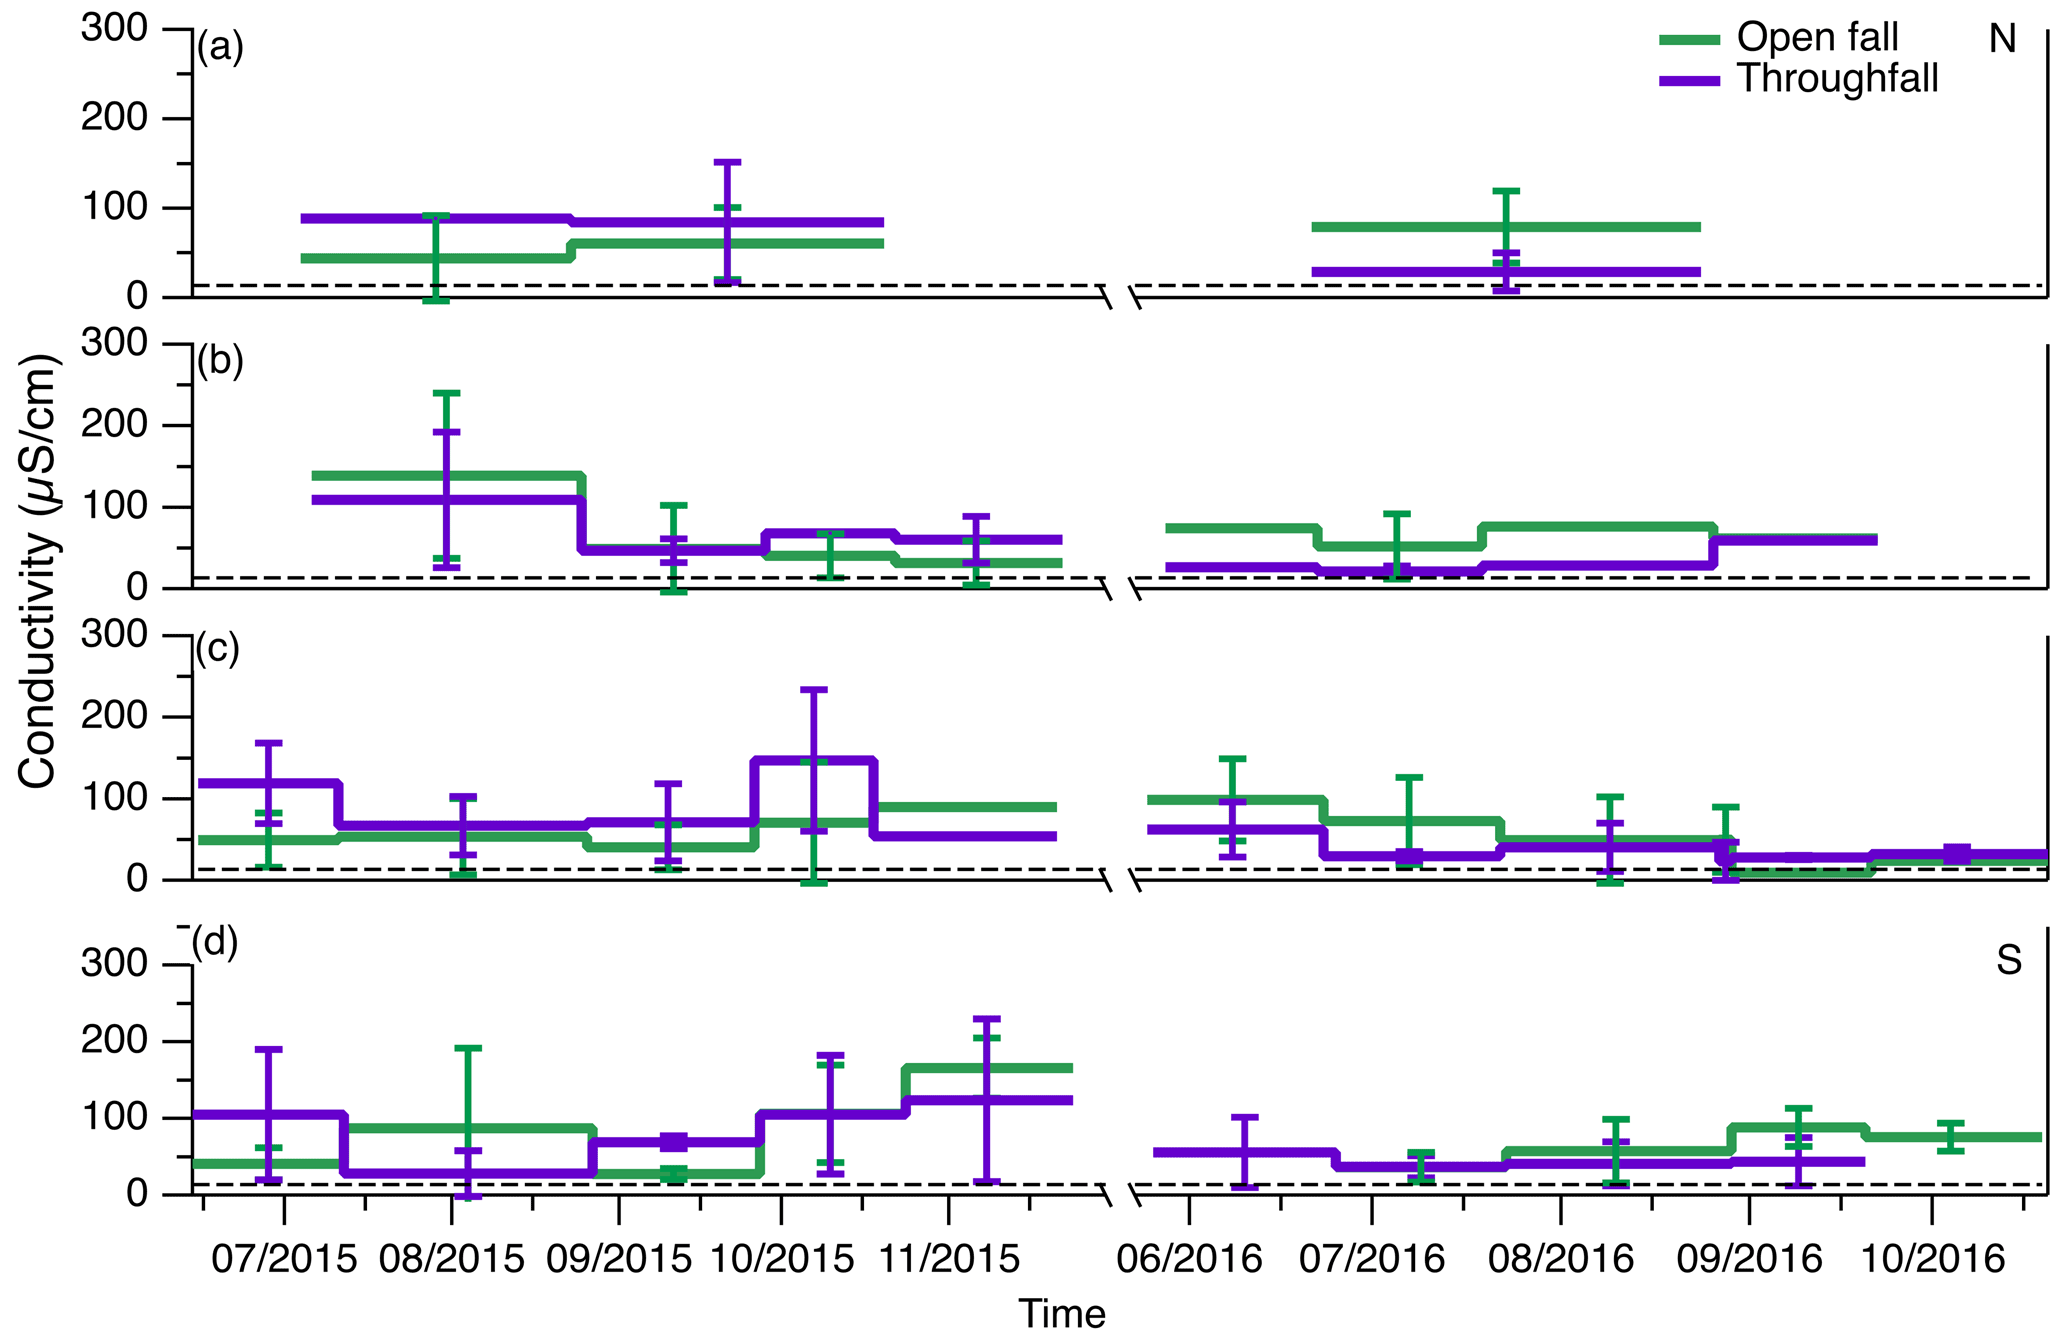
Figure 6Average conductivities measured from replicate automated samplers at the NL-BELT field sites (from north (N) to south (S)) (a) ER, (b) SR, (c) PB, and (d) GC from June 2015 to October 2016. The green trace represents open fall samplers, whereas the purple trace represents throughfall samples. The error bar represents the standard deviation between replicate measurements. The dashed black line represents the upper threshold of conductivity (13.6 µS cm−1), which arises when saturated aqueous HgCl2 is added to microbially sterilize samples. Note that all samples have conductivities equivalent to or higher than 13.6 µS cm−1.
3.4.3 Wet deposition of dissolved organic carbon (DOC) at the NL-BELT
The concentration of DOC in OF and TF precipitation across all four sites ranged from 3 to 46 mg L−1 and from 5 to 65 mg L−1, with averages of 16±10 mg L−1 and 22±12 mg L−1, respectively (Table 3). Concentrations are influenced by the volume collected and are not useful when discerning deposition trends and/or mechanisms. The concentrations were converted to elemental fluxes using the volume of precipitation collected, the area of the funnel, and the number of sampling days in each sampling period (Fig. 7). The total flux for each sample period was summed and reported as an equivalent annual flux in the following units: mg m−2 a−1. Annual fluxes ranged from 600 to 4200 mg C m−2 a−1 across the study sites for the snow-free period (Table S4).
The TF DOC fluxes were enhanced compared to the corresponding OF samples, as precipitation was intercepted by the forest canopy, with fluxes being higher in TF samples by 600, 400, and 400 mg C m−2 a−1 at GC, SR, and ER, respectively (Table S5). The accumulation of water-soluble organics on forest canopies, which increases the DOC detected in TF, could originate in part from organic carbon-containing compounds that age through oxidation reactions in the atmosphere, which increases their water solubility and propensity for surface interactions. In periods without substantial rain, these oxidized organics deposit effectively onto the high surface area of forest canopies, contributing to the elevated DOC measured in TF. Additionally, non-volatile organics left behind from evaporated precipitation intercepted by the canopy could also contribute. Conversely, other mechanisms within the forest could result in the enhanced DOC in TF. Recently, Cha et al. (2023) utilized a mass balance approach to determine whether DOC deposition is driven by canopy leaching (i.e., soluble tree resin, leaf exudates, internal tissues, and microbes) or the dissolution in rainwater of dry-deposited gases and PM 2.5 on plant foliage. It was found that canopy leaching is the major contributor to TF DOC, accounting for ∼ 83 % of the throughfall DOC, whereas PM2.5 and rainwater only accounted for ∼ 3 % and 14 %, respectively, while dry-deposited gases were not considered. This suggests that internal cycling of DOC within the forest could be an important source of DOC at the throughfall–soil interface (Cha et al., 2023). It is possible that a similar mechanism may be responsible for the elevated levels of DOC in TF at the NL-BELT sites, but we cannot explicitly distinguish between internal cycling versus external deposition in the current study.
A notable exception was observed at PB, where the DOC fluxes in the open fall sample were enhanced by up to 1800 mg C m−2 a−1 when compared to the TF in 2016. This may be attributed to a difference in forest type within this NL-BELT region, with black spruce (Picea mariana) being present instead of balsam fir (Bowering et al., 2023). Some studies have suggested that forest type could be a major factor affecting DOC variability (Arisci et al., 2012; Sleutel et al., 2009). Specific differences in canopy height, leaf area index, canopy structure, and the shapes of leaves and needles could drive DOC differences between forest types (Smith, 1981; Erisman and Draaijers, 2003; Sleutel et al., 2009). The elevated levels in the OF samples relative to TF within PB are consistent with the idea of uptake in the canopy, while the enhanced TF at the rest of the sites makes it more difficult to observationally constrain canopy uptake and/or leaching processes in the internal cycling of DOC.
Episodic events, such as polluted air masses from wildfires, could also result in an elevated deposition of DOC. It is estimated that ∼ 116–385 Tg C a−1 is produced globally due to the incomplete combustion of biomass during landscape fires (Santín et al., 2016; Coward et al., 2022). Several studies have associated enhanced DOC levels with wildfires (Gao et al., 2003; Moore, 2003; Wonaschütz et al., 2011; Myers-Pigg et al., 2015). More recently, Coward et al. (2022) measured the DOC in Pacific surface waters along the California coastline and observed 100 % to 400 % increases in DOC concentration when compared to pre-wildfire conditions. It is possible that a similar biomass-burning plume that underwent atmospheric washout could be responsible for the enhancement in the observed DOC at the NL-BELT, which overlies a background more typical of seasonal oxidation of biogenic DOC. This also coincides with the seasonal variability observed in OF samples from the same summer when elevated levels of DOC were measured. For instance, the DOC deposition at PB for August 2016 was 4800 mg C m−2, whereas the total deposition for the same year was 7800 mg C m−2 a−1. This single period accounts for 62 % of the total DOC deposition at this site. This underscores the pivotal role that episodic transport may play in influencing the dynamics of DOC deposition, particularly in a warming future when wildfires are more prevalent.
The deposition trend observed in the current study also highlights the complexity of the various drivers of atmospheric ROC, with more DOC being present in TF versus OF during some months, whereas occasionally the opposite is observed. Generally, we observed similar fluxes in both samples – suggesting that the amount of deposited carbon is comparable. Although the volume of precipitation captured in TF samplers is generally lower when compared to the corresponding OF samplers, the deposition flux of DOC is greater in TF samplers. With the enhanced DOC in TF samples, the values reported here could be an underestimation of the amount of carbon reaching the forest floor during precipitation events due to competing processes within the canopy. One such process is stemflow (SF), where a fraction of the precipitation intercepted by the forest canopy is funnelled over the bark of the tree surface to the base of the tree stem (Oka et al., 2021). Although SF was not measured in the current study, several studies have demonstrated that DOC concentrations are enhanced in SF when compared to the corresponding TF and bulk precipitation samples (Stubbins et al., 2017; Van Stan and Stubbins, 2018; Ryan et al., 2021). Additionally, we cannot rule out that the chemical speciation differs between OF, TF, and SF, even if the DOC values are similar, but such insights require more selective instrumentation for chemical analysis (e.g., high-resolution mass spectrometry).
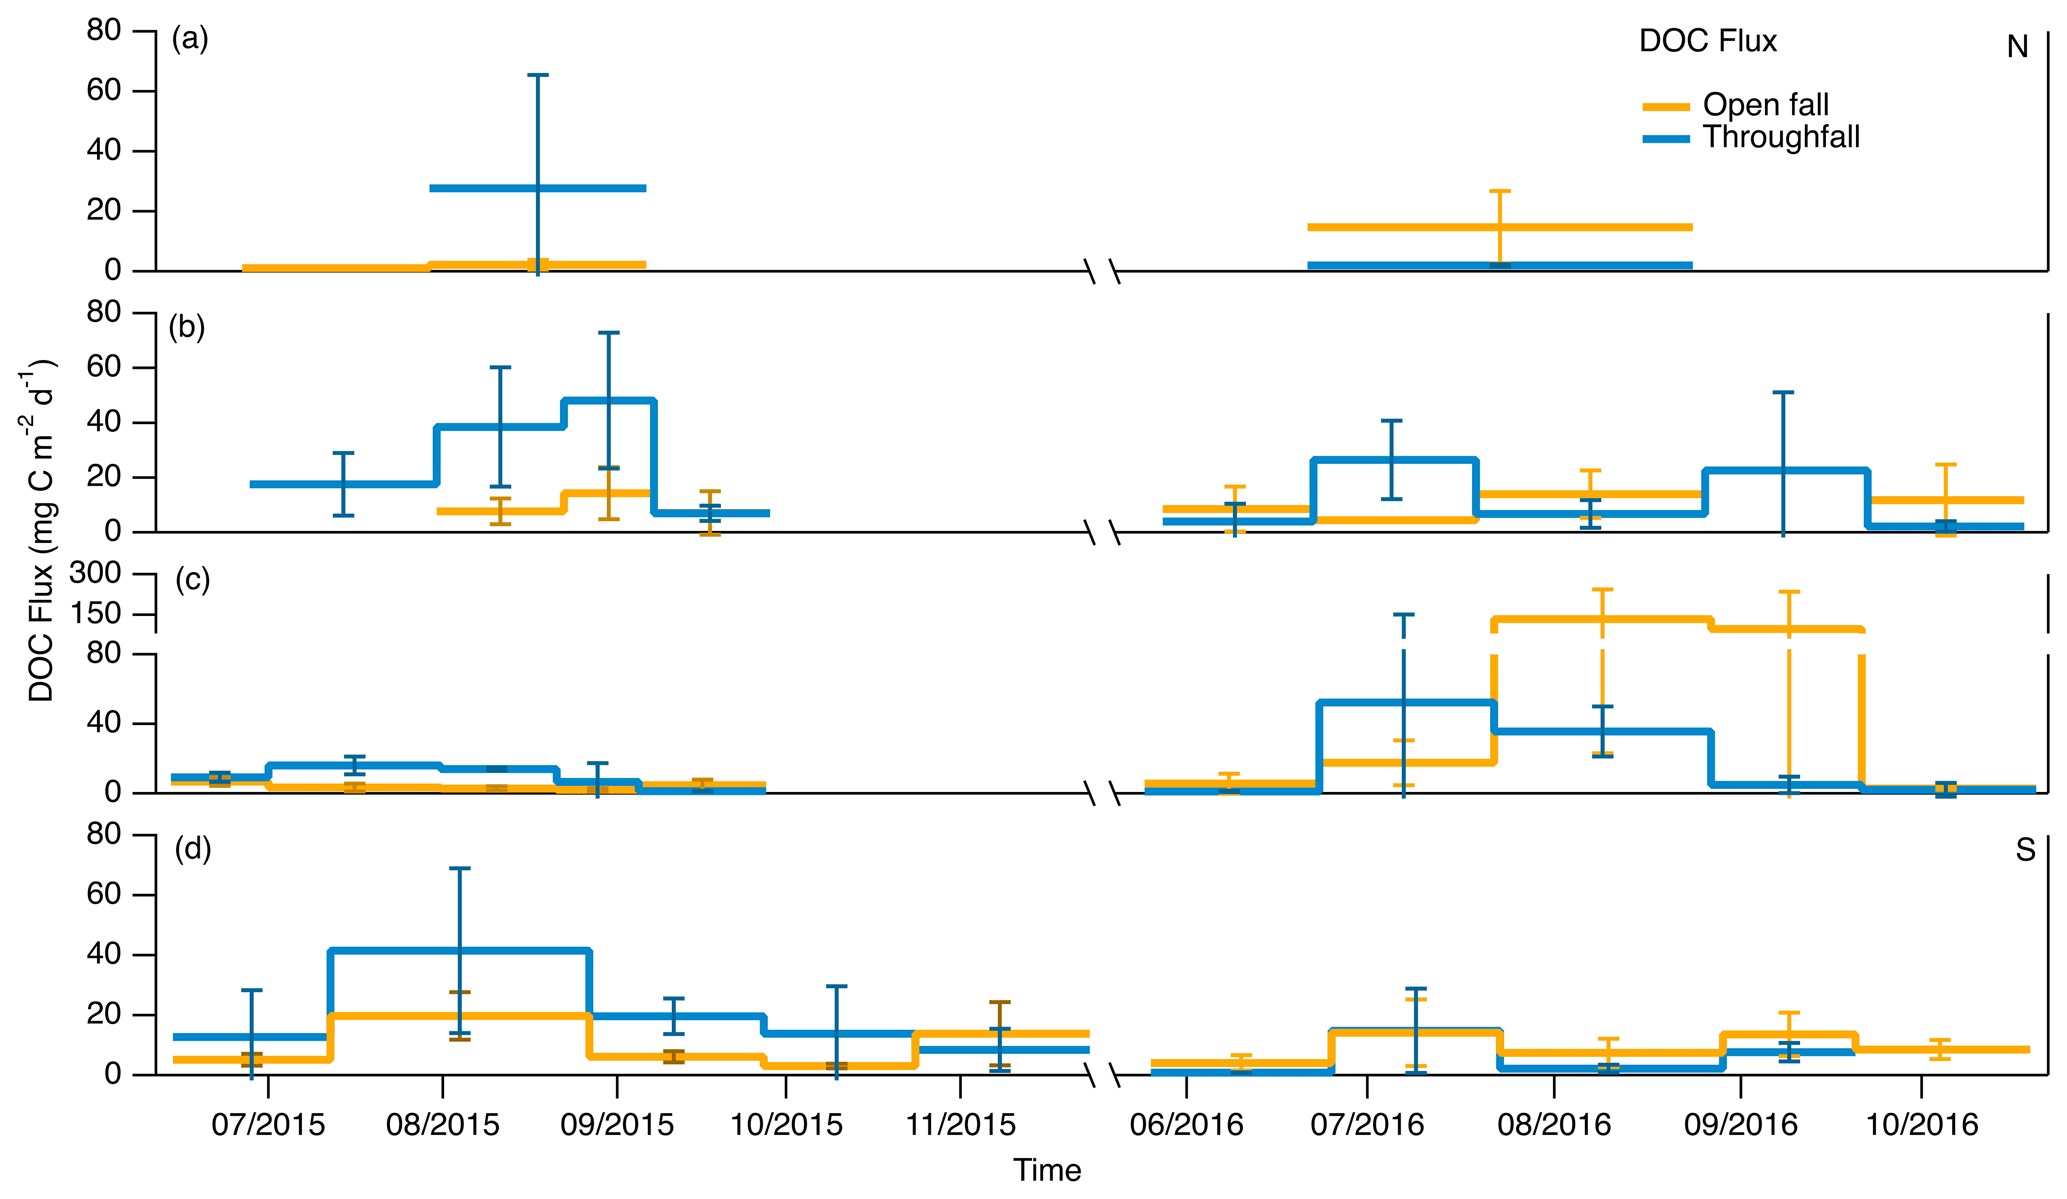
Figure 7Average DOC fluxes (mg m−2 d−1) in replicate samples collected at the NL-BELT field sites (ranging from north (N) to south (S)) (a) ER, (b) SR, (c) PB, and (d) GC from June 2015 to August 2016. The yellow trace represents samplers that were placed in the open without any obstruction, whereas the blue trace represents samplers that were placed under the canopy. Error bars represent the standard deviation of three measurements from three independent samples.
The ability to accurately determine DOC in OF and TF precipitation demonstrates the capability of the automated deposition samplers. To validate our measurements, we compared our observed fluxes to other studies in different forest types. Mean annual DOC fluxes were generally similar to those reported in some other boreal forests (Table 3). These include results from stands in Finland that consisted mainly of Scots pine (Pinus sylvestris L.) (mean OF 2.32; TF 4.35 g C m−2 a−1; Pumpanen et al., 2014) as well as stands in Mont St. Hilaire, Québec (mean OF 0.49; TF 2.05 g C m−2 a−1; Dalva and Moore, 1991), which also consisted of a variety of tree species, such as yellow birch (Betula allenghanien), red maple (Acer rubrum), and sugar maple (Acer saccharum). Conversely, the annual fluxes were orders of magnitude lower than measurements (23 to 48 g C m−2 a−1)) made at the University of Georgia in a forest (with a subtropical climate) consisting mainly of southern live oak (Quercus virginiana Mill.) and eastern red cedar (Juniperus virginiana L.) and which occasionally hosts dense epiphytes (Van Stan et al., 2017). This highlights the potential variability to expect when measuring DOC in different forest systems, as the annual DOC fluxes vary depending on factors such as climate, tree species composition, and environmental conditions.
These results underscore the pivotal role that off-grid custom-built automated deposition samplers can play in advancing scientific research, particularly in precipitation monitoring and analysis. The automated system enabled long-term continuous sample collection in remote locations, which was previously challenging to achieve due to the need for frequent human intervention and the resources required to regularly access these experimental forest stands. These samplers also allowed us to compare DOC through replicate measurements in TF and OF samples, which sheds light on the potentially different DOC deposition chemistries within the NL-BELT region. The automated system better maintains the integrity of DOC in the samples. This was achieved by following standard procedures for biogeochemical sample preservation (i.e., adding HgCl2); Argentino et al., 2023), employing a rigorous cleaning procedure, and using a design that prevents against the intrusion of forest litter, which could result in a positive bias for DOC in the collected precipitation. The use of replicates also results in more robust scientific conclusions and broader applicability of the results, and they can be obtained for a fraction of the cost of a commercial equivalent, highlighting the contribution that these automated systems are capable of when applied to current precipitation monitoring. As a result, these samplers show promise in the quantification of biogeochemical and anthropogenic chemical species of interest, which will be visited in future works drawing from the samples presented in this dataset and others obtained since but are beyond the scope of this paper, which is to demonstrate the performance of this new instrumentation.
Table 3Concentrations (mg C L−1) and annual fluxes (g C m−2 a−1) of DOC in precipitation (P), open fall (OF), throughfall (TF), and stemflow (SF) collected at forested sites. When volumes were not available in the other studies, it was not possible to calculate fluxes. The values reported in the current study are the estimated DOC fluxes for the wet-deposition sampling period (∼ June through October) for each year and therefore represent the lower limit of DOC deposition, as the dataset excludes snow.
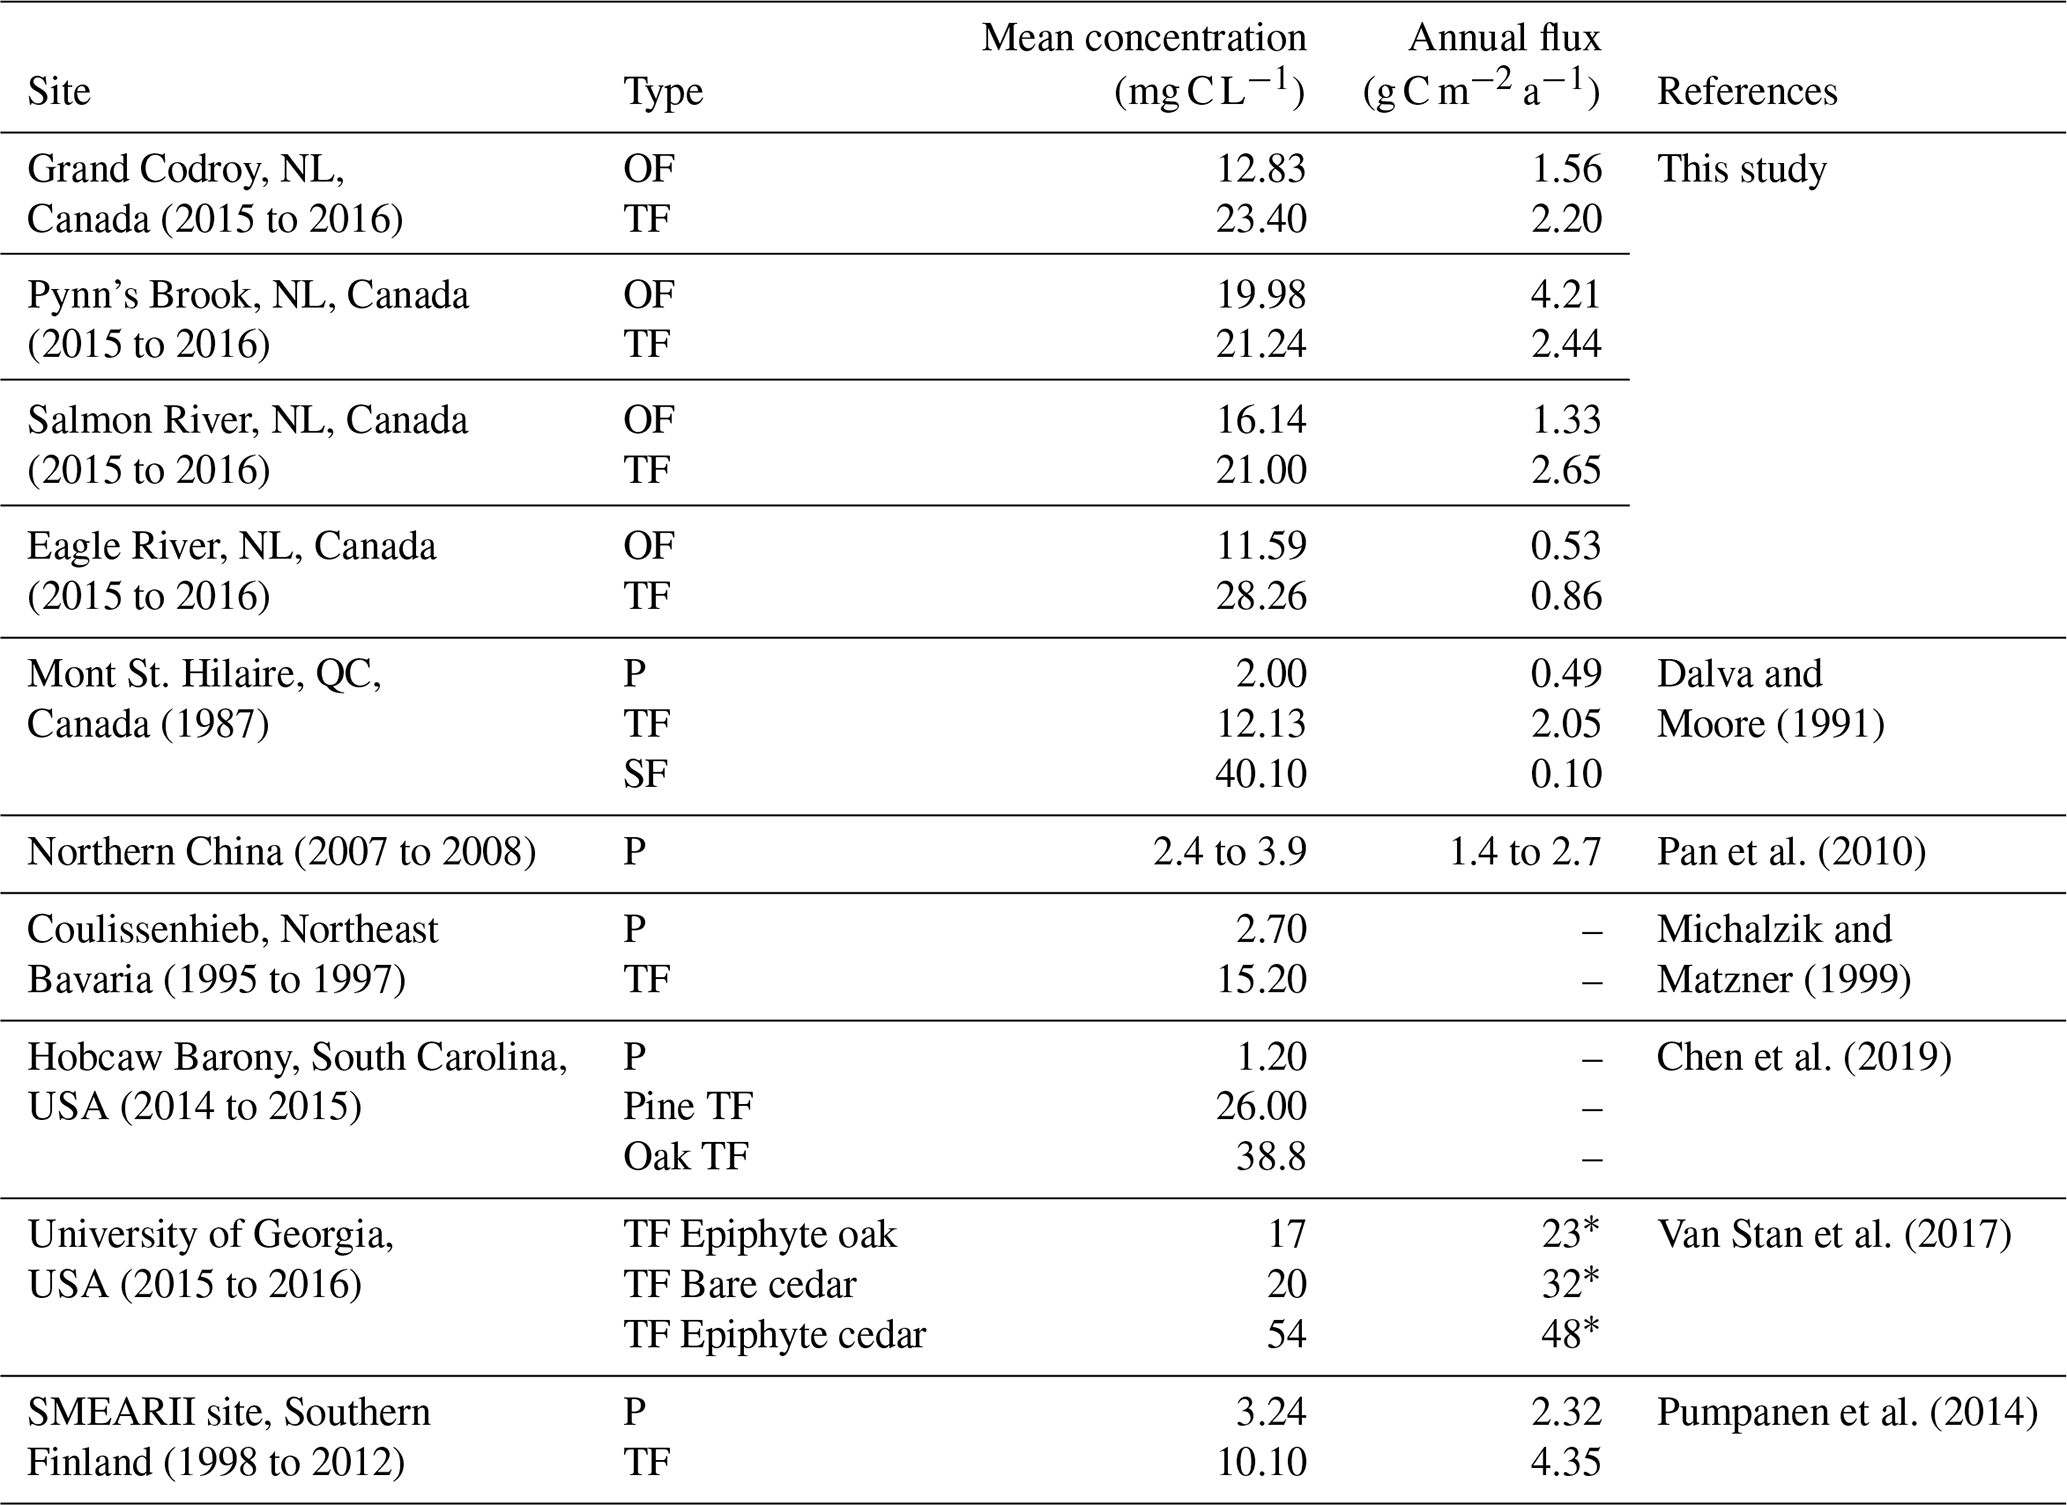
∗ Estimated DOC yield for 2016 (g C m−2 a−1), where sampled storm values (g C event−1) were scaled to an annual deposition value using meteorological data and a linear rainfall–DOC yield relationship.
This paper presents a cost-effective automated deposition sampler for the continuous collection of precipitation. An open-source procedure and schematics for building these samplers are provided alongside the rationale for selecting the materials in the current study to target analytes of scientific interest in wet-deposition samples. These low-power systems are demonstrated as being capable of continuous off-grid use for sample collection over 2 years at the NL-BELT experimental sites with monthly or bimonthly replacement of battery power packs, with their on-grid performance also provided for comparison. The resulting systems enhance the accessibility of automated wet-deposition samplers to scientists globally, and this work highlights their robust performance in collecting and preserving rainwater conductivity and pH alongside providing measurements of DOC from this understudied region, which build a broader picture of the atmosphere–surface exchange of this biogeochemical pool across the NL-BELT. The comparability and complementariness of our results to well-established and current measurements of interest like DOC demonstrate their efficacy and potential application to the study of processes such as canopy–precipitation interactions through the collection of open fall and throughfall replicates. The capacity to autonomously collect wet deposition in addition to traditional bulk deposition samples can shed light on competing wet and dry deposition processes. Should the on-grid capacity suit scientific objectives, it is anticipated that these samplers could be used year-round when paired with more power-intensive strategies to facilitate solid-to-liquid phase transfer for precipitation detected and collected in the winter.
For the broader deposition-motivated community, the instrument design also allows for easy and cost-effective modification of the number of replicate samplers, the material composition of all the surfaces the aqueous samples interact with, and preservation strategies – depending on the analyte of interest. For example, the lack of organic nitrogen measurements within universally established sampling and measurement procedures serves as a general example of the substantial knowledge gaps that may result when translating limited datasets to the wider global picture. This includes incomplete speciation and quantification across precipitation, aerosol, and gas phases. Monitoring systems that support US deposition assessments (e.g., the NADP) only characterize the inorganic fraction of wet deposition. Additionally, modern emerging issues that require the continuation of existing deposition measurements or the expansion of observation programs revolve around identifying and quantifying compound classes of concern, such as persistent organic pollutants. As reported in the literature, the deposition of these types of pollutants (e.g., polychlorinated biphenyls and polycyclic aromatic hydrocarbons) can be monitored using suitable collectors made of amber-coloured glass or stainless steel (Fingler et al., 1994; Amodio et al., 2014) – modifications which can be applied to the sample design detailed here. The samples collected in this work from this new instrumentation are expected to be used further in several upcoming complementary and novel environmental monitoring studies. Not only will this future work extend our biogeochemical analysis, but it will also assist in our study of the transport of other anthropogenic pollutants of emerging interest which are beyond the scope of describing this new platform.
The sampler performance and precipitation property measurements (pH, conductivity, and DOC) can be found in Colussi et al. (2024; https://doi.org/10.20383/103.0945). The data are available from the corresponding author (Trevor C. VandenBoer) on request.
The supplement related to this article is available online at: https://doi.org/10.5194/amt-17-3697-2024-supplement.
AC, DP, and ML performed the data analysis. AC and DP wrote the manuscript with contributions from all authors. Sampler design and construction were led by TV, with assistance from BP and RH for the initial prototypes, DP and ML for the revised iteration, and AC for the final modular control boards. Sample collection and associated characterization measurements were performed by BP and TV. The sampling experiments were conceptualized and conducted by TV, CY, KE, and SZ. All authors were involved in examining and reviewing the results. All authors were involved in editing the paper.
The contact author has declared that none of the authors has any competing interests.
Publisher’s note: Copernicus Publications remains neutral with regard to jurisdictional claims made in the text, published maps, institutional affiliations, or any other geographical representation in this paper. While Copernicus Publications makes every effort to include appropriate place names, the final responsibility lies with the authors.
Funding for this work was provided by the Harris Centre at Memorial University. Trevor C. VandenBoer was supported for this work in part through a Government of Canada Banting Postdoctoral Fellowship. Fieldwork sample collection by Bryan K. Place was supported by funding from Polar Knowledge Canada through the Northern Scientific Training Program. Additional financial support for a full redesign of the samplers was provided through Environment and Climate Change Canada Grants & Contributions. Alessia A. Colussi acknowledges support for this work through a Natural Sciences and Engineering Research Council of Canada (NSERC) Graduate Scholarship – Master's (CGSM) program and an Ontario Graduate Scholarship (OGS). Melodie Lao acknowledges support for this work through an NSERC Undergraduate Student Research Award (USRA). We thank Courtney M. Laprise and Christine R. Conlan for aiding in the collection and organization of samples for analysis, supported in part by the Memorial University Career Experience Program (MUCEP) and Venita Sitahal through a York University Dean's Undergraduate Research Award (DURA). Trevor C. VandenBoer, Cora J. Young, and Susan E. Ziegler were supported through the NSERC Discovery and Strategic Partnerships programs. The authors would also like to thank Brian Hearn, Darrell Harris, Andrea Skinner, Catie Young, John J. MacInnis, Jamie Warren, and Ligia Faria Tavares De Souza for their invaluable assistance in sampling-site access and setup, off-season storage of collection units, sample collection and analysis, and meteorological reanalysis. We thank Hayley Hung and Chubashini Shunthirasingham for productive discussions on modular design and considerations for the collection of persistent pollutants.
This research has been supported by the Natural Sciences and Engineering Research Council of Canada (grant nos. RGPIN-2020-06166, RGPIN-2018-05990, RGPIN-2018-05383, and 479224), the Environment and Climate Change Canada (grant no. GCXE20S009), and the Newfoundland and Labrador Department of Agrifoods and Forestry, Centre for Forestry Science and Innovation (project 221269).
This paper was edited by Mingjin Tang and reviewed by two anonymous referees.
Amodio, M., Catino, S., Dambruoso, P. R., de Gennaro, G., Di Gilio, A., Giungato, P., Laiola, E., Marzocca, A., Mazzone, A., Sardaro, A., and Tutino, M.: Atmospheric Deposition: Sampling Procedures, Analytical Methods, and Main Recent Findings from the Scientific Literature, Adv. Meteorol., 2014, 161730, https://doi.org/10.1155/2014/161730, 2014.
Argentino, C., Kalenitchenko, D., Lindgren, M., and Panieri, G.: HgCl2 addition to pore water samples from cold seeps can affect the geochemistry of dissolved inorganic carbon ([DIC], ä13CDIC), Mar. Chem., 251, 104236, https://doi.org/10.1016/j.marchem.2023.104236, 2023.
Arisci, S., Rogora, M., Marchetto, A., and Dichiaro, F.: The role of forest type in the variability of DOC in atmospheric deposition at forest plots in Italy, Environ. Monit. Assess., 184, 3415–3425, https://doi.org/10.1007/s10661-011-2196-2, 2012.
Audoux, T., Laurent, B., Desboeufs, K., Noyalet, G., Maisonneuve, F., Lauret, O., and Chevaillier, S.: Intra-event evolution of elemental and ionic concentrations in wet deposition in an urban environment, Atmos. Chem. Phys., 23, 13485–13503, https://doi.org/10.5194/acp-23-13485-2023, 2023.
Avery, G. B., Willey, J. D., and Kieber, R. J.: Carbon isotopic characterization of dissolved organic carbon in rainwater: Terrestrial and marine influences, Atmos. Environ., 40, 7539–7545, https://doi.org/10.1016/j.atmosenv.2006.07.014, 2006.
Barber, V. P. and Kroll, J. H.: Chemistry of Functionalized Reactive Organic Intermediates in the Earth's Atmosphere: Impact, Challenges, and Progress, J. Phys. Chem. A, 125, 10264–10279, https://doi.org/10.1021/acs.jpca.1c08221, 2021.
Barrie, L. A. and Hales, J. M.: The spatial distributions of precipitation acidity and major ion wet deposition in North America during 1980, Tellus B, 36, 333–355, https://doi.org/10.3402/tellusb.v36i5.14915, 1984.
Beverland, I. J., Heal, M. R., Crowther, J. M., and Srinivas, M. S. N.: Real-time measurement and interpretation of the conductivity and pH of precipitation samples, Water. Air. Soil Pollut., 98, 325–344, https://doi.org/10.1007/BF02047042, 1997.
Bowering, K. L., Edwards, K. A., Wiersma, Y. F., Billings, S. A., Warren, J., Skinner, A., and Ziegler, S. E.: Dissolved Organic Carbon Mobilization Across a Climate Transect of Mesic Boreal Forests Is Explained by Air Temperature and Snowpack Duration, Ecosystems, 26, 55–71, https://doi.org/10.1007/s10021-022-00741-0, 2022.
Bowering, K. L., Edwards, K. A., and Ziegler, S. E.: Seasonal controls override forest harvesting effects on the composition of dissolved organic matter mobilized from boreal forest soil organic horizons, Biogeosciences, 20, 2189–2206, https://doi.org/10.5194/bg-20-2189-2023, 2023.
Bowyer, P. J. (Ed.): Where the Wind Blows: A Guide to Marine Weather in Atlantic Canada, Breakwater Books Ltd., St John's, Newfoundland, 53 pp., ISBN 1-55081-119-3, 1995.
Boyd, C. E.: Carbon Dioxide, pH, and Alkalinity, in: Water Quality: An Introduction, edited by: Boyd, C. E., Springer International Publishing, Cham, 177–203, https://doi.org/10.1007/978-3-030-23335-8_9, 2020.
Brahney, J., Wetherbee, G., Sexstone, G. A., Youngbull, C., Strong, P., and Heindel, R. C.: A new sampler for the collection and retrieval of dry dust deposition, Aeolian Res., 45, 100600, https://doi.org/10.1016/j.aeolia.2020.100600, 2020.
Burkhardt, J. and Drechsel, P.: The synergism between SO2 oxidation and manganese leaching on spruce needles – A chamber experiment, Environ. Pollut., 95, 1–11, https://doi.org/10.1016/S0269-7491(96)00126-1, 1997.
Canadian Air and Precipitation Monitoring Network: Inspector's reference manual, 1-1–2-14 pp., Cat. No. En56-273/1985E-PDF, 1985.
Cappellato, R., Peters, N. E., and Ragsdale, H. L.: Acidic atmospheric deposition and canopy interactions of adjacent deciduous and coniferous forests in the Georgia Piedmont, Can. J. For. Res., 23, 1114–1124, https://doi.org/10.1139/x93-142, 1993.
Carlson, J., Gough, W. A., Karagatzides, J. D., and Tsuji, L. J. S.: Canopy Interception of Acid Deposition in Southern Ontario, Can. Field-Nat., 117, 523–530, https://doi.org/10.22621/cfn.v117i4.799, 2003.
Casas-Ruiz, J. P., Bodmer, P., Bona, K. A., Butman, D., Couturier, M., Emilson, E. J. S., Finlay, K., Genet, H., Hayes, D., Karlsson, J., Paré, D., Peng, C., Striegl, R., Webb, J., Wei, X., Ziegler, S. E., and del Giorgio, P. A.: Integrating terrestrial and aquatic ecosystems to constrain estimates of land-atmosphere carbon exchange, Nat. Commun., 14, 1571, https://doi.org/10.1038/s41467-023-37232-2, 2023.
Cha, J.-Y., Lee, S.-C., Lee, E.-J., Lee, K., Lee, H., Kim, H. S., Ahn, J., and Oh, N.-H.: Canopy Leaching Rather than Desorption of PM2.5 From Leaves Is the Dominant Source of Throughfall Dissolved Organic Carbon in Forest, Geophys. Res. Lett., 50, e2023GL103731, https://doi.org/10.1029/2023GL103731, 2023.
Chen, H., Tsai, K.-P., Su, Q., Chow, A. T., and Wang, J.-J.: Throughfall Dissolved Organic Matter as a Terrestrial Disinfection Byproduct Precursor, ACS Earth Space Chem., 3, 1603–1613, https://doi.org/10.1021/acsearthspacechem.9b00088, 2019.
Ciruzzi, D. M. and Loheide, S. P.: Monitoring Tree Sway as an Indicator of Interception Dynamics Before, During, and Following a Storm, Geophys. Res. Lett., 48, e2021GL094980, https://doi.org/10.1029/2021GL094980, 2021.
Colli, M., Lanza, L. G., Rasmussen, R., and Thériault, J. M.: The Collection Efficiency of Shielded and Unshielded Precipitation Gauges. Part II: Modeling Particle Trajectories, J. Hydrometeorol., 17, 245–255, https://doi.org/10.1175/JHM-D-15-0011.1, 2016.
Colussi, A. A., Persaud, D., Lao, M. Place, B. K., Hems, R. F., Ziegler, S. E., Edwards, K. A., Young, C. J., and VandenBoer, T. C.: Off-grid automatic precipitation measurements of pH, conductivity, and dissolved organic carbon across the Newfoundland and Labrador Boreal Ecosystem Latitudinal Transect., Federated Research Data Repository [data set], https://doi.org/10.20383/103.0945, 2024.
Coward, E. K., Seech, K., Carter, M. L., Flick, R. E., and Grassian, V. H.: Of Sea and Smoke: Evidence of Marine Dissolved Organic Matter Deposition from 2020 Western United States Wildfires, Environ. Sci. Technol. Lett., 9, 869–876, https://doi.org/10.1021/acs.estlett.2c00383, 2022.
Csavina, J., Field, J., Taylor, M. P., Gao, S., Landázuri, A., Betterton, E. A., and Sáez, A. E.: A review on the importance of metals and metalloids in atmospheric dust and aerosol from mining operations, Sci. Total Environ., 433, 58–73, https://doi.org/10.1016/j.scitotenv.2012.06.013, 2012.
Dalva, M. and Moore, T. R.: Sources and sinks of dissolved organic carbon in a forested swamp catchment, Biogeochemistry, 15, 1–19, https://doi.org/10.1007/BF00002806, 1991.
Di Lorenzo, R. A., Place, B. K., VandenBoer, T. C., and Young, C. J.: Composition of Size-Resolved Aged Boreal Fire Aerosols: Brown Carbon, Biomass Burning Tracers, and Reduced Nitrogen, ACS Earth Space Chem., 2, 278–285, https://doi.org/10.1021/acsearthspacechem.7b00137, 2018.
Dossett, S. R. and Bowersox, V. C.: National Trends Network Site Operation Manual, Illinois State Water Survey, 2-1–2-2, https://www.arlis.org/docs/vol1/123915417/opman.pdf (last access: 23 March 2021), 1999.
Eaton, J. S., Likens, G. E., and Bormann, F. H.: Throughfall and Stemflow Chemistry in a Northern Hardwood Forest, J. Ecol., 61, 495–508, https://doi.org/10.2307/2259041, 1973.
Environment Canada: Canadian Climate Normals, 1981 to 2010, https://climate.weather.gc.ca/climate_normals/ (last accessed: 14 July 2023), 2023.
Erisman, J. W. and Draaijers, G.: Deposition to forests in Europe: most important factors influencing dry deposition and models used for generalisation, Environ. Pollut., 124, 379–388, https://doi.org/10.1016/S0269-7491(03)00049-6, 2003.
Escarré, A., Carratalá, A., Àvila, A., Bellot, J., Piñol, J., and Milán, M.: Precipitation Chemistry and Air Pollution, in: Ecology of Mediterranean Evergreen Oak Forests, edited by: Rodà, F., Retana, J., Gracia, C. A., and Bellot, J., Springer Berlin Heidelberg, Berlin, Heidelberg, 195–208, https://doi.org/10.1007/978-3-642-58618-7_14, 1999.
Farmer, D. K., Boedicker, E. K., and DeBolt, H. M.: Dry Deposition of Atmospheric Aerosols: Approaches, Observations, and Mechanisms, Annu. Rev. Phys. Chem., 72, 375–397, https://doi.org/10.1146/annurev-physchem-090519-034936, 2021.
Feng, J., Vet, R., Cole, A., Zhang, L., Cheng, I., O'Brien, J., and Macdonald, A.-M.: Inorganic chemical components in precipitation in the eastern U.S. and Eastern Canada during 1989–2016: Temporal and regional trends of wet concentration and wet deposition from the NADP and CAPMoN measurements, Atmos. Environ., 254, 118367, https://doi.org/10.1016/j.atmosenv.2021.118367, 2021.
Fingler, S., Tkalèeviæ, B., Fröbe, Z., and Drevenkar, V.: Analysis of polychlorinated biphenyls, organochlorine pesticides and chlorophenols in rain and snow, Analyst, 119, 1135–1140, https://doi.org/10.1039/AN9941901135, 1994.
Fowler, D.: Wet and Dry Deposition of Sulphur and Nitrogen Compounds from the Atmosphere, Springer, Boston, MA, 9–27, https://doi.org/10.1007/978-1-4613-3033-2_3, 1980.
Galloway, J. N. and Likens, G. E.: The collection of precipitation for chemical analysis, Tellus, 30, 71–82, https://doi.org/10.3402/tellusa.v30i1.10318, 1978.
Gao, S., Hegg, D. A., Hobbs, P. V., Kirchstetter, T. W., Magi, B. I., and Sadilek, M.: Water-soluble organic components in aerosols associated with savanna fires in southern Africa: Identification, evolution, and distribution, J. Geophys. Res.-Atmos., 108, 02324, https://doi.org/10.1029/2002JD002324, 2003.
Gatz, D. F., Selman, R. F., Langs, R. K., and Holtzman, R. B.: An Automatic Sequential Rain Sampler, J. Appl. Meteorol. 1962–1982, 10, 341–344, 1971.
George, C.: Photosensitization is in the air and impacts the multiphase on oxidation capacity, EGU23, the 25th EGU General Assembly, 23–28 April, Vienna, Austria and Online, 2023.
Germer, S., Neill, C., Krusche, A. V., Neto, S. C. G., and Elsenbeer, H.: Seasonal and within-event dynamics of rainfall and throughfall chemistry in an open tropical rainforest in Rondônia, Brazil, Biogeochemistry, 86, 155–174, https://doi.org/10.1007/s10533-007-9152-9, 2007.
Grennfelt, P., Engleryd, A., Forsius, M., Hov, Ø., Rodhe, H., and Cowling, E.: Acid rain and air pollution: 50 years of progress in environmental science and policy, Ambio, 49, 849–864, https://doi.org/10.1007/s13280-019-01244-4, 2020.
Guinotte, J. M. and Fabry, V. J.: Ocean Acidification and Its Potential Effects on Marine Ecosystems, Ann. N. Y. Acad. Sci., 1134, 320–342, https://doi.org/10.1196/annals.1439.013, 2008.
Hadiwijaya, B., Isabelle, P.-E., Nadeau, D. F., and Pepin, S.: Observations of canopy storage capacity and wet canopy evaporation in a humid boreal forest, Hydrol. Process., 35, e14021, https://doi.org/10.1002/hyp.14021, 2021.
Hall, D. J.: Precipitation collector for use in the Secondary National Acid Deposition Network, United States Department of Energy, Report No. PB-87-126181/XAB; LR-561(AP)M, 1985.
Han, G., Song, Z., Tang, Y., Wu, Q., and Wang, Z.: Ca and Sr isotope compositions of rainwater from Guiyang city, Southwest China: Implication for the sources of atmospheric aerosols and their seasonal variations, Atmos. Environ., 214, 116854, https://doi.org/10.1016/j.atmosenv.2019.116854, 2019.
Heald, C. L. and Kroll, J. H.: The fuel of atmospheric chemistry: Toward a complete description of reactive organic carbon, Sci. Adv., 6, eaay8967, https://doi.org/10.1126/sciadv.aay8967, 2020.
Heald, C. L., Gouw, J. de, Goldstein, A. H., Guenther, A. B., Hayes, P. L., Hu, W., Isaacman-VanWertz, G., Jimenez, J. L., Keutsch, F. N., Koss, A. R., Misztal, P. K., Rappenglück, B., Roberts, J. M., Stevens, P. S., Washenfelder, R. A., Warneke, C., and Young, C. J.: Contrasting Reactive Organic Carbon Observations in the Southeast United States (SOAS) and Southern California (CalNex), Environ. Sci. Technol., 54, 14923–14935, https://doi.org/10.1021/acs.est.0c05027, 2020.
Houle, D., Augustin, F., and Couture, S.: Rapid improvement of lake acid–base status in Atlantic Canada following steep decline in precipitation acidity, Can. J. Fish. Aquat. Sci., 79, 2126–2137, https://doi.org/10.1139/cjfas-2021-0349, 2022.
Howard, M., Hathaway, J. M., Tirpak, R. A., Lisenbee, W. A., and Sims, S.: Quantifying urban tree canopy interception in the southeastern United States, Urban For. Urban Green., 77, 127741, https://doi.org/10.1016/j.ufug.2022.127741, 2022.
Iavorivska, L., Boyer, E. W., and DeWalle, D. R.: Atmospheric deposition of organic carbon via precipitation, Acid Rain Its Environ. Eff. Recent Sci. Adv., 146, 153–163, https://doi.org/10.1016/j.atmosenv.2016.06.006, 2016.
Jacob, D. J.: Introduction to Atmospheric Chemistry, Princeton University Press, Princeton, New Jersey, 49 pp., 1999.
Jurado, E., Jaward, F. M., Lohmann, R., Jones, K. C., Simó, R., and Dachs, J.: Atmospheric Dry Deposition of Persistent Organic Pollutants to the Atlantic and Inferences for the Global Oceans, Environ. Sci. Technol., 38, 5505–5513, https://doi.org/10.1021/es049240v, 2004.
Jurado, E., Jaward, F., Lohmann, R., Jones, K. C., Simó, R., and Dachs, J.: Wet Deposition of Persistent Organic Pollutants to the Global Oceans, Environ. Sci. Technol., 39, 2426–2435, https://doi.org/10.1021/es048599g, 2005.
Kattner, G.: Storage of dissolved inorganic nutrients in seawater: poisoning with mercuric chloride, Mar. Chem., 67, 61–66, https://doi.org/10.1016/S0304-4203(99)00049-3, 1999.
Kirkwood, D. S.: Stability of solutions of nutrient salts during storage, Mar. Chem., 38, 151–164, https://doi.org/10.1016/0304-4203(92)90032-6, 1992.
Kochendorfer, J., Meyers, T. P., Hall, M. E., Landolt, S. D., Lentz, J., and Diamond, H. J.: A new reference-quality precipitation gauge wind shield, Atmos. Meas. Tech., 16, 5647–5657, https://doi.org/10.5194/amt-16-5647-2023, 2023.
Kroll, J. H., Donahue, N. M., Jimenez, J. L., Kessler, S. H., Canagaratna, M. R., Wilson, K. R., Altieri, K. E., Mazzoleni, L. R., Wozniak, A. S., Bluhm, H., Mysak, E. R., Smith, J. D., Kolb, C. E., and Worsnop, D. R.: Carbon oxidation state as a metric for describing the chemistry of atmospheric organic aerosol, Nat. Chem., 3, 133–139, https://doi.org/10.1038/nchem.948, 2011.
Kuylenstierna, J. C., Rodhe, H., Cinderby, S., and Hicks, K.: Acidification in developing countries: ecosystem sensitivity and the critical load approach on a global scale, Ambio, 30, 20–28, https://doi.org/10.1579/0044-7447-30.1.20, 2001.
Laquer, F. C.: Sequential precipitation samplers: A literature review, Atmospheric Environ. Part Gen. Top., 24, 2289–2297, https://doi.org/10.1016/0960-1686(90)90322-E, 1990.
Laurent, B., Losno, R., Chevaillier, S., Vincent, J., Roullet, P., Bon Nguyen, E., Ouboulmane, N., Triquet, S., Fornier, M., Raimbault, P., and Bergametti, G.: An automatic collector to monitor insoluble atmospheric deposition: application for mineral dust deposition, Atmos. Meas. Tech., 8, 2801–2811, https://doi.org/10.5194/amt-8-2801-2015, 2015.
Lawrence, C. E., Casson, P., Brandt, R., Schwab, J. J., Dukett, J. E., Snyder, P., Yerger, E., Kelting, D., VandenBoer, T. C., and Lance, S.: Long-term monitoring of cloud water chemistry at Whiteface Mountain: the emergence of a new chemical regime, Atmos. Chem. Phys., 23, 1619–1639, https://doi.org/10.5194/acp-23-1619-2023, 2023.
Likens, G. E. and Butler, T. J.: Atmospheric Acid Deposition, in: The Handbook of Natural Resources, Atmosphere and Climate, Vol. 6, edited by: Wang, Y., CRC Press, ISBN 9781138339675, 2020.
Lin, W.-C., Brondum, K., Monroe, C. W., and Burns, M. A.: Multifunctional Water Sensors for pH, ORP, and Conductivity Using Only Microfabricated Platinum Electrodes, Sensors, 17, 1655, https://doi.org/10.3390/s17071655, 2017.
Lindberg, S. E., Lovett, G. M., Richter, D. D., and Johnson, D. W.: Atmospheric Deposition and Canopy Interactions of Major Ions in a Forest, Science, 231, 141–145, https://doi.org/10.1126/science.231.4734.141, 1986.
Lovett, G. M.: Atmospheric Deposition of Nutrients and Pollutants in North America: An Ecological Perspective, Ecol. Appl., 4, 629–650, https://doi.org/10.2307/1941997, 1994.
Lovett, G. M. and Kinsman, J. D.: Atmospheric pollutant deposition to high-elevation ecosystems, Atmospheric Environ. Part Gen. Top., 24, 2767–2786, https://doi.org/10.1016/0960-1686(90)90164-I, 1990.
Meteorological Service of Canada: 2004 Canadian Acid Deposition Science Assessment, Library and Archives Canada, ISBN 0-662-38754-6, https://publications.gc.ca/collections/Collection/En4-46-2004E.pdf (last access: 28 July 2021), 2005.
Metzger, J. C., Schumacher, J., Lange, M., and Hildebrandt, A.: Neighbourhood and stand structure affect stemflow generation in a heterogeneous deciduous temperate forest, Hydrol. Earth Syst. Sci., 23, 4433–4452, https://doi.org/10.5194/hess-23-4433-2019, 2019.
Michalzik, B. and Matzner, E.: Dynamics of dissolved organic nitrogen and carbon in a Central European Norway spruce ecosystem, Eur. J. Soil Sci., 50, 579–590, https://doi.org/10.1046/j.1365-2389.1999.00267.x, 1999.
Moore, T. R.: Dissolved organic carbon in a northern boreal landscape, Global Biogeochem. Cy., 17, 1109, https://doi.org/10.1029/2003GB002050, 2003.
Myers-Pigg, A. N., Louchouarn, P., Amon, R. M. W., Prokushkin, A., Pierce, K., and Rubtsov, A.: Labile pyrogenic dissolved organic carbon in major Siberian Arctic rivers: Implications for wildfire-stream metabolic linkages, Geophys. Res. Lett., 42, 377–385, https://doi.org/10.1002/2014GL062762, 2015.
National Atmospheric Deposition Program: NADP Site Selection and Installation Manual, https://nadp.slh.wisc.edu/wp-content/uploads/2022/01/NADP-2010_Site_Selection_and_Installation_Manual_v1.pdf (last access: 1 September 2021),, 2009.
Oka, A., Takahashi, J., Endoh, Y., and Seino, T.: Bark Effects on Stemflow Chemistry in a Japanese Temperate Forest I. The Role of Bark Surface Morphology, Front. For. Glob. Change, 4, https://doi.org/10.3389/ffgc.2021.654375, 2021.
Pacyna, J. M.: Ecological Processes: Atmospheric Deposition, in: Encyclopedia of Ecology, Vol. 1, edited by: Jorgensen, S. E. and Fath, B. D., Elsevier Science, 275–285, 2008.
Pan, Y., Wang, Y., Xin, J., Tang, G., Song, T., Wang, Y., Li, X., and Wu, F.: Study on dissolved organic carbon in precipitation in Northern China, Atmos. Environ., 44, 2350–2357, https://doi.org/10.1016/j.atmosenv.2010.03.033, 2010.
Peden, M. E., Bachman, S. R., Brennan, C. J., Demir, B., James, K. O., Kaiser, B. W., Lockard, J. M., Rothery, J. E., Sauer, J., Skowron, L. M., and Slater, M. J.: Methods for collection and analysis of precipitation, Illinois State Water Survey, ISWS Contract Report CR 381, 1–7 pp., 1986.
Pomeroy, J. W., Granger, R., Pietroniro, J., Elliott, J., Toth, B., and Hedstrom, N.: Classification of the Boreal Forest for Hydrological Processes, in: Proceedings of the Ninth International Boreal Forest Research Association Conference, 21–23 September, 1998, Oslo, Norway, edited by: Woxholtt, S., 49–59 pp., 1999.
Pumpanen, J., Lindén, A., Miettinen, H., Kolari, P., Ilvesniemi, H., Mammarella, I., Hari, P., Nikinmaa, E., Heinonsalo, J., Bäck, J., Ojala, A., Berninger, F., and Vesala, T.: Precipitation and net ecosystem exchange are the most important drivers of DOC flux in upland boreal catchments, J. Geophys. Res.-Biogeosci., 119, 1861–1878, https://doi.org/10.1002/2014JG002705, 2014.
Ramanathan, V. and Carmichael, G.: Global and regional climate changes due to black carbon, Nat. Geosci., 1, 221–227, https://doi.org/10.1038/ngeo156, 2008.
Randall, David: An Introduction to the Global Circulation of the Atmosphere, Princeton University Press, Princeton, New Jersey, 43 pp., ISBN 9780691148960, 2015.
Reddy, M. M., Liebermann, T. D., Jelinski, J. C., and Caine, N.: Variation in pH During Summer Storms Near the Continental Divide in Central Colorado, U.S.A.*, Arct. Alp. Res., 17, 79–88, 1985.
Richter, D. D. and Lindberg, S. E.: Wet Deposition Estimates from Long-Term Bulk and Event Wet-Only Samples of Incident Precipitation and Throughfall, J. Environ. Qual., 17, 619–622, https://doi.org/10.2134/jeq1988.00472425001700040017x, 1988.
Ryan, K. A., Adler, T., Chalmers, A., Perdrial, J., Shanley, J. B., and Stubbins, A.: Event Scale Relationships of DOC and TDN Fluxes in Throughfall and Stemflow Diverge From Stream Exports in a Forested Catchment, J. Geophys. Res.-Biogeosci., 126, e2021JG006281, https://doi.org/10.1029/2021JG006281, 2021.
Safieddine, S. A. and Heald, C. L.: A Global Assessment of Dissolved Organic Carbon in Precipitation, Geophys. Res. Lett., 44, 11672–11681, https://doi.org/10.1002/2017GL075270, 2017.
Saleh, R.: From Measurements to Models: Toward Accurate Representation of Brown Carbon in Climate Calculations, Curr. Pollut. Rep., 6, 90–104, https://doi.org/10.1007/s40726-020-00139-3, 2020.
Sanei, H., Outridge, P. M., Goodarzi, F., Wang, F., Armstrong, D., Warren, K., and Fishback, L.: Wet deposition mercury fluxes in the Canadian sub-Arctic and southern Alberta, measured using an automated precipitation collector adapted to cold regions, Atmos. Environ., 44, 1672–1681, https://doi.org/10.1016/j.atmosenv.2010.01.030, 2010.
Santín, C., Doerr, S. H., Kane, E. S., Masiello, C. A., Ohlson, M., de la Rosa, J. M., Preston, C. M., and Dittmar, T.: Towards a global assessment of pyrogenic carbon from vegetation fires, Glob. Change Biol., 22, 76–91, https://doi.org/10.1111/gcb.12985, 2016.
Siksna, R.: The electrolytical conductivity of precipitation water as an aid to the chemical analysis, Geofis. Pura E Appl., 42, 32–41, https://doi.org/10.1007/BF02113385, 1959.
Sleutel, S., Vandenbruwane, J., De Schrijver, A., Wuyts, K., Moeskops, B., Verheyen, K., and De Neve, S.: Patterns of dissolved organic carbon and nitrogen fluxes in deciduous and coniferous forests under historic high nitrogen deposition, Biogeosciences, 6, 2743–2758, https://doi.org/10.5194/bg-6-2743-2009, 2009.
Smith, W. H.: Air Pollution and Forests: Interactions Between Air Contaminants and Forest Ecosystems, 1st Edn., Springer, New York, NY, 379 pp., 1981.
Stedman, J. R., Heyes, C. J., and Irwin, J. G.: A comparison of bulk and wet-only precipitation collectors at rural sites in the United Kingdom, Water. Air. Soil Pollut., 52, 377–395, https://doi.org/10.1007/BF00229445, 1990.
Stoddard, J. L., Jeffries, D. S., Lükewille, A., Clair, T. A., Dillon, P. J., Driscoll, C. T., Forsius, M., Johannessen, M., Kahl, J. S., Kellogg, J. H., Kemp, A., Mannio, J., Monteith, D. T., Murdoch, P. S., Patrick, S., Rebsdorf, A., Skjelkvåle, B. L., Stainton, M. P., Traaen, T., van Dam, H., Webster, K. E., Wieting, J., and Wilander, A.: Regional trends in aquatic recovery from acidification in North America and Europe, Nature, 401, 575–578, https://doi.org/10.1038/44114, 1999.
Stubbins, A., Silva, L. M., Dittmar, T., and Van Stan, J. T.: Molecular and Optical Properties of Tree-Derived Dissolved Organic Matter in Throughfall and Stemflow from Live Oaks and Eastern Red Cedar, Front. Earth Sci., 5, https://doi.org/10.3389/feart.2017.00022, 2017.
Thornton, M. M., Shrestha, R., Wei, Y., Thornton, P. E., Kao, S.-C., and Wilson, B. E.: Daymet: Monthly Climate Summaries on a 1-km Grid for North America, Version 4 R1, https://doi.org/10.3334/ORNLDAAC/2131, 2022.
Thornton, P. E., Running, S. W., and White, M. A.: Generating surfaces of daily meteorological variables over large regions of complex terrain, Aggreg. Descr. Land-Atmosphere Interact., 190, 214–251, https://doi.org/10.1016/S0022-1694(96)03128-9, 1997.
Thornton, P. E., Shrestha, R., Thornton, M., Kao, S.-C., Wei, Y., and Wilson, B. E.: Gridded daily weather data for North America with comprehensive uncertainty quantification, Sci. Data, 8, 190, https://doi.org/10.1038/s41597-021-00973-0, 2021.
United States Environmental Protection Agency: Integrated Science Assessment (ISA) for Oxides of Nitrogen, Oxides of Sulfur and Particulate Matter Ecological Criteria (Final Report, 2020), U.S. Environmental Protection Agency, Washington, DC, EPA/600/R-20/278, 2020.
Van Stan, J. T. and Stubbins, A.: Tree-DOM: Dissolved organic matter in throughfall and stemflow, Limnol. Oceanogr. Lett., 3, 199–214, https://doi.org/10.1002/lol2.10059, 2018.
Van Stan, J. T., Wagner, S., Guillemette, F., Whitetree, A., Lewis, J., Silva, L., and Stubbins, A.: Temporal Dynamics in the Concentration, Flux, and Optical Properties of Tree-Derived Dissolved Organic Matter in an Epiphyte-Laden Oak-Cedar Forest, J. Geophys. Res.-Biogeosci., 122, 2982–2997, https://doi.org/10.1002/2017JG004111, 2017.
VandenBoer, T. C.: AIM-IC: Applications to Nitrous Acid (HONO) in the Ambient Atmosphere and Precipitation Monitoring, Masters of Science, University of Toronto, 2009.
Vermette, S. J. and Drake, J. J.: Simplified wet-only and sequential fraction rain collector, Atmos. Environ., 1967, 21, 715–716, https://doi.org/10.1016/0004-6981(87)90053-9, 1987.
Vet, R., Artz, R. S., Carou, S., Shaw, M., Ro, C.-U., Aas, W., Baker, A., Bowersox, V. C., Dentener, F., Galy-Lacaux, C., Hou, A., Pienaar, J. J., Gillett, R., Forti, M. C., Gromov, S., Hara, H., Khodzher, T., Mahowald, N. M., Nickovic, S., Rao, P. S. P., and Reid, N. W.: A global assessment of precipitation chemistry and deposition of sulfur, nitrogen, sea salt, base cations, organic acids, acidity and pH, and phosphorus, Glob. Assess. Precip. Chem. Depos. Sulfur Nitrogen Sea Salt Base Cations Org. Acids Acidity PH Phosphorus, 93, 3–100, https://doi.org/10.1016/j.atmosenv.2013.10.060, 2014.
Wang, X., Gemayel, R., Baboomian, V. J., Li, K., Boreave, A., Dubois, C., Tomaz, S., Perrier, S., Nizkorodov, S. A., and George, C.: Naphthalene-Derived Secondary Organic Aerosols Interfacial Photosensitizing Properties, Geophys. Res. Lett., 48, e2021GL093465, https://doi.org/10.1029/2021GL093465, 2021.
Washenfelder, R. A., Azzarello, L., Ball, K., Brown, S. S., Decker, Z. C. J., Franchin, A., Fredrickson, C. D., Hayden, K., Holmes, C. D., Middlebrook, A. M., Palm, B. B., Pierce, R. B., Price, D. J., Roberts, J. M., Robinson, M. A., Thornton, J. A., Womack, C. C., and Young, C. J.: Complexity in the Evolution, Composition, and Spectroscopy of Brown Carbon in Aircraft Measurements of Wildfire Plumes, Geophys. Res. Lett., 49, e2022GL098951, https://doi.org/10.1029/2022GL098951, 2022.
Wetherbee, G. A., Shaw, M. J., Latysh, N. E., Lehmann, C. M. B., and Rothert, J. E.: Comparison of precipitation chemistry measurements obtained by the Canadian Air and Precipitation Monitoring Network and National Atmospheric Deposition Program for the period 1995–2004, Environ. Monit. Assess., 164, 111–132, https://doi.org/10.1007/s10661-009-0879-8, 2010.
Wonaschütz, A., Hersey, S. P., Sorooshian, A., Craven, J. S., Metcalf, A. R., Flagan, R. C., and Seinfeld, J. H.: Impact of a large wildfire on water-soluble organic aerosol in a major urban area: the 2009 Station Fire in Los Angeles County, Atmos. Chem. Phys., 11, 8257–8270, https://doi.org/10.5194/acp-11-8257-2011, 2011.
Ziegler, S. E., Benner, R., Billings, S. A., Edwards, K. A., Philben, M., Zhu, X., and Laganière, J.: Climate Warming Can Accelerate Carbon Fluxes without Changing Soil Carbon Stocks, Front. Earth Sci., 5, https://doi.org/10.3389/feart.2017.00002, 2017.