the Creative Commons Attribution 4.0 License.
the Creative Commons Attribution 4.0 License.
 | 19 Jan 2024
Evaluation of the first year of Pandora NO2 measurements over Beijing and application to satellite validation
Ouyang Liu
Zhengqiang Li
Yangyan Lin
Cheng Fan
Ying Zhang
Kaitao Li
Peng Zhang
Yuanyuan Wei
Tianzeng Chen
Jiantao Dong
Gerrit de Leeuw
Nitrogen dioxide (NO2) is a highly photochemically reactive gas, has a lifetime of only a few hours, and at high concentrations is harmful to human beings. Therefore, it is important to monitor NO2 with high-precision, time-resolved instruments. To this end, a Pandora spectrometer has been installed on the roof of the laboratory building of the Aerospace Information Research Institute of the Chinese Academy of Sciences in the Olympic Park, Beijing, China. The concentrations of trace gases (including NO2, HCHO, O3) measured with Pandora are made available through the open-access Pandora database (https://data.pandonia-global-network.org/Beijing-RADI/Pandora171s1/, last access: 11 July 2023). In this paper, an overview is presented of the Pandora total and tropospheric NO2 vertical column densities (VCDs) and surface concentrations collected during the first year of operation, i.e., from August 2021 to July 2022. The data show that NO2 concentrations were high in the winter and low in the summer, with a diurnal cycle where the concentrations reached a minimum during the daytime. The concentrations were significantly lower during the 2022 Winter Olympics in Beijing, showing the effectiveness of the emission control measures during that period. The Pandora observations show that during northerly winds, clean air is transported to Beijing with low NO2 concentrations, whereas during southerly winds, pollution from surrounding areas is transported to Beijing and NO2 concentrations are high. The contribution of tropospheric NO2 to the total NO2 VCD varies significantly on daily to seasonal timescales; i.e., monthly averages vary between 50 % and 60 % in the winter and between 60 % and 70 % in the spring and autumn. A comparison of Pandora-measured surface concentrations with collocated in situ measurements using a Thermo Scientific 42i-TL analyzer shows that the Pandora data are low and that the relationship between Pandora-derived surface concentrations and in situ measurements is different for low and high NO2 concentrations. Explanations for these differences are offered in terms of measurement techniques and physical (transport) phenomena. The use of Pandora total and tropospheric NO2 VCDs for validation of collocated TROPOspheric Monitoring Instrument (TROPOMI) data, resampled to 100 m × 100 m, shows that although on average the TROPOMI VCDs are slightly lower, they are well within the expected error for TROPOMI of 0.5 + (0.2 to 0.5) ⋅ VCDtrop (1 = 1 × 10¹⁵ molec cm−2). The location of the Pandora instrument within a sub-orbital TROPOMI pixel of 3.5 km × 5.5 km may result in an error in the TROPOMI-derived tropospheric NO2 VCD between 0.223 and 0.282 , i.e., between 1.7 % and 2 %. In addition, the data also show that the Pandora observations at the Beijing-RADI site are representative of an area with a radius of 10 km.
- Article
(5749 KB) - Full-text XML
-
Supplement
(1359 KB) - BibTeX
- EndNote


NO2 is a trace gas that plays an important role in atmospheric chemistry (Seinfeld and Pandis, 1998), such as the O3–NOx–volatile organic compound (VOC) sensitivity (H. Wang et al., 2021; Liu and Shi, 2021), the formation of aerosols (Behera and Sharma, 2011), and thus air quality (de Leeuw et al., 2021). NO2 is also a precursor for the production of aerosol and ozone and therefore classified as an essential climate variable (ECV) (https://gcos.wmo.int/en/essential-climate-variables/precursors, last access: 11 July 2023). Sources of tropospheric NO2 include anthropogenic sources such as coal-fired power plants, motor vehicle emissions, and industrial chemical production (Carslaw and Beevers, 2005; Felix and Elliott, 2014) and natural sources such as stratospheric NOx intrusion, bacterial and volcanic action (Mather et al., 2004), and lightning (Zhang et al., 2020). NO2 is removed by chemical reactions and diluted by horizontal and vertical transport (Jorba et al., 2012; Dai et al., 2022). Thus the NO2 concentration decreases with distance to the emission sources. Most of the NO2 is located at altitudes between 0 and 3 km, with a small amount in the upper troposphere and stratosphere due to chemical reactions such as the oxidation of nitrous oxide (Brasseur and Nicolet, 1973; Grenfell et al., 2006; Dirksen et al., 2011; Herman et al., 2019). NO2 is a short-lived trace gas with a chemical lifetime of 3.8 ± 1.0 h during the summer (Liu et al., 2016), increasing during colder conditions in winter and at higher altitudes (Herman et al., 2018). Together with the multitude of localized (power plants, factories) and diffuse (traffic) sources, this short lifetime results in a large spatial and temporal variation in the NO2 concentrations (Weber and Bylicki, 1987; Sivakumaran et al., 2001; X. Zhao et al., 2022). To catch this variability, observations are needed with high temporal resolution together with good spatial resolution.
Information on NO2 concentrations can be obtained using different methods and techniques, i.e., ground-based in situ or remote sensing measurements or satellite remote sensing. Each of these techniques provides different types of data with their own advantages and disadvantages. Instruments used for ground-based observations have the advantage that they can easily be serviced, have high and well-known accuracy, can measure continuously, and thus provide good temporal coverage during day and night. In China, ground-based in situ measurements of NO2 concentrations are available, together with other species, from the China National Urban Air Quality Real-time Publishing Platform public website for air quality (AQ) monitoring data, maintained by the China National Environmental Monitoring Center (CNEMC) of the Ministry of Ecology and Environment of China (http://www.cnemc.cn/, last access: 11 July 2023) (Zhai et al., 2019; Li et al., 2020; Xie et al., 2005). This network includes more than 2000 stations all over China, but they are mainly located in densely populated and urban centers. In situ data are representative of concentrations near the surface and within a certain distance of the observation site, especially for a short-lived species like NO2 with many local emission sources such as traffic using fossil-fuel-powered engines and households. This leaves large gaps in the data coverage; i.e., there are no data for large areas outside the urban and industrial agglomerations.
Ground-based remote sensing of atmospheric NO2 concentrations can be made using instruments such as MAX-DOAS (Wagner et al., 2010) or Pandora (Herman et al., 2009). Both instruments are spectrometers with a mode viewing the sun directly, and another one viewing scattered radiation (sky) at different angles, providing information on the vertical distribution. In the current study, data from a Pandora instrument will be used (see Sect. 2.2 for more detail on the instrument).
The gaps in the spatial distributions can be filled with data from satellite observations, i.e., using dedicated satellite-based instruments (spectrometers) providing wide spatial coverage. Such instruments have been developed during the last 3 decades with enormous improvement in both spatial resolution and accuracy, i.e., from the Global Ozone Monitoring Experiment (GOME; launched on the European remote sensing satellite ERS-2 in 1995), the SCanning Imaging Absorption spectroMeter for Atmospheric CartograpHY (SCIAMACHY; launched on the Environmental Satellite (ENVISAT) in 2002), the Ozone Monitoring Instrument (OMI; launched on the Aura satellite in 2004), and GOME-2 (first launched on the Meteorological Operational satellite (Metop-A) in 2006) to the TROPOspheric Monitoring Instrument (TROPOMI; launched on the Sentinel-5 Precursor (S-5P) satellite in 2017). However, although these sensors provide data with daily near-global coverage, they have only one single overpass each day (more at high latitudes), which does not capture diurnal variation (Bovensmann et al., 1999; Burrows et al., 1999; Levelt et al., 2006, 2018; Verhoelst et al., 2021). The primary NO2 product from such satellites is the total vertical column density (VCD) (i.e., column-integrated NO2 concentrations), which can be separated into tropospheric and stratospheric VCDs using a chemical transport model (van Geffen et al., 2022b). The accuracy of satellite data is usually less good than from ground-based data because corrections need to be made for contributions from the surface and from other atmospheric constituents contributing to the reflected solar radiation measured by the instrument at the top of the atmosphere (TOA). In addition, satellite data need regular validation to account for post-launch degradation. In this study, TROPOMI data will be used as discussed in Sect. 2.2.
For the validation of satellite-retrieved NO2 data, the Pandonia Global Network (PGN) was established in 2018 to provide “long-term quality observations of total column and vertically resolved concentrations of a range of trace gases” (http://www.pandonia-global-network.org/, last access: 11 July 2023). The information on NO2, O3, and HCHO provided by PGN is obtained using Pandora instruments and is publicly available. Most PGN sites have been established in North America and Europe, with fewer data from Japan, South Korea, and some other countries, thus leaving large areas uncovered. In particular, until recently there were no publicly available data in China.
As a first step to fill this gap, a Pandora instrument has been installed in Beijing on the roof of the Aerospace Information Research Institute of the Chinese Academy of Sciences (AIRCAS) laboratory building in the Olympic Park, Beijing, China (40.0048∘ N, 116.3786∘ E). The instrument has been running continuously since the end of July 2021. The observations and data processing follow the Pandora protocol (Cede et al., 2021) and provide high-precision trace gas VCD data in near real time. The Pandora instrument, referred to as Beijing-RADI, is the first instrument in China which joined the PGN network, and all data are publicly available via the PGN website (https://data.pandonia-global-network.org/Beijing-RADI/Pandora171s1/, last access: 11 July 2023), within 1 d of the observations. The Beijing-RADI Pandora is included in the data suite which is routinely used for TROPOMI S-5P validation.
In this paper we provide an overview of the results from the first year of NO2 observations from the Beijing-RADI Pandora instrument, i.e., total VCDs, tropospheric VCDs, and surface concentrations. The site and experimental methods are discussed in Sect. 2. The results are presented in Sect. 3, where we discuss the variations in NO2 VCDs and surface concentrations and the contribution of tropospheric NO2 to the total VCD on hourly, daily, monthly, and seasonal timescales. Influences of wind speed and direction on the NO2 concentrations at the Beijing-RADI site are discussed. Pandora-derived surface concentrations are evaluated by comparison with collocated in situ observations, and differences are explained in terms of local production and long-range transport. Pandora NO2 tropospheric and total VCDs are used for validation of TROPOMI NO2 data, and the spatial representativeness of the Pandora is evaluated. A brief summary of the study and the main conclusions are presented in Sect. 4.
2.1 Site description
Beijing is a megacity with a population of over 21.7 million in 2023 (https://worldpopulationreview.com/world-cities/beijing-population, last access: 26 October 2023). The vast majority of the people in Beijing live within the 5th Ring Road (see Fig. 1). Beijing is located in the north of the North China Plain (NCP), with the Yan and Taihang mountains to the north and west, respectively. The NCP includes a highly industrialized and urbanized area where the weather conditions are often conducive to the accumulation of air pollution, resulting in the frequent occurrence of haze episodes (Sundström et al., 2012; Sun et al., 2014; Li et al., 2016). The effects of pollution in the NCP on the air quality in Beijing varies with weather conditions. Southern airflow transports pollution to the city, whereas northern airflow transports clean air from the north. Hence the air quality situation may vary strongly, depending on large-scale meteorological patterns (Hou et al., 2020). Furthermore, as the capital city of China, Beijing hosts the Chinese government and many national and international events. During such events, emissions from industry and traffic in and around Beijing are regulated to improve air quality (Wang et al., 2010; Wang et al., 2016; Fan et al., 2021; Chu et al., 2022).
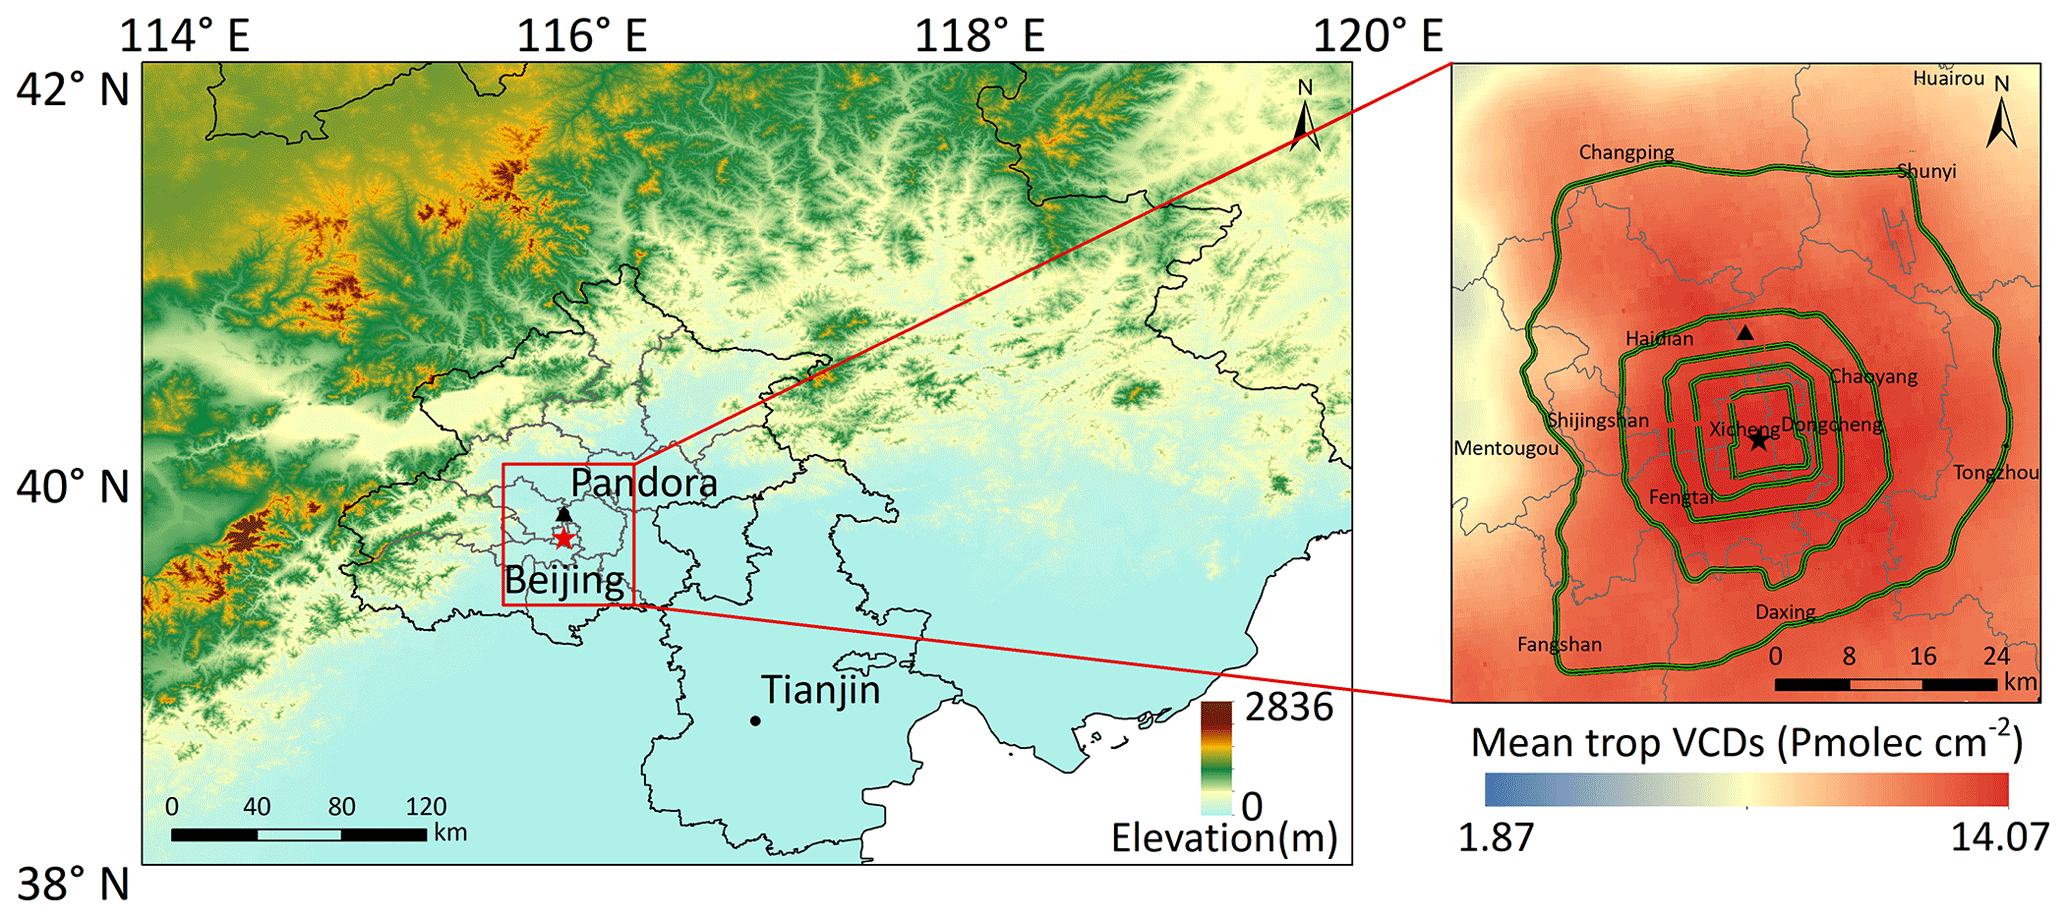
Figure 1Digital elevation map of Beijing and surroundings. The solid black line is the provincial boundary and the solid gray line is the administrative boundary of Beijing on a district basis. The Beijing-RADI site is indicated by the black triangle, at about 12 km north of the administrative center of China (red pentagram). The enlarged panel shows Beijing with ring roads 2–6 (from the center to outside; there is no ring road 1) overlaid on the TROPOMI-derived NO2 tropospheric VCD re-gridded to a resolution of 100 m × 100 m and averaged over the period from 1 August 2021 to 31 July 2022.
The AIRCAS laboratory building is located at the north side of Beijing between the 4th Ring Road and 5th Ring Road (see Fig. 1). The Beijing-RADI site is located at the roof of this building, at a height of 21 m above the ground. The site includes instrumentation for atmospheric observations such as a sun photometer, a lidar, and a suite of instruments for in situ measurements of aerosol properties, trace gas concentrations, and solar radiation. The Pandora instrument was added in 2021 to measure NO2 VCDs and surface concentrations. Due to its location in a science park at the edge of the Olympic Park, the Beijing-RADI site is considered a combined urban and suburban background observatory with small local emissions and large influences from nearby highways, urban activities, and industrial pollution advected from the south of Beijing and the NCP.
2.2 Instrumentation and auxiliary data
2.2.1 Pandora
Pandora is a sun-viewing instrument at solar zenith angles (SZAs) smaller than 80∘. The instrument consists of a UV–VIS spectrometer connected to an optical head through a 400 µm core diameter fiber-optic cable (Herman et al., 2009; Cede, 2021). The optical head is mounted on a sun tracker for accurate pointing at the sun (precision 0.013∘; Herman et al., 2009). Solar radiation is collected by the front-end optics with a field of view (FOV) of 2.6∘ for direct-sun observations using a diffuser and with a FOV of 1.5∘ for sky observations without a diffuser. The vast majority of the light sampled in direct observation mode comes from an angle of 0.5∘. The received solar radiation is transmitted through a fiber-optic cable to the spectrometer which is a 2048 pixel × 64 pixel back-thinned Hamamatsu charge-coupled device (CCD), with a 50 µm entrance slit and a grating with 1200 lines mm−1.
Pandora measures spectrally resolved solar radiances at wavelengths between 290 and 380 nm, using a UV bandpass filter, and between 280 and 525 nm, with a spectral resolution of 0.6 nm and 4.5 times oversampling. In clear-sky conditions, about 4000 spectra are measured in about 80 s, including about 20 s of dark current measurements between each spectral measurement (Herman et al., 2009; Cede, 2021). These 4000 spectra are averaged to achieve very high signal-to-noise ratios (Herman et al., 2019). The spectra are used to determine trace gas amounts using the differential optical absorption spectroscopy (DOAS) technique, i.e., spectral fitting, as described in detail in the ATBD (Cede, 2021). For the retrieval of NO2 VCDs, the part of the spectrum between 400 and 440 nm is used.
Using direct-sun measurements, information is obtained on the total VCDs of the trace gases. Diffuse (scattered) radiation is measured at five pointing zenith angles (PZAs) in sky mode which, together with the direct-sun measurement, provides information on the tropospheric VCD and on the surface concentrations. The PZAs are 0, 60, 75, and 88∘ and a maximum angle taken as 89∘. The measurements are taken in a V shape (all angles are measured twice around a central angle) as described in Cede (2021).
Details of the Pandora spectrometer instrument can be found on the Pandora project website https://Pandora.gsfc.nasa.gov/Instrument/ (last access: 11 July 2023), as well as the NASA Pandora website https://avdc.gsfc.nasa.gov/pub/DSCOVR/Pandora/Web_Pandora/index.html (last access: 11 July 2023). The Beijing-RADI Pandora is operated following the PGN operational procedures and data processing, described in detail in Cede (2021), which also includes the ATBD. In this study, L2 data products for NO2 (L2H files L2Tot for total VCD and L2Tro for tropospheric NO2 and surface concentrations) are used which include all measurements available. The data quality (DQ) has been checked for a number of criteria which have to be satisfied. Only DQ0 (assured high quality), DQ1 (assured medium quality), DQ10 (non-assured high quality), and DQ11 (non-assured medium quality) data are used. DQ2 and DQ12 data (low quality) are available in the data files, but their use is not recommended (Cede, 2021). The estimated nominal accuracy is about ± 2.67 (error in fraction for 5.33 %). (1 = 1 × 10¹⁵ molec cm−2 = 3.745 × 10⁻² DU (Dobson units) = 7.639 × 10⁻⁷ kg m−2) (Herman et al., 2009).
2.2.2 TROPOMI
TROPOMI on board the Sentinel-5 Precursor (S-5P) satellite of the European Space Agency (ESA) was launched on 13 October 2017 (Veefkind et al., 2012) to fill the gap between OMI (Schoeberl et al., 2006; Levelt et al., 2018) and future payloads. TROPOMI has been designed to retrieve the slant column densities (SCDs) of key atmospheric species such as NO2, O3, SO2, HCHO, CH4, and CO (e.g., http://www.tropomi.eu/, last access: 11 July 2023) with a spatial resolution of 3.5 km × 7 km, which was further reduced to 3.5 km × 5.5 km from 6 August 2019. This spatial resolution is suitable for air quality monitoring at a city level (Lama et al., 2020). TROPOMI has a swath width of 2600 km, which allows for daily global coverage, with an overpass time at about 13:00 LT (van Geffen et al., 2022b). Trace gas parameters are retrieved using six spectral channels covering wavelengths from the ultraviolet to the near infrared. The NO2 total SCD is retrieved by application of the DOAS method to the spectral radiation and irradiance measured in the UV–VIS (320–500 nm) spectral channels (van Geffen et al., 2015; Boersma et al., 2011). The stratospheric and tropospheric SCDs are derived from the total SCD using the TM5-MP chemical transport model (CTM) (Dentener et al., 2003). The meteorological information required to run the model is obtained from the European Centre for Medium-Range Weather Forecasts (ECMWF) (Dee et al., 2011; Uppala et al., 2005). The stratospheric and tropospheric SCDs are converted to VCDs using a height-dependent air mass factor (AMF) lookup table with a spatial resolution of 1∘ × 1∘ built using the double-adding KNMI (DAK) radiative transfer model (Palmer et al., 2001; Boersma et al., 2004). It is worth noting that the NO2 total VCDs provided by TROPOMI are the sum of tropospheric and stratospheric VCDs calculated as described above. The margin of error given by the data provider is 0.5 + (0.2 to 0.5) ⋅ VCDtrop (van Geffen et al., 2022b).
TROPOMI provides near-real-time data (NRTI) and off-line data (OFFL). The OFFL data used in the current study are produced using observational meteorological data for assimilation in the TM5-MP CTM (van Geffen et al., 2022b), whereas the NRTI are produced using meteorological forecast data. The TROPOMI OFFL data used in this study were retrieved using retrieval processor version 2.2.0 from 1 August 2021 to 14 November 2021, version 2.3.1 from 15 November 2021 to 17 July 2022, and version 2.4.0 after 18 July 2022 (van Geffen et al., 2022a, b). Only data were used with high quality, i.e., with quality assurance (QA) > 0.75, which disqualifies scenes with a cloud radiance fraction > 0.5, some scenes covered by snow or ice, and scenes that have been determined to include errors or problematic retrievals. TROPOMI NO2 VCD data were downloaded from the ESA website: https://dataspace.copernicus.eu/browser/ (last access: 22 December 2023).
2.2.3 In situ measurements of NO2 concentrations
In addition to NO2 surface concentrations obtained from Pandora observations, data from an in situ instrument are available for a short period of time, i.e., from a Thermo Scientific 42i-TL analyzer (https://www.thermofisher.com/order/catalog/product/42ITL, last access: 11 July 2023). This instrument was located at the roof of the AIRCAS building at approximately 20 m from the Pandora instrument, during the period 10–30 January 2022 (20 d). The Thermo Scientific 42i-TL analyzer measures the chemiluminescence caused by the reaction of NO with ozone, where NO is produced from the dissociation of NO2 (2 NO2 ↔ 2 NO + O2) on a heated molybdenum surface. The chemiluminescence intensity is proportional to the NO concentration (Kley and McFarland, 1980). More detailed information is provided in the instrument's manual (https://www.manualslib.com/manual/1251056/Thermo-Scientific-42i.html, last access: 11 July 2023). The Thermo Scientific NO2 data used in this study were screened for high quality using the quality flags, and anomalous data were discarded.
2.2.4 Reanalysis data
ERA5 hourly reanalysis wind data, available from the European Centre for Medium-Range Weather Forecasts (ECMWF, https://www.ecmwf.int/, last access: 11 July 2023), were used in the data analysis. This data set provides hourly atmospheric and oceanic information such as wind speed, temperature, and specific humidity at different pressure levels. ERA5 hourly wind speed data at four pressure levels (925, 950, 975, and 1000 hPa) were downloaded from the ECMWF website (ERA5: https://cds.climate.copernicus.eu/cdsapp#!/dataset/reanalysis-era5-pressure-levels?tab=form, last access: 11 July 2023, Hersbach et al., 2023) and averaged (following Stein et al., 2015; Ialongo et al., 2020; X. Zhao et al., 2022) for use in the analysis presented below.
2.3 Methodology
For the evaluation of the NO2 observations, different methods are used, such as time series to show the variability on different timescales or the effects of external parameters such as wind speed, averaging to reduce short-time variability, and scatterplots for comparison with independent data sets. For the comparison between Pandora and TROPOMI NO2 VCDs, the data need to be collocated. Furthermore, the difference in observation geometry needs to be taken into account. The Pandora bottom-up observations of direct and scattered (sky) solar radiation depend on the NO2 vertical profile, the spatial distribution, and the SZA (Boersma et al., 2011; van Geffen et al., 2015). For example, for a situation when most of the total VCD is located below 2 km and the SZA is 45∘, the total viewing area of Pandora with a FOV of () is about 128 m × 128 m. The TROPOMI top-down observations from space provide NO2 VCDs with a spatial resolution of 3.5 km × 5.5 km. To match the observation volumes, the TROPOMI observations were resampled to a spatial resolution of 100 m × 100 m, using Google Earth Engine (GEE; https://developers.google.com/earth-engine/guides/scale, last access: 11 July 2023). For an accurate comparison between TROPOMI and Pandora, only high-quality data were retained for the collocated TROPOMI–Pandora pixels. For time collocation, Pandora data obtained within 10 min of (both before and after) the TROPOMI overpass time were averaged. The resulting collocated TROPOMI and Pandora data sets were quantitatively evaluated using scatterplots and the statistical metrics mean difference (MD), mean absolute difference (MAD), mean relative difference (MRD), standard deviation (σ), correlation coefficient, and fitted slope.
MD is calculated by averaging the difference between two observations, as shown in Eq. (1):
MAD, given by Eq. (2), is defined as the mean of the absolute differences between TROPOMI and Pandora:
MRD, Eq. (3), is the mean of the differences between TROPOMI and Pandora when normalized with Pandora's VCDs:
Positive and negative values of the MRD indicate the degree of overestimation or underestimation.
The Pearson correlation R (Pearson, 1895) is defined in Eq. (4).
The standard deviation σ is defined in Eq. (5):
The dilution factor, Df, is defined in Eq. (6), where VCDTROPOMI,0.1 (median) and VCDTROPOMI,R (median) represent the median value of the TROPOMI VCD within a radius of 0.1 km and within a radius ρ around the location of Pandora, respectively (Chen et al., 2009; Griffin et al., 2019; Pinardi et al., 2020):
3.1 Pandora data overview
An overview of the Pandora data is presented in Fig. S1 in the Supplement, as time series for each month from August 2021 to July 2022, where the timescale is local time (i.e., China standard time, CST, locally called Beijing time, BJT, i.e., UTC + 8) throughout this paper. As an example, the data for November and December are enlarged in Fig. 2. Total NO2 VCD, tropospheric NO2 VCD, and surface NO2 concentrations are plotted in different colors, and only high- and medium-quality data are included (DQ0, DQ1, DQ10, and DQ11). Time series including also low-quality data (DQ2 and DQ12) are presented in Fig. S2. Although the use of low-quality data is not recommended, we have added this figure in the Supplement to show the high data density throughout the year. Overall, the NO2 concentrations are low in the summer and high in the winter, as is commonly observed in satellite data (van der A et al., 2006; Wang et al., 2019; Fan et al., 2021). For the tropospheric VCDs, including low-quality data adds 4681 data points to the total of 8620 data points during the 1-year study period (i.e., 54.3 % of all data are low quality). Among the total VCDs, 21 767 data points out of a total of 80 153 (27.2 %) are low quality. A comparison of Figs. S1 and S2 shows that low-quality data occur in particular during the winter months when the NO2 concentrations are high and aerosol (PM2.5) concentrations are also high, the boundary layer is shallow, the sky is often cloudy, and air quality is bad. These are conditions in which the data processing flags bad situations for some criteria, the reliability of the results decreases, and hence the DQ is increased to DQ2.
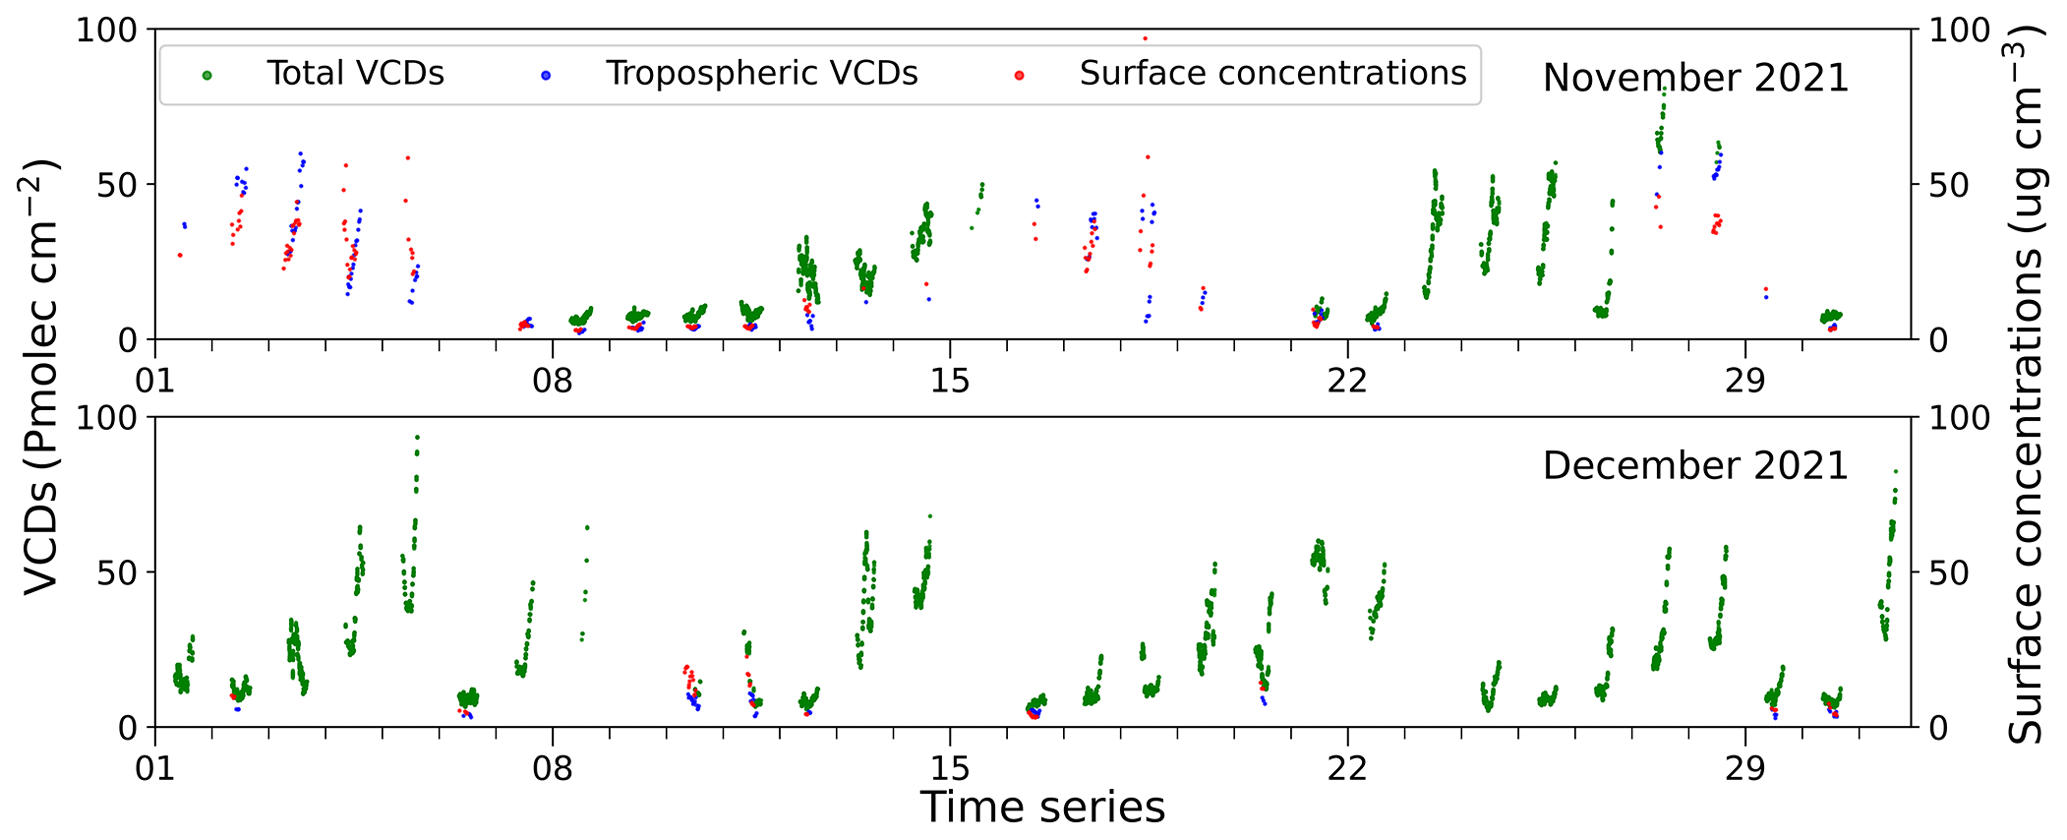
Figure 2Time series of NO2 data measured with Pandora at the Beijing-RADI site for November and December 2022 (the horizontal axes give the day of the month): total VCD in green and tropospheric VCD in blue (both on left vertical axes in ) and surface concentrations in red (plotted on the right axis in µg cm−3) Only data with DQ0, DQ1, DQ01, and DQ11 are plotted. Note that the surface concentration scale has been chosen such that data are plotted at the bottom of the VCDs.
3.1.1 Diurnal, day-to-day, and episodical variations
The data in Fig. 2 show the diurnal variation in the total and tropospheric NO2 VCDs, together with the surface concentrations derived from Pandora, with total VCDs larger than tropospheric VCDs. Although Pandora has the capability of using moonlight for the NO2 observations (Cede, 2021), the Beijing-RADI data include only daytime (solar) measurements. The NO2 VCDs decrease in the morning to reach a daily minimum around local noon and then increase. The complete diurnal cycle of surface concentrations measured with the Thermo Scientific 42i-TL analyzer, discussed in Sect. 3.4 and presented in Fig. 7, confirms these observations and shows that the maximum is reached during the night.
The time series in Fig. 2 show large variations in all three parameters over periods of several days, suggesting the occurrence of pollution episodes. An example is a long period from 11 to 19 November 2021 when the NO2 parameters are increasing until 15 November, whereafter the total VCDs are not available and the tropospheric VCDs and surface concentrations remain relatively high until 19 November. On other occasions the tropospheric VCDs and surface concentrations are not available, but the total VCDs increase over a period of several days. For example, this is observed in December 2021 during five different periods: 1–5, 7–9, 11–13, 16–22, and 25–28 December. Comparison with data from the nearby national air quality monitoring site in the Olympic Forest Park in Beijing (Fig. S3) shows that these periods coincide with similar behavior of the air quality (as indicated by the air quality index, dominated by high aerosol (PM) concentrations) and the associated NO2 time series (in situ). The variation in the NO2 concentrations and the occurrence of haze episodes is strongly related to the wind direction and the wind speed, the influence of which will be discussed in Sect. 3.2.
3.1.2 Monthly mean NO2 VCDs
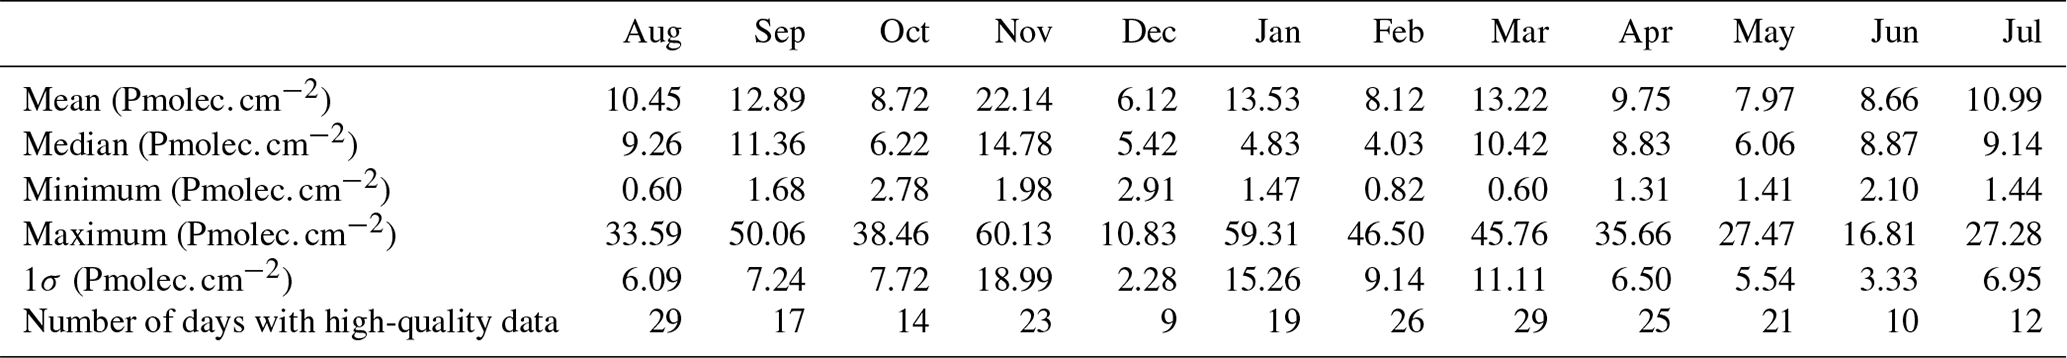
As shown in Fig. 2, apart from diurnal and short-term variations, there is also a clear seasonal variation in the NO2 VCDs. This is further illustrated in Fig. 3 where time series are plotted for the mean and median of monthly mean tropospheric VCDs (calculated from daily averages) derived from Pandora measurements during the period from August 2021 to July 2022. Only the data measured between 08:00 and 17:00 CST, corresponding to daylight hours during the winter, have been included, with DQ0, DQ1, DQ10, and DQ11. This selection of high-quality data reduces the number of days for which data are available but ensures reliability. A similar figure also including DQ2 and DQ12 data is included as Fig. S4, which shows that in the autumn and winter the NO2 VCDs are high and that they are low in the spring and summer, in good agreement with the seasonal variation which is commonly observed in satellite data (van der A et al., 2006; Wang et al., 2019; Fan et al., 2021). The number of days for which data are available for each month is included in Table S1 and Fig. S2 (including DQ2 and DQ12). Comparison shows that mainly the monthly mean VCD for December 2021 is affected by the data selection: the number of days is reduced from 31 to 9, and apparently mainly data with high VCDs, i.e., during days with bad AQ (Sect. 3.1.1), were removed by the DQ2 criteria. As a result, the annual cycle of the mean tropospheric NO2 VCDs is not as obvious in the high-quality data as in Fig. S4, which clearly shows the maximum occurring in the winter and the minimum in the summer. Such an annual variation pattern is in good agreement with near-surface observations of in situ NO2 measurements in Beijing. The mean, median, minimum, and maximum values, as well as the standard deviation (σ), of the tropospheric NO2 VCDs over Beijing for each month are summarized in Table 1. The difference between the median and mean values is significantly larger in the winter months than in the summer. The variability in the NO2 VCDs over Beijing is much higher during the winter than in the summer. The minimum in February 2022, as compared to January and March, illustrates the effectiveness of the emission control policy in and around Beijing during the 2022 Winter Olympics (Chu et al., 2022). Time series of the monthly mean total VCDs are presented in Fig. S5 and show similar variation to that for the tropospheric VCDs in Fig. 3.
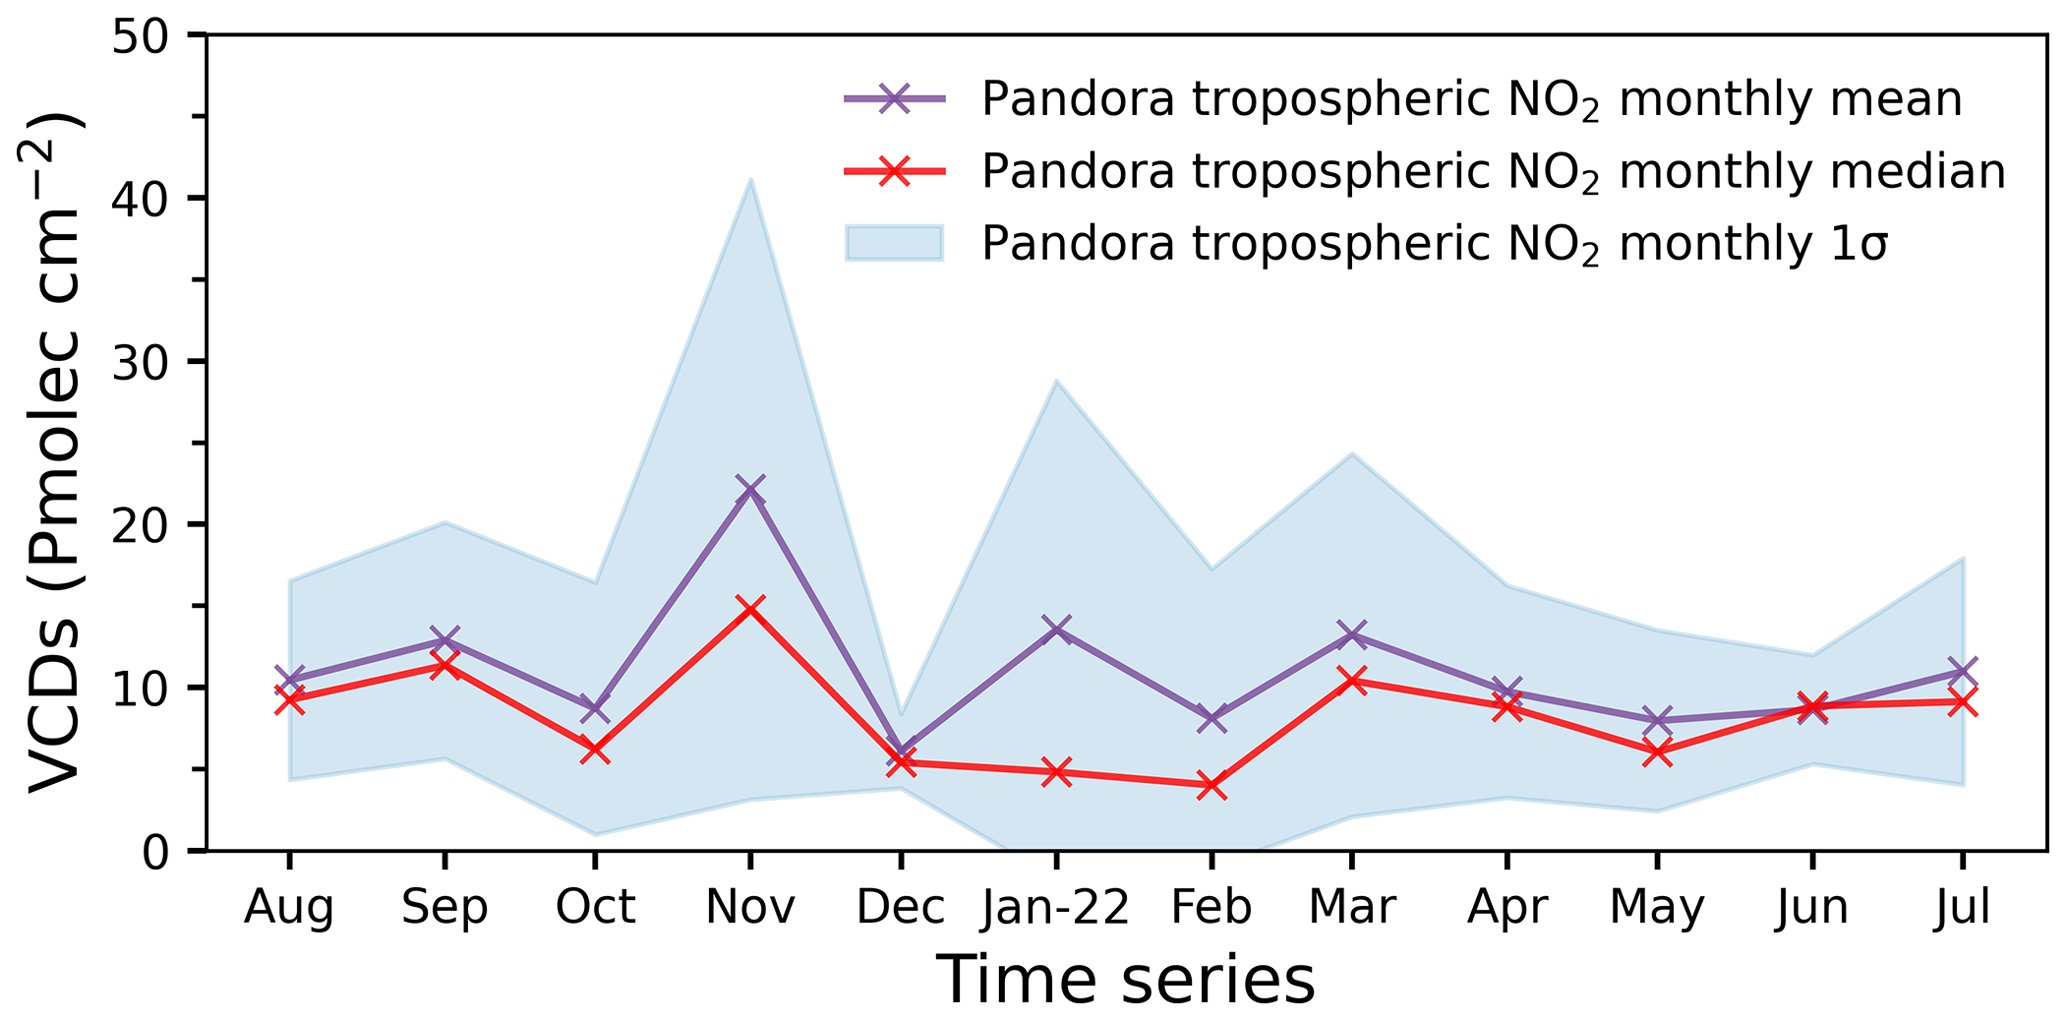
Figure 3Time series of the monthly mean and median tropospheric NO2 VCDs over Beijing from August 2021 to July 2022. Only high-quality data (DQ0, DQ1, DQ10, and DQ11) are included, which limits the number of days for which data are available as indicated in Table 1. The blue-shaded area indicates the standard deviation for the monthly mean data. Monthly mean data were calculated from daily means.
Table 1Statistics of the Pandora-derived monthly mean NO2 tropospheric VCDs. Only data with DQ0, DQ1, DQ10, and DQ11 are included.
3.2 Impact of wind direction and wind speed on NO2 VCDs in Beijing
The wind influences the concentrations of atmospheric constituents, and thus air quality, in several different ways. The wind transports aerosols and trace gases away from their sources and thus disperses them, leading to lower concentrations. This includes both vertical mixing due to wind-generated turbulence and advection (horizontal transport). This also implies that at very low wind speed the constituents accumulate, which leads to enhanced concentrations (Feng et al., 2014) and, in particular due to (photochemical) reactions, the formation of haze (An et al., 2019). The wind direction and its history indicate the transport pathways determined by large-scale weather phenomena (You et al., 2018; He et al., 2018; Hou et al., 2020; Li et al., 2021; W. Zhao et al., 2022). When the transport pathways cross source regions, the constituents are transported to the receptor point. Hence, depending on the wind direction, the wind transports polluted or clean air over long distances (Sundström et al., 2012).
To address the effect of advection on the NO2 tropospheric VCDs at the Beijing RADI site, a polar map has been created of NO2 tropospheric VCDs versus wind speed and wind direction (Fig. 4). To separate effects of wind direction and wind speed on NO2 VCDs from the large diurnal variations (Fig. 2), data have been plotted at 13:00 CST only when the concentrations are close to their daily minimum. The data in Fig. 4 show that, overall, the tropospheric VCDs are smaller during northwesterly winds, in particular when wind speeds exceed about 4 m s−1. This confirms that wind from these directions transport cleaner air to Beijing. As discussed in Sect. 2.1, the Yan and Taihang mountains are situated to the north and west of Beijing and the area between Beijing and the mountains is mainly agricultural with sparse population and little industry. Thus anthropogenic and industrial emissions over this area are small. Hence, during low wind speeds from this direction, relatively clean air is transported to Beijing. When wind speeds are higher, northwesterly winds from the Siberian plains bring clean air, thus greatly improving Beijing's air quality. As a result, the NO2 concentrations in the northwesterly wind sector are generally low, as shown in Fig. 4. However, the data in Fig. 4 show some exceptions when NO2 concentrations are high. Further analysis shows that these observations were all made during the winter and are likely due to NOx emissions from natural gas companies located in the Changping District in the northwest of Beijing. Natural gas is provided for, e.g., heating in the winter, and NOx is produced during the combustion process (Pan et al., 2023). Thus, in the winter, during northwesterly winds, NO2 is transported to the Pandora site. This explains the observations of high NO2 concentrations due to local emissions. (For more details of the high concentration number and time during northwest wind, please see Table S2.)
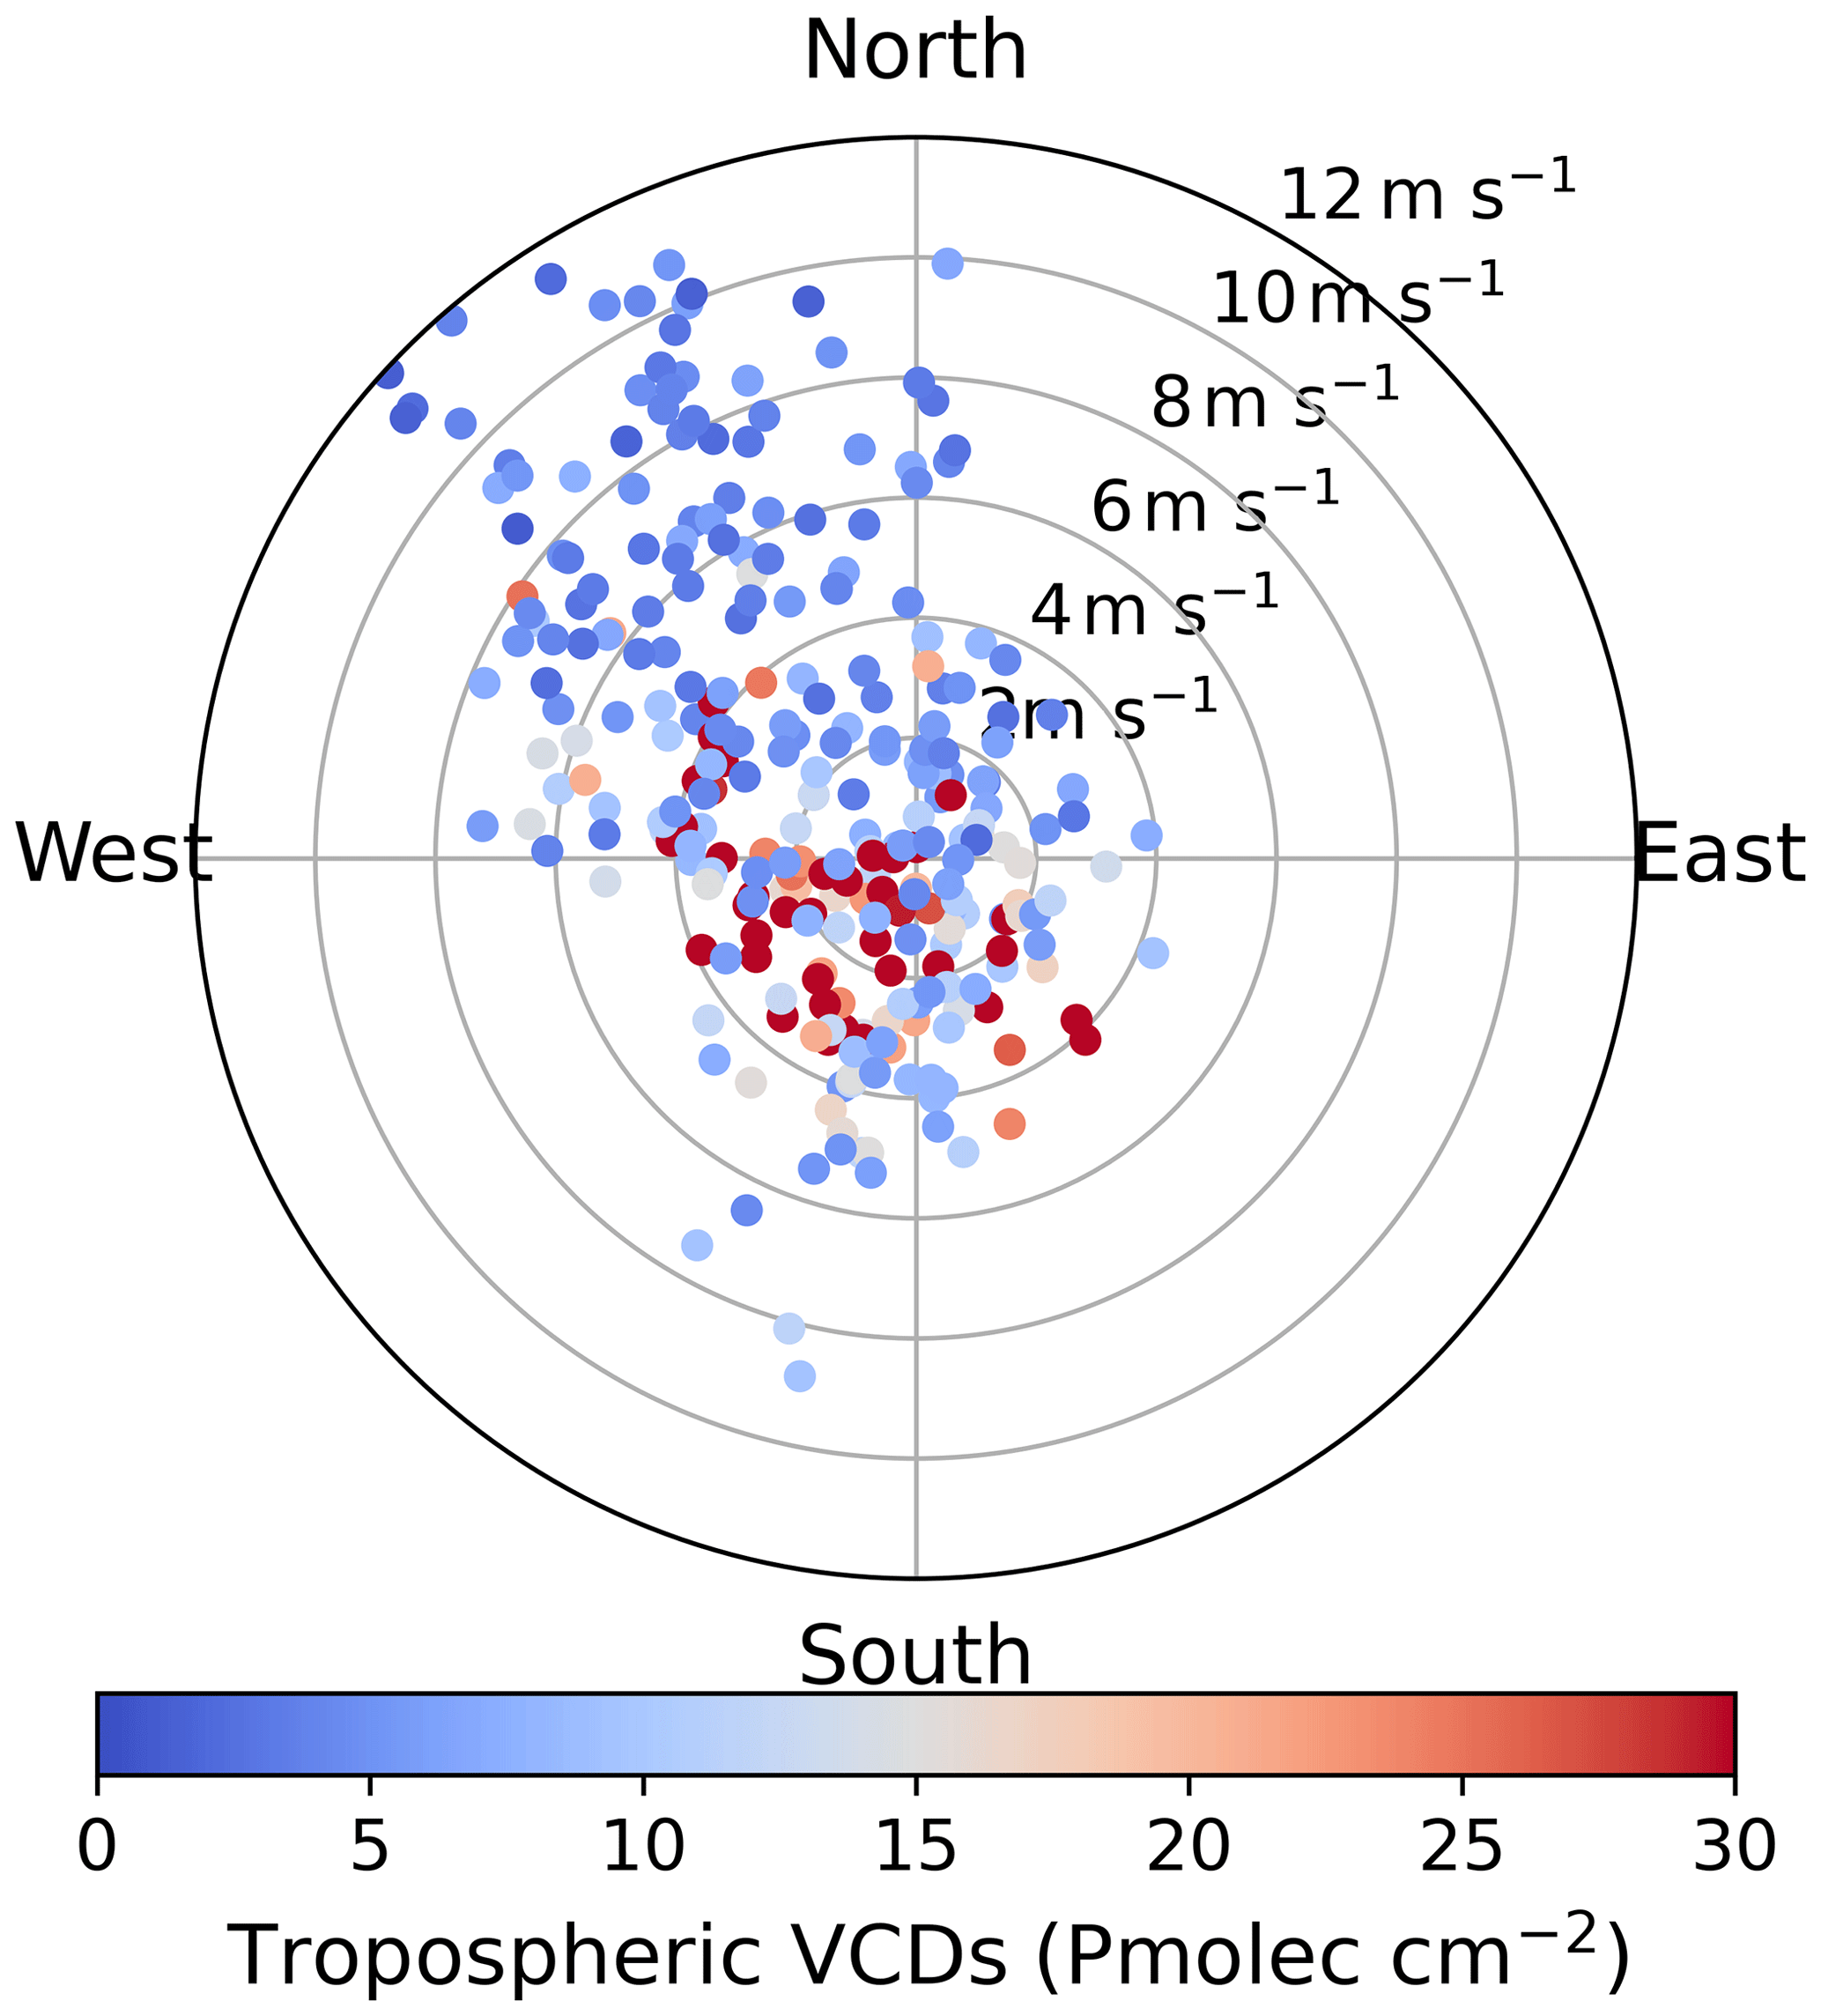
Figure 4Polar diagram of NO2 tropospheric VCDs, wind direction, and wind speed during the TROPOMI overpass time. Wind speed is indicated by the radius of the circles, ranging from 0 to 12 m s−1; wind direction corresponds to the angle in polar coordinates, clockwise from north. Note that the south wind direction indicates that the wind comes from the south.
During southerly winds, the NO2 VCDs are substantially higher. The high industrial activity and associated traffic and high degree of urbanization in the south of Beijing and the NCP lead to high emissions and, thus, during southerly winds, transport of large amounts of NO2 to Beijing. In addition, during low wind speed, the pollutants are accumulated, resulting in the observed very high pollution levels at low wind speed, in particular during southerly winds.
3.3 Tropospheric contribution to total NO2 VCDs
The total NO2 VCDs are determined from the Pandora direct-sun measurements, and the tropospheric NO2 VCDs are determined from the Pandora sky measurements. Hence the total and tropospheric NO2 VCDs are independently determined and can be used to obtain information on atmospheric processes. The data in Fig. 2 show the strong diurnal variation in both the total and the tropospheric NO2 columns, but the time series of the ratio of the tropospheric to the total NO2 VCD (see Fig. 5, where the ratios for February are shown as an example, and Fig. S6 for all months) show that they do not vary in the same way. Because direct-sun measurements are made more frequently than sky measurements, the ratios have been calculated using the first tropospheric VCD sky measurement available after a direct-sun measurement and then averaged to obtain daily and monthly means (Fig. 6). The results show that the fraction of tropospheric NO2 to total NO2 VCDs varies between about 0.2 and 1.05 (tropospheric VCDs should be smaller than or equal to the total VCDs; a value larger than 1 indicates the uncertainties in the data). The large diurnal and day-to-day variations in these ratios indicate that different processes in the troposphere and above affect NO2 concentrations. The data show that the tropospheric total ratio decreases to a minimum around the middle of the day; i.e., early in the day the tropospheric NO2 VCDs decrease faster than the total before they increase in the afternoon. This is due to a combination of processes including sources and sinks of a (photo)chemical nature (Herman et al., 2009), transport influenced by meteorological phenomena such as variations in wind speed and wind direction (discussed above in Sect. 3.2), and variations in boundary layer height while also the temperature profile changes throughout the day, influencing reaction rates and chemical balance (see Kang et al., 2022, for a brief overview). Likely all of these are different between the troposphere and above and therefore influence the ratio of tropospheric total NO2 VCD and its daily evolution.
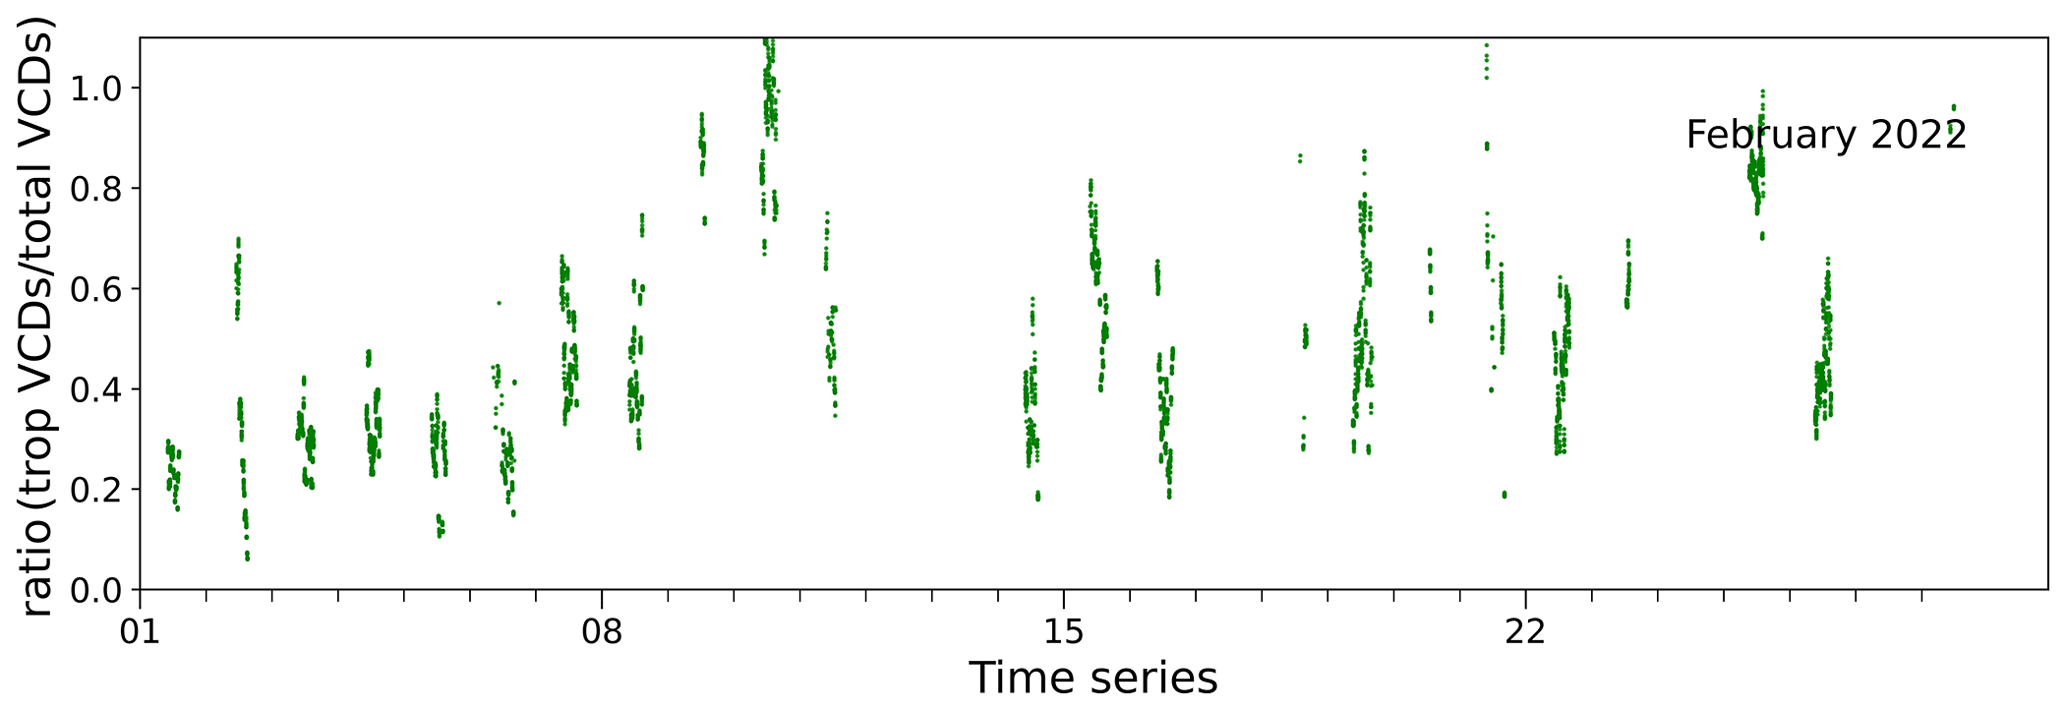
Figure 5Time series of the ratios of tropospheric VCDs to total VCDs during February 2022. The horizontal axis gives the day of the month.
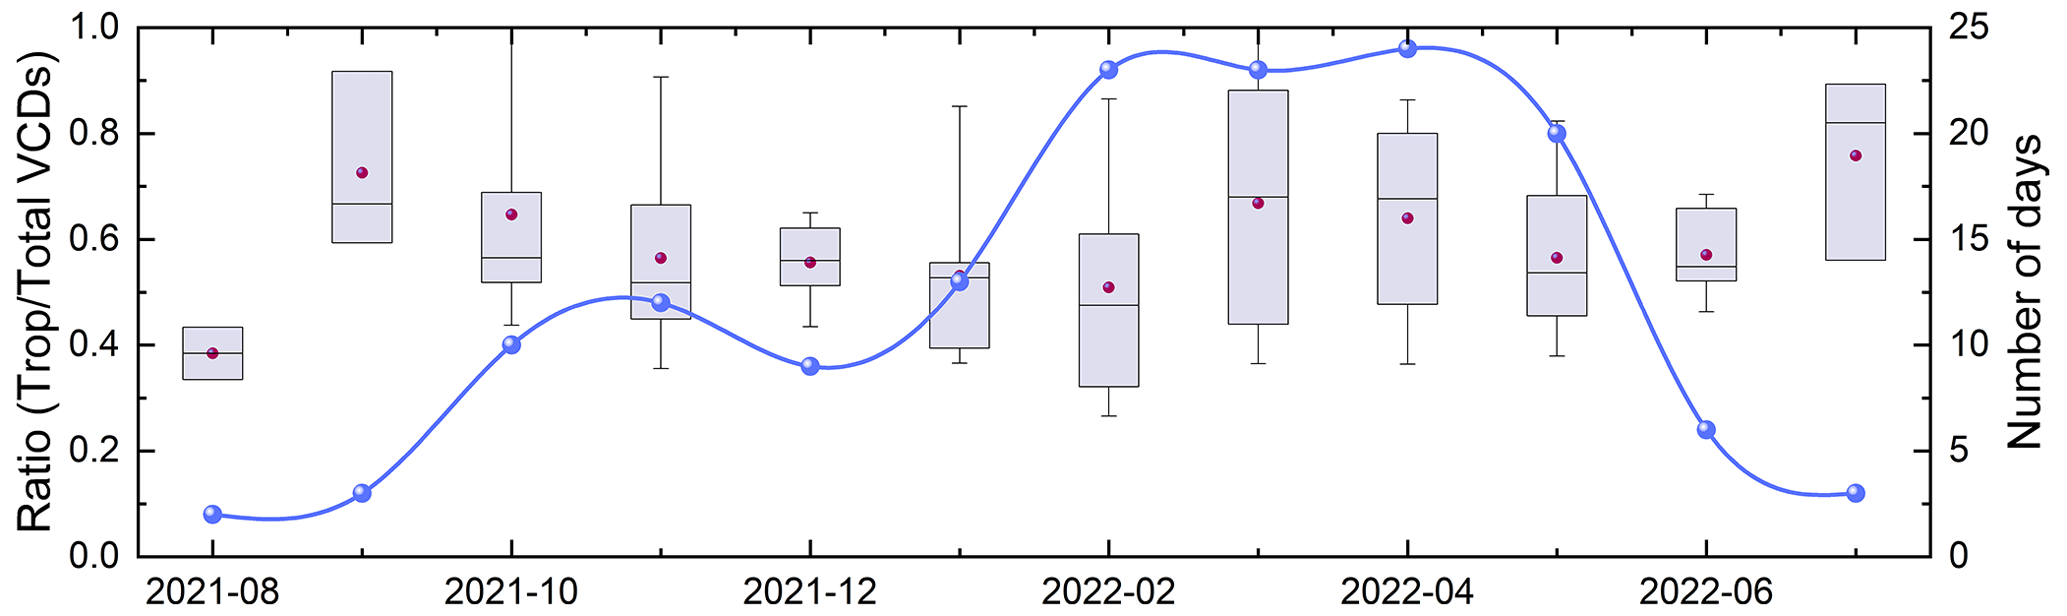
Figure 6Box-and-whisker plot of the monthly mean ratios of NO2 tropospheric VCDs to total VCDs from August 2021 to July 2022, with the number of valid data in each month plotted as a blue dot (right-hand axis). For each data point, the dot represents the mean value, the horizontal line represents the median value, the top and bottom edges of the boxes are the 25 % and 75 % quartiles, and the whiskers are the values corresponding to 10 % and 90 % of the data volume. The date format of the horizontal axis is year-month.
The monthly mean ratios of the NO2 tropospheric to total VCDs derived from the Pandora measurements at the Beijing-RADI site are plotted as time series in Fig. 6, together with the number of days for which data are available in each month. The results in Fig. 6 show that the monthly mean ratios vary between about 0.38 and about 0.75, and there is some inter-monthly variation. Considering only months with 10 or more days for which data are available, the monthly averages show that, on average, the tropospheric NO2 contribution is 50 % to 60 % in the winter and 60 % to 70 % in the spring and autumn. The smaller ratio in the winter may be related to the frequent occurrence of haze days when tropospheric NO2 is converted to fine particulate matter (Zheng et al., 2015; Xie et al., 2015; Wang et al., 2020), whereas the larger ratio in spring can be derived from reduced stratospheric concentrations due to enhanced solar shortwave radiation (Cheng et al., 2016; Müller, 2021). Similarly to ozone, stratospheric intrusion could be a possible reason for the springtime increase in tropospheric NO2 concentrations (Lin et al., 2015) because the higher values in the stratosphere have been observed in many studies (Sioris et al., 2003; Hendrick et al., 2004; Preston et al., 1998). Also, the larger standard deviations in spring (especially in March when it was larger than 0.2) indicate a larger day-to-day variability than in other seasons, which may be due to more active photochemical reactions in response to enhanced radiation intensity.
3.4 Comparison of Pandora-derived surface NO2 concentrations with ground-based in situ measurements
During the study period, the Thermo Scientific 42i-TL analyzer was operated side by side with the Pandora instrument during a period of 20 d in January 2022. The collocation of these two instruments provides an excellent opportunity for the evaluation of the ground-based NO2 concentrations derived from Pandora sky measurements, using the in situ data from the Thermo Scientific 42i-TL analyzer as reference. Figure 7 shows the time series of these two data sets. The in situ observations were made continuously, 24 h per day, but the Pandora measurements were only made during daylight hours. In addition, there are many gaps in the Pandora time series because only the best-quality data (DQ = 0, 1, 10, 11) were retained. To fill part of these gaps, Pandora-derived total VCDs, for which many more high-quality data are available as shown in Fig. S2 and discussed in Sect. 3.1.1, have been included in Fig. 7.
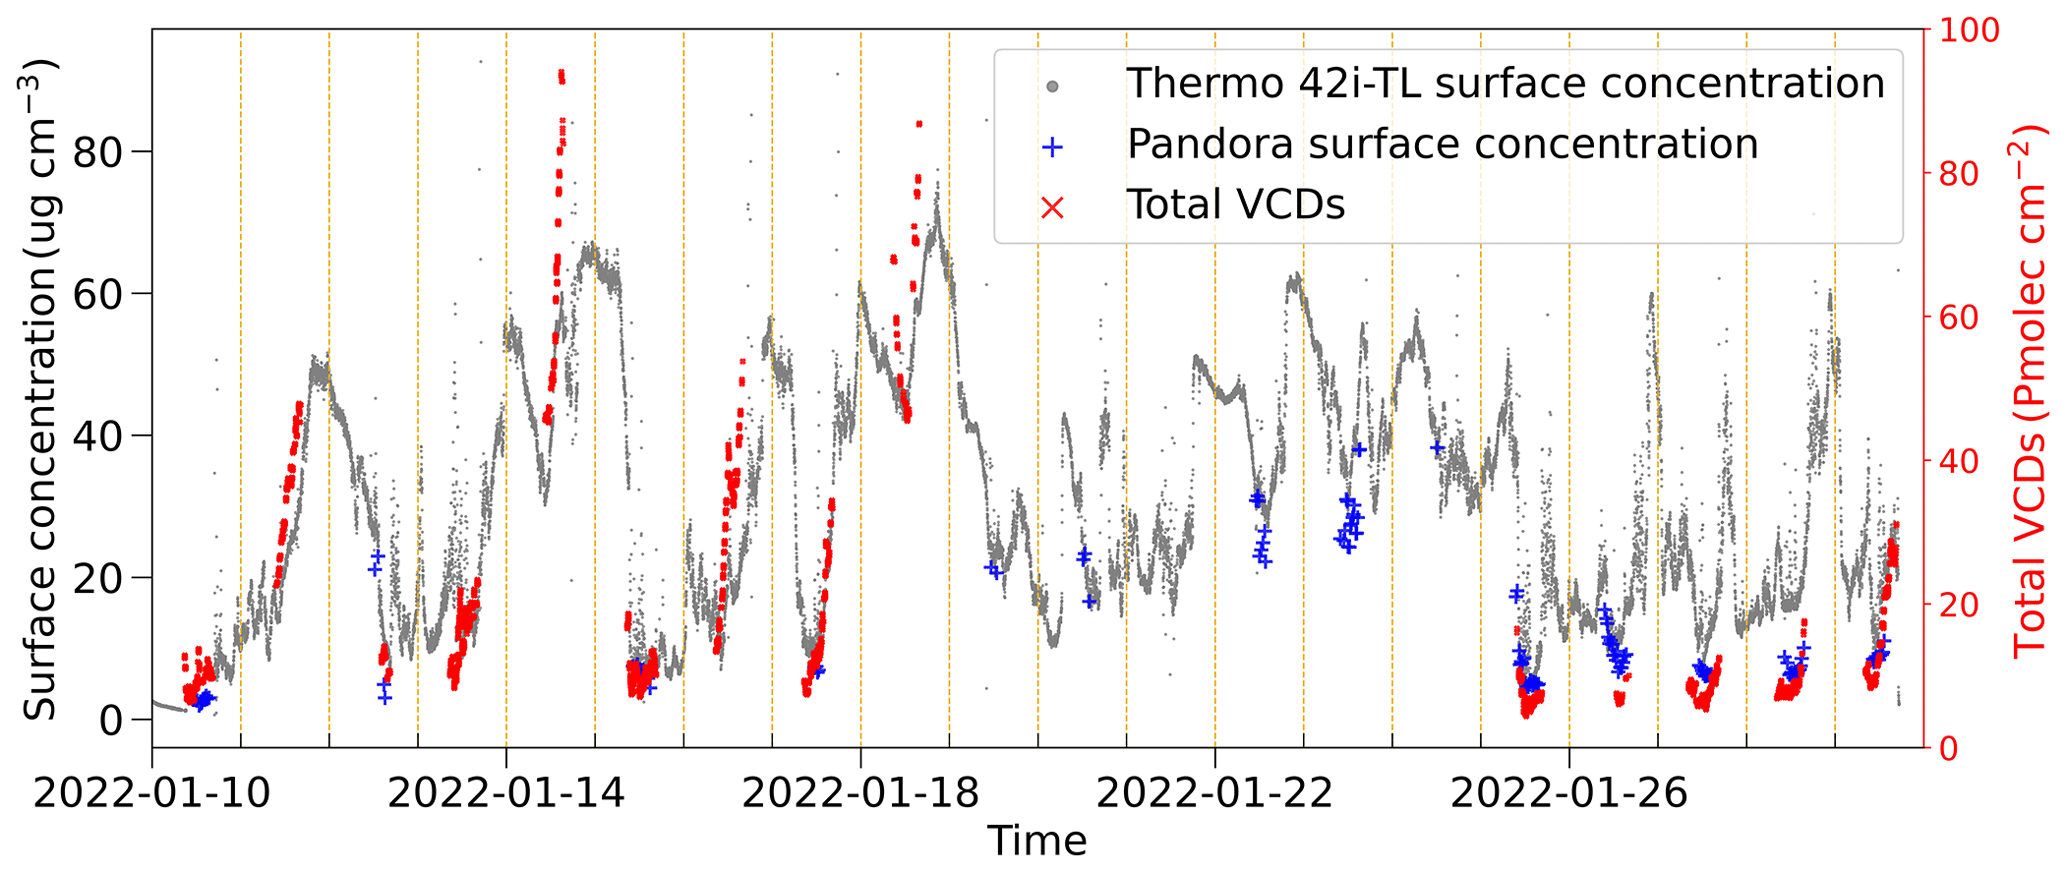
Figure 7Time series of NO2 surface concentrations measured using the Thermo Scientific 42i-TL analyzer (gray) and derived from the Pandora sky data (blue) and total VCDs (red) during 20 d: 10–30 January 2022. Dashed vertical yellow lines indicate 00:00 CST. Note that the NO2 total VCDs are plotted on the secondary vertical axis and scaled to match the Thermo 42i-TL analyzer surface concentration data. The date format of the horizontal axis is year-month-day.
The continuous time series of the ground-based in situ measurements shows that the NO2 concentrations are usually high during the night, decrease after sunrise to a minimum in the afternoon, and increase thereafter. The observed diurnal variation in the NO2 concentrations is due to complex photochemical reactions between atmospheric gases such as nitrogen oxides (NOx), O3, and volatile organic compounds (VOCs) (Law et al., 2002; Xue et al., 2016). On days with large variations in the NO2 surface concentration, such as on 11, 14, 16, and 17 January 2022 (Fig. 7), the total VCDs measured with Pandora traced the surface concentrations well (note that in Fig. 7 the total NO2 VCD data were scaled to match the Thermo 42i-TL analyzer surface concentrations). In addition, the data show that on 11 and 16 January, the total VCDs increased earlier than the surface concentrations, suggesting that the increase in the NO2 VCDs on these two dates resulted from atmospheric transport. On 14 January, the surface concentrations changed before the total VCDs increased, suggesting the occurrence of an NO2 source near the surface from where NO2 was vertically mixed, resulting in the subsequent increase in the tropospheric VCDs.
The data in Fig. 7 further show that the Pandora-derived surface NO2 concentrations are overall relatively low as compared with the in situ concentrations measured with the Thermo Scientific 42i-TL analyzer. This is further illustrated in the scatterplot of the Pandora-derived NO2 surface concentrations versus the Thermo Scientific 42i-TL analyzer in situ data (Fig. 8). Figure 8 shows that there are two data regimes: for low in situ NO2 concentrations, up to about 22 µg cm−3, the Pandora-derived surface concentrations trace the in situ concentrations but vary over a much smaller range (between about 5 and 10 µg cm−3). For larger NO2 concentrations, the Pandora-derived surface concentrations are closer to the in situ data but with a substantial underestimation. Similar differences have been reported between NO2 concentrations retrieved from MAX-DOAS measurements, which use a similar technique to that used for Pandora to derive surface concentrations, and NO2 point measurements using instruments mounted on a mast at three heights above the surface (a.s.l.), which, like the Thermo Scientific 42i-TL analyzer, derive the NO2 concentrations from chemiluminescence measurements (Kang et al., 2021). These authors report that MAX-DOAS substantially underestimates the in situ concentrations, by about 65 % at 60 and 160 and by 33 % at 280 , but do not offer an explanation. Below we discuss the Pandora and chemiluminescence data and influencing factors which may contribute to the observed differences.
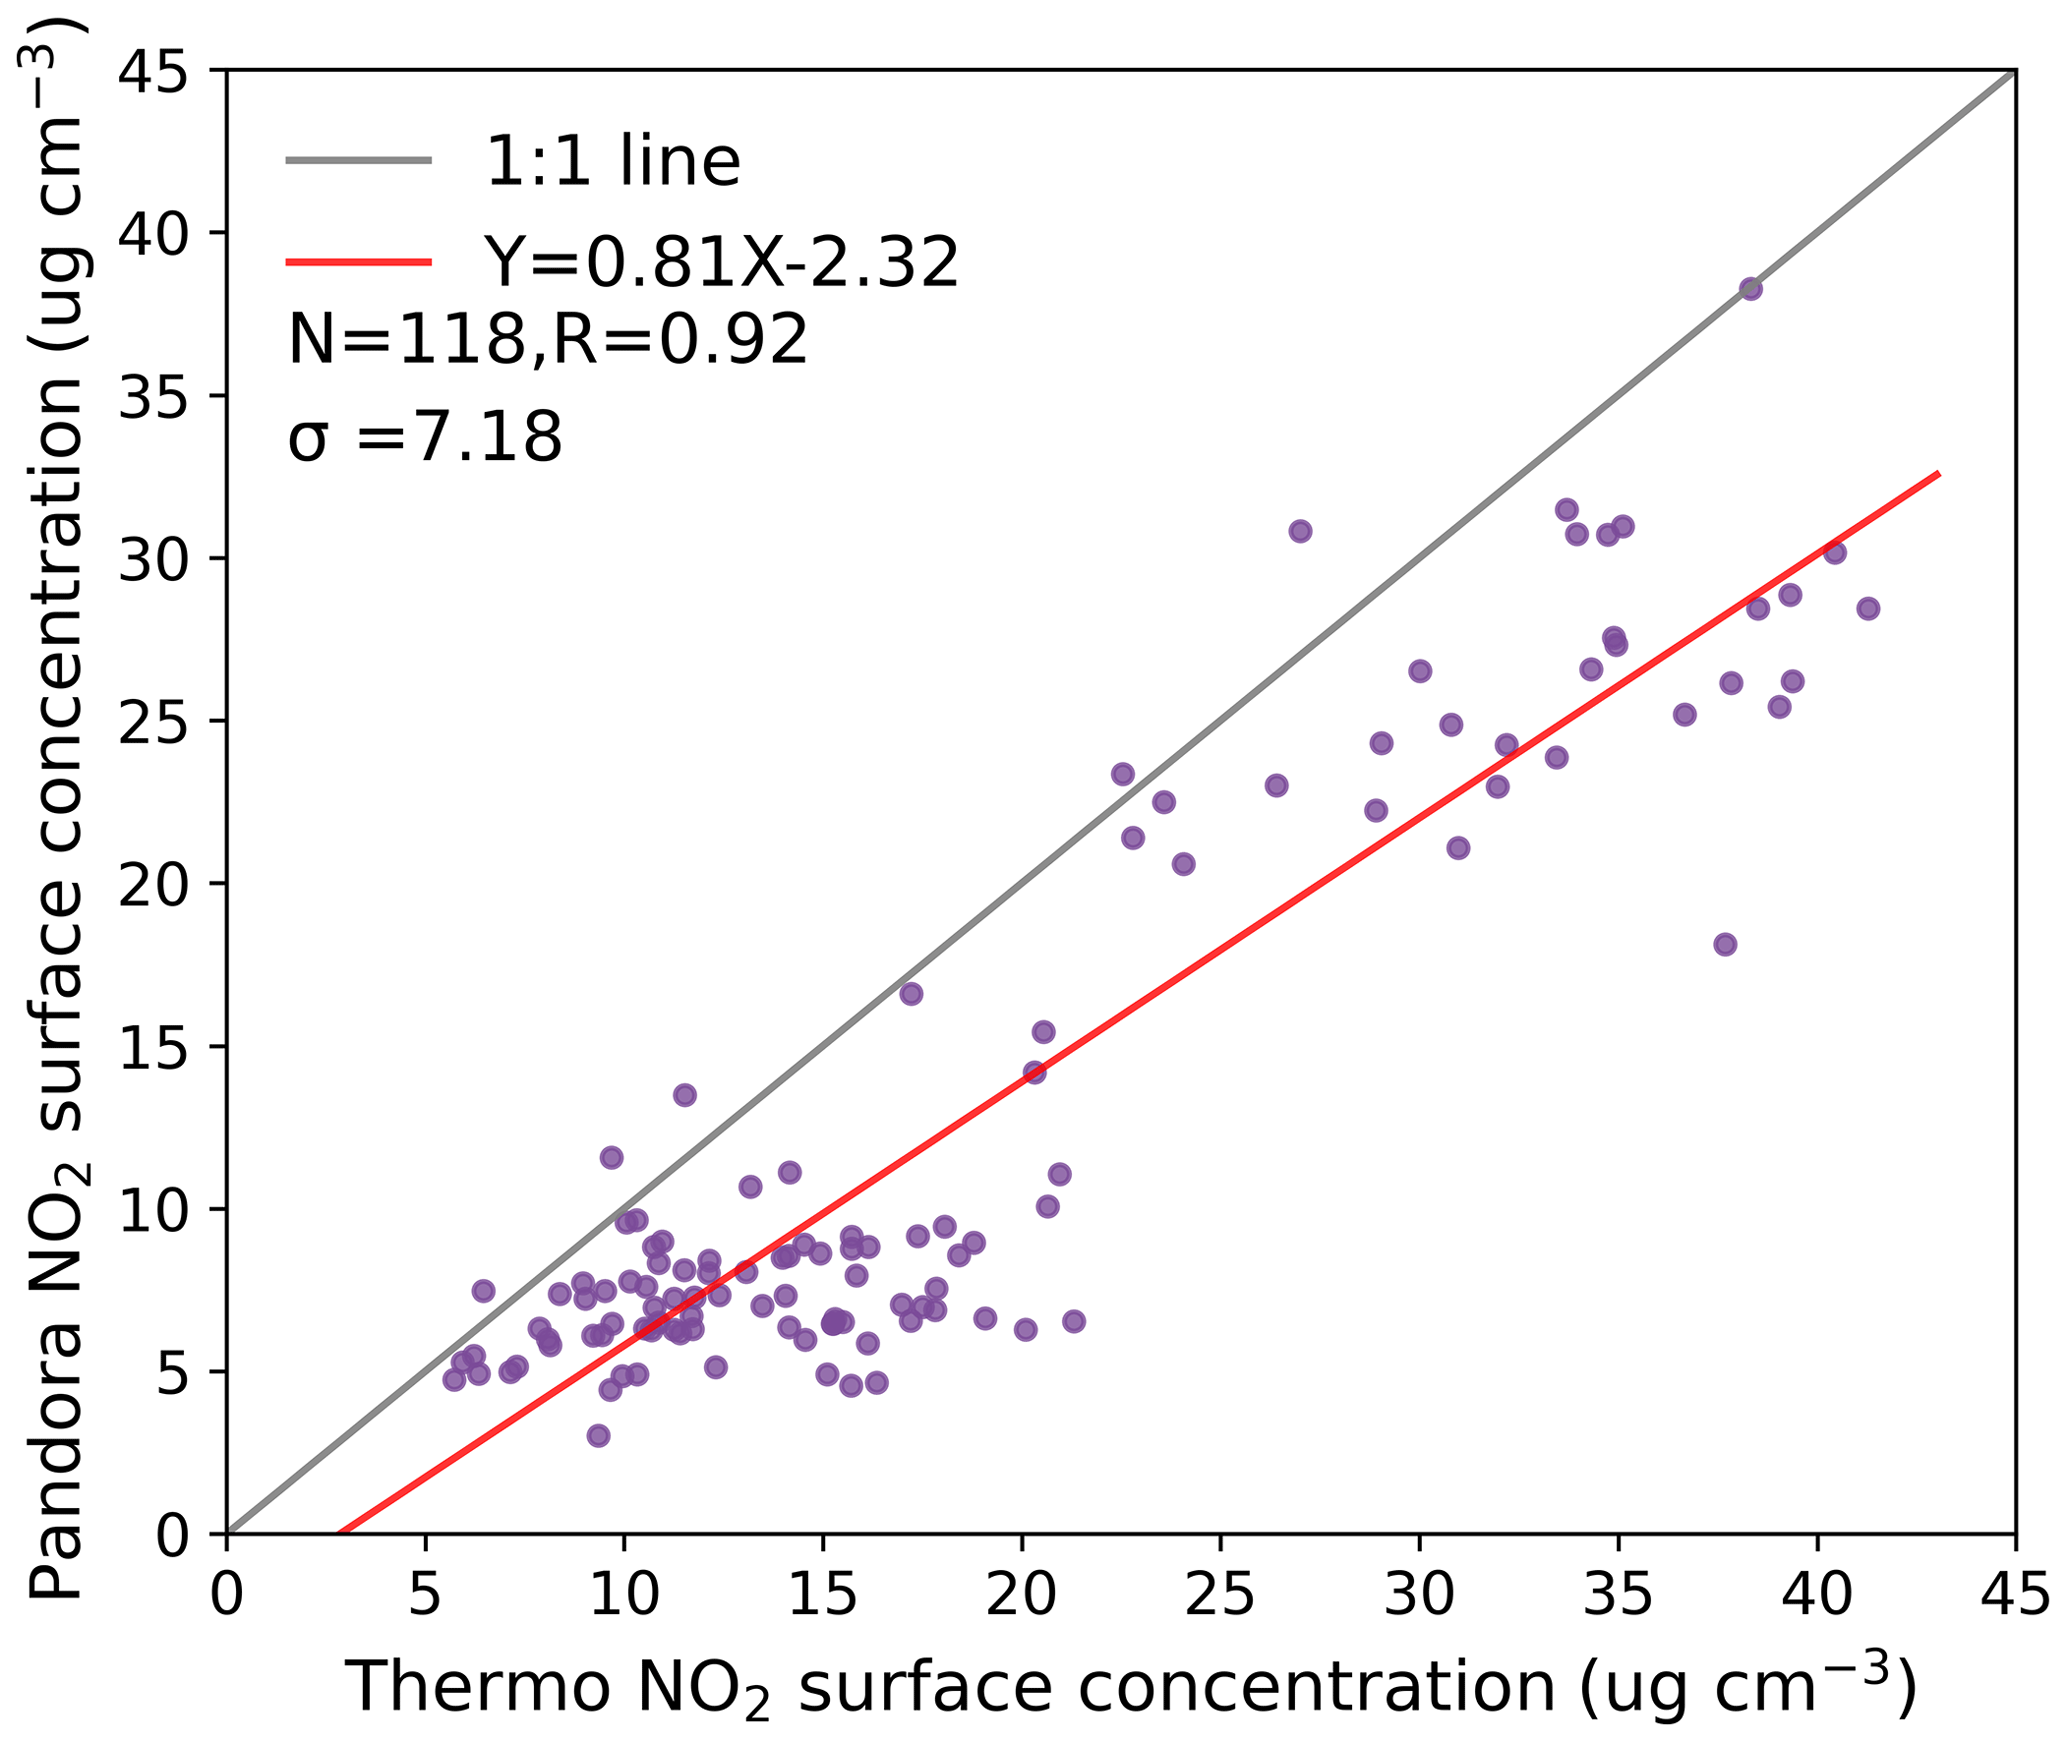
Figure 8Scatterplot of NO2 surface concentrations: Pandora data versus Thermo Scientific 42i-TL analyzer data.
The Pandora surface concentration is derived from the ratio of the difference between the SCDs of NO2 at the largest and smallest SZA and the same difference for air, i.e., (SCDPandora,max − SCDPandora,0)(SCDAIR,max − SCDAIR,0) (Cede, 2021). In view of the exponential decrease in NO2 concentrations with height as reported by Kang et al. (2021), the slant optical path at Pandora's maximum observation angle, which is slightly less than 90∘, implies that the NO2 concentration is integrated over a certain height with a negative NO2 concentration gradient. As a result, the measured concentration is lower than that at the surface which is measured by the Thermo Scientific 42i-TL analyzer.
Furthermore, Pandora measures the average NO2 concentration along the (slant) optical path, whereas the Thermo Scientific 42i-TL analyzer provides a local value at the location of the instrument (Kang et al., 2021) which may be more sensitive to local variations, such as short-term emissions by passing cars or turbulent perturbations of plumes.
Another factor influencing the comparison of Pandora and in situ measurements of NO2 concentrations using a Thermo Scientific 42i-TL analyzer is that this instrument may overestimate atmospheric NO2 concentrations due to interference from other atmospheric constituents which react with ozone to produce chemiluminescence, such as peroxyacetyl nitrate and nitric acid (Dunlea et al., 2007; Steinbacher et al., 2007) or alkenes (Alam et al., 2020). In particular, during the Beijing winter the nitrate concentrations are high (Luo et al., 2019; W. Wang et al., 2021) and may contribute to overestimation of the NO2 concentrations measured by the thermo-chemiluminescence method.
3.4.1 Difference between Pandora and in situ surface NO2 concentrations for different concentration regimes
As mentioned above, Fig. 8 shows two groups of data which are separated according to low and high NO2 concentrations. Comparison with the polar diagram in Fig. 4 shows that, for the TROPOMI overpass time, the low NO2 concentrations mainly occur during northerly winds, whereas high concentrations are mainly observed during southerly winds and more specifically for wind directions between about 135 and 315∘. The scatterplot in Fig. 8 includes all observations for a short time period. To further investigate the different NO2 regimes revealed in Fig. 8, wind direction has been added to the time series plot of Fig. 7, as well as aerosol optical depth (AOD), and the results are presented in Fig. S7. Figure S7 confirms that the conclusions from Fig. 4, for TROPOMI overpass times, also apply to the observations at other times, i.e., that the low surface NO2 concentrations (< 10 µg cm−3) derived from Pandora almost all occur during northerly winds, are smaller than the in situ concentrations measured at the same time with the Thermo Scientific 42i-TL analyzer, and trace the latter well. This is well-illustrated on 26 January when the surface concentrations initially decrease (from about 15 and 24 µg cm−3 for Pandora and in situ, respectively) to a minimum and then increase. This variation may be due to a combination of the diurnal variation described in Sect. 3.1 and the change in wind direction and thus transport pathway. During southerly winds the Pandora-derived surface NO2 concentrations are substantially higher (>15–20 µg cm−3) and increase with increasing in situ data. In particular for in situ concentrations between about 30 and 40 µg cm−3, there is a good correlation although Pandora data are still underestimated as discussed above. The data in Fig. S7 also show the large changes occurring during changes in wind direction, in combination with diurnal variations.
The difference between the relations between Pandora-derived and in situ-measured surface NO2 concentrations for the regimes of low and high NO2 concentration may be explained as follows. During northerly winds, the contribution to the NO2 concentrations from transport over long distances is small because the air masses are transported over relatively clean areas. Thus, the main contribution to the concentration is due to local production of NO2 from anthropogenic activities near the surface, which is first observed by the in situ sensor. Pandora surface NO2 concentration is an integrated value over the height range covered by the largest SZA. Mixing of the surface-produced NO2 over this height range takes some time, and thus there is a concentration gradient resulting in a lower value of the Pandora-derived surface concentration. In contrast, during southerly winds, the air mass transported to the measurement location has passed through an area with high NO2 concentrations and the contribution from local production of NO2 near the surface is relatively small. Thus, the NO2 concentration measured by the in situ sensor is relatively little enhanced due to local production as compared to that in northerly winds. Therefore, the Pandora-derived surface NO2 concentration compares better to the in situ data when the concentrations are high compared to when they are small.
3.4.2 Comparison with AOD
Figure S7 shows that the AOD and NO2 total VCD (both are column-integrated quantities measured using collocated ground-based instruments), trace each other very well. Thus the different relationships between MAX-DOAS- and tower-averaged NO2 concentrations for low and high AOD reported by Kang et al. (2021) occur for the same reason as the different relationship for low and high NO2 concentrations shown in Fig. 8 and discussed above. It is noted that the measurements reported by Kang et al. (2021) were made on a tower located in Beijing at ca. 5 km from the Beijing-RADI site and the conditions at both sites are similar.
3.5 Validation of TROPOMI NO2 VCDs over Beijing using Pandora
The Pandora instrument and the PGN were designed for satellite validation, i.e., providing VCDs as independent reference for the validation and evaluation of satellite data. Here Pandora data are used for the validation of TROPOMI NO2 total and tropospheric VCDs, resampled to a spatial resolution of 100 m × 100 m. Scatterplots of NO2 total and tropospheric VCDs from TROPOMI versus Pandora VCDs and histograms of the TROPOMI–Pandora differences are presented in Fig. 9. For TROPOMI, OFFL data were used, and for Pandora, only high-quality data with DQ0, DQ1, DQ10, and DQ11 were used. The Pandora quality control limits the number of suitable data, especially in June, July, August, and September (Sect. 3.1). The scatterplots in Fig. 9a and c show the good correlation of both the TROPOMI-derived NO2 total and tropospheric VCDs with the Pandora data. For the total VCDs, R=0.95, the slope of the least-squares (LSQ) fit is 0.96, and the MRD is −8.44 %, well below the expected deviation of 0.5 + (0.2 to 0.5) ⋅ VCDtrop (van Geffen et al., 2022b). Figure 9a shows that for small values of the total VCDs, the data points are very close to the identity line, whereas for VCDs > 10 , the differences are larger and the data points are rather evenly scattered around the identity line. The histogram of the differences between the TROPOMI and Pandora NO2 total VCDs in Fig. 9b shows a uniform distribution with the characteristics of a Gaussian distribution with the mean or median as the symmetry axis. On average, the mean TROPOMI total VCDs are slightly smaller than those from Pandora, with an MD of −1.16 , a MAD of 3.14 , and a standard deviation of 4.44 . This uncertainty is in part due to the large SZA, which leads to uncertainty in the air mass factor (AMF) (Herman et al., 2019; Griffin et al., 2019; Ialongo et al., 2020). In addition, a 10 % error in the AMF estimate due to cloud effects was reported in the ATBD (van Geffen et al., 2022b).
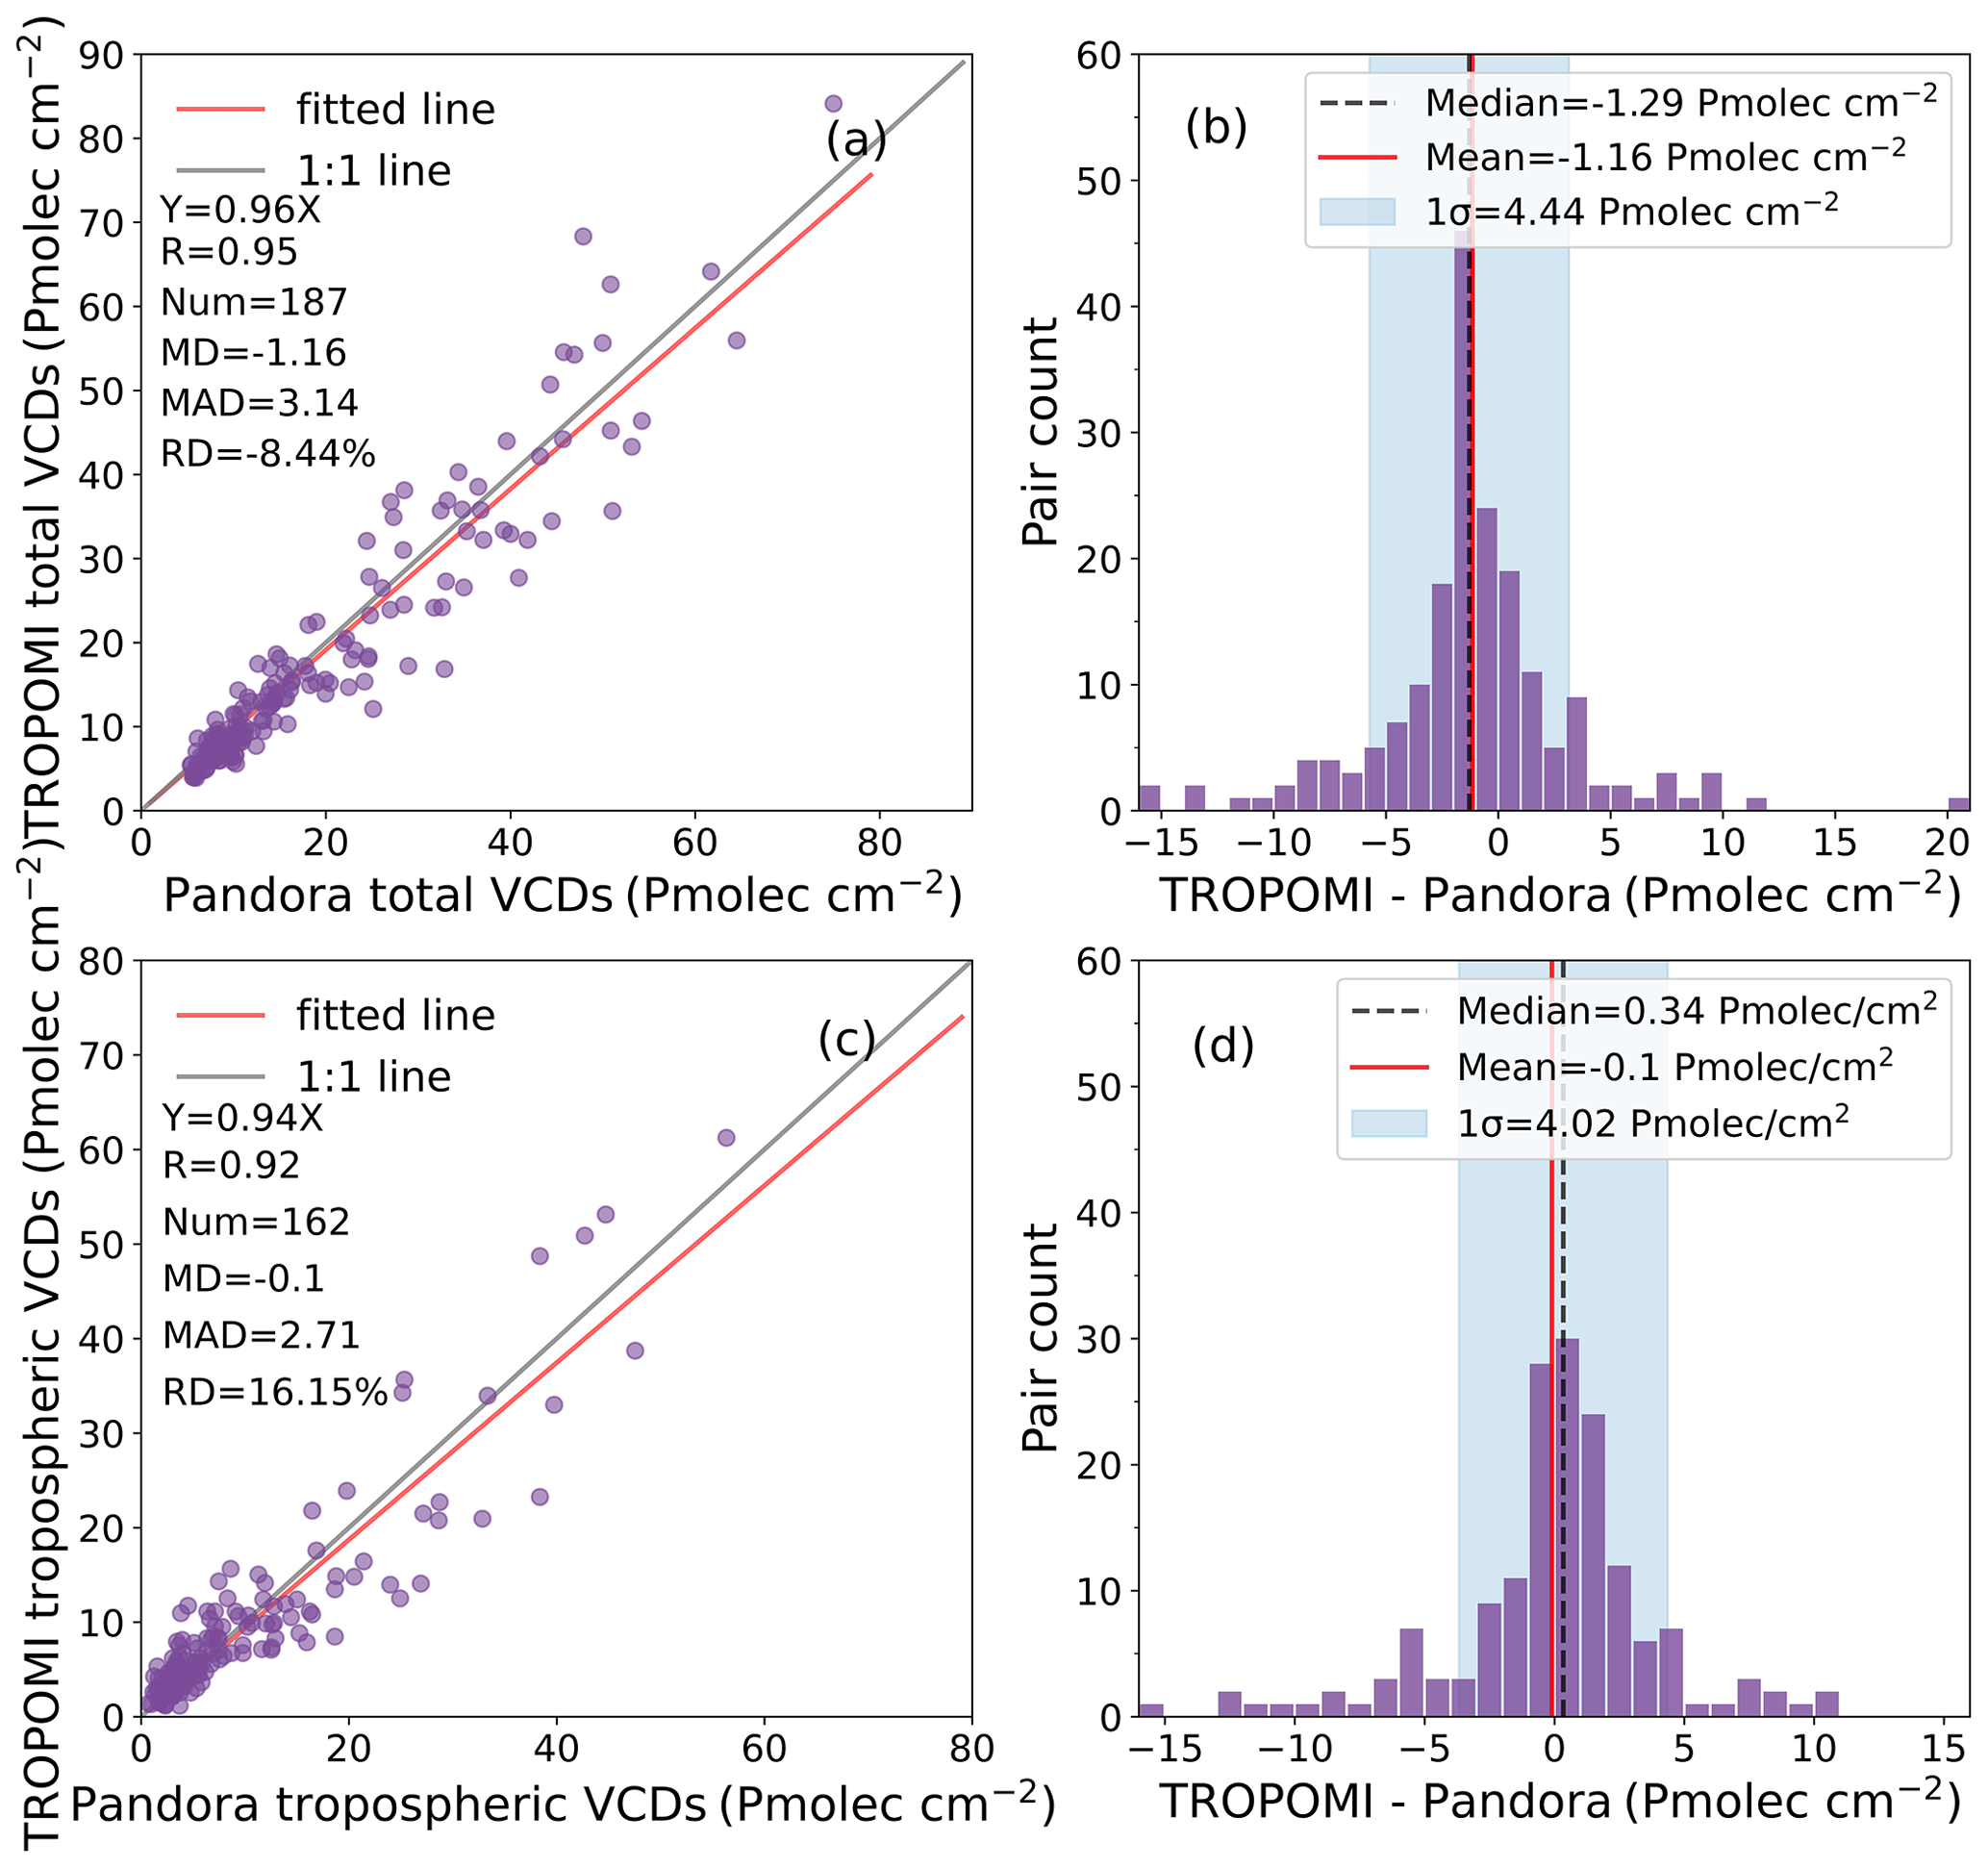
Figure 9Validation of TROPOMI total and tropospheric NO2 VCDs, resampled to a spatial resolution of 100 m × 100 m, using Pandora observations as reference data: (a, c) scatterplots of total and tropospheric TROPOMI vs. Pandora data together with statistical metrics; (b, d) histograms of the differences between TROPOMI and Pandora NO2 total tropospheric VCDs.
The validation of the TROPOMI-derived NO2 tropospheric VCDs is presented as scatterplots and histograms in Fig. 9c and d. As with the total VCDs, the TROPOMI tropospheric VCDs trace the Pandora data well and the scatterplot shows the good correlation between both data sets, with a correlation coefficient of 0.92, slightly smaller than for the total VCDs, and a somewhat smaller slope of 0.94, with an RD of 16.15 %. The histogram in Fig. 9d shows that the tropospheric VCDs are roughly symmetrically distributed around 0, and the number of large negative deviations (deviation < −10 ) is slightly larger than the number of positive deviations (deviation > 10 ).
The above analysis confirms the good performance of the TROPOMI NO2 total and tropospheric VCDs and provides confidence for the use of the TROPOMI data. For this analysis, the TROPOMI data were resampled to a spatial resolution of 100 m × 100 m, similar to the Pandora observation area.
3.6 Spatial representativeness of Pandora vertical column density
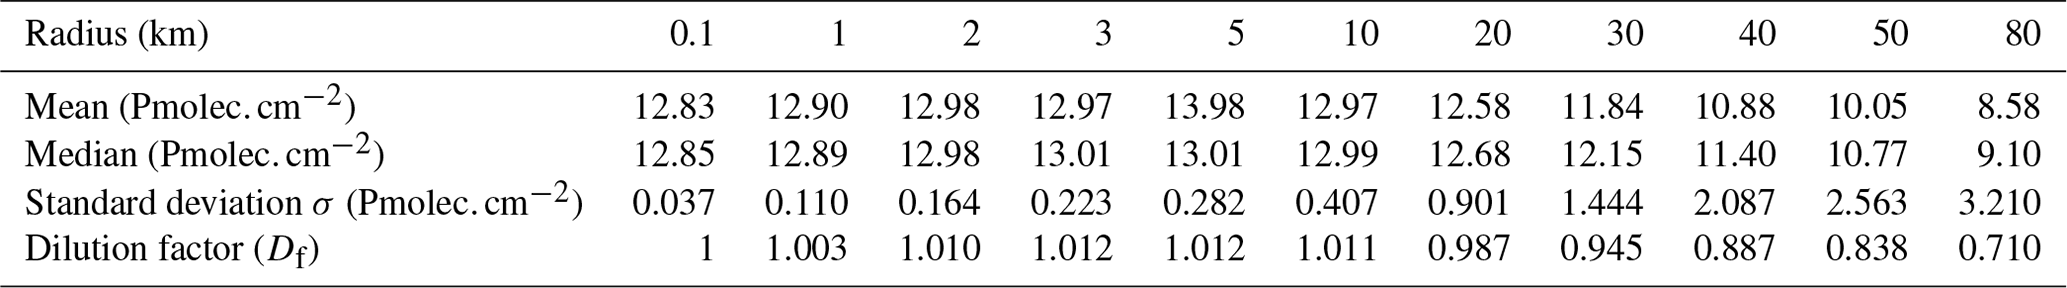
Considering the good performance of the TROPOMI-retrieved NO2 VCDs discussed in Sect. 3.5, these data have been used to evaluate the spatial representativeness of the Pandora observations at the Beijing-RADI site. Figure 10a shows the spatial distribution of the TROPOMI-derived NO2 tropospheric VCD over a wide area centered at the Beijing-RADI site averaged over the first year of Pandora operations (Fig. 1). Large differences are observed with high tropospheric NO2 VCDs over Beijing, Tianjin, and its highly industrialized surroundings and several other locations. Over the mountains to the north and west of the study area, the tropospheric NO2 VCDs are much lower, by a factor of 10 or more. The Beijing-RADI Pandora site is located in the area of high NO2 tropospheric VCD (as also shown in the enlarged panel of Fig. 1), while strong NO2 gradients are observed toward the north and west. Obviously, because of the variation in the NO2 VCD, the correlation between the TROPOMI and Pandora data is influenced by the choice of the area over which the TROPOMI data are averaged. In particular, this may happen when a separation between clean and polluted air occurs over Beijing, as reported, for instance, by Sun et al. (2017) (their Fig. 7). The effect of the size of the area over which TROPOMI data are averaged is illustrated in Fig. 10b, showing the annual mean (black) and median (red) tropospheric NO2 VCDs averaged over areas centered at the Beijing RADI Pandora site with increasing radius. The data show that, for this specific case when the TROPOMI NO2 VCDs are averaged over annual mean values, the area-averaged value remains constant within a radius of 10 km around the Pandora site and decreases when the radius is further increased. This is further illustrated by the data in Table 2, showing that for a radius larger than 10 km, the standard deviation (σ) increases as the radius increases. For less homogeneous NO2 distributions, the area for which the situation at the site is representative will be much smaller than 10 km. This also implies that the location of the Pandora site influences the validation results. The data in Table 2 show that for a circle of 3 km, the σ is 0.223 and for a circle of 5 km it is 0.282 . This means that when the Pandora site is at a different location in an overpass pixel, the 3.5 km × 5.5 km FOV produces an error in the NO2 tropospheric VCD between 0.223 and 0.282 , i.e., between 1.7 % and 2 %.
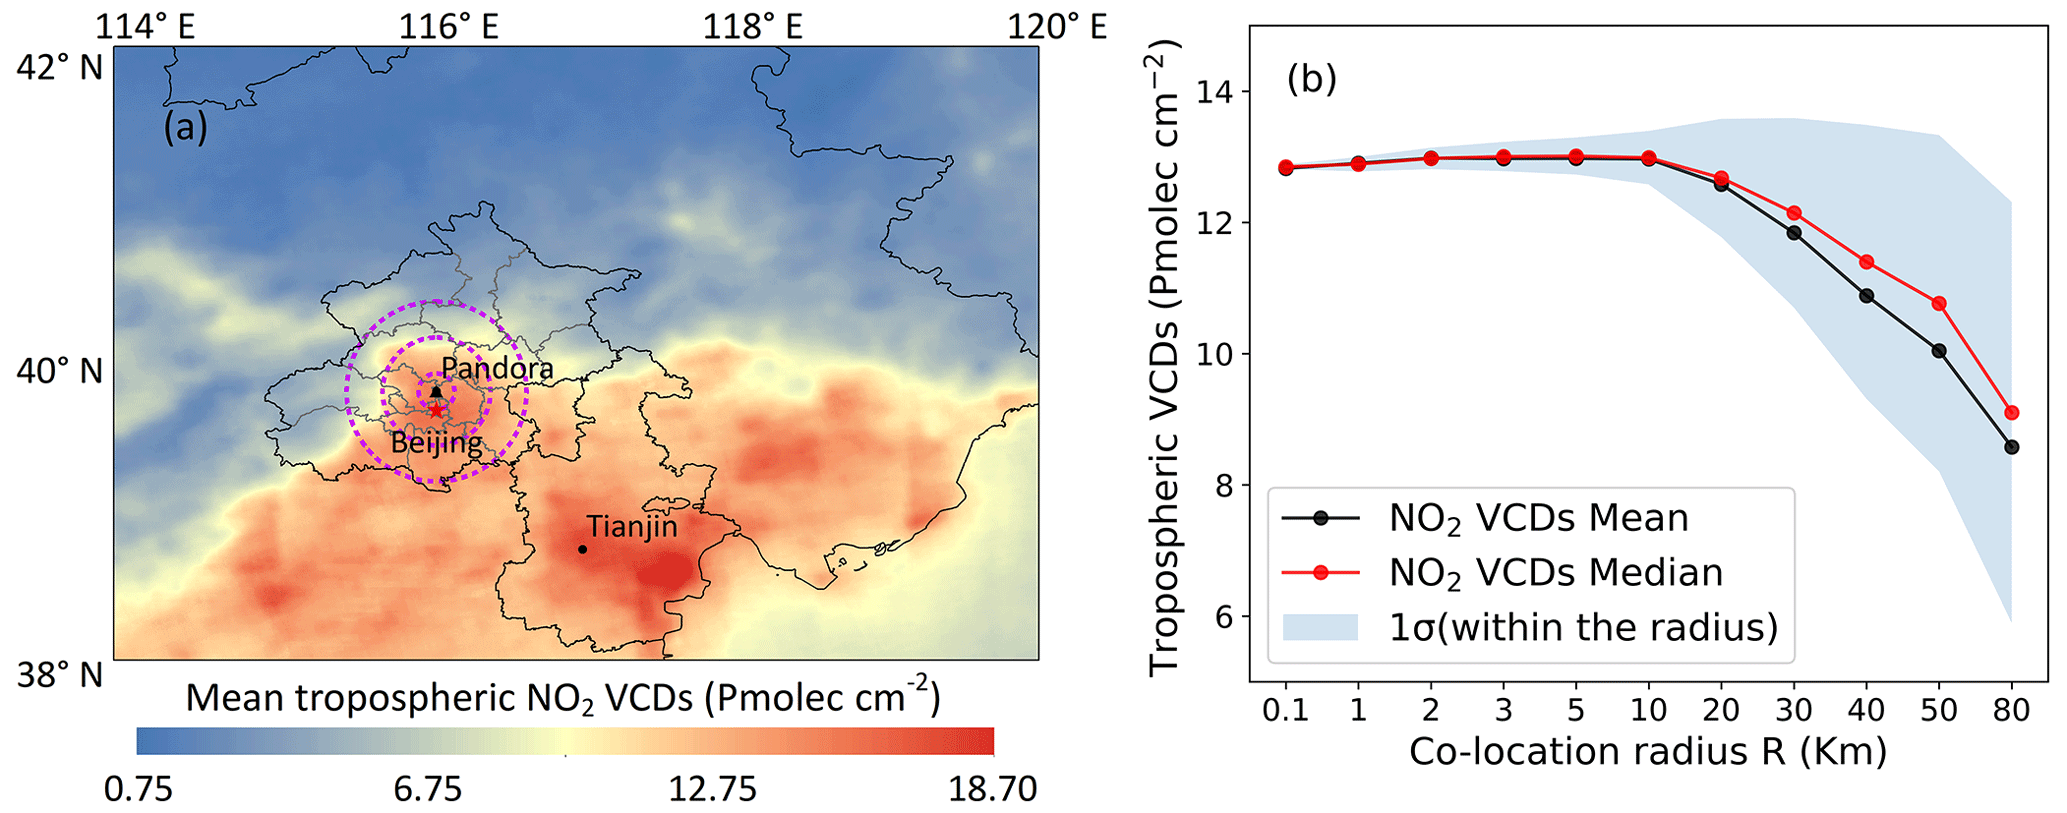
Figure 10Illustration of the spatial variation in the NO2 tropospheric VCD over a wide area around the Beijing-RADI (Pandora-171) site and the evaluation of the representativeness of the Pandora data for a larger area. (a) Spatial distribution of the TROPOMI-derived NO2 tropospheric VCD re-gridded to a resolution of 0.1 km × 0.1 km over the study area indicated in Fig. 1, averaged over the period from 1 August 2021 to 31 July 2022. The three purple circles indicate a radius of 10, 30, and 50 km around the site. (b) Annual mean (black) and median (red) tropospheric NO2 VCD averaged over circles centered at the Beijing RADI Pandora site with increasing radius, as a function of that radius (expressed in km), with variability (1 standard deviation) given as a light-blue area around the mean.
Table 2Statistical metrics for the tropospheric VCDs averaged over circles with increasing radius around the Pandora site.
The first operational Pandora site in China was established on the roof of the laboratory building of the Aerospace Information Research Institute of the Chinese Academy of Sciences (AIRCAS) in Beijing at the end of July 2021. The Pandora instrument provides continuous observations of NO2 total and tropospheric VCDs together with surface concentrations from direct-sun and sky measurements. The Beijing-RADI site is part of the PGN, and the Beijing-RADI data are publicly accessible from the PGN website. In this paper, an overview has been presented of the first year of data from the Beijing-RADI Pandora, i.e., their variations on timescales from hours to seasonal and the influences of wind speed and direction as well as chemical reactions on these variations. The NO2 surface concentrations have been compared with independent measurements from a collocated Thermo Scientific 42i-TL analyzer, using a different physical principle for NO2 concentration measurements. Explanations were offered for the differences between Pandora and in situ NO2 surface concentrations. The Pandora NO2 VCD data have been used as an independent reference for the evaluation of TROPOMI retrieved NO2 VCDs over Beijing. This study leads to the following conclusions:
-
The Pandora observations show that NO2 concentrations in Beijing are high during the winter and low during the summer, with a diurnal cycle where the concentrations reach a minimum during the daytime; the reduced concentrations during the 2022 Winter Olympics show that the emission control during that period was highly effective.
-
The fraction of tropospheric NO2 contributing to the total NO2 VCDs varies between 0.2 and 1, with large diurnal to seasonal variations, and is high in the morning and afternoon with a minimum around noon. Monthly averages show that the tropospheric NO2 contribution is 50 % to 60 % in the winter and 60 % to 70 % in the spring and autumn. The relatively small number of valid data does not allow us to assess the tropospheric contribution in summer.
-
During northerly winds, the tropospheric NO2 VCD is small, especially when the wind speed is larger than 4 m s−1. When the wind speed is low, clean air from areas between the Yan and Taihang mountains is transported to Beijing. When the wind speed is higher, northwesterly winds transport clean air from the Siberian plains, greatly improving Beijing's air quality. During southerly winds, polluted air is transported from adjacent areas with high NO2 emissions, resulting in high NO2 pollution in Beijing. In addition, at low wind speeds, pollutants accumulate, which results in increased NO2 concentrations that are most obvious during southerly winds.
-
Comparison of NO2 surface concentrations derived from Pandora measurements with in situ data from a Thermo Scientific 42i-TL analyzer shows that the Pandora-derived concentrations are substantially smaller than those of the in situ data. Reasons for this discrepancy have been identified. (1) The Thermo Scientific 42i-TL analyzer is sensitive to other sources of chemiluminescence contributing to the NO2 signal, such as peroxyacetyl nitrate and nitric acid or alkenes. (2) The Thermo Scientific 42i-TL analyzer represents the local in situ NO2 concentration near the sampling port, whereas Pandora represents the average concentration along a slant optical path, instead of a horizontal optical path for near-surface measurements, because the Pandora observation zenith angle is slightly smaller than 90∘. The concentrations are therefore an average over a small vertical range with, considering that the NO2 source is at the surface, a vertical concentration gradient. This results in an average NO2 concentration which is smaller than the actual concentration at the surface.
-
The comparison of the Pandora and in situ surface NO2 concentrations further shows that the data are separated into two clusters with different relations between the Pandora and in situ data, one for low NO2 concentrations during northerly winds where the Pandora concentrations show very little variation with in situ data and another regime for high NO2 concentrations where the Pandora data are still smaller than the in situ concentrations but with a definite positive correlation. These differences are explained in terms of transport and local production.
-
Using the Pandora data for validation of the TROPOMI NO2 total and tropospheric VCDs shows the good performance of the TROPOMI retrieval over Beijing with R=0.95 and 0.92, a LSQ fit with a slope of 0.96 and 0.94, and a standard deviation well below the expected 0.5 + (0.2 to 0.5) ⋅ VCDtrop.
-
The location of the Pandora instrument within a sub-orbital TROPOMI pixel of 3.5 km × 5.5 km may result in an error in the NO2 tropospheric VCD of between 0.223 and 0.282 , i.e., between 1.7 % and 2 %. The analysis shows that the Pandora observations at the Beijing-RADI site are representative of an area with a radius of 10 km.
All data used in this study are publicly available at the websites provided in Sect. 2 of this manuscript. In summary, the Pandora data are publicly available via the PGN website (https://data.pandonia-global-network.org/30Beijing-RADI/Pandora171s1/, last access: 11 July 2023) (Cede, 2021; Sect. 2.1). TROPOMI NO2 data are available via the Copernicus Data Space Ecosystem: https://dataspace.copernicus.eu/browser/ (Copernicus Data Space, 2023; last access: 22 December 2023) (Sect. 2.2). The ERA5 reanalysis data are available via the Copernicus Climate Change Service (C3S) Climate Data Store (CDS): https://cds.climate.copernicus.eu/cdsapp#!/dataset/reanalysis-era5-pressure-levels?tab=form, (last access: 11 July 2023) (Hersbach et al., 2023).
The supplement related to this article is available online at: https://doi.org/10.5194/amt-17-377-2024-supplement.
OL, GL, CF, and YL were involved in the research design. OL, GL, YZ, and CF analyzed the data. OL, GL, YZ, CF, and YL prepared the manuscript. JD provided support to the subsequent data analysis. KL operated and managed the Beijing-RADI Pandora measurements. PZ, TZ, and YW provided data of the Thermo Scientific 42i-TL instrument. ZL and YZ provided critical comments which substantially improved the paper. All authors have read and agreed on the published version of the paper.
The contact author has declared that none of the authors has any competing interests.
Publisher's note: Copernicus Publications remains neutral with regard to jurisdictional claims made in the text, published maps, institutional affiliations, or any other geographical representation in this paper. While Copernicus Publications makes every effort to include appropriate place names, the final responsibility lies with the authors.
The authors thank the reviewers for their valuable comments, which significantly contributed to the quality of this paper. We acknowledge valuable discussions with Jos van Geffen (KNMI) and suggestions. We acknowledge European Space Agency and the TROPOMI algorithm development and processing teams for TROPOMI NO2 data and Google Earth Engine for high-performance computing support. The PGN is a bilateral project supported with funding from NASA and ESA.
This research has been supported by the China National Funds for Distinguished Young Scholars (grant no. 41925019) and the National Natural Science Foundation of China (grant no. 42101365).
This paper was edited by Cuiqi Zhang and reviewed by three anonymous referees.
Alam, M. S., Crilley, L. R., Lee, J. D., Kramer, L. J., Pfrang, C., Vázquez-Moreno, M., Ródenas, M., Muñoz, A., and Bloss, W. J.: Interference from alkenes in chemiluminescent NOx measurements, Atmos. Meas. Tech., 13, 5977–5991, https://doi.org/10.5194/amt-13-5977-2020, 2020.
An, Z., Huang, R.-J., Zhang, R., Tie, X., Li, G., Cao, J., Zhou, W., Shi, Z., Han, Y., Gu, Z., and Ji, Y.: Severe haze in northern China: A synergy of anthropogenic emissions and atmospheric processes, P. Natl. Acad. Sci. USA, 116, 8657–8666, https://doi.org/10.1073/pnas.1900125116, 2019.
Behera, S. N. and Sharma, M.: Degradation of SO2, NO2 and NH3 leading to formation of secondary inorganic aerosols: An environmental chamber study, Atmos. Environ., 45, 4015–4024, https://doi.org/10.1016/j.atmosenv.2011.04.056, 2011.
Boersma, K. F., Eskes, H. J., and Brinksma, E. J.: Error analysis for tropospheric NO2 retrieval from space, J. Geophys. Res.-Atmos., 109, https://doi.org/10.1029/2003jd003962, 2004.
Boersma, K. F., Eskes, H. J., Dirksen, R. J., van der A, R. J., Veefkind, J. P., Stammes, P., Huijnen, V., Kleipool, Q. L., Sneep, M., Claas, J., Leitão, J., Richter, A., Zhou, Y., and Brunner, D.: An improved tropospheric NO2 column retrieval algorithm for the Ozone Monitoring Instrument, Atmos. Meas. Tech., 4, 1905–1928, https://doi.org/10.5194/amt-4-1905-2011, 2011.
Bovensmann, H., Burrows, J. P., Buchwitz, M., Frerick, J., Noel, S., Rozanov, V. V., Chance, K. V., and Goede, A. P. H.: SCIAMACHY: Mission objectives and measurement modes, J. Atmos. Sci., 56, 127–150, https://doi.org/10.1175/1520-0469(1999)056<0127:smoamm>2.0.co;2, 1999.
Brasseur, G. and Nicolet, M.: Chemospheric processes of nitric oxide in the mesosphere and stratosphere, Planet. Space Sci., 21, 939–961, https://doi.org/10.1016/0032-0633(73)90141-4, 1973.
Burrows, J. P., Weber, M., Buchwitz, M., Rozanov, V., Ladstätter-Weißenmayer, A., Richter, A., DeBeek, R., Hoogen, R., Bramstedt, K., Eichmann, K.-U., Eisinger, M., and Perner, D.: The Global Ozone Monitoring Experiment (GOME): Mission Concept and First Scientific Results, J. Atmos. Sci., 56, 151–175, https://doi.org/10.1175/1520-0469(1999)056<0151:Tgomeg>2.0.Co;2, 1999.
Carslaw, D. C. and Beevers, S. D.: Estimations of road vehicle primary NO2 exhaust emission fractions using monitoring data in London, Atmos. Environ., 39, 167–177, https://doi.org/10.1016/j.atmosenv.2004.08.053, 2005.
Cede, A.: Manual for Blcik Software Suite 1.8, [data set], https://www.pandonia-global-network.org/wp-content/uploads/2021/09/BlickSoftwareSuite_Manual_v1-8-4.pdf (last access: 11 July 2023), 2021.
Chen, D., Zhou, B., Beirle, S., Chen, L. M., and Wagner, T.: Tropospheric NO2 column densities deduced from zenith-sky DOAS measurements in Shanghai, China, and their application to satellite validation, Atmos. Chem. Phys., 9, 3641–3662, https://doi.org/10.5194/acp-9-3641-2009, 2009.
Cheng, Y., Zheng, G., Wei, C., Mu, Q., Zheng, B., Wang, Z., Gao, M., Zhang, Q., He, K., Carmichael, G., Pöschl, U., and Su, H.: Reactive nitrogen chemistry in aerosol water as a source of sulfate during haze events in China, Science Advances, 2, e1601530, https://doi.org/10.1126/sciadv.1601530, 2016.
Chu, F., Gong, C., Sun, S., Li, L., Yang, X., and Zhao, W.: Air Pollution Characteristics during the 2022 Beijing Winter Olympics, Int. J. Env. Res. Pub. He., 19, 11616, https://doi.org/10.3390/ijerph191811616, 2022.
Copernicus Data Space, Service Description and Evolution Roadmap, Doc-ID: CDSE-SDE-TSY, Issue 1.2, Date: 29.09.2023, [data set], https://documentation.dataspace.copernicus.eu/_docs/CDSE-SDE-TSY_Service%20Description%20and%20Evolution_1.2.pdf (last access: 5 January 2024), 2023.
Dai, Y., Cai, X., Zhong, J., Mazzeo, A., and MacKenzie, A. R.: Chemistry, transport, emission, and shading effects on NO2 and Ox distributions within urban canyons, Environ. Pollut., 315, 120347, https://doi.org/10.1016/j.envpol.2022.120347, 2022.
de Leeuw, G., van der A, R., Bai, J., Xue, Y., Varotsos, C., Li, Z., Fan, C., Chen, X., Christodoulakis, I., Ding, J., Hou, X., Kouremadas, G., Li, D., Wang, J., Zara, M., Zhang, K., and Zhang, Y.: Air Quality over China, Remote Sens.-Basel, 13, 3542, https://doi.org/10.3390/rs13173542, 2021.
Dee, D. P., Uppala, S. M., Simmons, A. J., Berrisford, P., Poli, P., Kobayashi, S., Andrae, U., Balmaseda, M. A., Balsamo, G., Bauer, P., Bechtold, P., Beljaars, A. C. M., van de Berg, L., Bidlot, J., Bormann, N., Delsol, C., Dragani, R., Fuentes, M., Geer, A. J., Haimberger, L., Healy, S. B., Hersbach, H., Holm, E. V., Isaksen, L., Kallberg, P., Kohler, M., Matricardi, M., McNally, A. P. et al.: The ERA-Interim reanalysis: configuration and performance of the data assimilation system, Q. J. Roy. Meteor. Soc., 137, 553–597, https://doi.org/10.1002/qj.828, 2011.
Dentener, F., van Weele, M., Krol, M., Houweling, S., and van Velthoven, P.: Trends and inter-annual variability of methane emissions derived from 1979-1993 global CTM simulations, Atmos. Chem. Phys., 3, 73–88, https://doi.org/10.5194/acp-3-73-2003, 2003.
Dirksen, R. J., Boersma, K. F., Eskes, H. J., Ionov, D. V., Bucsela, E. J., Levelt, P. F., and Kelder, H. M.: Evaluation of stratospheric NO2 retrieved from the Ozone Monitoring Instrument: Intercomparison, diurnal cycle, and trending, J. Geophys. Res., 116, D08305, https://doi.org/10.1029/2010JD014943, 2011.
Dunlea, E. J., Herndon, S. C., Nelson, D. D., Volkamer, R. M., San Martini, F., Sheehy, P. M., Zahniser, M. S., Shorter, J. H., Wormhoudt, J. C., Lamb, B. K., Allwine, E. J., Gaffney, J. S., Marley, N. A., Grutter, M., Marquez, C., Blanco, S., Cardenas, B., Retama, A., Ramos Villegas, C. R., Kolb, C. E., Molina, L. T., and Molina, M. J.: Evaluation of nitrogen dioxide chemiluminescence monitors in a polluted urban environment, Atmos. Chem. Phys., 7, 2691–2704, https://doi.org/10.5194/acp-7-2691-2007, 2007.
Fan, C., Li, Z., Li, Y., Dong, J., van der A, R., and de Leeuw, G.: Variability of NO2 concentrations over China and effect on air quality derived from satellite and ground-based observations, Atmos. Chem. Phys., 21, 7723–7748, https://doi.org/10.5194/acp-21-7723-2021, 2021.
Felix, J. D. and Elliott, E. M.: Isotopic composition of passively collected nitrogen dioxide emissions: Vehicle, soil and livestock source signatures, Atmos. Environ., 92, 359–366, https://doi.org/10.1016/j.atmosenv.2014.04.005, 2014.
Feng, X., Li, Q., Zhu, Y., Wang, J., Liang, H., Xu, R.: Formation and dominant factors of haze pollution over Beijing and its peripheral areas in winter, Air Poll. R., 4, 528–538, https://doi.org/10.5094/APR.2014.062, 2014.
Grenfell, J. L., Lehmann, R., Mieth, P., Langematz, U., and Steil, B.: Chemical reaction pathways affecting stratospheric and mesospheric ozone, J. Geophys. Res., 111, D17311, https://doi.org/10.1029/2004JD005713, 2006.
Griffin, D., Zhao, X. Y., McLinden, C. A., Boersma, F., Bourassa, A., Dammers, E., Degenstein, D., Eskes, H., Fehr, L., Fioletov, V., Hayden, K., Kharol, S. K., Li, S. M., Makar, P., Martin, R. V., Mihele, C., Mittermeier, R. L., Krotkov, N., Sneep, M., Lamsal, L. N., ter Linden, M., van Geffen, J., Veefkind, P., and Wolde, M.: High-Resolution Mapping of Nitrogen Dioxide With TROPOMI: First Results and Validation Over the Canadian Oil Sands, Geophys. Res. Lett., 46, 1049–1060, https://doi.org/10.1029/2018gl081095, 2019.
He, J., Gong, S., Zhou, C., Lu, S., Wu, L., Chen, Y., Yu, Y., Zhao, S., Yu, L., Yin, C.: Analyses of winter circulation types and their impacts on haze pollution in Beijing, Atmos. Environ., 192, 94–103, https://doi.org/10.1016/j.atmosenv.2018.08.060, 2018.
Hendrick, F., Barret, B., Van Roozendael, M., Boesch, H., Butz, A., De Mazière, M., Goutail, F., Hermans, C., Lambert, J.-C., Pfeilsticker, K., and Pommereau, J.-P.: Retrieval of nitrogen dioxide stratospheric profiles from ground-based zenith-sky UV-visible observations: validation of the technique through correlative comparisons, Atmos. Chem. Phys., 4, 2091–2106, https://doi.org/10.5194/acp-4-2091-2004, 2004.
Herman, J., Cede, A., Spinei, E., Mount, G., Tzortziou, M., and Abuhassan, N.: NO2 column amounts from ground-based Pandora and MFDOAS spectrometers using the direct-sun DOAS technique: Intercomparisons and application to OMI validation, J. Geophys. Res.-Atmos., 114, D13307, https://doi.org/10.1029/2009jd011848, 2009.
Herman, J., Spinei, E., Fried, A., Kim, J., Kim, J., Kim, W., Cede, A., Abuhassan, N., and Segal-Rozenhaimer, M.: NO2 and HCHO measurements in Korea from 2012 to 2016 from Pandora spectrometer instruments compared with OMI retrievals and with aircraft measurements during the KORUS-AQ campaign, Atmos. Meas. Tech., 11, 4583–4603, https://doi.org/10.5194/amt-11-4583-2018, 2018.
Herman, J., Abuhassan, N., Kim, J., Kim, J., Dubey, M., Raponi, M., and Tzortziou, M.: Underestimation of column NO2 amounts from the OMI satellite compared to diurnally varying ground-based retrievals from multiple PANDORA spectrometer instruments, Atmos. Meas. Tech., 12, 5593–5612, https://doi.org/10.5194/amt-12-5593-2019, 2019.
Hersbach, H., Bell, B., Berrisford, P., Biavati, G., Horányi, A., Muñoz Sabater, J., Nicolas, J., Peubey, C., Radu, R., Rozum, I., Schepers, D., Simmons, A., Soci, C., Dee, D., and Thépaut, J.-N.: ERA5 hourly data on pressure levels from 1940 to present, Copernicus Climate Change Service (C3S) Climate Data Store (CDS), [data set], https://doi.org/10.24381/cds.bd0915c6, 2023.
Hou, X., Zhu, B., Kumar, K. R., de Leeuw, G., Lu, W., Huang, Q., and Zhu, X.: Establishment of Conceptual Schemas of Surface Synoptic Meteorological Situations Affecting Fine Particulate Pollution Across Eastern China in the Winter, J. Geophys. Res.-Atmos., 125, e2020JD033153, https://doi.org/10.1029/2020JD033153, 2020.
Ialongo, I., Virta, H., Eskes, H., Hovila, J., and Douros, J.: Comparison of TROPOMI/Sentinel-5 Precursor NO2 observations with ground-based measurements in Helsinki, Atmos. Meas. Tech., 13, 205–218, https://doi.org/10.5194/amt-13-205-2020, 2020.
Jorba, O., Dabdub, D., Blaszczak-Boxe, C., Pérez, C., Janjic, Z., Baldasano, J., Spada, M., Badia, A., and Gonçalves, M.: Potential significance of photoexcited NO2 on global air quality with the NMMB/BSC chemical transport model, J. Geophys. Res., 117, D13301, https://doi.org/10.1029/2012JD017730, 2012.
Kang, H., Zhu, B., de Leeuw, G., Yu, B., van der A, R. J., and Lu, W.: Impact of urban heat island on inorganic aerosol in the lower free troposphere: a case study in Hangzhou, China, Atmos. Chem. Phys., 22, 10623–10634, https://doi.org/10.5194/acp-22-10623-2022, 2022.
Kang, Y., Tang, G., Li, Q., Liu, B., Cao, J., Hu, Q., and Wang, Y.: Evaluation and Evolution of MAX-DOAS-observed Vertical NO2 Profiles in Urban Beijing, Adv. Atmos. Sci., 38, 1188–1196, https://doi.org/10.1007/s00376-021-0370-1, 2021.
Kley, D. and McFarland, M.: Chemiluminescence detector for NO and NO2, Atmos. Technol., 12, D13307, https://www.osti.gov/biblio/6457230 (last access: 28 December 2023), 1980.
Lama, S., Houweling, S., Boersma, K. F., Eskes, H., Aben, I., Denier van der Gon, H. A. C., Krol, M. C., Dolman, H., Borsdorff, T., and Lorente, A.: Quantifying burning efficiency in megacities using the ratio from the Tropospheric Monitoring Instrument (TROPOMI), Atmos. Chem. Phys., 20, 10295–10310, https://doi.org/10.5194/acp-20-10295-2020, 2020.
Law, M., Kind, H., Messer, B., Kim, F., and Yang, P.: Photochemical Sensing of NO2 with SnO2 Nanoribbon Nanosensors at Room Temperature, Angew. Chem Int. Ed., 41, 2405–2408, https://doi.org/10.1002/1521-3773(20020703)41:13<2405::AID-ANIE2405>3.0.CO;2-3, 2002.
Levelt, P. F., Oord, G. H. J. v. d., Dobber, M. R., Malkki, A., Huib, V., Johan de, V., Stammes, P., Lundell, J. O. V., and Saari, H.: The ozone monitoring instrument, IEEE T. Geosci. Remote, 44, 1093–1101, https://doi.org/10.1109/TGRS.2006.872333, 2006.
Levelt, P. F., Joiner, J., Tamminen, J., Veefkind, J. P., Bhartia, P. K., Stein Zweers, D. C., Duncan, B. N., Streets, D. G., Eskes, H., van der A, R., McLinden, C., Fioletov, V., Carn, S., de Laat, J., DeLand, M., Marchenko, S., McPeters, R., Ziemke, J., Fu, D., Liu, X., Pickering, K., Apituley, A., González Abad, G., Arola, A., Boersma, F., Chan Miller, C., Chance, K., de Graaf, M., Hakkarainen, J., Hassinen, S., Ialongo, I., Kleipool, Q., Krotkov, N., Li, C., Lamsal, L., Newman, P., Nowlan, C., Suleiman, R., Tilstra, L. G., Torres, O., Wang, H., and Wargan, K.: The Ozone Monitoring Instrument: overview of 14 years in space, Atmos. Chem. Phys., 18, 5699–5745, https://doi.org/10.5194/acp-18-5699-2018, 2018.
Li, K., Jacob, D. J., Shen, L., Lu, X., De Smedt, I., and Liao, H.: Increases in surface ozone pollution in China from 2013 to 2019: anthropogenic and meteorological influences, Atmos. Chem. Phys., 20, 11423–11433, https://doi.org/10.5194/acp-20-11423-2020, 2020.
Li, M., Yao, Y., Simmonds, I., Luo, D., Zhong, L., and Pei, L.: Linkages between the atmospheric transmission originating from the North Atlantic Oscillation and persistent winter haze over Beijing, Atmos. Chem. Phys., 21, 18573–18588, https://doi.org/10.5194/acp-21-18573-2021, 2021.
Li, Z., Zhang, Y., Shao, J., Li, B., Hong, J., Liu, D., Li, D., Wei, P., Li, W., Li, L., Zhang, F., Guo, J., Deng, Q., Wang, B., Cui, C., Zhang, W., Wang, Z., Lv, Y., Xu, H., Chen, X., Li, L., and Qie, L.: Remote sensing of atmospheric particulate mass of dry PM2.5 near the ground: Method validation using ground-based measurements, Remote Sens. Environ., 173, 59–68, https://doi.org/10.1016/j.rse.2015.11.019, 2016.
Lin, M., Fiore, A. M., Horowitz, L. W., Langford, A. O., Oltmans, S. J., Tarasick, D., and Rieder, H. E.: Climate variability modulates western US ozone air quality in spring via deep stratospheric intrusions, Nat. Commun., 6, 7105, https://doi.org/10.1038/ncomms8105, 2015.
Liu, C. and Shi, K.: A review on methodology in O3-NOx-OC sensitivity study, Environ. Pollut. 291, 118249, https://doi.org/10.1016/j.envpol.2021.118249, 2021.
Liu, F., Beirle, S., Zhang, Q., Dörner, S., He, K., and Wagner, T.: NOx lifetimes and emissions of cities and power plants in polluted background estimated by satellite observations, Atmos. Chem. Phys., 16, 5283–5298, https://doi.org/10.5194/acp-16-5283-2016, 2016.
Luo, L., Wu, Y., Xiao, H., Zhang, R., Lin, H., Zhang, X., and Kao, S.-J.: Origins of aerosol nitrate in Beijing during late winter through spring, Sci. Total Environ., 653, 776–782, https://doi.org/10.1016/j.scitotenv.2018.10.306, 2019.
Mather, T. A., Pyle, D. M., and Allen, A. G.: Volcanic source for fixed nitrogen in the early Earth's atmosphere, Geology, 32, 905–908, https://doi.org/10.1130/G20679.1, 2004.
Müller, R.: The impact of the rise in atmospheric nitrous oxide on stratospheric ozone: This article belongs to Ambio's 50th Anniversary Collection. Theme: Ozone Layer, Ambio, 50, 35–39, https://doi.org/10.1007/s13280-020-01428-3, 2021.
Palmer, P. I., Jacob, D. J., Chance, K., Martin, R. V., Spurr, R. J. D., Kurosu, T. P., Bey, I., Yantosca, R., Fiore, A., and Li, Q. B.: Air mass factor formulation for spectroscopic measurements from satellites: Application to formaldehyde retrievals from the Global Ozone Monitoring Experiment, J. Geophys. Res.-Atmos., 106, 14539–14550, https://doi.org/10.1029/2000jd900772, 2001.
Pan, H., Geng, S., Yang, H., Zhang, G., Bian, H., and Liu, Y.: Influence of H2 blending on NOx production in natural gas combustion: Mechanism comparison and reaction routes, Int. J. Hydrogen Energ., 48, 784–797, https://doi.org/10.1016/j.ijhydene.2022.09.251, 2023.
Pearson, K. Notes on Regression and Inheritance in the Case of Two Parents, Proceedings of the Royal Society of London, 58, 240–242, https://doi.org/10.1098/rspl.1895.0041, 1895.
Pinardi, G., Van Roozendael, M., Hendrick, F., Theys, N., Abuhassan, N., Bais, A., Boersma, F., Cede, A., Chong, J., Donner, S., Drosoglou, T., Dzhola, A., Eskes, H., Frieß, U., Granville, J., Herman, J. R., Holla, R., Hovila, J., Irie, H., Kanaya, Y., Karagkiozidis, D., Kouremeti, N., Lambert, J.-C., Ma, J., Peters, E., Piters, A., Postylyakov, O., Richter, A., Remmers, J., Takashima, H., Tiefengraber, M., Valks, P., Vlemmix, T., Wagner, T., and Wittrock, F.: Validation of tropospheric NO2 column measurements of GOME-2A and OMI using MAX-DOAS and direct sun network observations, Atmos. Meas. Tech., 13, 6141–6174, https://doi.org/10.5194/amt-13-6141-2020, 2020.
Preston, K. E., Fish, D. J., Roscoe, H. K., and Jones, R. L.: Accurate Derivation of Total and Stratospheric Vertical Columns of NO2 from Ground-Based Zenith-Sky Measurements, J. Atmos. Chem., 30, 163–172, https://doi.org/10.1023/A:1006019628406, 1998.
Schoeberl, M., Douglass, A., Hilsenrath, E., Bhartia, P., Beer, R., Waters, J., Gunson, M., Froidevaux, L., Gille, J., Barnett, J., Levelt, P., and DeCola, P.: Overview of the EOS Aura mission, IEEE T. Geosci. Remote, 44, 1066–1074, https://doi.org/10.1109/TGRS.2005.861950, 2006.
Seinfeld, J. H. and Pandis, S. N.: Atmospheric Chemistry and Physics: From Air Pollution to Climate Change, ISBN 0-471-17815-2, https://doi.org/10.1063/1.882420, 1998.
Sioris, C. E., Haley, C. S., McLinden, C. A., von Savigny, C., McDade, I. C., McConnell, J. C., Evans, W. F. J., Lloyd, N. D., Llewellyn, E. J., Chance, K. V., Kurosu, T. P., Murtagh, D., Frisk, U., Pfeilsticker, K., Bösch, H., Weidner, F., Strong, K., Stegman, J., and Mégie, G.: Stratospheric profiles of nitrogen dioxide observed by Optical Spectrograph and Infrared Imager System on the Odin satellite, J. Geophys. Res, 108, 4215, https://doi.org/10.1029/2002JD002672, 2003.
Sivakumaran, V., Subramanian, K. P., and Kumar, V.: Lifetime measurement of NO2 at 423–462 nm, J. Quant. Spectrosc. Ra., 69, 513–518, https://doi.org/10.1016/S0022-4073(00)00092-3, 2001.
Stein, A. F., Draxler, R. R., Rolph, G. D., Stunder, B. J. B., Cohen, M. D., and Ngan, F.: NOAA's HYSPLIT Atmospheric Transport and Dispersion Modeling System, B. Am. Meteorol. Soc., 96, 2059–2077, https://doi.org/10.1175/BAMS-D-14-00110.1, 2015.
Steinbacher, M., Zellweger, C., Schwarzenbach, B., Bugmann, S., Buchmann, B., Ordóñez, C., Prevot, A. S. H., and Hueglin, C.: Nitrogen oxide measurements at rural sites in Switzerland: Bias of conventional measurement techniques, J. Geophys. Res., 112, D11307, https://doi.org/10.1029/2006JD007971, 2007.
Sun, L., Li, R., Tian, X., and Wei, J.: Analysis of the Temporal and Spatial Variation of Aerosols in the Beijing-Tianjin-Hebei Region with a 1 km AOD Product, Aerosol Air Qual. Res., 17, 923–935, https://doi.org/10.4209/aaqr.2016.05.0185, 2017.
Sun, Y., Jiang, Q., Wang, Z., Fu, P., Li, J., Yang, T., and Yin, Y.: Investigation of the sources and evolution processes of severe haze pollution in Beijing in January 2013, J. Geophys. Res., 119, 4380–4398, https://doi.org/10.1002/2014JD021641, 2014.
Sundström, A. M., Kolmonen, P., Sogacheva, L., and de Leeuw, G.: Aerosol retrievals over China with the AATSR dual view algorithm, Remote Sens. Environ., 116, 189–198, https://doi.org/10.1016/j.rse.2011.04.041, 2012.
Uppala, S. M., Kallberg, P. W., Simmons, A. J., Andrae, U., Bechtold, V. D., Fiorino, M., Gibson, J. K., Haseler, J., Hernandez, A., Kelly, G. A., Li, X., Onogi, K., Saarinen, S., Sokka, N., Allan, R. P., Andersson, E., Arpe, K., Balmaseda, M. A., Beljaars, A. C. M., Van De Berg, L., Bidlot, J., Bormann, N., Caires, S., Chevallier, F., Dethof, A., Dragosavac, M., Fisher, M., Fuentes, M., Hagemann, S., Holm, E., Hoskins, B. J., Isaksen, L., Janssen, P., Jenne, R., McNally, A. P., Mahfouf, J. F., Morcrette, J. J., Rayner, N. A., Saunders, R. W., Simon, P., Sterl, A., Trenberth, K. E., Untch, A., Vasiljevic, D., Viterbo, P., and Woollen, J.: The ERA-40 re-analysis, Q. J. Roy. Meteor. Soc., 131, 2961–3012, https://doi.org/10.1256/qj.04.176, 2005.
van der A, R. J., D. H. M. U. Peters, H. Eskes, K. F. Boersma, M. Van Roozendael, I. De Smedt, and H. M. Kelder.: Detection of the trend and seasonal variation in tropospheric NO2 over China, J. Geophys. Res., 111, D12317, https://doi.org/10.1029/2005JD006594, 2006.
van Geffen, J. H. G. M., Boersma, K. F., Van Roozendael, M., Hendrick, F., Mahieu, E., De Smedt, I., Sneep, M., and Veefkind, J. P.: Improved spectral fitting of nitrogen dioxide from OMI in the 405–465 nm window, Atmos. Meas. Tech., 8, 1685–1699, https://doi.org/10.5194/amt-8-1685-2015, 2015.
van Geffen, J. H. G. M., Eskes, H. J., Boersma, K. F., and Veefkind, J. P.: TROPOMI ATBD of the total and tropospheric NO2 data products, https://sentinel.esa.int/documents/247904/2476257/Sentinel-5P-TROPOMI-ATBD-NO2-data-products (last access: 9 March 2023), 2022b.
van Geffen, J., Eskes, H., Compernolle, S., Pinardi, G., Verhoelst, T., Lambert, J.-C., Sneep, M., ter Linden, M., Ludewig, A., Boersma, K. F., and Veefkind, J. P.: Sentinel-5P TROPOMI NO2 retrieval: impact of version v2.2 improvements and comparisons with OMI and ground-based data, Atmos. Meas. Tech., 15, 2037–2060, https://doi.org/10.5194/amt-15-2037-2022, 2022a.
Veefkind, J. P., Aben, I., McMullan, K., Förster, H., de Vries, J., Otter, G., Claas, J., Eskes, H. J., de Haan, J. F., Kleipool, Q., van Weele, M., Hasekamp, O., Hoogeveen, R., Landgraf, J., Snel, R., Tol, P., Ingmann, P., Voors, R., Kruizinga, B., Vink, R., Visser, H., and Levelt, P. F.: TROPOMI on the ESA Sentinel-5 Precursor: A GMES mission for global observations of the atmospheric composition for climate, air quality and ozone layer applications, Remote Sens. Environ., 120, 70–83, https://doi.org/10.1016/j.rse.2011.09.027, 2012.
Verhoelst, T., Compernolle, S., Pinardi, G., Lambert, J.-C., Eskes, H. J., Eichmann, K.-U., Fjæraa, A. M., Granville, J., Niemeijer, S., Cede, A., Tiefengraber, M., Hendrick, F., Pazmiño, A., Bais, A., Bazureau, A., Boersma, K. F., Bognar, K., Dehn, A., Donner, S., Elokhov, A., Gebetsberger, M., Goutail, F., Grutter de la Mora, M., Gruzdev, A., Gratsea, M., Hansen, G. H., Irie, H., Jepsen, N., Kanaya, Y., Karagkiozidis, D., Kivi, R., Kreher, K., Levelt, P. F., Liu, C., Müller, M., Navarro Comas, M., Piters, A. J. M., Pommereau, J.-P., Portafaix, T., Prados-Roman, C., Puentedura, O., Querel, R., Remmers, J. et al.: Ground-based validation of the Copernicus Sentinel-5P TROPOMI NO2 measurements with the NDACC ZSL-DOAS, MAX-DOAS and Pandonia global networks, Atmos. Meas. Tech., 14, 481–510, https://doi.org/10.5194/amt-14-481-2021, 2021.
Wang, H., Lu, K., Chen, S., Li, X., Zeng, L., Hu, M., and Zhang, Y.: Characterizing nitrate radical budget trends in Beijing during 2013–2019, Sci. Total Environ., 795, 148869, https://doi.org/10.1016/j.scitotenv.2021.148869, 2021.
Wang, T., Nie, W., Gao, J., Xue, L. K., Gao, X. M., Wang, X. F., Qiu, J., Poon, C. N., Meinardi, S., Blake, D., Wang, S. L., Ding, A. J., Chai, F. H., Zhang, Q. Z., and Wang, W. X.: Air quality during the 2008 Beijing Olympics: secondary pollutants and regional impact, Atmos. Chem. Phys., 10, 7603–7615, https://doi.org/10.5194/acp-10-7603-2010, 2010.
Wang, T., Huang, X., Wang, Z., Liu, Y., Zhou, D., Ding, K., Wang, H., Qi, X., and Ding, A.: Secondary aerosol formation and its linkage with synoptic conditions during winter haze pollution over eastern China, Sci. Total Environ., 730, 138888, https://doi.org/10.1016/j.scitotenv.2020.138888, 2020.
Wang, W., van der A, R., Ding, J., van Weele, M., and Cheng, T.: Spatial and temporal changes of the ozone sensitivity in China based on satellite and ground-based observations, Atmos. Chem. Phys., 21, 7253–7269, https://doi.org/10.5194/acp-21-7253-2021, 2021.
Wang, Y., Zhang, Y., Schauer, J. J., de Foy, B., Guo, B., and Zhang, Y.: Relative impact of emissions controls and meteorology on air pollution mitigation associated with the Asia-Pacific Economic Cooperation (APEC) conference in Beijing, China, Sci. Total Environ., 571, 1467–1476, https://doi.org/10.1016/j.scitotenv.2016.06.215, 2016.
Wang, Y., Song, W., Yang, W., Sun, X., Tong, Y., Wang, X., Liu, C., Bai, Z., and Liu, X.: Influences of Atmospheric Pollution on the Contributions of Major Oxidation Pathways to PM2.5 Nitrate Formation in Beijing, J. Geophys. Res., 124, 4174–4185, https://doi.org/10.1029/2019JD030284, 2019.
Wagner, T., Ibrahim, O., Shaiganfar, R., and Platt, U.: Mobile MAX-DOAS observations of tropospheric trace gases, Atmos. Meas. Tech., 3, 129–140, https://doi.org/10.5194/amt-3-129-2010, 2010.
Weber, H. G. and Bylicki, F.: NO2 lifetimes by hanle effect measurements, Chem. Phys., 116, 133–140, https://doi.org/10.1016/0301-0104(87)80075-7, 1987.
Xie, S., Yu, T., Zhang, Y., Zeng, L., Qi, L., and Tang, X.: Characteristics of PM10, SO2, NOx and O3 in ambient air during the dust storm period in Beijing, Sci. Total Environ., 345, 153–164, https://doi.org/10.1016/j.scitotenv.2004.10.013, 2005.
Xie, Y., Ding, A., Nie, W., Mao, H., Qi, X., Huang, X., Xu, Z., Kerminen, V.-M., Petäjä, T., Chi, X., Virkkula, A., Boy, M., Xue, L., Guo, J., Sun, J., Yang, X., Kulmala, M., and Fu, C.: Enhanced sulfate formation by nitrogen dioxide: Implications from in situ observations at the SORPES station, J. Geophys. Res.-Atmos., 120, 12679–12694, https://doi.org/10.1002/2015JD023607, 2015.
Xue, L., Gu, R., Wang, T., Wang, X., Saunders, S., Blake, D., Louie, P. K. K., Luk, C. W. Y., Simpson, I., Xu, Z., Wang, Z., Gao, Y., Lee, S., Mellouki, A., and Wang, W.: Oxidative capacity and radical chemistry in the polluted atmosphere of Hong Kong and Pearl River Delta region: analysis of a severe photochemical smog episode, Atmos. Chem. Phys., 16, 9891–9903, https://doi.org/10.5194/acp-16-9891-2016, 2016.
You, T., Wu, R. G., and Huang, G.: Differences in meteorological conditions between days with persistent and non-persistent pollution in Beijing, China, J. Meteorol. Res., 32, 81–98, https://doi.org/10.1007/s13351-018-7086-x, 2018.
Zhai, S., Jacob, D. J., Wang, X., Shen, L., Li, K., Zhang, Y., Gui, K., Zhao, T., and Liao, H.: Fine particulate matter (PM2.5) trends in China, 2013–2018: separating contributions from anthropogenic emissions and meteorology, Atmos. Chem. Phys., 19, 11031–11041, https://doi.org/10.5194/acp-19-11031-2019, 2019.
Zhang, X., Yin, Y., van der A, R., Lapierre, J. L., Chen, Q., Kuang, X., Yan, S., Chen, J., He, C., and Shi, R.: Estimates of lightning NOx production based on high-resolution OMI NO2 retrievals over the continental US, Atmos. Meas. Tech., 13, 1709–1734, https://doi.org/10.5194/amt-13-1709-2020, 2020.
Zhao, W., Chen, S., Zhang, H., Wang, J., Chen, W., Wu, R., Xing, W., Wang, Z., Hu, P., Paio, J., and Ma, T.: Distinct Impacts of ENSO on Haze Pollution in the Beijing–Tianjin–Hebei Region between Early and Late Winters, J. Climate, 35, 687–704, https://doi.org/10.1175/JCLI-D-21-0459.1, 2022.
Zhao, X., Fioletov, V., Alwarda, R., Su, Y., Griffin, D., Weaver, D., Strong, K., Cede, A., Hanisco, T., and Tiefengraber, M. J. R. S.: Tropospheric and Surface Nitrogen Dioxide Changes in the Greater Toronto Area during the First Two Years of the COVID-19 Pandemic, Remote Sens.-Basel, 14, 1625, https://doi.org/10.3390/rs14071625, 2022.
Zheng, G. J., Duan, F. K., Su, H., Ma, Y. L., Cheng, Y., Zheng, B., Zhang, Q., Huang, T., Kimoto, T., Chang, D., Pöschl, U., Cheng, Y. F., and He, K. B.: Exploring the severe winter haze in Beijing: the impact of synoptic weather, regional transport and heterogeneous reactions, Atmos. Chem. Phys., 15, 2969–2983, https://doi.org/10.5194/acp-15-2969-2015, 2015.