the Creative Commons Attribution 4.0 License.
the Creative Commons Attribution 4.0 License.
 | 03 Jul 2024
A 2-year intercomparison of three methods for measuring black carbon concentration at a high-altitude research station in Europe
Cyrielle Denjean
Pierre Nabat
Véronique Pont
Mathilde Arnaud
Thierry Bourrianne
Maria Dias Alves
Eric Gardrat
Black carbon (BC) is one of the most important climate forcers with severe health effects. Large uncertainties in radiative forcing estimation and health impact assessment arise from the fact that there is no standardized method to measure BC mass concentration. This study presents a 2-year comparison of three state-of-the-art BC measurement techniques at the high-altitude research station Pic du Midi (PDM) located in the French Pyrenees at an altitude of 2877 m above sea level. A recently upgraded Aethalometer AE33, a thermal-optical analyser Sunset and a single-particle soot photometer SP2 were deployed to measure simultaneously the mass concentration of equivalent black carbon (MeBC), elemental carbon (MEC) and refractory black carbon (MrBC), respectively. Significant deviations in the response of the instruments were observed. All techniques responded to seasonal variations in the atmospheric changes in BC levels and exhibited good correlation during the whole study period. This indicates that the different instruments quantified the same particle type despite the fact that they are based on different physical principles. However the slopes and correlation coefficients varied between instrument pairs. The largest biases were observed for the AE33 with MeBC values that were around 2 times greater than MrBC and MEC values. The principal reasons of such large discrepancy were explained by the mass absorption cross section (MAC) that was too low and C values recommended by the AE33 manufacturer and applied to the absorption coefficients measured by the AE33. In addition, the long-range transport of dust particles at PDM in spring caused significant increases in the bias between AE33 and SP2 by up to a factor 8. The Sunset MEC measurements agreed within around 17 % with the SP2 MrBC values. The largest overestimations of MEC were observed when the total carbon concentrations were below 25 µg C cm−2, which is probably linked to the incorrect determination of the organic carbon (OC)–EC split point. Another cause of the discrepancy between instruments was found to be the limited detection range of the SP2, which did not allow for the total detection of fine rBC particles. The procedure used to estimate the missing mass fraction of rBC not covered by the measurement range of the SP2 was found to be critical. We found that a time-dependent correction based on fitting the observed rBC size distribution with a multimodal lognormal distribution is needed to accurately estimate MrBC over a larger size range.
- Article
(3653 KB) - Full-text XML
-
Supplement
(569 KB) - BibTeX
- EndNote


Black carbon (BC), which results from incomplete combustion of fossil fuels, biofuel and biomass, is one of the most important short-lived climate forcers (IPCC, 2022). Due to its strong absorption in the visible wavelengths, it can reduce the amount of sunlight reaching the surface; heat the atmospheric layer in which it resides; and affect cloud formation, dissipation and precipitation with ensuing effects on atmosphere circulation through semi-direct radiative effects (Wang et al., 2016; Matsui et al., 2018; Tang et al., 2020). When deposited on the cryosphere (e.g. glaciers, snow cover and sea ice), BC can reduce the surface albedo, thereby accelerating its melt (Réveillet et al., 2022; Jacobi et al., 2015). Moreover, BC poses a threat to human health as it is considered a carcinogen and a source of respiratory disease due to its nanometre size (Janssen et al., 2012).
BC mass concentration (MBC) data are required to develop, assess and improve emission inventories, climate and chemical transport models, and mitigation strategies designed to reduce both air pollution and climate change. One major issue in MBC measurements is related to the lack of internationally accepted standardized method to measure it. Bond et al. (2013) discussed limitations in inferring its atmospheric concentration and highlighted inconsistencies between different terminologies and related measurement techniques. Petzold et al. (2013) defined a specific nomenclature for BC according to its quantification method. Following the recommendation of the authors MBC can be categorized into three broad measurement techniques: (1) filter-based optical methods, which measure light attenuation and convert it to an equivalent BC mass concentration (MeBC); (2) thermal-optical analysis methods, which report elemental carbon mass concentration (MEC) as the mass concentration of carbon which is thermally refractive up to about 800 K (depending on the analysis protocol); and (3) laser-induced incandescence (LII) methods, which measure refractory BC mass concentration (MrBC) as the incandescence signal of sampled particles after rapid heating to ∼ 4000 K. Since there is not yet a universally accepted MBC quantification technique, it is extremely important to understand how the measurements vary between different instruments and techniques and what the reasons are behind these potential differences.
Filter-based optical methods are commonly used for MeBC measurements at long-term research sites such as the Global Atmosphere Watch (GAW) and the Aerosol, Clouds and Trace Gases Research Infrastructure (ACTRIS) programmes because they are inexpensive and easy to maintain. Previous comparisons of the different optical methods revealed discrepancies of up to 45 % among instruments of the same type (Arnott et al., 2006; Chow et al., 2009; Müller et al., 2011; Laing et al., 2020; Wu et al., 2015; Mason et al., 2018; Davies et al., 2018; Cuesta-Mosquera et al., 2021) and up to a factor of 5 when comparing thermal-optical and LII methods (Healy et al., 2017; Laing et al., 2020; Slowik et al., 2007; Chirico et al., 2010; Sharma et al., 2017). Quantifying MeBC acquired by optical methods is challenging because it requires the assumption of a BC mass absorption cross section (MAC) value translating the absorption coefficient (σabs). Field and laboratory measurements have indicated that MACs vary both temporally and spatially with values ranging from 3.8 to 58 m2 g−1 (Wei et al., 2020). The wide range of reported values is not surprising given that the MAC relies on the BC core diameter, coating thickness, chemical composition and shape, which are expected to be influenced by a variety of spatio-temporal factors such as source type, transport pathway, and regional atmospheric composition and meteorology. Still further complications arise from the fact that the filter-based optical methods are prone to several filter artefacts, including dependence of light attenuation on the filter tape loading, the interference of aerosol light scattering with the absorption measurement and the multiple light scattering effects of the filter itself (Bond et al., 1999; Weingartner et al., 2003; Collaud Coen et al., 2010; Lack et al., 2014; Liousse et al., 1993; Schmid et al., 2006).
Thermal-optical and LII techniques are the most direct methods to measure MBC. Both techniques make use of the high refractoriness of BC to quantify its mass concentrations, although in different manners. There is considerable variability in results of field campaigns comparing MEC and MrBC. Some studies have shown that MrBC measured by a SP2 and MEC measured by a Sunset analyser were consistent within measurement uncertainties (Laborde et al., 2012a; Corbin and Gysel-Beer, 2019; Miyakawa et al., 2016). Other studies have shown they can systematically differ by factors of up to 2.5 (Pileci et al., 2021; Zhang et al., 2016; Sharma et al., 2017). While the authors could not clearly assign the reasons for the differences between the two methods, they found that various interferences from co-emitted species in the Sunset analyser and the different particle size range covered by the two methods could be the reason for the discrepancies.
Most instrument inter-comparisons took place in the planetary boundary layer (PBL), whereas very few intercomparisons at upper altitudes are available in the literature. Laing et al. (2020) found that MeBC measured by an Aethalometer at a US mountain site in the summer was 2 times higher than MrBC measured by a SP2 when using the Aethalometer manufacturer's recommendations for corrections. Observations in the free troposphere (FT) are more difficult to perform than at lower altitudes due to the lack of availability of suitable sites and due to adverse meteorological conditions. Airborne studies can overcome such problems but are usually limited to short timescales and thus do not provide statistically representative information at seasonal timescales. Moreover, distinguishing between signals, noise and inter-instrument uncertainty may become challenging at high altitude, as MBC can be several orders of magnitude lower in the FT than in the PBL (Sun et al., 2021). These aspects have historically kept intercomparison of BC measurements in the FT very sparse.
In this work, we conducted a systematic comparison of three current state-of-the-art BC monitoring instruments at the high-altitude research site of Pic du Midi in the French Pyrenees (PDM, 2877 ). More specifically, the recently upgraded Aethalometer (AE33, Magee Scientific, Berkeley, CA), analyses of filter samplings with a thermal-optical analyser (Sunset) and an online single-particle soot photometer (SP2) were deployed continuously during 2 years to measure MeBC, MEC and MrBC, respectively. The purpose of this study is to evaluate the agreement between the three measurement techniques to highlight the possible source of biases and to provide some recommendations on the use and data analysis of these different instruments.
2.1 Measurements site
The Pic du Midi research station (PDM; 42.93642° N, 0.14260° E) located in the south-west of France is part of the Pyrenees mountain chain, with an altitude of 2877 This site belongs to the European Aerosols, Clouds and Trace Gases Research Infrastructure (ACTRIS-Fr) and to the Global Atmosphere Watch (GAW) programme of the World Meteorological Organisation. It is often under the FT influence with limited local pollution around the site (Collaud Coen et al., 2018; Gheusi et al., 2016; Tinorua et al., 2024). It is therefore considered as a background mountain site. Air masses arriving at the PDM have various geographical origins coming from continental Europe, as well as over the Atlantic Ocean, Iberian Peninsula and North Africa. Therefore, the PDM is a suitable site to study BC long-range transport in the lower FT.
2.2 Instrumentation
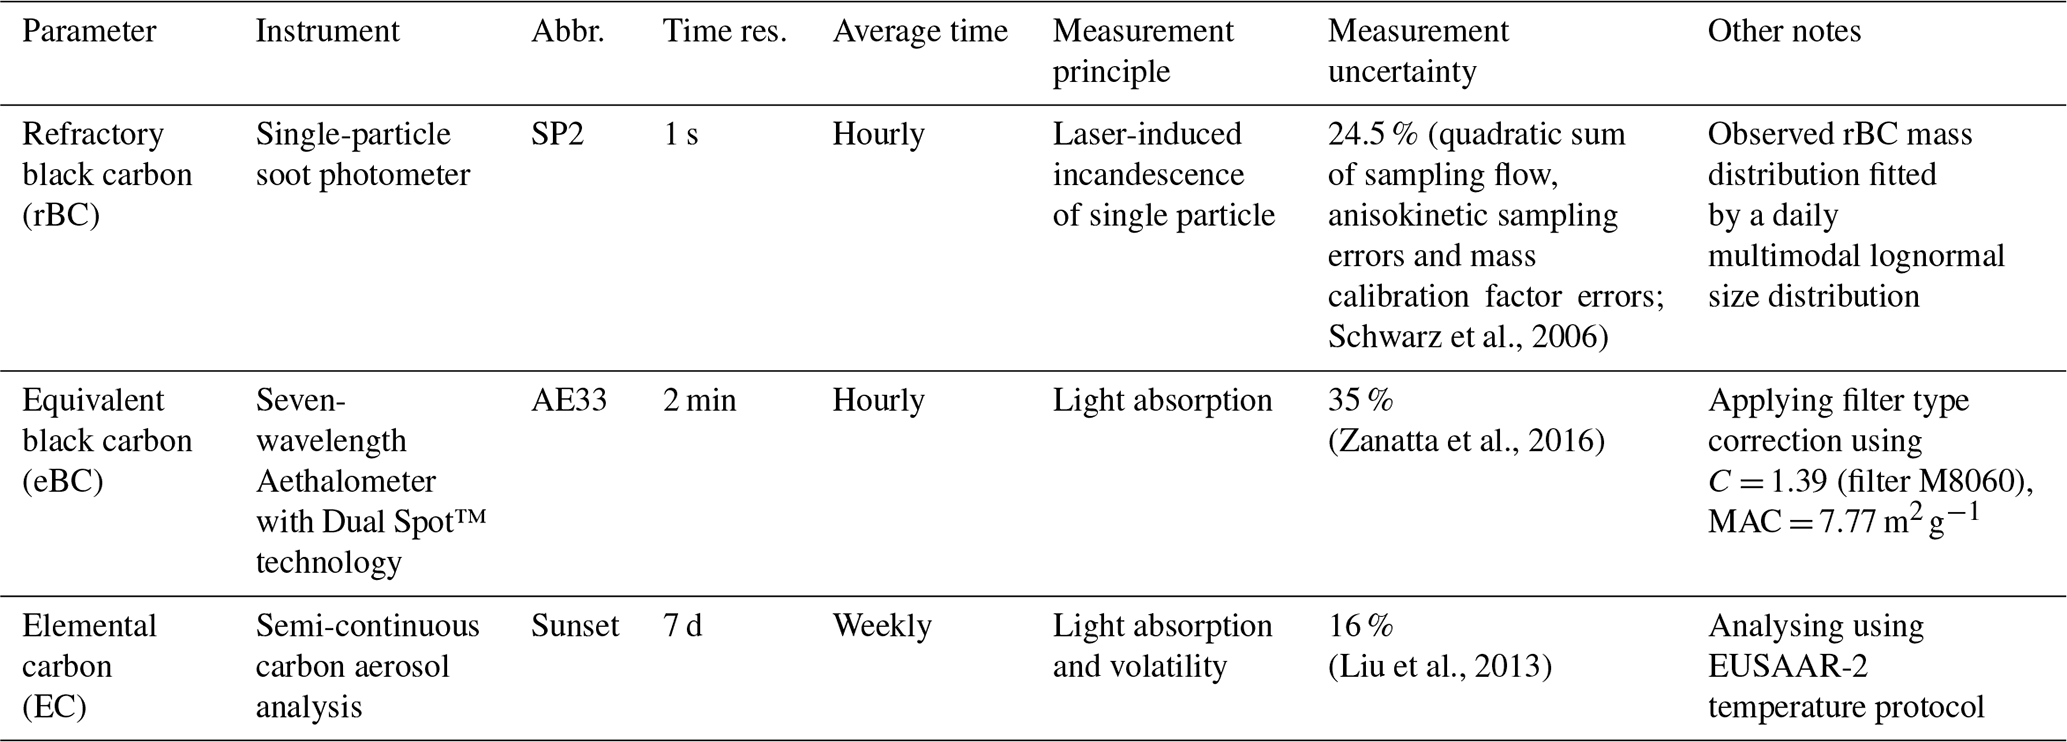
From February 2019 to January 2021, an important set of instruments was deployed to measure BC microphysical, chemical and optical properties in the framework of the h-BC project (Tinorua et al., 2024). Among them, three instruments were dedicated to the quantification of MBC: a recently upgraded Aethalometer (model AE33, Magee Scientific Company, Berkeley, CA, USA), a thermal-optical analyser (Sunset Laboratory Inc., Tigard, OR, USA) and a single-particle soot photometer (SP2, DMT, Longmont, CO, USA). Table 1 summarizes the main instrument characteristics and the uncertainty estimates for reported MBC. Ambient BC-containing particles were sampled by a whole-air inlet, suitable for long-term observations and placed 2 m above the building rooftop of the PDM measurement station. The air passing through the inlet was heated to ∼ 20 °C to prevent the relative humidity from exceeding 20 % (Nessler et al., 2003).
Schwarz et al., 2006(Zanatta et al., 2016)(Liu et al., 2013)Table 1Summary of BC instruments and data analysis protocol used in this study.
2.2.1 The single-particle soot photometer (SP2)
The SP2 measures MrBC based on its incandescence capacity when heated to high temperatures. Its operating principle has been described previously (Baumgardner et al., 2012; Laborde et al., 2012b; Moteki and Kondo, 2010; Schwarz et al., 2006). To sum up, particles entering the instruments are passing through an Nd:YAG laser cavity, where they are heated up to 4000 K by the laser beam. If these particles contains rBC, they can then reach their incandescence point and produce a signal detected by two avalanche photodiodes. Since species internally mixed with BC particles will evaporate before the rBC incandescence, the measured mass only takes into account the amount of rBC mass without interference from its potential coating. The intensity of this signal is proportional to the rBC mass. The incandescence peak height is converted to an individual rBC mass using a calibration factor, and then a rBC density of 1800 kg m−3 (Bond and Bergstrom, 2006) is used to convert the rBC mass into a rBC mass-equivalent diameter.
Calibration was carried out by measuring the heights of the incandescent peaks of monodisperse fullerene soot (Alfa Aesar, lot no. FS12S011) as a function of its diameter, selected by a differential mobility analyser and modelling the points obtained by a second-order polynomial fit.
The SP2 data were processed using the SP2PyPro code, a computer code written in Python that derives the rBC mass concentration and mixing state from SP2 measurements (Tinorua et al., 2024). The rBC mass was quantified from ∼ 0.68 to 320 fg, corresponding to 90 < DrBC < 700 nm. This size range was set by comparing the particle number concentration of the size-selected fullerene soot particles measured by the SP2 against the one measured by a condensation particle counter (CPC, model 3772, TSI Inc., Shoreview, USA). Typical rBC size distributions tend to fall into a consistent larger range from a few nanometres to a few micrometres (Bond et al., 2013). To date, there have been three approaches to estimate and correct for the rBC mass undetected by the SP2. All these methods are based on fitting the measured rBC size distribution with lognormal distribution and estimating the ambient fraction of rBC mass outside the SP2 measurement range, hereafter referred to as Rfit/meas and calculated using Eq. (1):
where MrBC,fit is the fitted rBC size distribution between 1 and 1000 nm and MrBC,meas the measured rBC size distribution in the detection size range of the SP2.
- i.
The most widely used approach is to fit the campaign average size distribution with a single and monomodal lognormal distribution and to derive a single correction factor of the mass concentration, hereafter called Rfit/meas (Schwarz et al., 2006; Laborde et al., 2012a; Metcalf et al., 2012; Zanatta et al., 2018; Liu et al., 2010; Ko et al., 2020).
- ii.
Another method consists of fitting the campaign average size distribution with a multimodal lognormal distribution using the sum of two to four modes (Cappa et al., 2019; Raatikainen et al., 2017; Zhao et al., 2019).
- iii.
A last procedure proposed in the present study consists of calculating a time-dependent correction factor by fitting with a sum of several lognormal modes the rBC size distribution averaged on a shorter time period than the campaign duration. This approach is supported by the fact that rBC size distribution can vary as a function of the sources and ageing processes (Cappa et al., 2019; Takahama et al., 2014). In this study, all three methods were applied in order to assess the sensitivity to the correction approach. Bounds of the fitting parameters dg and σg were fixed as follows: mode 1 – 50 < dg < 100 nm and 1.2 < σg < 3; mode 2 – 150 < dg < 250 nm and 1.3 < σg < 2.9; mode 3 – 350 < dg < 500 nm and 1 < σg < 3 with dg and σg the geometric mean diameter and the geometric standard deviation, respectively. The resulting uncertainty on the corrected rBC mass concentration, hereafter referred as MrBC,corr, is estimated to be around 24.5 %, corresponding to the quadratic sum of the 20 % uncertainty on the mass calibration factor, the 10 % uncertainty for anisokinetic sampling errors and the 10 % uncertainties on the flow calibration (Schwarz et al., 2006).
2.2.2 The thermal-optical analyser Sunset
Weekly integrated filter-sampled particles were analysed using an EC–organic aerosol (OC) analyser (Sunset Laboratory Inc., Tigard, OR, USA), hereafter referred to as Sunset. We used the EUSAAR-2 (European Supersites for Atmospheric Aerosol Research) heating protocol with transmittance correction (Cavalli et al., 2010). This protocol was specifically developed for aerosol typically encountered at European background sites, and it was recently selected as the European standard thermal protocol to be applied in air quality networks for the measurements of total carbon (TC), OC and EC in particulate matter samples (European Committee for Standardization, 2017).
The measurement principle is based on the different volatilization temperatures of OC and EC (Bauer et al., 2009). Briefly, aerosols were collected on a pre-burnt quartz fibre filter at PDM and thermally desorbed in the Sunset analyser following a temperature gradient. A first step allowed the OC desorption by progressively heating to 500–700 °C in an inert atmosphere made of pure helium (He). A second step brought the filter at higher temperature (∼ 850 °C) in an oxidizing atmosphere composed of 98 % helium and 2 % dioxygen to induce the EC desorption. At each temperature step the OC (in the inert atmosphere) and the EC (in the oxidized atmosphere) are oxidized to carbon dioxide and then catalytically reduced to methane, which is quantified by a nondispersive infrared (NDIR) detector, and associated with a mass of OC or MEC.
Due to temperature elevation, some OC can be pyrolysed and thus be desorbed during the second step of the procedure, leading to an overestimation of the sampled MEC. This artefact due to the so-called pyrolytic carbon (PyrC) is corrected using thermal-optical transmittance correction. The split point, determined in order to separate EC and refractory OC, is defined as the time at which the transmission through the filter in the second step (oxidized atmosphere) during the EC and PyrC desorption equals the transmission through the filter in the first step (inert atmosphere) before PyrC formation (i.e. initial value of transmission). The distinction between PyrC and native EC is based on two assumptions: (1) during the oxidative phase, PyrC is the first to completely evolve before native EC and (2) PyrC and native EC have the same mass absorption cross section (MAC) (Yang and Yu, 2002). Thus, the total OC mass on the filter is the sum of the four OC fractions (OC1, OC2, OC3 and OC4) and the total EC mass on the filter is the sum of the four EC fractions (EC1, EC2, EC3 and EC4) minus the PyrC mass determined optically (which is converted in OC fraction).
The Sunset calibration was performed using a sucrose (C6H12O6) solution containing two different known TC surface loadings (35.16 and 42.527 µg C cm−2), spiked on blank filters. Several blank filters were analysed over the campaign, and the resulting transmission intensity was introduced as an offset in the data. The limit of detection (LOD) of MEC is generally estimated using different methods based on filter blank measurements. The first one consists of averaging MEC across several blank filter samples (Sciare et al., 2011). Bauer et al. (2009) estimated the LOD by calculating the 95th percentile off the standard deviation over zero air measurements. The method recommended by EN 16909:2017 consists of calculating the average Sunset blank filter value from a high number of blank measurements and add 2 times its standard deviation (Jaffrezo et al., 2005; Karanasiou et al., 2020). The last method that was used here consists of taking 3 times the standard deviation of several blank measurements as proposed by Brown et al. (2019). By using 22 blank measurements, blank levels of 0.17 and 0.70 µg C cm−2 were obtained for EC and TC, respectively (using an average sampling volume of 440 m3). The LOD on EC is similar to the one of 0.18 µg C cm−2 obtained by Zheng et al. (2014), who studied the variations in the LOD among different protocols, and close to the LOD of 0.1 µg C cm−2 determined by Bauer et al. (2009).
2.2.3 The dual-spot Aethalometer AE33
A dual-spot Aethalometer (model AE33, Magee Scientific, USA) was used to quantify MeBC. This instrument measures the attenuation of light at seven wavelengths (370, 470, 520, 590, 660, 880 and 950 nm) through a filter where particles are continuously collected. MeBC was calculated from the attenuation coefficient σATN measured at 880 nm because other light-absorbing particles, such as brown carbon (BrC) and mineral dust, absorb significantly less at this wavelength (Samset et al., 2018). In the Aethalometer, the change in attenuation with time is caused by both the increasing mass of eBC deposited on the filter (i.e. loading effect) and the scattering by particles and filter matrix (Weingartner et al., 2003; Segura et al., 2014). To overcome the loading effect, a compensation algorithm has been incorporated into the AE33 using online dual-spot technology (Drinovec et al., 2015).
Following Drinovec et al. (2015) σATN and MeBC can be derived by applying Eqs. (2) and (3), respectively:
where S is the filter surface area loaded with the sample, ΔATN the variation in attenuation on this surface on the spot, F the measured flow rate passing through the instrument corrected by the leakage factor ζ (here equals 0.01), C the multiple scattering coefficient, k the loading factor parameter and Δt the sampling duration of aerosols in the Aethalometer fixed at 20 min.
MeBC was first determined using the default instrumental filter constant C of 1.39 for the M8060 filter tape and a MAC of 7.77 m2 g−1 at 880 nm. In Sect. 3.5, we have estimated the hourly and weekly C × MAC values that allow us to better match the MeBC with MrBC,corr and MEC at PDM.
To limit biases caused by extreme values, MeBC values under the lower detection limit of the AE33 (0.005 µg m−3) and over the 95th percentile of the distribution were filtered before the analysis.
2.3 Other parameters
Aerosol scattering coefficients (σsca) were retrieved by an integrating nephelometer (model Aurora 3000, Ecotech Pty Ltd, Knoxfield, Australia) at 450, 525 and 635 nm, and the scattering Angstróm exponent (SAE) was then calculated between 450 and 635 nm (SAE450–635). Absorption coefficients were derived from the attenuation measurements of the AE33 at 470 and 660 nm and then converted to 450 and 635 nm using the absorption Angstróm exponent calculated between 370 and 470 nm (AAE370–470) and between 590 and 660 nm (AAE590–660), respectively.
A scanning mobility particle sizer (SMPS), which consists of a differential mobility analyser (DMA; model 3071, TSI Inc., Shoreview, MN, USA) and a condensation particle counter (CPC; model 3772, TSI Inc., Shoreview, MN, USA), has been used to measure the aerosol size distribution between 12.6 and 532.6 nm.
To avoid biases linked to inlet artefacts and local pollution, periods when precipitation events, high humidity (95 %) and high CO concentrations (> 200 ppb) occurred were removed from the dataset. The HYSPLIT model (Hybrid Single-Particle Lagrangian Integrated Trajectory; Stein et al., 2015) has been used to retrieve the precipitation events along the 72 h trajectory of air masses arriving at the measurement site. The model was initialized to the PDM altitude, using 3-hourly atmospheric data of 1° × 1° spatial resolution from the Global Data Assimilation System (GDAS) of the National Centers for Environmental Prediction (NCEP). Weekly averages were calculated from hourly SP2 and AE33 data when at least 70 % of the hourly data were available. All data were converted to standard temperature and pressure (STP) using local meteorological data.
3.1 Sensitivity of rBC mass concentration to size distribution processing from the SP2 measurements
Figure 1 presents the campaign-average mass-weighted rBC size distribution derived from the SP2. Two distinct peaks can be seen at DrBC = 130 nm and DrBC = 180 nm. A third coarser mode seems to arise around 400 nm. From this figure, it can clearly be seen that the SP2 does not measure the rBC size distribution over its full size range. We evaluated three different approaches described in Sect. 2.2.1 to correct MrBC,meas for the rBC mass undetected by the SP2. The extent to which the different approaches contribute to uncertainty on the overall MrBC,corr was quantified by comparing the fitted MrBC,fit to observed MrBC,meas on the SP2 detection size range (90 < DrBC < 700 nm). When using a one-mode representation, the fitting procedure gave a mode centred on Dg = 153 nm on average over the 2-year campaign, while the three modes of the trimodal fit peak at Dg,1 = 98 nm, Dg,2 = 177 nm and Dg,3 = 377 nm. A first direct comparison between the fitting procedure shows that both approaches represent well the measurements for DrBC between 90 and 150 nm. However, the one-mode fit does not catch the variations in MrBC,meas for DrBC between 150 and 400 nm and completely misses the largest mode around 400 nm, while both are well represented by the trimodal approach. As a first conclusion, the trimodal curve generally better follows the measurements and in particular for rBC diameter above 150 nm.
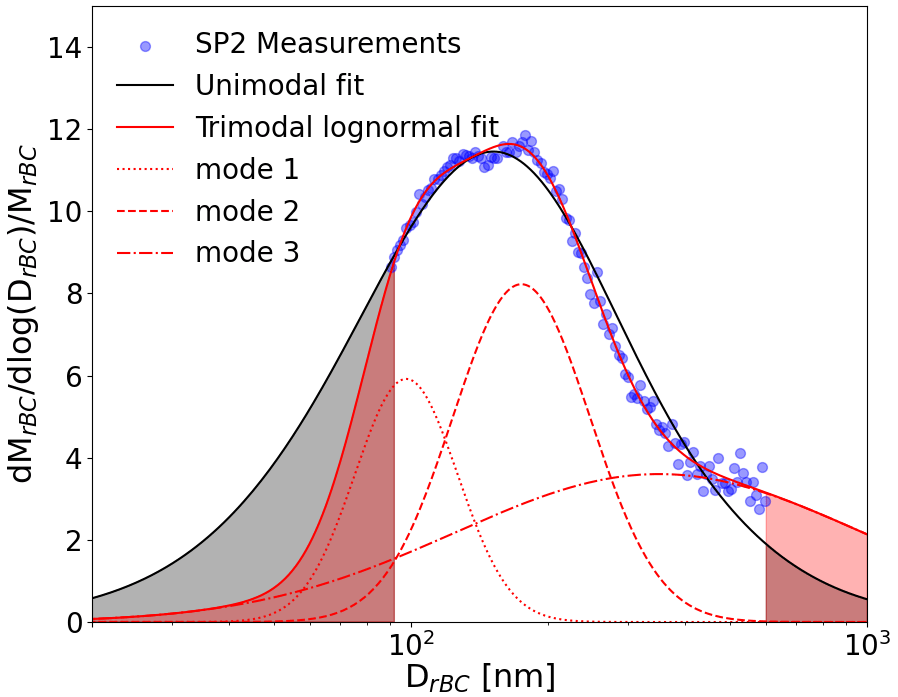
Figure 1The rBC core size distribution averaged over the campaign and fitted with a unique (in black lines) functions or a sum of three lognormal functions (in red line). The three modes are in dotted red lines. Blue dots represent the SP2 measurements over its size detection range. The black and red shaded areas represent the rBC mass fraction missed by the SP2 and recalculated when applying a unimodal or a trimodal fitting procedure, respectively. Data were normalized by the sum of MrBC,meas and averaged over the campaign.
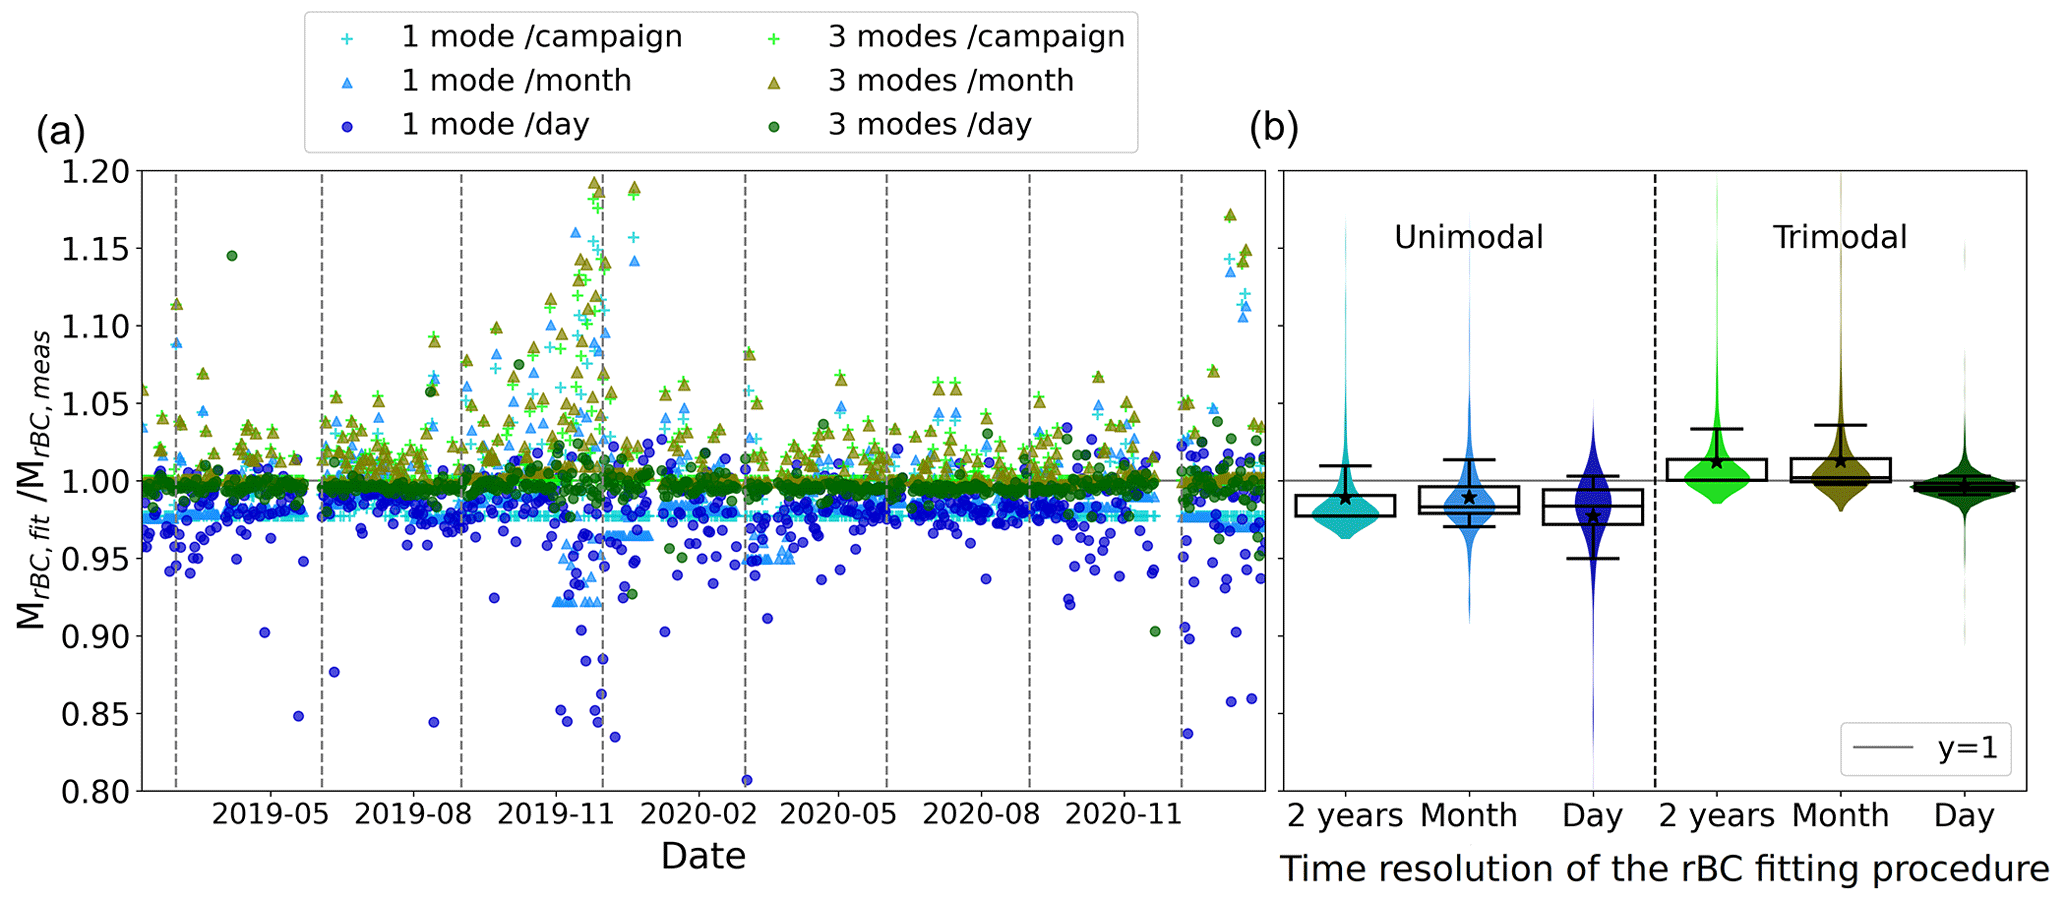
Figure 2(a) Time series and (b) statistics of calculated between 1 and 1000 nm when representing the rBC size distribution with one (light blue to dark blue) or three (light green to dark green) modes and when fitting on the mean campaign (crosses), monthly (triangles) or daily (plain circles) size distribution. Violin plots represent the probability density function of . Boxes and whiskers represent the 25th, 75th, 10th and 90th percentiles. Lines and stars show median and mean values.
Figure 2 shows the ratio between MrBC,fit fitted between 1 and 1000 nm and the one derived from the observation () over the DrBC range covered by the SP2 for the different fitting approaches throughout the campaign (Fig. 2a) and the overall statistical results (Fig. 2b). Considering all data points from the campaign, the unimodal fit tends to slightly underestimate MrBC,meas by around 1.6 % regardless of the selected averaging time. When using a trimodal lognormal function, the overall statistics for these two quantities agree more closely within 0.4 %. However, both the variability and the systematic bias in the ratio are considerably smaller when fitting the rBC size distribution with a trimodal lognormal distribution and on a daily basis. The evolution of the ratio over the 2-year measurement period shown in Fig. 2a illustrates that MrBC,fit differs regularly from MrBC,meas by more than 5 % for every fitting procedure and even more in autumn and winter. In fact, as shown in Fig. S1 in the Supplement, the averaged rBC size distribution observed in autumn and winter is more noisy than the one in summer and spring. In particular, the second mode usually peaking at around 180 nm is less clearly defined in autumn and winter with some outliers above the general distribution. The third coarse mode at DrBC ∼ 400 nm exhibits also a higher variability in cold seasons compared to the ones fitted in spring and summer. Tinorua et al. (2024) showed that winter was characterized by lower MrBC,corr with some rBC-containing particles injected from the boundary layer during the day, compared to summer when an additional long-range transport of rBC-containing particles occurred. Thus, the noisier rBC size distributions in winter and autumn could be due to the low daily MrBC,corr which leads to greater uncertainties in the fitting procedure and/or more sporadic variability in MrBC,corr due to the PBL dynamics in winter. Overall these results suggest that neglecting the day-to-day variability in rBC size distribution at PDM may lead to an overestimation of MrBC,corr.
The extrapolation of rBC size distribution towards lower and larger sizes leads to a missed mass fraction Rfit/meas calculated using Eq. (1) of around 25 % and 15 % for the unimodal and multimodal fits, respectively. Therefore, in the following, all reported MrBC,corr values are corrected with the multimodal fit on a daily basis. Although the overall bias between MrBC,meas and MrBC,fit remained low (< 2 % on average over the 2-year campaign) regardless of the approach chosen, it can be seen in Fig. 1 that the largest differences between the one-mode and the three-mode fitting approaches occurs for DrBC < 90 nm. It is important to note that the lack of measurements below 90 nm complicates the estimation of the missing mass fraction. Since it is possible that discrepancies between instruments arise from the extrapolation of rBC size distribution towards lower and larger sizes, the influence of the estimated fraction of undetected rBC particles on the biases between instruments will be investigated in Sect. 3.4.
3.2 Overview of rBC, EC and eBC mass concentrations measured by the SP2, Sunset and AE33 and their relationship
Figure 3 shows the temporal variation and frequency distribution of MrBC,corr, MEC and MeBC, which are, respectively, BC mass concentrations measured by the SP2, Sunset and AE33 from January 2019 to February 2021. Table S1 in the Supplement reports the statistical analysis of MrBC,corr, MEC and MeBC. Over the whole period the mean values (± SD) of MEC, MrBC,corr and MeBC were 54.7 (± 25.3), 36.4 (± 28.4) and 78.5 ng m−3 (± 54.3), respectively. All techniques respond to seasonal variations in the atmospheric changes in BC levels. Average concentrations were around 2–4 times (depending on the measurement technique) higher in summertime than in wintertime, with monthly averages ranging from a minimum of 14.2–44.8 ng m−3 in December to a maximum of 65.6–142.3 ng m−3 in July. This seasonal variation is similar to those reported at the high-altitude European sites of Jungfraujoch in Switzerland for MeBC measurements (Bukowiecki et al., 2021) and Montseny in Spain for MEC measurements (Zanatta et al., 2016). At PDM, this seasonality was attributed to the combined effects of less precipitation and a larger contribution of long-range transport from biomass burning sources during summer (Tinorua et al., 2024).
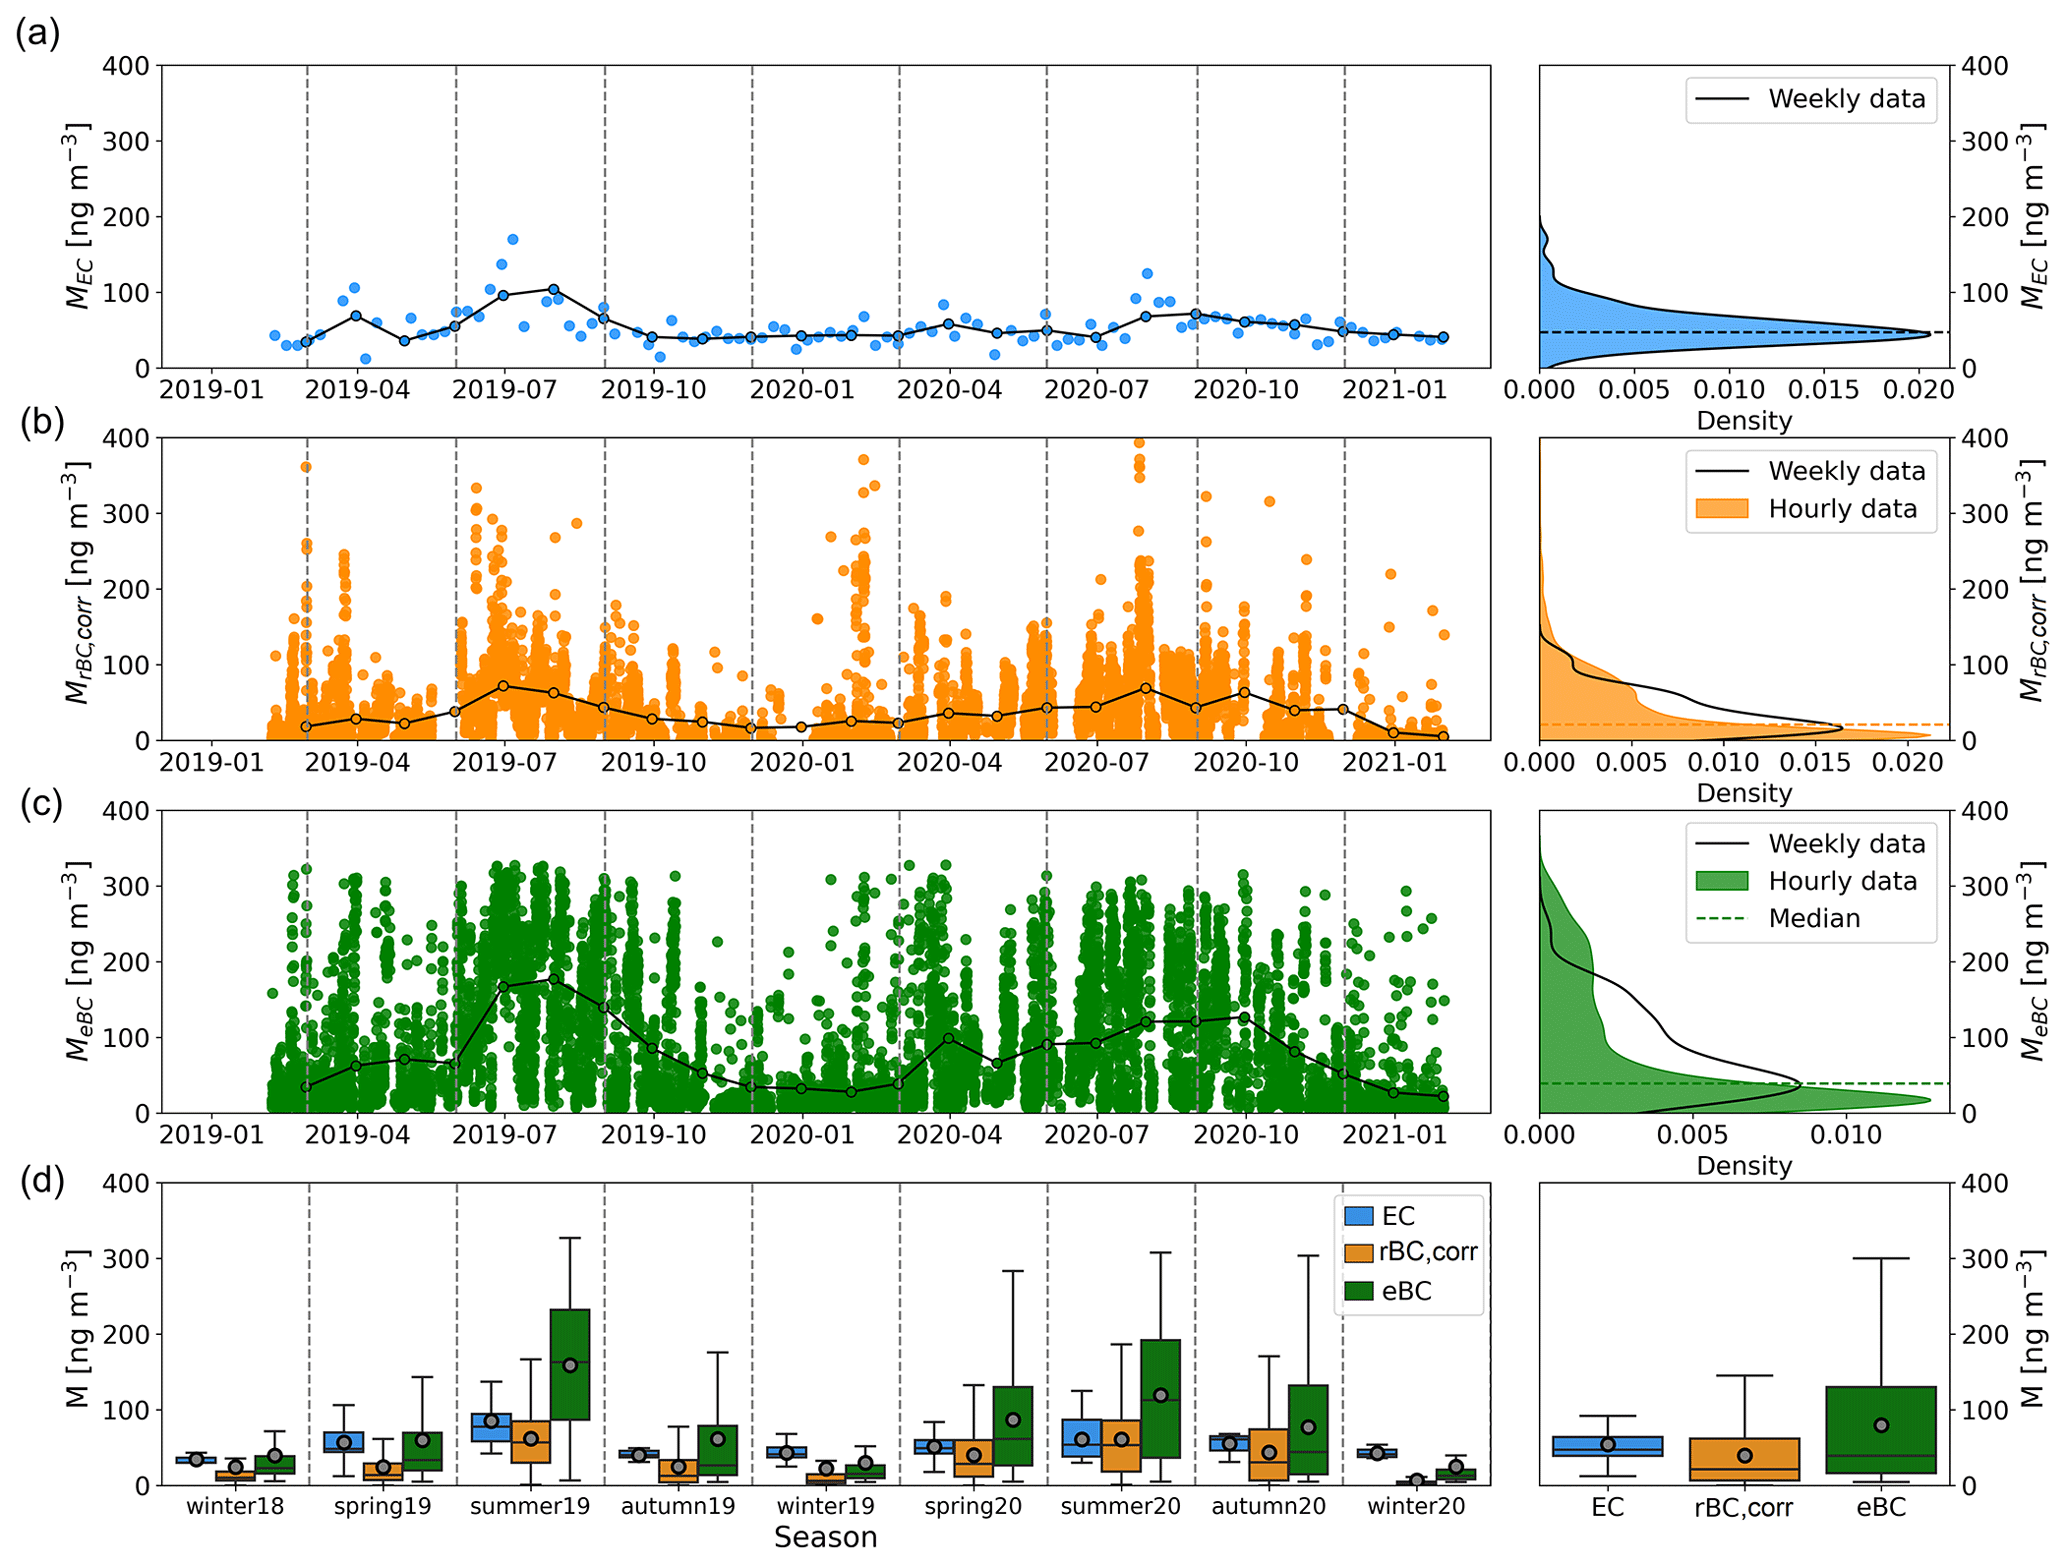
Figure 3Time series (left) and statistical analysis (right) of (a) MEC, (b) MrBC,corr and (c) MeBC measured during the campaign. Dots connected with lines represent monthly averages, and isolated dots represent hourly data. For (b) and (c), probability distribution functions of MrBC,corr and MeBC were calculated over hourly data in colours and over resampled data on the time resolution of Sunset in black lines. (d) Seasonal boxplot of MEC, MrBC,corr and MeBC.
Figure 4 shows scatterplots of time-resolved relationship between MrBC,corr, MEC and MeBC over the campaign using distinct colours for each month. Positive correlations were observed between all instruments with Pearson's r values ranging from 0.66 to 0.80. All linear regressions were based on an assumption of a zero intercept.
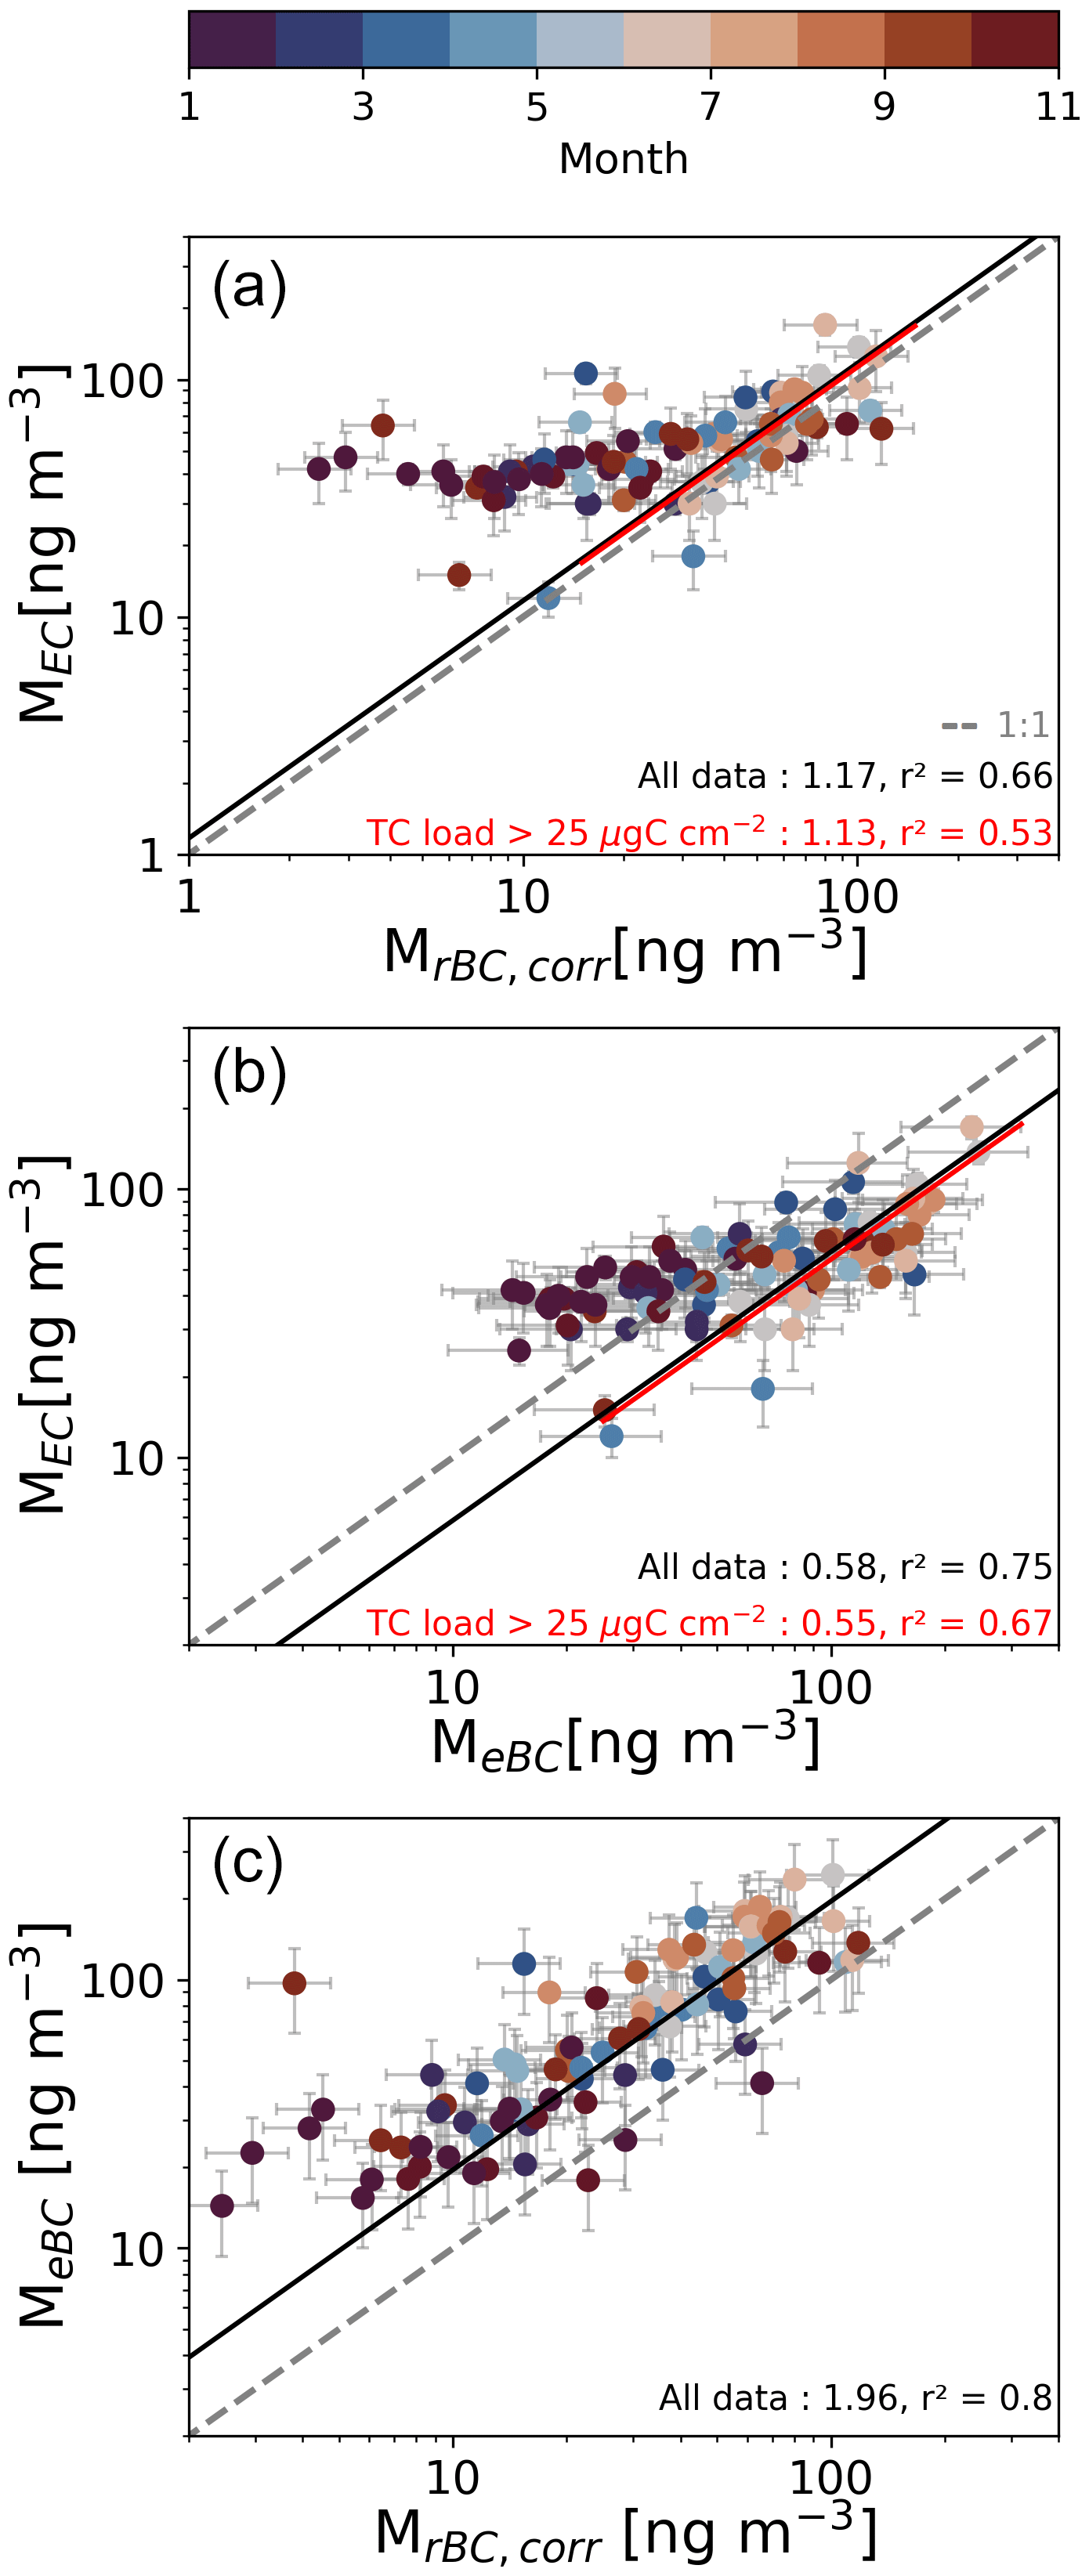
Figure 4Scatterplot of the relationship between (a) MEC versus MrBC,corr, (b) MEC versus MeBC and (c) MeBC versus MrBC,corr over to the whole measurement period. For each plot, the dashed line represents the 1:1 line and the dark solid line represents the linear fit over all data, with the corresponding correlation coefficient shown in the legend. ∗ For MEC versus MrBC,corr and MEC versus MeBC, the slopes excluding data where the TC load was lower than 25 µg C cm−2 have also been calculated and represented by solid red lines.
Considering all data points, the largest bias is observed between the AE33 and the SP2 measurements (Fig. 4c.), with MeBC higher by a factor 1.96 than MrBC,corr on average. The good Pearson's r value of 0.80 shows that the bias is systematic. The correlation slope is almost parallel with the 1:1 line, meaning that there is an offset error in MeBC compared to MrBC,corr. Considering the colours of the points, there is no link between the time of the year and the value of the bias.
The SP2 and Sunset measurements appear to have the best agreement with a correlation slope of 1.17 between MEC and MrBC,corr. As shown in Fig. 4a, the correlation between the Sunset and the SP2 measurements degrades for MEC lower than 50 ng m−3. The threshold MEC value can also be observed to a lesser extent on the relationship between the AE33 and Sunset measurements with a slight break in the correlation slope below 50 ng m−3 (Fig. 4b). These results point to a loss of Sunset sensitivity below this limit value. The reasons behind these results will be investigated in the next section.
3.3 Biases on EC mass concentration measured by Sunset: filter underloading and charring effect
The main challenges in isolating EC from TC analysis are the possible artefacts during OC–EC separation. In a study from the EMEP Co-operative Programm for Monitoring and Evaluation of the Long-range Transmission of Air Pollutants in Europe employing 36 instruments measuring MEC over Europe (EMEP/CCC–Report 1/2018, https://projects.nilu.no/ccc/reports/cccr1_2018_Data_Report _2016_FINAL.pdf, last access: 28 June 2024), a bias is mentioned in the determination of the OC–EC split point at low TC concentrations, which usually leads to an overestimation of MEC. However there is no detail provided to explain the effects. Figure 5a shows how the filter TC loading influences the biases between MEC and MrBC,corr. The same analysis has not been carried out for MEC to MeBC ratio because of the multiple sources of biases in MeBC (i.e. Sect. 3.5). A systematic positive bias and a wide dispersion of the ratio can be observed at TC contents below 25 µg C cm−2 (mean ± SD of 3.08 ± 2.71). Above this TC value, no significant dependence on the filter loading can be distinguished with a lower mean (± SD) ratio of 2.35 ± 3.29. A large fraction of samples (42 %) with TC loading below 25 µg C cm−2 was measured in winter. When data with a TC load below 25 µg C cm−2 are eliminated, the bias between MrBC,corr and MEC is reduced, with a decrease in the value of the slope from 1.17 to 1.13 (see Fig. 4a). By contrast, excluding data with a TC load below 25 µg C cm−2 leads to a slope of MEC versus MeBC farthest from unity (0.55 against 0.58 considering all data; see Fig. 4b). This is for sure due to the compensating effect of data with a TC load lower than 25 µg C cm−2 on the overestimation of MeBC compared to MEC, thus leading to a slope slightly closer to 1.
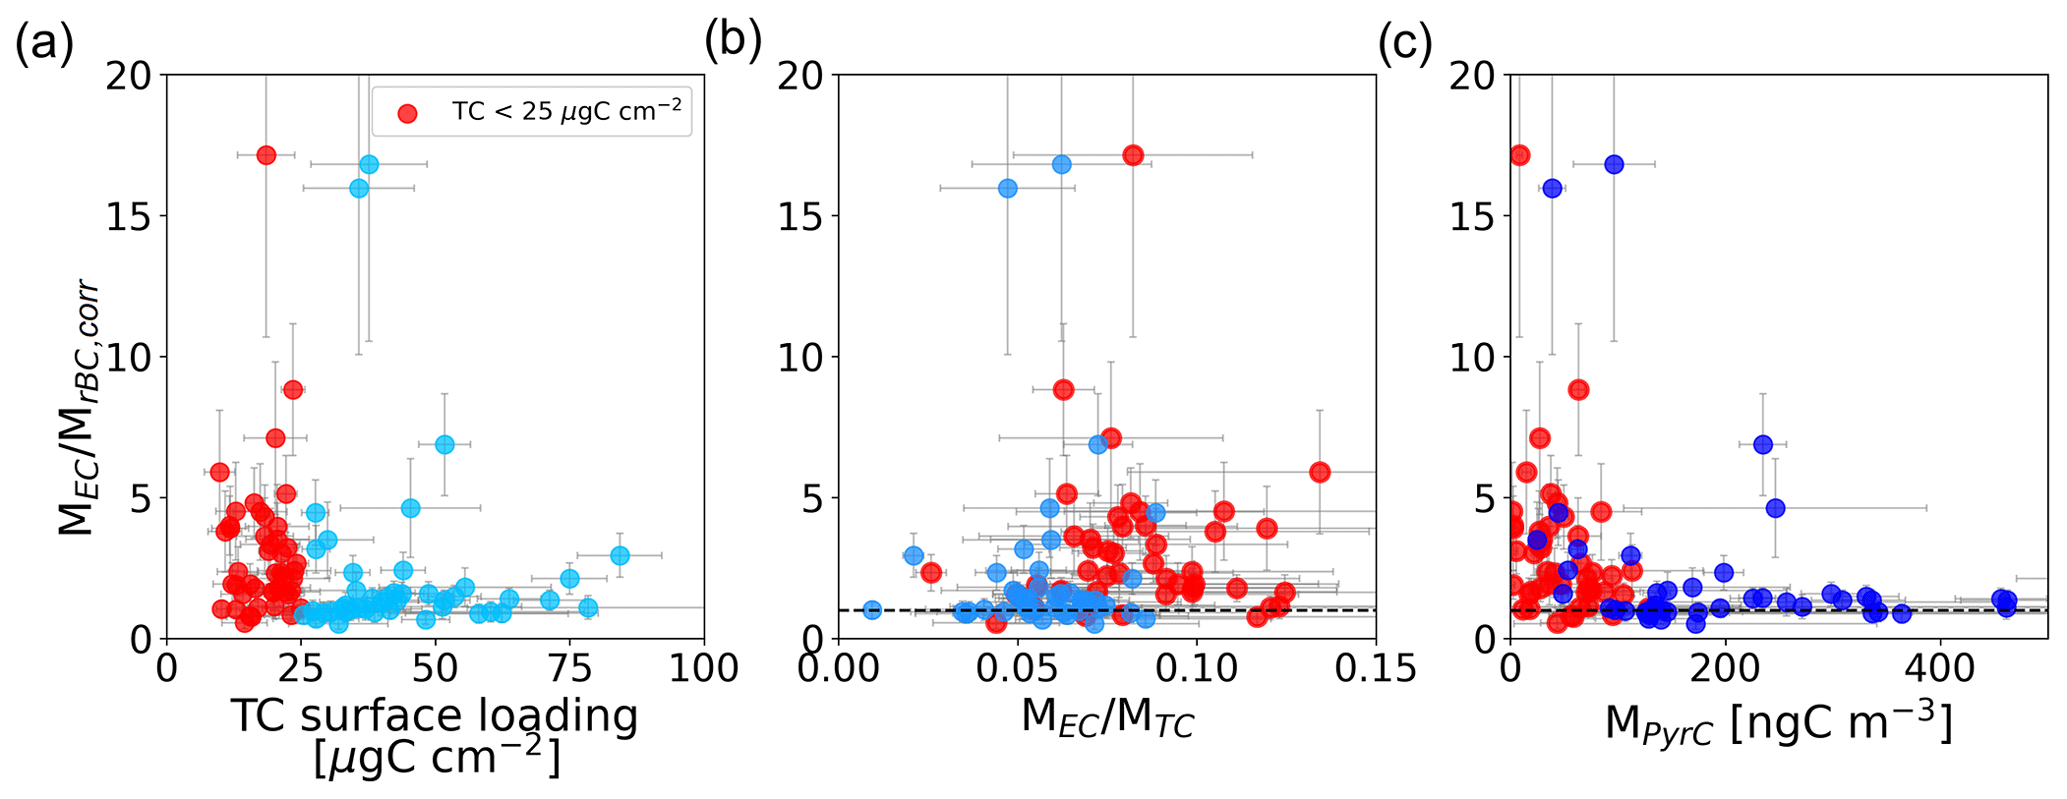
Figure 5 as a function of (a) total carbon (TC) surface loading, (b) and (c) MPyrC. Points have a weekly time resolution. Red dots highlight data where the TC loading is under 25 µg cm−2. Error bars represent the uncertainties for each variable considering the Sunset measurement uncertainty and the SP2 ones marked in Table 1.
Our results are consistent with the sharp reduction in the repeatability and reproducibility at low TC loadings (below 10 µg C cm−2) reported during an inter-laboratory comparison for the measurement of MEC performed within the European project ACTRIS-2 on ambient aerosol samples collected at a regional background site in Italy (EMEP/CCC–Report 1/2018). Conversely, Pileci et al. (2021) did not find any increased random noise or systematic bias caused by low TC surface loading. However, Fig. S2 in the Supplement shows that the superimposition of our data with theirs indicate a similar trend with a wide dispersion of ratio below 25 µg C cm−2. As explained in Zheng et al. (2014), the threshold TC load for accurate thermal-optical analysis can vary with location and season due to the variation in thermal properties among carbonaceous particles collected on the filter.
We further investigate the potential causes of the Sunset bias with a special focus on the charring correction used to derive MEC with the EUSAAR-2 protocol. Optical correction is an essential component of the thermal-optical method to remove measurement artefacts in OC and EC caused by charring of some OC components. Without correction, the charred fraction of OC, also called PyrC, would be reported as being part of EC, leading to an overestimation of MEC. Charring depends on many factors, including the amount and type of organic compounds, temperature steps in the analysis, the residence time at each temperature step, and the presence of certain inorganic constituents or BrC (Yu et al., 2002; Subramanian et al., 2007; McMeeking et al., 2009).
Figure 5b presents the ratio as a function of the ratio to investigate if biases arise from the split between OC and EC. No dependence of to ratio can be observed. This result differs from that obtained by Pileci et al. (2021) for five different field campaigns performed with different instruments. This could suggest that the quantification of ratio is more controlled by the instrument characteristic and set-up than the instrument-specific analysis-by-analysis variability.
Two different patterns can be distinguished for as a function of MPyrC in Fig. 5c. A wide dispersion of ratio for MPyrC below 140 ng C cm−3 can be observed with a mean (± SD) of 3.17 (± 3.40), whereas values are closer to 1 (1.63 ± 1.29) above this threshold value. All the data with MPyrC above 140 ng C cm−3 exhibited a TC loading over 25 µg C cm−2. By contrast below an MPyrC of 140 ng C m−3 most samples (73 %) exhibit a TC loading lower than 25 µg C cm−2. Interestingly the remaining samples with MPyrC below 140 ng C cm−3 and TC loading above 25 µg C cm−2 show a mean value of around 3.40. This result indicates a possible underestimation of MPyrC for these samples that could explain some of the bias between MEC and MrBC,corr.
Another possible measurement artefact can arise from the presence of dust and BrC particles as mentioned previously by Liu et al. (2022) and Karanasiou et al. (2020). However, as will be explained in Sect. 3.5, the sporadic nature of dust events at PDM compared to the long sampling duration of Sunset did not allow us to identify samples with significant Saharan dust contribution. Furthermore, Tinorua et al. (2024) found a very low contribution of BrC to the aerosol absorption at PDM. Ammerlaan et al. (2015) also highlighted a possible influence of the laser stability on MEC bias. Here, a deep analysis of the blank filters did not reveal laser instabilities. In addition, the analysis of the baseline of the transmission signal in the thermograms did not allow us to identify potential causes of the overestimation of MEC.
In the following, all Sunset data for which TC content is lower than 25 µg C cm−2 have been eliminated from the analysis.
3.4 Biases on rBC mass concentration measured by the SP2 due to the presence of undetected small/large rBC-containing particles
As shown in Sect. 3.1 and Fig. 1, the limited SP2 detection range (90 < DrBC < 700 nm) can lead to an underestimation of MrBC,corr. In this section we investigate if the mass discrepancy could be partially explained by the presence of BC particles outside the SP2 detection size range. MrBC,meas has been corrected for the missing mass concentration outside the SP2 detection range using an extrapolation method based on daily multimodal fits to the measurement (i.e. Sects. 2.2.1 and 3.1).
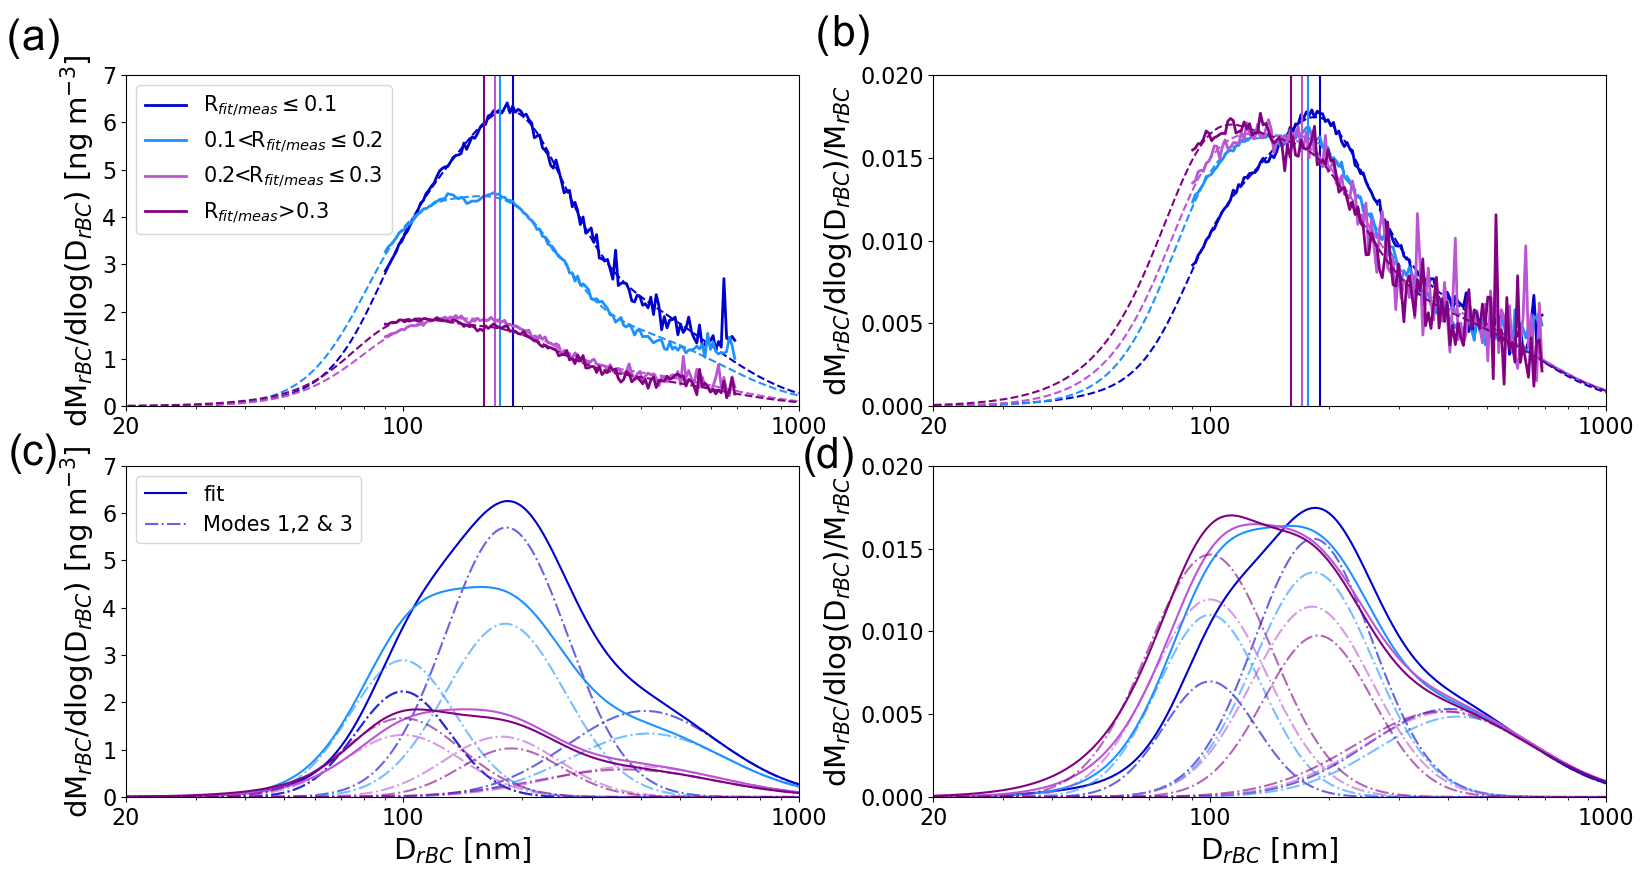
Figure 6(a) Mass size distribution of rBC core measured by the SP2 coloured as a function of the missing mass correction factor Rfit/meas. Vertical lines show the geometric diameter of each rBC mass size distribution. (b) Same as (a) but normalized by the total rBC mass. (c) Same as (a) but showing the position of the three modes with the fitting procedure represented by dotted lines. (d) Same as (c) but normalized by the total rBC mass.
Table 2Extrapolated mass fraction of MrBC,fit outside the SP2 size detection range for each Rfit/meas.
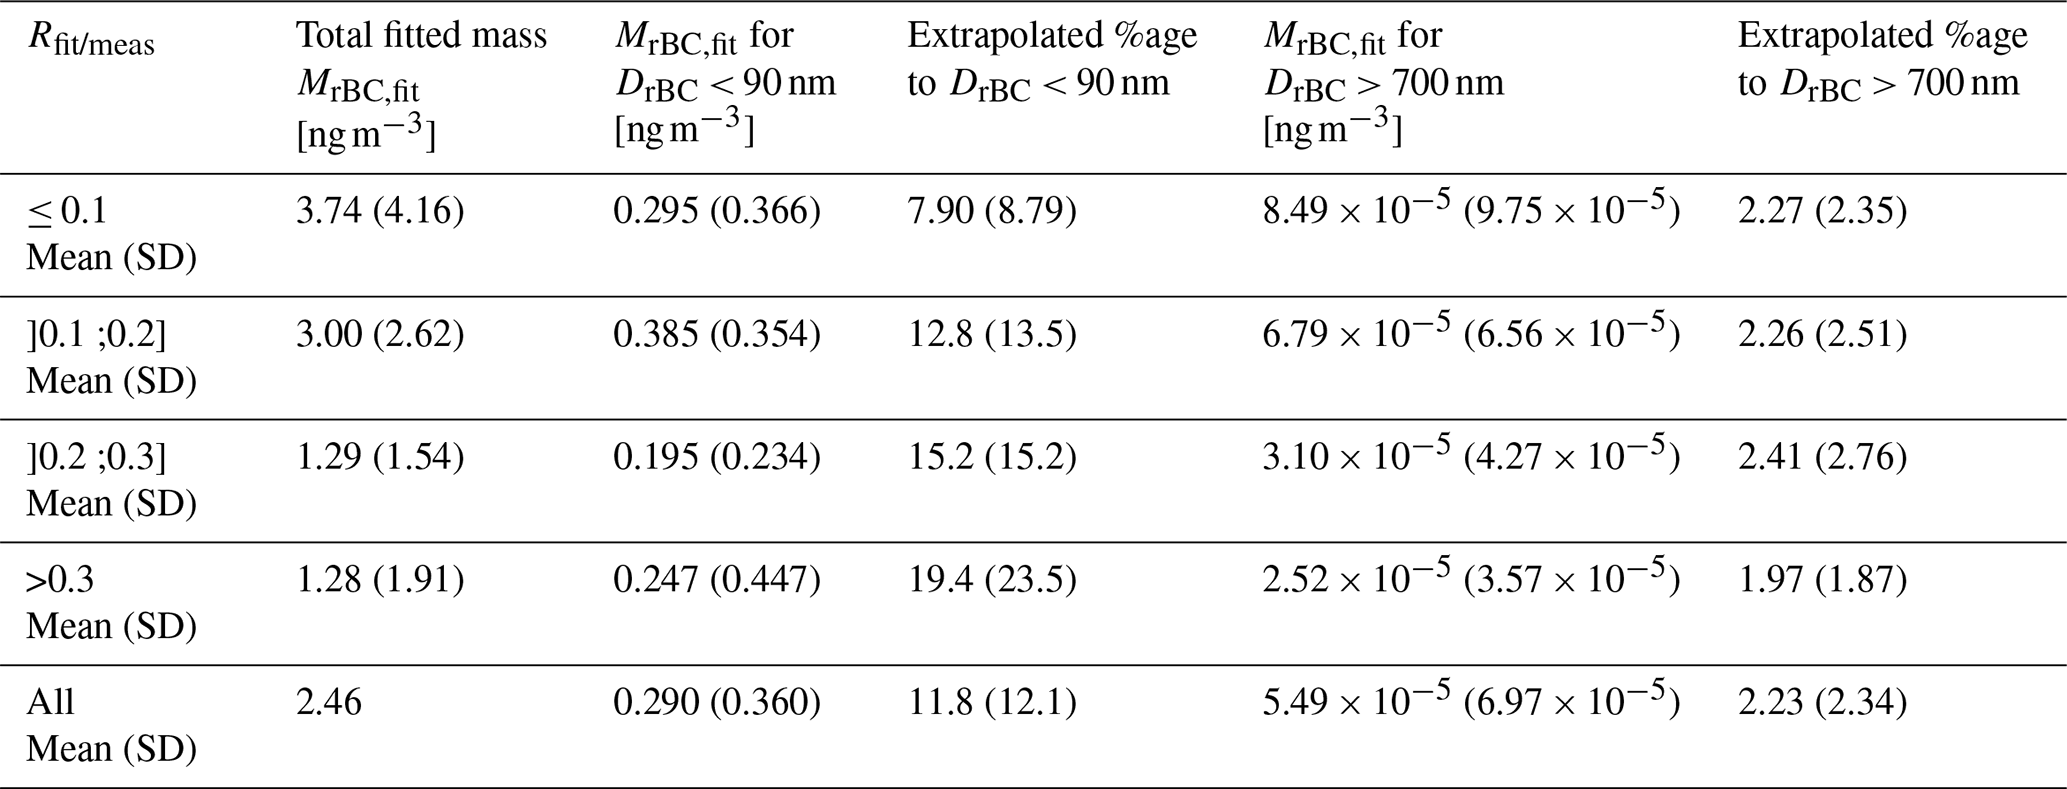
Figure 6 shows the campaign-averaged mass-weighted rBC size distribution classified into four ranges of fractional amount of missing mass fraction (Rfit/meas). Rfit/meas increases strongly as the proportion of mode 1 (i.e. centred at around 100 nm) increases. This mode 1 becomes predominant when Rfit/meas exceeds 0.1, while mode 2 (i.e. centred at around 180 nm) becomes secondary. Meanwhile, the proportion of mode 3 (i.e. centred at around 400 nm) remains rather constant for all ranges of Rfit/meas. As shown in Table 2, the extrapolated mass fraction under the lower detection range of the SP2 (DrBC < 90 nm) increases from 7.9 % to 19 % as Rfit/meas increases from values ≤ 0.1 to values > 0.3. By contrast, above the higher detection range (DrBC > 700 nm), the extrapolated mass fraction is very low with values around 2.5 % and is not correlated to Rfit/meas values. Overall, these results show that the presence of small rBC particles below the lower detection limit of the SP2 is the main contributor to the extrapolation calculations, whereas the contribution of large rBC particles above the higher detection limit is rather negligible.
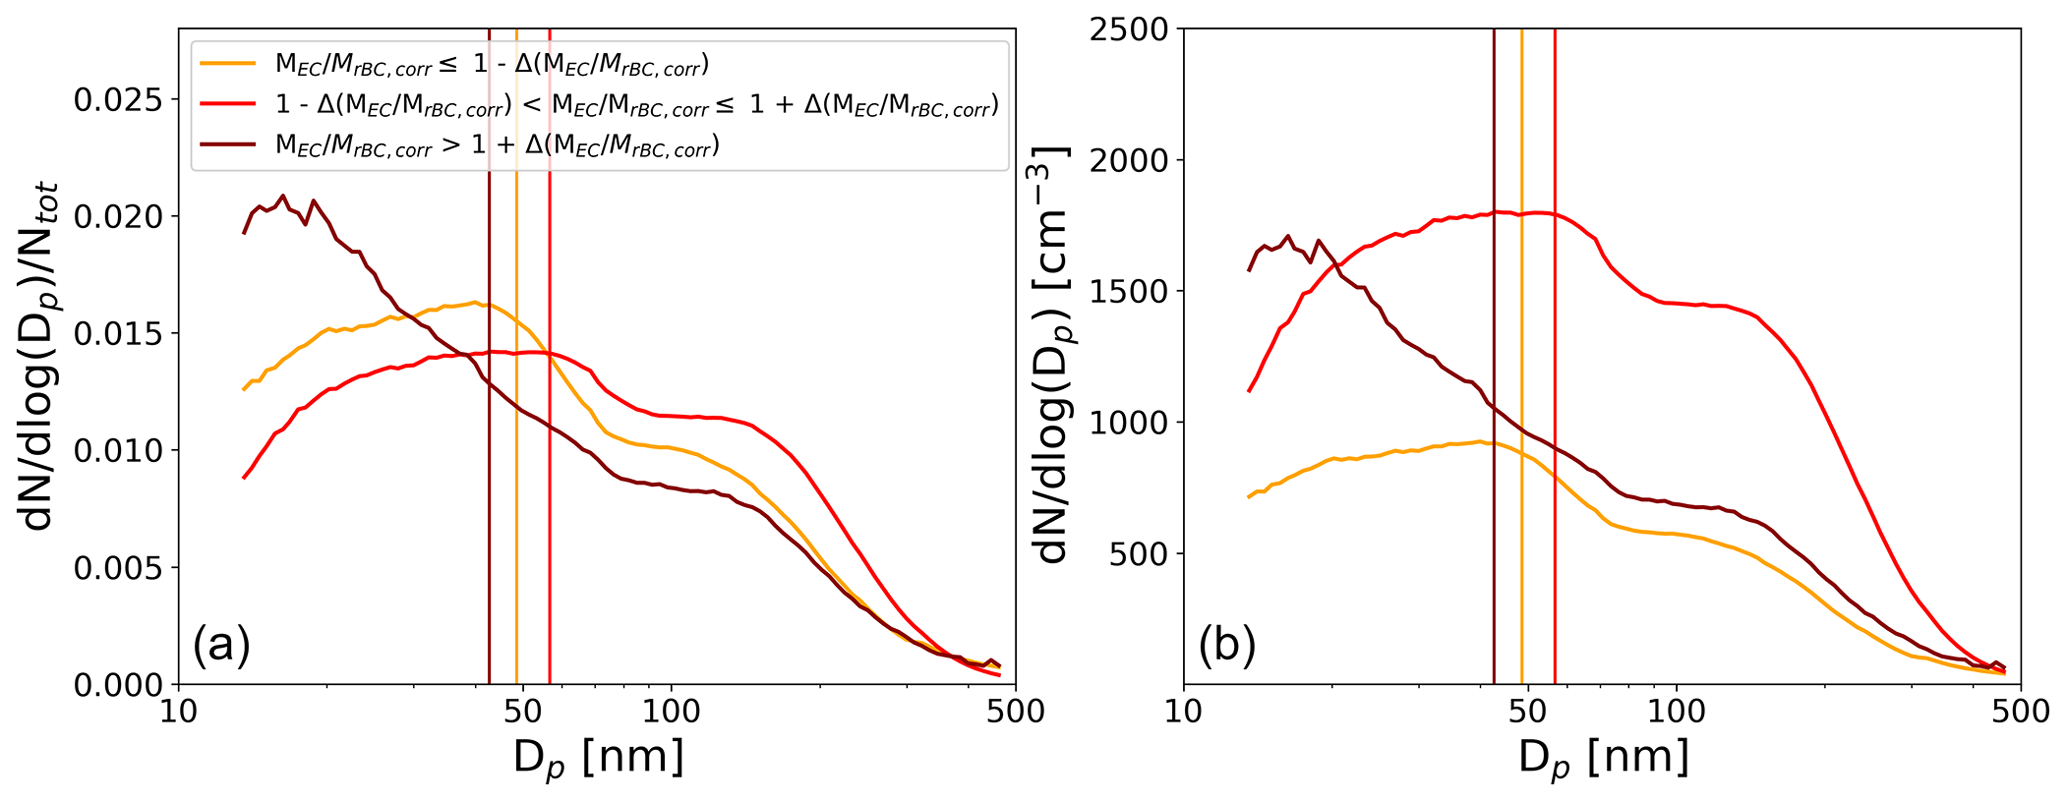
Figure 7(a) Number size distribution of aerosols measured by the SMPS, coloured by ranges of values. Panel (b) is the same as (a) but normalized by the total aerosol number concentration. Vertical lines highlight geometrical diameter corresponding to the colour of the range.
Given the remote location in the Pyrenees and apparent distance from fresh BC source regions of the PDM site, it is expected that rBC particles sampled at this site are aged with relatively large sizes. Regarding the large contribution of ultrafine rBC particles, their presence at PDM is surprising but could be explained by two hypotheses. First, it is possible that some periods with local influences of rBC emission still remain despite the filtering of isolated spikes of CO (i.e. Sect. 2). However, the Rfit/meas shows no correlation with MrBC,corr (see Fig. S3 in the Supplement), meaning that the presence of ultrafine rBC did not preferentially occur during local pollution events when MrBC,corr values were sporadically very high. In fact, an opposite trend can be observed with higher Rfit/meas (> 0.2) under low MrBC,corr conditions (< 30 ng m−3). Second, these ultrafine rBC-containing particles could be produced by aviation emissions. Modal diameters of nonvolatile particle size distributions in aircraft turbine exhaust range from 15 to 40 nm (Lobo et al., 2015; Durdina et al., 2017, 2019), while particles from petrol direct injection and diesel engines have larger mean diameter values ranging from 50 to 100 nm (Burtscher, 2005; Momenimovahed and Olfert, 2015). Recently, BC mass emissions were estimated to be around 100–1000 g km−2 above the Pyrenees region (Zhang et al., 2019) if only taking into account global civil aviation. Tinorua et al. (2024) showed that the dominant air mass origin at PDM is the North Atlantic Ocean, where around 14 % of the total BC mass emissions from civil aviation occurs (Zhang et al., 2019). To further investigate the role of small particles on the MrBC,corr bias, the aerosol number size distributions grouped by ratios have been plotted in Fig. 7. The size distribution for which the highest ratios between MEC and MrBC,corr has been observed clearly shows a contribution of small particles (< 20 nm) up to 2 times higher than when the bias on the ratio was negative or neutral, supporting the conclusion that the MrBC,corr underestimation compared to MEC is probably due to undetected small rBC-containing particles.
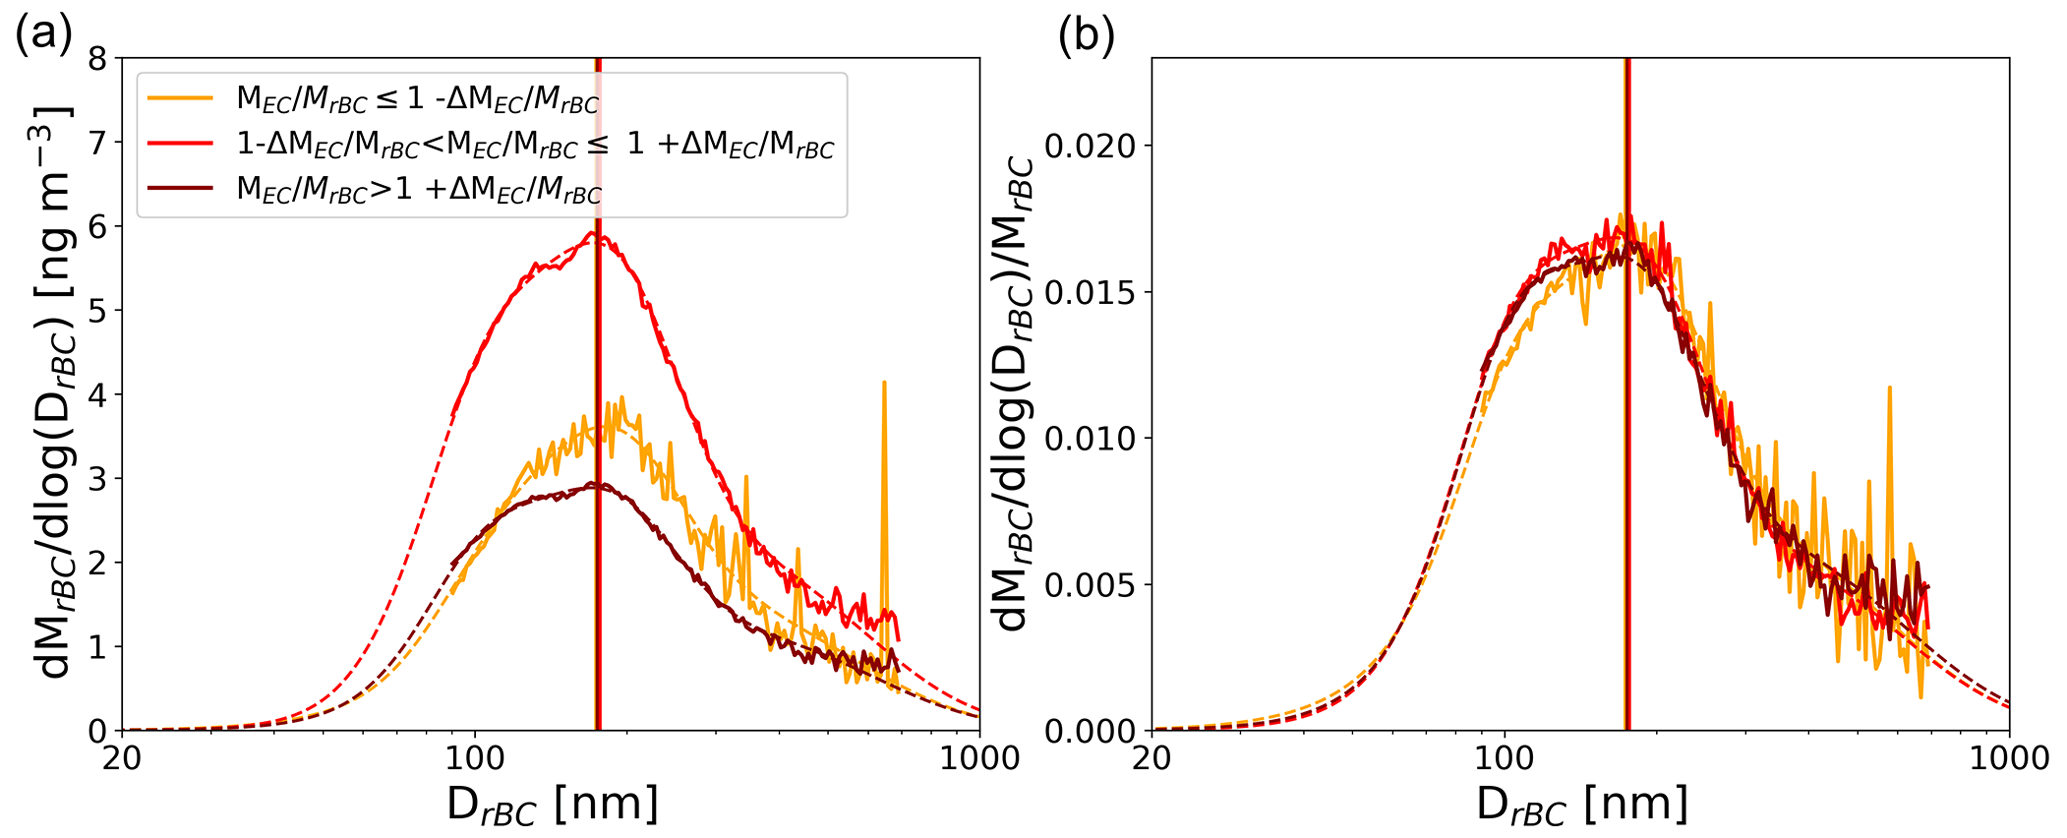
Figure 8(a) Mass size distribution of rBC core measured by the SP2, coloured by ranges of values. (b) is the same as (a) but normalized by the total rBC mass. Vertical lines highlight geometrical diameter corresponding to the colour of the range.
In order to estimate the extent to which the extrapolation in rBC size distribution contributes to uncertainty in the overall MrBC,corr, Fig. 8 shows the mass-weighted rBC size distribution classified into different ranges of ratio: a significant negative bias (), with Δ() representing the uncertainty in ); an agreement within the uncertainty range (); and a significant positive bias (). An examination of the shapes of rBC core mass size distributions of rBC core in Fig. 8 did not reveal any variability for the different ranges of values. From these results we can not conclude any influence of the SP2 limited detection size range on the discrepancy between the SP2 and Sunset. However, it is important to note that the modal diameters and widths for modes 1 and 3 are particularly uncertain as these modes occur near the lower and higher detection limit of the SP2. Uncertainties in the position and width for these modes may contribute to uncertainty in the total MrBC,corr. In addition it is possible that (1) the extrapolation of the first mode peaking at ∼ 100 nm is inaccurate for masses lower than 90 nm, which is the lower size detection limit of the SP2, or (2) the SP2 missed the detection of a mode that is centred at lower diameter than the lower limit of detection of the SP2.
3.5 Biases on eBC mass concentration measured by the AE33
The main uncertainties in the MeBC inferred from the AE33 measurement are the MAC used to calculate MeBC from the absorption coefficient and the correction due to multiple scattering of particles sampled on the filter, as shown in Eq. (3) (Arnott et al., 2005; Bond et al., 1999; Collaud Coen et al., 2010; Weingartner et al., 2003). The multiple scattering correction factor C depends on the optical properties of the aerosol collected on the filter and the filter tape used. A constant MAC value of 7.77 m2 g−1 is recommended by the AE33's manufacturer to convert σabs,880 to MeBC, which is representative of optical properties of fresh BC particles (Bond et al., 2013). Nonetheless a wide range of MAC of BC from 3.8 to 58 m2 g−1 at 880 nm has been reported from field and laboratory measurements (Wei et al., 2020). This variability is due to the diversity of BC microphysical and chemical properties, which are related to their emission sources (Schwarz et al., 2008) and the effects of ageing processes during the transport in the atmosphere (Ko et al., 2020; Sedlacek et al., 2022; Peng et al., 2016).
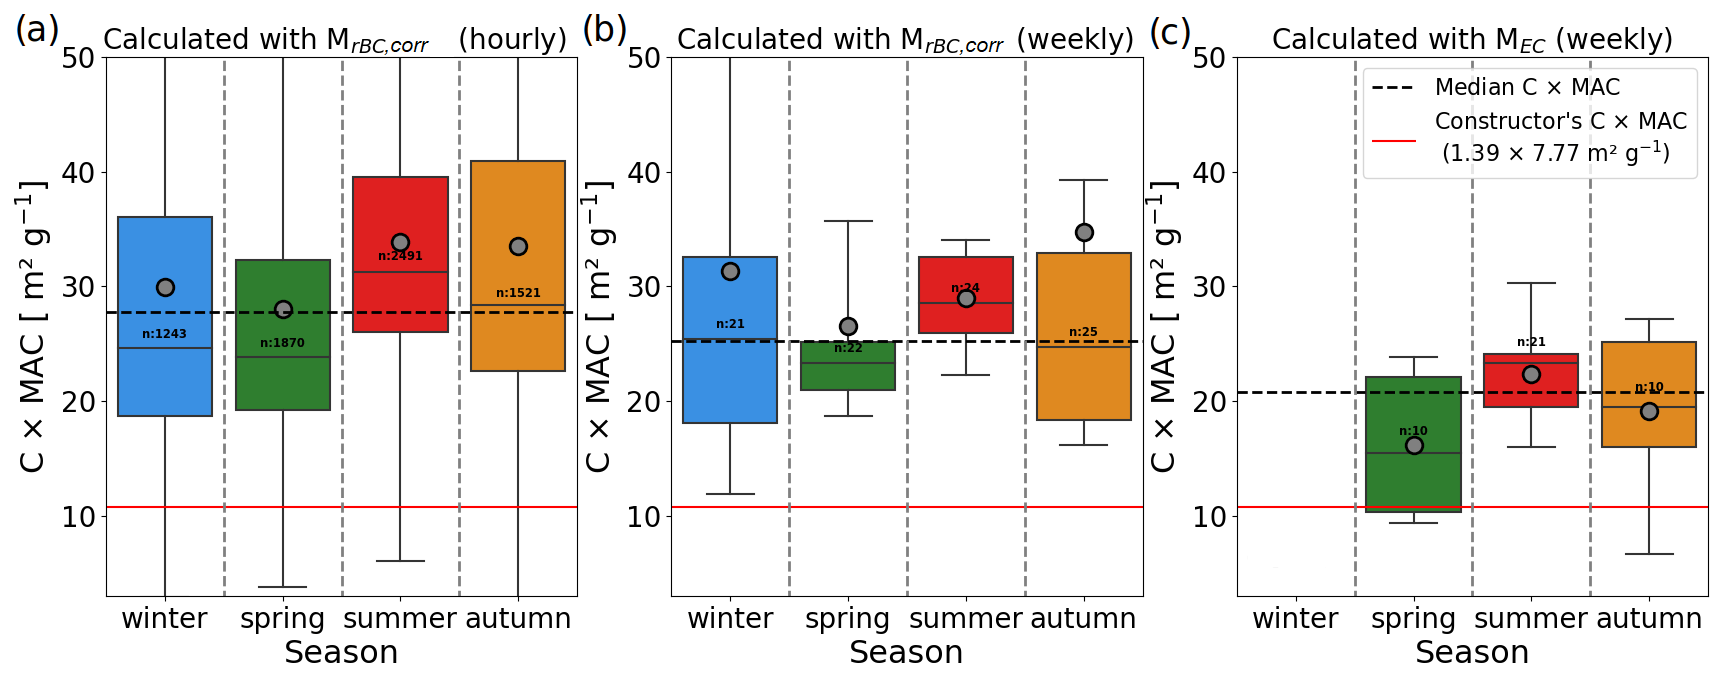
Figure 9C × MAC as a function of the season calculated with (a) MrBC,corr on an hourly basis; (b) MrBC,corr averaged over the sampling period of Sunset; and (c) MEC, excluding TC loading < 25 µg C cm−2. Constructor's values are represented with a solid red line, while median values are represented with a dashed black line. For (b), the median is calculated excluding winter's value to be in agreement with (c). Boxes, lines, black dots and whiskers indicate 25th percentile, 75th percentile, median, mean, 10th percentile and 90th percentile, respectively.
We first recalculated the hourly (weekly) products of the multiple scattering coefficient C and MAC value obtained at PDM by dividing σATN at 880 nm by MrBC,corr (MEC). Figure 9a shows that daily C × MAC values calculated with MrBC,corr are around 2 to 3 times higher than those recommended by the manufacturer, with a median value of 27.8 m2 g−1, against 10.8 m2 g−1 for the constructor's value. In addition, a clear seasonal pattern can be observed with median values of 24.5 m2 g−1 and 31.3 m2 g−1 in spring and summer, respectively. C × MAC values calculated using MrBC,corr from the SP2 are around 21 % higher than those obtained using MEC from Sunset (Fig. 9c) with median values of 25.2 and 20.8 g−1, respectively, despite averaging SP2 over the same time resolution as Sunset (Fig. 9b). However, similar seasonal variability in the C × MAC values was obtained using MEC and MrBC,corr, although no statistical values could be obtained in winter due low MEC values that are to too during this season. This is consistent with the seasonal trend of C values obtained at Montsec d'Ares in the Spanish Pyrenees by Yus-Díez et al. (2021) using σabs measured by a MAAP (multi-angle absorption photometer). In addition, Pandolfi et al. (2014) found also higher MAC values at 637 nm in summer than in spring at this site.
In order to investigate the cause of the seasonal variation in C × MAC, we plotted in Fig. 10 the correlation between C × MAC and the CO ratio for each season. The CO ratio has been shown to be a good tracer of the rBC combustion source and wet deposition (Baumgardner et al., 2002; Taylor et al., 2014). Here ΔMrBC,corr and ΔCO were estimated using the approach presented in Tinorua et al. (2024). Briefly, the hourly ΔCO values were obtained by subtracting the hourly CO concentrations by the background CO concentrations estimated from the rolling 5th percentile of the values on a 14 d time window. ΔMrBC,corr was considered to be equal to MrBC,corr, thus assuming that the background MrBC,corr is zero. Air masses for which precipitation occurred along 72 h back trajectories performed with the HYSPLIT model were removed in order to investigate the influence of rBC sources only. Lower C and MAC values are generally observed in the literature for rBC-containing particles emitted from fossil combustion compared to those emitted from biomass combustion (Laing et al., 2020; Sedlacek et al., 2022; Healy et al., 2015; McMeeking et al., 2014; Denjean et al., 2020). A significant increase in C × MAC can be observed in Fig. 10 for < 2 in every season except for spring, suggesting that a BC source-dependent correction should be applied to the AE33.
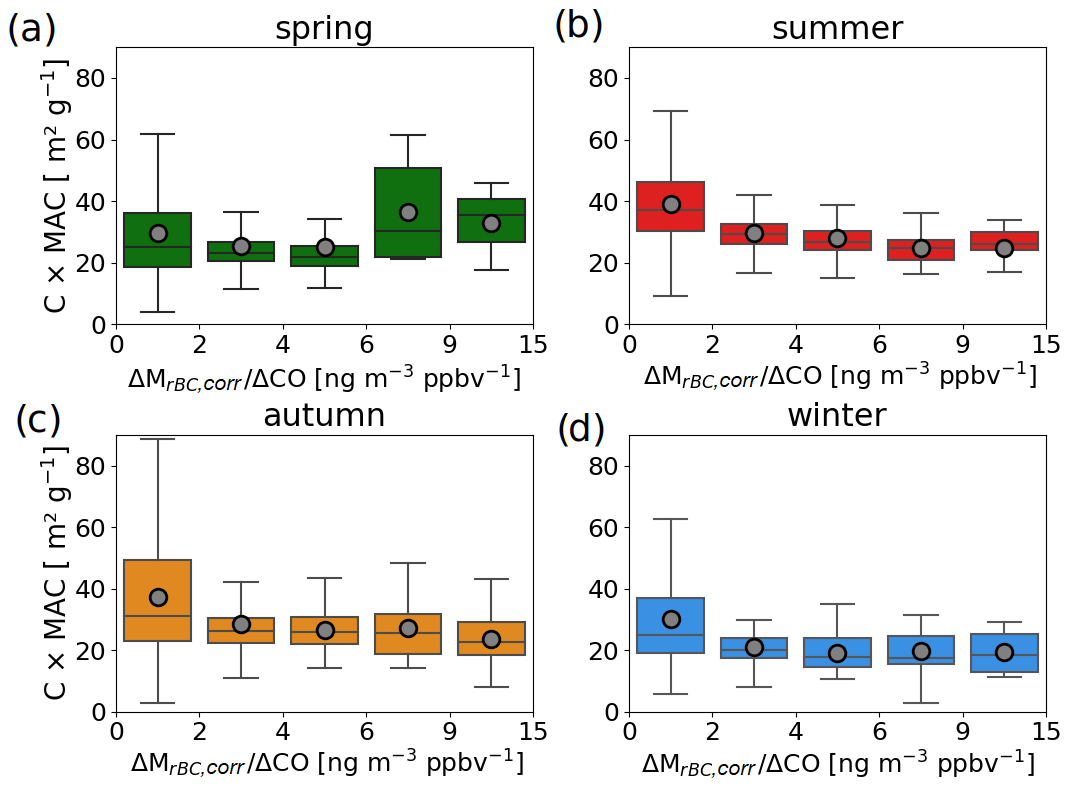
Figure 10(a–d) C × MAC as a function of the emission ratio for spring, summer, autumn and winter. Boxes, lines, black dots and whiskers indicate 25th percentile, 75th percentile, median, mean, 10th percentile and 90th percentile, respectively.
The absence of correlation between C × MAC and in spring may be due to a measurement artefact during this season, such as the dominant presence of dust particles which can affect the C correction of the AE33 (see Fig. 10a and associated text). In order to study the influence of other co-existing light-absorbing particles on C × MAC, a classification of the dominant aerosol type sampled at the PDM was performed. This classification, detailed in Tinorua et al. (2024), is based on the daily analysis of the spectral aerosol optical parameters AAE and SAE. Aerosols with AAE > 2 and SAE < 0.25 were classified as dust-dominated, aerosols with AAE > 2 and SAE > 1.5 were classified as BrC, and aerosols with AAE > 1.5 were characterized as aerosol mixtures containing dust particles and/or BrC (Kirchstetter et al., 2004; Lack and Cappa, 2010).
Figure 11a shows the ratio as a function of the season and the dominant aerosol type. The same analysis could not be carried out for the ratio due to the short duration of the dust events reaching PDM (< 1–2 d) compared to the duration of aerosol sampling for Sunset analyses (1 week). The level of agreement between MeBC and MrBC,corr over the 2-year campaign degrades by a factor of 2 when aerosols were dominated by dust particles (averaged ± SD of 6.7 ± 3.6 and 3.2 ± 6.3 during and outside dust events, respectively). The bias is the greatest in spring with ratio reaching 8.6 ± 3.7 (see Fig 11a). This seasonality is due to a stronger influence of dust events transported in the Pyrenees in spring (Tinorua et al., 2024). It should be noted that no BrC-dominated events were observed at PDM, probably due to their low lifetime in the atmosphere (around 1 d) (Forrister et al., 2015; Wong et al., 2019). In addition, no increase in ratio is observed for aerosols composed of a mixing of rBC with dust and/or BrC particles, suggesting that only the predominance of dust particles in the aerosol leads to significant biases in MeBC retrieval. Previous studies showed that a higher C value should be applied for dust samples (Yus-Díez et al., 2021; Di Biagio et al., 2017). Using the same instrumentation as this study, Yus-Díez et al. (2021) showed that a C value of around 3.95 should be used for correcting multiple scattering artefacts in the AE33 during Saharan dust outbreaks. As shown in Eq. (2), an increase in C value would lead to a decrease in MeBC values and thus a decrease in ratio from 6.7 to 2.3. Thus, a C readjustment taking into account the presence of dusts significantly improves the ratio. Nonetheless, a bias is still present even without the presence of dusts, suggesting an inappropriate MAC value regarding eBC measured at PDM.
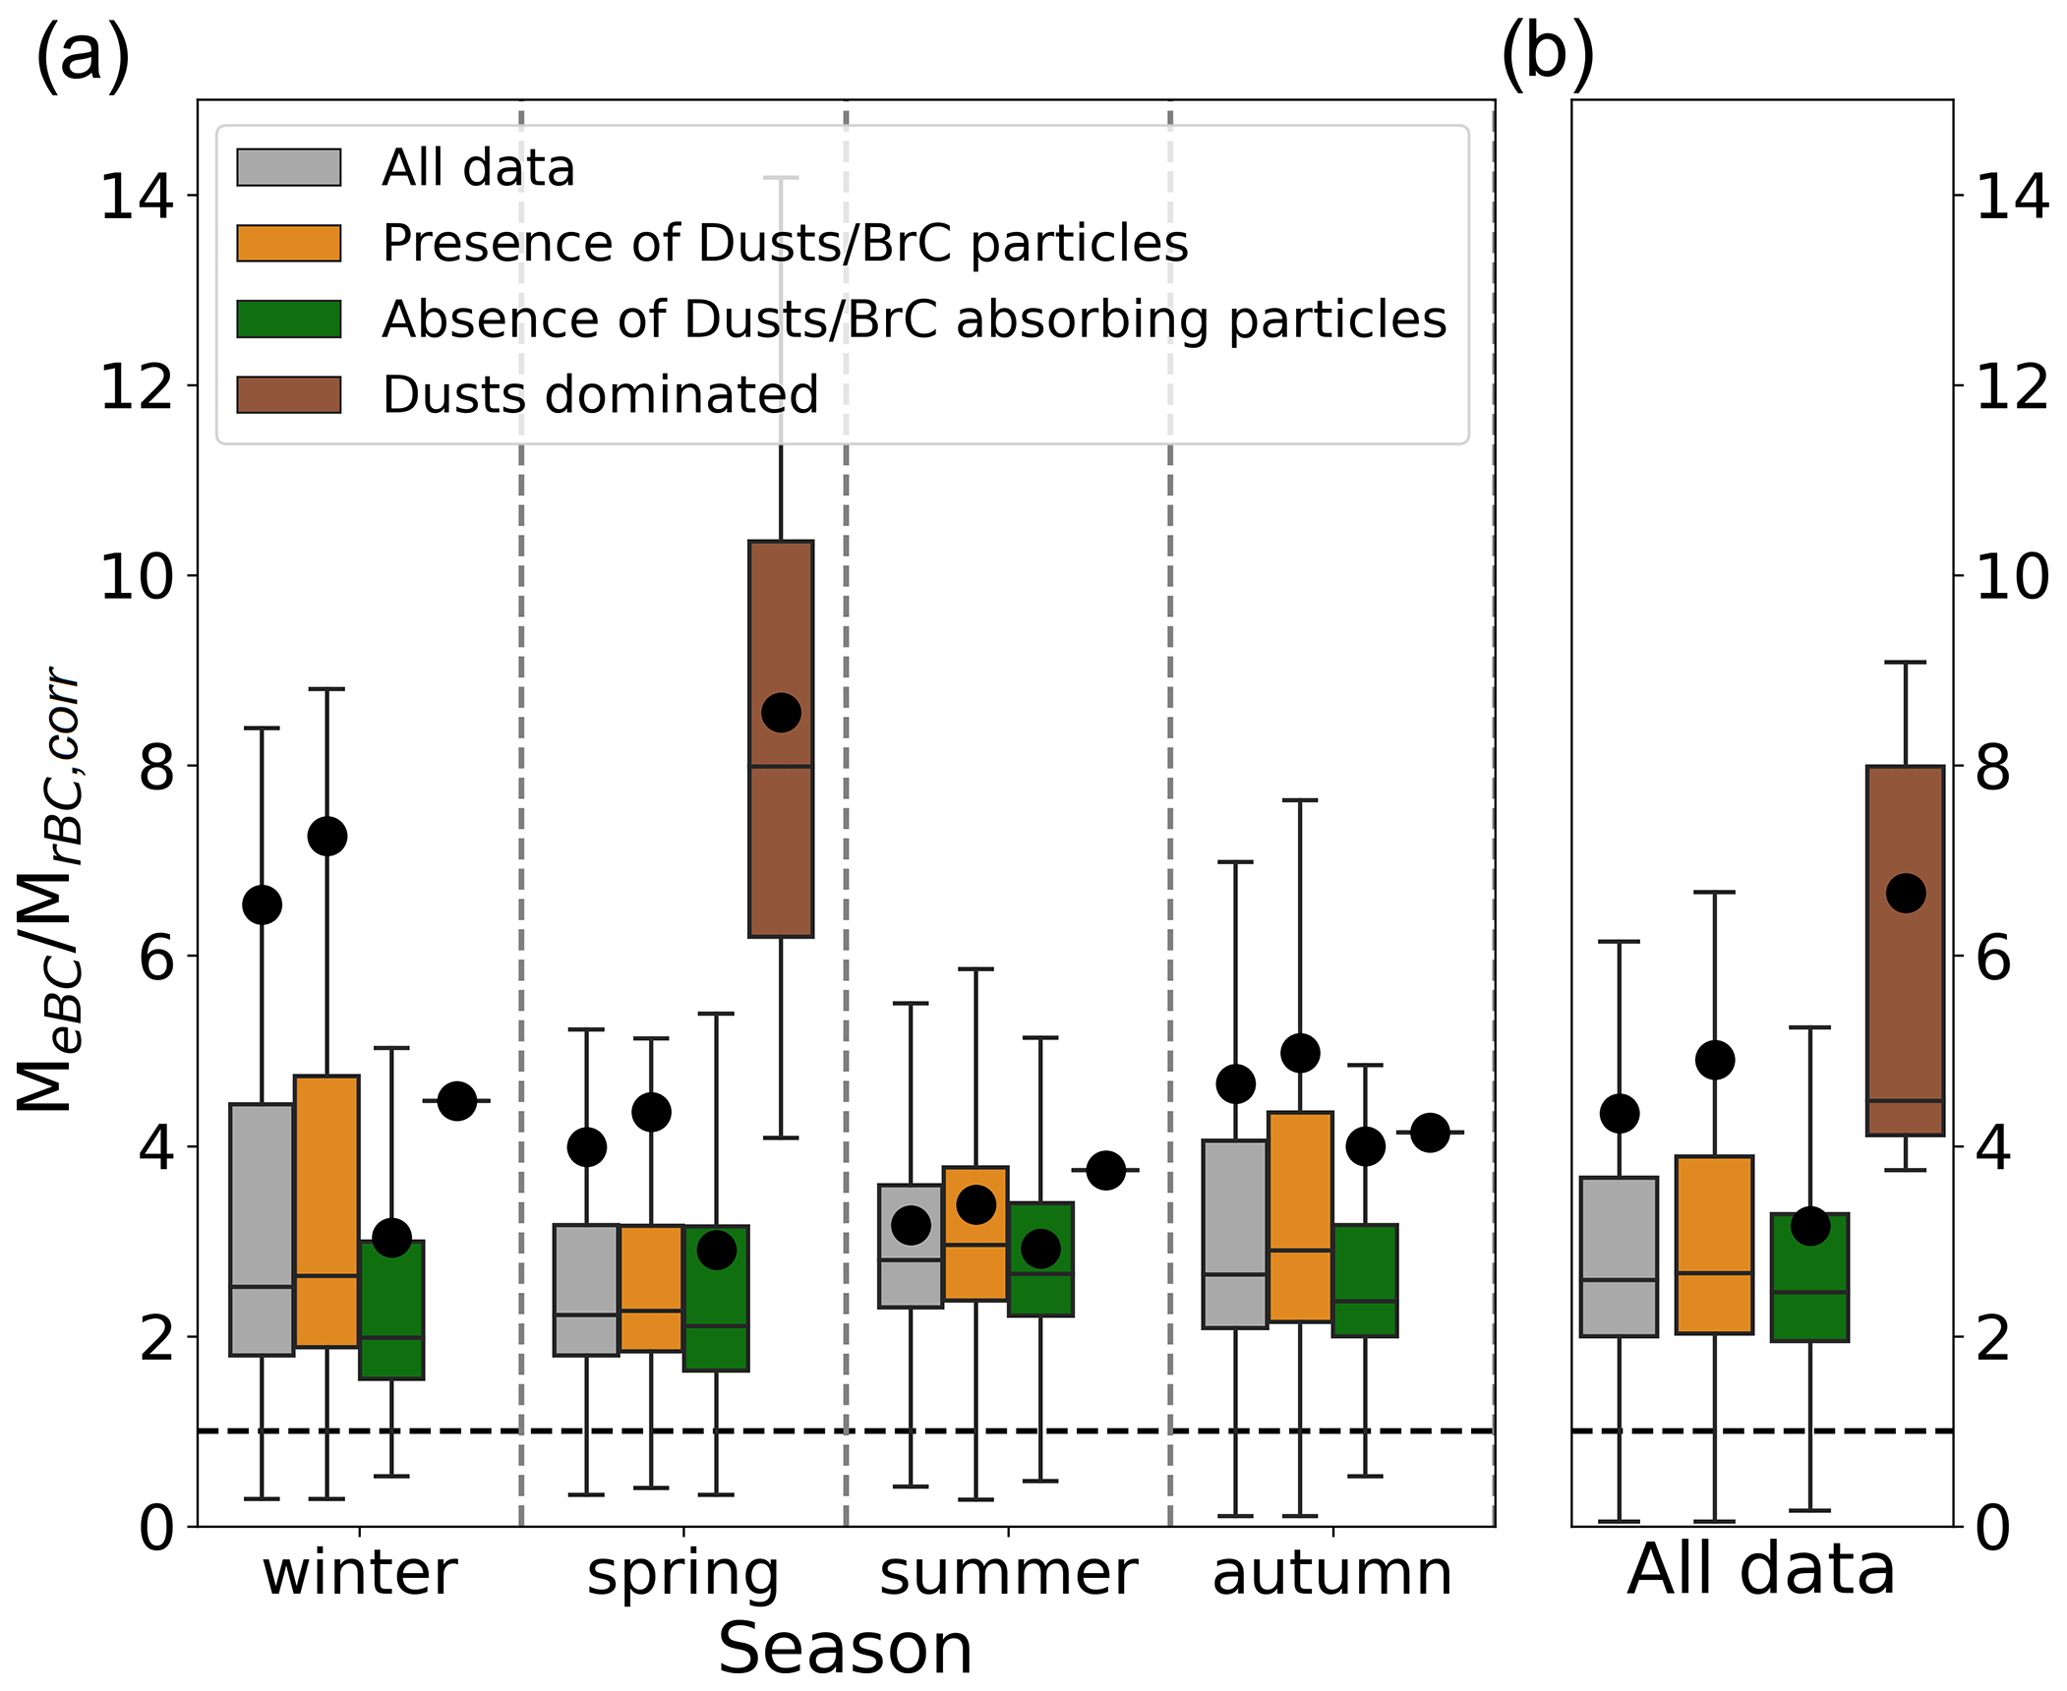
Figure 11 as a function of the dominant aerosol type (a) as a function of the season and (b) over the 2-year measurement campaign. Boxes, lines, black dots and whiskers indicate 25th percentile, 75th percentile, median, mean, 10th percentile and 90th percentile, respectively.
Three of the most widely used instruments to measure BC mass concentration have been compared during a 2-year measurement campaign at the high-altitude site Pic du Midi in the French Pyrenees. The agreement between an SP2, an AE33 and a Sunset measuring refractive BC (rBC), equivalent BC (eBC) and elemental carbon (EC) has been studied and the causes of variability have been investigated.
All techniques responded to seasonal variations in the atmospheric changes in BC levels and exhibited good correlations during the whole study period. This indicates that the different instruments quantified the same particle type despite the fact that they are based on different physical principle. However the slopes varied between instrument pairs. The largest biases were observed for the AE33 MeBC values that were larger by a factor of around 2 than SP2 MrBC,corr and Sunset MEC values. The SP2 and Sunset measurements appear to have the best agreement with an average bias by around 17 % between MEC and MrBC,corr.
However a large overestimation of MEC compared to MrBC,corr and MeBC is observed when MTC was lower than 25 µg C cm−2 of TC surface loading on the filter. Our analyses indicate a possible underestimation of MPyrC for some of these samples that could partly explain the positive bias in Sunset measurements. This threshold TC value is higher than the value of 10 µg C cm−2 obtained during the multiple-Sunset intercomparison study performed at a PBL background site in Italy (EMEP/CCC–Report 1/2018). We can notice that the aerosol types measured in this last intercomparison study may be very different to those studied here, and therefore this result could indicate a dependence of the lower quantification limit of Sunset on the thermal properties of the sampled carbonaceous particles. This threshold is a real issue for remote sites where low aerosol concentrations prevail, and it raises the need for alternative measurement techniques at low TC loading.
The main source of bias in MrBC quantification is found to be the limited size detection range of the SP2, which does not allow the detection of all rBC particles. Sensitivity tests based on different fitting approaches varying in terms of time resolution and number of lognormal modes have been carried out. While most studies use a fit with a single mode and averaged over the entire campaign, this approach does not adequately reproduce the rBC size distribution observed at PDM. Our results indicate that a consideration of the daily variation and multimodal shape of rBC size distribution is required in the fitting procedure for accurately calculating MrBC,corr at PDM.
The systematic positive bias in AE33 compared to SP2 and Sunset was attributed to the C × MAC values applied for the MeBC retrievals. The best agreement between MeBC and both MrBC,corr and MEC was obtained when C × MAC values were around 1.9 to 2.3 times higher than those recommended by the manufacturer. C × MAC values were found to be seasonally dependent and strongly linked to the source of rBC (determined using CO tracer). Another cause of bias in AE33 measurements was found to be the sampling of dust particles that causes a large overestimation of MeBC by up to a factor of 8. The incorrect C value applied during dust events may be the main cause of such a discrepancy.
Based on the results and specific issues presented above, this study points out some recommendations for improving the assessment of MEC, MrBC and MeBC:
-
The low detection sensitivity in separating accurately OC and EC at low TC contents with the Sunset analyser makes the use of this instrument tricky at some remote and background measurement sites under low-pollution conditions.
-
Special attention should be paid to the rBC procedure used to estimate the missing mass fraction of rBC not covered by the SP2 detection size range. The temporal resolution and the number of modes required to fit the rBC size distribution can vary greatly from one region to another and from one season to another.
-
We recommend to remove periods under strong dust events from the AE33 dataset, which could lead to a large overestimation MeBC.
-
If possible, the systematic deployment of an additional online instrument to measure absorption coefficient unaffected by filter artefacts would be very useful to constrain the correction factor C applied in AE33 retrievals.
The rBC, EC and eBC data are available upon request to the authors.
The supplement related to this article is available online at: https://doi.org/10.5194/amt-17-3897-2024-supplement.
ST and CD developed the analysis protocols, conducted the data analysis and wrote the initial manuscript. PN and MA contributed to the overall data analysis. TB, VP, MDA, EG, ST, VP and CD contributed to the measurement campaign. MDA and EG were involved in the offline sample analysis with Sunset. CD coordinated the h-BC project. All authors reviewed the final manuscript.
The contact author has declared that none of the authors has any competing interests.
Publisher's note: Copernicus Publications remains neutral with regard to jurisdictional claims made in the text, published maps, institutional affiliations, or any other geographical representation in this paper. While Copernicus Publications makes every effort to include appropriate place names, the final responsibility lies with the authors.
Observation data were collected at the Pyrenean Platform for Observation of the Atmosphere P2OA (https://p2oa.aeris-data.fr/, last access: 28 June 2024) in the frame of the SNO-CLAP (Service National d’Observation CLimate relevant Aerosol Properties from near surface observations). P2OA facilities and staff are funded and supported by the University Paul Sabatier Toulouse 3, France, and CNRS (Centre National de la Recherche Scientifique). We especially thank the staff of the Pic du Midi platform (Observatoire Midi-Pyrénées) for their technical assistance. We acknowledge SNO ICOS-France and ACTRIS-France for supporting aerosol observations at PDM and data collection, processing and dissemination. Finally, we thank the reviewers and the editor for their help to improve the paper.
This research has been supported by the French national programme LEFE/INSU and Météo-France.
This paper was edited by Charles Brock and reviewed by two anonymous referees.
Ammerlaan, B. A. J., Jedynska, A. D., Henzing, J. S., and Holzinger, R.: On a possible bias in elemental carbon measurements with the Sunset thermal/optical carbon analyser caused by unstable laser signal, Atmos. Environ., 122, 571–576, https://doi.org/10.1016/j.atmosenv.2015.09.076, 2015. a
Arnott, W. P., Hamasha, K., Moosmüller, H., Sheridan, P. J., and Ogren, J. A.: Towards Aerosol Light-Absorption Measurements with a 7-Wavelength Aethalometer: Evaluation with a Photoacoustic Instrument and 3-Wavelength Nephelometer, Aerosol Sci. Tech., 39, 17–29, https://doi.org/10.1080/027868290901972, 2005. a
Arnott, W. P., Walker, J. W., Moosmüller, H., Elleman, R. A., Jonsson, H. H., Buzorius, G., Conant, W. C., Flagan, R. C., and Seinfeld, J. H.: Photoacoustic insight for aerosol light absorption aloft from meteorological aircraft and comparison with particle soot absorption photometer measurements: DOE Southern Great Plains climate research facility and the coastal stratocumulus imposed perturbation experiments, J. Geophys. Res.-Atmos., 111, D05S02, https://doi.org/10.1029/2005JD005964, 2006. a
Bauer, J. J., Yu, X.-Y., Cary, R., Laulainen, N., and Berkowitz, C.: Characterization of the Sunset Semi-Continuous Carbon Aerosol Analyzer, J. Air Waste Manage., 59, 826–833, https://doi.org/10.3155/1047-3289.59.7.826, 2009. a, b, c
Baumgardner, D., Raga, G., Peralta, O., Rosas, I., Castro, T., Kuhlbusch, T., John, A., and Petzold, A.: Diagnosing black carbon trends in large urban areas using carbon monoxide measurements, J. Geophys. Res.-Atmos., 107, ICC 4-1–ICC 4-9, https://doi.org/10.1029/2001JD000626, 2002. a
Baumgardner, D., Popovicheva, O., Allan, J., Bernardoni, V., Cao, J., Cavalli, F., Cozic, J., Diapouli, E., Eleftheriadis, K., Genberg, P. J., Gonzalez, C., Gysel, M., John, A., Kirchstetter, T. W., Kuhlbusch, T. A. J., Laborde, M., Lack, D., Müller, T., Niessner, R., Petzold, A., Piazzalunga, A., Putaud, J. P., Schwarz, J., Sheridan, P., Subramanian, R., Swietlicki, E., Valli, G., Vecchi, R., and Viana, M.: Soot reference materials for instrument calibration and intercomparisons: a workshop summary with recommendations, Atmos. Meas. Tech., 5, 1869–1887, https://doi.org/10.5194/amt-5-1869-2012, 2012. a
Bond, T. C. and Bergstrom, R. W.: Light Absorption by Carbonaceous Particles: An Investigative Review, Aerosol Sci. Tech., 40, 27–67, https://doi.org/10.1080/02786820500421521, 2006. a
Bond, T. C., Anderson, T. L., and Campbell, D.: Calibration and Intercomparison of Filter-Based Measurements of Visible Light Absorption by Aerosols, Aerosol Sci. Tech., 30, 582–600, https://doi.org/10.1080/027868299304435, 1999. a, b
Bond, T. C., Doherty, S. J., Fahey, D. W., Forster, P. M., Berntsen, T., DeAngelo, B. J., Flanner, M. G., Ghan, S., Kärcher, B., Koch, D., Kinne, S., Kondo, Y., Quinn, P. K., Sarofim, M. C., Schultz, M. G., Schulz, M., Venkataraman, C., Zhang, H., Zhang, S., Bellouin, N., Guttikunda, S. K., Hopke, P. K., Jacobson, M. Z., Kaiser, J. W., Klimont, Z., Lohmann, U., Schwarz, J. P., Shindell, D., Storelvmo, T., Warren, S. G., and Zender, C. S.: Bounding the role of black carbon in the climate system: A scientific assessment, J. Geophys. Res.-Atmos., 118, 5380–5552, https://doi.org/10.1002/jgrd.50171, 2013. a, b, c
Brown, S., Minor, H., O'Brien, T., Hameed, Y., Feenstra, B., Kuebler, D., Wetherell, W., Day, R., Tun, R., Landis, E., and Rice, J.: Review of Sunset OC/EC Instrument Measurements During the EPA's Sunset Carbon Evaluation Project, Atmosphere, 10, 287, https://doi.org/10.3390/atmos10050287, 2019. a
Bukowiecki, N., Brem, B. T., Wehrle, G., Močnik, G., Affolter, S., Leuenberger, M., Coen, M. C., Hervo, M., Baltensperger, U., and Gysel-Beer, M.: Elucidating local pollution and site representativeness at the Jungfraujoch, Switzerland through parallel aerosol measurements at an adjacent mountain ridge, Environmental Research Communications, 3, 021001, https://doi.org/10.1088/2515-7620/abe987, 2021. a
Burtscher, H.: Physical characterization of particulate emissions from diesel engines: a review, J. Aerosol Sci., 36, 896–932, https://doi.org/10.1016/j.jaerosci.2004.12.001, 2005. a
Cappa, C. D., Zhang, X., Russell, L. M., Collier, S., Lee, A. K. Y., Chen, C.-L., Betha, R., Chen, S., Liu, J., Price, D. J., Sanchez, K. J., McMeeking, G. R., Williams, L. R., Onasch, T. B., Worsnop, D. R., Abbatt, J., and Zhang, Q.: Light Absorption by Ambient Black and Brown Carbon and its Dependence on Black Carbon Coating State for Two California, USA, Cities in Winter and Summer, J. Geophys. Res.-Atmos., 124, 1550–1577, https://doi.org/10.1029/2018JD029501, 2019. a, b
Cavalli, F., Viana, M., Yttri, K. E., Genberg, J., and Putaud, J.-P.: Toward a standardised thermal-optical protocol for measuring atmospheric organic and elemental carbon: the EUSAAR protocol, Atmos. Meas. Tech., 3, 79–89, https://doi.org/10.5194/amt-3-79-2010, 2010. a
Chirico, R., DeCarlo, P. F., Heringa, M. F., Tritscher, T., Richter, R., Prévôt, A. S. H., Dommen, J., Weingartner, E., Wehrle, G., Gysel, M., Laborde, M., and Baltensperger, U.: Impact of aftertreatment devices on primary emissions and secondary organic aerosol formation potential from in-use diesel vehicles: results from smog chamber experiments, Atmos. Chem. Phys., 10, 11545–11563, https://doi.org/10.5194/acp-10-11545-2010, 2010. a
Chow, J. C., Watson, J. G., Doraiswamy, P., Chen, L.-W. A., Sodeman, D. A., Lowenthal, D. H., Park, K., Arnott, W. P., and Motallebi, N.: Aerosol light absorption, black carbon, and elemental carbon at the Fresno Supersite, California, Atmos. Res., 93, 874–887, https://doi.org/10.1016/j.atmosres.2009.04.010, 2009. a
Collaud Coen, M., Weingartner, E., Apituley, A., Ceburnis, D., Fierz-Schmidhauser, R., Flentje, H., Henzing, J. S., Jennings, S. G., Moerman, M., Petzold, A., Schmid, O., and Baltensperger, U.: Minimizing light absorption measurement artifacts of the Aethalometer: evaluation of five correction algorithms, Atmos. Meas. Tech., 3, 457–474, https://doi.org/10.5194/amt-3-457-2010, 2010. a, b
Collaud Coen, M., Andrews, E., Aliaga, D., Andrade, M., Angelov, H., Bukowiecki, N., Ealo, M., Fialho, P., Flentje, H., Hallar, A. G., Hooda, R., Kalapov, I., Krejci, R., Lin, N.-H., Marinoni, A., Ming, J., Nguyen, N. A., Pandolfi, M., Pont, V., Ries, L., Rodríguez, S., Schauer, G., Sellegri, K., Sharma, S., Sun, J., Tunved, P., Velasquez, P., and Ruffieux, D.: Identification of topographic features influencing aerosol observations at high altitude stations, Atmos. Chem. Phys., 18, 12289–12313, https://doi.org/10.5194/acp-18-12289-2018, 2018. a
Corbin, J. C. and Gysel-Beer, M.: Detection of tar brown carbon with a single particle soot photometer (SP2), Atmos. Chem. Phys., 19, 15673–15690, https://doi.org/10.5194/acp-19-15673-2019, 2019. a
Cuesta-Mosquera, A., Močnik, G., Drinovec, L., Müller, T., Pfeifer, S., Minguillón, M. C., Briel, B., Buckley, P., Dudoitis, V., Fernández-García, J., Fernández-Amado, M., Ferreira De Brito, J., Riffault, V., Flentje, H., Heffernan, E., Kalivitis, N., Kalogridis, A.-C., Keernik, H., Marmureanu, L., Luoma, K., Marinoni, A., Pikridas, M., Schauer, G., Serfozo, N., Servomaa, H., Titos, G., Yus-Díez, J., Zioła, N., and Wiedensohler, A.: Intercomparison and characterization of 23 Aethalometers under laboratory and ambient air conditions: procedures and unit-to-unit variabilities, Atmos. Meas. Tech., 14, 3195–3216, https://doi.org/10.5194/amt-14-3195-2021, 2021. a
Davies, N. W., Cotterell, M. I., Fox, C., Szpek, K., Haywood, J. M., and Langridge, J. M.: On the accuracy of aerosol photoacoustic spectrometer calibrations using absorption by ozone, Atmos. Meas. Tech., 11, 2313–2324, https://doi.org/10.5194/amt-11-2313-2018, 2018. a
Denjean, C., Brito, J., Libois, Q., Mallet, M., Bourrianne, T., Burnet, F., Dupuy, R., Flamant, C., and Knippertz, P.: Unexpected Biomass Burning Aerosol Absorption Enhancement Explained by Black Carbon Mixing State, Geophys. Res. Lett., 47, e2020GL089055, https://doi.org/10.1029/2020GL089055, 2020. a
Di Biagio, C., Formenti, P., Cazaunau, M., Pangui, E., Marchand, N., and Doussin, J.-F.: Aethalometer multiple scattering correction Cref for mineral dust aerosols, Atmos. Meas. Tech., 10, 2923–2939, https://doi.org/10.5194/amt-10-2923-2017, 2017. a
Drinovec, L., Močnik, G., Zotter, P., Prévôt, A. S. H., Ruckstuhl, C., Coz, E., Rupakheti, M., Sciare, J., Müller, T., Wiedensohler, A., and Hansen, A. D. A.: The “dual-spot” Aethalometer: an improved measurement of aerosol black carbon with real-time loading compensation, Atmos. Meas. Tech., 8, 1965–1979, https://doi.org/10.5194/amt-8-1965-2015, 2015. a, b
Durdina, L., Brem, B. T., Setyan, A., Siegerist, F., Rindlisbacher, T., and Wang, J.: Assessment of Particle Pollution from Jetliners: from Smoke Visibility to Nanoparticle Counting, Environ. Sci Technol., 51, 3534–3541, https://doi.org/10.1021/acs.est.6b05801, 2017. a
Durdina, L., Brem, B. T., Schónenberger, D., Siegerist, F., Anet, J. G., and Rindlisbacher, T.: Nonvolatile Particulate Matter Emissions of a Business Jet Measured at Ground Level and Estimated for Cruising Altitudes, Environ. Sci Technol., 53, 12865–12872, https://doi.org/10.1021/acs.est.9b02513, 2019. a
European Committee for Standardization: Ambient air – Measurement of elemental carbon (EC) and organic carbon (OC) collected on filters: EN 16909:2017, European Committee for Standardization, https://standards.cen.eu/dyn/www/f?p=204:110:0::::FSP_PROJECT,FSP_ORG_ID:39908,6245&cs=10D493A2AD690A6AB4340BE3D316277CA (last access: 28 June 2024), 2017. a
Forrister, H., Liu, J., Scheuer, E., Dibb, J., Ziemba, L., Thornhill, K. L., Anderson, B., Diskin, G., Perring, A. E., Schwarz, J. P., Campuzano-Jost, P., Day, D. A., Palm, B. B., Jimenez, J. L., Nenes, A., and Weber, R. J.: Evolution of brown carbon in wildfire plumes, Geophys. Res. Lett., 42, 4623–4630, https://doi.org/10.1002/2015GL063897, 2015. a
Gheusi, F., Durand, P., Verdier, N., Dulac, F., Attié, J.-L., Commun, P., Barret, B., Basdevant, C., Clenet, A., Derrien, S., Doerenbecher, A., El Amraoui, L., Fontaine, A., Hache, E., Jambert, C., Jaumouillé, E., Meyerfeld, Y., Roblou, L., and Tocquer, F.: Adapted ECC ozonesonde for long-duration flights aboard boundary-layer pressurised balloons, Atmos. Meas. Tech., 9, 5811–5832, https://doi.org/10.5194/amt-9-5811-2016, 2016. a
Healy, R. M., Wang, J. M., Jeong, C.-H., Lee, A. K. Y., Willis, M. D., Jaroudi, E., Zimmerman, N., Hilker, N., Murphy, M., Eckhardt, S., Stohl, A., Abbatt, J. P. D., Wenger, J. C., and Evans, G. J.: Light-absorbing properties of ambient black carbon and brown carbon from fossil fuel and biomass burning sources, J. Geophys. Res.-Atmos., 120, 6619–6633, https://doi.org/10.1002/2015JD023382, 2015. a
Healy, R. M., Sofowote, U., Su, Y., Debosz, J., Noble, M., Jeong, C. H., Wang, J. M., Hilker, N., Evans, G. J., Doerksen, G., Jones, K., and Munoz, A.: Ambient measurements and source apportionment of fossil fuel and biomass burning black carbon in Ontario, Atmos. Environ., 161, 34–47, https://doi.org/10.1016/j.atmosenv.2017.04.034, 2017. a
Jacobi, H.-W., Lim, S., Ménégoz, M., Ginot, P., Laj, P., Bonasoni, P., Stocchi, P., Marinoni, A., and Arnaud, Y.: Black carbon in snow in the upper Himalayan Khumbu Valley, Nepal: observations and modeling of the impact on snow albedo, melting, and radiative forcing, The Cryosphere, 9, 1685–1699, https://doi.org/10.5194/tc-9-1685-2015, 2015. a
Jaffrezo, J.-L., Aymoz, G., Delaval, C., and Cozic, J.: Seasonal variations of the water soluble organic carbon mass fraction of aerosol in two valleys of the French Alps, Atmos. Chem. Phys., 5, 2809–2821, https://doi.org/10.5194/acp-5-2809-2005, 2005. a
Janssen, N. A., Gerlofs-Nijland, M. E., Lanki, T., Salonen, R. O., Cassee, F., Hoek, G., Fischer, P., Brunekreef, B., and Krzyzanowski, M.: Health effects of black carbon, World Health Organization, Regional Office for Europe, https://apps.who.int/iris/handle/10665/352615 (last access: 28 June 2024), 2012. a
Karanasiou, A., Panteliadis, P., Perez, N., Minguillón, M. C., Pandolfi, M., Titos, G., Viana, M., Moreno, T., Querol, X., and Alastuey, A.: Evaluation of the Semi-Continuous OCEC analyzer performance with the EUSAAR2 protocol, Sci. Total Environ., 747, 141266, https://doi.org/10.1016/j.scitotenv.2020.141266, 2020. a, b
Kirchstetter, T. W., Novakov, T., and Hobbs, P. V.: Evidence that the spectral dependence of light absorption by aerosols is affected by organic carbon, J. Geophys. Res.-Atmos., 109, D21208, https://doi.org/10.1029/2004JD004999, 2004. a
Ko, J., Krasowsky, T., and Ban-Weiss, G.: Measurements to determine the mixing state of black carbon emitted from the 2017–2018 California wildfires and urban Los Angeles, Atmos. Chem. Phys., 20, 15635–15664, https://doi.org/10.5194/acp-20-15635-2020, 2020. a, b
Laborde, M., Mertes, P., Zieger, P., Dommen, J., Baltensperger, U., and Gysel, M.: Sensitivity of the Single Particle Soot Photometer to different black carbon types, Atmos. Meas. Tech., 5, 1031–1043, https://doi.org/10.5194/amt-5-1031-2012, 2012a. a, b
Laborde, M., Schnaiter, M., Linke, C., Saathoff, H., Naumann, K.-H., Möhler, O., Berlenz, S., Wagner, U., Taylor, J. W., Liu, D., Flynn, M., Allan, J. D., Coe, H., Heimerl, K., Dahlkötter, F., Weinzierl, B., Wollny, A. G., Zanatta, M., Cozic, J., Laj, P., Hitzenberger, R., Schwarz, J. P., and Gysel, M.: Single Particle Soot Photometer intercomparison at the AIDA chamber, Atmos. Meas. Tech., 5, 3077–3097, https://doi.org/10.5194/amt-5-3077-2012, 2012b. a
Lack, D. A. and Cappa, C. D.: Impact of brown and clear carbon on light absorption enhancement, single scatter albedo and absorption wavelength dependence of black carbon, Atmos. Chem. Phys., 10, 4207–4220, https://doi.org/10.5194/acp-10-4207-2010, 2010. a
Lack, D. A., Moosmüller, H., McMeeking, G. R., Chakrabarty, R. K., and Baumgardner, D.: Characterizing elemental, equivalent black, and refractory black carbon aerosol particles: a review of techniques, their limitations and uncertainties, Anal. Bioanal. Chem., 406, 99–122, https://doi.org/10.1007/s00216-013-7402-3, 2014. a
Laing, J. R., Jaffe, D. A., and Arthur J. Sedlacek, I. I. I.: Comparison of Filter-based Absorption Measurements of Biomass Burning Aerosol and Background Aerosol at the Mt. Bachelor Observatory, Aerosol Air Qual. Res., 20, 663–678, https://doi.org/10.4209/aaqr.2019.06.0298, 2020. a, b, c, d
Liousse, C., Cachier, H., and Jennings, S. G.: Optical and thermal measurements of black carbon aerosol content in different environments: Variation of the specific attenuation cross-section, sigma (σ), Atmos. Environ. A-Gen., 27, 1203–1211, https://doi.org/10.1016/0960-1686(93)90246-U, 1993. a
Liu, D., Flynn, M., Gysel, M., Targino, A., Crawford, I., Bower, K., Choularton, T., Jurányi, Z., Steinbacher, M., Hüglin, C., Curtius, J., Kampus, M., Petzold, A., Weingartner, E., Baltensperger, U., and Coe, H.: Single particle characterization of black carbon aerosols at a tropospheric alpine site in Switzerland, Atmos. Chem. Phys., 10, 7389–7407, https://doi.org/10.5194/acp-10-7389-2010, 2010. a
Liu, J., Bergin, M., Guo, H., King, L., Kotra, N., Edgerton, E., and Weber, R. J.: Size-resolved measurements of brown carbon in water and methanol extracts and estimates of their contribution to ambient fine-particle light absorption, Atmos. Chem. Phys., 13, 12389–12404, https://doi.org/10.5194/acp-13-12389-2013, 2013. a
Liu, X., Zheng, M., Liu, Y., Jin, Y., Liu, J., Zhang, B., Yang, X., Wu, Y., Zhang, T., Xiang, Y., Liu, B., and Yan, C.: Intercomparison of equivalent black carbon (eBC) and elemental carbon (EC) concentrations with three-year continuous measurement in Beijing, China, Environ. Res., 209, 112791, https://doi.org/10.1016/j.envres.2022.112791, 2022. a
Lobo, P., Durdina, L., Smallwood, G. J., Rindlisbacher, T., Siegerist, F., Black, E. A., Yu, Z., Mensah, A. A., Hagen, D. E., Miake-Lye, R. C., Thomson, K. A., Brem, B. T., Corbin, J. C., Abegglen, M., Sierau, B., Whitefield, P. D., and Wang, J.: Measurement of Aircraft Engine Non-Volatile PM Emissions: Results of the Aviation-Particle Regulatory Instrumentation Demonstration Experiment (A-PRIDE) 4 Campaign, Aerosol Sci. Tech., 49, 472–484, https://doi.org/10.1080/02786826.2015.1047012, 2015. a
Mason, B., Wagner, N. L., Adler, G., Andrews, E., Brock, C. A., Gordon, T. D., Lack, D. A., Perring, A. E., Richardson, M. S., Schwarz, J. P., Shook, M. A., Thornhill, K. L., Ziemba, L. D., and Murphy, D. M.: An intercomparison of aerosol absorption measurements conducted during the SEAC4RS campaign, Aerosol Sci. Tech., 52, 1012–1027, https://doi.org/10.1080/02786826.2018.1500012, 2018. a
Matsui, H., Hamilton, D. S., and Mahowald, N. M.: Black carbon radiative effects highly sensitive to emitted particle size when resolving mixing-state diversity, Nat. Commun., 9, 3446, https://doi.org/10.1038/s41467-018-05635-1, 2018. a
McMeeking, G. R., Kreidenweis, S. M., Baker, S., Carrico, C. M., Chow, J. C., Collett Jr., J. L., Hao, W. M., Holden, A. S., Kirchstetter, T. W., Malm, W. C., Moosmüller, H., Sullivan, A. P., and Wold, C. E.: Emissions of trace gases and aerosols during the open combustion of biomass in the laboratory, J. Geophys. Res.-Atmos., 114, D19210, https://doi.org/10.1029/2009JD011836, 2009. a
McMeeking, G. R., Fortner, E., Onasch, T. B., Taylor, J. W., Flynn, M., Coe, H., and Kreidenweis, S. M.: Impacts of nonrefractory material on light absorption by aerosols emitted from biomass burning, J. Geophys. Res.-Atmos., 119, 12272–12286, https://doi.org/10.1002/2014JD021750, 2014. a
Metcalf, A. R., Craven, J. S., Ensberg, J. J., Brioude, J., Angevine, W., Sorooshian, A., Duong, H. T., Jonsson, H. H., Flagan, R. C., and Seinfeld, J. H.: Black carbon aerosol over the Los Angeles Basin during CalNex, J. Geophys. Res.-Atmos., 117, D00V13,, https://doi.org/10.1029/2011JD017255, 2012. a
Miyakawa, T., Kanaya, Y., Komazaki, Y., Taketani, F., Pan, X., Irwin, M., and Symonds, J.: Intercomparison between a single particle soot photometer and evolved gas analysis in an industrial area in Japan: Implications for the consistency of soot aerosol mass concentration measurements, Atmos. Environ., 127, 14–21, https://doi.org/10.1016/j.atmosenv.2015.12.018, 2016. a
Momenimovahed, A. and Olfert, J. S.: Effective Density and Volatility of Particles Emitted from Gasoline Direct Injection Vehicles and Implications for Particle Mass Measurement, Aerosol Sci. Tech., 49, 1051–1062, https://doi.org/10.1080/02786826.2015.1094181, 2015. a
Moteki, N. and Kondo, Y.: Dependence of Laser-Induced Incandescence on Physical Properties of Black Carbon Aerosols: Measurements and Theoretical Interpretation, Aerosol Sci. Tech., 44, 663–675, https://doi.org/10.1080/02786826.2010.484450, 2010. a
Müller, T., Laborde, M., Kassell, G., and Wiedensohler, A.: Design and performance of a three-wavelength LED-based total scatter and backscatter integrating nephelometer, Atmos. Meas. Tech., 4, 1291–1303, https://doi.org/10.5194/amt-4-1291-2011, 2011. a
Nessler, R., Bukowiecki, N., Henning, S., Weingartner, E., Calpini, B., and Baltensperger, U.: Simultaneous dry and ambient measurements of aerosol size distributions at the Jungfraujoch, Tellus B, 55, 808–819, https://doi.org/10.1034/j.1600-0889.2003.00067.x, 2003. a
Pandolfi, M., Ripoll, A., Querol, X., and Alastuey, A.: Climatology of aerosol optical properties and black carbon mass absorption cross section at a remote high-altitude site in the western Mediterranean Basin, Atmos. Chem. Phys., 14, 6443–6460, https://doi.org/10.5194/acp-14-6443-2014, 2014. a
Peng, J., Hu, M., Guo, S., Du, Z., Zheng, J., Shang, D., Levy Zamora, M., Zeng, L., Shao, M., Wu, Y.-S., Zheng, J., Wang, Y., Glen, C. R., Collins, D. R., Molina, M. J., and Zhang, R.: Markedly enhanced absorption and direct radiative forcing of black carbon under polluted urban environments, P. Natl. Acad. Sci., 113, 4266–4271, https://doi.org/10.1073/pnas.1602310113, 2016. a
Petzold, A., Ogren, J. A., Fiebig, M., Laj, P., Li, S.-M., Baltensperger, U., Holzer-Popp, T., Kinne, S., Pappalardo, G., Sugimoto, N., Wehrli, C., Wiedensohler, A., and Zhang, X.-Y.: Recommendations for reporting “black carbon” measurements, Atmos. Chem. Phys., 13, 8365–8379, https://doi.org/10.5194/acp-13-8365-2013, 2013. a
Pileci, R. E., Modini, R. L., Bertò, M., Yuan, J., Corbin, J. C., Marinoni, A., Henzing, B., Moerman, M. M., Putaud, J. P., Spindler, G., Wehner, B., Müller, T., Tuch, T., Trentini, A., Zanatta, M., Baltensperger, U., and Gysel-Beer, M.: Comparison of co-located refractory black carbon (rBC) and elemental carbon (EC) mass concentration measurements during field campaigns at several European sites, Atmos. Meas. Tech., 14, 1379–1403, https://doi.org/10.5194/amt-14-1379-2021, 2021. a, b, c
Raatikainen, T., Brus, D., Hooda, R. K., Hyvärinen, A.-P., Asmi, E., Sharma, V. P., Arola, A., and Lihavainen, H.: Size-selected black carbon mass distributions and mixing state in polluted and clean environments of northern India, Atmos. Chem. Phys., 17, 371–383, https://doi.org/10.5194/acp-17-371-2017, 2017. a
Réveillet, M., Dumont, M., Gascoin, S., Lafaysse, M., Nabat, P., Ribes, A., Nheili, R., Tuzet, F., Ménégoz, M., Morin, S., Picard, G., and Ginoux, P.: Black carbon and dust alter the response of mountain snow cover under climate change, Nat. Commun., 13, 5279, https://doi.org/10.1038/s41467-022-32501-y, 2022. a
Samset, B. H., Stjern, C. W., Andrews, E., Kahn, R. A., Myhre, G., Schulz, M., and Schuster, G. L.: Aerosol Absorption: Progress Towards Global and Regional Constraints, Current Climate Change Reports, 4, 65–83, https://doi.org/10.1007/s40641-018-0091-4, 2018. a
Schmid, O., Artaxo, P., Arnott, W. P., Chand, D., Gatti, L. V., Frank, G. P., Hoffer, A., Schnaiter, M., and Andreae, M. O.: Spectral light absorption by ambient aerosols influenced by biomass burning in the Amazon Basin. I: Comparison and field calibration of absorption measurement techniques, Atmos. Chem. Phys., 6, 3443–3462, https://doi.org/10.5194/acp-6-3443-2006, 2006. a
Schwarz, J. P., Gao, R. S., Fahey, D. W., Thomson, D. S., Watts, L. A., Wilson, J. C., Reeves, J. M., Darbeheshti, M., Baumgardner, D. G., Kok, G. L., Chung, S. H., Schulz, M., Hendricks, J., Lauer, A., Kärcher, B., Slowik, J. G., Rosenlof, K. H., Thompson, T. L., Langford, A. O., Loewenstein, M., and Aikin, K. C.: Single-particle measurements of midlatitude black carbon and light-scattering aerosols from the boundary layer to the lower stratosphere, J. Geophys. Res.-Atmos., 111, https://doi.org/10.1029/2006JD007076, 2006. a, b, c, d
Schwarz, J. P., Spackman, J. R., Fahey, D. W., Gao, R. S., Lohmann, U., Stier, P., Watts, L. A., Thomson, D. S., Lack, D. A., Pfister, L., Mahoney, M. J., Baumgardner, D., Wilson, J. C., and Reeves, J. M.: Coatings and their enhancement of black carbon light absorption in the tropical atmosphere, J. Geophys. Res.-Atmos., 113, D03203, https://doi.org/10.1029/2007JD009042, 2008. a
Sciare, J., d'Argouges, O., Sarda-Estève, R., Gaimoz, C., Dolgorouky, C., Bonnaire, N., Favez, O., Bonsang, B., and Gros, V.: Large contribution of water-insoluble secondary organic aerosols in the region of Paris (France) during wintertime, J. Geophys. Res.-Atmos., 116, D22203, https://doi.org/10.1029/2011JD015756, 2011. a
Sedlacek, A. J. I., Lewis, E. R., Onasch, T. B., Zuidema, P., Redemann, J., Jaffe, D., and Kleinman, L. I.: Using the Black Carbon Particle Mixing State to Characterize the Lifecycle of Biomass Burning Aerosols, Environ. Sci Technol., 56, 14315–14325, https://doi.org/10.1021/acs.est.2c03851, 2022. a, b
Segura, S., Estellés, V., Titos, G., Lyamani, H., Utrillas, M. P., Zotter, P., Prévôt, A. S. H., Močnik, G., Alados-Arboledas, L., and Martínez-Lozano, J. A.: Determination and analysis of in situ spectral aerosol optical properties by a multi-instrumental approach, Atmos. Meas. Tech., 7, 2373–2387, https://doi.org/10.5194/amt-7-2373-2014, 2014. a
Sharma, S., Leaitch, W. R., Huang, L., Veber, D., Kolonjari, F., Zhang, W., Hanna, S. J., Bertram, A. K., and Ogren, J. A.: An evaluation of three methods for measuring black carbon in Alert, Canada, Atmos. Chem. Phys., 17, 15225–15243, https://doi.org/10.5194/acp-17-15225-2017, 2017. a, b
Slowik, J. G., Cross, E. S., Han, J.-H., Davidovits, P., Onasch, T. B., Jayne, J. T., Williams, L. R., Canagaratna, M. R., Worsnop, D. R., Chakrabarty, R. K., Moosmüller, H., Arnott, W. P., Schwarz, J. P., Gao, R.-S., Fahey, D. W., Kok, G. L., and Petzold, A.: An Inter-Comparison of Instruments Measuring Black Carbon Content of Soot Particles, Aerosol Sci. Tech., 41, 295–314, https://doi.org/10.1080/02786820701197078, 2007. a
Stein, A. F., Draxler, R. R., Rolph, G. D., Stunder, B. J. B., Cohen, M. D., and Ngan, F.: NOAA's HYSPLIT Atmospheric Transport and Dispersion Modeling System, B. Am. Meteorol. Soc., 96, 2059–2077, https://doi.org/10.1175/BAMS-D-14-00110.1, 2015. a
Subramanian, R., Roden, C. A., Boparai, P., and Bond, T. C.: Yellow Beads and Missing Particles: Trouble Ahead for Filter-Based Absorption Measurements, Aerosol Sci. Tech., 41, 630–637, https://doi.org/10.1080/02786820701344589, 2007. a
Sun, J., Hermann, M., Yuan, Y., Birmili, W., Collaud Coen, M., Weinhold, K., Madueño, L., Poulain, L., Tuch, T., Ries, L., Sohmer, R., Couret, C., Frank, G., Brem, B. T., Gysel-Beer, M., Ma, N., and Wiedensohler, A.: Long-term trends of black carbon and particle number concentration in the lower free troposphere in Central Europe, Environmental Sciences Europe, 33, 47, https://doi.org/10.1186/s12302-021-00488-w, 2021. a
Takahama, S., Russell, L. M., Shores, C. A., Marr, L. C., Zheng, J., Levy, M., Zhang, R., Castillo, E., Rodriguez-Ventura, J. G., Quintana, P. J. E., Subramanian, R., Zavala, M., and Molina, L. T.: Diesel vehicle and urban burning contributions to black carbon concentrations and size distributions in Tijuana, Mexico, during the Cal-Mex 2010 campaign, Atmos. Environ., 88, 341–352, https://doi.org/10.1016/j.atmosenv.2013.09.057, 2014. a
Tang, T., Shindell, D., Zhang, Y., Voulgarakis, A., Lamarque, J.-F., Myhre, G., Stjern, C. W., Faluvegi, G., and Samset, B. H.: Response of surface shortwave cloud radiative effect to greenhouse gases and aerosols and its impact on summer maximum temperature, Atmos. Chem. Phys., 20, 8251–8266, https://doi.org/10.5194/acp-20-8251-2020, 2020. a
Taylor, J. W., Allan, J. D., Allen, G., Coe, H., Williams, P. I., Flynn, M. J., Le Breton, M., Muller, J. B. A., Percival, C. J., Oram, D., Forster, G., Lee, J. D., Rickard, A. R., Parrington, M., and Palmer, P. I.: Size-dependent wet removal of black carbon in Canadian biomass burning plumes, Atmos. Chem. Phys., 14, 13755–13771, https://doi.org/10.5194/acp-14-13755-2014, 2014. a
Tinorua, S., Denjean, C., Nabat, P., Bourrianne, T., Pont, V., Gheusi, F., and Leclerc, E.: Higher absorption enhancement of black carbon in summer shown by 2-year measurements at the high-altitude mountain site of Pic du Midi Observatory in the French Pyrenees, Atmos. Chem. Phys., 24, 1801–1824, https://doi.org/10.5194/acp-24-1801-2024, 2024. a, b, c, d, e, f, g, h, i, j
Wang, R., Balkanski, Y., Boucher, O., Ciais, P., Schuster, G. L., Chevallier, F., Samset, B. H., Liu, J., Piao, S., Valari, M., and Tao, S.: Estimation of global black carbon direct radiative forcing and its uncertainty constrained by observations, J. Geophys. Res.-Atmos., 121, 5948–5971, https://doi.org/10.1002/2015JD024326, 2016. a
Wei, X., Zhu, Y., Hu, J., Liu, C., Ge, X., Guo, S., Liu, D., Liao, H., and Wang, H.: Recent Progress in Impacts of Mixing State on Optical Properties of Black Carbon Aerosol, Current Pollution Reports, 6, 380–398, https://doi.org/10.1007/s40726-020-00158-0, 2020. a, b
Weingartner, E., Saathoff, H., Schnaiter, M., Streit, N., Bitnar, B., and Baltensperger, U.: Absorption of light by soot particles: determination of the absorption coefficient by means of aethalometers, J. Aerosol Sci., 34, 1445–1463, https://doi.org/10.1016/S0021-8502(03)00359-8, 2003. a, b, c
Wong, J. P. S., Tsagkaraki, M., Tsiodra, I., Mihalopoulos, N., Violaki, K., Kanakidou, M., Sciare, J., Nenes, A., and Weber, R. J.: Atmospheric evolution of molecular-weight-separated brown carbon from biomass burning, Atmos. Chem. Phys., 19, 7319–7334, https://doi.org/10.5194/acp-19-7319-2019, 2019. a
Wu, Y., Yan, P., Tian, P., Tao, J., Li, L., Chen, J., Zhang, Y., Cao, N., Chen, C., and Zhang, R.: Spectral Light Absorption of Ambient Aerosols in Urban Beijing during Summer: An Intercomparison of Measurements from a Range of Instruments, Aerosol Air Qual. Res., 15, 1178–1187, https://doi.org/10.4209/aaqr.2014.09.0224, 2015. a
Yang, H. and Yu, J. Z.: Uncertainties in Charring Correction in the Analysis of Elemental and Organic Carbon in Atmospheric Particles by Thermal/Optical Methods, Environ. Sci Technol., 36, 5199–5204, https://doi.org/10.1021/es025672z, 2002. a
Yu, J. Z., Xu, J., and Yang, H.: Charring Characteristics of Atmospheric Organic Particulate Matter in Thermal Analysis, Environ. Sci Technol., 36, 754–761, https://doi.org/10.1021/es015540q, 2002. a
Yus-Díez, J., Bernardoni, V., Močnik, G., Alastuey, A., Ciniglia, D., Ivančič, M., Querol, X., Perez, N., Reche, C., Rigler, M., Vecchi, R., Valentini, S., and Pandolfi, M.: Determination of the multiple-scattering correction factor and its cross-sensitivity to scattering and wavelength dependence for different AE33 Aethalometer filter tapes: a multi-instrumental approach, Atmos. Meas. Tech., 14, 6335–6355, https://doi.org/10.5194/amt-14-6335-2021, 2021. a, b, c
Zanatta, M., Gysel, M., Bukowiecki, N., Müller, T., Weingartner, E., Areskoug, H., Fiebig, M., Yttri, K., Mihalopoulos, N., Kouvarakis, G., Beddows, D., Harrison, R., Cavalli, F., Putaud, J., Spindler, G., Wiedensohler, A., Alastuey, A., Pandolfi, M., Sellegri, K., Swietlicki, E., Jaffrezo, J., Baltensperger, U., and Laj, P.: A European aerosol phenomenology-5: Climatology of black carbon optical properties at 9 regional background sites across Europe, Atmos. Environ., 145, 346–364, https://doi.org/10.1016/j.atmosenv.2016.09.035, 2016. a, b
Zanatta, M., Laj, P., Gysel, M., Baltensperger, U., Vratolis, S., Eleftheriadis, K., Kondo, Y., Dubuisson, P., Winiarek, V., Kazadzis, S., Tunved, P., and Jacobi, H.-W.: Effects of mixing state on optical and radiative properties of black carbon in the European Arctic, Atmos. Chem. Phys., 18, 14037–14057, https://doi.org/10.5194/acp-18-14037-2018, 2018. a
Zhang, X., Kim, H., Parworth, C. L., Young, D. E., Zhang, Q., Metcalf, A. R., and Cappa, C. D.: Optical Properties of Wintertime Aerosols from Residential Wood Burning in Fresno, CA: Results from DISCOVER-AQ 2013, Environ. Sci Technol., 50, 1681–1690, https://doi.org/10.1021/acs.est.5b04134, 2016. a
Zhang, X., Chen, X., and Wang, J.: A number-based inventory of size-resolved black carbon particle emissions by global civil aviation, Nat. Commun., 10, 534, https://doi.org/10.1038/s41467-019-08491-9, 2019. a, b
Zhao, G., Tao, J., Kuang, Y., Shen, C., Yu, Y., and Zhao, C.: Role of black carbon mass size distribution in the direct aerosol radiative forcing, Atmos. Chem. Phys., 19, 13175–13188, https://doi.org/10.5194/acp-19-13175-2019, 2019. a
Zheng, G. J., Cheng, Y., He, K. B., Duan, F. K., and Ma, Y. L.: A newly identified calculation discrepancy of the Sunset semi-continuous carbon analyzer, Atmos. Meas. Tech., 7, 1969–1977, https://doi.org/10.5194/amt-7-1969-2014, 2014. a, b