the Creative Commons Attribution 4.0 License.
the Creative Commons Attribution 4.0 License.
 | 17 Jul 2024
An oxidation flow reactor for simulating and accelerating secondary aerosol formation in aerosol liquid water and cloud droplets
Ningjin Xu
Chen Le
David R. Cocker
Kunpeng Chen
Ying-Hsuan Lin
Liquid water in cloud droplets and aqueous aerosols serves as an important reaction medium for the formation of secondary aerosol through aqueous-phase reactions (aqSA). Large uncertainties remain in estimates of the production and chemical evolution of aqSA in the dilute solutions found in cloud droplets and the concentrated solutions found in aerosol liquid water, which is partly due to the lack of available measurement tools and techniques. A new oxidation flow reactor (OFR), the Accelerated Production and Processing of Aerosols (APPA) reactor, was developed to measure secondary aerosol formed through gas- and aqueous-phase reactions, both for laboratory gas mixtures containing one or more precursors and for ambient air. For simulating in-cloud processes, ∼ 3.3 µm diameter droplets formed on monodisperse seed particles are introduced into the top of the reactor, and the relative humidity (RH) inside it is controlled to 100 %. Similar measurements made with the RH in the reactor < 100 % provide contrasts for aerosol formation with no liquid water and with varying amounts of aerosol liquid water.
The reactor was characterized through a series of experiments and used to form secondary aerosol from known concentrations of an organic precursor and from ambient air. The residence time distributions of both gases and particles are narrow relative to other OFRs and lack the tails at long residence time expected with laminar flow. Initial cloud processing experiments focused on the well-studied oxidation of dissolved SO2 by O3, with the observed growth of seed particles resulting from the added sulfuric acid agreeing well with estimates based on the relevant set of aqueous-phase reactions. The OH exposure (OHexp) for low RH, high RH, and in-cloud conditions was determined experimentally from the loss of SO2 and benzene and simulated from the KinSim chemical kinetics solver with inputs of the measured 254 nm UV intensity profile through the reactor and loss of O3 due to photolysis. The aerosol yield for toluene at high OHexp ranged from 21.4 % at low RH with dry seed particles present in the reactor to 78.1 % with cloud droplets present. Measurement of the composition of the secondary aerosol formed from ambient air using an aerosol mass spectrometer showed that the oxygen-to-carbon ratio (O : C) of the organic component increased with increasing RH (and liquid water content).
- Article
(2836 KB) - Full-text XML
-
Supplement
(1813 KB) - BibTeX
- EndNote


Atmospheric aerosols have significant roles in air quality and climate (Akimoto, 2003; Seinfeld and Pandis, 2016; Shiraiwa et al., 2017). They consist of organic and inorganic compounds, with the organic component (organic aerosol; OA) being a substantial contributor to submicron aerosols, accounting for 20 %–90 % of aerosol mass loadings worldwide (Kanakidou et al., 2005; Jimenez et al., 2009; Knopf et al., 2018). Aerosol particles are both emitted directly into the atmosphere (primary aerosol) and produced in the atmosphere from reactions involving precursor gases (secondary aerosol) (Canagaratna et al., 2007; Andreae and Rosenfeld, 2008; Myhre et al., 2013). Secondary aerosol species include inorganic nitrate (NO), sulfate (SO), and ammonium (NH), as well as thousands of organic compounds (secondary organic aerosol; SOA) that, collectively, account for a significant fraction of OA mass (Salcedo et al., 2006; Docherty et al., 2008; Froyd et al., 2009; Hallquist et al., 2009; Ehn et al., 2014). Considerable progress has been made towards understanding the efficiency with which secondary aerosol forms from gas-phase oxidation of important anthropogenic and biogenic precursors (Shrivastava et al., 2017; Schroder et al., 2018; Bianchi et al., 2019). Much less is known about the production rate and properties of secondary aerosol formed through aqueous-phase reactions (aqSA) in atmospheric liquid water. Despite differences of orders of magnitude in liquid water content (LWC), both cloud droplets and aqueous aerosol particles serve as important reaction mediums for the formation and evolution of aqSA. Experimental and modeling efforts to determine the contribution of aqSA to the total secondary aerosol burden are complicated by the diversity of organic and inorganic precursor gases; the complexity of the chemical pathways and products formed in liquid water; and uncertainties in quantities such as the concentration, composition, and size distribution of droplets. Nevertheless, laboratory and modeling studies have revealed that the contribution of aqueous reactions of dissolved inorganics and organics to secondary aerosol formation is significant (Lim et al., 2005; Carlton et al., 2006, 2007; Volkamer et al., 2009; McNeill et al., 2012; Budisulistiorini et al., 2017; Ma et al., 2021; Wang et al., 2021).
Though sulfate formation from aqueous-phase oxidation of sulfur dioxide (SO2) has been recognized and studied for decades, recent efforts have explored new pathways as part of an effort to explain rapid formation during severe haze events such as those observed in Beijing. As just one example, Liu et al. (2020) measured sulfate formation in hygroscopic, pH-buffered aerosol particles and demonstrated that the oxidation of SO2 by hydrogen peroxide (H2O2) in aqueous aerosol particles can explain the missing sulfate source during severe haze pollution events. Ge et al. (2021) used the Community Earth System Model Version 2 (CESM2) to evaluate the effects of in-cloud aqueous-phase reaction mechanisms on SO2 oxidation and the importance for sulfate formation on hazy days.
Formation of SOA through aqueous-phase chemistry (aqSOA) was argued to potentially be significant by Blando and Turpin (2000) and has since been the subject of numerous laboratory, field, and modeling studies. Interest in aqSOA is partly due to its potential to help explain discrepancies between observed mass loadings and model estimates that include only gas-phase chemistry (Carlton et al., 2008; Ervens and Volkamer, 2010; Ervens et al., 2011; Guo et al., 2012; McNeill, 2015; Gilardoni et al., 2016). A large fraction of aqSOA is believed to form through photochemistry as water-soluble products of gas-phase chemistry enter cloud droplets or aerosol liquid water (ALW) and react in the aqueous phase with hydroxyl radical (OH) or other oxidants, with some of the reaction products then remaining in the particle phase after the evaporation of the water (Perri et al., 2009; Lim et al., 2010; Liu et al., 2012a; McNeill et al., 2012; Lin et al., 2014). Lamkaddam et al. (2021) found that 50 %–70 % of the products of gas-phase OH oxidation of isoprene partitioned into a liquid water film and subsequently reacted with dissolved OH, resulting in the production of more oxygenated and less volatile products that would remain in the aerosol phase. Aqueous SOA is also produced as aldehydes such as glyoxal and methylglyoxal partition into water droplets and undergo nonoxidative reactions that are not dependent on UV or visible light (De Haan et al., 2009; Galloway et al., 2014) by the aqueous oxidation of organic compounds by singlet molecular oxygen (1O) and by triplet excited states of organic compounds (3C∗) and hydroperoxyl radicals (HO2) (Smith et al., 2014, 2015; Kaur and Anastasio, 2018). Ye et al. (2020) used results from experiments focused on the aqueous-phase photochemistry of three phenolic compounds to demonstrate the importance of aqueous-phase oxidation of moderately soluble compounds to SOA formation. Tsui et al. (2017) used an updated version of the Gas–Aerosol Model for Mechanism Analysis (GAMMA) that includes uptake of isoprene epoxydiols (IEPOX) and subsequent formation of SOA to compare formation of IEPOX SOA in cloud water and aqueous aerosol for simulated laboratory and atmospheric conditions.
Unlike experimental studies of secondary aerosol formation through gas-phase reactions (gasSA), for which realistic atmospheric conditions can more easily be simulated, laboratory investigation of aqSA mechanisms, products, and yields is usually performed in bulk aqueous solutions with high oxidant and precursor concentrations (Liu et al., 2012b; Lim et al., 2013). The experimental concentrations and conditions often differ from those in the atmosphere, which can introduce uncertainty when results are implemented into multiphase models. Among the sources of constraints on experimental conditions is the lack of suitable and sensitive measurement and detection technology (Ervens et al., 2011; Spracklen et al., 2011). Some laboratory-based studies of aqueous-phase oxidation have been conducted using cloud chambers which can offer measurement over a range in temperature and pressure and with artificial solar illumination. Such chambers have been used to study multiphase atmospheric photochemistry with one or more cloud formation and evaporation cycles (Berndt et al., 2007; Wang et al., 2011; Hoyle et al., 2016). However, challenges of creating an environment in which there is both active photochemistry and a controlled population of cloud droplets has limited the number of such facilities.
Oxidation flow reactors (OFRs) are commonly used to study secondary aerosol formation and evolution, both in the laboratory and in the field (Kang et al., 2007; Lambe et al., 2011; Keller and Burtscher, 2012; Ortega et al., 2013; Simonen et al., 2017). Photolysis of injected or in-situ-formed ozone (O3) inside a typical OFR results in OH concentrations that are orders of magnitude higher than that found in the atmosphere. However, almost all OFRs are designed for studying gas-phase chemistry and are not generally suitable for studying aqSA formation because of issues such as temperature gradients caused by the UV lights, wall losses of gases at high relative humidity (RH), and settling losses of droplets (Li et al., 2015; Huang et al., 2017; Mitroo et al., 2018; Cao et al., 2020). To our knowledge, only one study has been conducted in which a flow-through reactor was used to simulate in-cloud aqSA formation from the oxidation of soluble gases produced from gas-phase photochemistry (Lamkaddam et al., 2021). Inside the wet-walled flow reactor used in that study, precursor gases react with OH over a timescale of minutes, as with a standard OFR, whereas the subsequent aqueous-phase oxidation occurs in a thin layer of water surrounding the flow cell over a timescale of several hours for each experiment.
In this work, we describe the Accelerated Production and Processing of Aerosols (APPA) reactor, which is an OFR that can be used to study gas- and aqueous-phase secondary aerosol formation from prescribed concentrations of precursors in the lab and from the complex mixture of gases present in ambient air. Reported here is the design and laboratory characterization of the reactor, including the examination of transmission efficiencies and residence time distributions for both particles and gases, size distributions of the droplets used in experiments simulating in-cloud chemistry, UV intensity and spatial variability, and the OH exposure (OHexp) estimation from measurement of the consumption of SO2 and benzene. The observed growth of seed particles on which droplets formed as sulfate was produced from the S(IV)–O3 reaction is compared with a prediction derived from the cloud model kinetic expression presented in Caffrey et al. (2001). We report the production of SOA from OH oxidation of toluene with minimal liquid water present (RH = 40 %), with ALW (RH = 85 %), and for simulated in-cloud conditions (RH = 100 %). Example results are also provided from measurements of the composition of secondary aerosol formed from ambient air processed under that same set of humidity and liquid water content conditions. Though not described here, the reactor can also be used to study the impact of cloud cycling on the composition and properties of ambient or generated particles.
2.1 Reactor design and operation overview
A cross-sectional view of the APPA reactor is shown in Fig. 1. The core of the reactor is a 148 cm L × 8.9 cm outer diameter (OD) × 7.8 cm ID PFA (perfluoroalkoxy) Teflon tube (Ametek FPP) with a total internal volume of 7.5 L, which is identical to that used in the Particle Formation Accelerator OFR described by Xu and Collins (2021). The perfluoroalkoxy (PFA) tube is surrounded by a 148 cm L × 11.5 cm OD × 11.0 cm ID cylindrical quartz tube (Technical Glass Products, Inc.) which is used to create a water jacket as described below. Machined PTFE end caps seal the PFA and quartz tubes at the top and bottom. When used as an OFR, the APPA reactor is operated with lamps producing only 254 nm UV (and not also 185 nm; often referred to as OFR254), with OH produced from photolysis of O3 that is produced externally by an O3 generator (Jelight Company, Inc., model 610) and introduced into the reactor. The reactor is oriented vertically with inlet flows introduced at the top and outlet flows extracted at the bottom. The nominal total flow rate of 3.0 L min−1 results in a mean gas residence time of 150 s. The bottom cap was adapted from the design used in the reactor described by Xu and Collins (2021). To minimize the influence of the reactor walls and to narrow the particle residence time distribution (RTD), the central 50 % (1.5 L min −1) of the total flow is subsampled through the conical sample extraction port and directed to the aerosol and/or droplet analyzers. The outer 50 % (also 1.5 L min−1) of the total flow is extracted through eight 0.15 cm holes at the base of the annulus between the reactor ID and the extraction port in the center of the tube and is directed to one or more gas analyzers. Those two outlet flows and their corresponding ports in the bottom PTFE cap are hereafter referred to as the outlet-center and outlet-annulus. The flow rates are actively controlled, with dilution or make-up flow used as needed, such that they are always 1.5/1.5 L min−1 and are unaffected by the flow rates of the sets of analyzers used for different experiments. The reactor system is fully controlled using National Instruments LabVIEW software and is capable of unattended operation for multiple days.
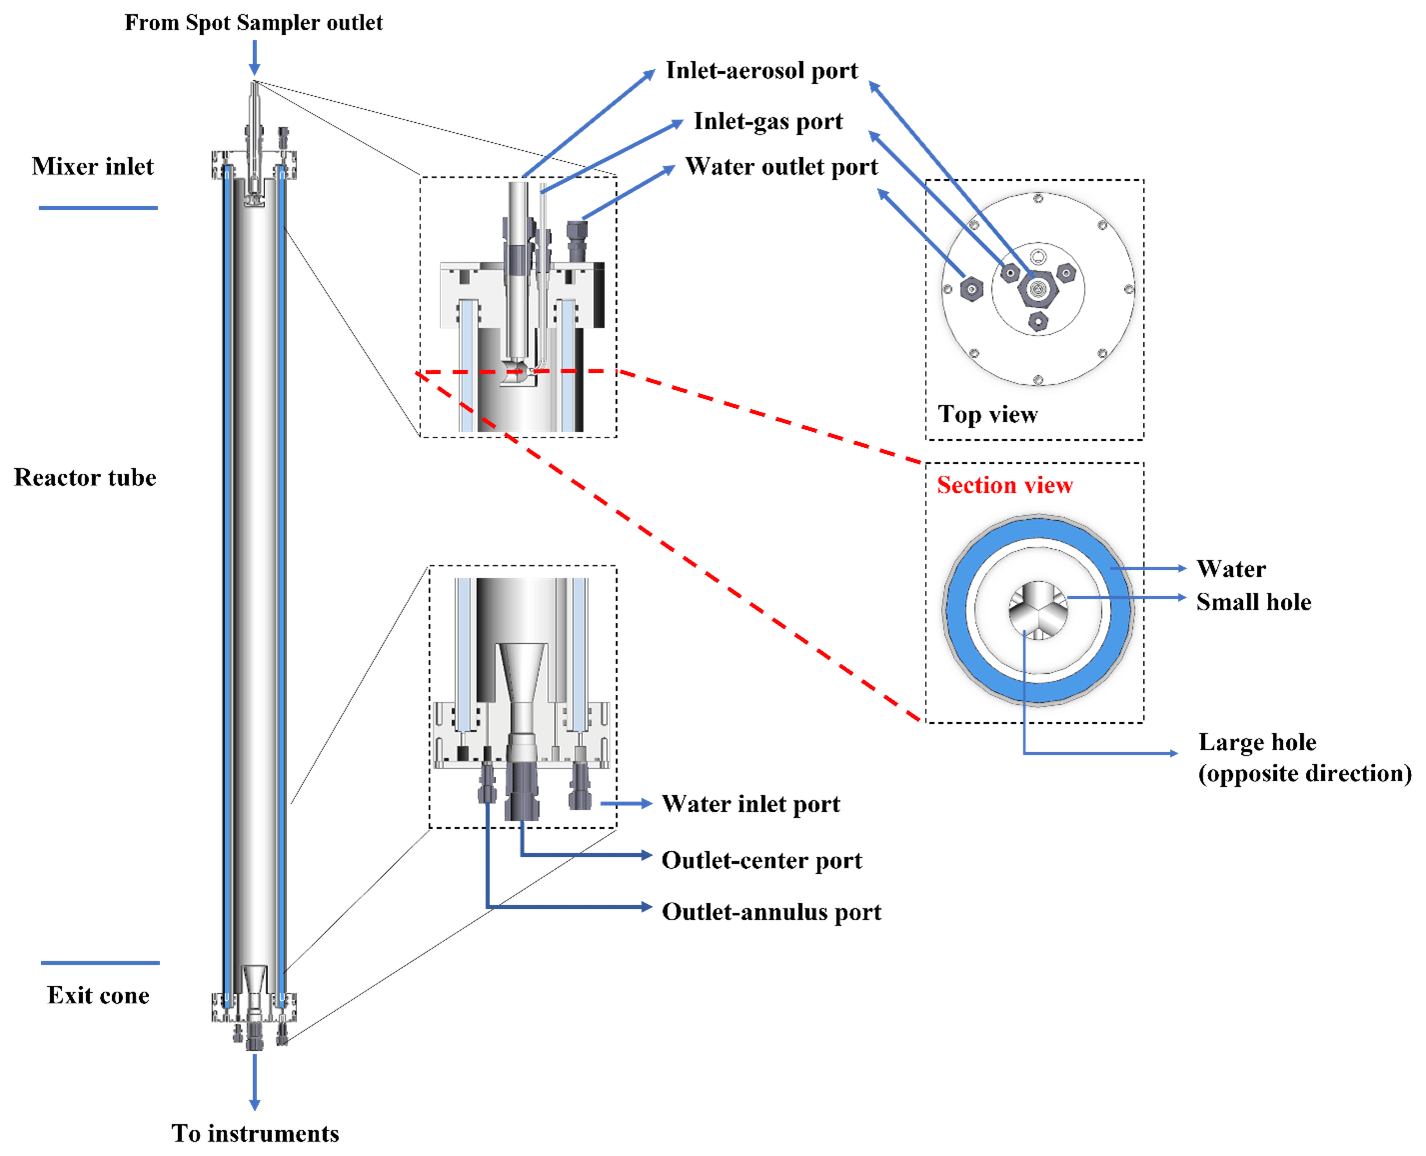
Figure 1Vertical cross section views of the APPA reactor (left) and horizontal cross section views of the top cap (right).
To precisely control the reactor cell temperature and to minimize any radial or axial temperature gradients that would promote convective mixing and cause droplet growth or evaporation, temperature-controlled ultrapure water from a chiller (Cole-Parmer, model 10124) is pumped upward through the 1.0 cm annulus between the outside of the PFA tube and the inside of the quartz tube. To achieve uniform upward velocity around the annulus, the water flows through eight equally spaced 0.32 cm holes as it enters through the bottom PTFE cap and as it exits through the top PTFE cap. Thermistors measure the temperature of the water entering and exiting the water jacket, with an average difference between the two of only about 0.2 °C with the solar-simulating or UV lamps described below turned on.
The most novel aspect of the APPA reactor is its use for studying aqueous-phase secondary aerosol formation in ALW and in cloud droplets. This is achieved by introducing cloud droplets formed on hygroscopic seed particles at the top and controlling the dew point and temperature in the reactor to produce either a prescribed RH or saturated conditions. To minimize losses of soluble and reactive gases to liquid water on the walls of the tubing and droplet generator upstream of the reactor, separate flows containing the gas mixture and the seed aerosol/droplets are used and are rapidly mixed inside the reactor. Those two inlet flows and their corresponding ports in the top PTFE cap are hereafter referred to as inlet-gas and inlet-aerosol. For the experiments reported here, the inlet-gas flow was controlled to 1.64 L min−1, and the inlet-aerosol flow was 1.36 L min−1. The stability of two flows over time is evident in the time series shown in Fig. S1a in the Supplement. The inlet-gas flow is subsaturated and particle-free and contains the precursor gas(es) and O3, while the inlet-aerosol flow is typically saturated zero air and, for most experiments, contains droplets formed on monodisperse seed particles. The inlet-aerosol flow is injected through the center injection port shown in the horizontal cross-sectional view of the top cap in Fig. 1, and the inlet-gas flow is introduced through three equally spaced ports that surround it.
2.2 Inlet-aerosol flow and droplet generation
Typical operation of the APPA involves injection of droplets formed on monodisperse seed particles into the top of the reactor and then measurement of the amount, properties, and/or composition of secondary aerosol that was added to them after they exit from the bottom and are dried. Because an objective of many of the experiments is to contrast aerosol formation in cloud droplets with that when dry or aqueous seed particles are present, droplets are typically injected even when the RH in the reactor is controlled to less than 100 % in order to minimize bias between the different reactor conditions. The flow path and components of the aerosol and droplet generation system are shown in Fig. 2. To date, most experiments have used potassium sulfate (K2SO4) seed particles because they have a dynamic shape factor close to 1 and effloresce at an RH of about 60 % (Freney et al., 2009), which permits measurements without ALW at higher RH than would be possible with common aerosol types such as ammonium sulfate and sodium chloride. The pH of pure K2SO4 aqueous particles or cloud droplets that form on them is close to 7, which is not representative of typical atmospheric aerosols but simplifies the interpretation of experiments for systems with significant pH dependence. The aerosol is generated by atomizing a 0.1 M aqueous K2SO4 solution with an atomizer (TSI Inc., model 3076), drying with a diffusion dryer consisting of a perforated tube surrounded by molecular sieve pellets, and size classifying with a high-flow differential mobility analyzer (DMA) (Stolzenburg et al., 1998). The aerosol is charge-neutralized in one soft X-ray neutralizer upstream of the DMA and then again in another downstream of the DMA in order to reduce the charged fraction and resulting electrostatic losses of the particles. Additionally, static charge on the inside of the reactor is minimized prior to the start of a series of experiments by pushing compressed zero air through a bipolar ionizer (Simco-Ion, model 4012229) and through the reactor. The particle diameter used for most experiments to date is 0.1 µm, which was selected to balance the desire to use smaller particles to maximize the relative change in size accompanying growth from addition of secondary aerosol and the desire to use larger particles to provide sufficiently high surface area concentration for non-cloud experiments to maximize the fraction of oxidation products that condense on them. For that diameter, the seed particle concentration inside the reactor can be varied between about 3000 and 30 000 cm−3 using an actively controlled dilution flow. For the seed particle concentration of approximately 20 000 cm−3 that was used for most experiments reported here, the resulting surface area concentration was between 1200 and 1400 µm2 cm−3 for low RH operation with no ALW or cloud droplets.
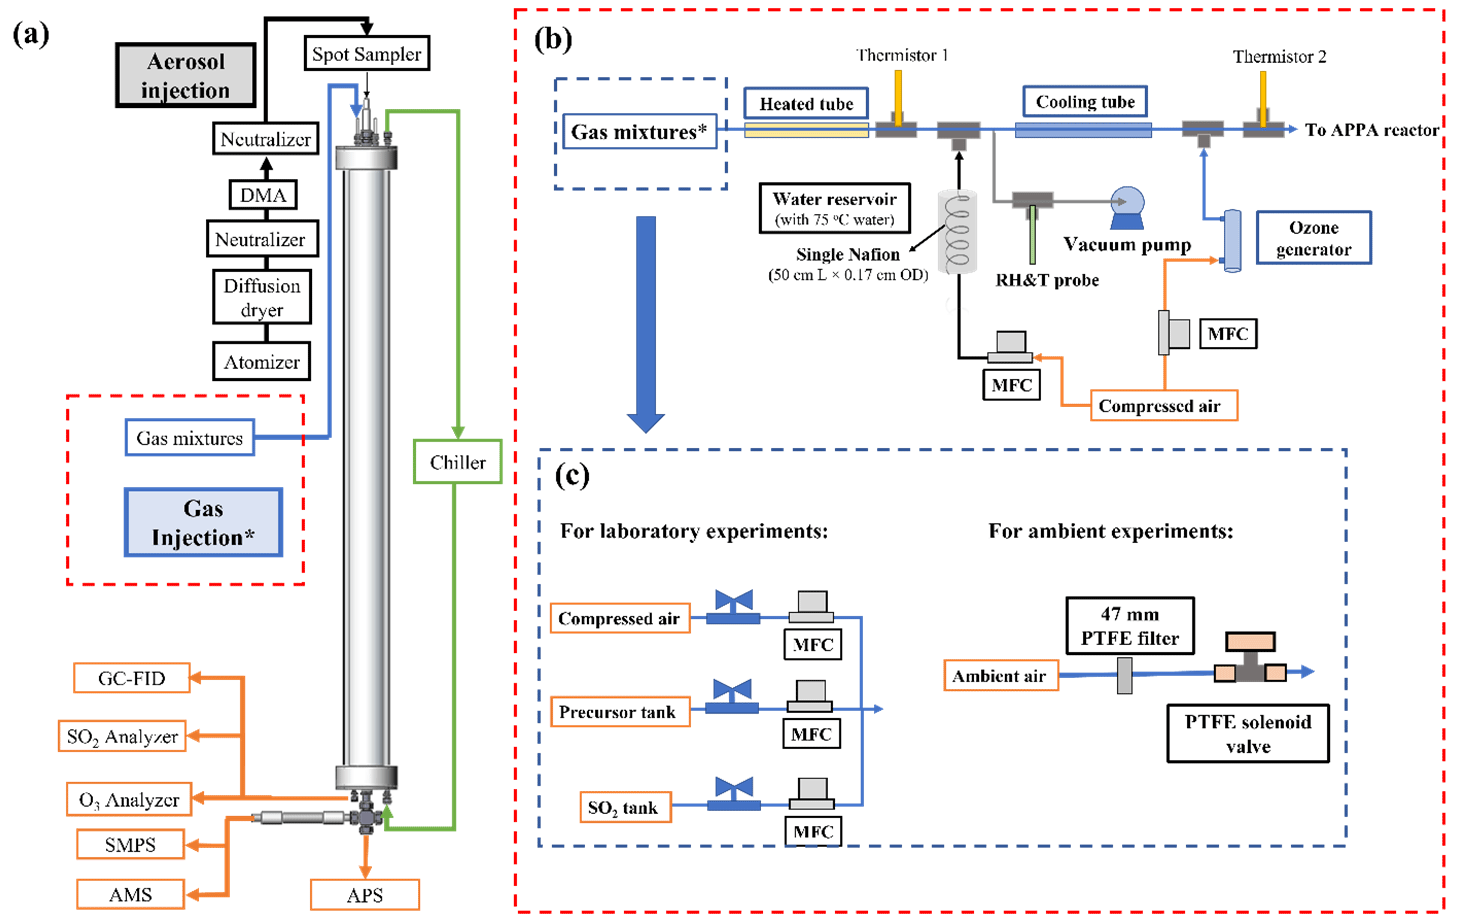
Figure 2(a) Schematic diagram of the APPA reactor and (b) associated experimental setup of the gas mixture injection with (c) configurations shown for laboratory and ambient measurements.
Droplets are formed on the monodisperse particles as they pass through a modified Spot Sampler (Aerosol Devices, Inc., model 110A) that is positioned on top of the reactor assembly and connected to the top cap through a short interface tube, as depicted in Fig. 3. The Spot Sampler uses a three-stage, moderated, and laminar flow water condensation growth tube similar to that described by Hering et al. (2014). Particles activate as they are exposed to a supersaturated environment and grow into droplets with diameters between about 3 and 4 µm, effectively forming a fog (Hering and Stolzenburg, 2005; Eiguren Fernandez et al., 2014). The resulting LWC inside the reactor is between approximately 0.1 and 1.0 g m−3 for the range in seed particle concentration described above. The Spot Sampler used for this application was modified by increasing the bore diameter of the condensation growth tube to about 6 mm and using more powerful fans for the heat sinks on the thermoelectric coolers in the moderator section. The focusing nozzle at the outlet of the standard Spot Sampler was replaced with a machined interface tube that carries the droplets to the inlet-aerosol port. Cooling water is pumped through coiled tubing wrapped around that interface to prevent warming of the flow that would result in evaporation of the droplets.
2.3 Inlet-gas flow and RH control
The gas mixture introduced into the reactor contains O3, water vapor, and either prescribed concentrations of aerosol precursors or particle-filtered ambient air. Almost all tubing and fittings in the flow path are made of PFA Teflon, with the exceptions being the solenoid valve, for which all wetted parts are PTFE, two thermistors that are covered in PTFE thread tape, and, for measurements of ambient air, the 47 mm PTFE membrane filter (Sartorius Stedim Biotech, product 36229-44) used to remove ambient particles (the filter housing is PFA). The O3 concentration is controlled using a mass flow controller (MFC; AALBORG Inc., GFC17-500SCCM) that varies the flow of zero air that is pushed through a generator in which O2 is photolyzed (Jelight Company, Inc., model 610). Because O3 production in the generator is relatively insensitive to the air flow rate through it, a small purge flow is extracted through a critical flow orifice immediately downstream of the generator, such that the amount of O3 added to the gas mixture varies with the difference between the total flow through the generator and that purged through the orifice. Using that approach, the O3 mixing ratio in the reactor can be controlled from 0.1 to 5.0 ppm. For laboratory experiments for which a precursor gas is injected, its concentration is controlled by an MFC (Alicat Scientific, model MC-100SCCM) downstream of a pressurized cylinder or tank containing the precursor in a balance of zero air. The gas mixture is heated (typically to 55 °C) just upstream of the point at which water vapor is added in order to prevent localized saturation and condensation, which could otherwise cause losses of soluble gases. The water vapor concentration is controlled to create saturated conditions or to produce the desired RH in the reactor after mixing with the cool and saturated droplet flow and brought to the controlled reactor temperature. To minimize dilution of the gas mixture flow for measurements with ambient air, concentrated water vapor is added from a hot, nearly saturated flow that is generated by pushing zero air controlled by an MFC (Alicat Scientific, model MC-500SCCM) through a 50 cm L × 0.17 cm OD Nafion tube that is submerged in water inside a stainless tank that is maintained at a fixed temperature (typically 75 °C). Immediately downstream of the tee where the water vapor is added, the mixed flow is forced through a small orifice to promote efficient mixing. To prevent contact of the gas mixture flow with the RH/T sensor (Vaisala, model HMP110) that is used to determine the water vapor pressure, a 0.8 L min−1 flow is split off and pulled past the sensor and then purged. Just upstream of the reactor, the humid gas mixture is cooled in a segment of the PFA tube that is submerged in a temperature-controlled water bath and is then split between three PFA tubes that extend through the three inlet-gas injection ports shown in Fig. 1. The three tubes extend into the interior of the reactor where they are press-fit into the outer curved surface of the hollow mixer also shown in that figure. Each of the three parts of the inlet-gas flow is introduced inward and perpendicular to the inlet-aerosol flow entering from above. The three gas mixture flows mix with the droplets and are pushed through holes on the opposite side of the hollow mixer to promote rapid and efficient mixing while also minimizing impaction losses and any evaporation/growth of the droplets.
The RH in the reactor cell is calculated from the cell temperature and the water content in the two inlet flows and, independently, from the cell temperature and the water content in the outlet-annulus flow. The calculation based on the inlet flows is used for the RH control while that based on the outlet flow is used as a check. To date, the cell temperature has typically been maintained at 20 °C. The flow exiting the Spot Sampler is saturated, with a dew point of approximately the minimum temperature reached by the flow as it exits the base of the cold moderator section. Though the moderator temperature has typically been maintained at the 3 °C lower limit possible; that is, the temperature of the growth tube wall and the air temperature is significantly higher. By mixing the flow from the Spot Sampler with zero air and measuring the resulting RH in the temperature-controlled reactor cell, it was determined that the flow exiting the Spot Sampler has a dew point of about 14.5 °C. The temperature to which the inlet-gas flow is controlled is optimized for each experiment but is fixed throughout an experiment to minimize the time needed to switch between measurements at different RH. During a multi-hour to multi-day experiment, the water content in the inlet-aerosol flow and the temperatures of the inlet-gas and inlet-aerosol flows and of the reactor are all fixed, and the cell RH varies only with the water vapor concentration in the inlet-gas flow, which is actively controlled by adjusting the flow rate of zero air pushed through the submerged Nafion tube.
Figure S3 provides a graphical depiction of the inlet-gas flow RH needed to result in the commonly used set of 40 % RH (dry seed), 85 % RH (ALW), and saturated (cloud) conditions for the typical inlet-aerosol, reactor, and inlet-gas temperatures of 14.5, 20.0, and 31.0 °C, respectively. As shown in the figure, the RH in the inlet-gas flow is controlled to be higher than that needed to result in 100 % RH in the reactor for cloud conditions, which was experimentally found to be necessary to prevent droplet evaporation. Figure S1b shows an example time series of the dew points of the two inlet flows and the temperature of the reactor for the same set of conditions depicted in Fig. S3.
2.4 Outlet flows and gas and aerosol measurements
As shown in Figs. 2 and 3, a in. (1.9 cm) Swagelok cross is mounted directly to the outlet-center port at the base of the reactor. For the orientation shown in the figures, the bottom and right legs of the cross are used only for measuring the size distribution of the droplets with an aerodynamic particle sizer (APS; TSI, Inc., model 3321) that is permanently positioned below the reactor. For normal operation, the outlet-center flow containing the processed seed particles or droplets turns 90° in that cross and then immediately enters a 15.2 cm L × 1.7 cm OD Nafion tube (Perma Pure LLC, model MD 700), where it is dried sufficiently to evaporate the large droplets that would otherwise have high loss rates due to settling and impaction. The flow is then further dried in a 61 cm L bundle of 18 0.17 cm OD Nafion tubes (Perma Pure LLC, model PD-070-18T) to reduce the RH to below 20 %. The size distribution and non-refractory composition of the initially single-component and monodisperse particles are then measured with a scanning mobility particle sizer (SMPS; fabricated in-house) and an Aerodyne high-resolution time-of-flight aerosol mass spectrometer (HR-ToF-AMS; DeCarlo et al., 2006). When measuring the droplet size distribution, the 1 L min−1 sample flow of the APS is pulled through a thin-walled stainless steel tube that is press-fit on the sample flow inlet of the APS and extends up through the cross and to a point just below the conical extraction section in the reactor cap. For the orientation shown in Figs. 2 and 3, 3.5 of the 4 L min−1 humidified sheath flow of the APS is introduced through the right leg of the cross, with the remaining 0.5 L min−1 pulled from the outlet-center flow around the thin-walled tube carrying the APS sample flow. As with the interface between the Spot Sampler and reactor that between the reactor and APS is cooled to the temperature of the reactor to prevent droplet evaporation. The outlet-annulus flow is always connected to an O3 analyzer (Teledyne Technologies, model T400U) and always flows past an RH/T sensor (Vaisala, model HMP110). For some experiments, the flow is also sampled with an SO2 analyzer (Teledyne Technologies, model T100UP) and/or a gas chromatograph with flame ionization detector (GC-FID; SRI Instruments, model 8610C).
2.5 Light source and intensity profile
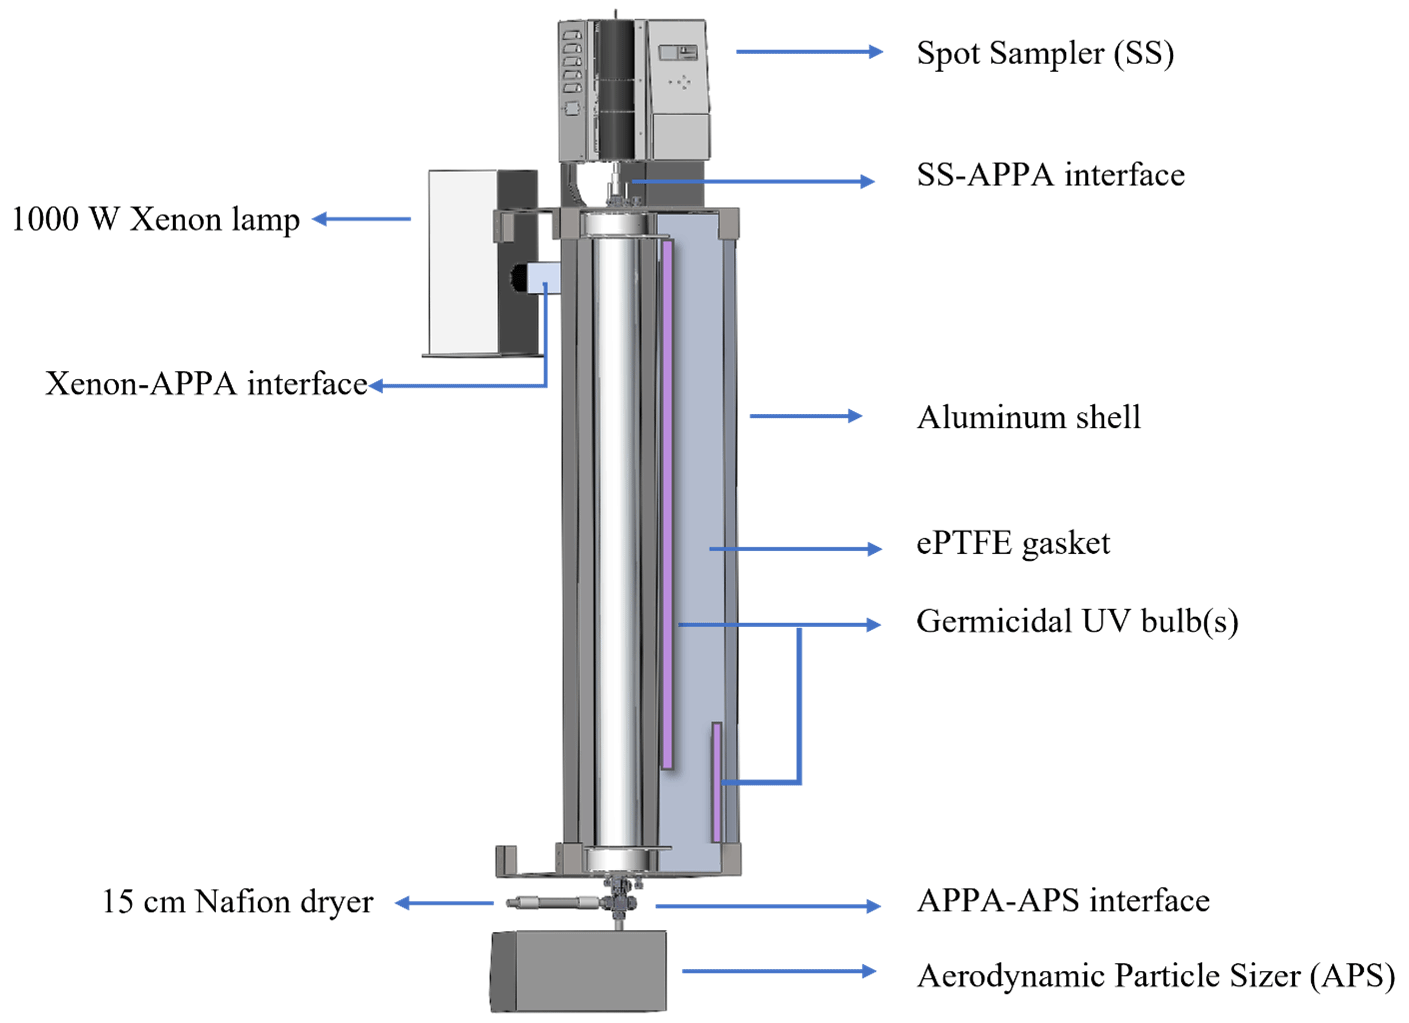
As depicted in the assembly view in Fig. 3, the reactor is housed in a 158 cm H × 20 cm L × 20 cm W aluminum shell that is in two halves that swing open and shut with hinges. The light sources are located outside of the quartz tube (which is outside of the PFA reactor). This configuration is similar to that in OFRs with UV lights surrounding a quartz tube reactor such as the Caltech photooxidation flow tube (CPOT; Huang et al., 2017) and Toronto photooxidation tube (TPOT; George et al., 2007; Lambe et al., 2011), with the important difference here that the UV must also be transmitted through the water layer and PFA tube. The quartz tube, ultrapure water, and PFA tube all absorb little visible or UV radiation (Beder et al., 1971; Litjens et al., 1999; Peng et al., 2017). However, the thick-walled PFA tube is translucent but dull white in appearance and much of the light incident upon it is reflected and not transmitted to reach the interior of the reactor. To maximize the UV intensity and uniformity inside the reactor, all interior surfaces of the aluminum shell are covered by a 6 mm thick highly UV-reflective expanded PTFE (ePTFE) gasket (Intertech, Inc., product SQ-S). The intent is to mimic an integrating sphere, with photons repeatedly reflected by the gasket and onto the outer surface of the PFA tube to maximize the fraction that reach the interior of the reactor and to make the UV uniform and nearly isotropic. The spectral intensity inside the reactor is measured using a UV-Vis spectrometer (StellarNet, Inc., model BLK-CXR-SR) through a fiber optic cable that is terminated with a cosine receptor and permanently secured in a threaded port in the top cap.
For standard operation as an OFR, a pair of 254 nm emitting germicidal UV bulbs that collectively span the length of the reactor (OSRAM, model G36T8; 122 cm and Ushio, Inc., model G10T8; 46 cm) are mounted on the inside of the ePTFE gasket, as shown in Fig. 3. The output of the UV lamps is computer-controlled, using a dimmable lamp ballast, and is typically maintained at a level for each RH that results in loss of 15 ± 2 % of the added O3 between the top and bottom of the reactor, which represents a balance between maximizing the OH : O3 concentration ratio and minimizing the O3 (and consequently OH) gradient over the length of the reactor.
An alternate use of the APPA reactor is for studying the impact of solar radiation on biological particles or other particle types. To achieve this, a 1000 W xenon lamp (Newport Corporation, model 66924-1000XF-RI) is mounted externally, with its focusing lens housing inserted into one end of a 7.6 cm × 7.6 cm square tube interface that leads to a hole through the aluminum shell and ePTFE gasket surrounding the reactor. That interface is attached to the aluminum shell at a 45° angle so that the focused beam is incident upon the inner surface of the ePTFE gasket and not the quartz tube in order to minimize local heating and to maximize light intensity uniformity. A 7.6 cm × 7.6 cm B270 or borosilicate glass window is secured in the interface to produce a spectrum that most closely matches the solar spectrum, especially in the short UV wavelength range close to 300 nm. The light intensity inside the reactor can be adjusted over a wide range through a combination of adjustment of the voltage output of the xenon lamp controller, partial blocking of the beam using a sliding baffle in the interface tube, and swapping the standard 1000 W bulb with an interchangeable 450 W bulb.
3.1 Reactor characterization
3.1.1 Gas and particle transmission efficiencies
The particle transmission efficiency through the reactor was evaluated with continuous injections of size-classified ammonium sulfate (AS) particles with mobility diameters ranging from 0.050 to 0.20 µm. The transmission efficiency was calculated as the ratio of particle concentrations downstream of the reactor and downstream of a 150 cm L × 0.95 cm OD copper tube bypass measured with a condensation particle counter (CPC; TSI Inc., model 3760A). As with the gas transmission efficiency tests described below, the flow rate through the reactor was the same 3.0 L min−1 used during normal operation. The measurements were repeated 2 or 3 times for each particle size, with agreement between measurements found to be to within ±5 % for each diameter. As expected for the particle size range considered for which the dominant loss mechanisms are Brownian motion and electrostatic attraction to charged surfaces, the particle transmission efficiency increases with increasing particle size from 0.67 for 0.050 µm particles to 0.94 at 0.080 µm and 0.98 at 0.20 µm. As shown in Fig. 4a, the size-dependent particle transmission efficiency through the APPA reactor is similar to that for the OFR described by Xu and Collins (2021), which is not surprising, given the similarity in the materials and designs of the reactor tubes and end caps of the two. Figure 4b compares the particle transmission efficiencies of the APPA OFR and several flow tube reactors with non-metal wall materials. The potential aerosol mass (PAM) reactor for which data are provided is the 15 L glass cylindrical chamber described in Lambe et al. (2011). The particle transmission efficiency of the APPA reactor is significantly higher than those of the quartz PAM, TPOT, and CPOT, though somewhat lower than those of the Environment and Climate Change Canada OFR (ECCC-OFR; Li et al., 2019) and the TUT Secondary Aerosol Reactor (TSAR; Simonen et al., 2017) at the smallest particle sizes evaluated. The exact causes of the differences in transmission efficiencies among the reactors are unknown, though subsampling of the center flow at the outlet of the APPA likely contributes to its higher efficiency relative to the quartz PAM, TPOT, and CPOT, while its lower efficiency relative to the ECCC-OFR and TSAR may in part be due to differing residence times (150, 120, and 40 s for the APPA, ECCC-OFR, and TSAR, respectively).
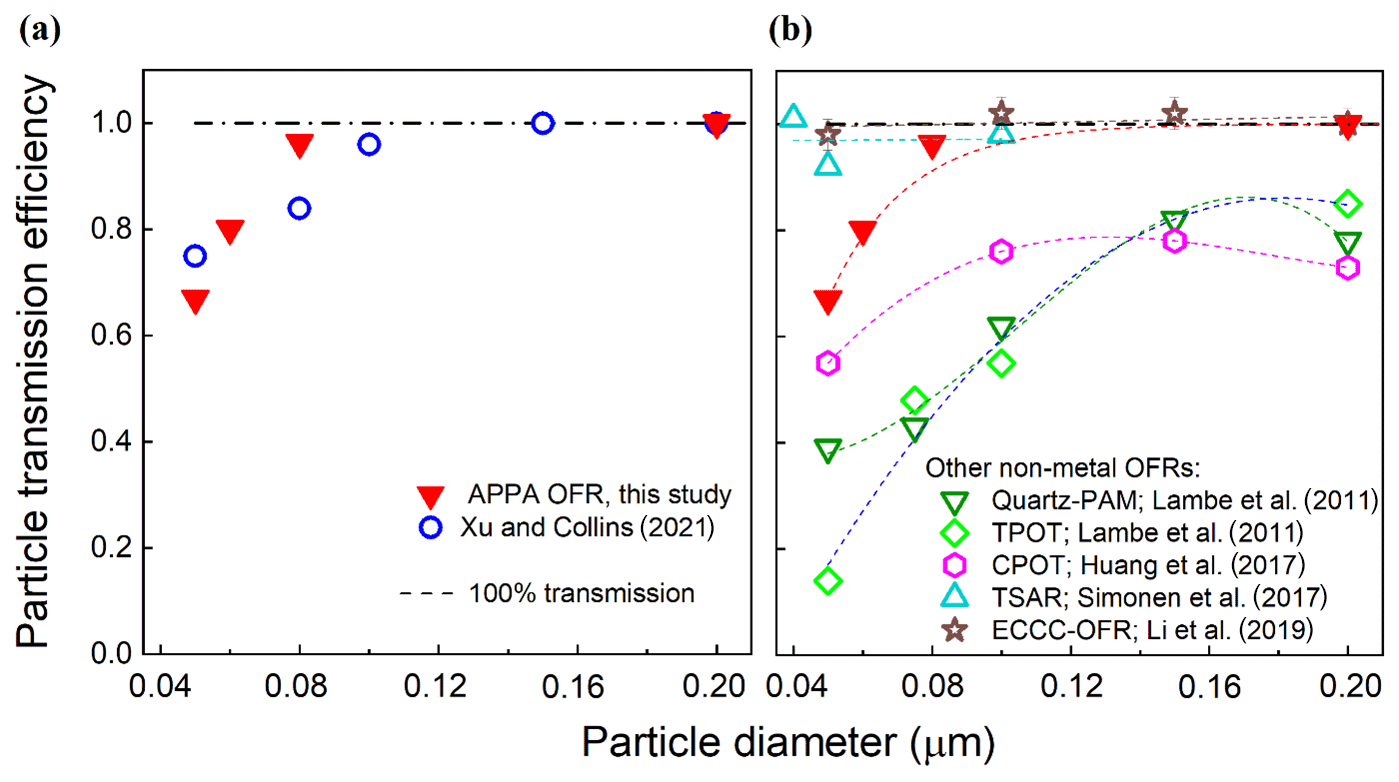
Figure 4Particle transmission efficiency of the APPA reactor compared with those reported (a) for the OFR described by Xu and Collins (2021) and (b) for several non-metal OFRs reported in the literature, as described in the text.
Gas transmission efficiency was evaluated for SO2, O3, and CO2, which were selected as representative of gases that adhere to, react on, and are unaffected by reactor walls, respectively (Lambe et al., 2011; Ahlberg et al., 2017; Huang et al., 2017). Transmission efficiencies were calculated as the ratios of the SO2, O3, and CO2 concentrations measured downstream and upstream of the reactor using the SO2 and O3 analyzers described in Sect. 2.4 and a non-dispersive infrared (NDIR) analyzer (LI-COR Biosciences, model Li-840A) for CO2. Prior to measurement of the SO2 transmission efficiency, the SO2 gas mixture was pushed through the reactor for about 20 min to passivate the tubing and reactor surfaces, following the approach described by Lambe et al. (2011). Figure 5 shows the gas transmission efficiencies for 0 % < RH ≤ 100 %. The transmission efficiencies of CO2 and O3 were over 90 % over the RH range tested for each. For SO2, transmission decreases from over 90 % at an RH of 40 % to 0.8 and 0.73 at an RH of 85 % and 100 %, respectively. For comparison, Lambe et al. (2011) reported that the measured CO2 and SO2 transmission efficiencies for the TPOT were 0.97 ± 0.10 and 0.45 ± 0.13, respectively, and for the quartz PAM were 0.91 ± 0.09 and 1.20 ± 0.40, respectively.
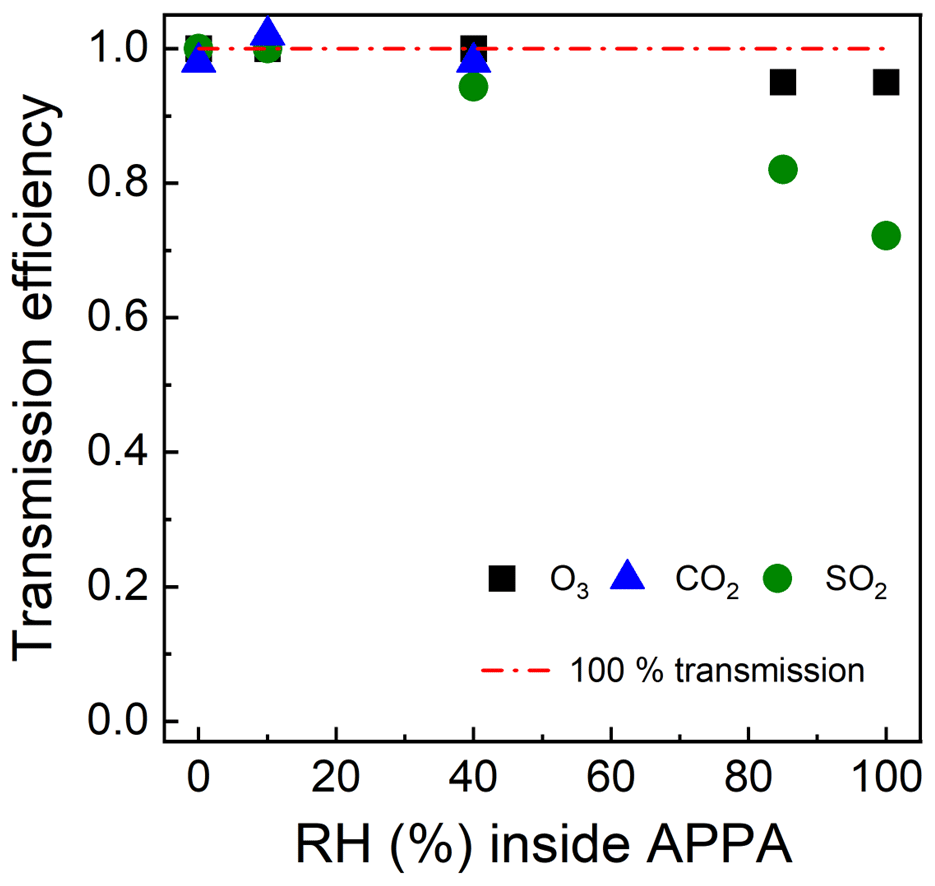
Figure 5Gas transmission efficiencies of the APPA reactor as a function of relative humidity.
3.1.2 Gas and particle residence time distributions
Though the extent of processing of gases and particles inside an OFR is typically reported as a single value, such as OH exposure or equivalent photochemical age, developed flow velocity profiles and mixing due to convection and/or flow cell geometry lead to a continuum of residence times and the corresponding extent of processing. The spread in exposure is typically reported as a residence time probability distribution function, as described in Mitroo et al. (2018). Such functions are often referred to simply as residence time distributions or RTDs.
The approach used to characterize the RTDs of particles and gases is the same as that described in Xu and Collins (2021). Briefly, an MFC was used to introduce 10 s pulses of either 0.20 µm AS particles or pure CO2. The particle and CO2 concentrations in the outlet-center flow were measured with the CPC and CO2 analyzers identified in the previous section. For both tests, the RH was controlled to 40 %, and the UV lights were off. Both the particle and gas RTD measurements were repeated three times. The resulting distribution functions for particles and gas are shown for the APPA and other reactors in Fig. 6a and b, respectively. The combination of a relatively small inner diameter, a uniform and constant reactor temperature maintained by the water jacket, and the subsampling of the center flow at the outlet results in gas and, especially, particle RTDs of the APPA that are narrow relative to the other reactors included in the figures and that lack the long tail expected even for ideal laminar flow.
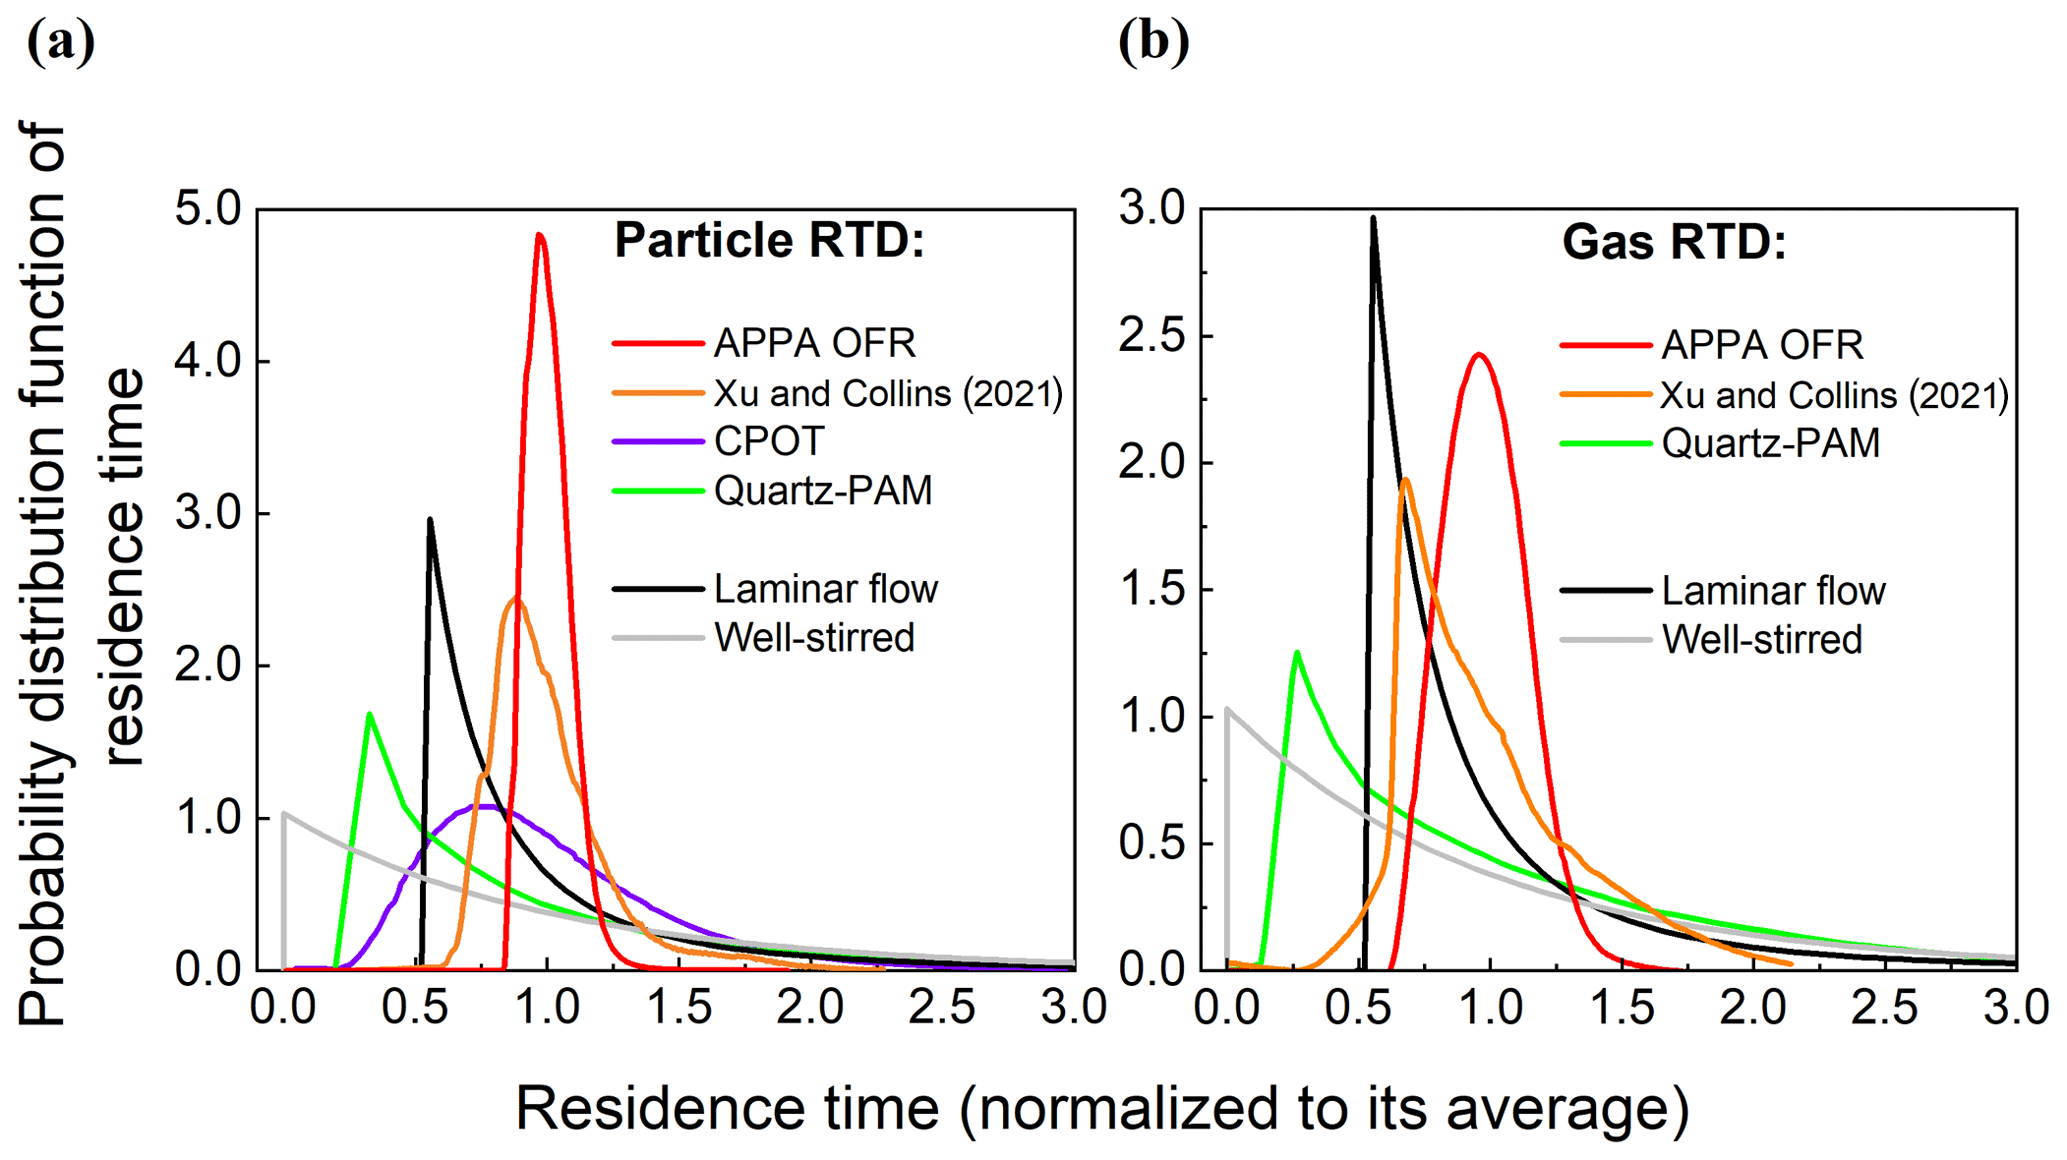
Figure 6Residence time probability distribution function of (a) particles and (b) gases in the APPA and in other reactors, as reported for the PAM by Lambe et al. (2011), CPOT by Huang et al. (2017), and PFA by Xu and Collins (2021) and downloaded from PAMWiki (https://sites.google.com/site/pamwiki/home, last access: October 2022).
3.1.3 Droplet size distribution
Droplet size distributions measured at the outlet of the APPA by the APS are shown in Fig. 7. As is true for most of the experiments reported here, the droplets formed inside the Spot Sampler on 0.1 µm diameter K2SO4 particles and were introduced into the top of the reactor in the 1.36 L min−1 inlet-aerosol flow. For these characterization experiments, the seed particle, and consequently droplet, concentration was varied from 20 000 to 70 000 cm−3. The measured droplet size distributions shown in Fig. 7 are normalized by the integrated concentrations to emphasize changes, or lack thereof, in shape and peak location with varying concentration. The mean diameter of the droplets is stable at approximately 3.3 µm for the range in concentration examined here. As shown in Fig. S2, the shape of the droplet size distribution was also stable over a period of several months, with the mean diameter varying by only ±5 %. For the 20 000 cm−3 concentration used for most experiments, the resulting LWC is approximately 0.3 g m−3. Compared with the droplet size distribution measured directly from the Spot Sampler, which is similar to that reported by (Lewis and Hering, 2013), the distribution measured at the outlet of the APPA has a tail at the left side, which is thought to be caused by partial evaporation of droplets near the walls in the interface between the Spot Sampler and inlet-aerosol port. The efficiency with which the droplets were transmitted through the reactor and the Nafion tube and bundle was found to be over 80 % from experiments in which the seed particle concentration upstream of the Spot Sampler was measured with a CPC (Aerosol Devices Inc., model MAGIC 210) and compared with that calculated from the size distribution measured by the SMPS located downstream of the APPA and Nafion dryers.
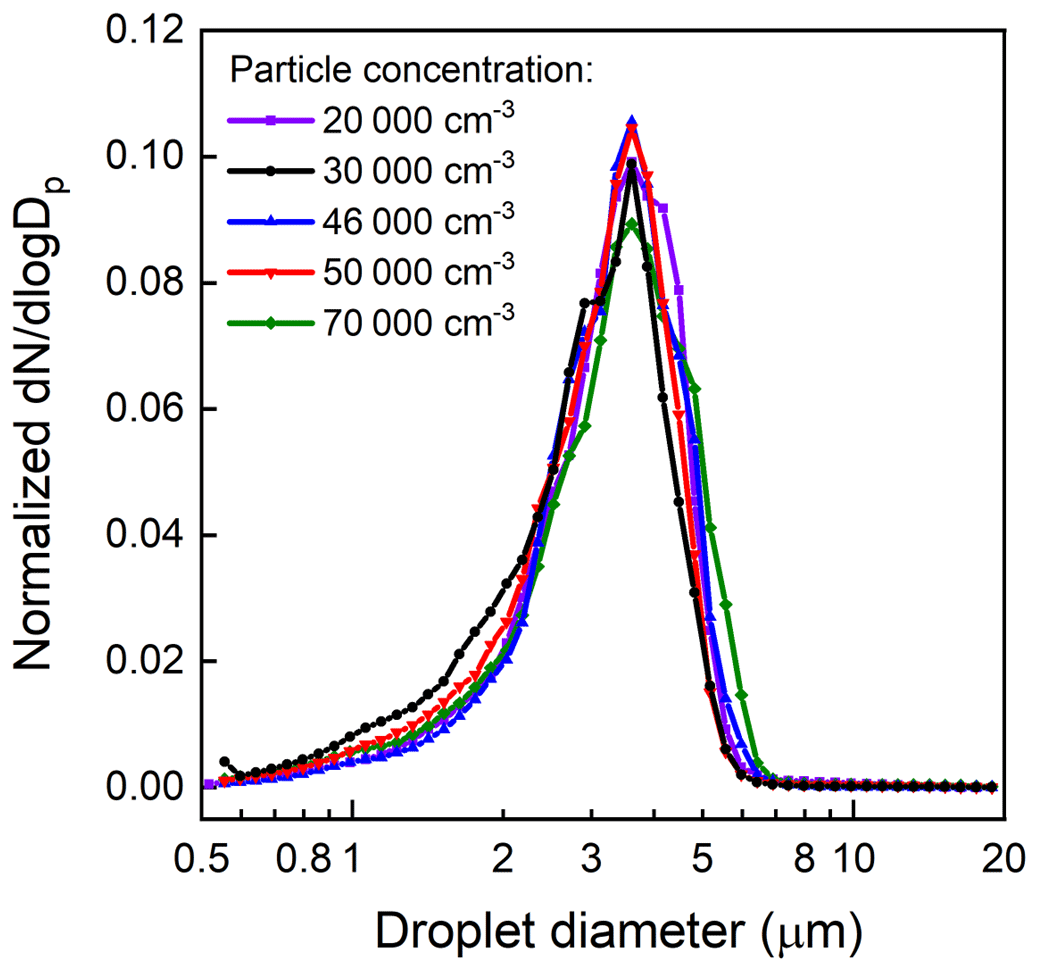
Figure 7Droplet size distributions measured at the outlet of the APPA reactor for a range in concentration.
3.1.4 Sulfate formation in cloud droplets
Though, like most OFRs, the APPA reactor is most often used to measure aerosol formation resulting from OH chemistry, conditions inside the reactor during cloud chemistry experiments were first evaluated through the well-studied oxidation of dissolved SO2 by O3, leading to the growth of the particles on which the droplets formed accompanying the formation of sulfuric acid through the following generic reaction:
where S(IV) represents the +4 oxidation state sulfur species SO2⋅H2O, , and that will not remain in the aerosol phase following the evaporation of the droplet, and S(VI) represents the +6 oxidation state sulfur species H2SO4, , and that will remain in the aerosol phase. The experimental conditions for these tests differed from those for standard operation only in that the UV lights were not turned on, and the diameter of the K2SO4 seed particles was varied. The use of ∼ pH-neutral K2SO4 for these experiments minimized the influence of the seed particles for the highly pH-dependent reaction. The SO2 and O3 mixing ratios at the top (inlet) of the reactor were fixed at 50 ppb and 1.5 ppm, respectively.
Figure S4 shows the initial and cloud-processed dry particle size distributions measured with the SMPS when 0.040 µm diameter seed particles were injected. Figure 8 summarizes the relationship between the mode diameters of the initial and cloud-processed particles for that experiment and for others that differed only in the size of the injected K2SO4 seed particles, with 0.030, 0.050, and 0.10 µm particles observed to grow to 0.0418, 0.0569, and 0.102 µm, respectively. Also shown in that figure are estimates of the particle growth from a 0-D model that includes reactions for this system, as described by Caffrey et al. (2001), and that assumes a cloud droplet diameter of 3.3 µm. The measured and modeled dry diameters of the cloud-processed particles agree within 5 %.
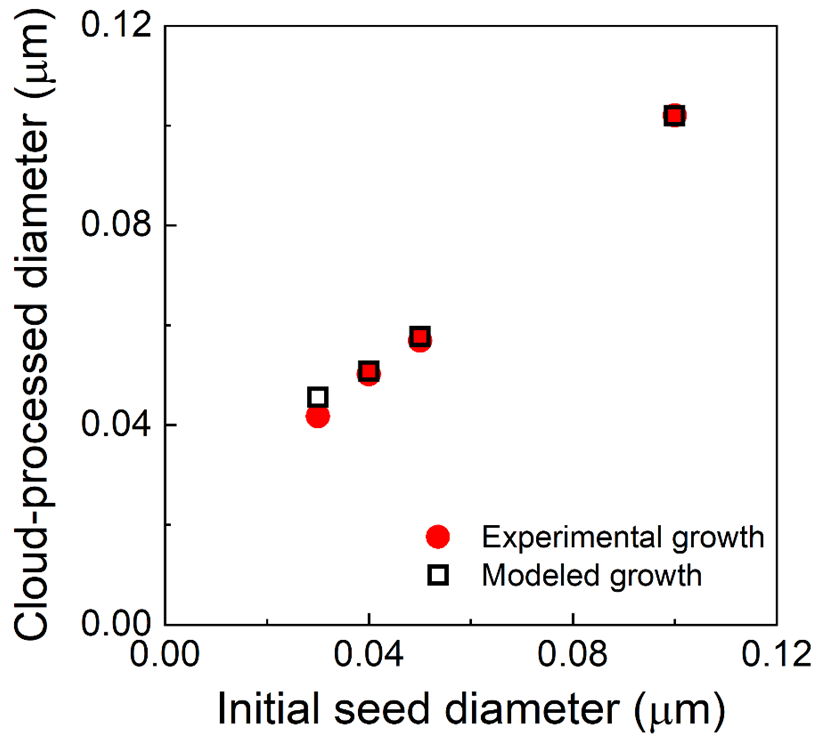
Figure 8Measured diameters of cloud-processed and evaporated particles as a function of the diameter of the injected K2SO4 seed particles (solid red points), the expected diameters calculated for the reactor conditions (3.3 µm droplet diameter, 50 ppb SO2, and 1.5 ppm O3), and the set of relevant aqueous-phase reactions (hollow black squares).
3.1.5 Light intensity spectrum and profile
As described in Sect. 2.5, a 1000 W xenon lamp is used instead of the 254 nm mercury lamps for experiments such as those designed to assess the germicidal efficacy of solar radiation. Spectral irradiances shown in Fig. S5 were measured (i) inside the reactor and (ii) outdoors, with the fiber optic cosine receptor pointed at the Sun around noon on a sunny day in April. The data are normalized to more clearly show the similarity in spectral shapes. Actinic fluxes were calculated from the measured irradiance spectra and approximate actinic flux to irradiance ratios for nearly isotropic (reactor) and mostly direct (solar) radiation taken from Hofzumahaus et al. (1999). Actinic flux is the radiant quantity used to calculate photodissociation rates that are used to describe the photochemistry of the atmosphere and is also the most relevant quantity for many biological systems (Kylling et al., 2003). The ratio of the reactor and outdoor actinic fluxes is also included in Fig. S5, with an average inside the reactor of 1.9 times that in direct sunlight for 300 nm ≤ λ ≤ 400 nm.
The uniformity of the 254 nm UV from the germicidal mercury lamps was evaluated by attaching the receptor of the fiber-optic-coupled spectrometer to a metal rod that was inserted through the outlet-center port and moved to five approximately evenly spaced positions between the top and bottom of the reactor. The UV photon counts and normalized intensity at 254 nm as a function of position are shown in Fig. 9a. The 254 nm intensity varies by approximately ±10 % throughout the reactor.
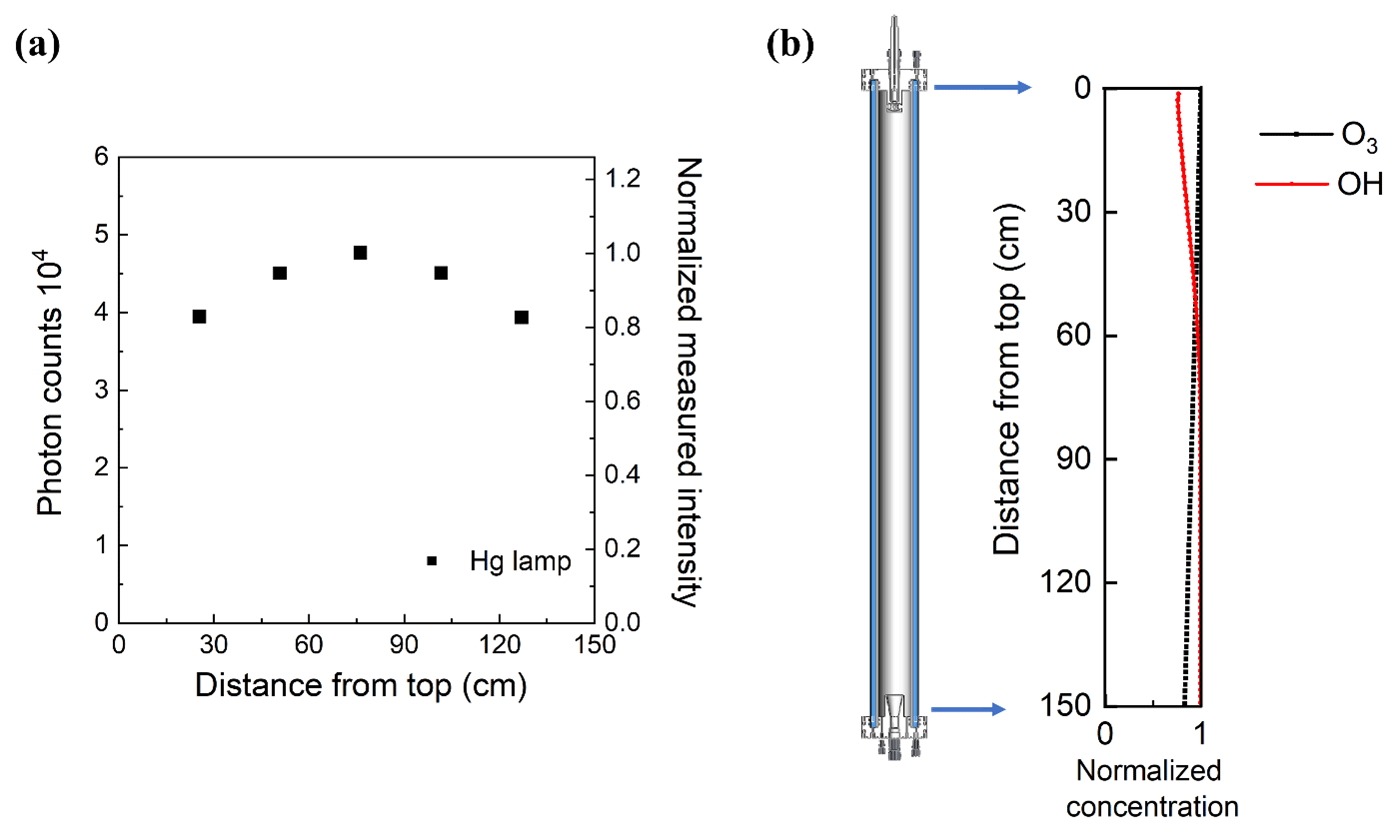
Figure 9(a) Relative UV intensity profile and (b) normalized ratio of O3 and OH concentration as a function of position in the reactor cell.
The rate of OH formation from O3 photolysis at any position in the reactor is dependent upon the local 254 nm UV intensity and the local water vapor and O3 concentrations. The water vapor concentration varies minimally inside the reactor, while, as noted above, the UV lamp output is generally set at a level that results in loss of ∼ 15 % of the added O3 between the inlet and outlet. Though the OH formation rate can be estimated from the UV and O3 profiles, estimating the more relevant OH concentration profile requires the consideration of reactions involving an array of radicals and other species. Here, the position-dependent concentrations of OH and other important species were simulated using the KinSim chemical kinetic solver (Peng et al., 2016; Peng and Jimenez, 2019). Environmental parameters such as temperature and RH and a scaling array for the 254 nm UV intensity, based on the data shown in Fig. 9a, were provided as inputs. The reactions used in the simulator included the default set of gas-phase reactions in the KinSim “OFR radical chemistry” module, relevant photolysis rate constants for 254 nm UV, and the aqueous-phase reactions listed in Table S1 for which effective reaction rate constants were calculated for an LWC of 0.3 g m−3 and assuming aqueous-phase concentrations are described by Henry's law. The peak 254 nm photon flux specified in the model for each RH was then iteratively determined such that the simulated loss of O3 matched that measured. The photon fluxes determined in that way ranged from ∼ 4.6 × 10¹⁴ photons cm−2 s−1 for 100 % RH measurements (2.3 V sent to the adjustable lamp ballast) to 1.1 × 10¹⁵ photons cm−2 s−1 for 40 % RH measurements (3.0 V sent to ballast). The UV intensity required to result in the same fractional loss of O3 is higher at low RH because a larger percentage of the O(1D) produced from O3 photolysis undergoes collisional deactivation to form O(3P), which subsequently reacts with O2 to reform O3. Figure 9b shows an example of the profiles of simulated concentrations of O3 and OH through the length of the reactor, each normalized by its maximum concentration. The OH concentration increases with time (and distance from the inlet) over roughly the top one-third of the reactor and is nearly constant through the lower two-thirds.
The oxidizing environment inside OFRs is often expressed as the OH exposure (OHexp), which is normally defined as the product of the average OH concentration (in cm−3) and the mean residence time of the sample flow (in seconds). Here, OHexp was calculated from the reactive loss of SO2 and benzene gas as a function of UV intensity, RH, and added O3 concentration. Those experimentally determined values were compared with estimates from the KinSim model with the photon fluxes specified above. Reactive loss of SO2 was used to determine OHexp at 40 % RH and that of benzene to determine OHexp at 40 %, 85 %, and 100 % RH. Sulfur dioxide was not used for the high RH measurements because oxidation by O3 and OH in the ALW or cloud droplets would cause a high OHexp bias. Sulfur dioxide and benzene were used because their OH reaction rate constants of 1.3 × 10⁻¹² and 1.23 × 10⁻¹² cm3 molec.−1 s−1 result in significant, but not complete, reactive loss over the OHexp range of interest. For both SO2 and benzene, mixing ratios of between 150 and 250 ppb were injected, and those of the air exiting the chamber were measured by the SO2 analyzer and the GC-FID, respectively. The reactive loss was determined from the ratio of the concentration measured with the UV lights on to that with them off. As with normal operation of the reactor, OHexp was varied by changing the added O3 concentration, with the UV lamp intensity at each RH fixed (and, again, selected to result in the loss of approximately 15 % of the O3).
The points in Fig. S6 represent OHexp calculated from measured SO2 loss as a function of initial O3 concentration for a series of experiments at 40 % RH. The two dashed curves in that figure are OHexp estimated from KinSim for the experimental conditions. For the simulations resulting in the values along the upper (black) curve, the only source of “external” OH reactivity (OHext) (Peng et al., 2015) was the ∼ 4.7 to 7.8 s−1 corresponding to the added 150 to 250 ppb SO2. For the values shown with the lower dashed (red) curve, an additional reactant and reaction were included in KinSim that added 2.0 s−1 external OH reactivity without directly affecting any other species. Though it is unknown whether that change improves the agreement because of the presence of one or more species that react with OH because of loss of OH to the walls, and/or because of sources of error in the experiments and simulations, it is assumed to improve the simulation for all conditions and is included in KinSim for all other experiments reported here as well. A summary of the measurements and simulations for high RH experiments using benzene is provided in Sect. S5 and Fig. S7 in the Supplement.
3.2 Measurement of secondary aerosol formation
3.2.1 Gas- and aqueous-phase SOA formation from oxidation of toluene
Secondary organic aerosol formation from a single precursor was studied by injecting K2SO4 seed particles and between 80 and 90 ppb of toluene and then varying both OHexp and RH between experiments. The volume concentration of the resulting SOA was calculated from size distributions measured with the SMPS described above. For the highest OHexp experiment for each RH (between 1.01 and 1.06 × 10¹² molec. cm−3 s), the aerosol exiting the reactor was collected on a 25 mm PTFE membrane filter for offline compositional analysis. Organic compounds were evaporated from the filters as they were heated in a Filter Inlet for Gases and Aerosols (FIGAERO) coupled to an iodide adduct high-resolution time-of-flight chemical ionization mass spectrometer (FIGAERO-HR-ToF-CIMS; Aerodyne Research Inc.). The mass spectra measured throughout the FIGAERO temperature ramp were composited to provide a single spectrum for each RH.
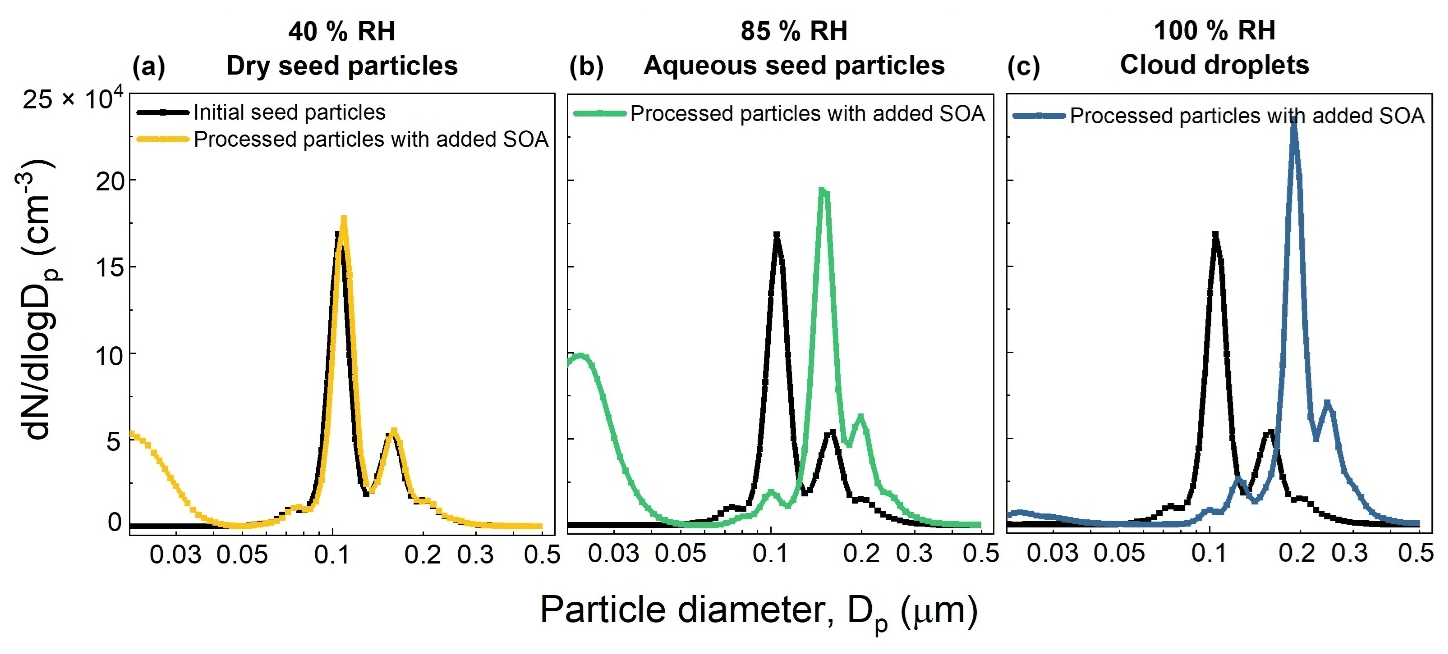
Figure 10Example set of number size distributions of seed particles without and with added SOA formed from the OH oxidation of toluene for 40 % RH (a), 85 % RH (b), and 100 % RH (c). The initial toluene mixing ratio was 80–90 ppb and the OHexp estimated from KinSim is 3.49 × 10¹¹ molec. cm−3 s.
An example set of number size distributions of seed particles without and with added SOA is shown in Fig. 10. The nucleation modes evident in the distributions measured when dry seed particles were present in the reactor (40 % RH) and when ALW was present (85 % RH) were often observed but typically contributed negligibly to the total mass concentration. The SOA mass concentration was calculated from the increase in aerosol volume concentration above that of the seed particles and an assumed SOA density of 1.3 g cm−3 (Schnitzler et al., 2014). SOA yields were then calculated as the ratio of the mass concentration of SOA to the mass concentration of reacted toluene, which was determined from the measurement of the outlet flow with the GC-FID. Figure 11 summarizes the SOA yield as a function of RH and OHexp. As shown in that figure, the SOA yield for each RH increased with increasing OHexp up to the maximum of 1.04–1.10 × 10¹² molec. cm−3 s, which corresponds to a photochemical age of 8–8.5 d for an assumed average atmospheric [OH] of 1.5 × 106 cm−3. Also evident in the figure is the significant dependence of the yield on the presence and amount of liquid water. Maximum yields of 0.21, 0.45, and 0.78 were measured when dry seed particles, aqueous seed particles, and cloud droplets were present in the reactor, respectively. The yield measured with no liquid water present is similar to the 0.17–0.23 range reported by Nakao et al. (2011), though the comparison is indirect because of differences in OHexp and organic mass loading between the two studies.
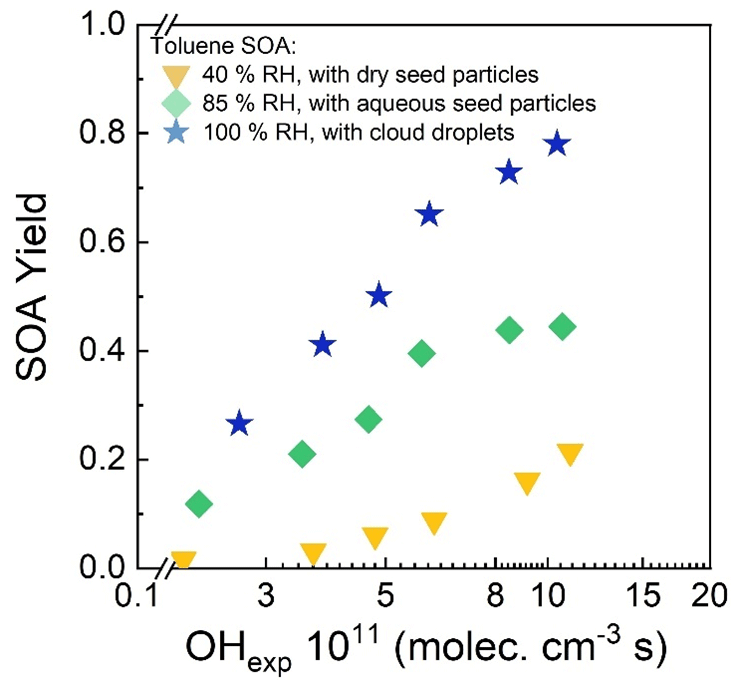
Figure 11Toluene SOA yield as a function of OHexp in low RH (40 %), high RH (85 %), and cloud (100 %) modes.
The observed increase in SOA yield with increasing liquid water content is believed to result from further oxidation in the aqueous phase of the products of the gas-phase oxidation of toluene. An alternative explanation that must be considered is that the enhancement is simply a consequence of the increased surface area available for condensation of low-volatility products of the gas-phase oxidation. Support for a significant role of aqueous-phase chemistry comes from the aerosol composition measured with the FIGAERO–HR-ToF-CIMS. Mass spectra of the SOA collected for the three RH (and liquid water) conditions are shown in Fig. S8. The signal observed at = 217 (C2H2O4I−) was absent from the mass spectrum obtained from SOA generated in the APPA at 40 % RH (Fig. S8a) but was the dominant peak in spectra obtained from SOA generated at 85 % and 100 % RH (Fig. S8b and c). The C2H2O4I− signal corresponds to oxalic acid, which can be produced following reactive uptake, hydration, and multi-generational OH oxidation of glyoxal in the aqueous phase (Lim et al., 2010). While glyoxal is a major gas-phase OH oxidation product of toluene (Volkamer et al., 2001), oxalic acid is not generated via subsequent gas-phase OH oxidation of glyoxal (Warneck, 2003), which is why it is observed in Fig. S8b–c but not in Fig. S8a. Peaks are not evident in the spectra corresponding to glyoxylic acid (C2H2O3I−; = 201) and glycolic acid (C2H4O3I−; = 203), both of which are oxidation products of glyoxal, and the former of which is a direct precursor to oxalic acid through aqueous-phase oxidation (e.g., Lim et al., 2010). The absence of those compounds despite the high concentration of oxalic acid is attributed to a combination of their oxidation to near-completion during the ∼ 8 d equivalent photochemical aging in the reactor and to their preferential evaporation from the residual particles following evaporation of the water from the droplets because of their substantially higher vapor pressures (∼ 1, ∼ 0.02, and 0.0002 mm Hg for glyoxylic, glycolic, and oxalic acid, respectively; Brown, 2008).
3.2.2 Aerosol formed from oxidation of ambient air
The potential contribution of aqueous-phase chemistry to secondary aerosol formation potential of ambient air is assessed by cycling through RH (and liquid water content) as quickly as possible to minimize the influence of changing ambient concentrations between measurements. Approximately 15 min is required for measurement at each RH OHexp, which includes time to reach steady state and then time to measure two size distributions with the SMPS, with the aerosol composition often simultaneously measured with the AMS. Measurement at several OHexp steps, as with the toluene experiments summarized in Fig. 11, would take too long for most study locations. The example RH time series shown in Fig. S9 is a segment of a period of several weeks during which ambient air was processed through the APPA at the standard RH steps of 40 %, 85 %, and 100 % and with OHexp steps corresponding to approximately 8 h and 4 d photochemical age. That repeated matrix of six RH OHexp pairs required approximately 1.75 h, which includes a few minutes of flushing with dry air after the 100 % RH measurements to ensure that no liquid water remains on the reactor walls.
Figure 12 provides an example of the influence of aerosol liquid water and cloud water on the composition of the organic fraction of secondary aerosol that formed as ambient air in Riverside, CA, was exposed to a fixed OHexp of approximately 5 × 10¹¹ molec. cm−3 s (∼ 3.8 d photochemical age). As shown in the figure, the O : C ratio calculated from the high-resolution AMS data increased significantly with increased liquid water content from an average of 0.34 when only dry seed particles were present to an average of 0.64 with aqueous seed particles and an average of 0.89 with cloud droplets. This sort of enhancement in O : C in aqSOA is among the possible explanations for the frequent observation that ambient aerosol has a higher O : C than that formed in environmental chambers (Reinhardt et al., 2007; Chhabra et al., 2011). Results from the continuous processing of ambient air over periods of weeks will be presented in future publications.
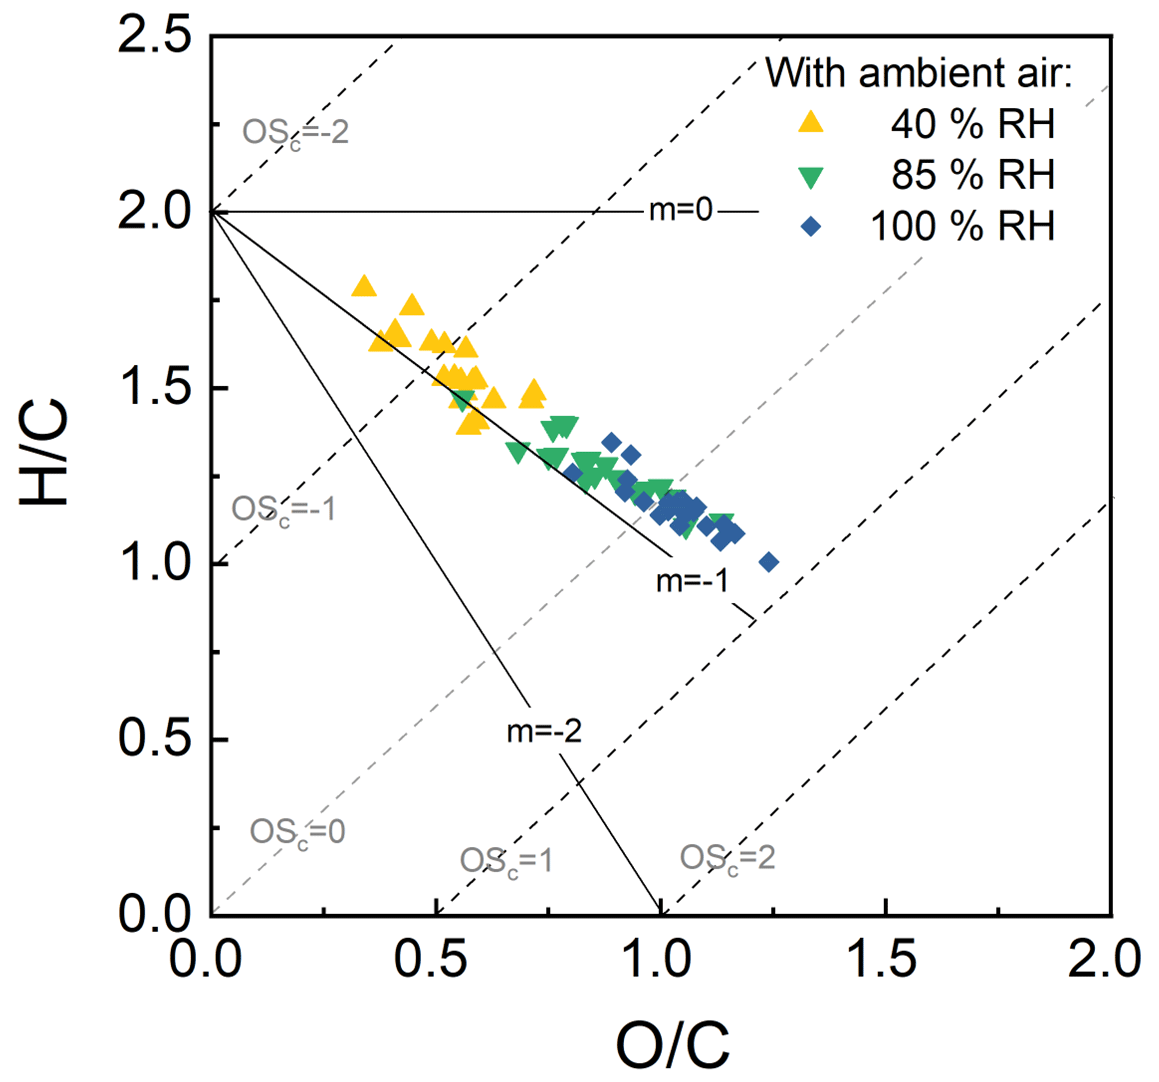
Figure 12O C and H C ratios determined from AMS measurements of SOA formed as ambient air was processed in the reactor. The significant decrease in H C ratio and increase in O C ratio with the progression from no liquid water in the reactor (40 %) to ALW (85 %) to cloud droplets (100 %) suggests that oxidation in the aqueous phase was important.
A new all-Teflon flow cell reactor was developed to study (i) secondary aerosol formation from gas- and aqueous-phase chemistry and (ii) changes in aerosols resulting from cloud processing or exposure to simulated solar or other light sources. To date, the Accelerated Production and Processing of Aerosols (APPA) reactor has primarily been used as an oxidation flow reactor, with the photolysis of externally generated O3 providing an OH exposure of between 8 × 10¹⁰ and 1.2 × 10¹² molec. cm−3 s over the ∼ 150 s mean gas residence time. The geometry, inlet and outlet designs, and tight temperature control result in minimal mixing and a narrow residence time distribution. The most unique aspect of the reactor is the ability to vary the liquid water content present in aqueous aerosol or ∼ 3.3 µm diameter cloud droplets that are formed on monodisperse seed particles and flow through the reactor together with the O3, OH, and reactive precursor gases. A set of measurements for a prescribed gas mixture or ambient air can thus investigate the amount, properties, and composition of secondary aerosol formed across a matrix of conditions spanning both OHexp and RH/LWC. The experimental system is fully automated and designed for continuous operation over extended periods of time. A series of experiments and numerical simulations summarized here explored the characteristics and capabilities of the reactor system. Example results reported here provide a preview into ongoing work investigating the roles of aerosol liquid water and cloud water in aerosol formation for (i) a range of organic precursor gases and (ii) ambient air over multi-week sampling periods.
Data presented in this work are available from the corresponding author upon request.
The Supplement includes a file with a table, several figures, and a compressed folder that contains the KinSim mechanism and case files for the results shown in Figs. S6 and S7. The supplement related to this article is available online at: https://doi.org/10.5194/amt-17-4227-2024-supplement.
DoRC designed the reactor and edited the paper. NX performed the experiments and simulations, processed the data, and wrote the paper. CL, DaRC, KC, and YHL contributed to some of the experiments and data analysis.
The contact author has declared that none of the authors has any competing interests.
Publisher's note: Copernicus Publications remains neutral with regard to jurisdictional claims made in the text, published maps, institutional affiliations, or any other geographical representation in this paper. While Copernicus Publications makes every effort to include appropriate place names, the final responsibility lies with the authors.
The authors thank Joshua Santarpia of the University of Nebraska Medical Center for his recommendations on the design and operation of the APPA. The authors also thank Alija Kabir for her assistance in construction and testing of the APPA.
This paper was edited by Pierre Herckes and reviewed by two anonymous referees.
Ahlberg, E., Falk, J., Eriksson, A., Holst, T., Brune, W. H., Kristensson, A., Roldin, P., and Svenningsson, B.: Secondary organic aerosol from VOC mixtures in an oxidation flow reactor, Atmos. Environ., 161, 210–220, 2017.
Akimoto, H.: Global air quality and pollution, Science, 302, 1716–1719, 2003.
Andreae, M. and Rosenfeld, D.: Aerosol–cloud–precipitation interactions. Part 1. The nature and sources of cloud-active aerosols, Earth-Sci. Rev., 89, 13–41, 2008.
Beder, E., Bass, C., and Shackleford, W.: Transmissivity and absorption of fused quartz between 0.22 µ and 3.5 µ from room temperature to 1500 °C, Appl. Optics, 10, 2263–2268, 1971.
Berndt, T., Böge, O., and Stratmann, F.: Atmospheric H2SO4/H2O Particle Formation: Mechanistic Investigations, in: Nucleation and Atmospheric Aerosols, Springer, 69–72, https://doi.org/10.1007/978-1-4020-6475-3_13, 2007.
Bianchi, F., Kurteìn, T., Riva, M., Mohr, C., Rissanen, M. P., Roldin, P., Berndt, T., Crounse, J. D., Wennberg, P. O., and Mentel, T. F.: Highly oxygenated organic molecules (HOM) from gas-phase autoxidation involving peroxy radicals: A key contributor to atmospheric aerosol, Chem. Rev., 119, 3472–3509, 2019.
Blando, J. D. and Turpin, B. J.: Secondary organic aerosol formation in cloud and fog droplets: a literature evaluation of plausibility, Atmos. Environ., 34, 1623–1632, 2000.
Brown, J. A.: An internet database for the classification and dissemination of information about hazardous chemicals and occupational diseases, Am. J. Ind. Med., 51, 428–435, 2008.
Budisulistiorini, S. H., Nenes, A., Carlton, A. G., Surratt, J. D., McNeill, V. F., and Pye, H. O.: Simulating aqueous-phase isoprene-epoxydiol (IEPOX) secondary organic aerosol production during the 2013 Southern Oxidant and Aerosol Study (SOAS), Environ. Sci. Technol., 51, 5026–5034, 2017.
Caffrey, P., Hoppel, W., Frick, G., Pasternack, L., Fitzgerald, J., Hegg, D., Gao, S., Leaitch, R., Shantz, N., and Albrechcinski, T.: In-cloud oxidation of SO2 by O3 and H2O2: Cloud chamber measurements and modeling of particle growth, J. Geophys. Res.-Atmos., 106, 27587–27601, 2001.
Canagaratna, M., Jayne, J., Jimenez, J., Allan, J., Alfarra, M., Zhang, Q., Onasch, T., Drewnick, F., Coe, H., and Middlebrook, A.: Chemical and microphysical characterization of ambient aerosols with the aerodyne aerosol mass spectrometer, Mass Spectrom. Rev., 26, 185–222, 2007.
Cao, J., Wang, Q., Li, L., Zhang, Y., Tian, J., Chen, L. A., Ho, S. S. H., Wang, X., Chow, J. C., and Watson, J. G.: Evaluation of the oxidation flow reactor for particulate matter emission limit certification, Atmos. Environ., 224, 117086, https://doi.org/10.1016/j.atmosenv.2019.117086, 2020.
Carlton, A. G., Turpin, B. J., Lim, H. J., Altieri, K. E., and Seitzinger, S.: Link between isoprene and secondary organic aerosol (SOA): Pyruvic acid oxidation yields low volatility organic acids in clouds, Geophys. Res. Lett., 33, L06822, https://doi.org/10.1029/2005GL025374, 2006.
Carlton, A. G., Turpin, B. J., Altieri, K. E., Seitzinger, S., Reff, A., Lim, H.-J., and Ervens, B.: Atmospheric oxalic acid and SOA production from glyoxal: Results of aqueous photooxidation experiments, Atmos. Environ., 41, 7588–7602, 2007.
Carlton, A. G., Turpin, B. J., Altieri, K. E., Seitzinger, S. P., Mathur, R., Roselle, S. J., and Weber, R. J.: CMAQ model performance enhanced when in-cloud secondary organic aerosol is included: comparisons of organic carbon predictions with measurements, Environ. Sci. Technol., 42, 8798–8802, 2008.
Chhabra, P. S., Ng, N. L., Canagaratna, M. R., Corrigan, A. L., Russell, L. M., Worsnop, D. R., Flagan, R. C., and Seinfeld, J. H.: Elemental composition and oxidation of chamber organic aerosol, Atmos. Chem. Phys., 11, 8827–8845, https://doi.org/10.5194/acp-11-8827-2011, 2011.
DeCarlo, P. F., Kimmel, J. R., Trimborn, A., Northway, M. J., Jayne, J. T., Aiken, A. C., Gonin, M., Fuhrer, K., Horvath, T., and Docherty, K. S.: Field-deployable, high-resolution, time-of-flight aerosol mass spectrometer, Anal. Chem., 78, 8281–8289, 2006.
De Haan, D. O., Corrigan, A. L., Tolbert, M. A., Jimenez, J. L., Wood, S. E., and Turley, J. J.: Secondary organic aerosol formation by self-reactions of methylglyoxal and glyoxal in evaporating droplets, Environ. Sci. Technol., 43, 8184–8190, 2009.
Docherty, K. S., Stone, E. A., Ulbrich, I. M., DeCarlo, P. F., Snyder, D. C., Schauer, J. J., Peltier, R. E., Weber, R. J., Murphy, S. M., and Seinfeld, J. H.: Apportionment of primary and secondary organic aerosols in Southern California during the 2005 Study of Organic Aerosols in Riverside (SOAR-1), Environ. Sci. Technol., 42, 7655–7662, 2008.
Ehn, M., Thornton, J. A., Kleist, E., Sipilä, M., Junninen, H., Pullinen, I., Springer, M., Rubach, F., Tillmann, R., and Lee, B.: A large source of low-volatility secondary organic aerosol, Nature, 506, 476–479, 2014.
Eiguren Fernandez, A., Lewis, G. S., and Hering, S. V.: Design and laboratory evaluation of a sequential spot sampler for time-resolved measurement of airborne particle composition, Aerosol Sci. Tech., 48, 655–663, 2014.
Ervens, B. and Volkamer, R.: Glyoxal processing by aerosol multiphase chemistry: towards a kinetic modeling framework of secondary organic aerosol formation in aqueous particles, Atmos. Chem. Phys., 10, 8219–8244, https://doi.org/10.5194/acp-10-8219-2010, 2010.
Ervens, B., Turpin, B. J., and Weber, R. J.: Secondary organic aerosol formation in cloud droplets and aqueous particles (aqSOA): a review of laboratory, field and model studies, Atmos. Chem. Phys., 11, 11069–11102, https://doi.org/10.5194/acp-11-11069-2011, 2011.
Freney, E. J., Martin, S. T., and Buseck, P. R.: Deliquescence and efflorescence of potassium salts relevant to biomass-burning aerosol particles, Aerosol Sci. Tech., 43, 799–807, 2009.
Froyd, K. D., Murphy, D. M., Sanford, T. J., Thomson, D. S., Wilson, J. C., Pfister, L., and Lait, L.: Aerosol composition of the tropical upper troposphere, Atmos. Chem. Phys., 9, 4363–4385, https://doi.org/10.5194/acp-9-4363-2009, 2009.
Galloway, M. M., Powelson, M. H., Sedehi, N., Wood, S. E., Millage, K. D., Kononenko, J. A., Rynaski, A. D., and De Haan, D. O.: Secondary organic aerosol formation during evaporation of droplets containing atmospheric aldehydes, amines, and ammonium sulfate, Environ. Sci. Technol., 48, 14417–14425, 2014.
Ge, W., Liu, J., Yi, K., Xu, J., Zhang, Y., Hu, X., Ma, J., Wang, X., Wan, Y., Hu, J., Zhang, Z., Wang, X., and Tao, S.: Influence of atmospheric in-cloud aqueous-phase chemistry on the global simulation of SO2 in CESM2, Atmos. Chem. Phys., 21, 16093–16120, https://doi.org/10.5194/acp-21-16093-2021, 2021.
George, I. J., Vlasenko, A., Slowik, J. G., Broekhuizen, K., and Abbatt, J. P. D.: Heterogeneous oxidation of saturated organic aerosols by hydroxyl radicals: uptake kinetics, condensed-phase products, and particle size change, Atmos. Chem. Phys., 7, 4187–4201, https://doi.org/10.5194/acp-7-4187-2007, 2007.
Gilardoni, S., Massoli, P., Paglione, M., Giulianelli, L., Carbone, C., Rinaldi, M., Decesari, S., Sandrini, S., Costabile, F., Gobbi, G. P., Pietrogrande, M. C., Visentin, M., Scotto, F., Fuzzi, S., and Facchini, M. C.: Direct observation of aqueous secondary organic aerosol from biomass-burning emissions, P. Natl. Acad. Sci. USA, 113, 10013–10018, https://doi.org/10.1073/pnas.1602212113, 2016.
Guo, J., Wang, Y., Shen, X., Wang, Z., Lee, T., Wang, X., Li, P., Sun, M., Collett Jr, J. L., and Wang, W.: Characterization of cloud water chemistry at Mount Tai, China: Seasonal variation, anthropogenic impact, and cloud processing, Atmos. Environ., 60, 467–476, 2012.
Hallquist, M., Wenger, J. C., Baltensperger, U., Rudich, Y., Simpson, D., Claeys, M., Dommen, J., Donahue, N. M., George, C., Goldstein, A. H., Hamilton, J. F., Herrmann, H., Hoffmann, T., Iinuma, Y., Jang, M., Jenkin, M. E., Jimenez, J. L., Kiendler-Scharr, A., Maenhaut, W., McFiggans, G., Mentel, Th. F., Monod, A., Prévôt, A. S. H., Seinfeld, J. H., Surratt, J. D., Szmigielski, R., and Wildt, J.: The formation, properties and impact of secondary organic aerosol: current and emerging issues, Atmos. Chem. Phys., 9, 5155–5236, https://doi.org/10.5194/acp-9-5155-2009, 2009.
Hering, S. V. and Stolzenburg, M. R.: A method for particle size amplification by water condensation in a laminar, thermally diffusive flow, Aerosol Sci. Tech., 39, 428–436, 2005.
Hering, S. V., Spielman, S. R., and Lewis, G. S.: Moderated, water-based, condensational particle growth in a laminar flow, Aerosol Sci. Tech., 48, 401–408, 2014.
Hofzumahaus, A., Kraus, A., and Müller, M.: Solar actinic flux spectroradiometry: A technique for measuring photolysis frequencies in the atmosphere, Appl. Optics, 38, 4443–4460, 1999.
Hoyle, C. R., Fuchs, C., Järvinen, E., Saathoff, H., Dias, A., El Haddad, I., Gysel, M., Coburn, S. C., Tröstl, J., Bernhammer, A.-K., Bianchi, F., Breitenlechner, M., Corbin, J. C., Craven, J., Donahue, N. M., Duplissy, J., Ehrhart, S., Frege, C., Gordon, H., Höppel, N., Heinritzi, M., Kristensen, T. B., Molteni, U., Nichman, L., Pinterich, T., Prévôt, A. S. H., Simon, M., Slowik, J. G., Steiner, G., Tomé, A., Vogel, A. L., Volkamer, R., Wagner, A. C., Wagner, R., Wexler, A. S., Williamson, C., Winkler, P. M., Yan, C., Amorim, A., Dommen, J., Curtius, J., Gallagher, M. W., Flagan, R. C., Hansel, A., Kirkby, J., Kulmala, M., Möhler, O., Stratmann, F., Worsnop, D. R., and Baltensperger, U.: Aqueous phase oxidation of sulphur dioxide by ozone in cloud droplets, Atmos. Chem. Phys., 16, 1693–1712, https://doi.org/10.5194/acp-16-1693-2016, 2016.
Huang, Y., Coggon, M. M., Zhao, R., Lignell, H., Bauer, M. U., Flagan, R. C., and Seinfeld, J. H.: The Caltech Photooxidation Flow Tube reactor: design, fluid dynamics and characterization, Atmos. Meas. Tech., 10, 839–867, https://doi.org/10.5194/amt-10-839-2017, 2017.
Jimenez, J. L., Canagaratna, M., Donahue, N., Prevot, A., Zhang, Q., Kroll, J. H., DeCarlo, P. F., Allan, J. D., Coe, H., and Ng, N.: Evolution of organic aerosols in the atmosphere, Science, 326, 1525–1529, 2009.
Kanakidou, M., Seinfeld, J. H., Pandis, S. N., Barnes, I., Dentener, F. J., Facchini, M. C., Van Dingenen, R., Ervens, B., Nenes, A., Nielsen, C. J., Swietlicki, E., Putaud, J. P., Balkanski, Y., Fuzzi, S., Horth, J., Moortgat, G. K., Winterhalter, R., Myhre, C. E. L., Tsigaridis, K., Vignati, E., Stephanou, E. G., and Wilson, J.: Organic aerosol and global climate modelling: a review, Atmos. Chem. Phys., 5, 1053–1123, https://doi.org/10.5194/acp-5-1053-2005, 2005.
Kang, E., Root, M. J., Toohey, D. W., and Brune, W. H.: Introducing the concept of Potential Aerosol Mass (PAM), Atmos. Chem. Phys., 7, 5727–5744, https://doi.org/10.5194/acp-7-5727-2007, 2007.
Kaur, R. and Anastasio, C.: First measurements of organic triplet excited states in atmospheric waters, Environ. Sci. Technol., 52, 5218–5226, 2018.
Keller, A. and Burtscher, H.: A continuous photo-oxidation flow reactor for a defined measurement of the SOA formation potential of wood burning emissions, J. Aerosol Sci., 49, 9–20, 2012.
Knopf, D. A., Alpert, P. A., and Wang, B.: The role of organic aerosol in atmospheric ice nucleation: a review, ACS Earth Space Chem., 2, 168–202, 2018.
Kylling, A., Webb, A., Bais, A., Blumthaler, M., Schmitt, R., Thiel, S., Kazantzidis, A., Kift, R., Misslbeck, M., and Schallhart, B.: Actinic flux determination from measurements of irradiance, J. Geophys. Res.-Atmos., 108, 4506, https://doi.org/10.1029/2002JD003236, 2003.
Lambe, A. T., Ahern, A. T., Williams, L. R., Slowik, J. G., Wong, J. P. S., Abbatt, J. P. D., Brune, W. H., Ng, N. L., Wright, J. P., Croasdale, D. R., Worsnop, D. R., Davidovits, P., and Onasch, T. B.: Characterization of aerosol photooxidation flow reactors: heterogeneous oxidation, secondary organic aerosol formation and cloud condensation nuclei activity measurements, Atmos. Meas. Tech., 4, 445–461, https://doi.org/10.5194/amt-4-445-2011, 2011.
Lamkaddam, H., Dommen, J., Ranjithkumar, A., Gordon, H., Wehrle, G., Krechmer, J., Majluf, F., Salionov, D., Schmale, J., and Bjelić, S.: Large contribution to secondary organic aerosol from isoprene cloud chemistry, Science Advances, 7, eabe2952, https://doi.org/10.1126/sciadv.abe2952, 2021.
Lewis, G. S. and Hering, S. V.: Minimizing concentration effects in water-based, laminar-flow condensation particle counters, Aerosol Sci. Tech., 47, 645–654, 2013.
Li, K., Liggio, J., Lee, P., Han, C., Liu, Q., and Li, S.-M.: Secondary organic aerosol formation from α-pinene, alkanes, and oil-sands-related precursors in a new oxidation flow reactor, Atmos. Chem. Phys., 19, 9715–9731, https://doi.org/10.5194/acp-19-9715-2019, 2019.
Li, R., Palm, B. B., Ortega, A. M., Hlywiak, J., Hu, W., Peng, Z., Day, D. A., Knote, C., Brune, W. H., and De Gouw, J. A.: Modeling the radical chemistry in an oxidation flow reactor: Radical formation and recycling, sensitivities, and the OH exposure estimation equation, J. Phys. Chem. A, 119, 4418–4432, 2015.
Lim, H.-J., Carlton, A. G., and Turpin, B. J.: Isoprene forms secondary organic aerosol through cloud processing: Model simulations, Environ. Sci. Technol., 39, 4441–4446, 2005.
Lim, Y. B., Tan, Y., Perri, M. J., Seitzinger, S. P., and Turpin, B. J.: Aqueous chemistry and its role in secondary organic aerosol (SOA) formation, Atmos. Chem. Phys., 10, 10521–10539, https://doi.org/10.5194/acp-10-10521-2010, 2010.
Lim, Y. B., Tan, Y., and Turpin, B. J.: Chemical insights, explicit chemistry, and yields of secondary organic aerosol from OH radical oxidation of methylglyoxal and glyoxal in the aqueous phase, Atmos. Chem. Phys., 13, 8651–8667, https://doi.org/10.5194/acp-13-8651-2013, 2013.
Lin, G., Sillman, S., Penner, J. E., and Ito, A.: Global modeling of SOA: the use of different mechanisms for aqueous-phase formation, Atmos. Chem. Phys., 14, 5451–5475, https://doi.org/10.5194/acp-14-5451-2014, 2014.
Litjens, R. A., Quickenden, T. I., and Freeman, C. G.: Visible and near-ultraviolet absorption spectrum of liquid water, Appl. Optics, 38, 1216–1223, 1999.
Liu, T., Clegg, S. L., and Abbatt, J. P.: Fast oxidation of sulfur dioxide by hydrogen peroxide in deliquesced aerosol particles, P. Natl. Acad. Sci. USA, 117, 1354–1359, 2020.
Liu, Y., Monod, A., Tritscher, T., Praplan, A. P., DeCarlo, P. F., Temime-Roussel, B., Quivet, E., Marchand, N., Dommen, J., and Baltensperger, U.: Aqueous phase processing of secondary organic aerosol from isoprene photooxidation, Atmos. Chem. Phys., 12, 5879–5895, https://doi.org/10.5194/acp-12-5879-2012, 2012a.
Liu, Y., Siekmann, F., Renard, P., El Zein, A., Salque, G., El Haddad, I., Temime-Roussel, B., Voisin, D., Thissen, R., and Monod, A.: Oligomer and SOA formation through aqueous phase photooxidation of methacrolein and methyl vinyl ketone, Atmos. Environ., 49, 123–129, 2012b.
Ma, P., Quan, J., Jia, X., Liao, Z., Wang, Q., Cheng, Z., Dou, Y., Su, J., and Pan, Y.: Effects of ozone and relative humidity in secondary inorganic aerosol formation during haze events in Beijing, China, Atmos. Res., 264, 105855, https://doi.org/10.1016/j.atmosres.2021.105855, 2021.
McNeill, V. F.: Aqueous organic chemistry in the atmosphere: Sources and chemical processing of organic aerosols, Environ. Sci. Technol., 49, 1237–1244, https://doi.org/10.1021/es5043707, 2015.
McNeill, V. F., Woo, J. L., Kim, D. D., Schwier, A. N., Wannell, N. J., Sumner, A. J., and Barakat, J. M.: Aqueous-phase secondary organic aerosol and organosulfate formation in atmospheric aerosols: a modeling study, Environ. Sci. Technol., 46, 8075–8081, 2012.
Mitroo, D., Sun, Y., Combest, D. P., Kumar, P., and Williams, B. J.: Assessing the degree of plug flow in oxidation flow reactors (OFRs): a study on a potential aerosol mass (PAM) reactor, Atmos. Meas. Tech., 11, 1741–1756, https://doi.org/10.5194/amt-11-1741-2018, 2018.
Myhre, G., Myhre, C., Samset, B., and Storelvmo, T.: Aerosols and their relation to global climate and climate sensitivity, Nature Education Knowledge, 4, 7, http://www.nature.com/scitable/knowledge/library/aerosols-and-their-relation-to-global-climate-102215345 (last access: October 2022), 2013.
Nakao, S., Clark, C., Tang, P., Sato, K., and Cocker III, D.: Secondary organic aerosol formation from phenolic compounds in the absence of NOx, Atmos. Chem. Phys., 11, 10649–10660, https://doi.org/10.5194/acp-11-10649-2011, 2011.
Ortega, A. M., Day, D. A., Cubison, M. J., Brune, W. H., Bon, D., de Gouw, J. A., and Jimenez, J. L.: Secondary organic aerosol formation and primary organic aerosol oxidation from biomass-burning smoke in a flow reactor during FLAME-3, Atmos. Chem. Phys., 13, 11551–11571, https://doi.org/10.5194/acp-13-11551-2013, 2013.
Peng, J., Hu, M., Guo, S., Du, Z., Shang, D., Zheng, J., Zheng, J., Zeng, L., Shao, M., Wu, Y., Collins, D., and Zhang, R.: Ageing and hygroscopicity variation of black carbon particles in Beijing measured by a quasi-atmospheric aerosol evolution study (QUALITY) chamber, Atmos. Chem. Phys., 17, 10333–10348, https://doi.org/10.5194/acp-17-10333-2017, 2017.
Peng, Z. and Jimenez, J. L.: KinSim: a research-grade, user-friendly, visual kinetics simulator for chemical-kinetics and environmental-chemistry teaching, J. Chem. Educ. 96, 806–811, https://doi.org/10.1021/acs.jchemed.9b00033, 2019.
Peng, Z., Day, D. A., Stark, H., Li, R., Lee-Taylor, J., Palm, B. B., Brune, W. H., and Jimenez, J. L.: HOx radical chemistry in oxidation flow reactors with low-pressure mercury lamps systematically examined by modeling, Atmos. Meas. Tech., 8, 4863–4890, https://doi.org/10.5194/amt-8-4863-2015, 2015.
Peng, Z., Day, D. A., Ortega, A. M., Palm, B. B., Hu, W., Stark, H., Li, R., Tsigaridis, K., Brune, W. H., and Jimenez, J. L.: Non-OH chemistry in oxidation flow reactors for the study of atmospheric chemistry systematically examined by modeling, Atmos. Chem. Phys., 16, 4283–4305, https://doi.org/10.5194/acp-16-4283-2016, 2016.
Perri, M. J., Seitzinger, S., and Turpin, B. J.: Secondary organic aerosol production from aqueous photooxidation of glycolaldehyde: Laboratory experiments, Atmos. Environ., 43, 1487–1497, 2009.
Reinhardt, A., Emmenegger, C., Gerrits, B., Panse, C., Dommen, J., Baltensperger, U., Zenobi, R., and Kalberer, M.: Ultrahigh mass resolution and accurate mass measurements as a tool to characterize oligomers in secondary organic aerosols, Anal. Chem., 79, 4074–4082, 2007.
Salcedo, D., Onasch, T. B., Dzepina, K., Canagaratna, M. R., Zhang, Q., Huffman, J. A., DeCarlo, P. F., Jayne, J. T., Mortimer, P., Worsnop, D. R., Kolb, C. E., Johnson, K. S., Zuberi, B., Marr, L. C., Volkamer, R., Molina, L. T., Molina, M. J., Cardenas, B., Bernabé, R. M., Márquez, C., Gaffney, J. S., Marley, N. A., Laskin, A., Shutthanandan, V., Xie, Y., Brune, W., Lesher, R., Shirley, T., and Jimenez, J. L.: Characterization of ambient aerosols in Mexico City during the MCMA-2003 campaign with Aerosol Mass Spectrometry: results from the CENICA Supersite, Atmos. Chem. Phys., 6, 925–946, https://doi.org/10.5194/acp-6-925-2006, 2006.
Schnitzler, E. G., Dutt, A., Charbonneau, A. M., Olfert, J. S., and Jäger, W.: Soot aggregate restructuring due to coatings of secondary organic aerosol derived from aromatic precursors, Environ. Sci. Technol., 48, 14309–14316, 2014.
Schroder, J., Campuzano-Jost, P., Day, D., Shah, V., Larson, K., Sommers, J., Sullivan, A., Campos, T., Reeves, J., and Hills, A.: Sources and secondary production of organic aerosols in the northeastern United States during WINTER, J. Geophys. Res.-Atmos., 123, 7771–7796, 2018.
Seinfeld, J. H. and Pandis, S. N.: Atmospheric chemistry and physics: from air pollution to climate change, John Wiley & Sons, ISBN 978-1-118-94740-1, 2016.
Shiraiwa, M., Li, Y., Tsimpidi, A. P., Karydis, V. A., Berkemeier, T., Pandis, S. N., Lelieveld, J., Koop, T., and Pöschl, U.: Global distribution of particle phase state in atmospheric secondary organic aerosols, Nat. Commun., 8, 1–7, 2017.
Shrivastava, M., Cappa, C. D., Fan, J., Goldstein, A. H., Guenther, A. B., Jimenez, J. L., Kuang, C., Laskin, A., Martin, S. T., and Ng, N. L.: Recent advances in understanding secondary organic aerosol: Implications for global climate forcing, Rev. Geophys., 55, 509–559, 2017.
Simonen, P., Saukko, E., Karjalainen, P., Timonen, H., Bloss, M., Aakko-Saksa, P., Rönkkö, T., Keskinen, J., and Dal Maso, M.: A new oxidation flow reactor for measuring secondary aerosol formation of rapidly changing emission sources, Atmos. Meas. Tech., 10, 1519–1537, https://doi.org/10.5194/amt-10-1519-2017, 2017.
Smith, J. D., Sio, V., Yu, L., Zhang, Q., and Anastasio, C.: Secondary organic aerosol production from aqueous reactions of atmospheric phenols with an organic triplet excited state, Environ. Sci. Technol., 48, 1049–1057, 2014.
Smith, J. D., Kinney, H., and Anastasio, C.: Aqueous benzene-diols react with an organic triplet excited state and hydroxyl radical to form secondary organic aerosol, Phys. Chem. Chem. Phys., 17, 10227–10237, 2015.
Spracklen, D. V., Jimenez, J. L., Carslaw, K. S., Worsnop, D. R., Evans, M. J., Mann, G. W., Zhang, Q., Canagaratna, M. R., Allan, J., Coe, H., McFiggans, G., Rap, A., and Forster, P.: Aerosol mass spectrometer constraint on the global secondary organic aerosol budget, Atmos. Chem. Phys., 11, 12109–12136, https://doi.org/10.5194/acp-11-12109-2011, 2011.
Stolzenburg, M., Kreisberg, N., and Hering, S.: Atmospheric size distributions measured by differential mobility optical particle size spectrometry, Aerosol Sci. Tech., 29, 402–418, 1998.
Tsui, W. G., Rao, Y., Dai, H.-L., and McNeill, V. F.: Modeling photosensitized secondary organic aerosol formation in laboratory and ambient aerosols, Environ. Sci. Technol., 51, 7496–7501, 2017.
Volkamer, R., Platt, U., and Wirtz, K.: Primary and secondary glyoxal formation from aromatics: experimental evidence for the bicycloalkyl- radical pathway from benzene, toluene, and p-xylene, J. Phys. Chem. A, 105, 7865–7874, 2001.
Volkamer, R., Ziemann, P. J., and Molina, M. J.: Secondary Organic Aerosol Formation from Acetylene (C2H2): seed effect on SOA yields due to organic photochemistry in the aerosol aqueous phase, Atmos. Chem. Phys., 9, 1907–1928, https://doi.org/10.5194/acp-9-1907-2009, 2009.
Wang, J., Doussin, J. F., Perrier, S., Perraudin, E., Katrib, Y., Pangui, E., and Picquet-Varrault, B.: Design of a new multi-phase experimental simulation chamber for atmospheric photosmog, aerosol and cloud chemistry research, Atmos. Meas. Tech., 4, 2465–2494, https://doi.org/10.5194/amt-4-2465-2011, 2011.
Wang, S., Wang, L., Wang, N., Ma, S., Su, F., and Zhang, R.: Formation of droplet-mode secondary inorganic aerosol dominated the increased PM2.5 during both local and transport haze episodes in Zhengzhou, China, Chemosphere, 269, 128744, https://doi.org/10.1016/j.chemosphere.2020.128744, 2021.
Warneck, P.: In-cloud chemistry opens pathway to the formation of oxalic acid in the marine atmosphere, Atmos. Environ., 37, 2423–2427, 2003.
Xu, N. and Collins, D. R.: Design and characterization of a new oxidation flow reactor for laboratory and long-term ambient studies, Atmos. Meas. Tech., 14, 2891–2906, https://doi.org/10.5194/amt-14-2891-2021, 2021.
Ye, Z., Zhuang, Y., Chen, Y., Zhao, Z., Ma, S., Huang, H., Chen, Y., and Ge, X.: Aqueous-phase oxidation of three phenolic compounds by hydroxyl radical: Insight into secondary organic aerosol formation yields, mechanisms, products and optical properties, Atmos. Environ., 223, 117240, https://doi.org/10.1016/j.atmosenv.2019.117240, 2020.