the Creative Commons Attribution 4.0 License.
the Creative Commons Attribution 4.0 License.
 | 25 Jul 2024
Aerosol optical property measurement using the orbiting high-spectral-resolution lidar on board the DQ-1 satellite: retrieval and validation
Chenxing Zha
Lingbing Bu
Zhi Li
Qin Wang
Ahmad Mubarak
Pasindu Liyanage
Jiqiao Liu
Weibiao Chen
The Atmospheric Environment Monitoring Satellite (AEMS), also called Daqi-1 or DQ-1, was launched in April 2022; one of its main payloads is a high-spectral-resolution lidar (HSRL) system. This new system enables the accurate measurements of global aerosol optical properties, which can be used in the geoscientific community after the retirement of the Cloud-Aerosol Lidar and Infrared Pathfinder Satellite Observation (CALIPSO) satellite. Developing a suitable retrieval algorithm and validating retrieved results are necessary. This research demonstrates a retrieval algorithm for aerosol optical properties using the DQ-1 HSRL system. This method has retrieved the aerosol linear depolarization ratio, backscatter coefficient, extinction coefficient, and optical depth. For validation purposes, we compared retrieved results with those obtained through CALIPSO. The results indicate that the profiles of the two datasets are in good agreement, with DQ-1 showing an improved signal-to-noise ratio (SNR). Optical property profiles from National Aeronautics and Space Administration (NASA) Micro-Pulse Lidar Network (MPLNET) stations were selected for validation with the DQ-1 measurements, resulting in a relative error of 25 %. Between June 2022 and December 2022, aerosol optical depth measurements using the DQ-1 satellite and the AErosol RObotic NETwork (AERONET) were correlated and yielded a value of R2 equal to 0.803. We use the DQ-1 dataset to initially investigate the transport processes of the Saharan dust and the South Atlantic volcanic aerosols. These validations and applications show that the DQ-1 HSRL system can accurately measure global aerosols and has significant potential for Earth scientific applications.
- Article
(10691 KB) - Full-text XML
- BibTeX
- EndNote


Aerosols are tiny solid and liquid particles suspended in the atmosphere; an atmospheric aerosol particle typically ranges from 0.01 to 10 µm in diameter. The Earth's radiation balance is influenced by aerosols' capability to scatter and absorb radiation. Similarly, as cloud condensation nuclei, aerosols influence cloud formation and affect global climate change (Kaufman et al., 2002). The aerosol optical properties can be used to study the abovementioned scientific phenomena. Lidar, as an active remote sensing instrument, can obtain aerosol optical parameters at a high spatial and temporal resolution. Based on the various observation approaches, lidar can be divided into ground-based lidar, airborne lidar, and spaceborne lidar. Typical examples of ground-based lidar include the European Aerosol Research Lidar Network (EARLINET) (Pappalardo et al., 2014; Guibert et al., 2005), the Micro-Pulse Lidar Network (MPLNET) (Welton et al., 2001), and the Asian Dust and Aerosol Lidar Observation Network (AD-Net) (Nishizawa et al., 2016), among others. There are several advantages of ground-based lidar: easy maintenance of the instrument and long-term stable observation of specific areas. The life cycle and evolution process of aerosols can be studied through ground-based lidar systems. Furthermore, it is beneficial to validate spaceborne and airborne measurements with ground-based lidar systems (Pitari et al., 2013; Mattis et al., 2004). The disadvantage of ground-based observation includes limited spatial coverage capability, which makes it impossible to carry out large-scale continuous observation. The airborne lidar system enables extensive and continuous observations over a wide range, thereby compensating for the limitations associated with ground-based systems. Typical examples of airborne lidar include the National Aeronautics and Space Administration (NASA) Langley airborne High Spectral Resolution Lidar (HSRL-1) and the Langley airborne High Spectral Resolution Lidar – Generation 2 (HSRL-2). The two airborne lidar experiments were conducted to observe aerosol optical properties quantitatively and to investigate the impact of aerosols on radiation, clouds, and air quality (Knobelspiesse et al., 2011; Burton et al., 2012a, b). The German Aerospace Center (DLR) has also developed an airborne high-spectral-resolution lidar (HSRL) system to measure aerosol optical properties and types (Esselborn et al., 2008; Groß et al., 2013). The Shanghai Institute of Optics and Fine Mechanics (SIOM) of the Chinese Academy of Sciences, in collaboration with Nanjing University of Information Science and Technology (NUIST), Zhejiang University (ZJU), and other institutions, has conducted observational experiments on airborne HSRL system at two distinct geographical locations, Dunhuang and Shanhaiguan. This airborne system is a scaled system of the DQ-1 HSRL. The aerosol optical parameters in these two regions obtained by the HSRL system were validated using CALIPSO, the ground-based Micro-Pulse Lidar Network (MPLNET), and sun photometers. An analysis was conducted on the sources, sinks, and types of aerosols in the local area (Wang et al., 2020; Xu et al., 2020; Zhu et al., 2021; Juxin et al., 2023; Changzhe et al., 2023). The airborne lidar system addresses the shortcomings of ground-based observations. Nevertheless, the system's observations are limited by factors such as flight paths and meteorological conditions preventing prolonged data collection and long-term observations and low spatiotemporal resolution making it impossible to observe the microscale system.
Global information about aerosol optical parameters is vital to familiarizing with aerosol sources and sinks. This global information is valuable for tracking aerosol particle dispersion pathways and compensates for the limitations of ground-based and airborne observations. Although satellite observations have the drawbacks of low temporal and spatial resolutions, as well as long revisit periods, they can obtain global aerosol optical parameters (Qin et al., 2016; Huang et al., 2008). With space technology's advancement, several spaceborne lidar systems have been developed. The Cloud-Aerosol Lidar and Infrared Pathfinder Satellite Observation (CALIPSO) satellite, developed by NASA, is the most representative spaceborne lidar satellite. Since its launch in 2006, it has been fully verified by comparing its dataset with other multi-source datasets (Bibi et al., 2015; Wang et al., 2016; McGill et al., 2007; Chiang et al., 2011). Investigation of and discrimination between clouds and aerosols, optical properties, aerosol types, and microphysical characteristics of the aerosol were performed. An advanced-level retrieval algorithm was developed to present an outstanding contribution to research on the optical properties and spatiotemporal distribution of aerosols globally (Getzewich et al., 2018; Vaughan et al., 2019; Winker et al., 2010; Z. Liu et al., 2019). Due to insufficient power (Langley Research Center, 2023), the CALIPSO science mission ended in August 2023; a well-established and developed new-generation spaceborne lidar is needed to replace CALIPSO for global aerosol observation. As a new-generation type of lidar, high-spectral-resolution lidars filter out the Mie scattering in return signals through a filter. This method avoids the assumptions made by traditional lidars during retrieval, resulting in more precise results (Hair et al., 2001). NASA has developed the Cloud-Aerosol Transport System (CATS) as a low-cost payload for the International Space Station (ISS). The system design incorporates a high-spectral-resolution lidar and elastic backscattering lidar. It has unveiled the characteristics of aerosols and clouds and their interactions. Similarly, it has conducted in-depth scientific observations in certain areas (Xiong et al., 2023; Proestakis et al., 2019; Yorks et al., 2016). In addition, the Atmospheric Laser Doppler Instrument (ALADIN) lidar loaded on Aeolus provides results of global aerosol optical parameters retrieved as L2A data and validated by comparison with ground-based lidar products (Abril-Gago et al., 2022). Furthermore, under the leadership of NASA, the Atmosphere Observing System (AOS) international program analyzes the additional value provided by a spaceborne HSRL system. This research has shown that the results of spaceborne HSRL systems are more accurate than the results of traditional elastic backscatter lidar in three different cases (Cornut et al., 2023). The European Space Agency (ESA) and the Japan Aerospace Exploration Agency (JAXA) collaborated on the development of Earth Cloud, Aerosol and Radiation Explorer (EarthCARE), equipped with the Atmospheric Lidar (ATLID). The primary objective of this mission is to observe and characterize clouds and aerosols, as well as to measure the infrared radiation emitted from the Earth's surface and the solar radiation reflected from the atmosphere. This satellite was launched on 29 May 2024 (Reverdy et al., 2015; Wehr et al., 2023). It is worth noting that, with the exception of EarthCARE, the abovementioned new spaceborne lidar satellites are in the planning stage and have not actually been launched. The previous observing satellites have stopped working, and now we are facing a gap in global aerosol data based on spaceborne lidar.
China launched the Atmospheric Environment Monitoring Satellite (AMES), also called Daqi-1 or DQ-1, from the Taiyuan Satellite Launch Center on 16 April 2022. The main payload is the Aerosol and Carbon dioxide Detection Lidar (ACDL), which includes a dual-polarization HSRL system based on an iodine vapor filter (D. Liu et al., 2019; Zheng et al., 2020; Dong et al., 2019). Prior to the launch of DQ-1, an airborne scaling system for ACDL was developed, deployed, and tested at two sites: Shanhaiguan and Dunhuang. The results ensure the feasibility of the scaling system and verify the accuracy of the observations (Wang et al., 2020; Xu et al., 2020; Zhu et al., 2021; Juxin et al., 2023; Changzhe et al., 2023). The successful operation of the airborne scaling system indicates the accurate design and observation of the DQ-1 system and provides a foundation for spaceborne retrieval algorithms. After the above-described operation, the DQ-1 satellite was launched into a 705 km orbit. Now, DQ-1 must establish a robust retrieval algorithm and conduct multi-source data validation on algorithmic outcomes, ensuring the system observation's precision.
In this work, we studied the aerosol optical parameter retrieval algorithm of the spaceborne HSRL system. This algorithm used the data of the attenuated backscatter coefficient of the perpendicularly polarized channel, parallel-polarized channel, and molecular scattering channel of the DQ-1 ACDL system. We used the atmospheric temperature and pressure data in the European Centre for Medium-Range Weather Forecasts Reanalysis v5 (ERA5) to calculate the molecular backscatter coefficient. The attenuated backscatter coefficient is first compared with the CALIPSO dataset to ensure the accuracy of instrument calibration. The retrieval results were then compared with the corresponding data products of CALIPSO and NASA MPLNET qualitatively. To ensure accuracy, the retrieved aerosol optical depth was compared to the corresponding data products of AERONET, and the errors were analyzed. The comparison results confirm the accuracy of the DQ-1 L2A datasets and retrieval algorithm. Lastly, we use data from DQ-1 to analyze the transport processes of Saharan dust and South Atlantic tropospheric volcanic aerosol. This primary application area indicates the scientific significance of the high-performance system introduced by the DQ-1 satellite in the context of global aerosol detection applications, rendering it an alternative approach to the CALIPSO satellite.
2.1 DQ-1 ACDL system
2.1.1 System overview
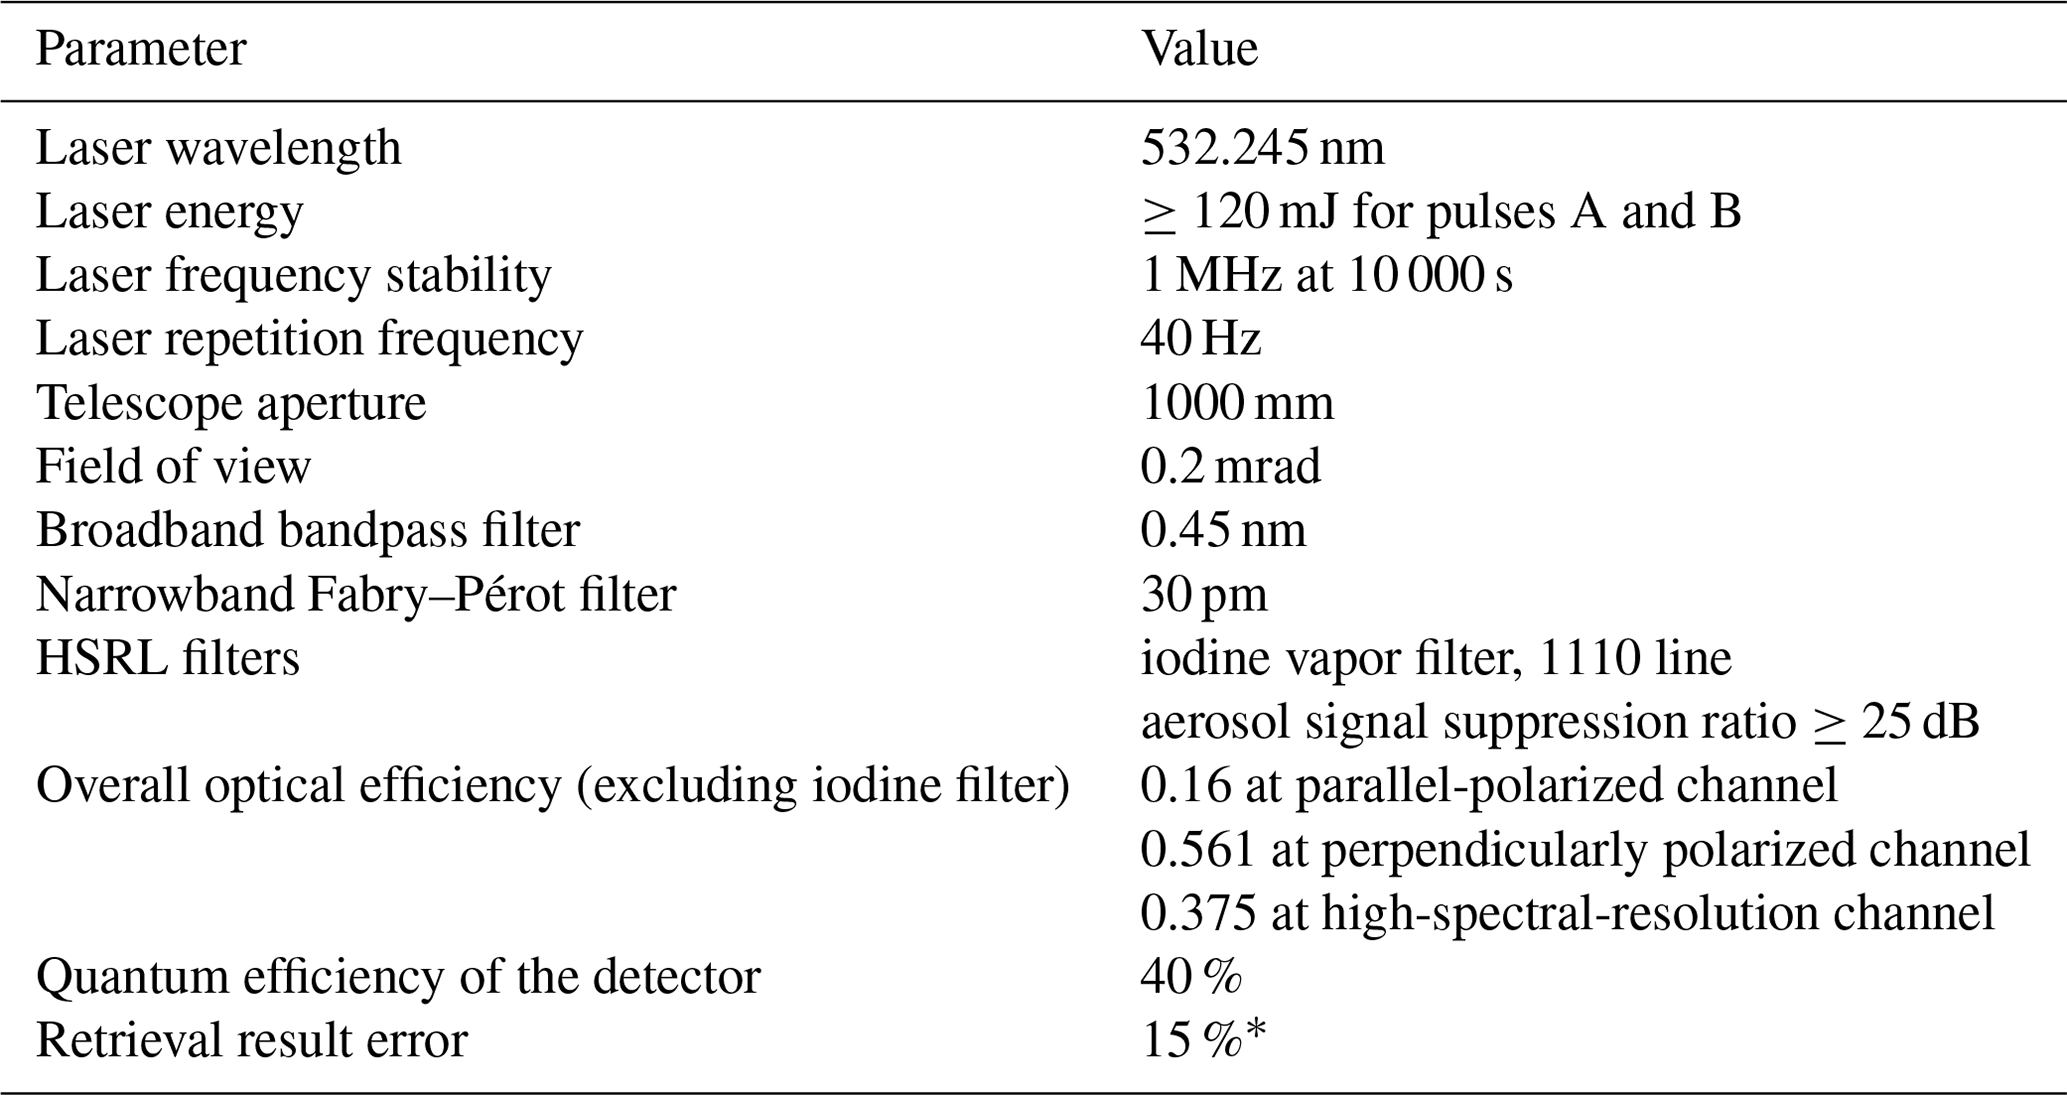
The ACDL system includes an integral path differential absorption (IPDA) lidar system and a high-spectral-resolution lidar (HSRL) system, capable of performing the integrated satellite-based detection of atmospheric aerosols, clouds, and carbon dioxide (Weibiao et al., 2023). The main parameters of the DQ-1 HSRL system are shown in Table 1. The laser beam of the HSRL system has a wavelength of 532.245 nm, a pulse repetition frequency of 40 Hz, and the absorption line of iodine molecules corresponding to line 1110 (Weibiao et al., 2023). The laser produces two distinct pulses, pulse A and pulse B, to observe the atmosphere practically; both of the pulses are normalized prior to the retrieval process. The laser beam is off-zenith, pointing at an angle of 2°, and remains steady due to the attitude control system. The optical system has a Cassegrain-type telescope with a primary mirror of 1 m diameter. The receiving system consists of three optical channels: the perpendicularly polarized channel, the parallel-polarized channel, and the high-spectral-resolution channel (Weibiao et al., 2023; Dai et al., 2023). The parallel and perpendicular channels serve the function of obtaining polarization information about the aerosol; a polarizing beam splitter (PBS) is placed to reduce polarization cross talk. To verify the accuracy of the parallel and perpendicular channels, we retrieved the depolarization ratio of atmospheric molecules at high altitude. The results, shown in Fig. 1, indicate that the depolarization ratio is 0.5 %, which confirms the accuracy of the two optical channels. The high-spectral-resolution channels function to separate Mie scattering and Rayleigh scattering in the signal, obtaining the molecular scattering profile. The measured absorption spectrum lines of the iodine vapor filter on ACDL are shown in Fig. 2a. The principle of aerosol scattering suppression by the iodine filter is also shown in Fig. 2a, based on the characteristic of aerosol Mie scattering spectra having a narrow bandwidth compared to those of molecular Rayleigh scattering, to eliminate aerosol scattering efficiently. Based on the previous simulation, the most suitable temperature, pressure, and length of the iodine filter were selected, resulting in a suppression ratio of 25 dB (Dong et al., 2018); this suppression ratio is sufficient to filter out the Mie scattering for subsequent retrieval. Figure 2b shows the comparison of signals before and after filtering, with no significant aerosol Mie scattering signal in the filtered signal and a residual portion of molecular Rayleigh scattering. The detector output signals obtained at three channels make up the L2A attenuated backscatter coefficients used in the retrieval algorithm.
Table 1Main parameters of the DQ-1 HSRL system (Dong et al., 2018; Weibiao et al., 2023).
∗ The relative error between the DQ-1 retrieval results (backscatter coefficient and depolarization ratio) and other authoritative data products, at low altitudes below 6 km under nighttime conditions.
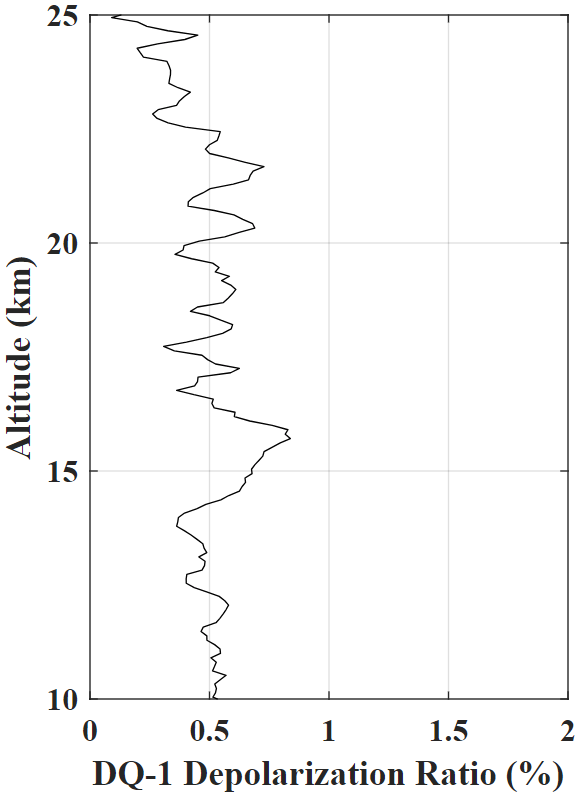
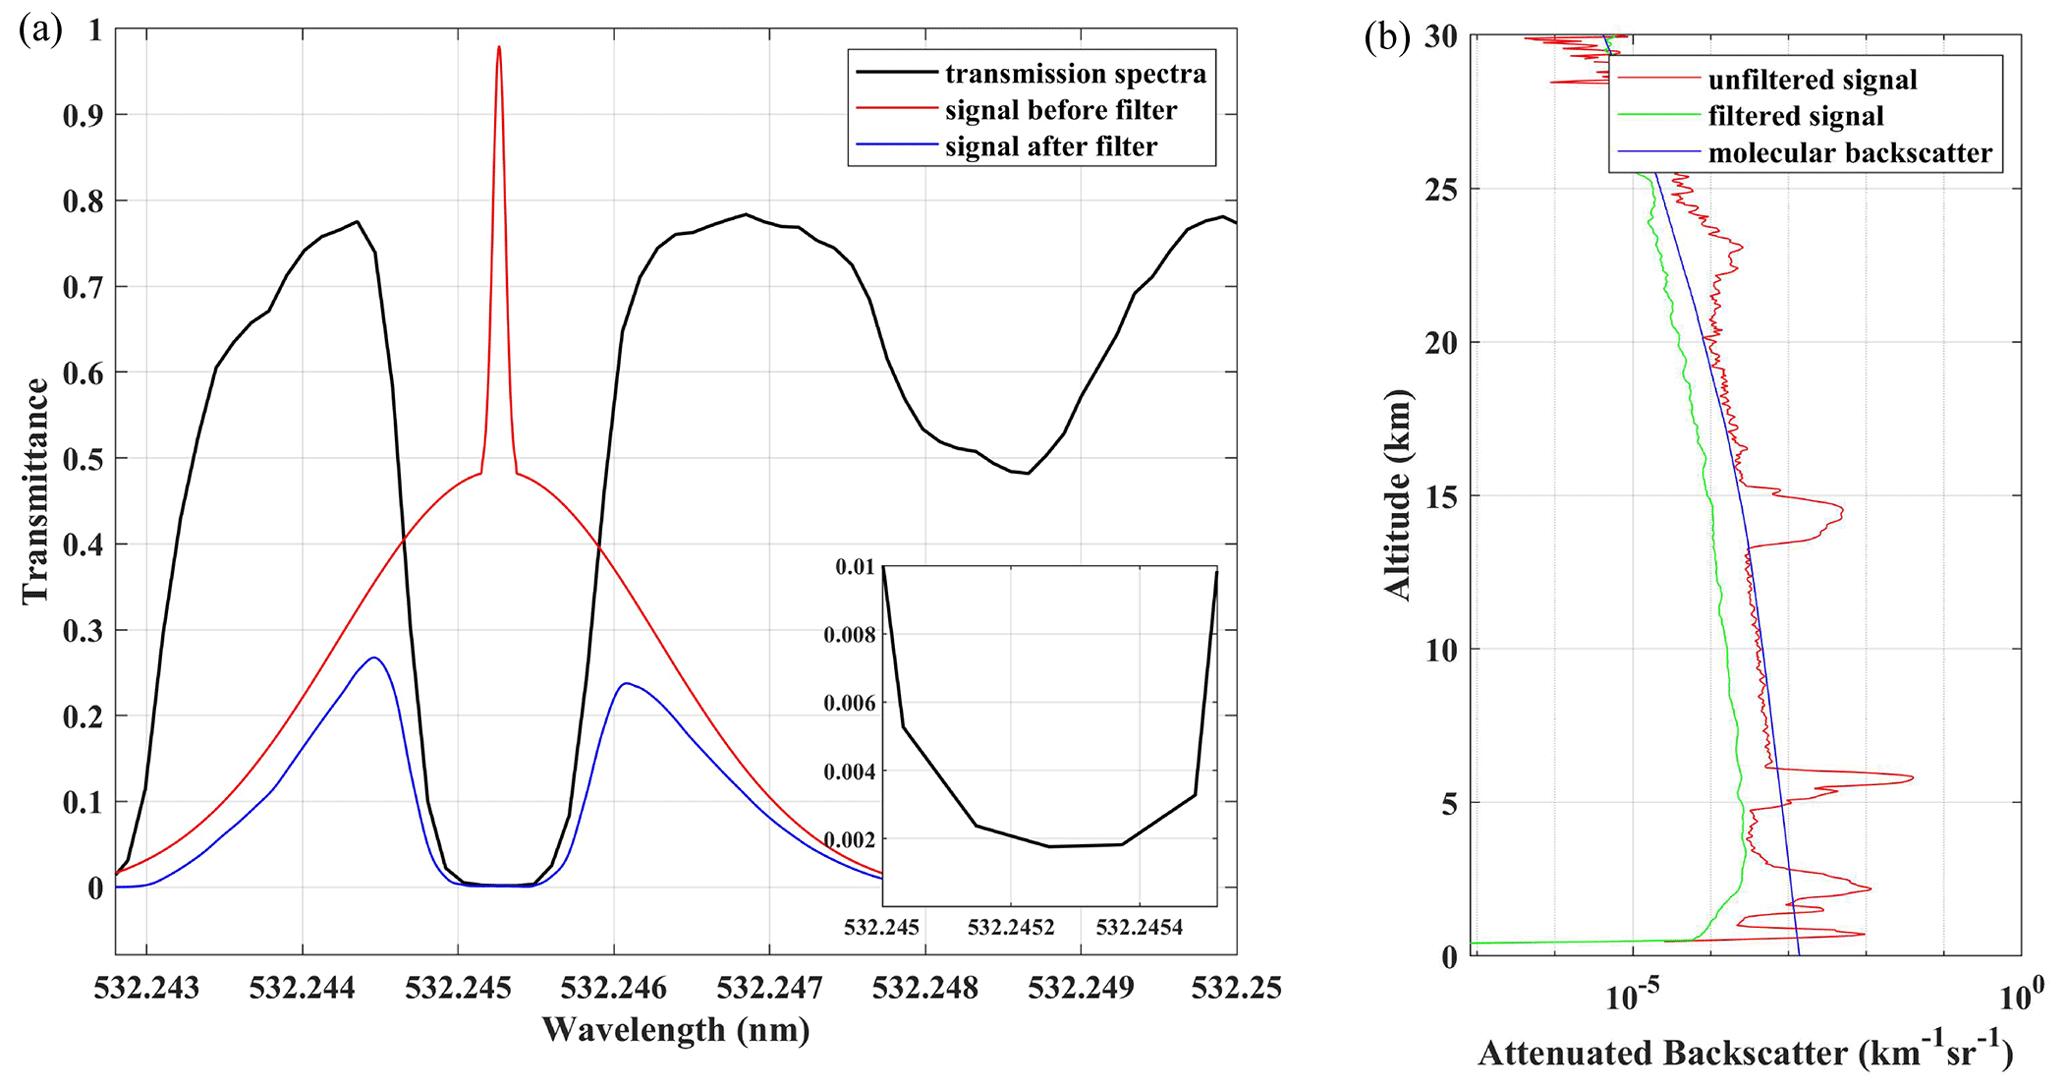
Figure 2The transmittance spectra of the filter and comparison of signals before and after filtering. (a) The actual measured transmittance spectra of the onboard iodine vapor filter of the DQ-1 satellite; the inset in the lower-right corner displays the transmittance spectrum on the 1110 line. The solid red line delineates the spectra of the echo signal prior to the filter (parallel channel); the solid blue line delineates the spectra of the echo signal after the filter (high-spectral-resolution channel). (b) Comparison of signals before and after filtering; the red line represents the unfiltered signal, the green line represents the filtered signal, and the blue line represents the molecular backscatter signal.
2.1.2 Retrieval algorithm
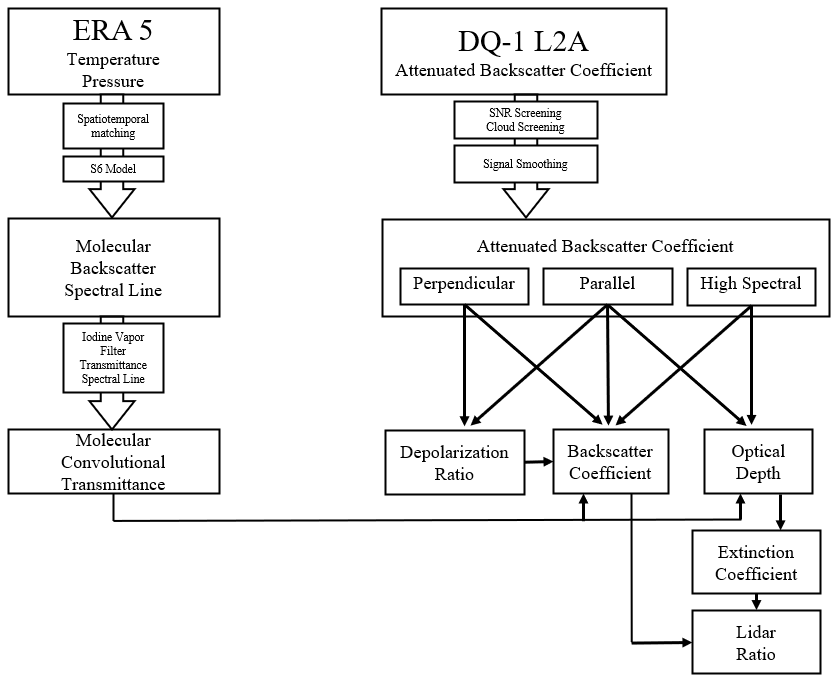
Prior to L2A data retrieval, some pre-processing steps are taken, including signal-to-noise ratio (SNR) control, applying a moving average, and pulse averaging. SNR control refers to removing the backscatter signal with insufficient SNR, which includes removing the heavy cloud-covered signal, and removing erroneous echoes under the surface and signals with poor SNRs; this is achieved by setting an SNR threshold. The threshold is determined by the magnitude of the weak echo signal beneath the dense cloud cover. After this, the low-pass-filtering algorithm is used to apply a moving average to the profile. To achieve the design's horizontal resolution of 20 km, the profiles within a 20 km horizontal range are normalized and averaged. There is an energy difference between laser pulses A and B, where the L2A data have been calibrated during the production, and the time delay of pulses A and B is 200 µs. To improve the SNR of the raw data, the two pulses have been normalized and averaged. The main retrieval processes are presented through a flowchart, as shown in Fig. 3. The ERA5 and DQ-1 L2A datasets, which serve as the algorithm's initial point, are given. The ERA5 temperature and pressure data corresponding to the DQ-1 satellite are incorporated into the atmospheric model (Tenti et al., 1974) to compute molecular backscattering spectra. Subsequently, to determine the transmittance of the molecules, Tm, the spectra are convolved with iodine absorption spectra. The computation of the volume depolarization ratio employs data from both parallel-depolarized and perpendicularly depolarized channels, while the backscatter coefficient is from three channels and Tm. The extinction coefficient is computed from parallel and high-spectral-resolution channels, along with Tm. The specific mathematical equations are presented as follows.
Based on the receiving-system principles outlined in Sect. 2.1.1, the equations for the attenuated backscatter coefficient are described as follows, with a perpendicularly depolarized channel, parallel-depolarized channel, and high-spectral-resolution channel.
In Eqs. (1)–(3), the symbols ⊥ and ∥ represent signals characterized by perpendicular polarization and parallel polarization, respectively. The ratio between them reflects the sphericity of the target. The subscripts C and H represent the signals of the parallel channel and the high-spectral-resolution channel, with their ratio reflecting the proportion of aerosol Mie scattering signals to the backscattering signals. P(r) represents the power of the laser echo signal at distance r. P0 represents the emitting power of the laser; η represents the optical efficiency of the corresponding receiving channel; A represents the aperture of the telescope; and L stands for the half of the pulse spatial transfer length, where L is calculated as , with c representing the speed of light and Δt denoting the pulse duration. System correction has been implemented to ensure that the data are solely contingent upon atmospheric conditions. βm(r) and βa(r) represent the backscatter coefficient of molecules and aerosols, respectively, and αm(r) and αa(r) represent the molecular and the aerosol extinction coefficients. The molecular backscatter coefficient and extinction coefficient are calculated by the S6 molecular model (Tenti et al., 1974) using the data of temperature and pressure provided by ERA5. Tm(T,p) and Ta(T,p) represent the transmittance of the echo signal of molecules and aerosols, respectively, while passing the iodine filter; they can be expressed as
where represents the spectrum distribution of the laser beam and F(v) represents the normalized transmission spectrum of the iodine filter. represents the normalized molecular scattering spectrum related to temperature and pressure. represents the normalized aerosol particle scattering spectrum (Dong et al., 2018). To ensure the stability of the transmittance spectrum, the temperature and pressure of iodine in the filter are strictly controlled on the orbit.
Based on Eqs. (1)–(5), the aerosol backscatter coefficient is calculated as follows:
where δm represents the depolarization ratio of molecules and δ(r) represents the depolarization ratio, which is dependent on the spherical state of the target. K(r0) is the ratio of the parallel channel to the molecular channel; it can be expressed as
The particulate depolarization ratio is expressed as
Based on Eqs. (1)–(5), the atmospheric optical depth is defined as
Differentiating Eq. (9), the aerosol extinction coefficient can be expressed as
The aerosol lidar ratio is expressed as
2.2 CALIPSO
The Cloud-Aerosol Lidar and Infrared Pathfinder Satellite Observation (CALIPSO) satellite, launched on 28 April 2006, is equipped with the Cloud-Aerosol Lidar with Orthogonal Polarization (CALIOP) instrument operating at wavelengths of 532 and 1064 nm. CALIOP continuously observes the Earth's atmosphere to monitor attenuated backscatter data with depolarization and color ratios. The CALIPSO Level 2 data include vertical profiles of the aerosol backscatter coefficient, extinction coefficient, and depolarization ratio. Various approved methodologies have been deployed to accurately monitor and observe the Earth's atmosphere (McPherson et al., 2010). The retrieval algorithm employed for Level 2 data processing has been refined frequently, with the updated version being V4.51. Due to insufficient power supply, the CALIPSO science mission ended on 1 August 2023, necessitating the deployment of a new satellite platform to continue global observations of clouds and aerosols.
2.3 AERONET
The AErosol RObotic NETwork (AERONET) is a ground-based aerosol remote sensing network established by the mutual collaboration of NASA and LOA PHOTONS (CNRS) (Holben et al., 1998). At the moment, this global automated observation network has coverage in major regions throughout the world. The network utilizes the automated sun photometers produced by Cimel Electronique as the primary instruments to observe the atmosphere. The instruments at most sites collect data daily, which are then further processed by the instrumental setup. AERONET provides a valuable resource for multi-wavelength, continuous, and accurate aerosol optical depth data products. These data products play a significant role in the study of global aerosol transport and aerosol radiative effects, the validation of radiative transfer models, and the verification of satellite-based aerosol remote sensing results.
2.4 NASA MPLNET
The NASA Micro-Pulse Lidar Network (MPLNET) is a globally distributed network equipped with a polarized micro-pulse lidar (MPL) system that has been operating continuously since 2000 (Welton et al., 2001). With more than 70 well-established observational stations worldwide, MPLNET operates over several underlying surface conditions, allowing it to collect ongoing aerosol vertical profiles in different regions. The aerosol backscatter coefficient, extinction coefficient, and depolarization ratio can be measured by its system. Most of the MPLNET sites are strategically situated near the observation sites of AERONET. The integration of MPLNET and AERONET is used to make a potential approach possible and to facilitate the robust validation of satellite instruments and other scientific objects.
2.5 HYSPLIT model
The HYSPLIT model is a widely used atmospheric transport and dispersion model developed by the National Oceanic and Atmospheric Administration (NOAA) (Draxler and Hess, 1997; Stein et al., 2015). It has been extensively employed for various applications, including air pollution studies, atmospheric research, emergency response planning, and radiological assessments. The HYSPLIT model employs a Lagrangian approach to trace aerosol movement and simulate the dispersion of pollutants or other atmospheric constituents over time. This model provides valuable insight into the long-range transport of pollutants; the dispersion patterns of hazardous substances; and atmospheric dynamics on local, regional, and global scales (Crawford et al., 2016; Wang and Chen, 2014).
3.1 Validation with CALIPSO
We conducted a comparative validation between the CALIPSO and DQ-1 satellites on a closely aligned orbit on 6 June 2022. The ground tracks of both satellites are illustrated in Fig. 4. The two satellites follow orbital trajectories extending from the central Asian region across the Arabian Peninsula to the open ocean south of Africa, with a spatial separation of 400 km and a temporal difference of 60 min. In order to verify the consistency of the raw data, Fig. 5a and b present the total attenuated backscatter coefficients of DQ-1 and CALIPSO. Within the geographical area of 40 to 10° N, at an altitude below 5 km, desert dust aerosols, making up a large proportion of the aerosols, were investigated. The attenuated backscatter coefficient in this area falls within the range of 10−3 to 10−2 . This geographical area intersects the Arabian Peninsula and the Iranian Plateau. At an altitude of 15 km, the distribution of cirrus was observed, with the laser return signal failing to penetrate certain portions of the cloud cover. South of 10° N, as the two satellites entered the maritime region, there was no observed aerosol distribution. The cumulus clouds were distributed at an altitude of 3 km, and some mid-level clouds reached an altitude of 5 km. South of 20° N, at an altitude higher than 20 km, DQ-1 observed the distribution of stratospheric volcanic aerosols. Due to the impact of temporal and spatial inconsistencies, the results obtained for cloud detection from CALIPSO and DQ-1 have dissimilarities. Nevertheless, both the aerosol results exhibit similar trends, with numerical values ranging from 10−3 to 10−2 . To further evaluate the differences in both the raw signals, Fig. 5e presents the average raw signal with a latitude ranging from 20 to 22° N, with the molecular backscatter coefficient calculated from ERA5 temperature and pressure data for analysis. The raw signals of DQ-1 and CALIPSO align with the molecular scattering profile. The local variations in the high-altitude atmosphere are relatively small, making system noise more easily distinguishable. High-altitude echo signals are used as noise, and the ratio of the noise to echo signals is utilized as the SNR. To compare the signal quality of both systems, the SNR of the total attenuated backscattered signals was analyzed, as illustrated in Fig. 5c and d. The vertical resolution of the DQ-1 attenuated backscatter coefficient is 48 m, while CALIPSO exhibited a vertical resolution of 30 m below 8 km and 60 m between 8 and 20 km. In areas with aerosol distribution, the value of the SNR of CALIPSO's signal varied from 10 to 40, and the SNR of DQ-1's signal exceeded 40. Additionally, DQ-1 has maintained a high-altitude molecular scattering SNR above 20, whereas CALIPSO's high-altitude molecular scattering signal SNR has a value of less than 20. In conclusion, the two satellites give consistent raw-data results in close orbits, with DQ-1 operating at a higher resolution and achieving a better SNR.
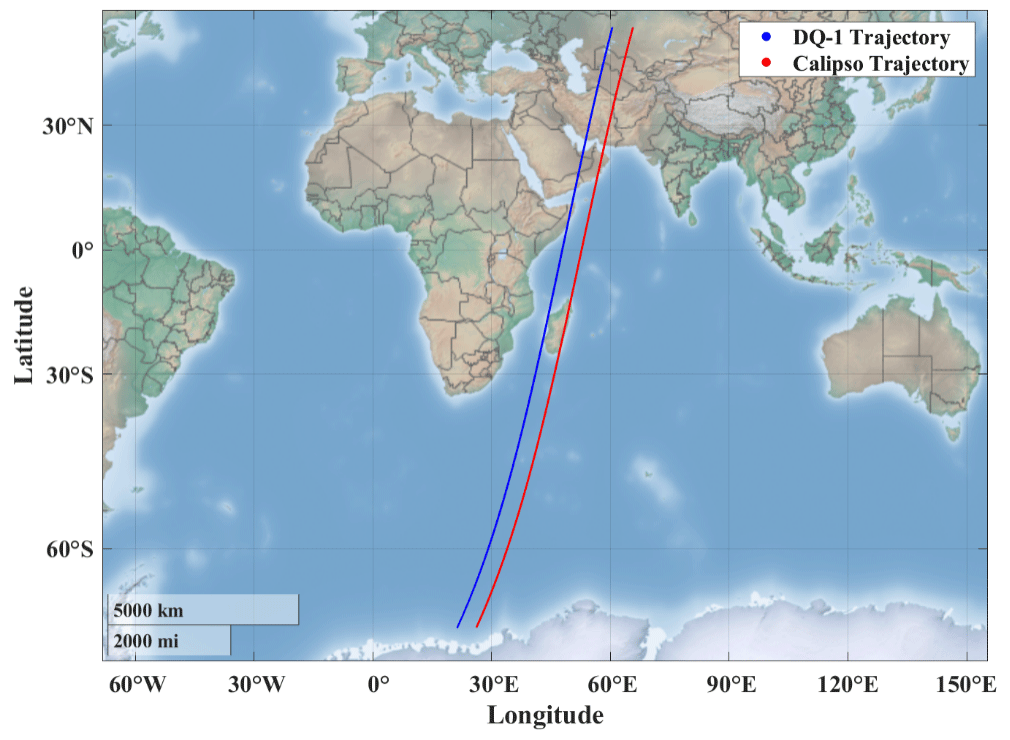
Figure 4The selected satellite trajectory of DQ-1 and CALIPSO in 6 June 2022. The DQ-1 trajectory is indicated by the solid blue line, while the CALIPSO trajectory is represented by the solid red line. The time difference between the two trajectories is 60 min, and the spatial separation amounts to 400 km.
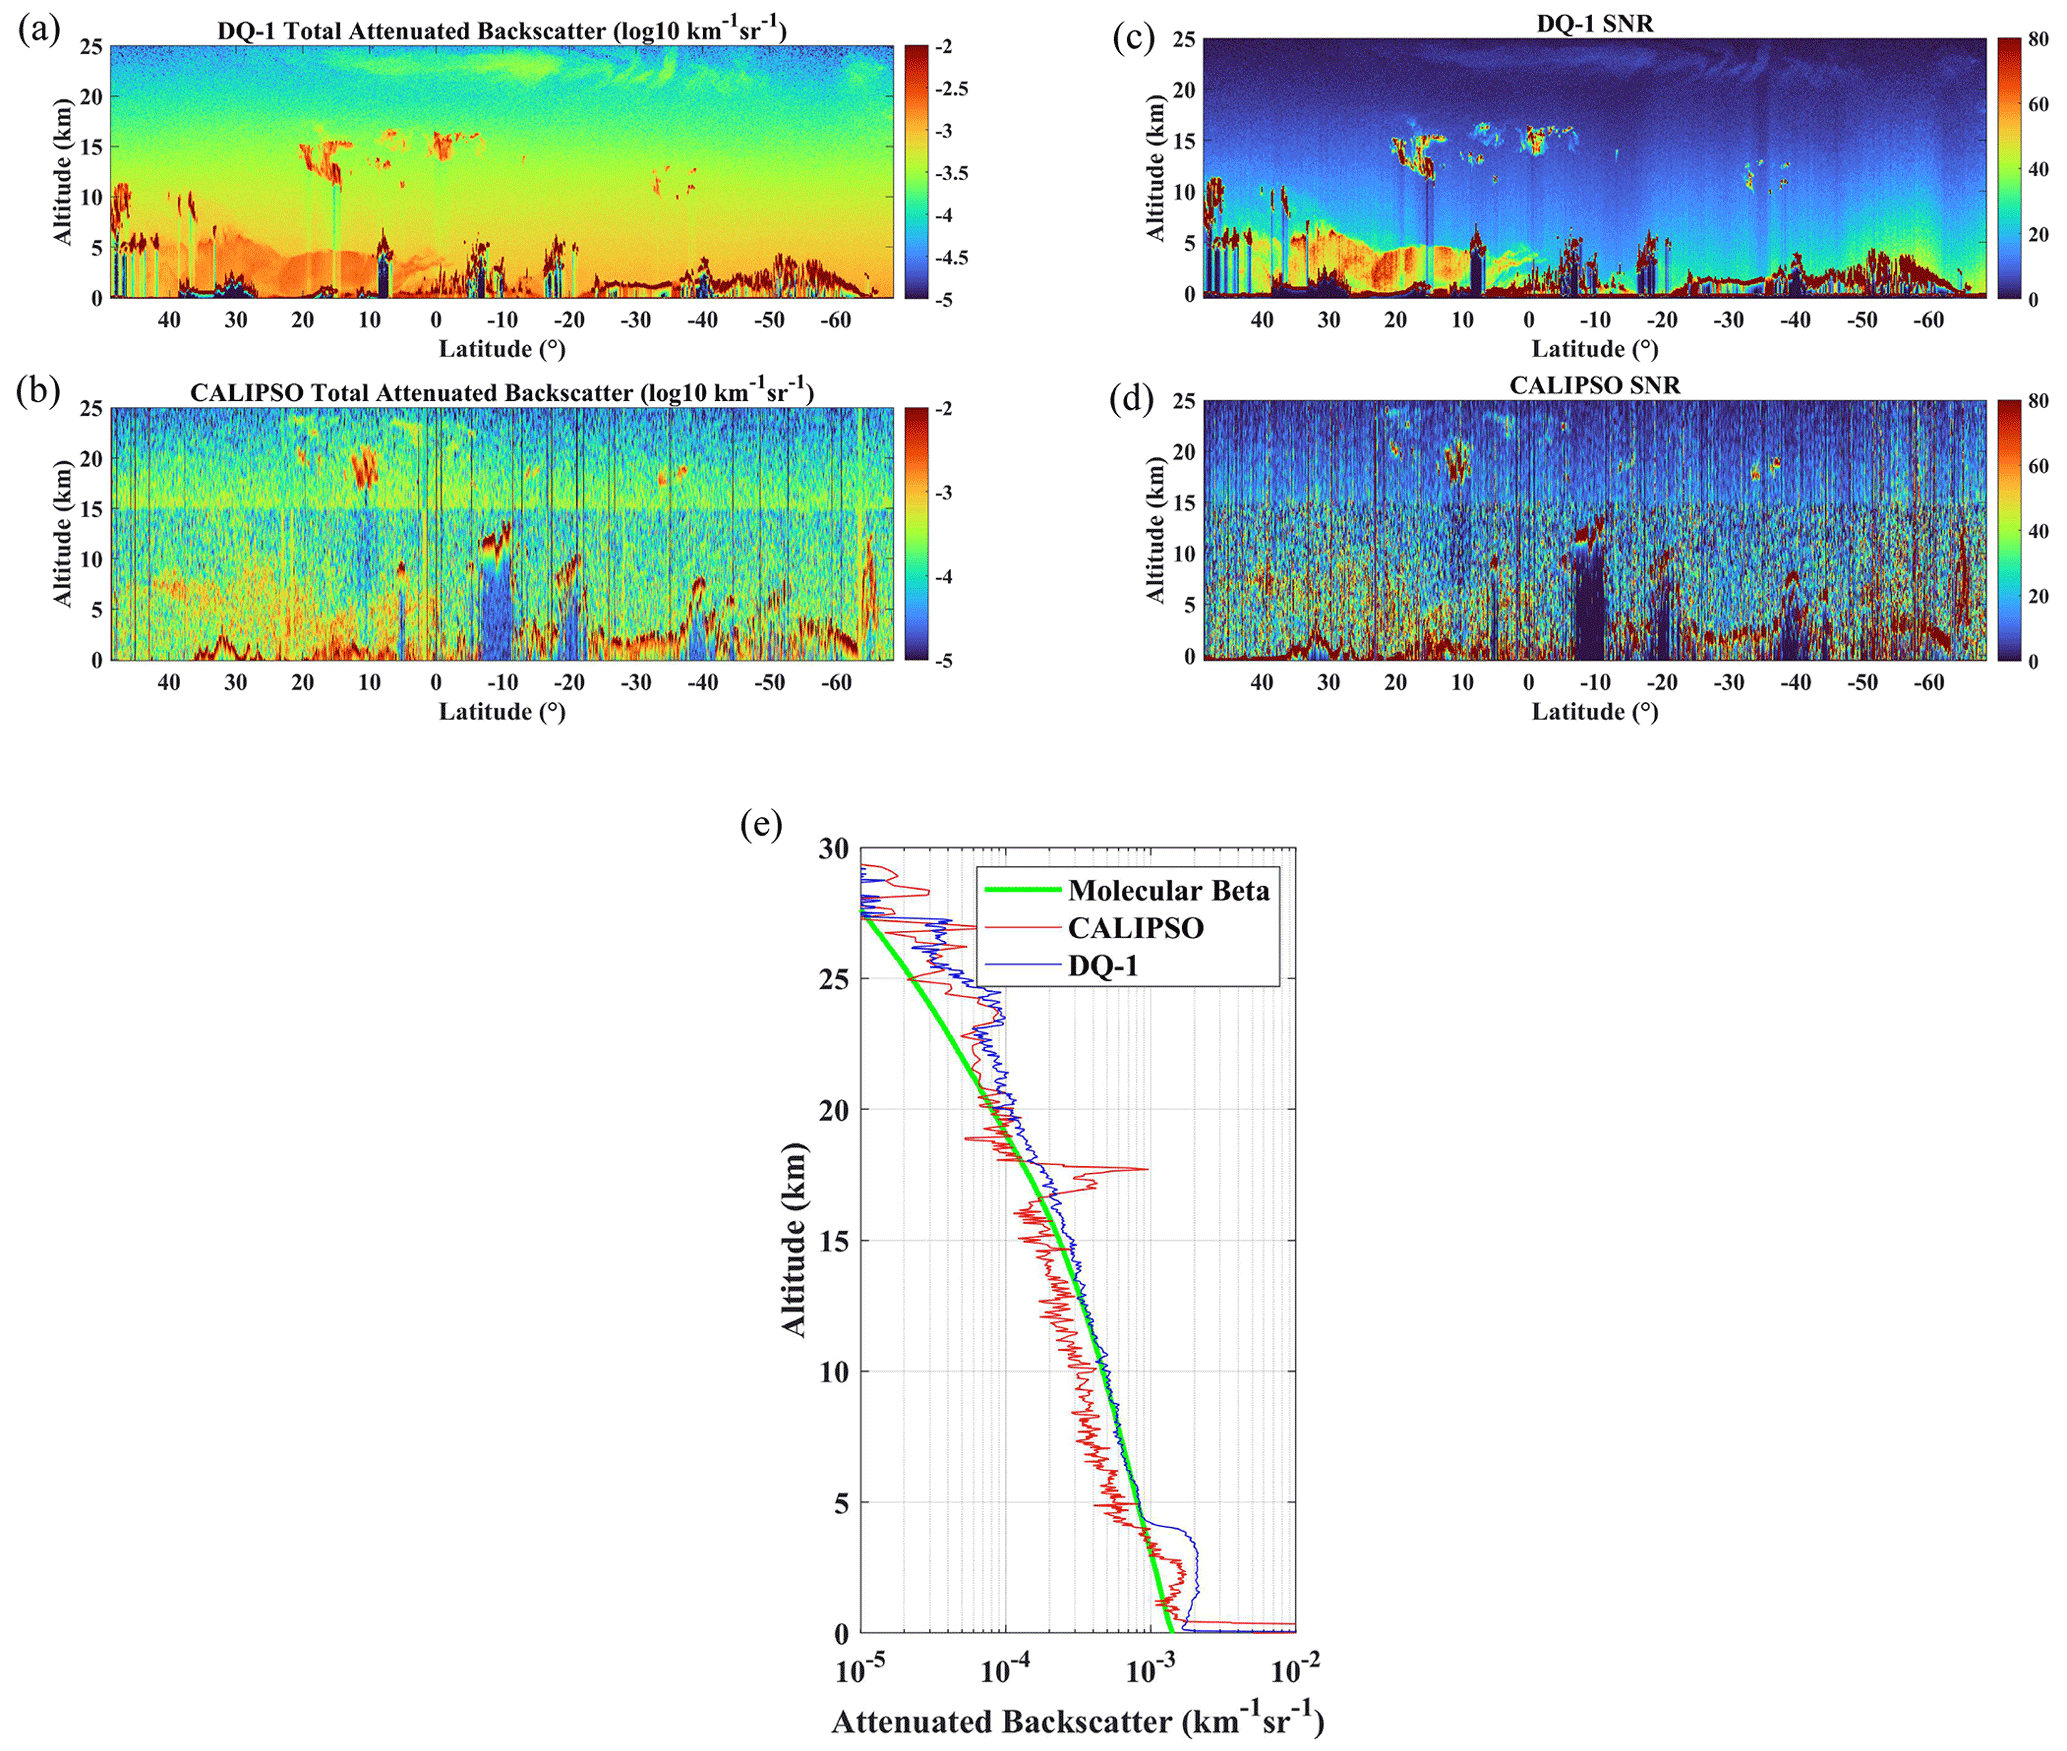
Figure 5Profile comparison of DQ-1 and CALIPSO on 6 June 2022: (a) total attenuated backscatter coefficient profiles obtained by DQ-1; (b) total attenuated backscatter coefficient profiles obtained by CALIPSO; (c) the SNR of DQ-1 total attenuated backscatter; (d) the SNR of CALIPSO total attenuated backscatter; and (e) comparison of total attenuated backscatter mean profile of 20 to 22° N, where the solid blue line represents the DQ-1 results, the solid red line represents the CALIPSO results, and the solid green line depicts the computed molecular backscatter coefficient.
Figure 6 shows a comparative analysis of the retrieval results obtained from both systems. Figure 6a and b show the latitudinal distribution of aerosol extinction coefficients with a 10−1 km−1 value. Figure 6c and d illustrate the latitudinal distribution of backscatter coefficients for both systems, with a value of 10−2 . Due to spatial differences, the results of high-level clouds obtained by the two systems are different. Furthermore, at a height below 2 km in the lower troposphere, spanning 5 to 15° N, CALIPSO obtains significantly higher retrieval values, discriminating between the aerosol types. In Fig. 6j and k, we chose two satellites for the profile comparison of the aerosol extinction coefficient and backscatter coefficient at a latitude of 22° N. The backscatter coefficient was retrieved from both satellites with a value of 10−3 at a height lower than 4 km, whereas the aerosol extinction coefficient was retrieved with a 10−1 km−1 value. This indicates a relatively dense distribution of aerosols. Besides atmospheric variations caused by specific spatiotemporal effects, both variables' trends and numerical distributions are closely related. Figure 6e, f, and i depict the particulate depolarization ratio. The value of the depolarization ratio at a low altitude obtained from DQ-1 is 0.3, demonstrating the nature of dust. Similarly, the depolarization ratio of clouds at a high altitude of 15 km is 0.4, indicating the characteristics of cirrus clouds composed of ice crystals. The retrieval results of the particulate depolarization ratio from CALIPSO exhibit a mean value of 0.3, which is consistent with DQ-1. Figure 6g and h depict the latitudinal distribution of the aerosol lidar ratio. The advantage of the DQ-1 HSRL system is that it can retrieve the lidar ratio without assumptions, which is significantly different from CALIPSO. DQ-1 indicates that the lidar ratio of aerosol particles is around 40 sr, consistent with the characteristics of dust, consistent with CALIPSO's aerosol type. For cirrus at an altitude of 10 to 15 km, the retrieved lidar ratio of DQ-1 is less than 40 sr, indicating the characteristics of ice crystals. Due to the proximity of the CALIPSO orbit to oceanic regions below 3 km altitude and south of 18° N, CALIPSO identified sea salt aerosols, with numerical values giving a lidar ratio of 20 sr, and retrieved a depolarization ratio of less than 0.1. Considering the spatiotemporal differences between the two satellites, the retrieval results of DQ-1 and CALIPSO are consistent. DQ-1, operating in high-resolution conditions, achieves a high signal-to-noise ratio and presents reliable retrieval results.
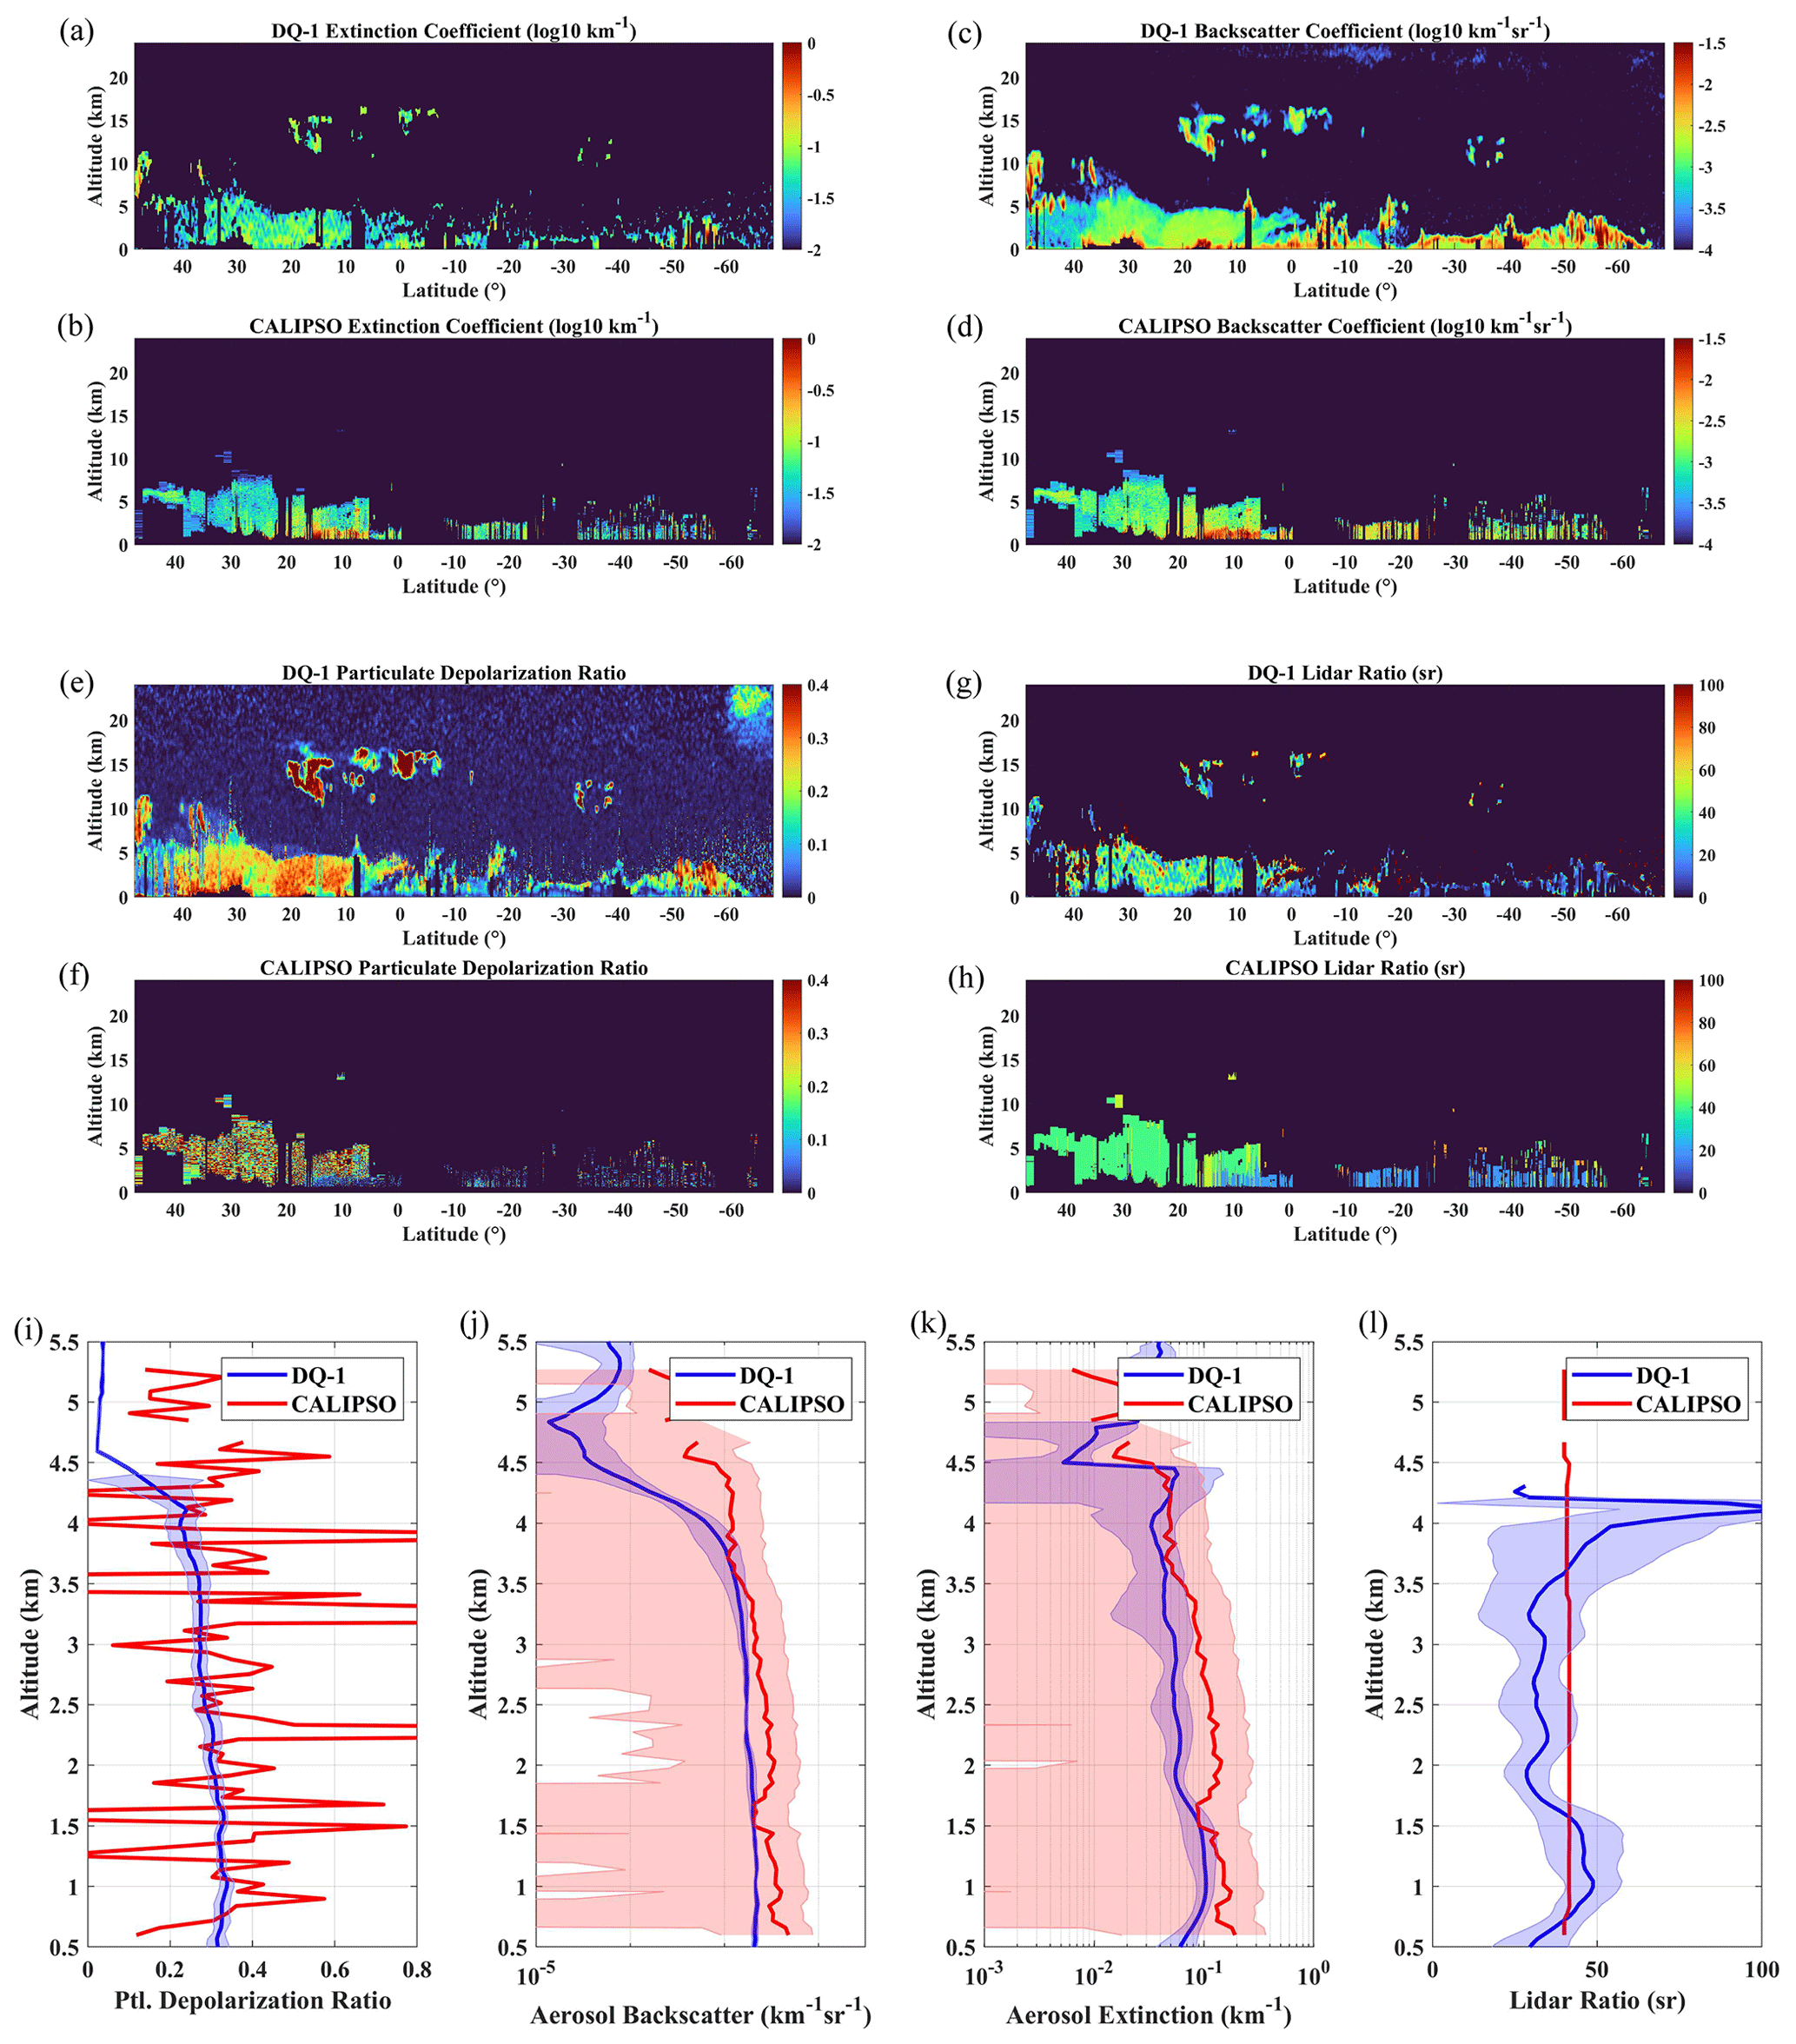
Figure 6Profile comparisons of DQ-1 and CALIPSO on 6 June 2022: (a) extinction coefficient profiles of aerosols obtained by DQ-1, (b) extinction coefficient profiles of aerosols obtained by CALIPSO, (c) backscatter coefficient profiles of aerosols obtained by DQ-1, (d) backscatter coefficient profiles of aerosols obtained by CALIPSO, (e) the particulate depolarization profile obtained by DQ-1, (f) the particulate depolarization profile obtained by CALIPSO, (g) the lidar ratio profile obtained by DQ-1, (h) the lidar ratio profile obtained by CALIPSO, (i) comparison of the particulate depolarization mean profile of 20 to 22° N, (j) comparison of the aerosol backscatter coefficient mean profile of 20 to 22° N, (k) comparison of the aerosol extinction coefficient mean profile of 20 to 22° N, and (l) the aerosol lidar ratio profile of 20 to 22° N. The solid blue line represents the DQ-1 results, the solid red line represents the CALIPSO results, and the shaded area represents the standard deviation of different detection heights.
3.2 Validation with MPLNET
We qualitatively compared the aerosol optical parameter data products from the NASA MPLNET ground station with the retrieval results of DQ-1. This comparison has three surface types: land, ocean, and coastal regions. Profile-averaged findings inside a circle with a radius of 100 km, centered on MPLNET stations, were explicitly chosen for DQ-1 data. For MPLNET data, we utilized the average MPLNET profile within 15 min of DQ-1 transit. Figure 7 illustrates the validation results. The change in lower atmospheric aerosols is fast and characterized by high local heterogeneity, whereas the SNR at a high altitude is comparatively low. Hence, we selected the data at an altitude range of 1 to 8 km for comparison. Three selected distinct surface types, namely, land, coastal, and oceanic regions, correspond to the Appalachian, El Arenosillo, and Santa Cruz de Tenerife sites. The location of these three sites and the satellite trajectory are illustrated in Fig. 7c, f, and i. The difference between the satellite and ground-based retrieval results is quantified, as shown in Fig. 8.
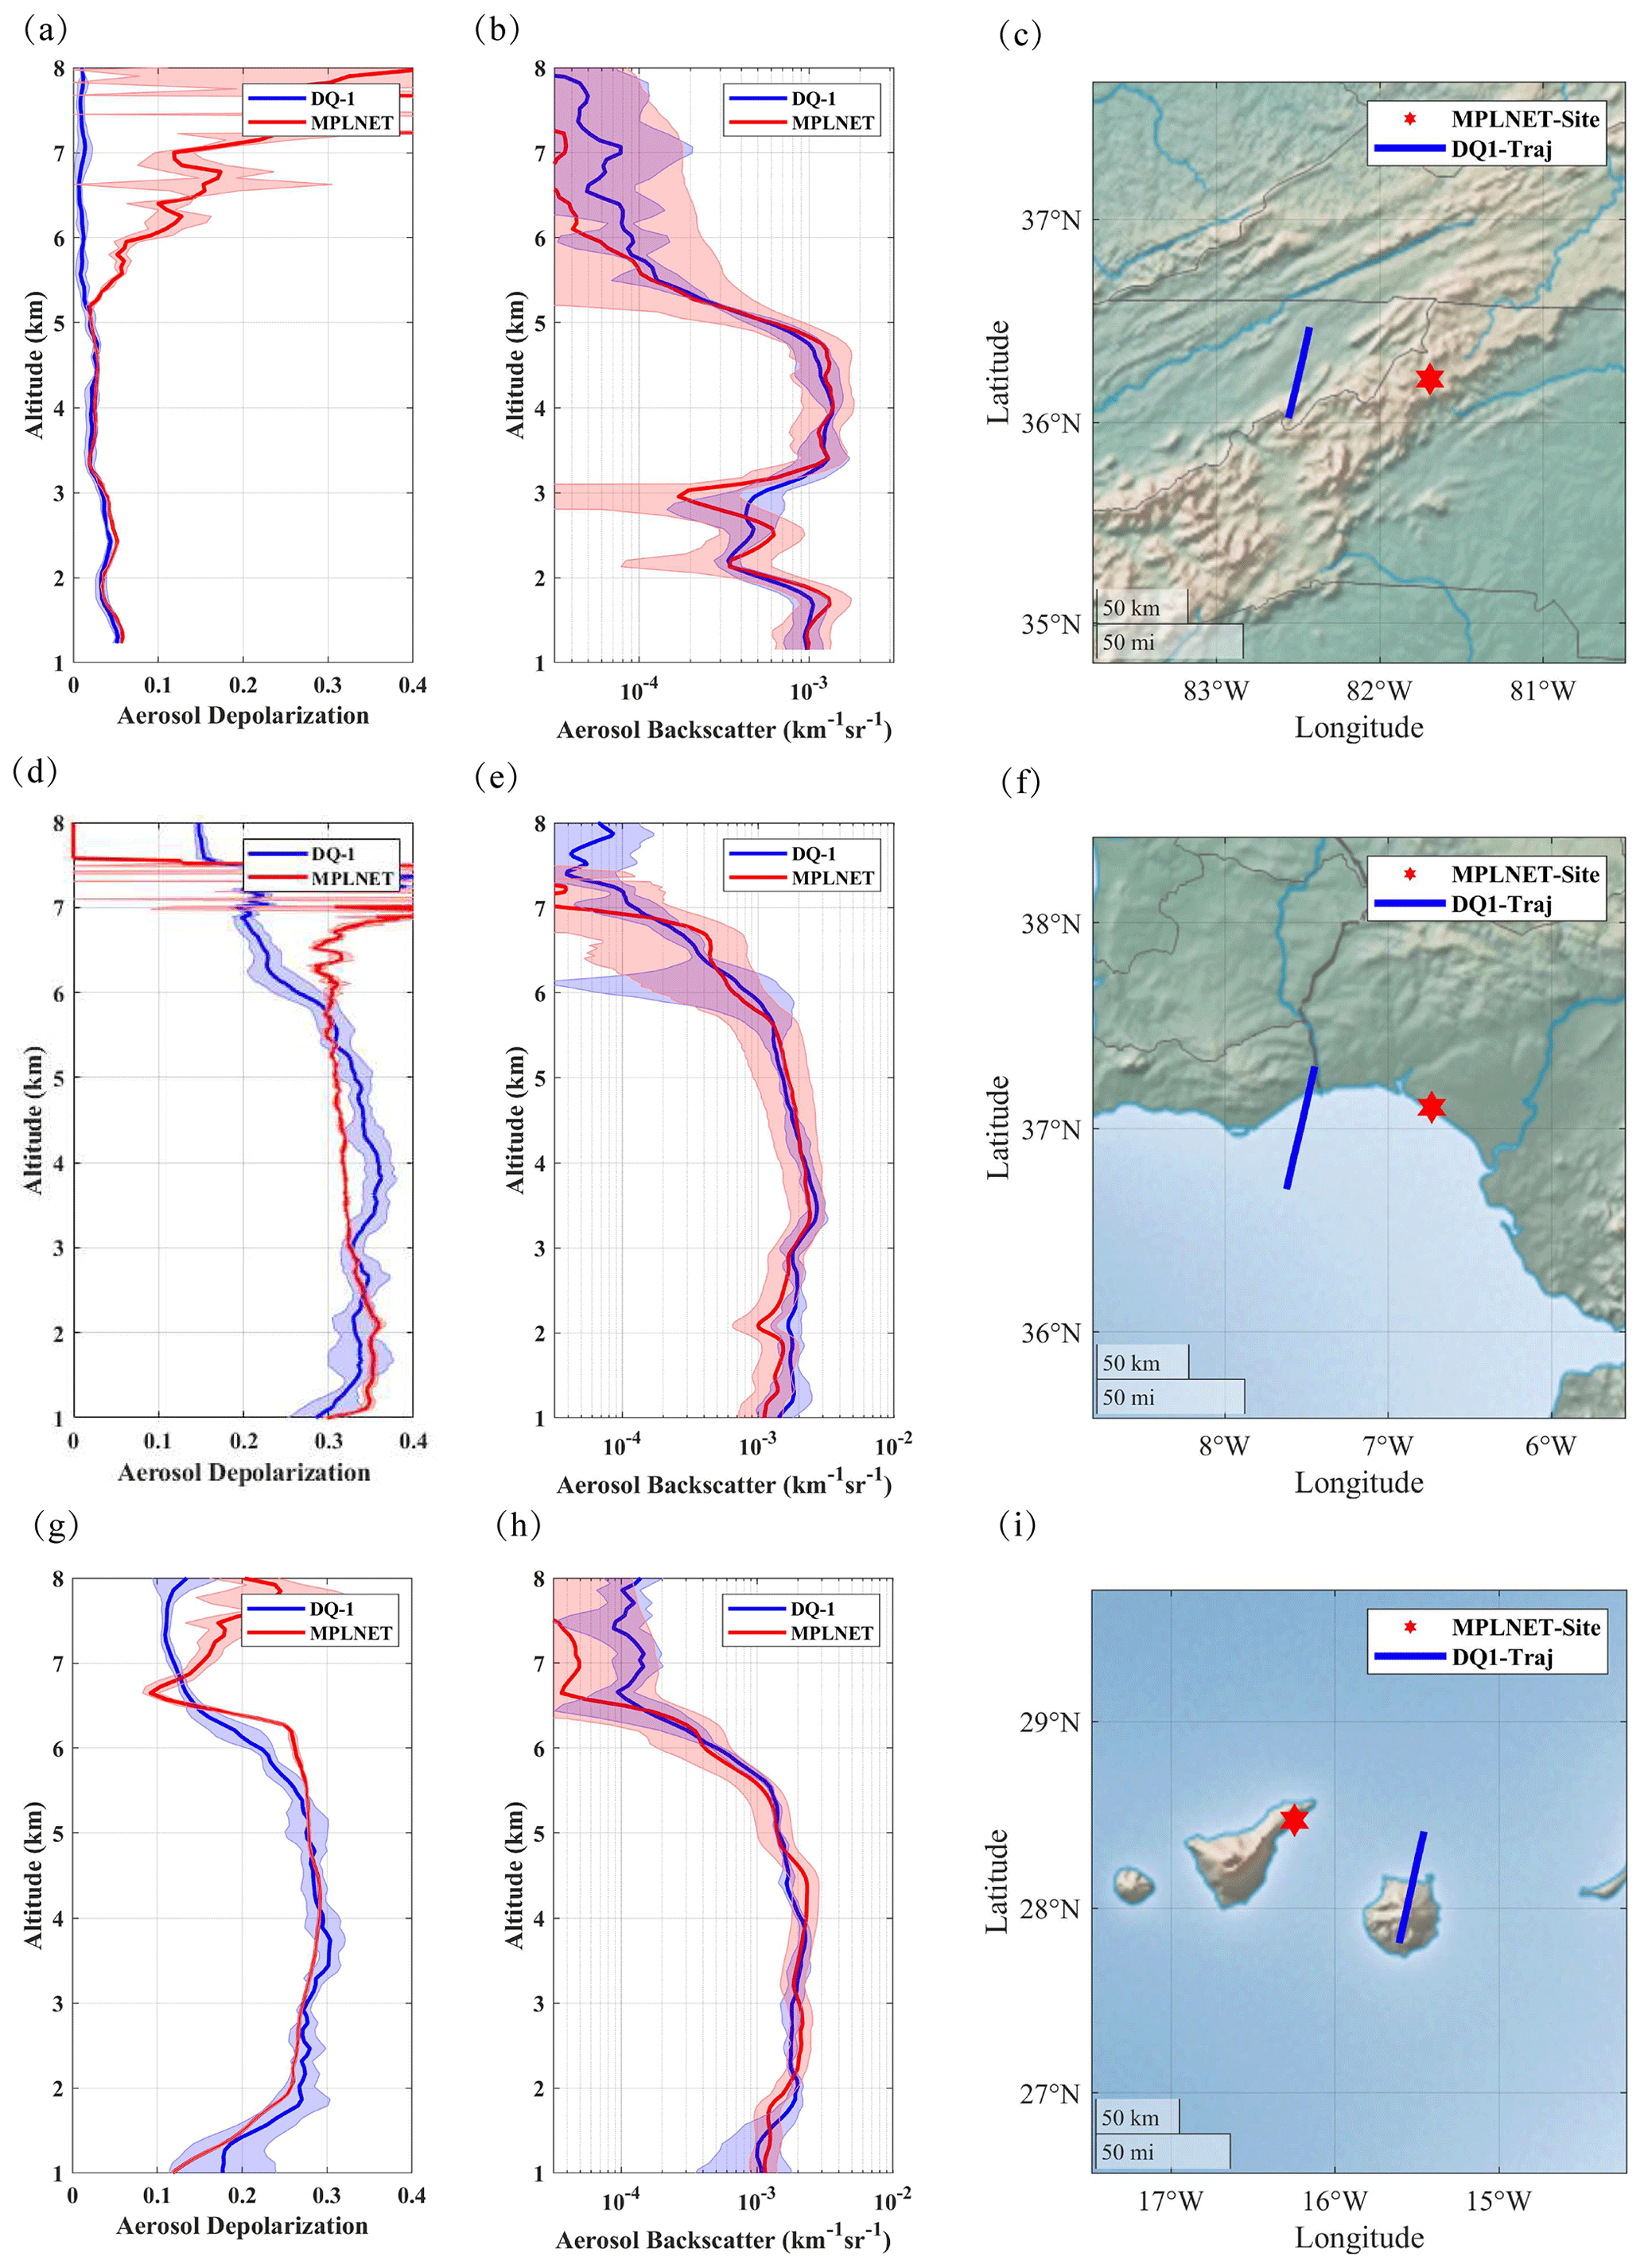
Figure 7Comparison of single profiles between DQ-1 and NASA MPLNET. The solid red line represents MPLNET results, the solid blue line represents DQ-1 results, and the shaded area represents the standard deviation of different altitudes. (a) Comparison of aerosol depolarization ratio profiles between DQ-1 and MPLNET for the Appalachian site on 16 August 2022, (b) comparison of aerosol backscatter coefficient profiles between DQ-1 and MPLNET for the Appalachian site on 16 August 2022, (c) trajectory of the DQ-1 orbit and MPLNET for the Appalachian site location, (d) comparison of aerosol depolarization ratio profiles between DQ-1 and MPLNET for the El Arenosillo site on 13 June 2022, (e) comparison of aerosol backscatter coefficient profiles between DQ-1 and MPLNET for the El Arenosillo site on 13 June 2022, (f) trajectory of the DQ-1 orbit and MPLNET for the El Arenosillo site location, (g) comparison of aerosol depolarization ratio profiles between DQ-1 and MPLNET for the Santa Cruz de Tenerife site on 22 August 2022, (h) comparison of aerosol backscatter coefficient profiles between DQ-1 and MPLNET for the Santa Cruz de Tenerife site on 22 August 2022, and (i) trajectory of the DQ-1 orbit and MPLNET Santa Cruz de Tenerife site location.
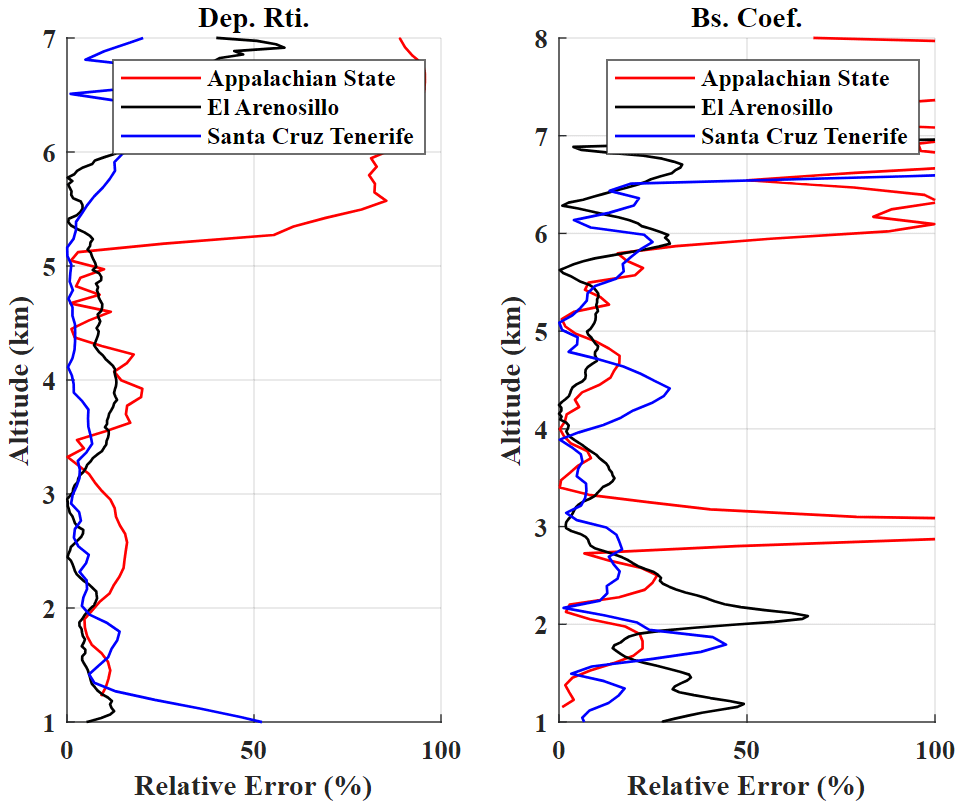
Figure 8The relative errors between the three MPL sites and DQ-1. The red line represents the relative error between the profiles of the Appalachian station and DQ-1, the black line represents the relative error between the profiles of the El Arenosillo station and DQ-1, and the blue line represents the relative error between the profiles of the Santa Cruz de Tenerife station and DQ-1.
The Appalachian site is inland in the United States, and the satellite passes it during nighttime hours. At this site, aerosol backscatter coefficients obtained from satellites and ground-based observations correspond relatively well at an altitude range of 3 to 5 km. The relative discrepancy between the two observations is less than 25 % within this range. However, below 3 km, the measurements are influenced by clouds, increasing the error between the two datasets. Both satellite and ground-based observations indicate a decreasing trend in the backscatter coefficient with an altitude of more than 5 km. Above 5 km, ground-based data exhibit rapid variations, leading to increased variations between the two datasets. Below an altitude of 3 km, the depolarization ratio of the two remains consistent. Above 5 km, there is a difference in the depolarization ratio results obtained by the two observation platforms due to the influence of clouds. The El Arenosillo site is situated along the southwestern coast of Spain, and the profile comparison results are depicted in Fig. 7d and e. Both observational methods indicate that the aerosol distribution exhibits relatively low variation within the altitude of 1 to 6 km. Above 6 km, there is a decline in aerosol concentration with increasing altitude. The distribution of the aerosol backscatter and depolarization ratio is consistent. The relative error between the two results is less than 25 % at altitudes above 2.5 km. The Santa Cruz de Tenerife station is situated in the Canary Islands, west of northern Africa, near the ocean. The profiles of aerosol optical parameters from both satellite and ground-based results remain relatively consistent. The depolarization ratio and backscatter coefficient profiles from both sources exhibit a high degree of agreement when accounting for spatial disparities. The relative errors between the two results are less than 25 %. Comparative analysis of NASA MPL ground-based data products, when there is no influence of cloud, reveals that the relative errors in aerosol extinction and backscatter coefficients between the two sources are about 25 %. This further validates the DQ-1 satellite retrieval algorithm.
3.3 Validation with AERONET
Figure 9 illustrates a scatterplot comparison between aerosol optical depth data obtained from DQ-1 and AERONET Level 2.0 from June to December 2022. The DQ-1 data represent the average aerosol optical depth within a circular region of a radius of 100 km, centered on AERONET sites, derived through the retrieval process. The data from AERONET stations represent ground-based measurements obtained within a 15 min time window when DQ-1 passes over these sites. The difference in elevation between the sub-satellite point and the AERONET station can introduce errors (Omar et al., 2013). To mitigate such errors, we excluded the deviant results at more than 200 m from the station's altitude on the ground. To exclude cloud signals, we subject the DQ-1 aerosol optical depth data to cloud signal removal using the backscatter ratio for better quality enhancement. When the backscatter ratio exceeds 10, we consider it to indicate the cloud signal, which is excluded from calculating the aerosol optical depth (Ke et al., 2022). Aerosol optical depth measurements at a wavelength of 532 nm were missing at some AERONET stations. Hence, we employed data at a wavelength range of 500 to 550 nm as a substitute.
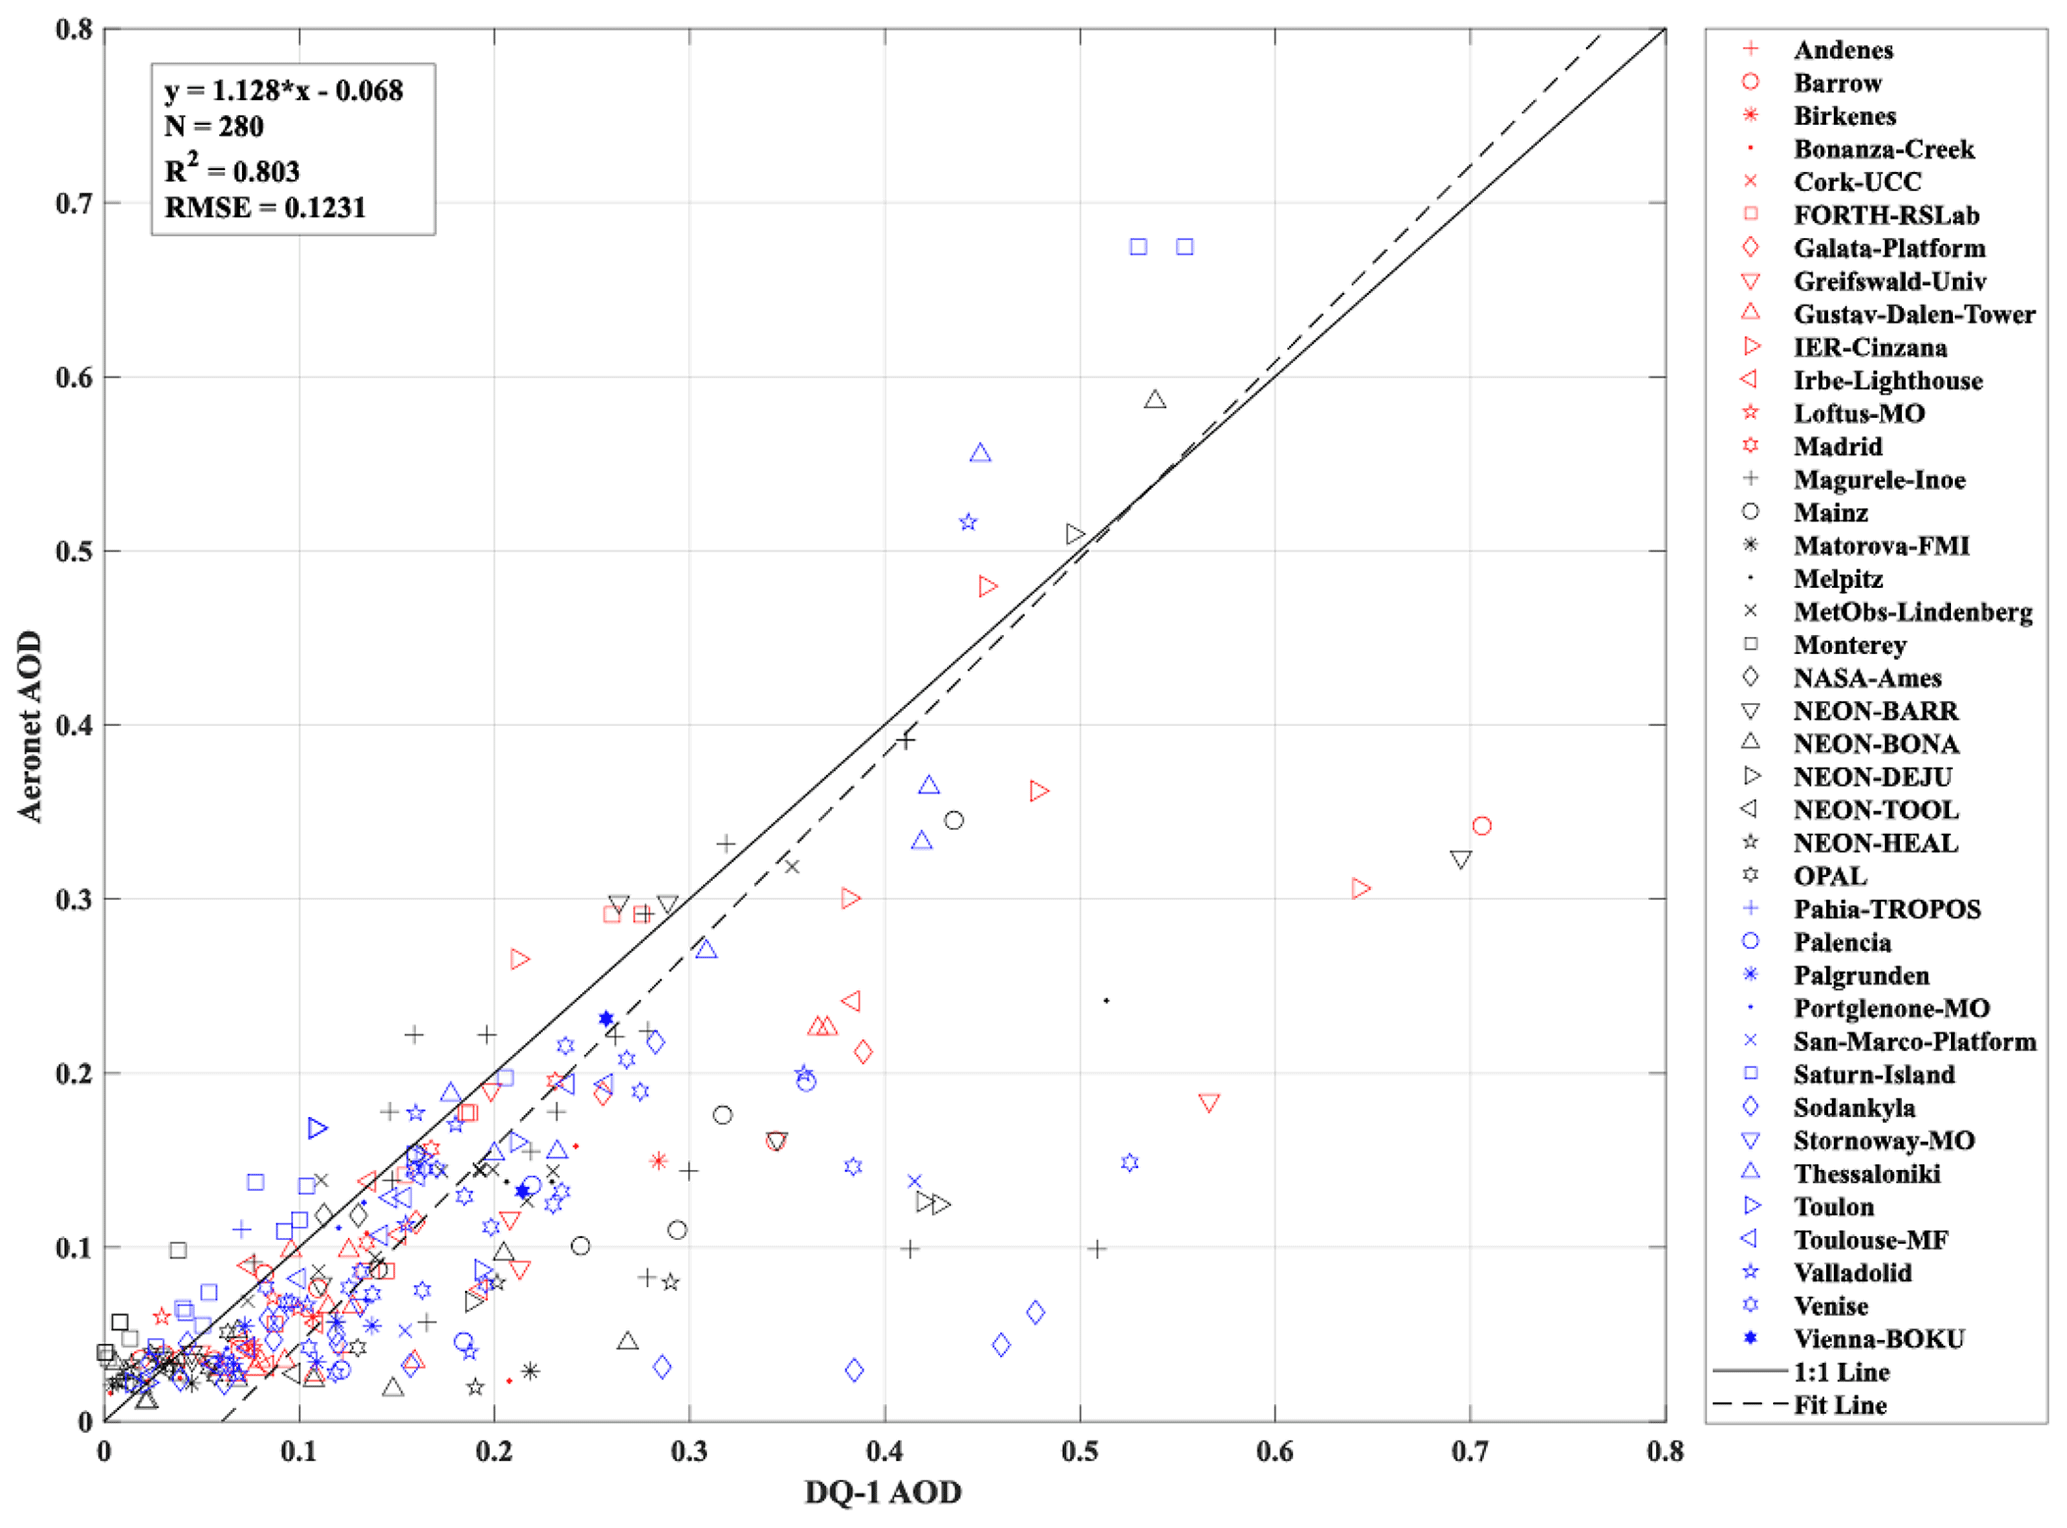
Figure 9Scatterplot of aerosol optical depth measured by DQ-1 and AERONET. Distinct shapes and colors are employed to indicate the scatter of AERONET and DQ-1 aerosol optical depth from various measurement sites. The solid black line represents the unity line (1:1), and the dashed black line represents the outcome of a linear regression between the two datasets. The coefficient of determination (R2) is computed as 0.803, based on 280 fitted data points.
The results obtained from a first-order polynomial regression analysis of the scatterplot data revealed a variance of 0.803 and a root mean square error (RMSE) of 0.1231. Considering the spatiotemporal differences between the two datasets, the satellite-based and ground-based observations exhibited a commendable level of agreement. There are specific data points that deviate from the fitted regression line. These deviating data points share a common characteristic: satellite-based data tend to exhibit higher values. This difference can be attributed to the incomplete removal of cloud signals during retrieval. Such issues have also been highlighted in prior studies (Omar et al., 2013). Due to the current status of DQ-1's Level 2A data processing, completed only from June to December 2022, and ongoing data processing efforts for specific AERONET datasets, the available quantity of matching results is limited. Further validation through satellite-ground comparisons over an extended period can be pursued.
After validation with various well-established observational platforms, our research has provided initial verification of the observational accuracy of the DQ-1 HSRL system. The following work will showcase some of the scientific applications that can be achieved with DQ-1, unveiling the immense potential and scientific value of the high-performance system carried by this satellite for comprehensive atmospheric environmental monitoring.
4.1 Observation of aerosol transport in eastern Africa
In July 2022, DQ-1 observed the propagation of Saharan dust from the northeastern Sahara region of Africa towards the Atlantic region. The optical parameters along the aerosol transport path from 3 to 8 July were retrieved. Additionally, a 6 d backward trajectory analysis using the NOAA HYSPLIT model was conducted on 8 July over the northeastern Atlantic off the coast of South America. Within this 6 d duration, the dust covered a distance of 4000 km, with an average speed of 30 km h−1. These results are presented in Fig. 10. From 3 to 4 July, DQ-1 observed a top height of 8 km for the aerosol layer, with the backscatter coefficient ranging from 10−2 to 10−1 . Following a westward transport over 2 d, 7 to 8 July, the altitude distribution was reduced to 4 km and the backscatter coefficient fell below 10−2 . During this transport process, there was an observable trend of aerosol settling over the ocean, reducing the altitude distribution range and backscatter coefficient. Figure 10c and e show the lidar and particulate depolarization ratios, respectively. On 3 July, measurements over western Africa indicated a lidar ratio distribution centered around 50 sr and particulate depolarization ratio values within a range of 0.25 to 0.4, representing dust (Burton et al., 2012a; Groß et al., 2011, 2013). During the transport process, the value of the lidar ratio was constant at 50 sr, while the particulate depolarization ratio was reduced from 0.25 to 0.15. According to 8 July measurements, the lidar ratio from the surface to 2 km altitude exhibited values centered around 20 sr, indicating the characteristics of sea salt (Burton et al., 2012a; Groß et al., 2011, 2013). Above 2 km, the lidar ratio was about 50 sr, indicating a consistent presence of dust. These observations revealed a stratified distribution of aerosols in this region. The satellite-based retrieval results presented the spatial variations in the position and optical properties of dust during its transport. DQ-1 observed that as these dust aerosols were transported, their altitude, backscatter coefficient, and particulate depolarization ratio decreased at the lidar ratio's constant value.
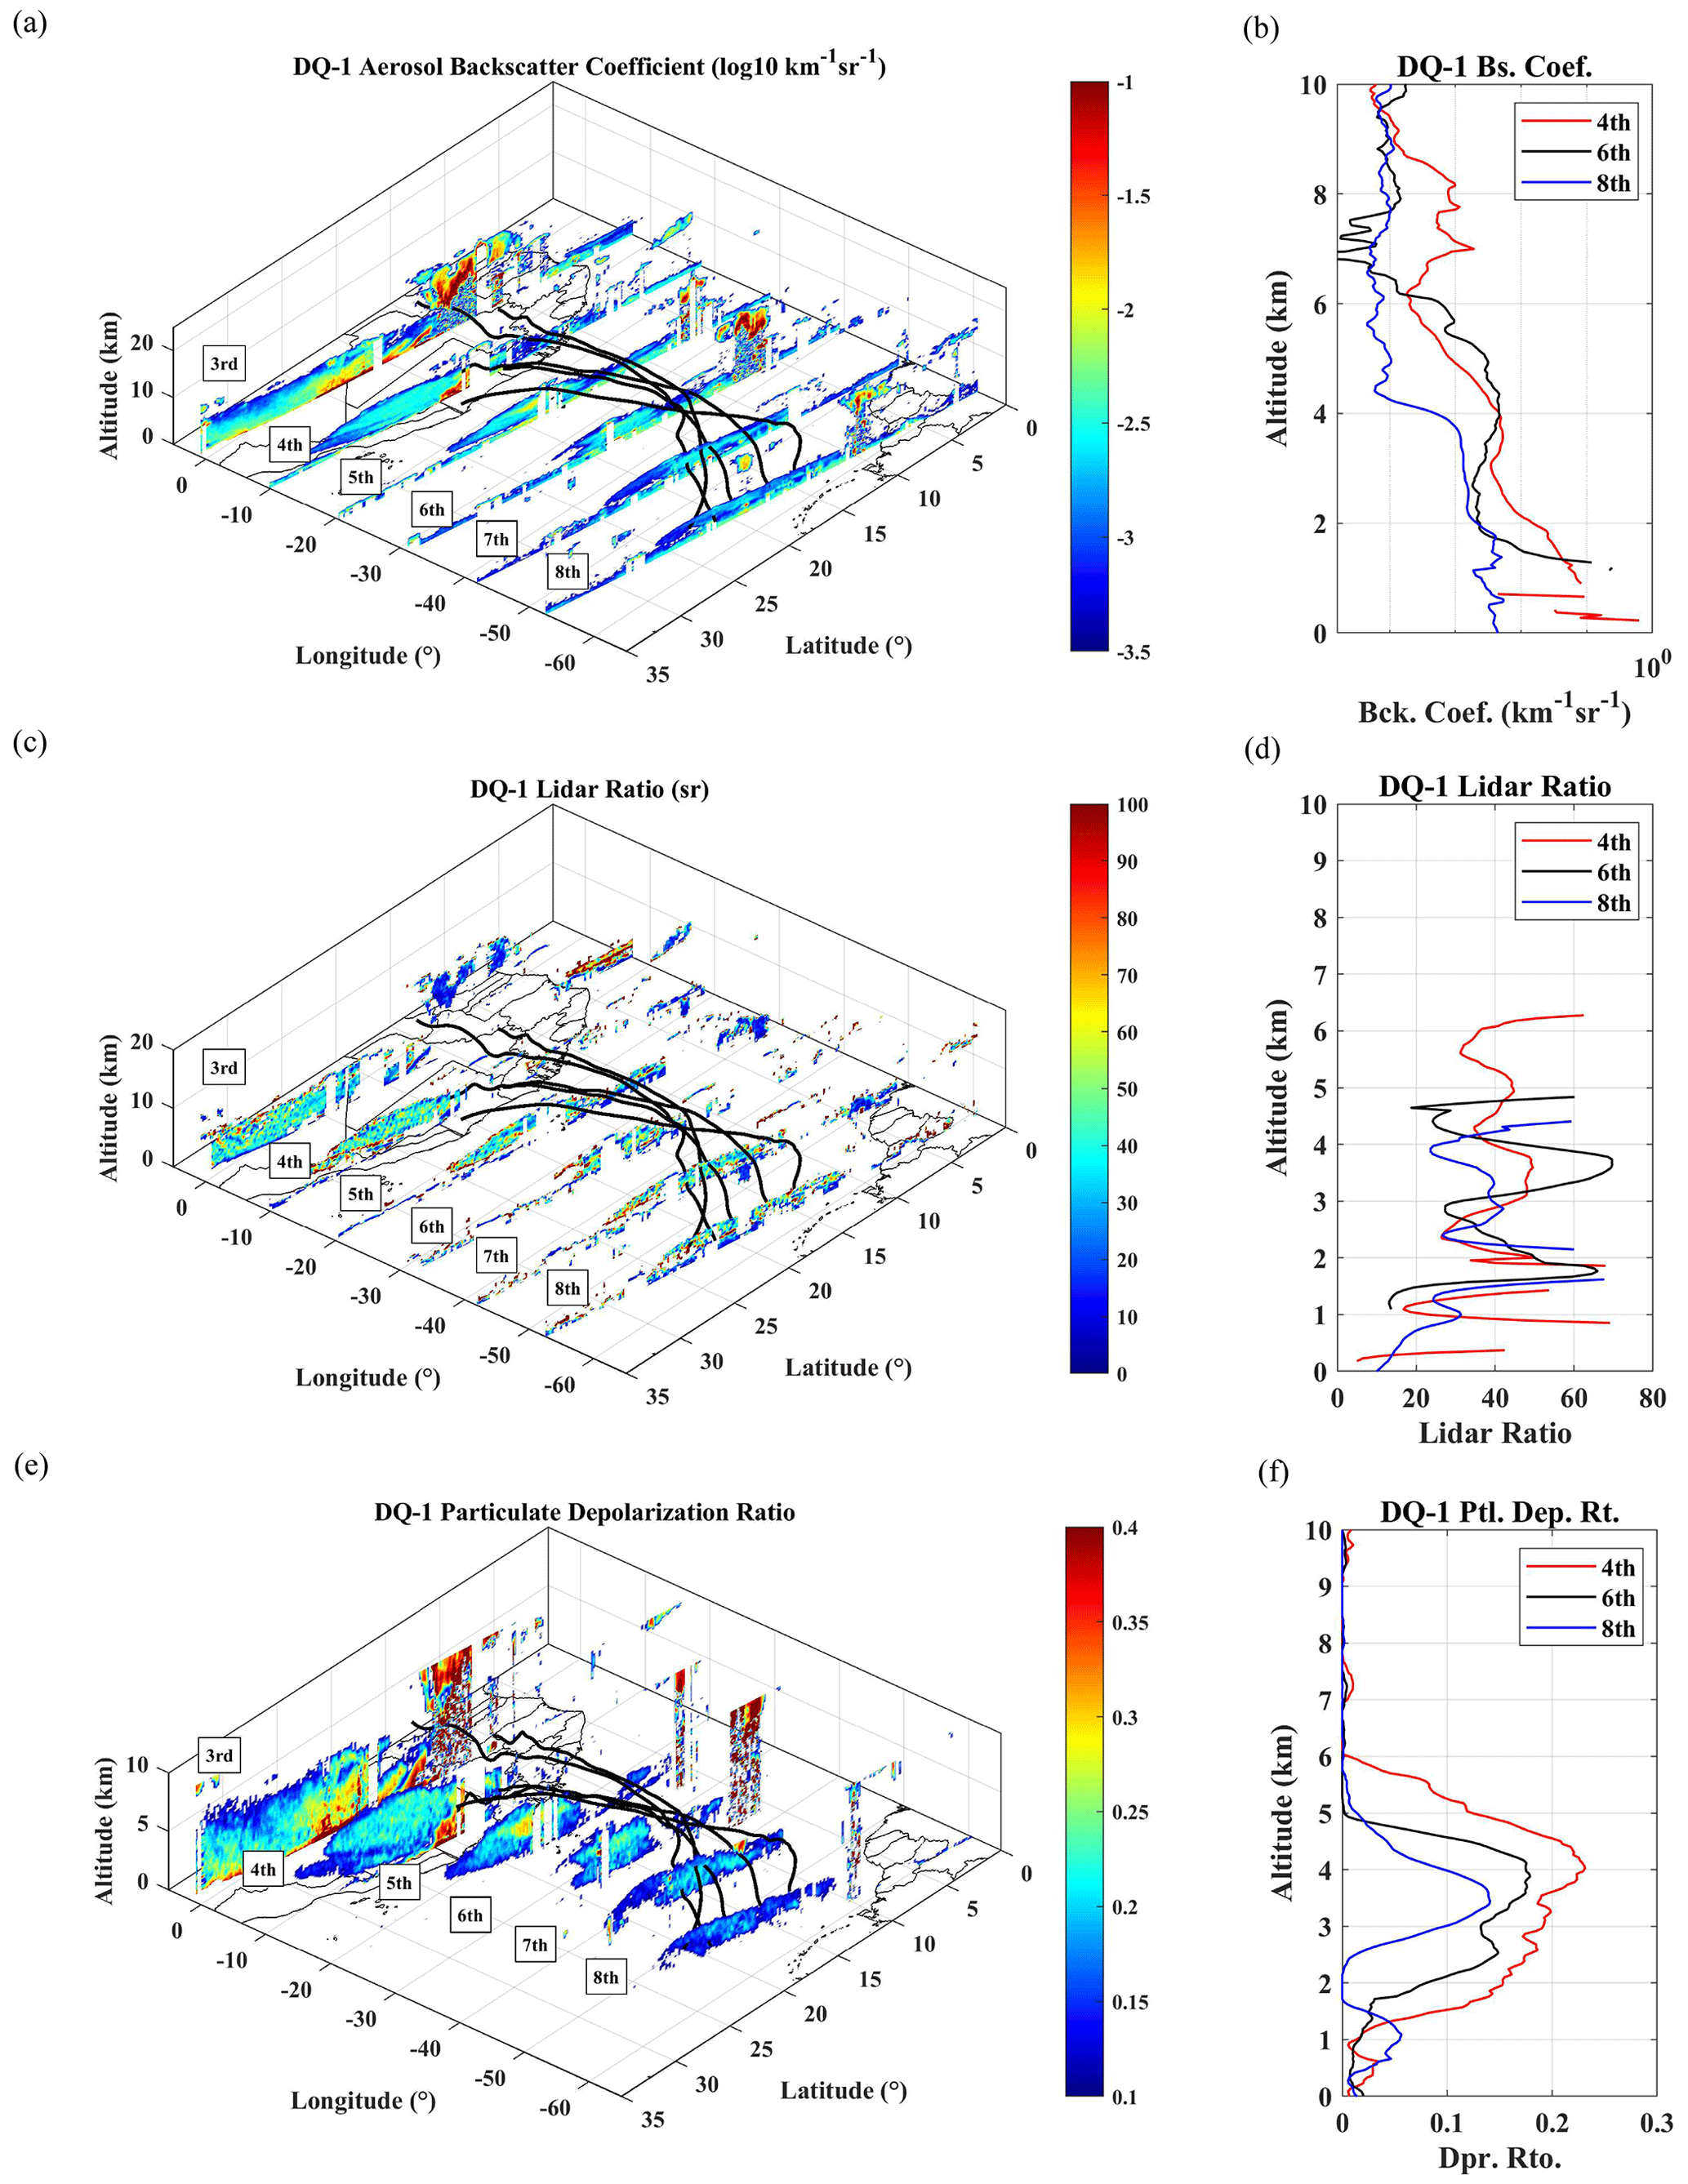
Figure 10Aerosol optical parameters retrieval results from DQ-1 over the Atlantic Ocean and corresponding HYSPLIT backward trajectory analysis. The figure presents observations from six orbits spanning 3 to 8 July, with dates indicated on the left side in (a), (c), and (e). The solid black lines denote the aerosol transport paths derived from the HYSPLIT backward trajectory analysis. (a) DQ-1 aerosol backscatter coefficient; (b) DQ-1 aerosol backscatter coefficient mean profile on 4, 6, and 8 July; (c) DQ-1 lidar ratio; (d) DQ-1 lidar ratio mean profile on 4, 6, and 8 July; (e) DQ-1 depolarization ratio; (f) DQ-1 depolarization ratio mean profile on the 4, 6, and 8 July.
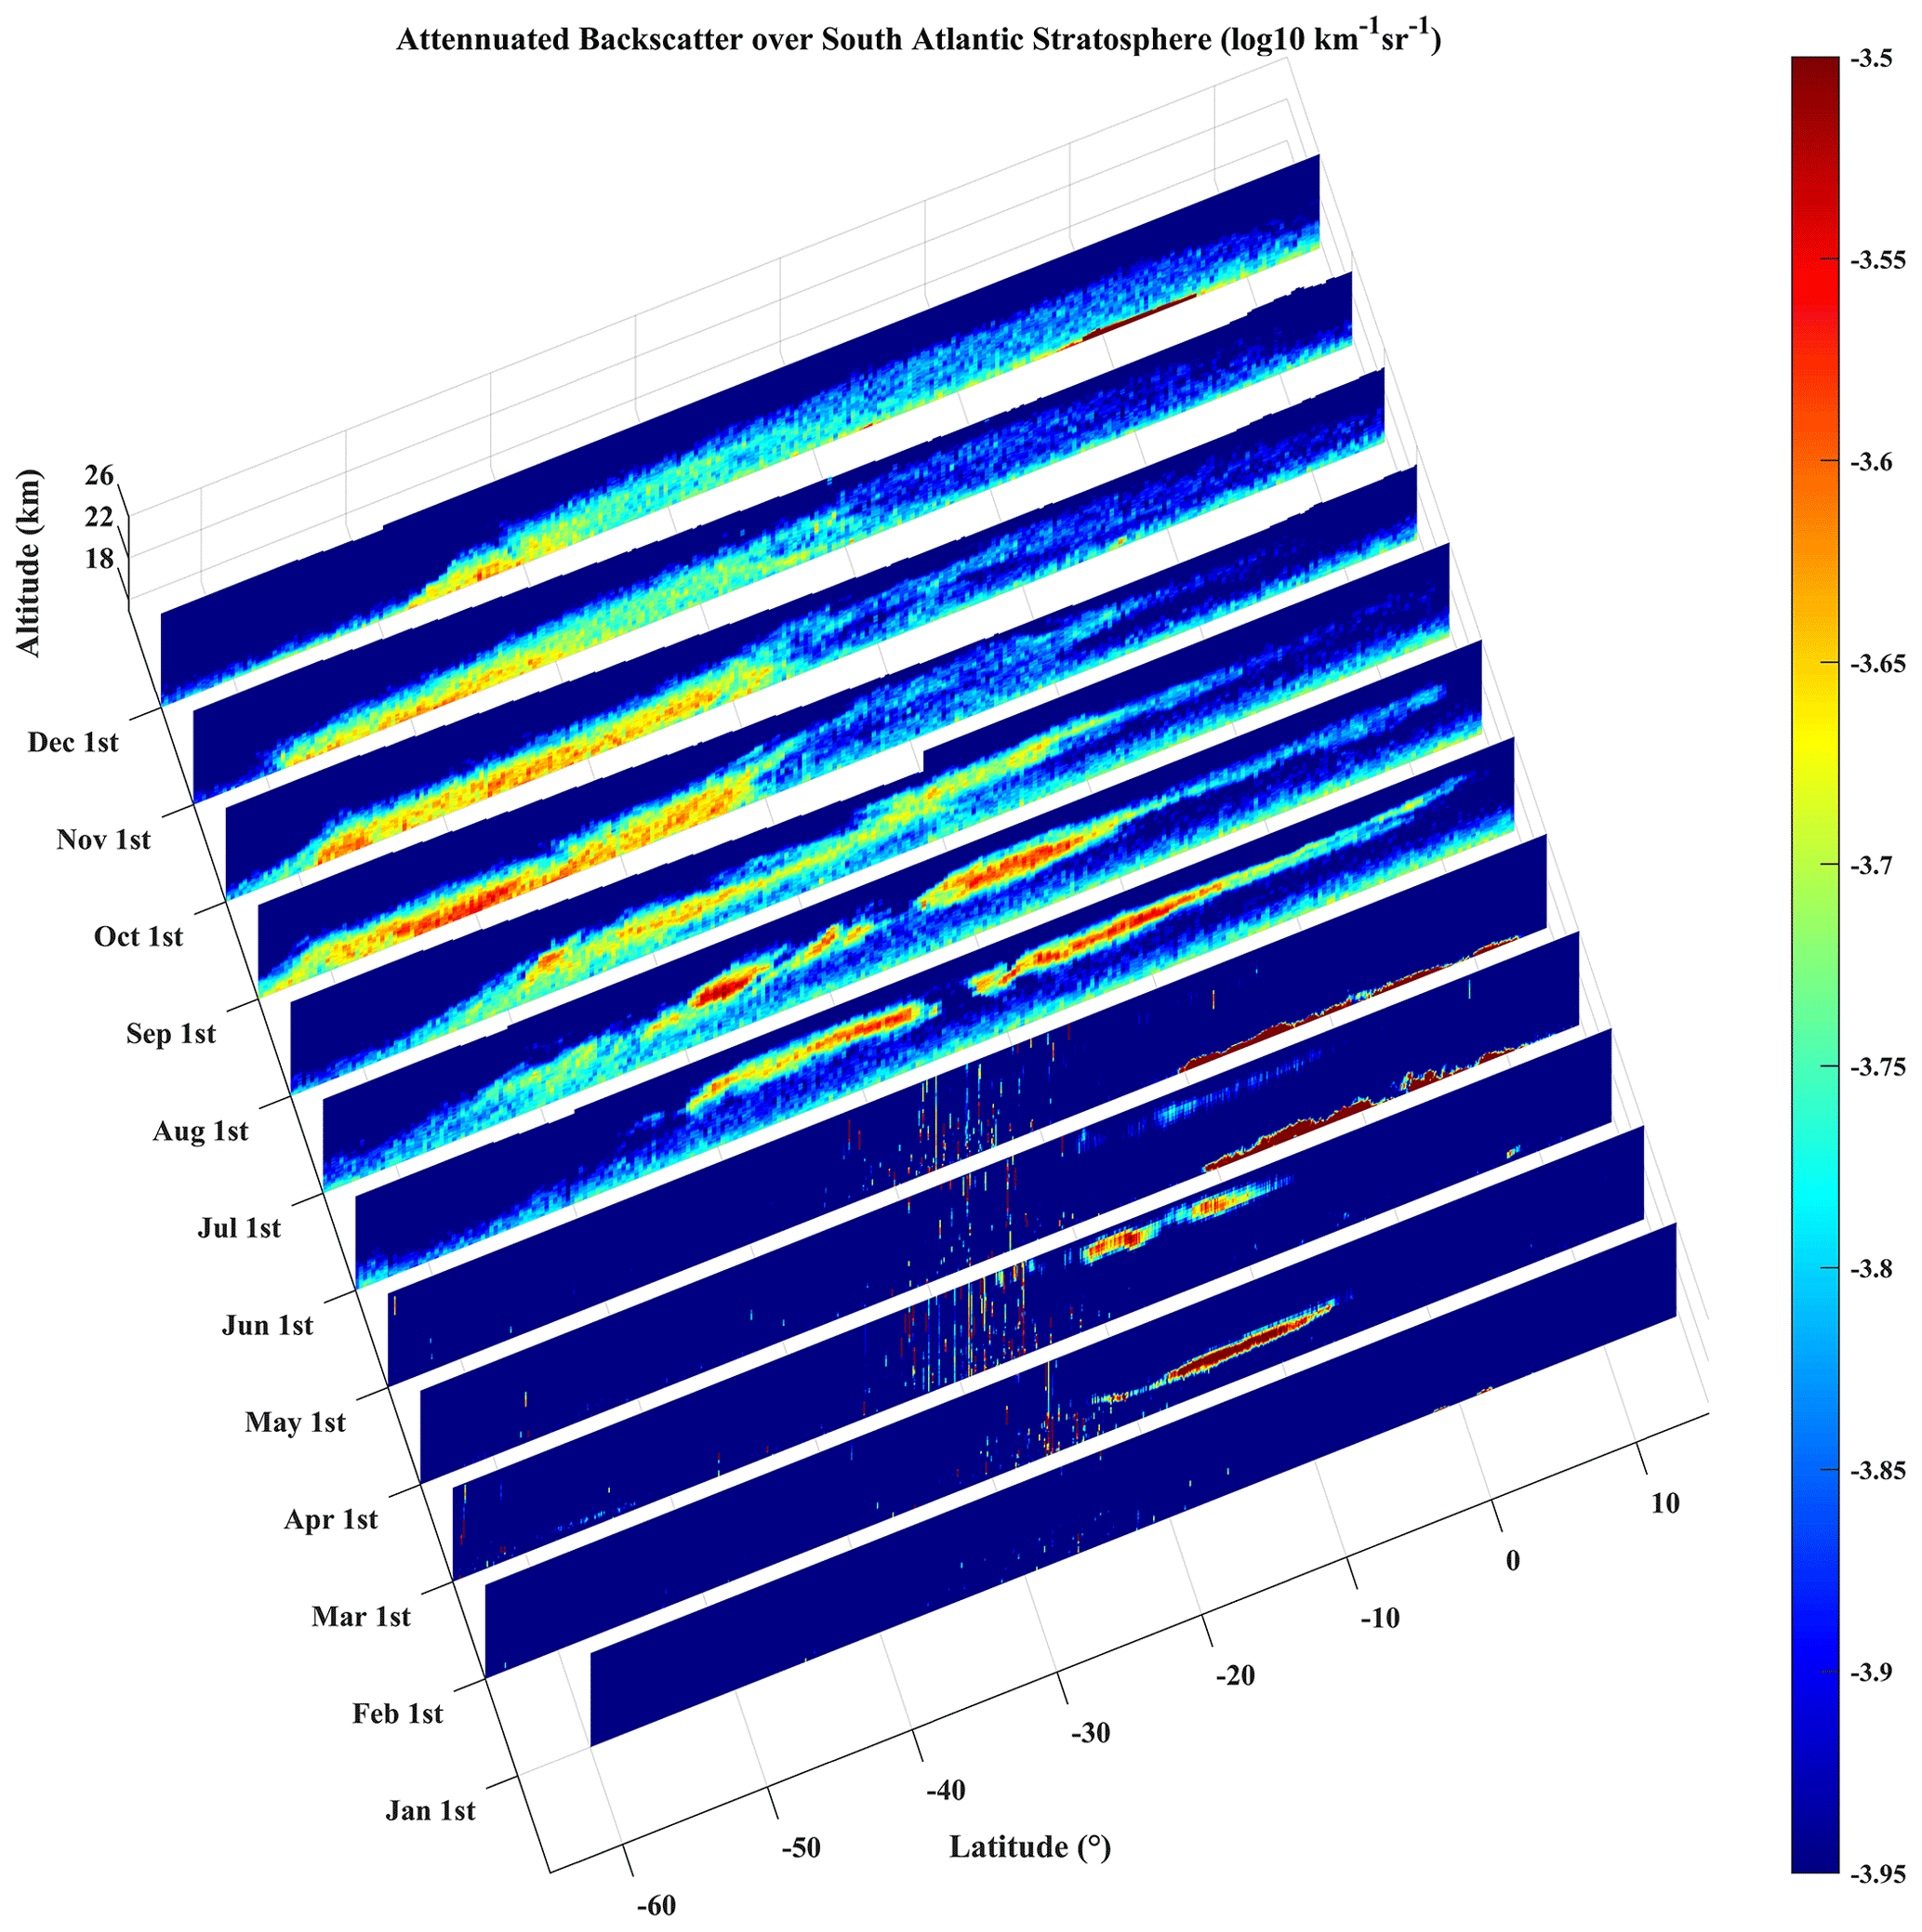
Figure 11Observed volcanic aerosol attenuated backscatter profile in the stratosphere over the South Atlantic in 2022. The left axis displays the date, while the bottom axis displays latitude, with an altitude range of 18 to 26 km; global information is based on the observation results of a single orbit passing through the central South Pacific (10 to 30° W) on the first day of each month. The results from 1 January to 1 May are derived from CALIPSO, while the results from 1 June to 1 December are derived from DQ-1.
4.2 Observation of stratospheric aerosol distribution over the South Atlantic
From 14 to 15 January 2022, the Hunga Tonga–Hunga Ha′apai volcano experienced two significant eruptions, releasing a substantial volume of volcanic ash, gases, and water vapor into the upper atmosphere that led to extensive cloud formations. The volcanic ash reached an altitude of 20 km (Yufeng et al., 2022). DQ-1 observations over the South Atlantic have revealed various effects and the distribution of volcanic aerosol in the stratosphere. As DQ-1 data are available from June to December 2022, we substituted data from February to June 2022 with CALIPSO data. Figure 11 presents the observed attenuated backscatter coefficient from January to December 2022 within the stratosphere over the South Atlantic Ocean, using both CALIPSO and DQ-1. The area in the figure, ranging from 20 to 30° S, falls within CALIPSO's South Atlantic Anomaly (SAA) region. The laser energy is weaker in this region, resulting in a low SNR. On 1 January, CALIPSO detected no aerosol distribution within the stratosphere. Following a volcanic eruption in mid-January, on 1 February, significant signals emerged at an altitude of 20 km, with attenuated backscatter coefficients reaching 10−3 . From February to June, stratospheric aerosols' distribution gradually extended from 5 to 20° S latitude, with the attenuated backscattering reducing constantly to less than 10−4 . By 1 May, due to insufficient laser energy, CALIPSO received weak volcanic aerosol backscatter signals that were difficult to distinguish from system noise. By 1 June, DQ-1 initiated observations in this region, revealing the presence of stratospheric aerosols at an altitude of more than 20 km, spanning 0 to 40° S latitude. Due to the diffusion of volcanic aerosols in the stratosphere and the advantages in terms of laser energy of the DQ-1 system, the results from DQ-1 indicate a broader distribution range of volcanic aerosols. By 1 August, volcanic aerosols had extended southward to 50° S latitude, with an altitude of less than 20 km. From September to December, aerosols were consistently reduced and dissipated within 30 to 60° S latitude. By 1 December, their distribution spanned 30 to 50° S latitude, with altitudes decreasing to around 15 km.
This research has studied satellite-based retrieval algorithms and multi-source data validation of algorithmic results to obtain satellite-based aerosol optical properties accurately. The aerosol optical parameters obtained from DQ-1 have been validated against the product of CALIPSO and molecular backscatter coefficients. The results indicate that DQ-1 exhibits a higher SNR and conforms to the results of trends in molecular scattering. Data products from MPLNET stations, representing the three underlying surface types, were selected for satellite-to-ground validation purposes using DQ-1. Both datasets yielded consistent trends in the depolarization ratio and backscatter coefficient profiles, with a relative error of 25 % after excluding cloud interference. Comparing the aerosol optical depth (AOD) from DQ-1 with the AOD obtained from AERONET within the selected spatiotemporal domain, a correlation analysis yielded an R2 value of 0.803 and RMSE of 0.1231, indicating a strong correlation between the two datasets. The validation process, conducted in conjunction with CALIPSO, MPLNET, and AERONET, ensured the accuracy of the raw data and retrieval results obtained by the system. This paper has detailed an initial application investigating the transport of dust aerosols in eastern Africa using retrieval-based results. The research findings indicate that the lidar ratio remains constant during the aerosol transport process, while the depolarization ratio and backscatter coefficient decrease. The study employed the attenuated backscatter coefficient from CALIPSO and DQ-1 to investigate South Atlantic stratospheric volcanic aerosols in 2022. The research findings have unveiled the latitude and altitude variations in the vertical distribution of volcanic aerosols. The abovementioned preliminary scientific applications demonstrate that the DQ-1 spaceborne HSRL system is capable of accurate global observations. The system can be used to obtain very efficient retrieval techniques and comprehensive multi-source data validation with further scientific applications. Therefore, it can be a suitable alternative for satellite-based systems like CALIPSO.
The DQ-1 L2A data were not publicly available at the time our manuscript was submitted. We were able to access the data as part of the scientific team for DQ-1. The ERA5 data set is available from https://doi.org/10.24381/cds.bd0915c6 (Hersbach et al., 2023). The AERONET dataset was downloaded via https://aeronet.gsfc.nasa.gov/new_web/download_all_v3_aod.html (AERONET, 2023). The MPLNET dataset was downloaded via https://mplnet.gsfc.nasa.gov/download_tool/ (last access: 10 October 2023). The CALIPSO dataset is available from https://doi.org/10.5067/CALIOP/CALIPSO/CAL_LID_L2_05kmALay-Standard-V4-51 (CALIPSO, 2023).
CZ contributed to algorithm development and data analysis and wrote the manuscript. LB, ZL, and QW contributed to scientific discussions and reviewed the manuscript. AM and PL contributed to modifying the grammar of the manuscript and reviewed the manuscript. JL and WC reviewed and edited the manuscript.
The contact author has declared that none of the authors has any competing interests.
Publisher's note: Copernicus Publications remains neutral with regard to jurisdictional claims made in the text, published maps, institutional affiliations, or any other geographical representation in this paper. While Copernicus Publications makes every effort to include appropriate place names, the final responsibility lies with the authors.
We thank the Shanghai Institute of Optics and Fine Mechanics, Chinese Academy of Sciences, for providing the Level 2A data of DQ-1. We thank the AERONET principal investigators (PIs) and their staff for establishing and maintaining AERONET at the 40 sites used in this work. We thank the NASA Langley Research Center for providing the datasets of CALIPSO. We are also thankful to the MPLNET PIs for their effort in establishing and maintaining the Appalachian, El Arenosillo, and Santa Cruz de Tenerife sites. We also thank the European Centre for Medium-Range Weather Forecasts (ECMWF) for providing the ERA5 dataset.
This research has been supported by the National Natural Science Foundation of China–China Academy of General Technology Joint Fund for Basic Research (grant no. 42175145), the National Key R&D Program of China (grant no. 2020YFA0607501), and the Shanghai Aerospace Science and Technology Innovation Foundation (grant no. SAST2022-039).
This paper was edited by Christoph Kiemle and reviewed by Silke Gross and David Winker.
Abril-Gago, J., Guerrero-Rascado, J. L., Costa, M. J., Bravo-Aranda, J. A., Sicard, M., Bermejo-Pantaleón, D., Bortoli, D., Granados-Muñoz, M. J., Rodríguez-Gómez, A., Muñoz-Porcar, C., Comerón, A., Ortiz-Amezcua, P., Salgueiro, V., Jiménez-Martín, M. M., and Alados-Arboledas, L.: Statistical validation of Aeolus L2A particle backscatter coefficient retrievals over ACTRIS/EARLINET stations on the Iberian Peninsula, Atmos. Chem. Phys., 22, 1425–1451, https://doi.org/10.5194/acp-22-1425-2022, 2022.
Bibi, H., Alam, K., Chishtie, F., Bibi, S., Shahid, I., and Blaschke, T.: Intercomparison of MODIS, MISR, OMI, and CALIPSO aerosol optical depth retrievals for four locations on the Indo-Gangetic plains and validation against AERONET data, Atmos. Environ., 111, 113–126, https://doi.org/10.1016/j.atmosenv.2015.04.013, 2015.
Burton, S. P., Ferrare, R. A., Hostetler, C. A., Hair, J. W., Rogers, R. R., Obland, M. D., Butler, C. F., Cook, A. L., Harper, D. B., and Froyd, K. D.: Aerosol classification using airborne High Spectral Resolution Lidar measurements – methodology and examples, Atmos. Meas. Tech., 5, 73–98, https://doi.org/10.5194/amt-5-73-2012, 2012a.
Burton, S. P., Ferrare, R. A., Omar, A. H., Hostetler, C. A., Hair, J. W., Rogers, R., Obland, M. D., Butler, C. F., Cook, A. L., and Harper, D. B.: Comparison of Aerosol Classification From Airborne High Spectral Resolution Lidar and the CALIPSO Vertical Feature Mask, Presentation, Langley Research Center, 2012b.
CALIPSO: Cloud–Aerosol Lidar and Infrared Pathfinder Satellite Observation Lidar Level 2 Aerosol Profile, V4-51, NASA Langley Atmospheric Science Data Center DAAC [data set], https://doi.org/10.5067/CALIOP/CALIPSO/CAL_LID_L2_05kmALay-Standard-V4-51, 2023.
Changzhe, D., Juan, Z., Xinyu, S., Jinru, Y., Fengyang, W., Yang, Z., Juxin, Y., and Zhenyang, L.: Design and Verification for DQ-1 Satellite Aerial Experiment, Aerospace Shanghai (Chinese & English), 40, 122–131, https://doi.org/10.19328/j.cnki.2096-8655.2023.03.015, 2023.
Chiang, C. W., Kumar Das, S., Shih, Y. F., Liao, H. S., and Nee, J. B.: Comparison of CALIPSO and ground-based lidar profiles over Chung-Li, Taiwan, J. Quant. Spectrosc. Ra., 112, 197–203, https://doi.org/10.1016/j.jqsrt.2010.05.002, 2011.
Cornut, F., Amraoui, L., Cuesta, J., and Blanc, J.: Added Value of Aerosol Observations of a Future AOS High Spectral Resolution Lidar with Respect to Classic Backscatter Spaceborne Lidar Measurements, Remote Sens.-Basel, 15, 506, https://doi.org/10.3390/rs15020506, 2023.
Crawford, A. M., Stunder, B. J. B., Ngan, F., and Pavolonis, M. J.: Initializing HYSPLIT with satellite observations of volcanic ash: A case study of the 2008 Kasatochi eruption, J. Geophys. Res.-Atmos., 121, 10786–10803, https://doi.org/10.1002/2016JD024779, 2016.
Dai, G., Wu, S., Long, W., Liu, J., Xie, Y., Sun, K., Meng, F., Song, X., Huang, Z., and Chen, W.: Aerosols and Clouds data processing and optical properties retrieval algorithms for the spaceborne ACDL/DQ-1, EGUsphere [preprint], https://doi.org/10.5194/egusphere-2023-2182, 2023.
Dong, J., Liu, J., Bi, D., Ma, X., Zhu, X., Zhu, X., and Chen, W.: Optimal iodine absorption line applied for spaceborne high spectral resolution lidar, Appl. Optics, 57, 5413–5419, https://doi.org/10.1364/AO.57.005413, 2018.
Dong, J., Liu, J., Zhu, X., Bi, D., Zhu, X., and Chen, W.: Splitting ratio optimization of spaceborne high spectral resolution lidar, Infrared and Laser Engineering, 48, 7–12, https://doi.org/10.3788/IRLA201948.S205001, 2019.
Draxler, R. R. and Hess, G. D.: Description of the HYSPLIT4 modeling system, Technical Memorandum, NOAA technical memorandum ERL ARL; 224, 27 pp., https://repository.library.noaa.gov/view/noaa/31133 (last access: 10 October 2023), 1997.
Esselborn, M., Wirth, M., Fix, A., Tesche, M., and Ehret, G.: Airborne high spectral resolution lidar for measuring aerosol extinction and backscatter coefficients, Appl. Optics, 47, 346–358, https://doi.org/10.1364/ao.47.000346, 2008.
Getzewich, B. J., Vaughan, M. A., Hunt, W. H., Avery, M. A., Powell, K. A., Tackett, J. L., Winker, D. M., Kar, J., Lee, K.-P., and Toth, T. D.: CALIPSO lidar calibration at 532 nm: version 4 daytime algorithm, Atmos. Meas. Tech., 11, 6309–6326, https://doi.org/10.5194/amt-11-6309-2018, 2018.
Groß, S., Tesche, M., Freudenthaler, V., Toledano, C., Wiegner, M., Ansmann, A., Althausen, D., and Seefeldner, M.: Characterization of Saharan dust, marine aerosols and mixtures of biomass-burning aerosols and dust by means of multi-wavelength depolarization and Raman lidar measurements during SAMUM 2, Tellus B, 63, 706–724, https://doi.org/10.1111/j.1600-0889.2011.00556.x, 2011.
Groß, S., Esselborn, M., Weinzierl, B., Wirth, M., Fix, A., and Petzold, A.: Aerosol classification by airborne high spectral resolution lidar observations, Atmos. Chem. Phys., 13, 2487–2505, https://doi.org/10.5194/acp-13-2487-2013, 2013.
Guibert, S., Matthias, V., Schulz, M., Bösenberg, J., Eixmann, R., Mattis, I., Pappalardo, G., Rita Perrone, M., Spinelli, N., and Vaughan, G.: The vertical distribution of aerosol over Europe – synthesis of one year of EARLINET aerosol lidar measurements and aerosol transport modeling with LMDzT-INCA, Atmos. Environ., 39, 2933–2943, https://doi.org/10.1016/j.atmosenv.2004.12.046, 2005.
Hair, J. W., Caldwell, L. M., Krueger, D. A., and She, C.-Y.: High-Spectral-Resolution Lidar with Iodine-Vapor Filters: Measurement of Atmospheric-State and Aerosol Profiles, Appl. Optics, 40, 5280–5294, https://doi.org/10.1364/AO.40.005280, 2001.
Hersbach, H., Bell, B., Berrisford, P., Biavati, G., Horányi, A., Muñoz Sabater, J., Nicolas, J., Peubey, C., Radu, R., Rozum, I., Schepers, D., Simmons, A., Soci, C., Dee, D., and Thépaut, J.-N.: ERA5 hourly data on pressure levels from 1940 to present, Copernicus Climate Change Service (C3S) Climate Data Store (CDS), ECMWF [data set], https://doi.org/10.24381/cds.bd0915c6, 2023.
Holben, B. N., Eck, T. F., Slutsker, I., Tanré, D., Buis, J. P., Setzer, A., Vermote, E., Reagan, J. A., Kaufman, Y. J., Nakajima, T., Lavenu, F., Jankowiak, I., and Smirnov, A.: AERONET – A Federated Instrument Network and Data Archive for Aerosol Characterization, Remote Sens. Environ., 66, 1–16, https://doi.org/10.1016/S0034-4257(98)00031-5, 1998.
Huang, J., Minnis, P., Chen, B., Huang, Z., Liu, Z., Zhao, Q., Yi, Y., and Ayers, J. K.: Long-range transport and vertical structure of Asian dust from CALIPSO and surface measurements during PACDEX, J. Geophys. Res.-Atmos., 113, D23212, https://doi.org/10.1029/2008JD010620, 2008.
Juxin, Y., Yang, Z., Chuncan, F., Qin, W., Xufeng, Z., Shiguang, L., Junxuan, Z., Lingbing, B., Jiqiao, L., and Weibiao, C.: Development and Flight Verification of Airborne Aerosol and Carbon Dioxide Detection Lidar, Aerospace Shanghai (Chinese & English), 40, 84–92, https://doi.org/10.19328/j.cnki.2096-8655.2023.03.010, 2023.
Kaufman, Y. J., Tanré, D., and Boucher, O.: A satellite view of aerosols in the climate system, Nature, 419, 215–223, https://doi.org/10.1038/nature01091, 2002.
Ke, J., Sun, Y., Dong, C., Zhang, X., Wang, Z., Lyu, L., Zhu, W., Ansmann, A., Su, L., Bu, L., Xiao, D., Wang, S., Chen, S., Liu, J., Chen, W., and Liu, D.: Development of China's first space-borne aerosol-cloud high-spectral-resolution lidar: retrieval algorithm and airborne demonstration, PhotoniX, 3, 17, https://doi.org/10.1186/s43074-022-00063-3, 2022.
Knobelspiesse, K., Cairns, B., Ottaviani, M., Ferrare, R., Hair, J., Hostetler, C., Obland, M., Rogers, R., Redemann, J., Shinozuka, Y., Clarke, A., Freitag, S., Howell, S., Kapustin, V., and McNaughton, C.: Combined retrievals of boreal forest fire aerosol properties with a polarimeter and lidar, Atmos. Chem. Phys., 11, 7045–7067, https://doi.org/10.5194/acp-11-7045-2011, 2011.
Langley Research Center: The Cloud-Aerosol Lidar and Infrared Pathfinder Satellite Observation (CALIPSO), https://www-calipso.larc.nasa.gov/ (last access: 10 October 2023), 2023.
Liu, D., Zheng, Z., Chen, W., Wang, Z., Li, W., Ke, J., Zhang, Y., Chen, S., Cheng, C., and Wang, S.: Performance estimation of space-borne high-spectral-resolution lidar for cloud and aerosol optical properties at 532 nm, Opt. Express, 27, A481–A494, https://doi.org/10.1364/oe.27.00a481, 2019.
Liu, Z., Kar, J., Zeng, S., Tackett, J., Vaughan, M., Avery, M., Pelon, J., Getzewich, B., Lee, K.-P., Magill, B., Omar, A., Lucker, P., Trepte, C., and Winker, D.: Discriminating between clouds and aerosols in the CALIOP version 4.1 data products, Atmos. Meas. Tech., 12, 703–734, https://doi.org/10.5194/amt-12-703-2019, 2019.
Mattis, I., Ansmann, A., Müller, D., Wandinger, U., and Althausen, D.: Multiyear aerosol observations with dual-wavelength Raman lidar in the framework of EARLINET, J. Geophys. Res.-Atmos., 109, D13203, https://doi.org/10.1029/2004JD004600, 2004.
McGill, M. J., Vaughan, M. A., Trepte, C. R., Hart, W. D., Hlavka, D. L., Winker, D. M., and Kuehn, R.: Airborne validation of spatial properties measured by the CALIPSO lidar, J. Geophys. Res.-Atmos., 112, D20201, https://doi.org/10.1029/2007JD008768, 2007.
McPherson, C. J., Reagan, J. A., Schafer, J., Giles, D., Ferrare, R., Hair, J., and Hostetler, C.: AERONET, airborne HSRL, and CALIPSO aerosol retrievals compared and combined: A case study, J. Geophys. Res.-Atmos., 115, D00H21, https://doi.org/10.1029/2009JD012389, 2010.
NASA: MPLNET, The NASA Micro-Pulse Lidar Network, Goddard Space Flight Center [data set], https://mplnet.gsfc.nasa.gov/download_tool/ (last access: 10 October 2023), 2023.
Nishizawa, T., Sugimoto, N., Matsui, I., Shimizu, A., Higurashi, A., and Jin, Y.: The Asian Dust and Aerosol Lidar Observation Network (AD-NET): Strategy and Progress, EPJ Web Conf., 119, 19001, https://doi.org/10.1051/epjconf/201611919001, 2016.
Omar, A. H., Winker, D. M., Tackett, J. L., Giles, D. M., Kar, J., Liu, Z., Vaughan, M. A., Powell, K. A., and Trepte, C. R.: CALIOP and AERONET aerosol optical depth comparisons: One size fits none, J. Geophys. Res.-Atmos., 118, 4748–4766, https://doi.org/10.1002/jgrd.50330, 2013.
Pappalardo, G., Amodeo, A., Apituley, A., Comeron, A., Freudenthaler, V., Linné, H., Ansmann, A., Bösenberg, J., D'Amico, G., Mattis, I., Mona, L., Wandinger, U., Amiridis, V., Alados-Arboledas, L., Nicolae, D., and Wiegner, M.: EARLINET: towards an advanced sustainable European aerosol lidar network, Atmos. Meas. Tech., 7, 2389–2409, https://doi.org/10.5194/amt-7-2389-2014, 2014.
Pitari, G., Di Carlo, P., Coppari, E., De Luca, N., Di Genova, G., Iarlori, M., Pietropaolo, E., Rizi, V., and Tuccella, P.: Aerosol measurements at L'Aquila EARLINET station in central Italy: Impact of local sources and large scale transport resolved by LIDAR, J. Atmos. Sol.-Terr. Phy., 92, 116–123, https://doi.org/10.1016/j.jastp.2012.11.004, 2013.
Proestakis, E., Amiridis, V., Marinou, E., Binietoglou, I., Ansmann, A., Wandinger, U., Hofer, J., Yorks, J., Nowottnick, E., Makhmudov, A., Papayannis, A., Pietruczuk, A., Gialitaki, A., Apituley, A., Szkop, A., Muñoz Porcar, C., Bortoli, D., Dionisi, D., Althausen, D., Mamali, D., Balis, D., Nicolae, D., Tetoni, E., Liberti, G. L., Baars, H., Mattis, I., Stachlewska, I. S., Voudouri, K. A., Mona, L., Mylonaki, M., Perrone, M. R., Costa, M. J., Sicard, M., Papagiannopoulos, N., Siomos, N., Burlizzi, P., Pauly, R., Engelmann, R., Abdullaev, S., and Pappalardo, G.: EARLINET evaluation of the CATS Level 2 aerosol backscatter coefficient product, Atmos. Chem. Phys., 19, 11743–11764, https://doi.org/10.5194/acp-19-11743-2019, 2019.
Qin, K., Wu, L., Wong, M. S., Letu, H., Hu, M., Lang, H., Sheng, S., Teng, J., Xiao, X., and Yuan, L.: Trans-boundary aerosol transport during a winter haze episode in China revealed by ground-based Lidar and CALIPSO satellite, Atmos. Environ., 141, 20–29, https://doi.org/10.1016/j.atmosenv.2016.06.042, 2016.
Reverdy, M., Chepfer, H., Donovan, D., Noel, V., Cesana, G., Hoareau, C., Chiriaco, M., and Bastin, S.: An EarthCARE/ATLID simulator to evaluate cloud description in climate models, J. Geophys. Res.-Atmos., 120, 11090–11113, https://doi.org/10.1002/2015JD023919, 2015.
Stein, A. F., Draxler, R. R., Rolph, G. D., Stunder, B. J. B., Cohen, M. D., and Ngan, F.: NOAA's HYSPLIT Atmospheric Transport and Dispersion Modeling System, B. Am. Meteorol. Soc., 96, 2059–2077, https://doi.org/10.1175/BAMS-D-14-00110.1, 2015.
Tenti, G., Boley, C. D., and Desai, R. C.: On the Kinetic Model Description of Rayleigh–Brillouin Scattering from Molecular Gases, Can. J. Phys., 52, 285–290, https://doi.org/10.1139/p74-041, 1974.
Tesche, M., Ansmann, A., Müller, D., Althausen, D., Engelmann, R., Freudenthaler, V., and Groß, S.: Vertically resolved separation of dust and smoke over Cape Verde using multiwavelength Raman and polarization lidars during Saharan Mineral Dust Experiment 2008, J. Geophys. Res., 114, D13202, https://doi.org/10.1029/2009JD011862, 2009.
Vaughan, M., Garnier, A., Josset, D., Avery, M., Lee, K.-P., Liu, Z., Hunt, W., Pelon, J., Hu, Y., Burton, S., Hair, J., Tackett, J. L., Getzewich, B., Kar, J., and Rodier, S.: CALIPSO lidar calibration at 1064 nm: version 4 algorithm, Atmos. Meas. Tech., 12, 51–82, https://doi.org/10.5194/amt-12-51-2019, 2019.
Wang, Q., Bu, L., Tian, L., Xu, J., Zhu, S., and Liu, J.: Validation of an airborne high spectral resolution Lidar and its measurement for aerosol optical properties over Qinhuangdao, China, Opt. Express, 28, 24471–24488, https://doi.org/10.1364/oe.397582, 2020.
Wang, T., Fetzer, E. J., Wong, S., Kahn, B. H., and Yue, Q.: Validation of MODIS cloud mask and multilayer flag using CloudSat-CALIPSO cloud profiles and a cross-reference of their cloud classifications, J. Geophys. Res.-Atmos., 121, 11620–11635, https://doi.org/10.1002/2016JD025239, 2016.
Wang, X. and Chen, J.: Fog Formation in Cold Season in Ji'nan, China: Case Analyses with Application of HYSPLIT Model, Adv. Meteorol., 2014, 940956, https://doi.org/10.1155/2014/940956, 2014.
Wehr, T., Kubota, T., Tzeremes, G., Wallace, K., Nakatsuka, H., Ohno, Y., Koopman, R., Rusli, S., Kikuchi, M., Eisinger, M., Tanaka, T., Taga, M., Deghaye, P., Tomita, E., and Bernaerts, D.: The EarthCARE mission – science and system overview, Atmos. Meas. Tech., 16, 3581–3608, https://doi.org/10.5194/amt-16-3581-2023, 2023.
Weibiao, C., Jiqiao, L., Xia, H., Huaguo, Z., Xiuhua, M., Yuan, W., and Xiaopeng, Z.: Lidar Technology for Atmosphere Environment Monitoring Satellite, Aerospace Shanghai (Chinese & English), 40, 13–20, https://doi.org/10.19328/j.cnki.2096-8655.2023.03.002, 2023.
Welton, E., Campbell, J., Spinhirne, J., and Scott, V. S.: Global monitoring of clouds and aerosols using a network of micropulse lidar systems, Proc. SPIE 4153, Lidar Remote Sensing for Industry and Environment Monitoring (13 February 2001), https://doi.org/10.1117/12.417040, 2001.
Winker, D., Pelon Jr., J., J., Ackerman, S., Charlson, R., Colarco, P., Flamant, P., Fu, Q., Hoff, R., Kittaka, C., Kubar, T., Treut, H., McCormick, M., Mégie, G., Poole, L., Trepte, C., Vaughan, M., and Wielicki, B.: The Calipso Mission: A Global 3D View of Aerosols and Clouds, B. Am. Meteorol. Soc., 91, 1211–1230, https://doi.org/10.1175/2010BAMS3009.1, 2010.
Xiong, Z., Xu, X., Yang, Y., and Luo, T.: Diurnal vertical distribution and transport of dust aerosol over and around Tibetan Plateau from lidar on International Space Station, Atmos. Res., 294, 106939, https://doi.org/10.1016/j.atmosres.2023.106939, 2023.
Xu, J., Bu, L., Liu, J., Zhang, Y., Zhu, S., Wang, Q., Zhu, X., and Chen, W.: Airborne High-Spectral-Resolution Lidar for Atmospheric Aerosol Detection, Chinese Journal of Lasers, 47, 411–420, https://doi.org/10.3788/CJL202047.0710003, 2020.
Yorks, J. E., McGill, M. J., Palm, S. P., Hlavka, D. L., Selmer, P. A., Nowottnick, E. P., Vaughan, M. A., Rodier, S. D., and Hart, W. D.: An overview of the CATS level 1 processing algorithms and data products, Geophys. Res. Lett., 43, 4632–4639, https://doi.org/10.1002/2016GL068006, 2016.
Yufeng, H., Zhenhong, L., Le, W., Bo, C., Wu, Z., Shuangcheng, Z., Jiantao, D., Xuesong, Z., Jing, Y., Meiling, Z., Zhenjiang, L., Sisi, W., Chen, M., Lianchong, Z., and Jianbing, P.: Rapid Interpretation and Analysis of the 2022 Eruption of Hunga Tonga Hunga Ha'apai Volcano with Integrated Remote Sensing Techniques, Geomatics and Information Science of Wuhan University, 47, 242–250, https://doi.org/10.13203/j.whugis20220050, 2022.
Zheng, Z., Chen, W., Zhang, Y., Chen, S., and Liu, D.: Denoising the space-borne high-spectral-resolution lidar signal with block-matching and 3D filtering, Appl. Optics, 59, 2820–2828, https://doi.org/10.1364/AO.385469, 2020.
Zhu, S., Bu, L., Liu, J., Wang, Q., Yang, J., Zhang, Y., Zhu, X., and Cheng, W.: Study on Airborne High Spectral Resolution Lidar Detecting Optical properties and Pollution of Atmospheric Aerosol, Chinese Journal of Lasers, 48, 164–176, https://doi.org/10.3788/CJL202148.1710003, 2021.