the Creative Commons Attribution 4.0 License.
the Creative Commons Attribution 4.0 License.
 | 29 Jul 2024
A novel, balloon-borne UV–Vis spectrometer for direct sun measurements of stratospheric bromine
Karolin Voss
Philip Holzbeck
Klaus Pfeilsticker
Ralph Kleinschek
Gerald Wetzel
Blanca Fuentes Andrade
Michael Höpfner
Jörn Ungermann
Björn-Martin Sinnhuber
André Butz
We report on a novel, medium-weight (∼ 25 kg) optical spectrometer coupled to an automated sun tracker for direct sun observations from azimuth-controlled balloon platforms weighing approximately 12 kg. It is designed to measure a suite of UV–Vis absorbing gases relevant in the context of stratospheric ozone depletion using the differential optical absorption spectroscopy (DOAS) method, i.e. O3, NO2, BrO, OClO, HONO, and IO. Here, we describe the design and major features of the instrument. Further, the instrument's performance during two stratospheric deployments from Esrange near Kiruna (Sweden) on 21 August 2021 and from Timmins (Ontario, Canada) on 23 August 2022 is discussed along with the first results concerning inferred mixing ratios of BrO above balloon float altitude. Using a photochemical correction for the partitioning of stratospheric bromine () obtained by chemical transport simulations, the inferred total stratospheric bromine load [Bry] amounts to (17.5 ± 2.2) ppt, with a purely statistical error amounting to 1.5 ppt in (5.5 ± 1.0)-year old air. The latter is inferred from simultaneous measurements of N2O by the GLORIA (Gimballed Limb Observer for Radiance Imaging of the Atmosphere) mid-IR instrument, resulting in a stratospheric entry of the investigated air mass in early 2017 ± 1 year.
- Article
(8296 KB) - Full-text XML
- BibTeX
- EndNote


Although much less abundant than chlorine, bromine contributes about one-third to the columnar loss in stratospheric ozone since it has an ozone depletion potential as large as 60 to 75 (Ko et al., 2003; Sinnhuber et al., 2009; Engel et al., 2018; Koenig et al., 2020; Klobas et al., 2020; Laube et al., 2022). In 2021/22, sources of stratospheric bromine included synthetic brominated organic species amounts of ∼ 1.5 ppt from CH3Br, ∼ 7.1 ppt from the halons, ∼ 5.5 ppt from naturally emitted CH3Br, and ∼ 5 ppt from so-called brominated very short-lived substances (VSLSs) and their organic decay products. The total of these sources reached a maximum of about 22.1 ppt around the turn of the century but declined afterwards to (19.2 ± 1.2) ppt in 2017/18, mostly due to the emission reduction regulations agreed on in the Montreal Protocol (Rotermund et al., 2021; Laube et al., 2022). Under a changing climate, future stratospheric bromine abundances could increase again, mostly due to stronger marine emissions and the more efficient delivery of brominated VSLSs to the stratosphere, but the extent of these changes remains speculative (Falk et al., 2017).
However, it is not fully clear what the notion “delivery to the stratosphere” really means for the stratospheric budget of bromine, since bromine enters the stratosphere via (a) the tropical tropopause layer, (b) transport in the lower branch of the Brewer–Dobson circulation, and (c) extra-tropical stratosphere–troposphere exchange. At the same time, bromine may undergo uncertain transformation processes of the gaseous species into particulate form and vice versa and hence may become subject to heterogeneous removal (Sinnhuber and Folkins, 2006; Werner et al., 2017; Rotermund et al., 2021). Therefore, bromine's amounts in the lowermost stratosphere may (slightly) differ from its amounts in the middle stratosphere. Comparing the bromine transported through the tropical tropopause layer (e.g. Werner et al., 2017; Wales et al., 2018) and the bromine found in the tropical middle stratosphere or the descending branch of the Brewer–Dobson circulation (e.g. Dorf et al., 2008; Rotermund et al., 2021) points to differences of 1–2 ppt. This small difference in total bromine may point to some inorganic bromine being scavenged during its transport from the lower to middle stratosphere and may accordingly reduce the bromine-mediated loss in ozone (Sinnhuber and Folkins, 2006). As a consequence, to further quantify all these processes, it appears desirable to precisely measure and specify all forms of bromine in all sub-domains of the stratosphere.
Traditionally, stratospheric bromine abundances have been inferred from measured bromine monoxide (BrO) or bromine nitrate (BrONO2) concentrations employing a suitable correction for bromine partitioning by using in situ and remote sensing instrumentation, which was deployed on crewed and uncrewed aircraft, high-flying balloons, and satellites (e.g. Brune et al., 1989; Toohey et al., 1990; Harder et al., 1998, 2000; Pundt et al., 2002; Sioris et al., 2006; Theys et al., 2009; Höpfner et al., 2009, 2021; Rozanov et al., 2011; Liao et al., 2012; Stachnik et al., 2013; Volkamer et al., 2015; Werner et al., 2017; Wetzel et al., 2017; Rotermund et al., 2021). Among the various employed techniques (e.g. resonance fluorescence, chemical ionisation mass spectrometry, mid-infrared and microwave spectroscopy, and differential optical absorption spectroscopy – DOAS), DOAS for direct sunlight (solar occultation) and atmospheric skylight measurements has been used most widely for BrO observations in the lower and middle stratosphere, due to its excellent selectivity, sensitivity, and repeatability (Harder et al., 1998, 2000; Pundt et al., 2002; Weidner et al., 2005). In particular, the repeatability of these DOAS observations helped establish the trend in total stratospheric bromine in the past 3 decades, which is necessary for the verification of the regulations of the Montreal Protocol (Dorf et al., 2006b; WMO, 2022).
From 1996 until 2012, we regularly deployed a DOAS instrument for solar occultation measurements of the halogen oxides BrO, chlorine dioxide (OClO), and iodine oxide (IO) in the stratosphere on the azimuth-stabilised LPMA (Laboratoire de Physique Moléculaire et Applications)/DOAS balloon gondola (Camy-Peyret et al., 1993, 1995, 1999; Ferlemann et al., 1998, 2000). However, due to a change in ballooning technology and operations by the CNES (Centre National d'Études Spatiales) in the mid-2010s, the previously used LPMA/DOAS balloon gondola and the DOAS solar occultation instrument were decommissioned. Hence, the solar tracker previously provided by LPMA was no longer available. Here, we present a newly developed, compact DOAS spectrometer system coupled to an active, stand-alone solar tracker for balloon-borne solar occultation measurements of mid-stratospheric BrO and, possibly (to be addressed by future studies), other UV–Vis absorbing gases such as IO and OClO. We report on the instrument setup, the demonstration deployments, and the performance of the new system for BrO concentration measurements and the derived total inorganic bromine ([Bry]).
The paper is structured as follows. Section 2 reports on the two deployments to date, Sect. 3 describes the design and technical features of the spectrometer system and the sun tracker as well as its performance, and Sect. 4 discusses the different methods used to infer total bromine from measured BrO. Section 5 reports on the stratospheric abundances inferred from the second deployment and discusses the obtained results. Section 6 concludes the study.
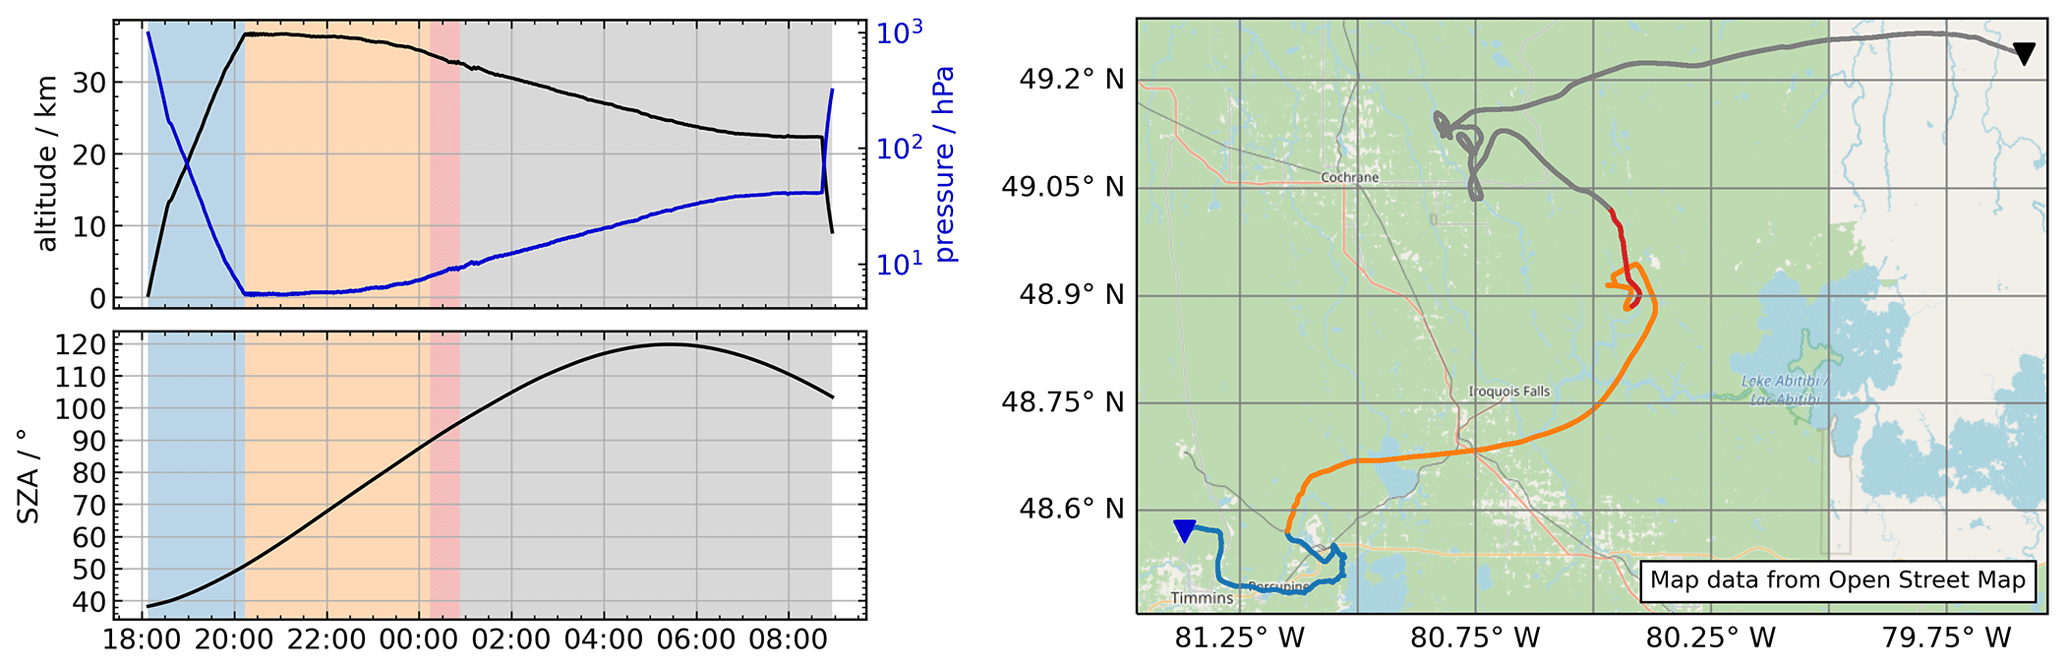
Figure 1Flight profile (left) of the second deployment from Timmins, Canada (23 August 2022), showing balloon altitude, air pressure (top-left panel), and SZA over time (UTC) (bottom-left panel). The shadings indicate the distinct phases of the flight: balloon ascent (blue), balloon float with SZA < 90° (orange), solar occultation (red), and night (grey). The balloon's trajectory (right) is marked by the same flight phase colours. The blue triangle marks the launching site, and the black triangle marks the landing site of the balloon. Due to a leakage of the helium balloon, it descended slowly after reaching the maximum altitude (36 km) around 20:00 UTC. Map from Open Street Map. © OpenStreetMap contributors 2023. Distributed under the Open Data Commons Open Database License (ODbL) v1.0.
To date, the new instrument has been deployed twice on board azimuth-stabilised stratospheric balloon gondolas. Here, we will mainly report on the second deployment, which took place in Timmins, Ontario, Canada (48.57° N, 81.37° W), on 23 August 2022 in the early afternoon (launch at 18:08 UTC, 14:08 LT). The flight profile and trajectory of this balloon flight are shown in Fig. 1. We collected good-quality measurements under afternoon and sunset conditions (solar zenith angles (SZAs) between 55 and 96°) from a balloon ceiling altitude between 32 and 36.5 km. Measurements during the ascent of the balloon into the stratosphere were not possible since the azimuth rotation of the gondola could not be stabilised due to high wind shear. The other remote sensing payloads on this flight were GLORIA (Gimballed Limb Observer for Radiance Imaging of the Atmosphere from the Karlsruhe Institute of Technology (KIT) and the Forschungszentrum Jülich (FzJ); Riese et al., 2014; Friedl-Vallon et al., 2014; Höpfner et al., 2022) and FIRMOS (Far-Infrared Radiation Mobile Observation System from the National Institute of Optics (CNR-INO); Belotti et al., 2023; Palchetti et al., 2021).
One year before, on 21 August 2021, the first deployment of our instrument took place from Esrange near Kiruna, Sweden (67.89° N, 21.08° E), in the afternoon (launch at 15:08 UTC, 17:08 LT). This flight (total flight time around 18 h) allowed us to record spectra during sunset (SZA between 85 and 95°) and subsequent sunrise (SZA between 94.5 and 61°) from balloon altitudes above 32 km. Measurements during the ascent of the balloon into the stratosphere were impossible due to both technical problems with our instrument and difficulties with the azimuth stabilisation of the gondola. GLORIA and ALI (Aerosol Limb Imager from the Institute of Space and Atmospheric Studies at the University of Saskatchewan, Elash et al., 2016) were other scientific payloads on the same flight. While we report on the performance of the solar tracker for the first flight, spectroscopic artefacts (etalon structures) hinder us from carrying out and reporting on the spectral analysis. We were able to reduce these artefacts for the second flight from Timmins to the extent that we can correct from them (see Sect. 4.1). Thus, our spectroscopic results mainly derive from the second flight.
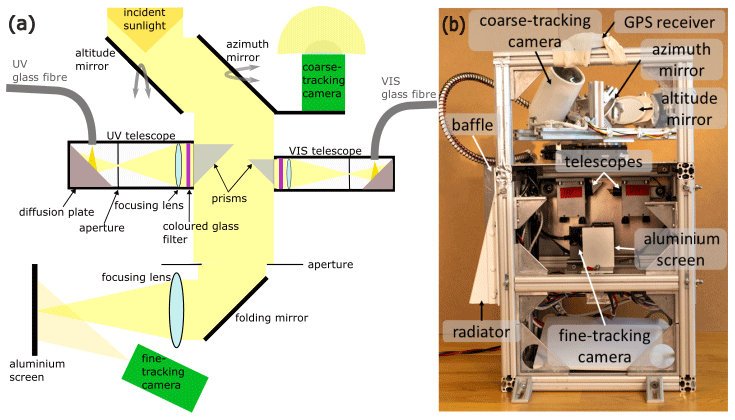
Figure 2Schematic of the light path through the solar tracker (a) and photograph with labelling of the important components of the solar-tracking unit (b). Note that the open side of the solar tracker is closed by an aluminium plate during the flight.
The new balloon-borne DOAS instrument is designed to measure UV–Vis absorbing trace gases such as O3, NO2, and BrO and possibly IO, OClO, and HONO under stratospheric pressure and temperature conditions. Compared to the previous LPMA/DOAS instrument, the new instrument has a lower weight with a total mass of < 40 kg, is more compact, and has a lower power consumption of < 100 W, making it a suitable secondary payload on stratospheric balloon gondolas. The balloon-borne DOAS instrument consists of two major parts: an active solar-tracking unit (Fig. 2) capturing direct sunlight (described in Sect. 3.1) and the spectrometer unit (Fig. 3) containing two grating spectrometers (described in Sect. 3.2), one sensitive to the UV range and the other one sensitive to the visible (Vis) spectral range. Two telescopes within the solar tracker feed the direct sunlight into the spectrometers via two glass fibres of 3 m length each. Each unit is equipped with an embedded computer (Fitlet2-CE3959-P36) and an Arduino-based housekeeping unit logging temperature data. All electronics producing a significant amount of heat are thermally connected to a radiation shield (hereinafter called the radiator) attached to the respective unit and facing the cold sky to provide radiative cooling during stratospheric balloon flights. In addition, baffles shield the radiators from direct sun radiation. The embedded computers can be operated remotely from the ground via telecommand or telemetry connections provided by the host gondola. Each unit is connected to a GPS receiver to synchronise its clock. Thus, except for the connection via the glass fibres, the spectrometer and solar-tracking units are two stand-alone units that can be placed in different parts of the host gondola. For example, the solar tracker can be installed on the outside fuselage of the gondola to enable direct sun viewing, while the spectrometer unit can be placed somewhere inside the structure, with the side constraint that the radiators need to face the cold background sky.
3.1 Solar tracker
The concept of the stand-alone solar tracker is based on the Camtracker setup developed by Gisi et al. (2011) and is used routinely for ground-based direct sun observations on slowly moving platforms by our group and many others (e.g. Frey et al., 2019; Klappenbach et al., 2015; Butz et al., 2017). The concept of this ground-based solar tracker was adjusted for deployment on balloon gondolas. Compared to the former LPMA solar tracker (Camy-Peyret et al., 1995), the presented stand-alone solar tracker is much lighter and more compact and consumes less power. A schematic drawing of the light path through our solar tracker and a picture of the unit are shown in Fig. 2. Two plane ellipse-shaped mirrors are assembled on an altitude–azimuth mount with two motorised stages (STANDA 8MR151-1 and STANDA 8MR190-2-28) whose lubricant has been replaced with a Teflon-based lubricant (Fluroxon GV2S, specified from −60 to 100 °C) to avoid clogging under stratospheric conditions. Additionally, each stage motor is kept warm with a self-regulating heater (DBK HP05-104, ≤ 15 W). The plane mirrors reflect the parallel beam of sunlight into the tracker's body, where it is deflected by a 45° folding mirror and focused by a lens (2.54 cm (1 in.) diameter, focal length f = 150 mm) onto a sand-blasted aluminium screen positioned at a distance of one focal length from the lens. The image of the sun on the screen is approximately 1.4 mm in diameter, which equals 64 pixels in the picture of the so-called fine-tracking camera inside the tracker's body. The tracker unit measures 0.4 m × 0.4 m × 0.5 m, weighs around 12 kg, and consumes around 60 W at peak computational and heating power.
The tracking operates in two steps. First, a coarse-tracking fish-eye-lens camera with a field of view of 185° (IDS UI-3280CP Rev.2 with a Fujinon FE185C057HA-1 f-theta objective lens) mounted at a zenith angle of 45° finds the rough position of the sun in the sky. The tracker rotates the altitude and azimuth mirrors accordingly, such that the sun's image is visible through the fine-tracking camera that observes a target area of roughly 21 mm diameter on the sand-blasted aluminium screen. Then, the faster fine-tracking camera (IDS UI-3140CP Rev.2) takes over and slightly adjusts the mirror positions to centre the sun's disc in a pre-defined centre position using a proportional-integral-derivative (PID) control loop with a frequency of 50 Hz. The target precision of the tracking is approximately of the sun's diameter (0.05° full angle). In principle, sun tracking is possible down to a SZA of 96° and in an azimuth segment of 360°. During the two deployments reported here, the tracker was mounted on the top of the balloon gondola structure on the side facing the sun to ensure an unobscured view of the sun throughout the flight. When mounted on the balloon gondola for these two deployments, the available azimuth viewing range reduced to roughly 270° as the balloon and the gondola obscured the view of the sun in some directions.
Two telescopes, one optimised for the UV spectral range (2.54 cm (1 in.) diameter, 20 mm side-length right-angle prism) and the other for the Vis spectral range (1.27 cm (0.5 in.) diameter, 10 mm side-length right-angle prism), respectively, are placed in the parallel light beam between the azimuth mirror and the folding mirror to detract sunlight for the spectral analysis by the spectrometer unit. The telescope design follows the design reported in Butz et al. (2017). Through internal total reflection, the right-angle prism guides the light into the telescope tube with a coloured glass filter (UV: Hoya U340; Vis: Hoya B460) for the respective desired wavelength ranges. Inside the telescope, a lens with a focal length of f = 40 mm (UV: Thorlabs LB4030-UV; Vis: Thorlabs LB1378) focuses the light onto an aperture with a diameter of 800 µm to limit the field of view to 1.15°, i.e. roughly corresponding to twice the diameter of the solar disc. Behind the aperture, the expanding light beam illuminates a diffuser plate at a 45° angle, and the light scattered off the diffuser plate is collected by mono 400 µm glass fibre (numerical aperture 0.22, length 3 m), which guides the light into the spectrometer.
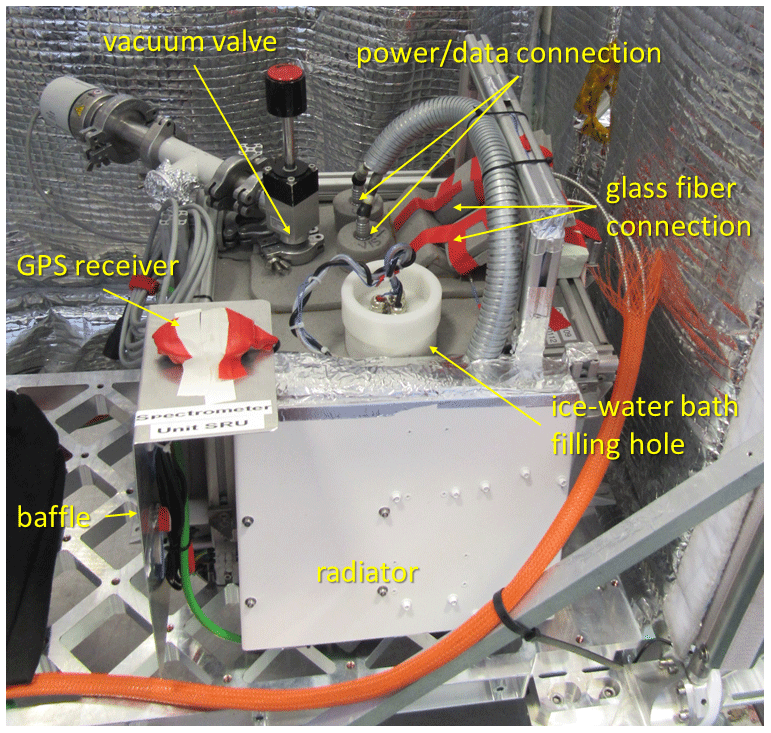
Figure 3Photograph with labelling of the important components of the spectrometer. Note that the vacuum valve and tubing are unmounted during the balloon flight since vacuum pumping is only performed on the ground prior to the flight.
3.2 Spectrometer unit
The concept and design of the balloon-borne spectrometer were inherited from the limb spectrometers used by Weidner et al. (2005) and Kritten et al. (2010). However, in the present application, the spectrometers were changed from Ocean Insight QE 2000 and QE65000 spectrometers to slightly larger, higher-performance Ocean Insight QE-Pro spectrometers. Additionally, electronics including the onboard computer and power lines were updated. Compared to the LPMA/DOAS direct-sun spectrometer, the new spectrometer is lighter and more compact and can be placed flexibly on the gondola.
Two spectrometers, one for the UV spectral range (305 to 387 nm) and one for the Vis spectral range (398 to 502 nm), are used to record the solar absorption spectra. The UV spectrometer has a spectral resolution of 0.38 nm, while the Vis spectrometer has a spectral resolution of 0.55 nm. The spectral resolution of both spectrometers corresponds to ∼ 5 spectral pixels. The spectral response functions of both spectrometers are measured using spectral emission lamps and are shown in Fig. 4.
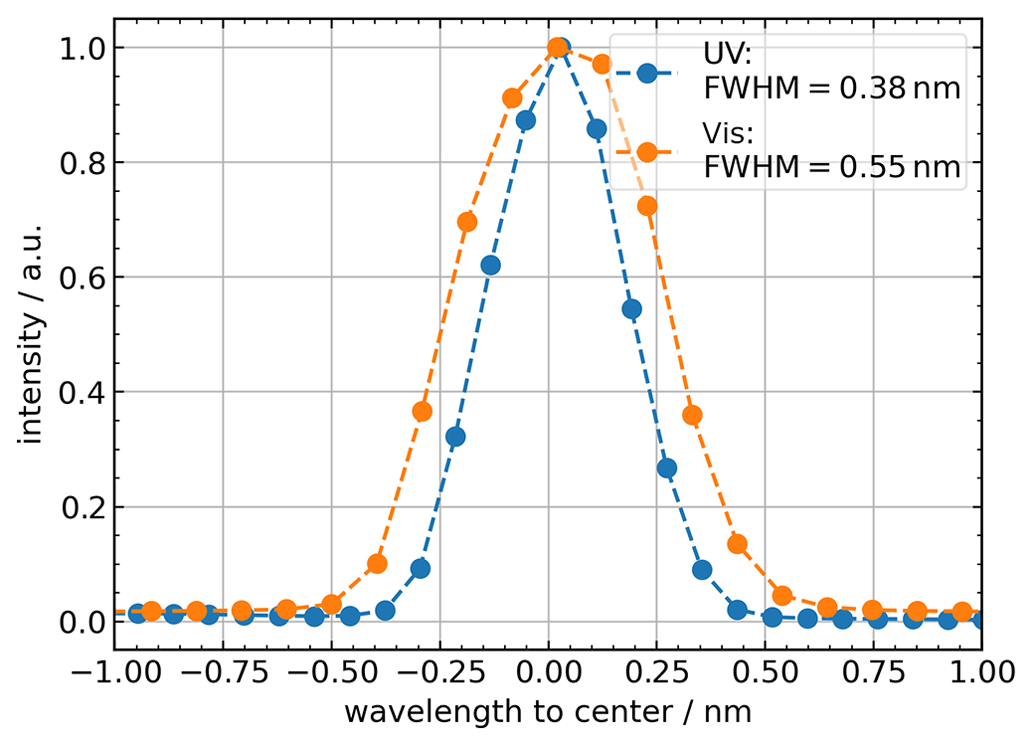
Figure 4Spectral response function of the UV–Vis spectrometers monitored through the mercury emission peak at 334 nm (blue) and the krypton peak at 432 nm (orange), respectively. The full width at half maximum (FWHM) of the spectral response functions gives the resolution of the respective spectrometer. For both spectrometers the sampling is about 5 pixels per FWHM. The shown spectral response functions were recorded a few hours before the balloon launch from Timmins.
The spectrometer unit is depicted in Fig. 3. The glass fibres coming from the solar-tracking unit feed the sunlight into the spectrometers via a custom-made vacuum feedthrough to the spectrometer entrance slits each 100 µm wide. A vacuum chamber houses both spectrometers to avoid wavelength shifts through pressure changes and any condensation on the actively thermo-electrically cooled CCD detectors (operated at −10 °C). The temperature of the spectrometers is stabilised by a mixture of ice and water (volume of around 8 L) within a vessel surrounding the vacuum chamber. A small water pump continuously mixes the ice-water bath to prevent temperature gradients from forming. About 3 cm of open-cell foam insulates the vessel from the outside. The spectrometer unit measures 0.45 m × 0.4 m × 0.4 m, weighs around 25 kg (including the water), and consumes 30 W.
The spectral acquisition software was developed in our laboratory. During stratospheric balloon flights, it can be operated via a remote connection to the embedded computer. Single spectra are stored locally on the embedded computer. Integration times between 10 and 60 000 ms are adjusted manually during sunset and sunrise, when illumination conditions change quickly.
3.3 Instrument performance
Overall, the instrument performed well during both deployments, and a continuous set of spectra was acquired during the sunset for both flights.
The thermal budget of the instrument's electronic components was balanced well throughout both deployments, except for the ascent of the flight from Kiruna. During this first deployment, the onboard computer integrated into the spectrometer unit shut down during balloon ascent due to low temperatures (∼ 215 K) near the tropopause. However, radiative heating in the middle stratosphere brought the computer online again, and high computational usage at night resulted in continuous measurements during the entire measurement period at balloon float altitude. In general, the computers were more susceptible to becoming too cold than too warm. Therefore, two heaters were built into the onboard computers for the second deployment at Timmins, supplying up to 3 W of heat when the computers' temperatures were below 0 °C. Additionally, the computational power was increased on purpose by dummy scripts during the critical phases to generate heat.
The performance of the spectrometers is mainly dependent on their thermal stability, which is governed by the stability of the ice-water bath. Stable temperatures were measured with a PT1000 sensor within the ice-water bath throughout both flights, with deviations lower than ± 0.25 °C. Nevertheless, a wavy pattern of the signal recorded by individual detector pixels is observed over time in the spectra acquired during both deployments, even during periods where all relevant parameters (integration time, relative azimuth angle of the sun to the solar tracker, number of scans, etc.) were kept constant (as can be seen in Fig. 6). This artefact is most likely caused by some condensate on the detector, resulting in residual spectral structures. Unfortunately, these residual spectral structures were likely the consequence of a thermal incident due to an operating mistake prior to the first deployment from Kiruna in 2021 in the laboratory. Volatile chemical components within the evacuated spectrometer housing were outgassed due to warm-water-bath temperatures above 50 °C and condensed onto the cooled detector surfaces, resulting in the etalon-like spectral structures observed for both spectrometers. For cleaning, we reversed the process, heating the detectors while cooling the lid of the vacuum chamber and evacuating the spectrometer container. By this measure, most of the condensate could be removed from the detector surfaces such that the residual structures were largely reduced. However, it is plausible that a thin layer of condensate remained on the detector surfaces, causing residual structures of the order of τresidual < 10−3.
A promising correction method is described in Sect. 4.2. Unfortunately, this method can only be applied to the spectra recorded during the second deployment from Timmins because the relative azimuth angle of the sun tracker to the sun was kept constant during the entire sunset, resulting in a smooth-intensity time series. However, this relative azimuth angle was changed several times during the first flight from Kiruna, resulting in small changes in the recorded intensity, making a correction via polynomial fits unfeasible. Hence, all the results presented in the following sections are based on the spectral retrieval of the UV data from the Timmins deployment only.
During the flight, the tracker needs to not only follow the sun's position in the sky but also compensate for any gondola movement. During ascent, these movements of the gondola are the greatest, with more than ± 4 ° s−1. Once the gondola is azimuth-stabilised, it reduces drastically to angular velocities of less than ± 1 ° s−1. The sun tracker was designed to compensate for angular velocities of up to ± 2 ° s−1. Therefore, during both deployments, the sun tracker followed the sun sufficiently once the gondola was stabilised in the azimuth direction. During ascent, when the gondola was not stabilised in the azimuth, tracking the sun was not continuously possible, and the balloon frequently obscured the tracker's view of the sun. This limitation is mostly related to recent safety-related changes in the balloon flight train and the auxiliary balloon needed for the launch procedure. Previously, the auxiliary balloons were detached shortly after launch. However, in the present configuration, the auxiliary balloon is attached to the flight train and is no longer released, leading to a larger area of attack for the shear winds, which induces azimuthal torque in the flight train and the gondola. As a consequence of the present setup of the balloon flight train, a reliable azimuth stabilisation is not possible when strong shear winds prevail, i.e. during balloon ascent below altitudes of at least 10 to 15 km. This prevents us from collecting continuous ascent measurements due to the unpredictable rotations of the balloon gondola.
The tracking precision during the measurement time of the sunset from balloon float altitude in the range 53° ≤ SZA ≤ 95° for the flight from Timmins is depicted by the 2D histogram shown in Fig. 5. The deviation from the target position on the screen viewed by the fine-tracking camera is given in degrees of the azimuth and elevation angle. All the data points lie within the target range of 0.05°, and 83.1 % of the data points show deviations of less than 0.005°. A similar precision with a few more outliers was achieved during the first deployment from Kiruna.
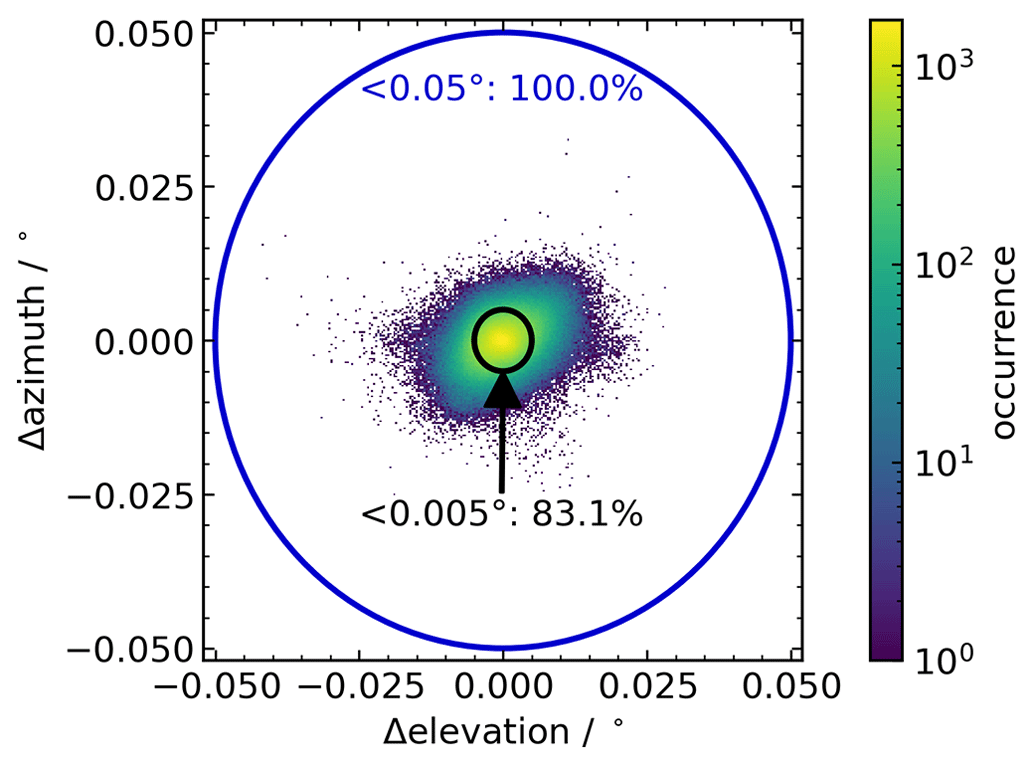
Figure 5Tracking precision during sunset (53° ≤ SZA ≤ 95°) of the flight from Timmins in 2022. The blue circle shows the target precision of 0.05°, whereas the black circle shows a deviation by 0.005° from the centre pixel. All data points of the tracking during this time span lie within the target range, and 83.1 % even deviate by less than 0.005°.
The recorded solar absorption spectra are first pre-processed to correct for instrument-related effects, which include a residual structure that needs particular attention (Sect. 4.1). Then, we use the DOAS method (Platt and Stutz, 2008) to infer, for each spectrum, the differential slant column densities (dSCDs) of the fitted trace gases. Here, we focus on the retrieval of BrO dSCDs from the UV spectral range (Sect. 4.2) since the primary goal of the mission is to monitor bromine abundances in the middle stratosphere. The instrument setup also supports the detection of IO, OClO, HONO, O3, and NO2 retrievals, which are, however, not detailed here. To convert dSCDs into a mean BrO volume-mixing ratio (VMR) above the balloon altitude ([BrO]), we employ Langley's method entailing the simulation of the light path from the sun to the balloon-borne instrument (Sect. 4.3). Finally, we estimate [Bry] by simulating the bromine partitioning in the middle stratosphere using a photochemical box model (Sect. 4.4).
4.1 Pre-processing
Prior to the balloon deployments, the non-linearity of the spectrometers' detectors was characterised in laboratory measurements. The detector's response is most linear for pixel saturations between 30 % and 60 %, with deviations from linearity within this range being smaller than 0.002 %. Thus, the correction in the processing step increases the signal of pixels with saturations between 30 % and 60 % by less than 0.002 % (at maximum). The integration time during the deployments was manually adjusted such that the maximum saturation is within this range. The detector's dark current and offset voltage, together with mercury and krypton emission lamp and halogen lamp spectra, were recorded a few hours before and a few hours to 1 d after each balloon deployment, depending on the recovery time of the gondola.
As a first step of the data pre-processing, each single spectrum recorded during the flight is corrected for the detector's non-linearity, and 200 spectra are co-added to increase the signal-to-noise ratio. Further, the spectrometer's spectral response function used for convolving absorption cross sections is calculated from the emission lamp spectra. Here, the spectral emission line closest to the retrieval window is used for the convolution. Further, a wavelength pre-calibration for the DOAS evaluation is calculated from the spectra of the spectral emission lamps. The software used for the DOAS retrieval, QDOAS (Danckaert et al., 2017), corrects all the spectra for the offset and dark current and performs a more advanced wavelength calibration using the solar Fraunhofer lines.
The first DOAS retrievals showed the presence of disturbing residual structures in the retrieved spectra, resulting in a highly varying retrieval quality. That is, the root mean square (rms) of the spectral residuals of the DOAS fits showed an oscillating pattern over time. Further investigation indicated oscillations in the signal recorded by each detector pixel over time but with different phases for individual pixels as depicted in Fig. 6. These oscillating signals are most likely caused by condensate on the detector resulting in spectral residual structures. Given the oscillating pattern of the rms, the effects of these residual structures reproduce with time. That is, the same spectral structures repeat themselves in each full oscillation. Therefore, we use a few oscillations to characterise the artefacts and to correct for them within the DOAS retrieval.
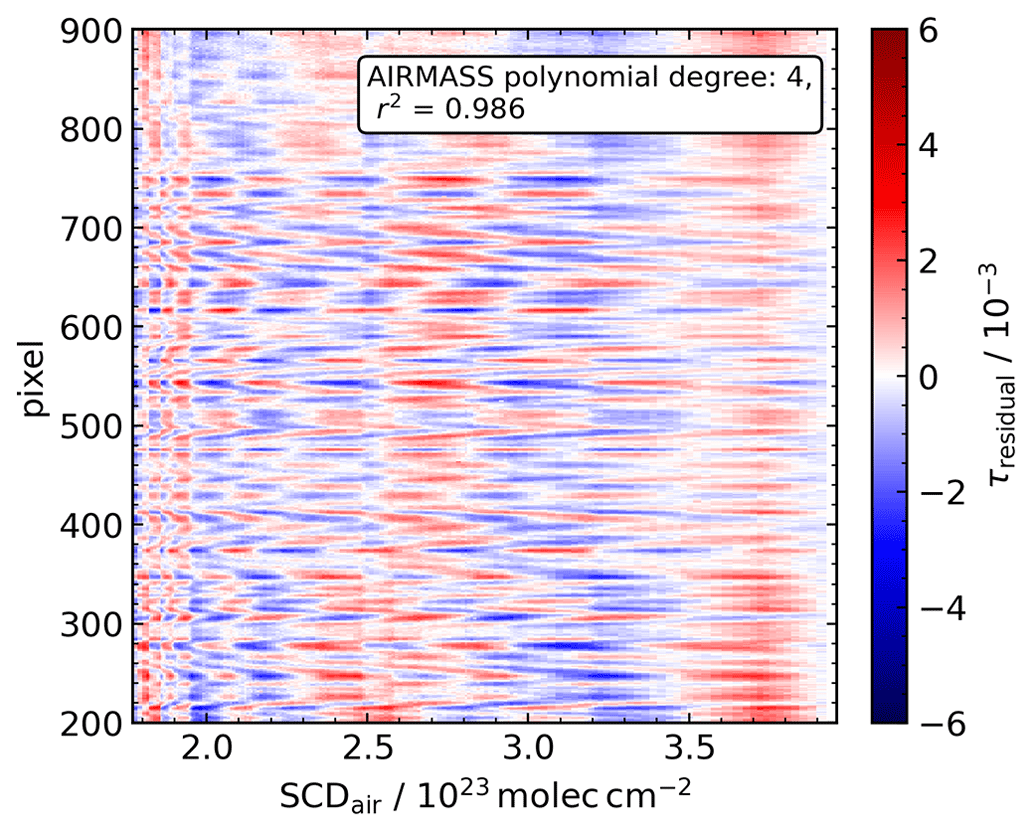
Figure 6Optical density fluctuations due to residual spectral structures τresidual shown for detector pixels 200 to 900 as a function of slant air mass SCDair. The spectral pattern was obtained using the AIRMASS approach with a fourth-degree polynomial, as described in the text. The chosen reference spectrum at SZA = 74.1° has a SCDair of 3.9 × 10²³ . The mean r2 value for the polynomial fits over all the pixels is 0.986.
The overall correction strategy is to select a period where the dSCDs of the target gases are safely below the detection limit and which is long enough to cover a few cycles of the oscillating pattern. From spectra recorded during that period, we extract the artefact signal in terms of a residual optical density and characterise its spectral pattern through a principal component analysis (PCA). The inferred principal components are then used to correct all the spectra, including those used for scientific analysis. To this end, the DOAS retrieval includes a set of the inferred spectral residual structures as pseudo cross sections. The scaling of each pseudo cross section together with the gas absorption structures is determined with least-squares minimisation. As the period for calibrating the principal components, we take the one corresponding to the SZA range from 55 to 75° when the balloon was at float altitude, the sun was high in the sky, and we anticipated that the DOAS retrievals would use the spectrum recorded at SZA = 74.1° as their reference spectrum. Thus, the target gases show negligible spectral signals for the chosen period. However, the period covers five cycles of the oscillations.
In order to infer the residual optical density τresidual from the spectra recorded during the calibration period, we first calculate the measured optical density τmeas with respect to the reference spectrum (at SZA = 74.1°). The atmospheric contribution of τatmo to τmeas is mainly due to Rayleigh scattering, which we approximate by a low-order polynomial function P of either the slant air mass SCDair (with respect to the reference spectrum) or wavelength (see the two approaches below). The residual optical density τresidual can thus be calculated from the measured optical density τmeas via
Then, there are two approaches to implementing Eq. (1). The first approach (further called AIRMASS) finds the atmospheric optical density τatmo by fitting the polynomial coefficients of P(SCDair) (between third order and fifth order) to the measured optical density τmeas for each detector pixel as a function of the slant air mass SCDair. The residual optical density τresidual resulting from this procedure is shown in Fig. 6. The second approach (further called SPEC finds the atmospheric optical density τatmo by fitting a third-order polynomial P(λ) to the measured optical density τmeas for each spectrum as a function of wavelength λ. Using the SPEC approach, the results for τresidual are similar to the oscillations shown in Fig. 6 and obtained using the AIRMASS approach.
No matter which approach is used, a PCA is then performed on τresidual(λ,SCDair) to retrieve the dominating spectral features, i.e. the principal components (PCs) as a function of wavelength λ over the calibration period with the time parameterised through SCDair. The PCs are sorted by the variance they explain along the SCDair dimension, and the first five to seven PCs are finally included in the DOAS analysis as pseudo-absorption cross sections. As the various settings (AIRMASS approach and SPEC approach, order of polynomials, number of PCs) used for the residual correction yield similar results, a sensitivity study is conducted to estimate the uncertainty propagated by the respective choices into the final results.
4.2 Spectral retrieval of BrO
We infer differential slant column densities of BrO with respect to a reference spectrum by applying the established DOAS technique (Platt, 1994; Platt and Stutz, 2008) using the QDOAS software (Danckaert et al., 2017). The spectrally interfering species are O3, NO2, and O4. The reference is chosen from the collection of spectra recorded at the balloon float altitude when the slant column absorption is minimal (here SZA = 74.1°).
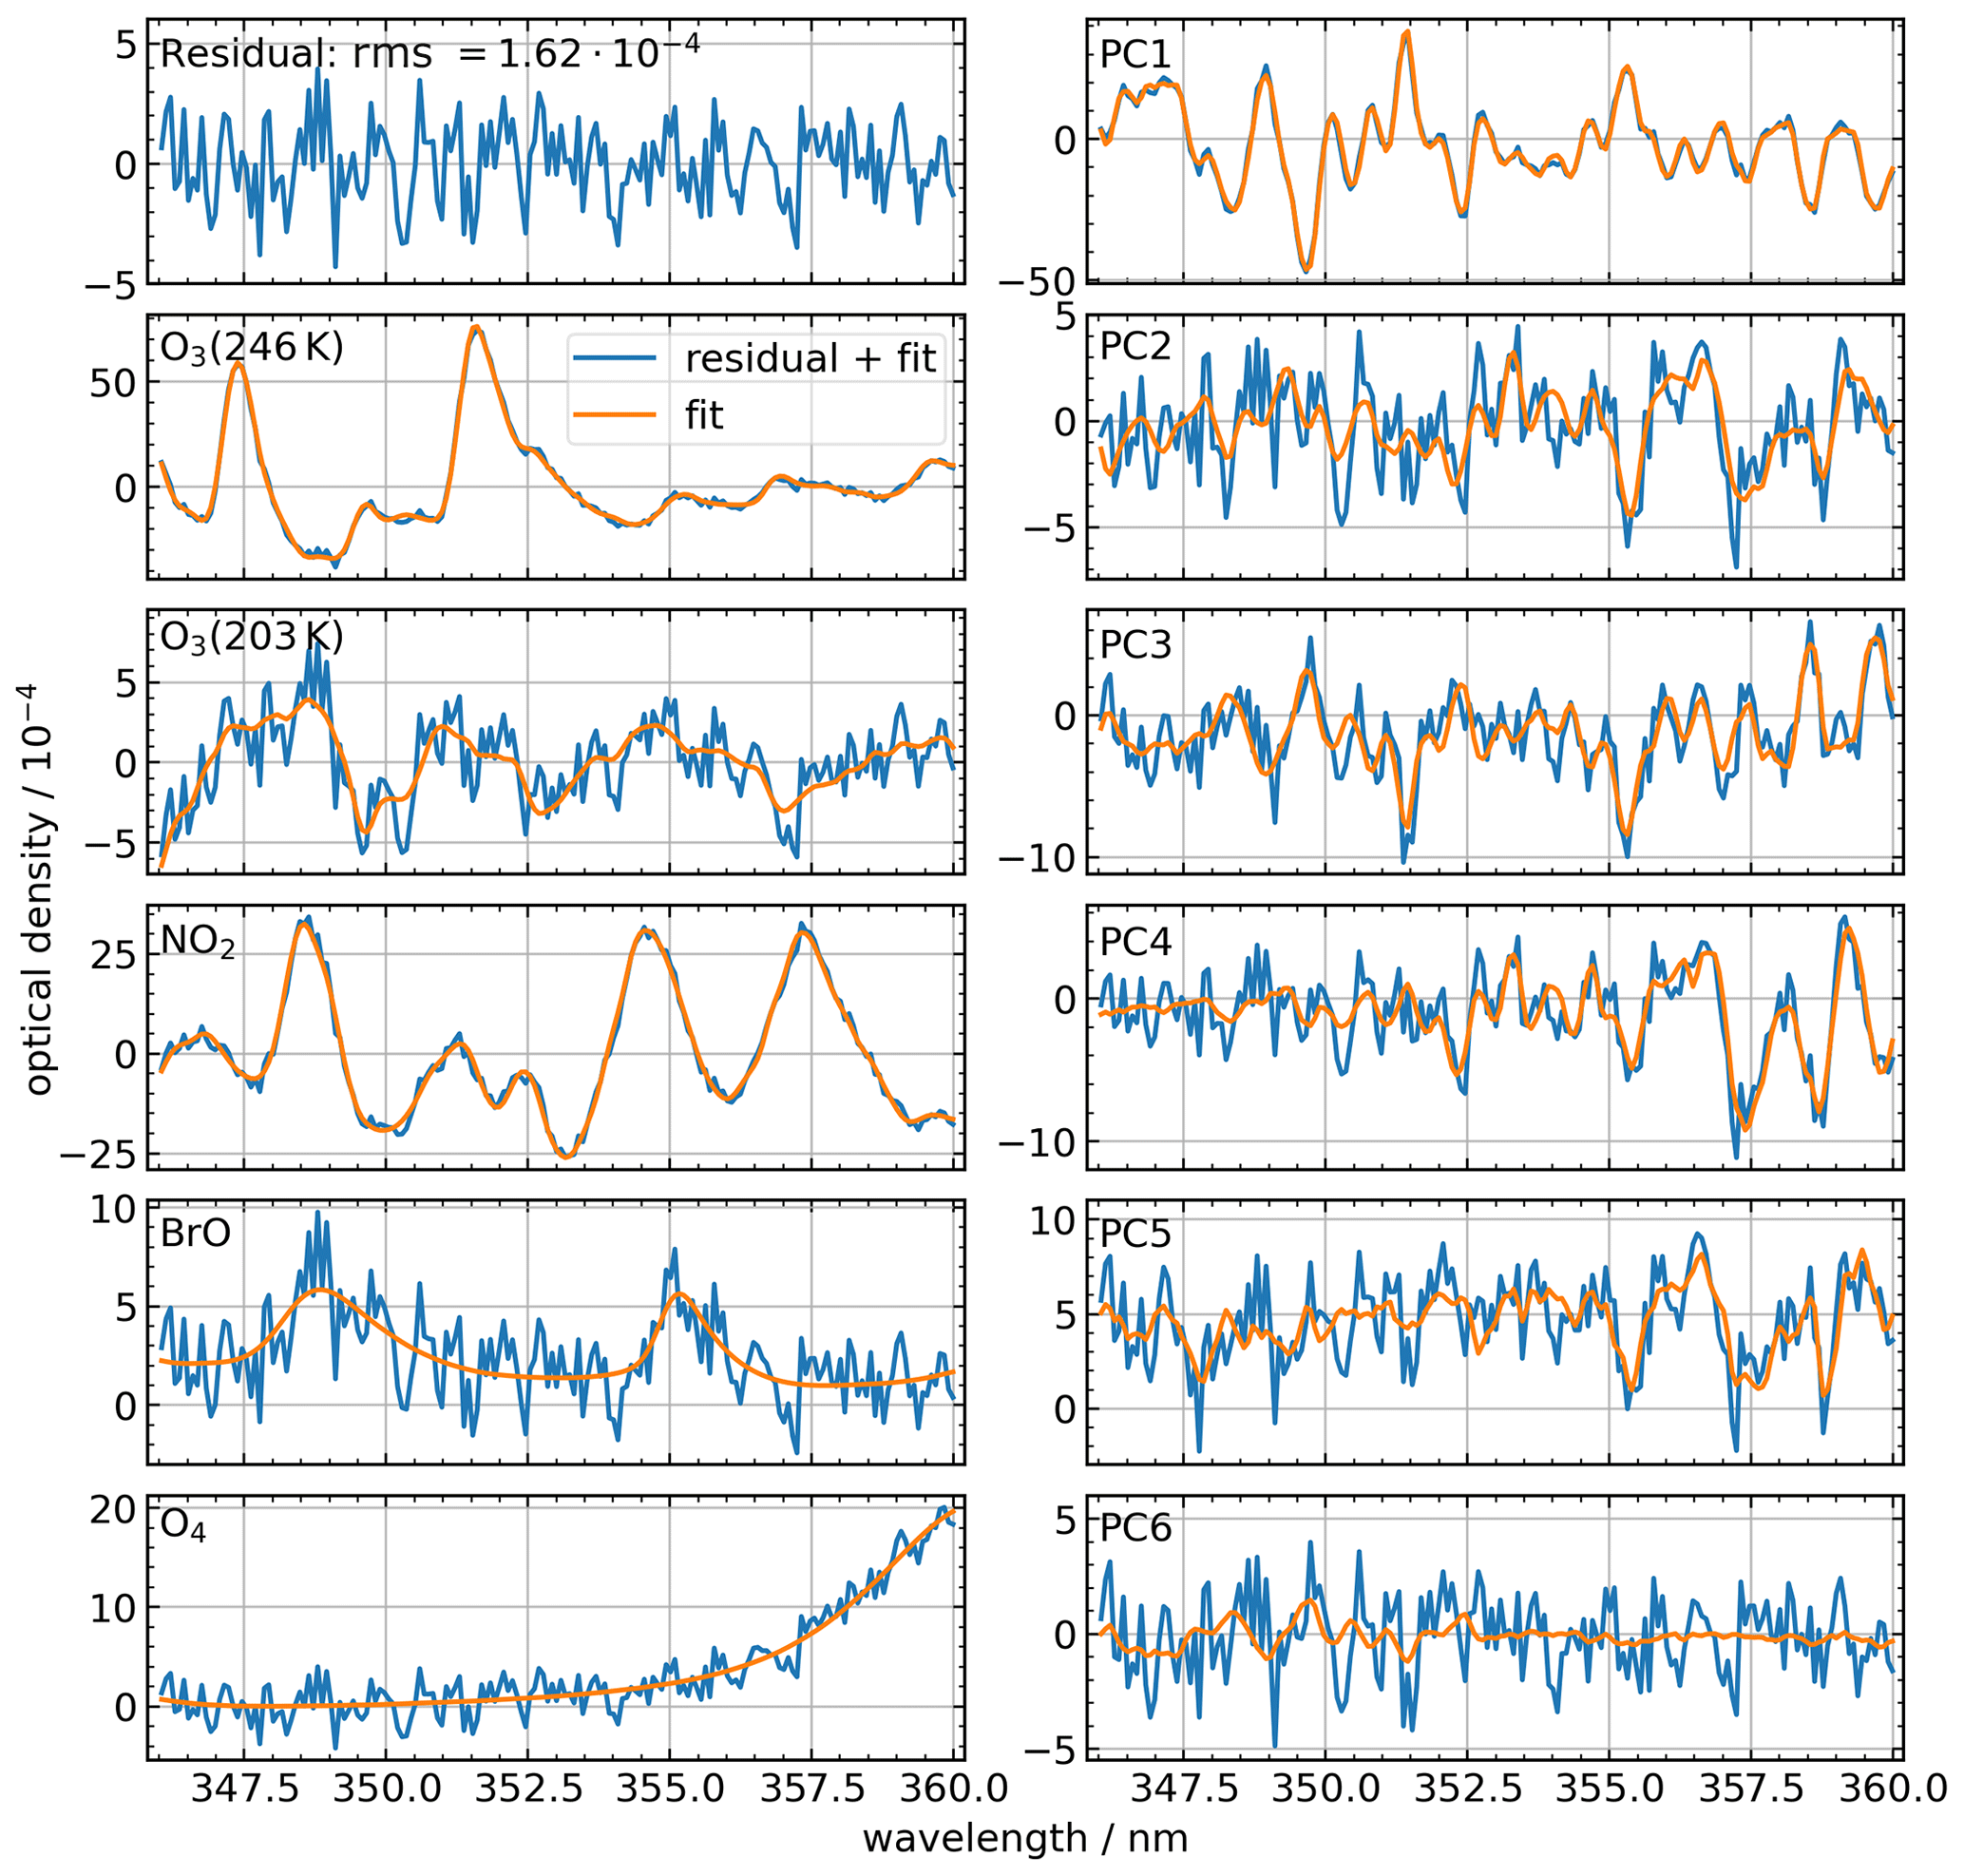
Figure 7DOAS fit results for the spectrum recorded at SZA = 89.9°. The spectral retrieval uses two O3 absorption cross sections at different temperatures, a NO2 absorption cross section, a BrO absorption cross section at 298 K, an O4 absorption cross section, and the first six PCs representing the residual structures calculated via the AIRMASS approach described in the text. In addition to the fit components shown here, the DOAS retrieval adopts a first-order offset polynomial and a second-order polynomial to account for broadband extinction processes.
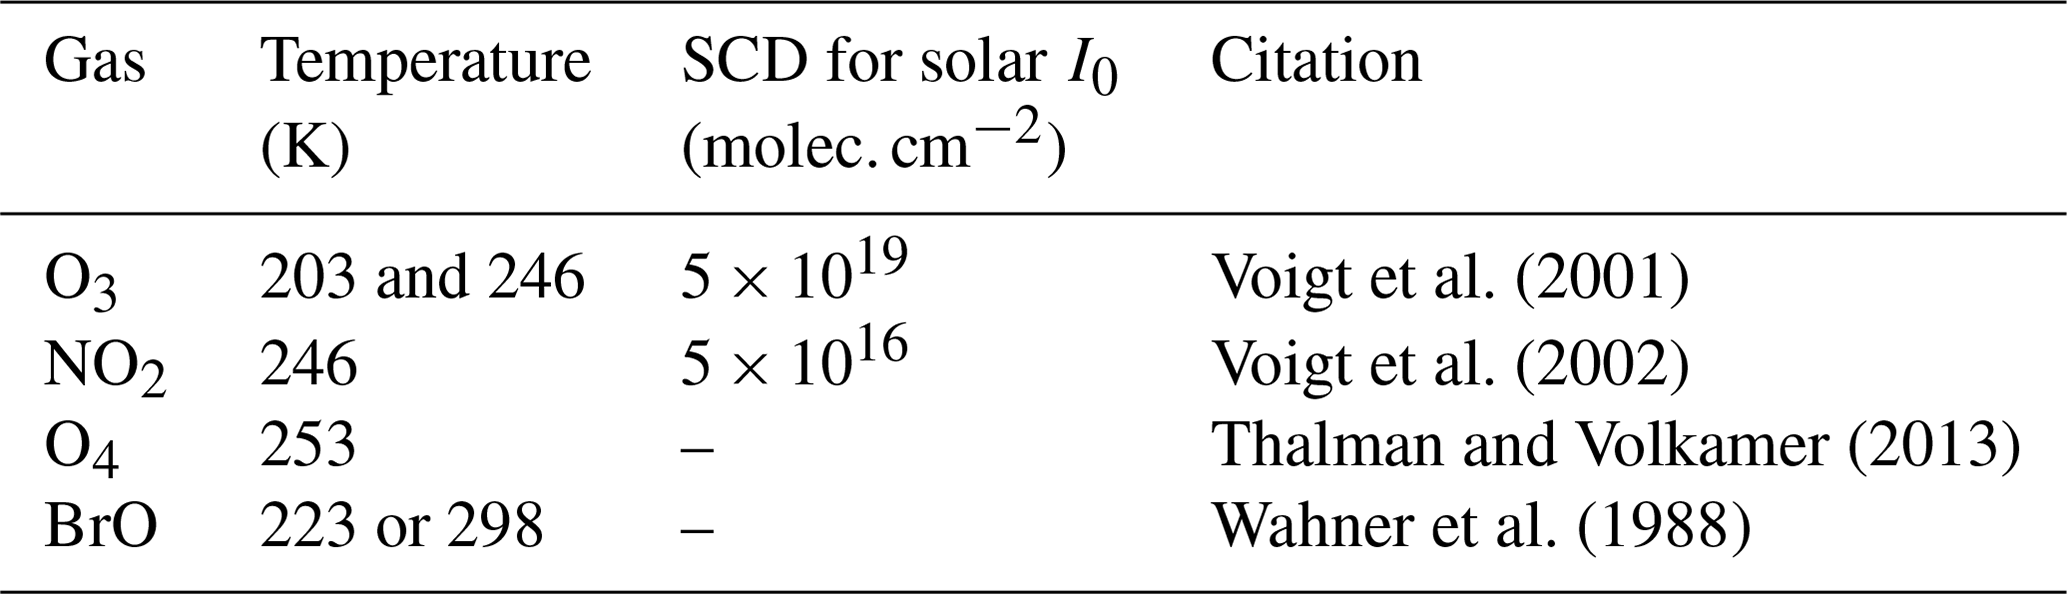
Following the recommendations of Aliwell et al. (2002) and previous balloon-borne BrO studies (Harder et al., 2000; Dorf et al., 2006b; Kreycy et al., 2013; Rotermund et al., 2021), the retrieval window extends over the range 346–360 nm covering two BrO absorption bands. All the absorption cross sections used for the DOAS fit are listed in Table 1. An additive offset polynomial (order 1) is included to account for instrumental stray light, and a second-degree polynomial is included to account for any broadband extinction processes. To make the results of this study comparable with other balloon-borne stratospheric BrO measurements (Harder et al., 2000; Dorf et al., 2006b; Kreycy et al., 2013), the DOAS retrieval settings are consistent with these studies, and the BrO absorption cross section by Wahner et al. (1988) is used for the retrieval with a fixed wavelength shift of 0.28 nm (Wilmouth et al., 1999). All the absorption cross sections are convolved to the instrument's spectral resolution using the measured spectral response function shown in Fig. 4. As the absorption cross section of O3 is temperature-dependent, absorption cross sections for two different temperatures are included in the fit, with the absorption cross section at 203 K being orthogonalised to the one at 246 K. The absorption cross sections of the strong absorbers O3 and NO2 are also corrected for the solar I0 effect using the dSCDs listed in Table 1 (Aliwell et al., 2002; Platt and Stutz, 2008). Additionally, five to seven principal components are included in the DOAS fit as pseudo-spectral cross sections (pseudo absorbers) to represent the residual structures determined during the pre-processing in the DOAS retrieval. Figure 7 illustrates the spectral fitting quality.
Since the absorption cross section of BrO is approximately linearly dependent on the gas temperature, the BrO dSCD of each spectrum is calculated from an interpolation between the dSCDs retrieved with the two BrO absorption cross sections recorded at T = 223 K (cold) and T = 298 K (warm) (Wahner et al., 1988) and the effective absorption temperature.
The effective absorption temperature of BrO as a function of SZA and observation altitude Teff(SZA) can be inferred from the photochemical simulations (Sect. 4.4) and the simulated light path yielding the air mass factor (AMF) and the air density ρi of layer i (Sect. 4.3). It is calculated via
with the temperature Ti and BrO VMR [BrO] in each layer i.
4.3 Langley's method
Under the assumption of a constant [BrO] within the altitude range from the balloon to a few kilometres above as suggested by photochemical modelling, the BrO dSCDs (dSCDBrO) should scale linearly with the slant column density of air (SCDair) (Langley, 1904; Bösch et al., 2001; Dorf et al., 2006b),
where SCDBrO,0 is the slant column of BrO in the reference spectrum. SCDair is calculated with our ray-tracing programme differential air mass factors (DAMF), which has been validated in the studies of Harder et al. (2000), Bösch et al. (2001), Dorf et al. (2006b), Butz et al. (2009), and Weidner et al. (2005). The DAMF calculates the box air mass factor AMFi for each layer i, i.e. the factor by which the air mass along the slant light path is larger compared to the vertical column density of air in the atmospheric layer of height Δhi≥ 100 m. The AMF calculation is based on a spherical atmosphere and takes into account the refraction due to the changing pressure in the atmosphere. The used atmospheric pressure and temperature profile is based on ERA5 data (Hersbach et al., 2020, 2023) and above the highest ERA5 altitude of 1 hPa (corresponds to about 48.5 km) of the U.S. Standard Atmosphere scaled to the ERA5 profile. The resulting SCDair is then obtained for each spectrum from
Using Langley's method according to Eq. (3), i.e. performing a linear regression to the BrO dSCDs vs. SCDair, provides the [BrO] above the balloon float altitude and SCDBrO,0.
In previous studies, a representative partitioning ratio was used to scale the Langley-derived [BrO] to the total (inorganic) bromine, [Bry]. However, this assumption is only approximately valid. Therefore, in the present study, Eq. (4) is modified to
to account for the ratio varying with height and with the local SZA. The respective ratio as a function of altitude and SZA is obtained from photochemical modelling (Sect. 4.4). Reconsidering Langley's method with the partitioning-weighted SCDair,weighted on the abscissa, [Bry] can be inferred directly from the slope of a linear regression to the BrO dSCDs.
4.4 Photochemical modelling
During daytime, BrO is the predominant bromine species in the middle stratosphere. Due to the well-mixed conditions in the middle stratosphere, the major bromine species rapidly approach steady state under sunlight. The main reactions governing the bromine partitioning in the middle stratosphere are the inter-conversion reactions between the three most reactive bromine species BrO, BrONO2, and Br via reactions with the odd oxygen species
and
the photolysis of bromine oxide,
and the formation of the predominant nighttime species bromine nitrate:
Here, M represents a third but inert collision partner needed for momentum conservation.
We use a 1D photochemical stacked box (column) model to calculate the time evolution of stratospheric inorganic bromine species. The chemical mechanism is based on the offline chemical transport model TOMCAT (Chipperfield, 1999, 2006), similar to the setup in Höpfner et al. (2021) and Sinnhuber et al. (2005) with all bimolecular and termolecular rate constants being updated to JPL2022 (Burkholder et al., 2019). The model simulates the chemical evolution of stratospheric species over the course of 5 d, with the flight day being the last day. The model calculates actinic fluxes in a pseudo-spherical geometry, with the direct solar beam calculated by taking into account the sphericity of the atmosphere and multiple scattering calculated in plane-parallel approximation using a scheme based on Lary and Pyle (1991). This in turn is based on Meier et al. (1982) and Nicolet et al. (1982). The actinic flux calculations of the model were validated by Bösch et al. (2001) for similar balloon-borne observations. VMR profiles are calculated at the balloon launch site's latitude and longitude at 47 vertical levels between 10 and 132 km. Initial temperature and pressure profiles are taken from ERA5 data. The O3 profile is initialised with a Microwave Limb Sounder (MLS) ozone profile recorded in close temporal and spatial proximity to the balloon flight (Schwartz et al., 2020). Other gas profiles are initialised with the EMAC (ECHAM5 with MESSy Atmospheric Chemistry) simulations presented in Höpfner et al. (2021).
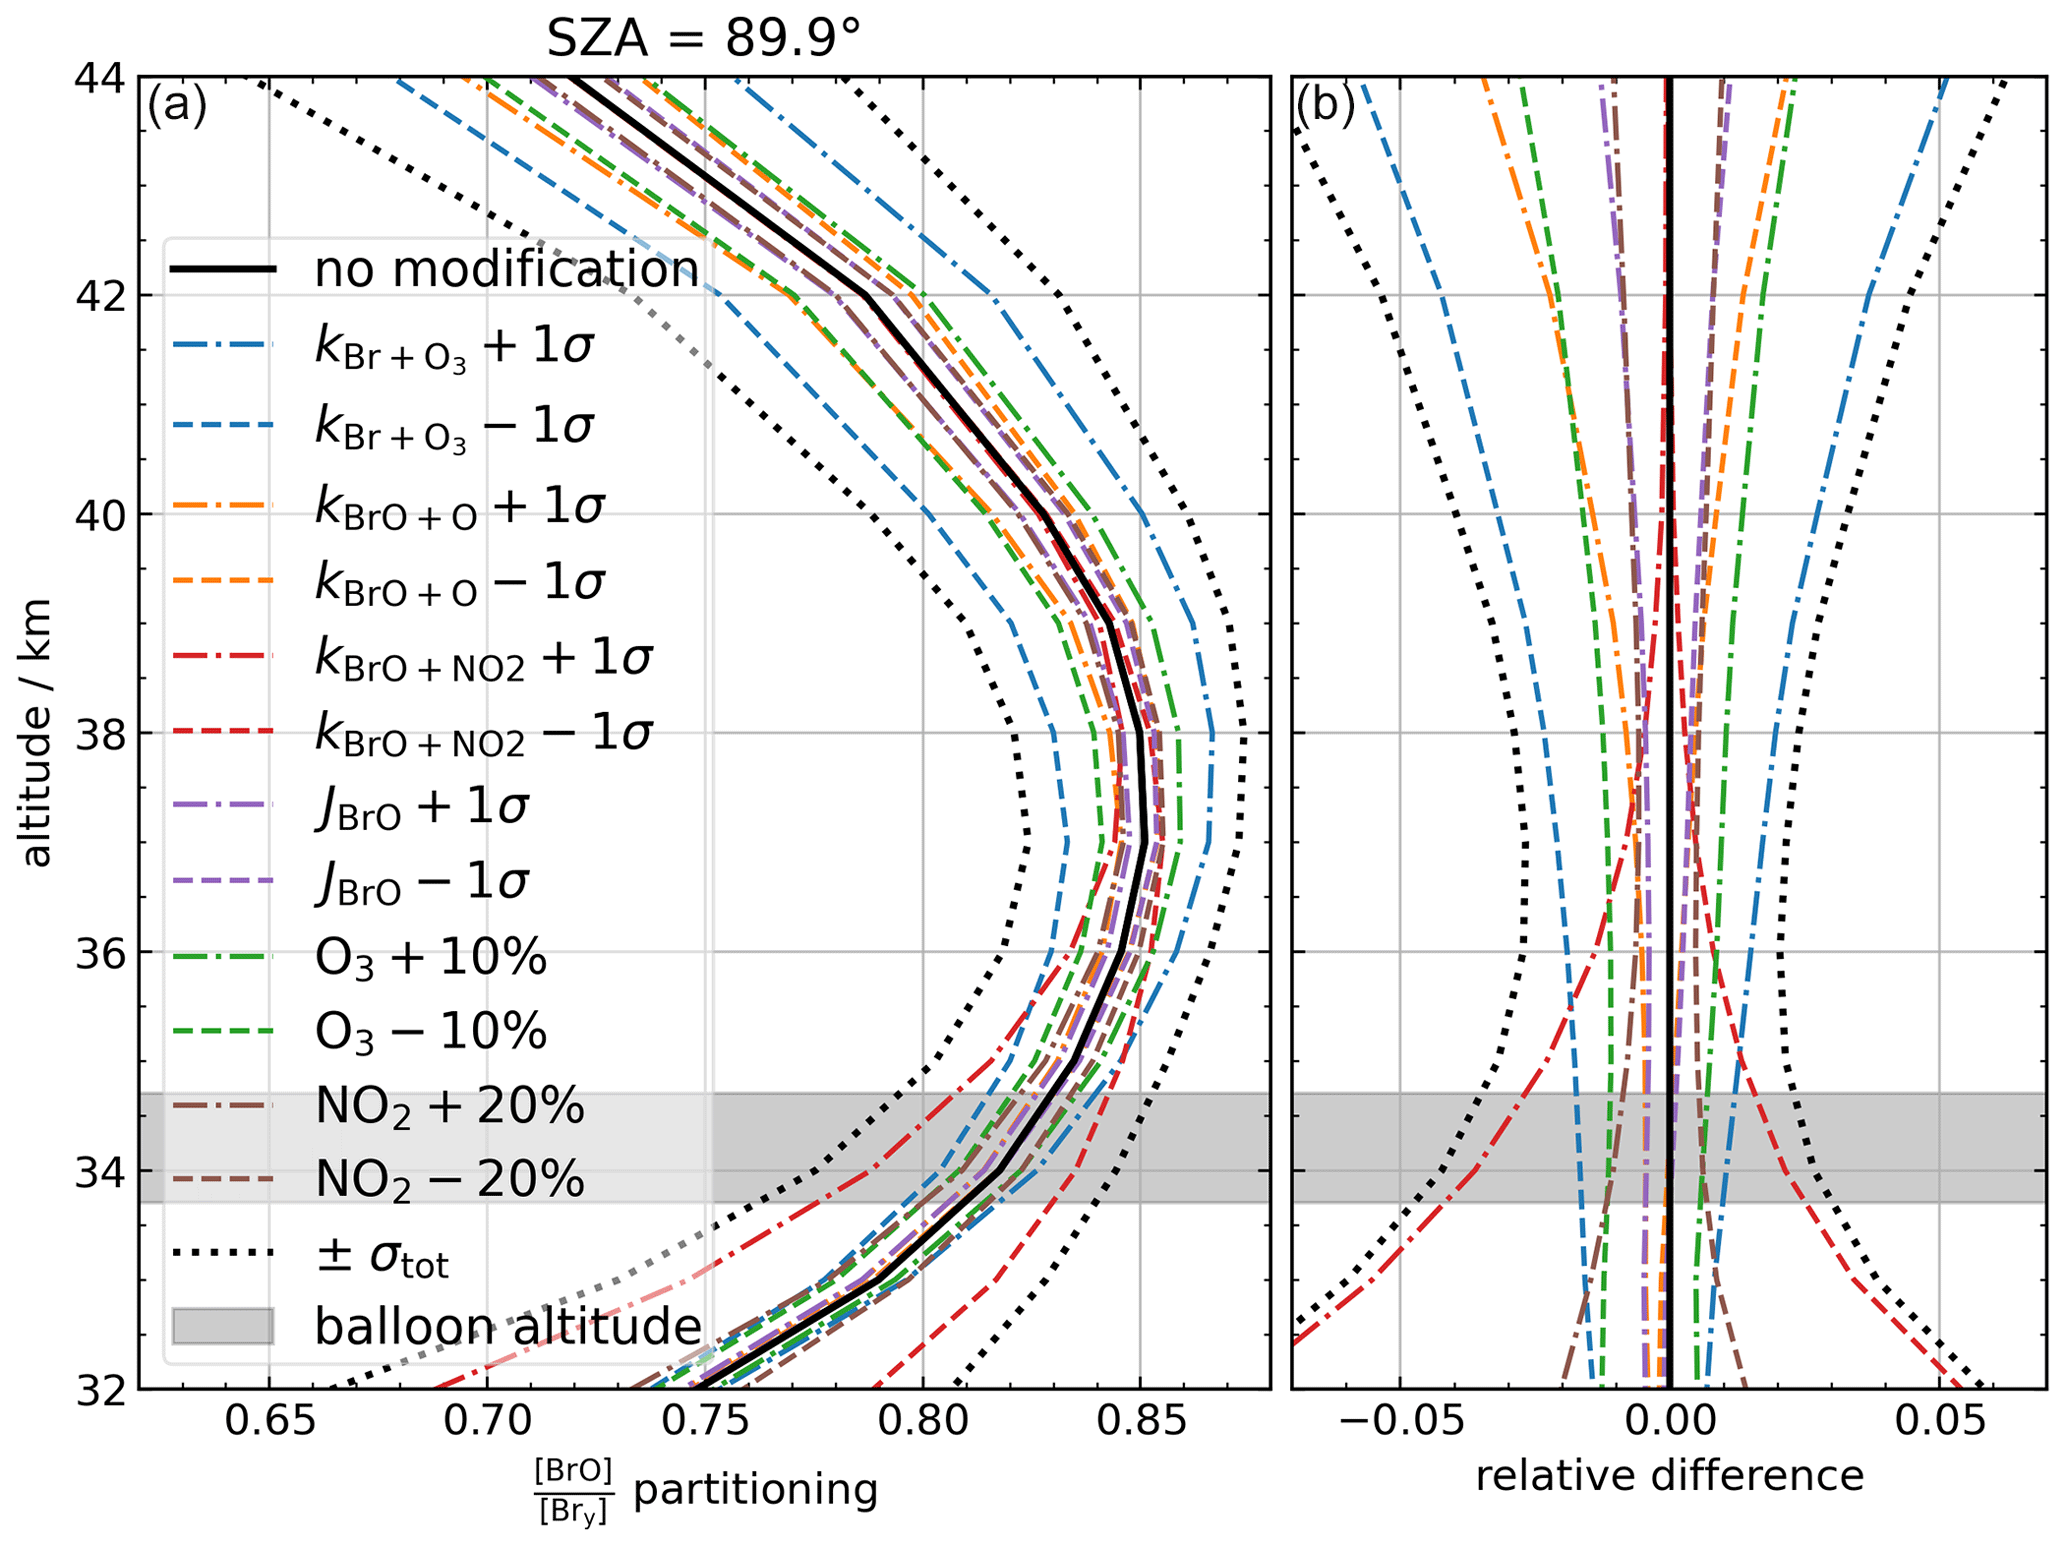
Figure 8The partitioning at 89.9° SZA at 30 km to 45 km altitude (a). In addition to the model base run (black), we conducted several simulations under perturbed model parameters (coloured), as indicated by the legend and as described in the main text. Panel (b) shows the relative difference of the perturbed simulations with the base run. The total uncertainty (black dots) is calculated by Gaussian summation of the individual differences with the base run. The light-grey altitude range marks the balloon gondola's altitude during the observations used for the regression in the Langley plot (33.7 to 34.7 km).
The simulations are used to infer the partitioning as a function of altitude and SZA (shown in black in Fig. 8 for SZA = 89.9°). For 80° ≤ SZA ≤ 90°, this partitioning is between 0.8 and 0.9 for altitudes between 33 and 41 km. The uncertainty of the partitioning profile is estimated by varying model parameters important for stratospheric bromine chemistry. These parameters include the rate constants k of Reactions (R1), (R2), and (R4), each varied by ± 1σ at 250 K according to Burkholder et al. (2019). Additionally, the photolysis frequency of BrO JBrO (Reaction R3) is varied by ± 8 % according to the uncertainty of the absorption cross section (Wilmouth et al., 1999) and the O3 VMR is varied by ± 10 %, while the initial NO2 VMR (together with the NO VMR) is varied by ± 20 %. The resulting profiles of the partitioning are shown as dashed lines in Fig. 8. The combined uncertainty of all these runs gives the estimated modelling error of . In the relevant altitude range from 33.7 to 40 km, this error amounts to 5 %, which agrees with a similar study by Dorf et al. (2006b). The largest contribution comes from Reaction (R4).
Given the analytical tools outlined in Sect. 4, we quantify the stratospheric bromine abundance in terms of the mid-stratospheric [BrO] (Sect. 5.1), the compatible VMR of the total gaseous inorganic bromine [Bry] (Sect. 5.2), and the implications for the bromine trend in the stratosphere (Sect. 5.3).
5.1 BrO abundance in the middle stratosphere
The BrO dSCDs are retrieved from the measured absorption spectra as described in Sect. 4.2, including an interpolation to the effective absorption temperature according to Eq. (2). Thereby, the retrieval is run repeatedly with a variable set of pre-processing parameters (see Table A1) to estimate the uncertainty introduced by the residual structures and their correction. For illustration purposes, we report on a particular setting (AIRMASS approach, fourth-degree polynomial, six PCs) as being representative of the quality of our [BrO] estimate, and we consider the spread of sensitivity runs within the error analysis.
Figure 9 shows the estimated BrO dSCDs for the measurement period with SZA ranging from 80 to 89.9°. This period is outside the range used for calibrating the residual correction, and the balloon is at float altitude (33.7 to 34.7 km), the sun is approaching the horizon (implying a long light path through the overhead atmosphere), and the partitioning does not change greatly. The latter allows for detection of the minor abundant BrO, which is clearly visible in the increase in the detected BrO dSCDs with SZA. Figure 9 also illustrates the effect of interpolating the BrO dSCDs from the retrieval nodes at 223 and 298 K to the effective absorption temperature. The error bars in the dSCDs represent the 1σ uncertainty of the DOAS retrieval.
The error-weighted Langley linear regression (Fig. 10) based on the BrO dSCDs interpolated to the effective temperature yields [BrO] = (14.1 ± 1.0) ppt, which is representative of the mean BrO VMR above balloon altitude, where the [BrO] uncertainty represents the statistical uncertainty of the linear regression. For the Langley regression, the SZA range from 86.0° to 89.9° (corresponding to 1.6 = 1024 ≤ SCDair ≤ 5.3 × 1024 ) is used since for SZA < 86.0° the BrO dSCDs are below the detection limit commonly taken as twice the dSCD retrieval uncertainty.
To estimate possible errors introduced by the residual correction during pre-processing, we perform a sensitivity study with different choices of pre-processing parameters as listed in Table A1. The BrO dSCDs and the Langley regressions are calculated for each parameter configuration (see Figs. A1 and B1). For the ensemble of sensitivity runs, the inferred mid-stratospheric [BrO] ranges from (12.7 ± 1.0) ppt to (16.4 ± 1.0) ppt, while the quality of the spectral retrieval is comparable among all the runs. The inferred [BrO] is similar across different numbers of PCs included in the DOAS fit. However, [BrO] is significantly different for different polynomial degrees. None of the pre-processing settings seems to produce significantly different results concerning the rms of the DOAS residuals or dSCD dependencies on SZA. Thus, we integrate all the runs into our final result by calculating the mean and the standard deviation in the ensemble. The mean mid-stratospheric [BrO] over the ensemble (Fig. B1) is 14.4 ppt with a standard deviation of 1.3 ppt on top of a mean Langley regression error of 1.0 ppt. Note that the statistical treatment of the pre-processing error estimated by the standard deviation over the ensemble is debatable since it is actually of a systematic nature. In the absence of better insight, we nevertheless use Gaussian error propagation to combine the pre-processing and Langley-fit error contributions, which yields a total error of 1.6 ppt (11 %). Additionally, the systematic error of the BrO absorption cross section (about 8%) needs to be added when compared with studies using different BrO absorption cross sections.
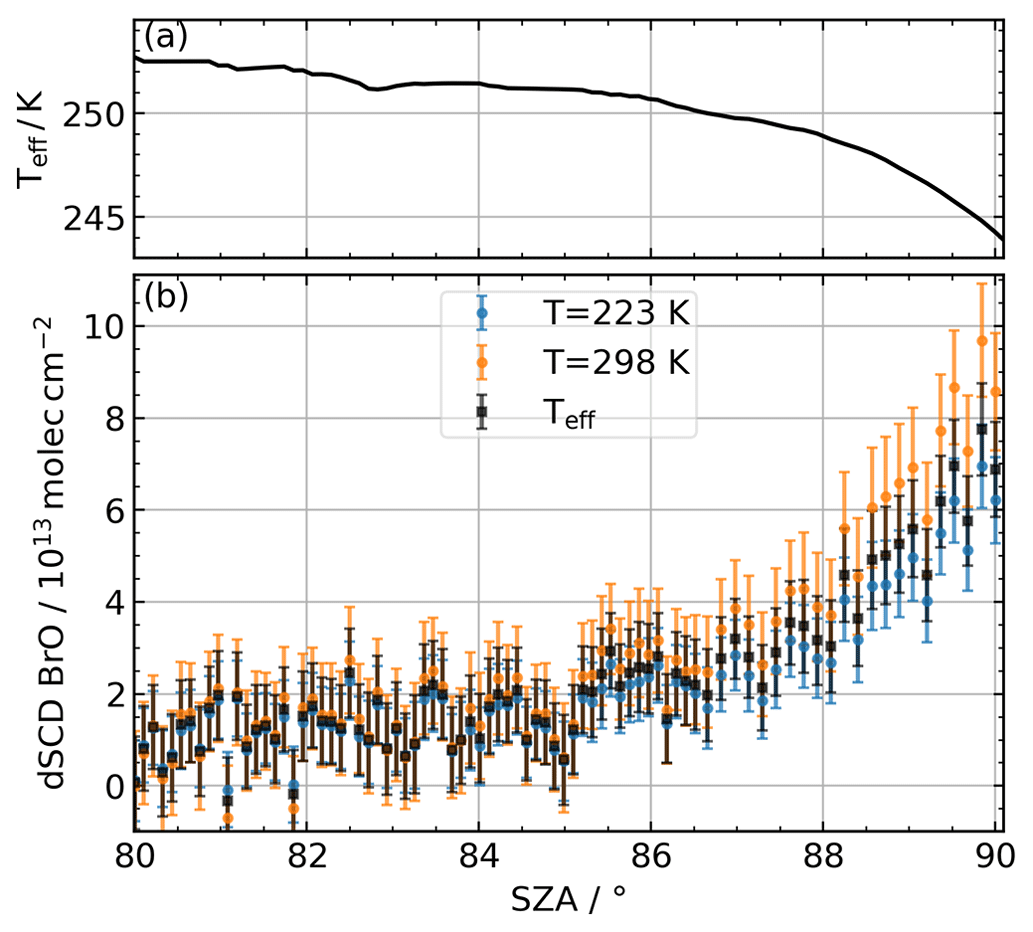
Figure 9Panel (a) shows the BrO effective absorption temperature as a function of the SZA. Panel (b) shows the retrieved dSCDs of BrO for the two BrO absorption cross section temperatures 223 K (blue) and 298 K (orange) reported by Wahner et al. (1988) and the dSCDs of BrO interpolated to the effective absorption temperature (black).
5.2 Bry in the middle stratosphere
[Bry] is inferred from the retrieved BrO dSCDs using the air mass factor matrix and the model-based ratio as described in Sect. 4.3. Figure 11 shows the respective Langley regressions for the same illustrative sensitivity run as in Sect. 5.1. The linear regression of the BrO dSCDs against the slant air mass yields [Bry] = 17.0 ppt with a fit error of 1.2 ppt.
The Langley regressions of all the sensitivity runs are depicted in Fig. B2. In the ensemble, [Bry] ranges from 15.4 to 19.9 ppt. The mean [Bry] among all the sensitivity runs is 17.5 ppt with a standard deviation of 1.6 ppt (9 %). The mean Langley-fit uncertainty of all the runs is 1.2 ppt (7 %). Additionally, we need to consider the uncertainty of the ratio inferred from photochemical simulations, which amounts to 5 % (as described in Sect. 4.4). Again resorting to Gaussian error propagation to combine all three error sources, the total uncertainty of the inferred [Bry] is 2.2 ppt (12 %). Further, we need to add the systematic uncertainty of the BrO absorption cross section of 8 % when our [Bry] is compared with results based on a different absorption cross section or a totally different method.
5.3 Inferred Bry in the context of bromine trends
Our measurements result in [Bry] = (17.5 ± 2.2) ppt with a combined uncertainty of statistical (1.5 ppt) and systematic (1.6 ppt) uncertainty plus an additional 8 % contribution from the absorption cross section needed when compared with results using a different absorption cross section. To compare this result with the published trend in total stratospheric bromine (Laube et al., 2022), we need to determine the year of the stratospheric entry of the observed air masses. To this end, we estimate the age of air from N2O VMRs measured in close temporal and spatial vicinity by the MLS instrument (Waters et al., 2006) or by the co-deployed GLORIA instrument (see Fig. C1). Using the N2O and age-of-air relationship of Engel et al. (2002) and updating the relationship with present N2O VMRs at the stratospheric entry level (Lan et al., 2022), we infer a mean age of the probed air masses of (5.5 ± 1.0) years. This results in a stratospheric entry date in early 2017 ± 1 year.
Given this date and the sizes of our errors, our [Bry] estimate fits reasonably well into the trend assessments provided in Figs. 1–14a of the recent scientific assessment of ozone depletion (Laube et al., 2022). Moreover, Rotermund et al. (2021) inferred a total stratospheric bromine mixing ratio [Brtot] from total inorganic bromine Bry and organic bromine species of [Brtot] = (19.2 ± 1.2) ppt for air younger than about 1 year in the lower stratosphere measured from on board the HALO aircraft during the WISE campaign in autumn 2017. Since there should be no sizable organic bromine abundance present in the middle stratosphere, our inferred [Bry] can be compared directly to their [Brtot]. The estimate by Rotermund et al. (2021) is greater by 1.7 ppt than ours but agrees within our comparatively large error bar.
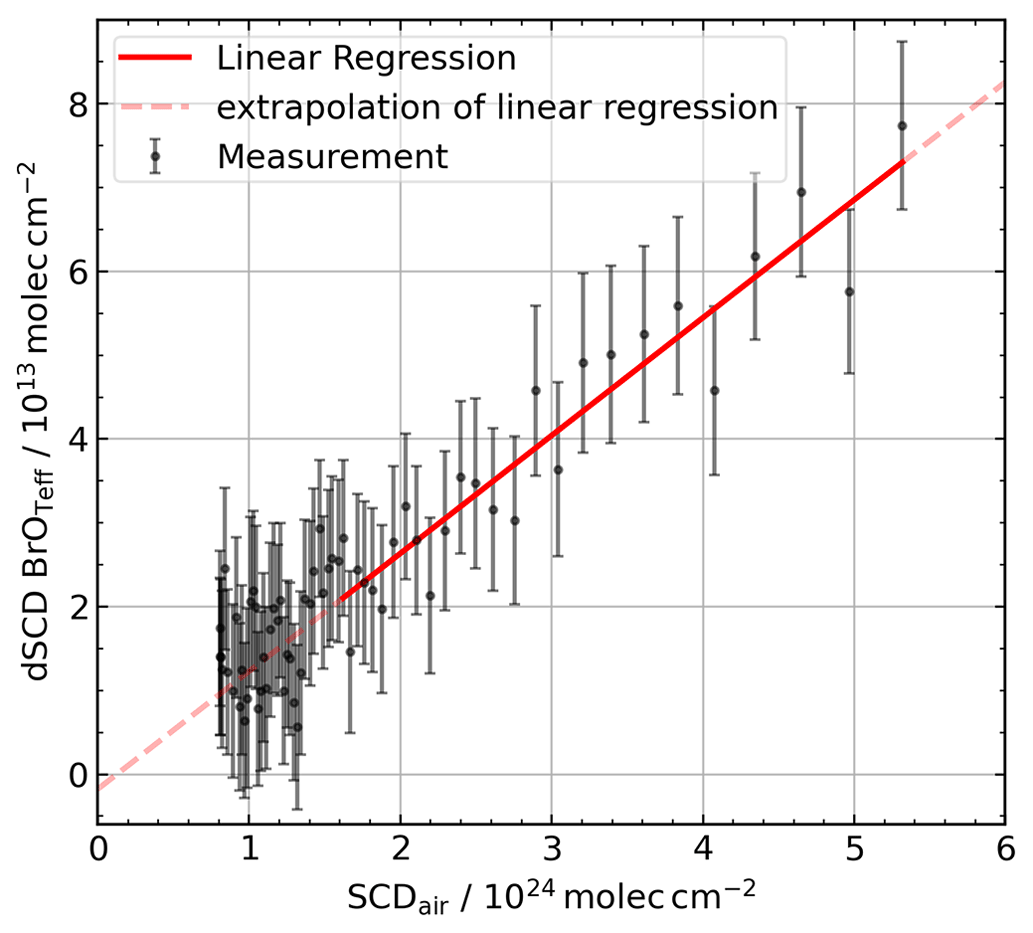
Figure 10Langley plot for BrO. The dSCD BrO error bars indicate the 1σ DOAS retrieval uncertainty. The linear regression (red solid line) yields a slope of [BrO] = (14.1 ± 1.0) ppt and a y-axis intercept of SCDBrO,0 = (1.8 ± 3.0) × 1012 . The faint dashed red line indicates the extrapolation of the linear regression outside the fit range of 86° ≤ SZA ≤ 89.9°.
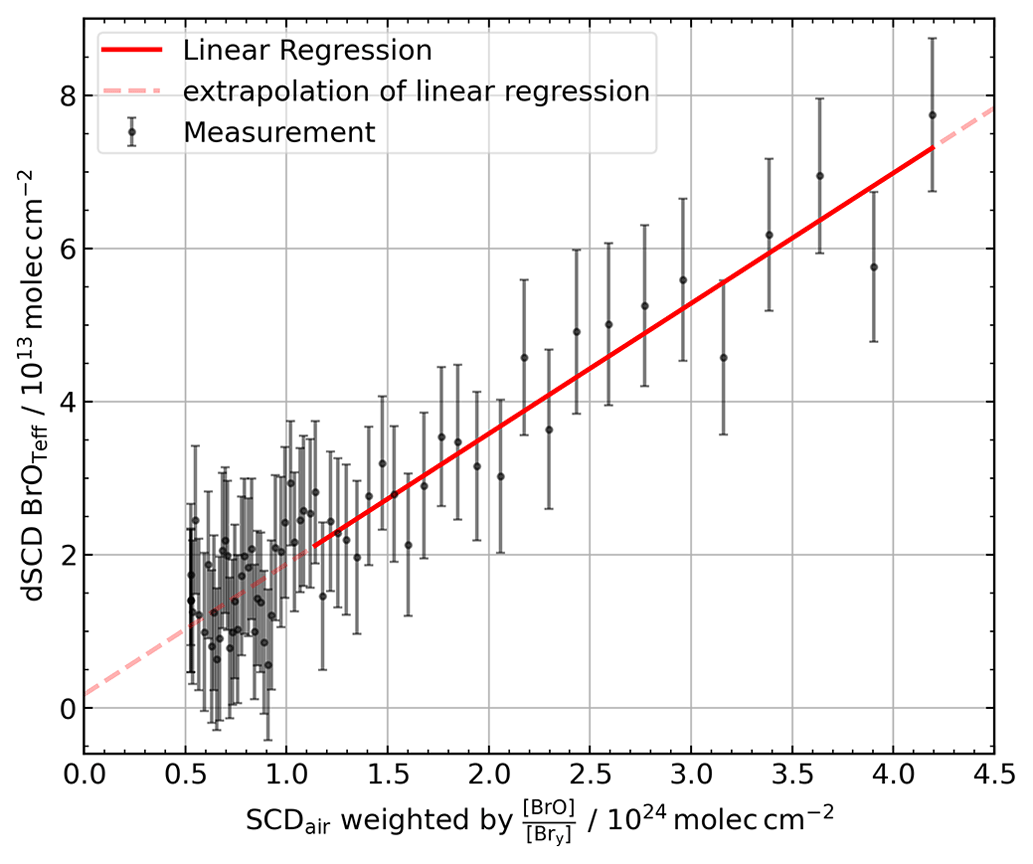
Figure 11Langley plot for Bry. A linear regression (red solid line) is fitted to the BrO dSCDs of BrO against the SCDair weighted by the ratio as described in the text. The slope of the fit yields a [Bry] of (17.0 ± 1.2) ppt. Again, the BrO dSCDs of spectra with SZA < 86° are not included in the fit (red dashed line) since they are lower than the detection limit of our instrument (twice the DOAS fit error).
However, in the future, it should be feasible for us to infer [Bry] with higher accuracy than presented here, which would add more information to the trend in stratospheric bromine when continued over a longer period. The predominant contribution to the uncertainty of our Bry estimate is the error arising from the residual correction, the error of the BrO absorption cross section, and the noise error of the retrieved BrO dSCDs.
We plan to replace the CCD detectors that were contaminated in the past, which should eliminate the detected residual structures in the spectra and, thus, the respective error contribution. Furthermore, the noise in the dSCDs can be reduced by enhancing the light throughput. Our instrument setup could accommodate a light input larger by a factor of 2 into the spectrometers by choosing different glass fibres, which should reduce the noise by a factor of for the same temporal co-adding. Both measures could reduce the error of the inferred [Bry] of our measurements. Our assessments would also benefit from a better-constrained BrO absorption cross section with respect to its temperature dependence, which is used to retrieve BrO using the DOAS method as well as the photochemical simulation of the ratio. Further, better-constrained reaction rate constants for the dominant daytime bromine reactions (Reactions R1, R2, and R4) at stratospheric temperatures would decrease the uncertainty of the estimated ratio. More information on the photochemistry of stratospheric bromine could be obtained from simultaneous balloon-borne measurements of BrO (e.g. our balloon-borne DOAS instrument) and BrONO2 (Michelson Interferometer for Passive Atmospheric Sounding – MIPAS – or GLORIA instruments, Wetzel et al., 2017; Höpfner et al., 2021). In fact, for both deployments reported here, we intended joint measurements of BrO and BrONO2, but the data coverage (e.g. lacking ascent data; see e.g. Dorf et al., 2008) and quality of our measurements during the previous deployments are still not as good as desired for such a study.
If operational issues currently preventing us from continuous observations during balloon ascent can be solved, we should be capable of extending our analyses from merely using balloon float data to inferring vertical trace gas profiles of BrO, O3, and NO2 and possibly HONO from the upper troposphere and lower stratosphere into the middle stratosphere, similarly to previous balloon-borne deployments (Dorf et al., 2006a; Butz et al., 2006; Kritten et al., 2010).
Further, the instrument potentially offers the opportunity to measure mid-stratospheric IO abundances using the spectra recorded by the Vis spectrometer. Solar occultation measurements from balloon float altitudes of 35 km at SZA ≈ 95° provide very long light paths through the stratosphere and thus the possibility of detecting even very low IO abundances (Bösch et al., 2003; Butz et al., 2009).
We have developed a new balloon-borne solar occultation DOAS instrument designed for measurements of UV–Vis absorbing gases mainly relevant to ozone chemistry in the stratosphere, e.g. O3, NO2, and BrO and possibly IO, OClO, and HONO. The instrument is of medium weight (< 40 kg) and has low power consumption (< 100 W), making it suitable as a secondary instrument on azimuth-controlled balloon gondolas. Its modular design combines a stand-alone solar tracker with two temperature- and pressure-stabilised optical spectrometers coupled through glass fibre bundles. The solar tracker is capable of compensating for the rotational motion of the gondola up to a rate of ± 2 ° s−1 via altitude–azimuth-mounted mirrors controlled by a PID control loop.
Two deployments of the instrument on board the azimuth-stabilised gondola HEMERA offered by the CNES (Centre National d'Études Spatiales) were conducted in 2021 and 2022 from Kiruna (Sweden) and Timmins (Canada), respectively. The precision of the solar tracking system was excellent, with virtually all the measurements complying with the targeted precision of 0.05° corresponding to of the sun's diameter with respect to the centre of the solar disc during balloon float in the middle stratosphere. However, due to operational constraints, the gondola's rotational motions during balloon ascent were too fast to allow for solar tracking. The optical spectrometers performed reasonably well apart from an oscillating spectral pattern that we attribute to contaminated CCD detectors. Nevertheless, for spectra acquired during the deployment in 2022, these residual structures could be corrected for with a principal component analysis. After this correction, slant column densities of O3, NO2, and BrO could be retrieved. Using Langley's method, the BrO dSCDs are converted to a mid-stratospheric (above 33.7 km) [BrO] VMR which amounted to (14.4 ± 1.6) ppt with an additional systematic error due to the BrO absorption cross section of 8 %.
In order to estimate the total gaseous inorganic bromine load Bry, we simulate the mid-stratospheric ratio as a function of altitude and SZA using a photochemical model based on TOMCAT. We find a [Bry] = (17.5 ± 2.2) ppt plus 8 % contribution from the absorption cross section. The [Bry] uncertainty reflects the combined statistical (1.5 ppt) and systematic (1.6 ppt) uncertainties. Based on the age-of-air relationship driven by N2O profiles measured by the GLORIA instrument on board the same balloon gondola, the stratospheric entry date of the probed air masses is early 2017 ± 1 year. Our inferred [Bry] fits reasonably well into the decadal stratospheric trend given by Laube et al. (2022) with a [Bry] lower by 1.7 ppt than the total stratospheric bromine inferred by Rotermund et al. (2021) with a similar stratospheric entry date. Both results agree with each other considering the combined error bars.
Further improvements in our instrument will be directed toward reducing the errors by improving the light throughput and eliminating the spectral residual structures. Future deployments of the instrument and the respective data analysis will focus on exploiting the capabilities in terms of measuring the full suite of accessible chemical species such as IO to better constrain the stratospheric iodine load. Given its suitability as a secondary payload, we will aim to co-deploy the instrument with other stratospheric chemistry missions to contextualise the photochemical regime through various observational constraints.
The choice of the best parameters to use in the pre-processing to derive the pseudo absorbers to be included in the DOAS retrieval is not straightforward. Thus, a sensitivity study is performed to investigate the impact of different sets of pseudo absorbers. The following parameters are varied in this sensitivity study (Table A1): (a) the AIRMASS approach or SPEC approach, (b) the polynomial degree fitted in the pre-processing procedure to derive the residual optical densities, and (c) the number of included PCs in DOAS retrievals. In total, 11 different DOAS retrievals are carried out for each of the two BrO absorption cross-sectional temperatures.
Table A1Parameter configurations used for estimating the sensitivity of the BrO DOAS retrievals to the residual correction in the pre-processing step.
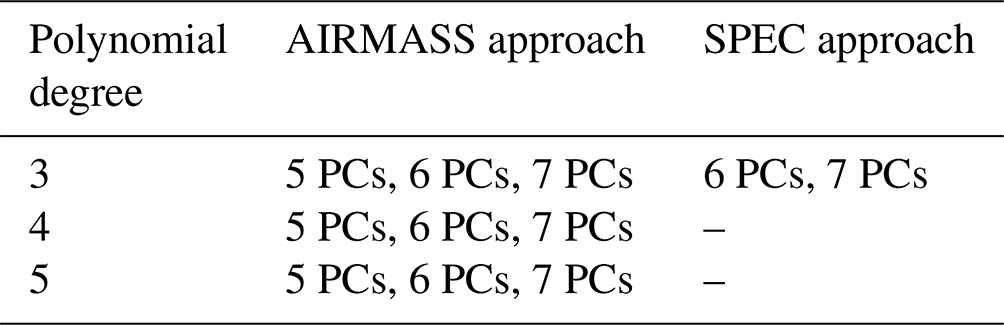
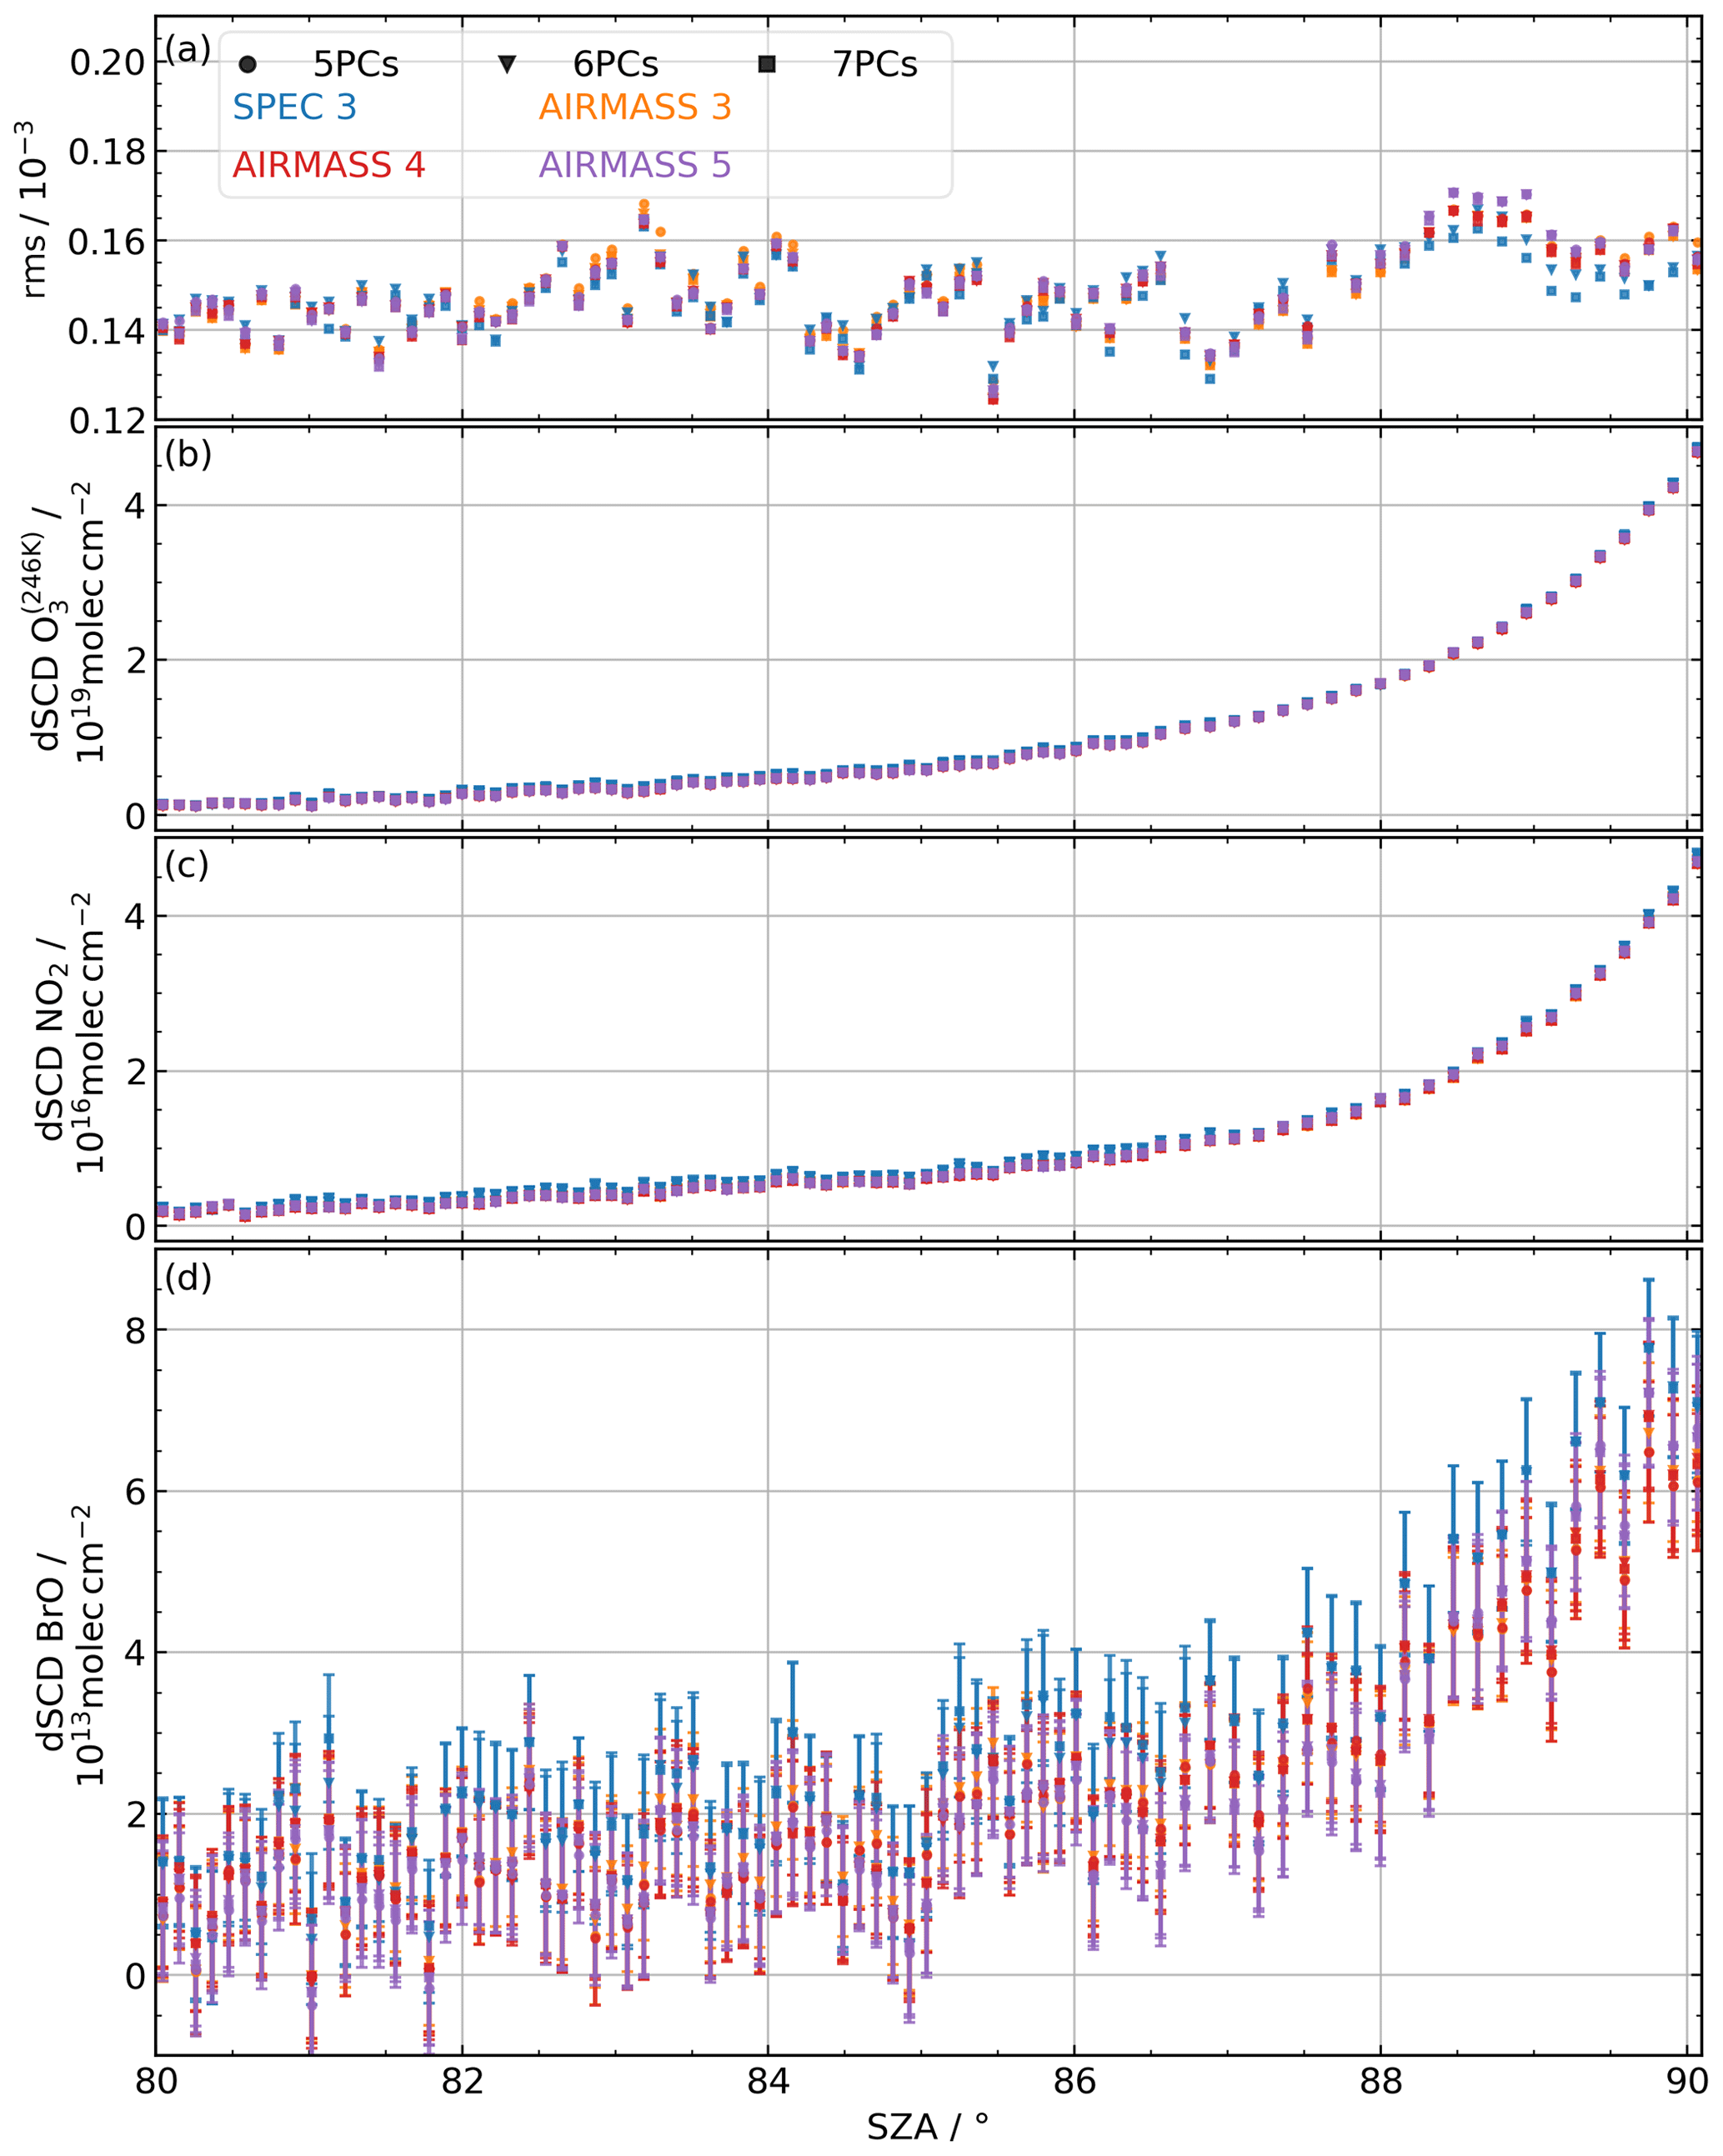
Figure A1O3 (b), NO2 (c), and BrO (d) dSCDs and the rms (a) of the DOAS retrievals as a function of SZAs for the 11 parameter configurations of the residual correction (colours and markers as indicated by the legend).
The rms and the dSCDs of O3, NO2, and BrO retrieved with the DOAS method for all 11 configurations are shown in Fig. A1. Different colours and markers indicate the different sensitivity runs. In comparison to the retrieval with the cold BrO absorption cross section, the retrieval with the warm BrO absorption cross section yields similar rms values, O3, and NO2 dSCDs but slightly higher BrO dSCDs (shown in Fig. 9b). Figure A1 shows that the retrieved dSCDs of ozone (Fig. A1b) and NO2 (Fig. A1c) are only marginally affected by the different sets of pseudo absorbers included in the sensitivity runs, because the optical densities of these gases along the line of sight are higher than the spectral residual structures. However, the rms of the spectral residuals (Fig. A1a) and the BrO dSCDs (Fig. A1d) vary slightly for the different sensitivity runs. Nevertheless, the differences in the retrieved BrO dSCDs between the sensitivity runs are lower than the dSCD errors (indicated by the error bars). Furthermore, the variance in the rms over all the spectra retrieved with one set of pseudo absorbers is larger than the differences in the rms between the different sensitivity runs of one spectrum. Additionally, the differences in the BrO dSCDs and rms between the two spectra are similar in magnitude and sign for all the sensitivity runs. That is, the lowest rms of the residual is found for the same spectrum, independent of the sensitivity run. Markers of the same colour mostly lie very close to each other, while markers of different colours show larger discrepancies in the retrieved dSCDs. Thus, the effect of the chosen approach (AIRMASS or SPEC) and the polynomial order shows a higher impact on the retrieved dSCDs than the number of principal components included in the DOAS fits.
The BrO dSCDs as a function of the SZA show slightly different slopes for the different sensitivity runs. That is, the runs marked in red (AIRMASS with polynomial order 4) result in the lowest dSCDs at SZAs between 89 and 90°, whereas the runs marked in purple (AIRMASS with polynomial degree 5) result in the lowest dSCDs for nearly all the spectra recorded at SZAs between 80 and 89°. In general, the dSCDs of the sensitivity runs marked in blue (SPEC approach) show the largest retrieved BrO dSCDs for all the SZAs.
None of the included sensitivity studies seems to perform significantly better or worse with respect to the rms of the residual and the BrO dSCDs as a function of the SZA. Therefore, in the evaluation, the results of all the sensitivity runs are used, and the uncertainty remaining after correcting the spectral residual structures is then estimated from the mean and standard deviation of the ensemble of results as described in the main paper.
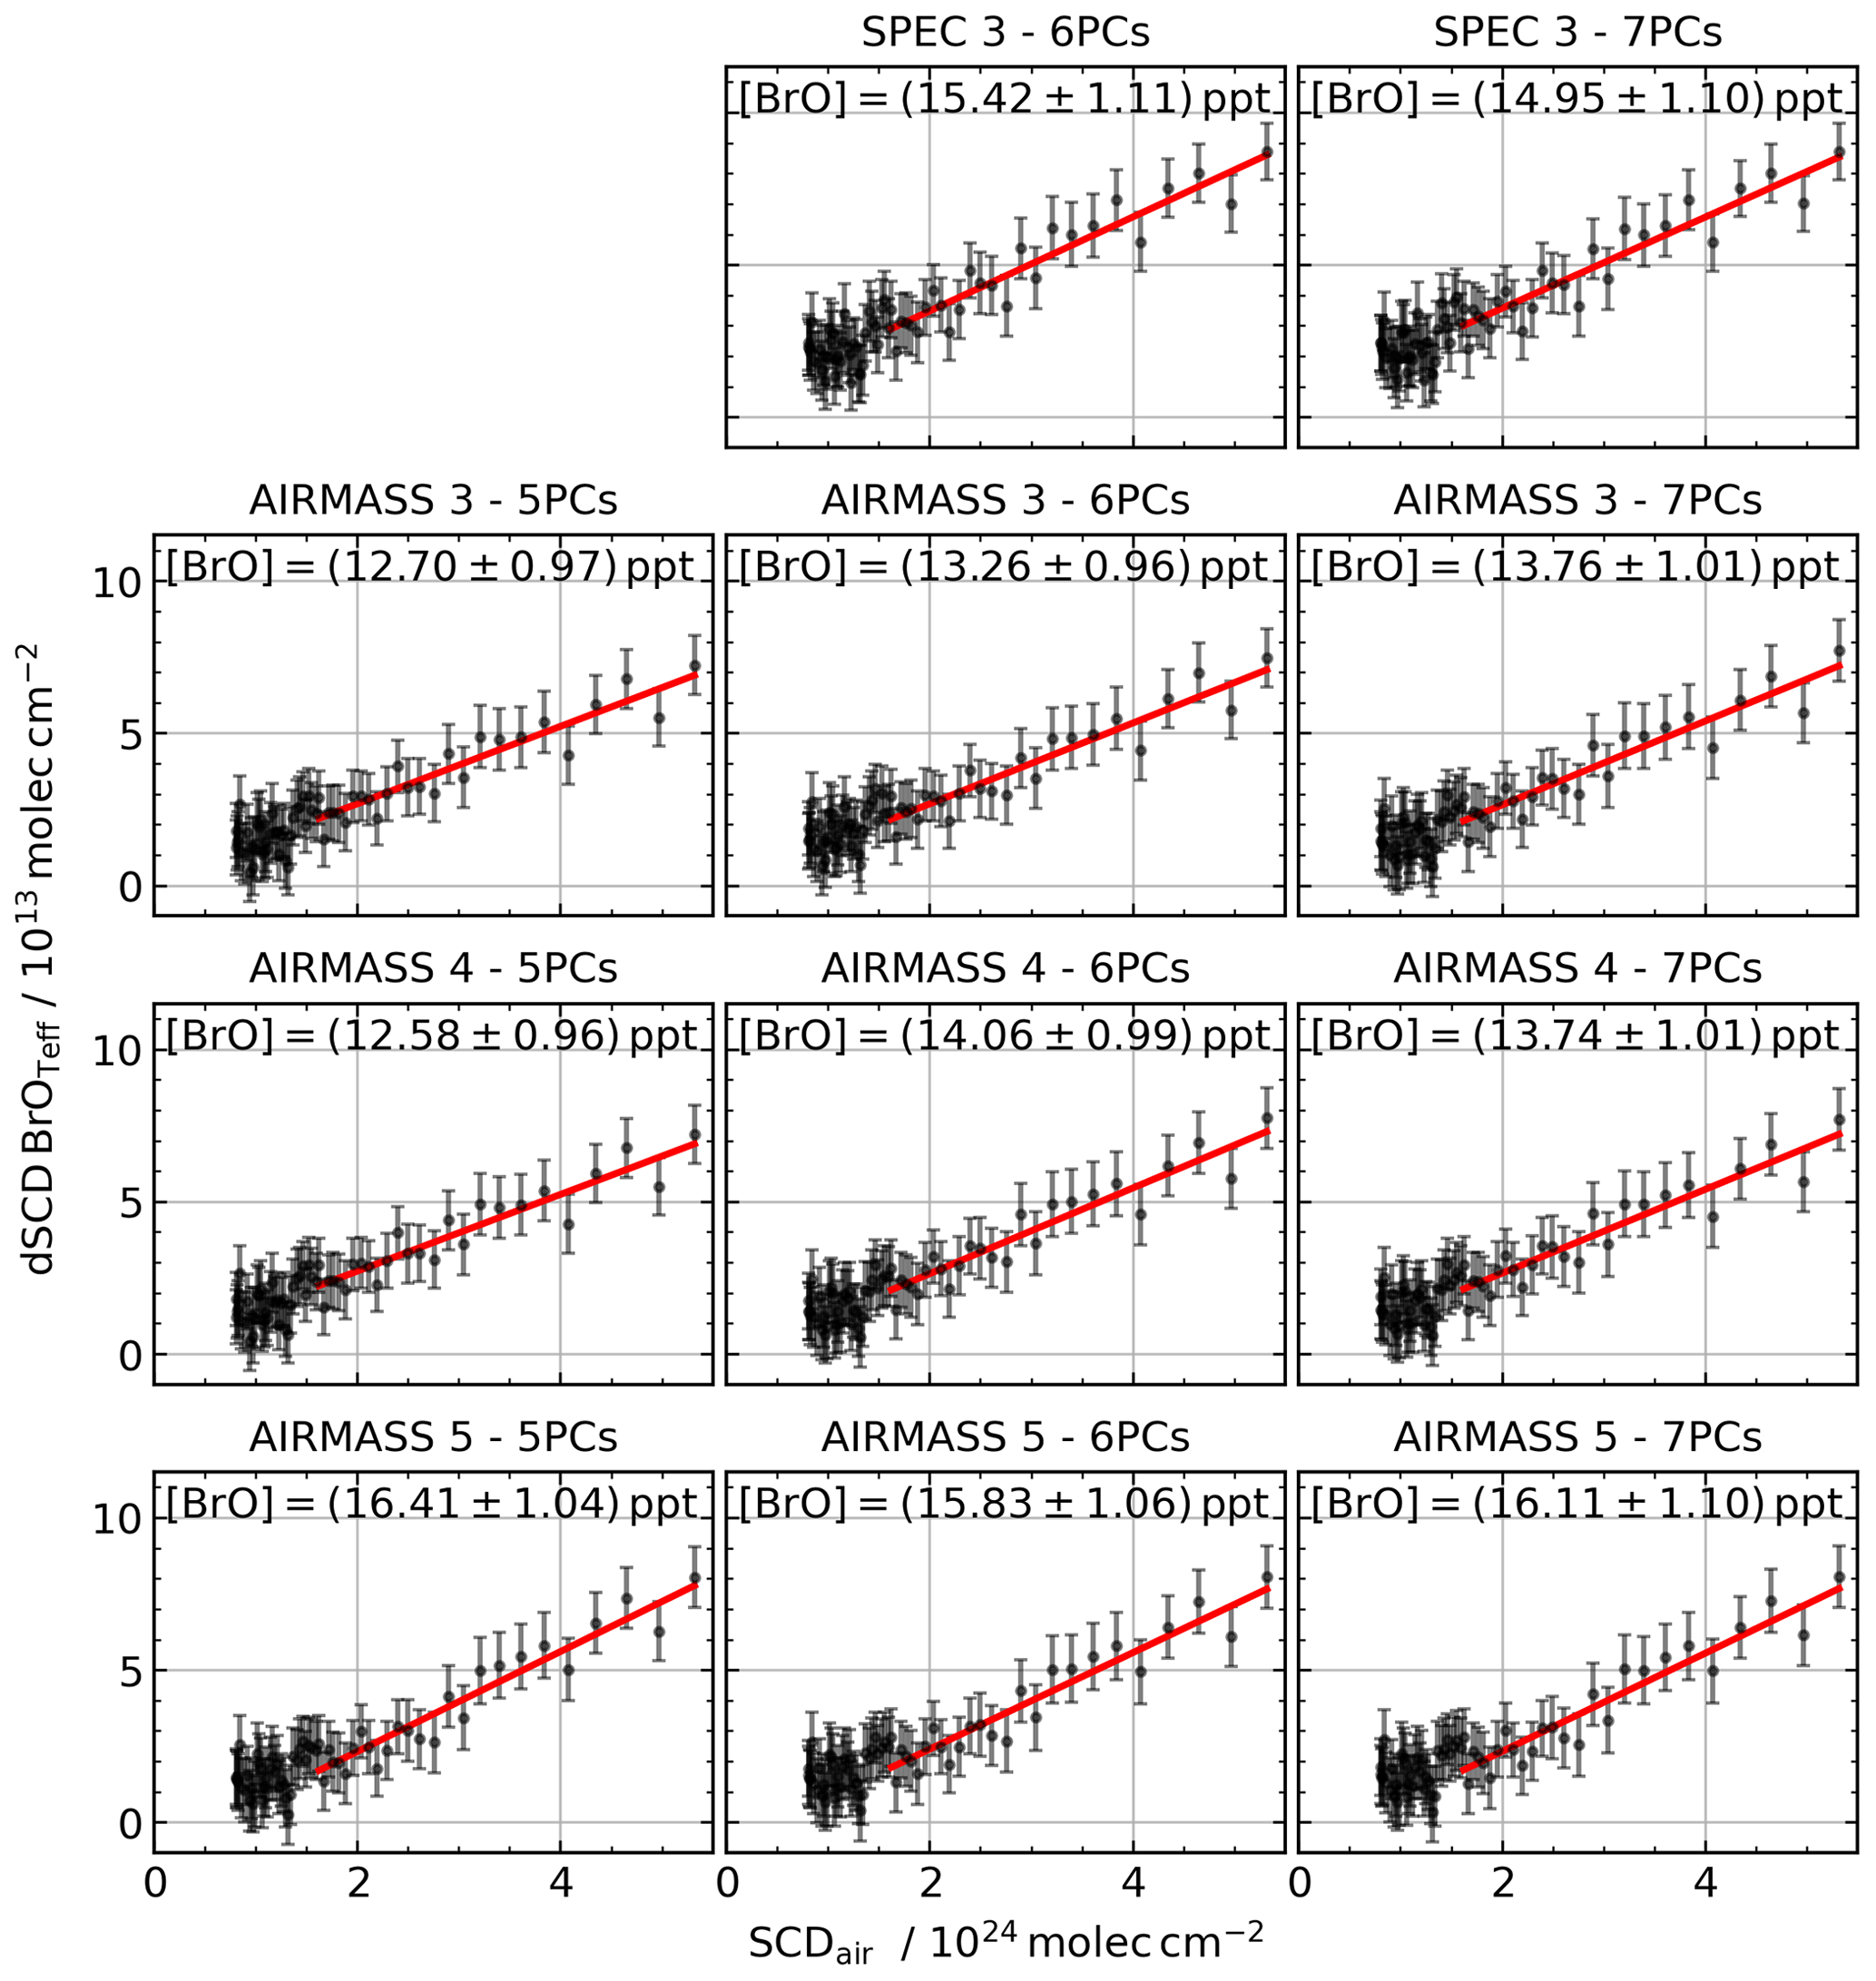
Figure B1BrO Langley fits for the 11 parameter configurations of the residual correction. The mean [BrO] is 14.4 ppt. The standard deviation is 1.3 ppt and the mean fit error is 1.0 ppt.
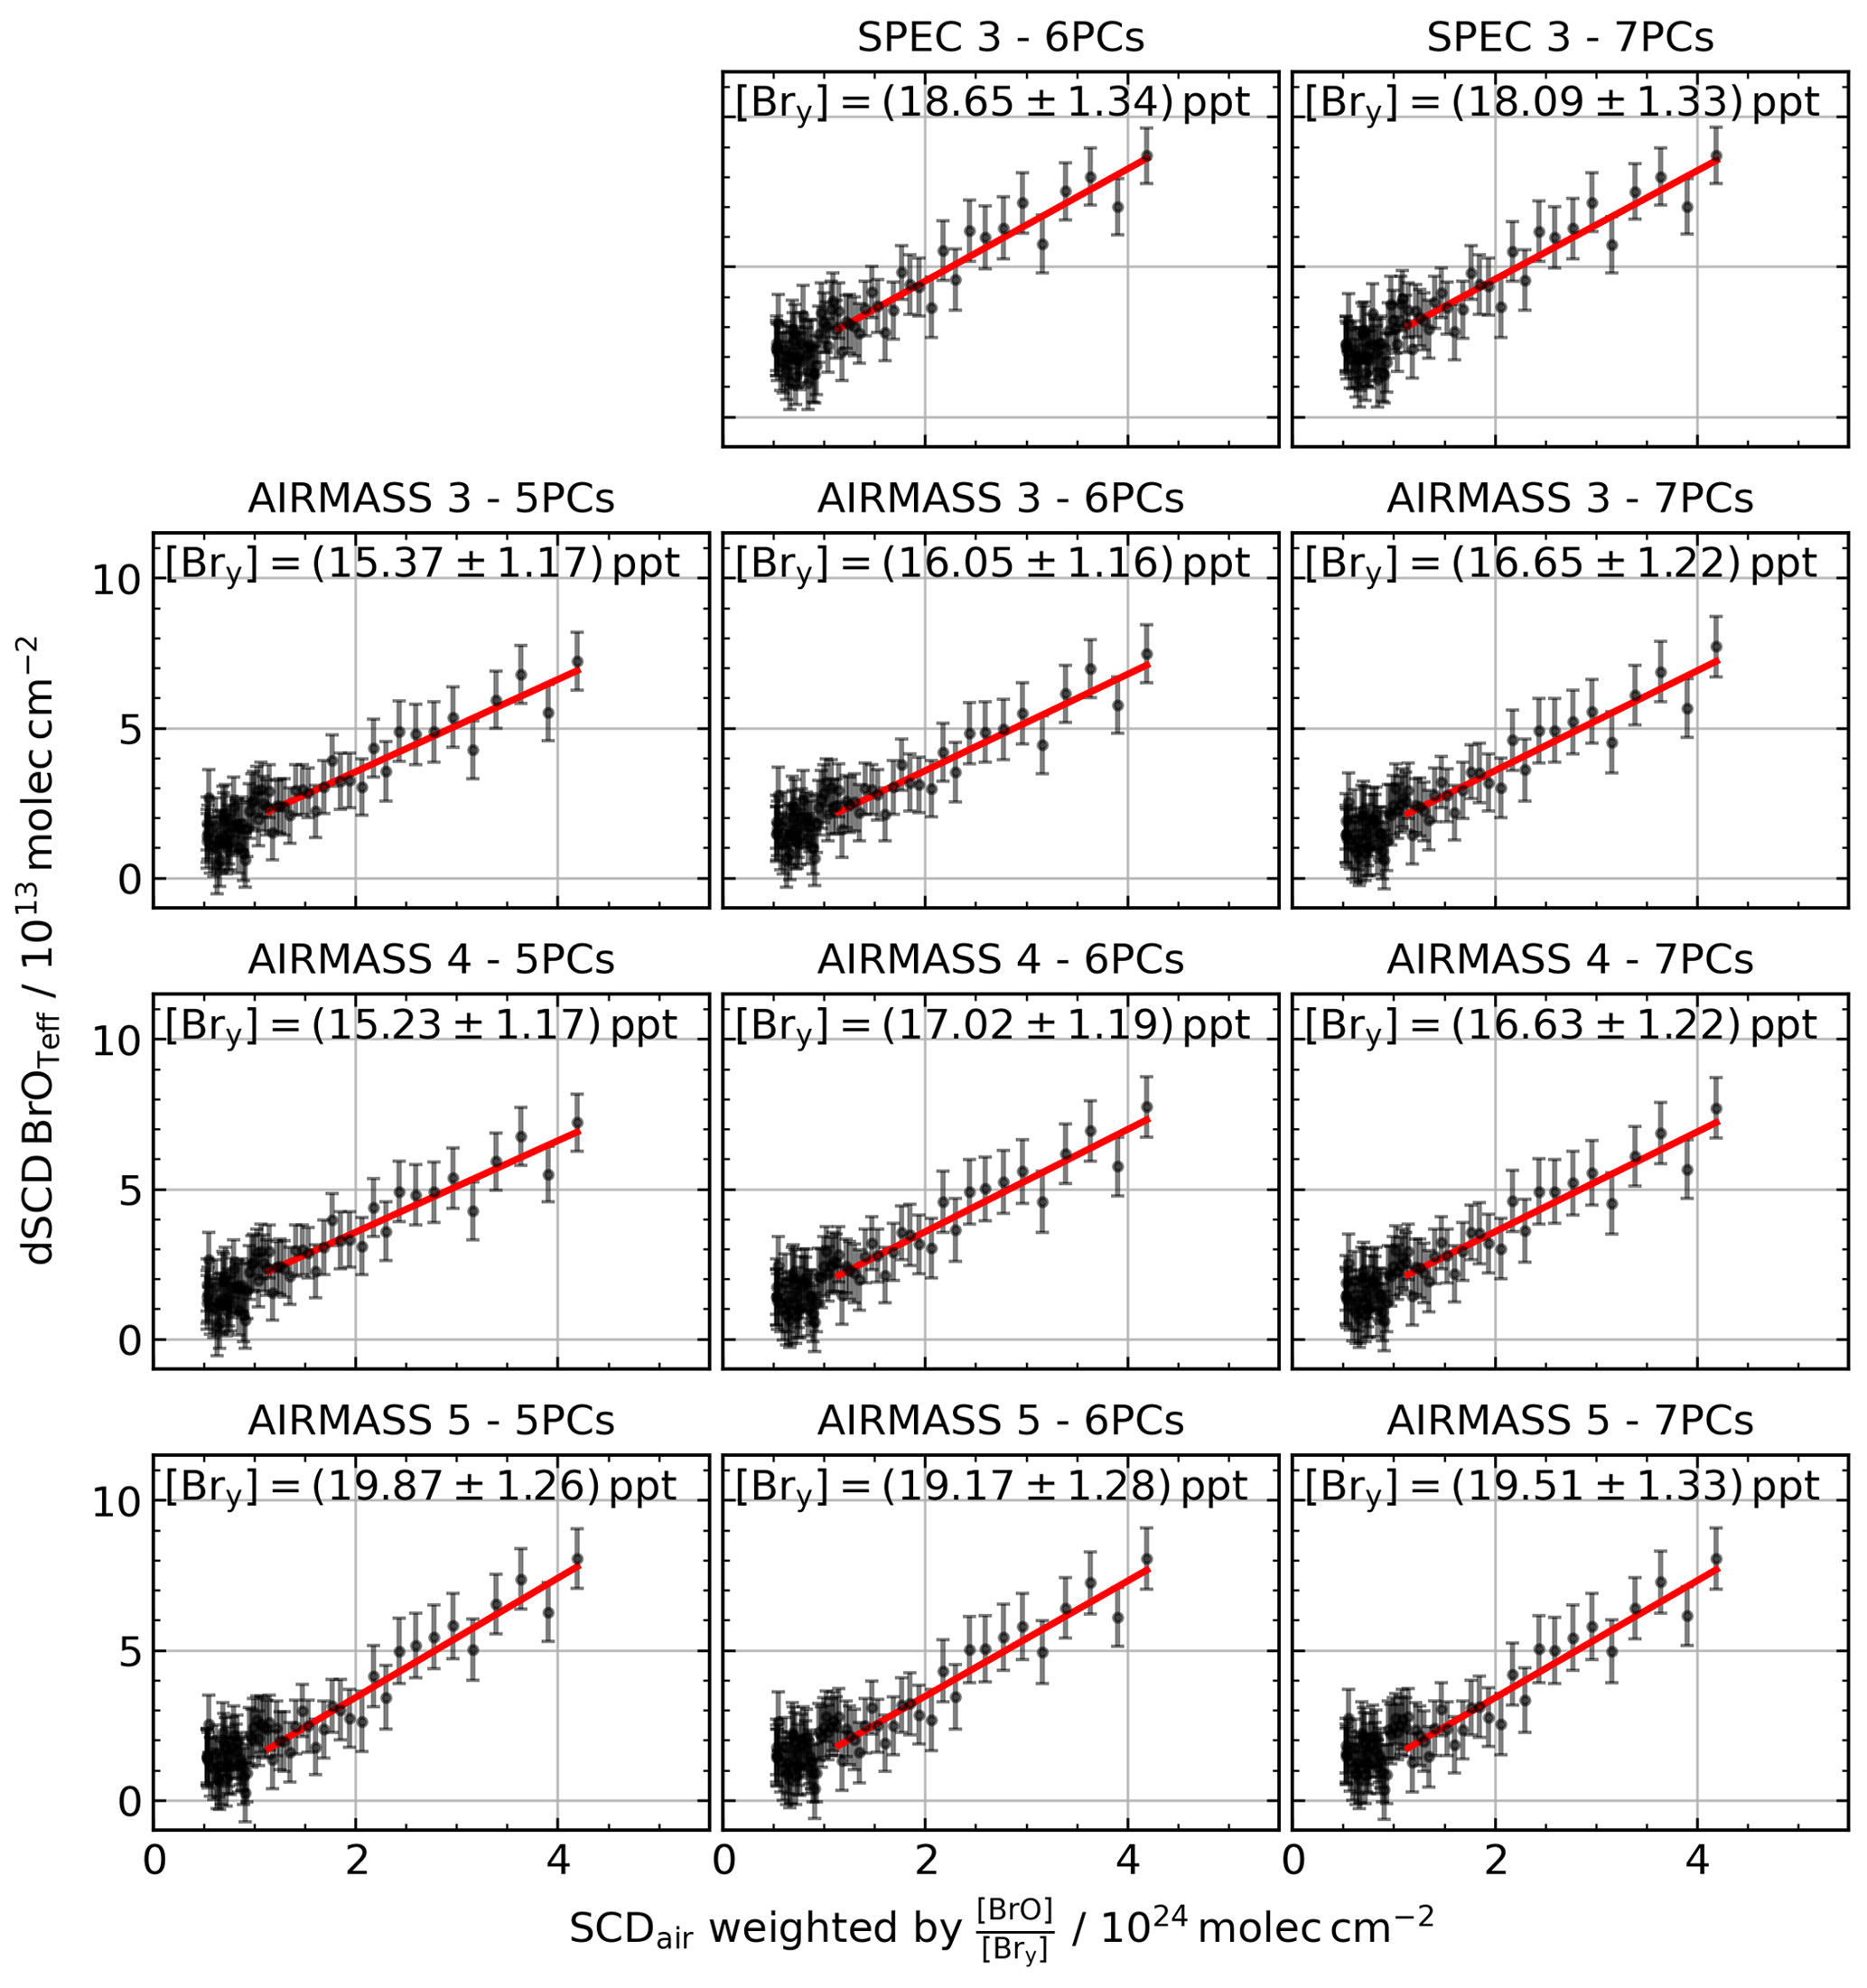
Figure B2Bry Langley fits for the 11 parameter configurations of the residual correction. The mean [Bry] is 17.5 ppt. The standard deviation is 1.6 ppt and the mean fit error is 1.2 ppt.
Engel et al. (2002) inferred an empirical relationship between the mean age of air of a stratospheric air mass and its N2O volume-mixing ratio shown in blue in Fig. C1b. Their relationship is based on tropospheric N2O mixing ratios around 2002, and thus it needs to be updated to present-day N2O mixing ratios by multiplying it by the fractional increase in tropospheric N2O since 2000. This update is shown in orange in Fig. C1b. The N2O profile of air masses probed during the balloon flight from Timmins can be inferred from the co-deployed GLORIA instrument. A mean N2O profile over the entire flight retrieved from GLORIA spectra (blue) and a N2O profile measured by the MLS on 23 August 2022 over 48° N and 82.5° W (orange) (Lambert et al., 2020) are shown in Fig. C1a. At balloon altitude we find a [N2O] of (40 ± 20) ppb, resulting in a mean age of air of (5.5 ± 1.0) years since stratospheric entry.
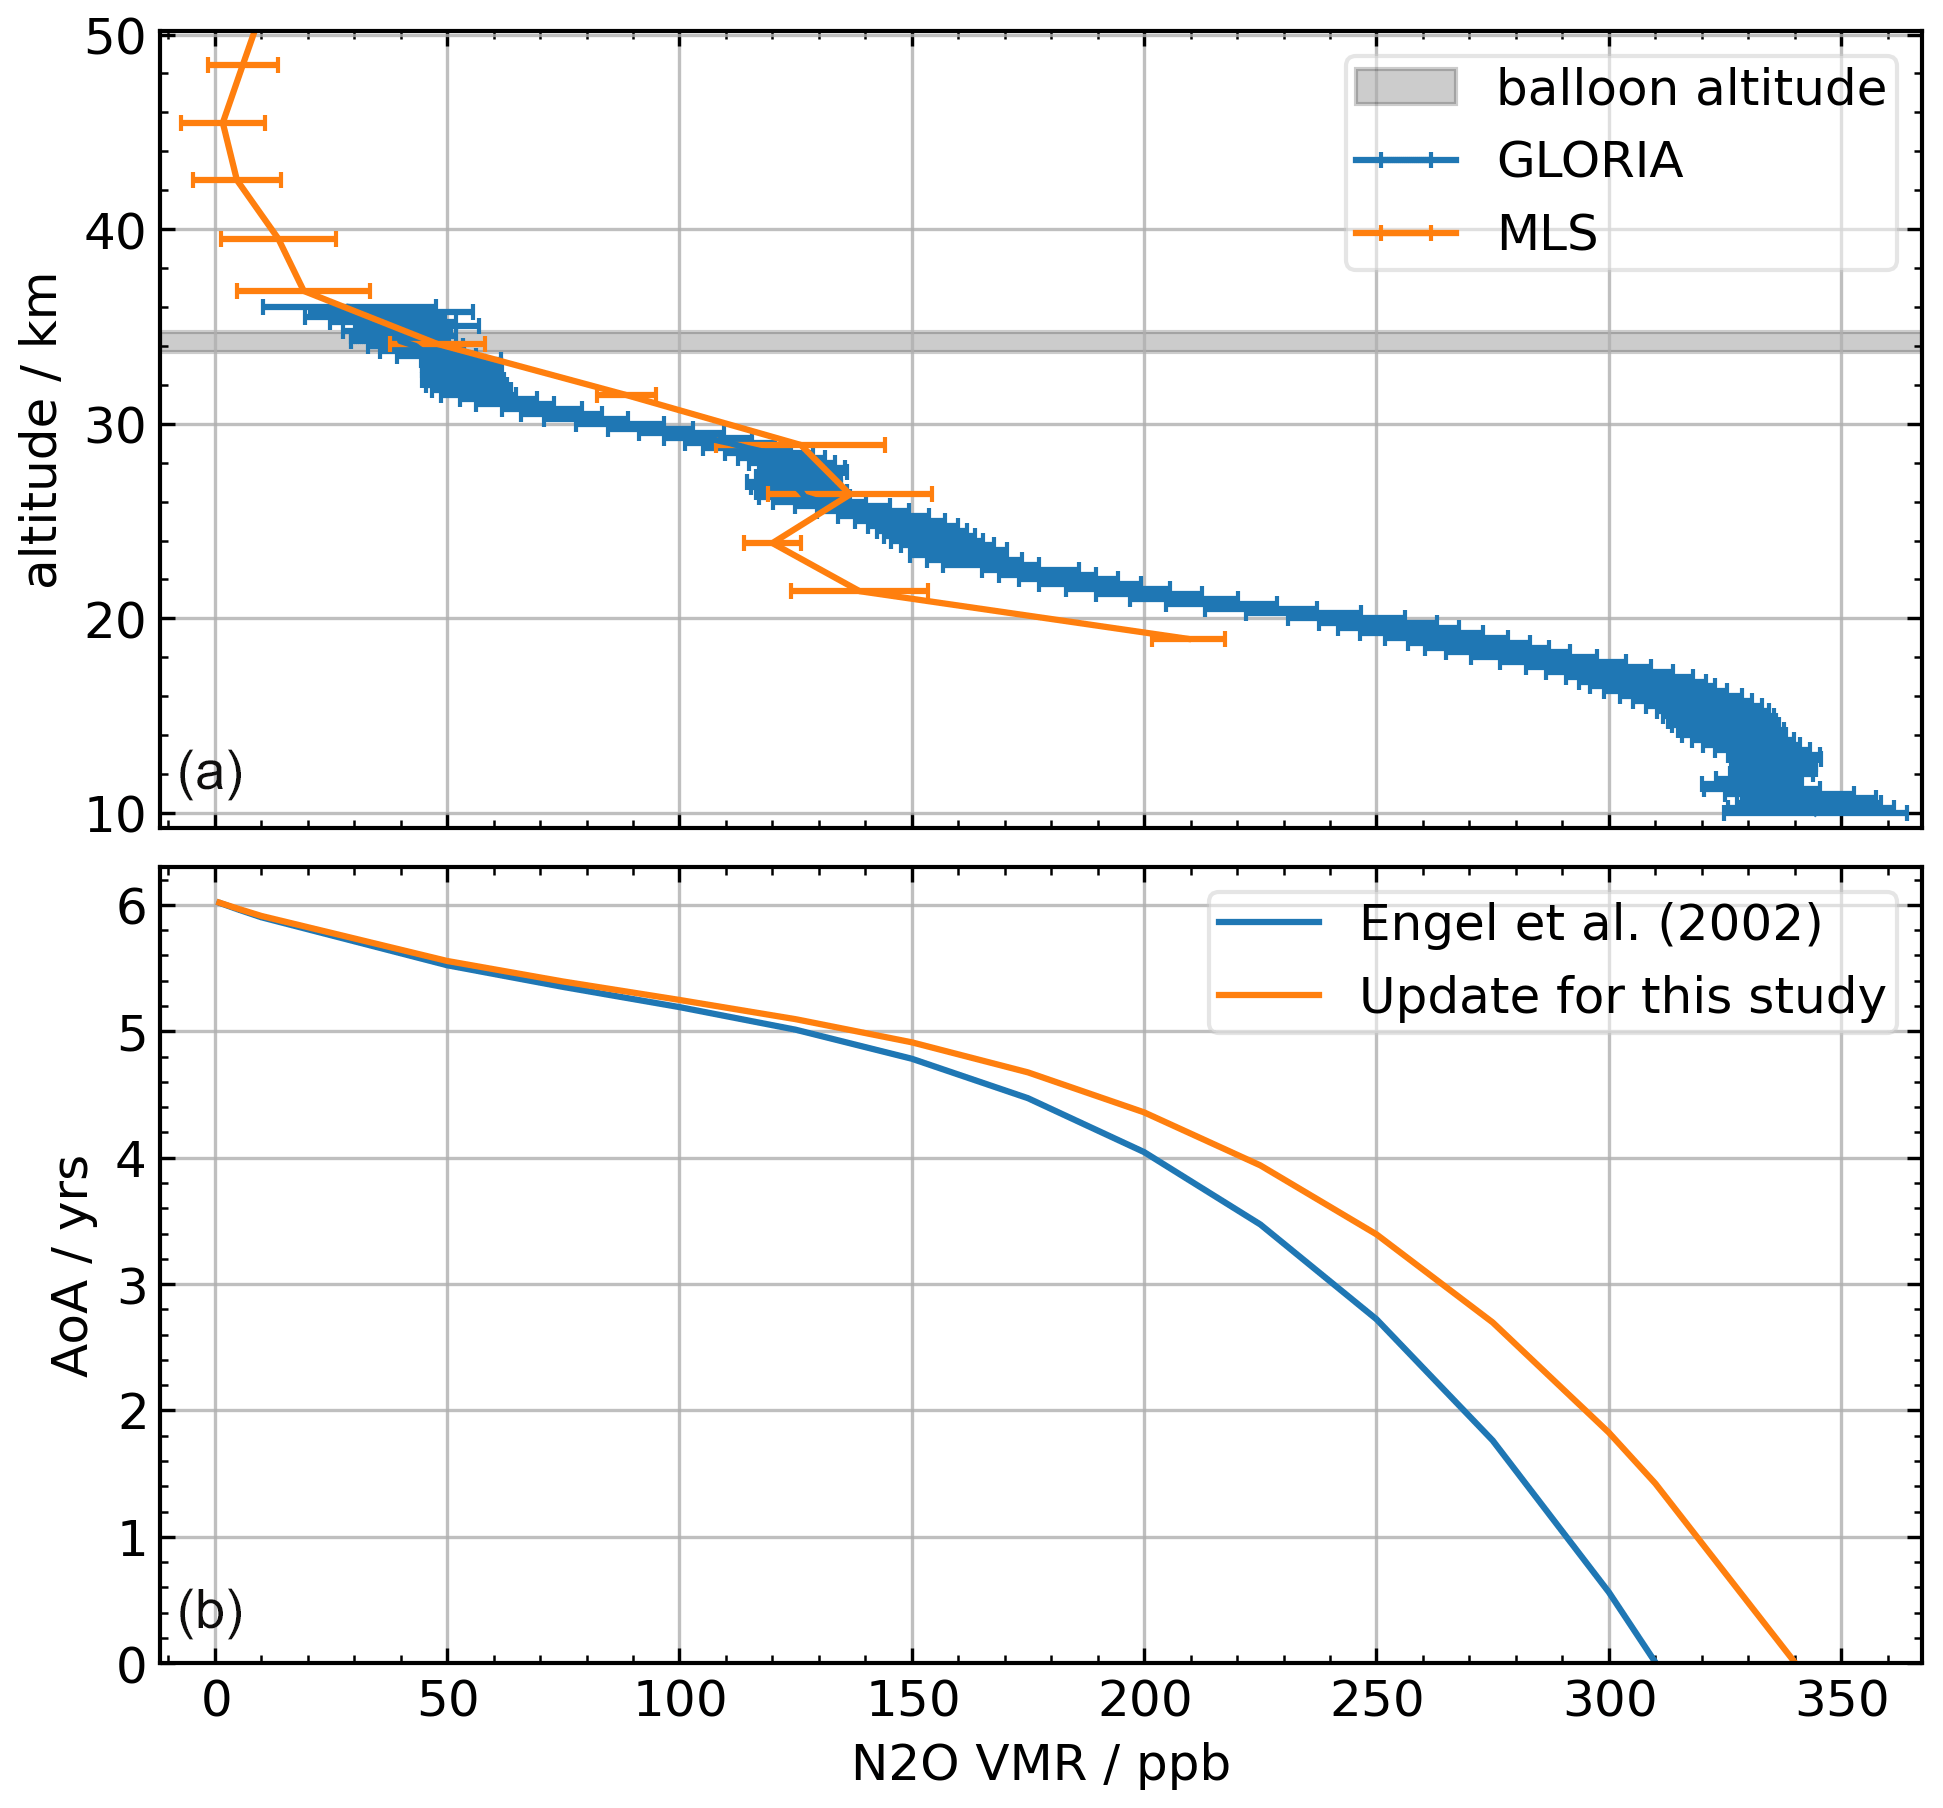
Figure C1N2O profiles measured by GLORIA and the MLS (a). Panel (b) shows the mean age of air for a given N2O VMR. A measured [N2O] of (40±20) ppb results in an age of air of around (5.5 ± 1.0) years since stratospheric entry.
The data recorded by the balloon-borne DOAS instrument presented in Figs. 10 and 11 and the mean N2O profile recorded by GLORIA presented in Fig. C1 are available at https://doi.org/10.25326/XYCR-8C53 (no registration required, Voss, 2024). The MLS data can be obtained from the Goddard Earth Sciences Data and Information Services Center archive at https://disc.gsfc.nasa.gov (last access: 20 March 2023; registration required, N2O data: https://doi.org/10.5067/Aura/MLS/DATA/3116, Lambert et al., 2020; registration required, O3 data: https://doi.org/10.5067/Aura/MLS/DATA2516, Schwartz et al., 2020). The ERA5 data can be obtained from the Copernicus Climate Data Store at https://doi.org/10.24381/cds.bd0915c6 (registration required, Hersbach et al., 2023).
KV, PH, and RK assembled and tested the instrument in the laboratory. KV, PH, and KP assembled the instrument on the HEMERA 1 and HEMERA 2 balloon payloads and participated in the balloon campaigns. KV did the data evaluation. BF wrote the software used to operate the spectrometers during the deployments. GW, MH, and JU provided the onboard N2O data from the GLORIA instrument from which the age of air was inferred. Moreover, GW, MH, and BMS provided the TOMCAT model setup. KV, AB, and KP wrote the manuscript, with contributions from all the co-authors. KP and AB conceived and supervised the study.
At least one of the (co-)authors is a member of the editorial board of Atmospheric Measurement Techniques. The peer-review process was guided by an independent editor, and the authors also have no other competing interests to declare.
Publisher's note: Copernicus Publications remains neutral with regard to jurisdictional claims made in the text, published maps, institutional affiliations, or any other geographical representation in this paper. While Copernicus Publications makes every effort to include appropriate place names, the final responsibility lies with the authors.
We are grateful to the CNES balloon team for the campaign organisation and for successfully performing the balloon flight from Esrange near Kiruna (Sweden) on 21 August 2021 and from Timmins (Ontario, Canada) on 23 August 2022. We thank the editor Saulius Nevas and the two anonymous reviewers for their comments, which helped to improve the paper.
This research was supported by the Deutsche Forschungsgemeinschaft (grant nos. BU 2599/9-1 and PF 384/23-1) and by the EU Horizon 2020 research and innovation programme HEMERA (grant no. 730970).
This paper was edited by Saulius Nevas and reviewed by two anonymous referees.
Aliwell, S. R., Van Roozendael, M., Johnston, P. V., Richter, A., Wagner, T., Arlander, D. W., Burrows, J. P., Fish, D. J., Jones, R. L., Tørnkvist, K. K., Lambert, J.-C., Pfeilsticker, K., and Pundt, I.: Analysis for BrO in zenith-sky spectra: An intercomparison exercise for analysis improvement, J. Geophys. Res.-Atmos., 107, ACH 10-1–ACH 10-20, https://doi.org/10.1029/2001JD000329, 2002. a, b
Belotti, C., Barbara, F., Barucci, M., Bianchini, G., D'Amato, F., Del Bianco, S., Di Natale, G., Gai, M., Montori, A., Pratesi, F., Rettinger, M., Rolf, C., Sussmann, R., Trickl, T., Viciani, S., Vogelmann, H., and Palchetti, L.: The Far-Infrared Radiation Mobile Observation System (FIRMOS) for spectral characterization of the atmospheric emission, Atmos. Meas. Tech., 16, 2511–2529, https://doi.org/10.5194/amt-16-2511-2023, 2023. a
Bösch, H., Camy-Peyret, C., Chipperfield, M. P., Fitzenberger, R., Harder, H., Schiller, C., Schneider, M., Trautmann, T., and Pfeilsticker, K.: Comparison of measured and modeled startospheric UV/visible actinic fluxes at large solar zenith angles, Geophys. Res. Lett., 28, 1179–1182, 2001. a, b, c
Bösch, H., Camy-Peyret, C., Chipperfield, M. P., Fitzenberger, R., Harder, H., U., P., and Pfeilsticker, K.: Upper limits of stratospheric IO and OIO inferred from center-to-limb-darkening-corrected balloon-borne solar occultation visible spectra: Implications for total gaseous iodine and stratospheric ozone, J. Geophys. Res., 108, 4455, https://doi.org/10.1029/2002JD003078, 2003. a
Brune, W. H., Anderson, J. G., and Chan, K. R.: In situ observations of BrO over Antarctica: ER-2 aircraft results from 54° S to 72° S latitude, J. Geophys. Res., 94, 16649–16663, 1989. a
Burkholder, J. B., Sander, S. P., Abbatt, J., Barker, J. R., Cappa, C., Crounse, J. D., Dibble, T. S., Huie, R. E., Kolb, C. E., Kurylo, M. J., Orkin, V. L., Percival, C. J., Wilmouth, D. M., and Wine, P. H.: Chemical Kinetics and Photochemical Data for Use in Atmospheric Studies, Evaluation No. 19, JPL Publication 19-5, Jet Propulsion Laboratory, Pasadena, http://jpldataeval.jpl.nasa.gov (last access: 23 May 2023), 2019. a, b
Butz, A., Bösch, H., Camy-Peyret, C., Chipperfield, M., Dorf, M., Dufour, G., Grunow, K., Jeseck, P., Kühl, S., Payan, S., Pepin, I., Pukite, J., Rozanov, A., von Savigny, C., Sioris, C., Wagner, T., Weidner, F., and Pfeilsticker, K.: Inter-comparison of stratospheric O3 and NO2 abundances retrieved from balloon borne direct sun observations and Envisat/SCIAMACHY limb measurements, Atmos. Chem. Phys., 6, 1293–1314, https://doi.org/10.5194/acp-6-1293-2006, 2006. a
Butz, A., Bösch, H., Camy-Peyret, C., Chipperfield, M. P., Dorf, M., Kreycy, S., Kritten, L., Prados-Román, C., Schwärzle, J., and Pfeilsticker, K.: Constraints on inorganic gaseous iodine in the tropical upper troposphere and stratosphere inferred from balloon-borne solar occultation observations, Atmos. Chem. Phys., 9, 7229–7242, https://doi.org/10.5194/acp-9-7229-2009, 2009. a, b
Butz, A., Dinger, A. S., Bobrowski, N., Kostinek, J., Fieber, L., Fischerkeller, C., Giuffrida, G. B., Hase, F., Klappenbach, F., Kuhn, J., Lübcke, P., Tirpitz, L., and Tu, Q.: Remote sensing of volcanic CO2, HF, HCl, SO2, and BrO in the downwind plume of Mt. Etna, Atmos. Meas. Tech., 10, 1–14, https://doi.org/10.5194/amt-10-1-2017, 2017. a, b
Camy-Peyret, C., Flaud, J.-M., Perrin, A., Rinsland, C., and Goldman, A.: Stratospheric N2O5, CH4 and N2O profiles from IR solar occultation spectra, J. Atmos. Chem., 16, 31–40, 1993. a
Camy-Peyret, C., Jeseck, P., Hawat, T., Durry, G., Berubeé, G., Rochette, L., and Huguenin, D.: The LPMA balloon borne FTIR spectrometer for remote sensing of the atmospheric constituents, in: 12th ESA Symposium on European Rocket and Balloon Programmes and Related Research, Lillehammer, Norway, 29 May–1 June 1995, edited by: Blix, T. A., European Space Agency (ESA), Paris, ESA Special Publication, 370, p. 323, 1995. a, b
Camy-Peyret, C., Jeseck, P., Té, Y., Hawat, T., Pfeilsticker, K., Harder, H., Fitzenberger, R., and Bösch, H.: Recent results obtained with the LPMA and DOAS balloon-borne instruments during the ILAS, SABINE and THESEO campaigns, in: Proceedings of the 14th ESA Symposium on Rocket and Balloon Programmes and Related Research, Potsdam, Germany, 341–345, 1999. a
Chipperfield, M. P.: Multiannual simulations with a three-dimensional chemical transport model, J. Geophys. Res.-Atmos., 104, 1781–1805, https://doi.org/10.1029/98JD02597, 1999. a
Chipperfield, M. P.: New Version of the TOMCAT/SLIMCAT Off-Line Chemical Transport Model: Intercomparison of Stratospheric Tracer Experiments, Q. J. Roy. Meteor. Soc., 132, 1179–1203, https://doi.org/10.1256/qj.05.51, 2006. a
Danckaert, T., Fayt, C., Van Roozendael, M., De Smedt, I., Letocart, V., Merlaud, A., and Pinardi, G.: QDOAS Software user manual, Version 3.2, BIRA-IASB, https://uv-vis.aeronomie.be/software/QDOAS/QDOAS_manual.pdf (last access: 20 June 2022), 2017. a, b
Dorf, M., Bösch, H., Butz, A., Camy-Peyret, C., Chipperfield, M. P., Engel, A., Goutail, F., Grunow, K., Hendrick, F., Hrechanyy, S., Naujokat, B., Pommereau, J.-P., Van Roozendael, M., Sioris, C., Stroh, F., Weidner, F., and Pfeilsticker, K.: Balloon-borne stratospheric BrO measurements: comparison with Envisat/SCIAMACHY BrO limb profiles, Atmos. Chem. Phys., 6, 2483–2501, https://doi.org/10.5194/acp-6-2483-2006, 2006a. a
Dorf, M., Butler, J., Butz, A., Camy-Peyret, C., Chipperfield, M., Kritten, L., Montzka, S., Simmes, B., Weidner, F., and Pfeilsticker, K.: Long-term observations of stratospheric bromine reveal slow down in growth, Geophys. Res. Lett., 33, L24803, https://doi.org/10.1029/2006GL027714, 2006b. a, b, c, d, e, f
Dorf, M., Butz, A., Camy-Peyret, C., Chipperfield, M. P., Kritten, L., and Pfeilsticker, K.: Bromine in the tropical troposphere and stratosphere as derived from balloon-borne BrO observations, Atmos. Chem. Phys., 8, 7265–7271, https://doi.org/10.5194/acp-8-7265-2008, 2008. a, b
Elash, B. J., Bourassa, A. E., Loewen, P. R., Lloyd, N. D., and Degenstein, D. A.: The Aerosol Limb Imager: acousto-optic imaging of limb-scattered sunlight for stratospheric aerosol profiling, Atmos. Meas. Tech., 9, 1261–1277, https://doi.org/10.5194/amt-9-1261-2016, 2016. a
Engel, A., Strunk, M., Müller, M., Haase, H.-P., Poss, C., Levin, I., and Schmidt, U.: Temporal development of total chlorine in the high-latitude stratosphere based on reference distributions of mean age derived from CO2 and SF6, J. Geophys. Res.-Atmos., 107, ACH 1-1–ACH 1-11, https://doi.org/10.1029/2001JD000584, 2002. a, b
Engel, A., Rigby, M., (Lead Authors), Burkholder, J. B., Fernandez, R. P., Froidevaux, L., Hall, B. D., Hossaini, R., Saito, T., Vollmer, M. K., and Yao, B.: Update on Ozone-Depleting Substances (ODS) and Other Gases of Interest to the Montreal Protocol, Chapter 1 in Scientific Assessment of Ozone Depletion: 2018, Global Ozone Research and Monitoring Project–Report No. 58, World Meteorological Organization, Geneve, Switzerland, 2018. a
Falk, S., Sinnhuber, B.-M., Krysztofiak, G., Jöckel, P., Graf, P., and Lennartz, S. T.: Brominated VSLS and their influence on ozone under a changing climate, Atmos. Chem. Phys., 17, 11313–11329, https://doi.org/10.5194/acp-17-11313-2017, 2017. a
Ferlemann, F., Camy-Peyret, C., Fitzenberger, R., Harder, H., Hawat, T., Osterkamp, H., Schneider, M., Perner, D., Platt, U., Vradelis, P., and Pfeilsticker, K.: Stratospheric BrO profiles measured at different latitudes and seasons: Instrument description, spectral analysis and profile retrieval, Geophys. Res. Lett., 25, 3847–3850, 1998. a
Ferlemann, F., Bauer, N., Fitzenberger, R., Harder, H., Osterkamp, H., Perner, D., Platt, U., Scheider, M., Vradelis, P., and Pfeilsticker, K.: Differential optical absorption spectroscopy instrument for stratospheric balloon-borne trace gas studies, Appl. Optics, 39, 2377–2386, 2000. a
Frey, M., Sha, M. K., Hase, F., Kiel, M., Blumenstock, T., Harig, R., Surawicz, G., Deutscher, N. M., Shiomi, K., Franklin, J. E., Bösch, H., Chen, J., Grutter, M., Ohyama, H., Sun, Y., Butz, A., Mengistu Tsidu, G., Ene, D., Wunch, D., Cao, Z., Garcia, O., Ramonet, M., Vogel, F., and Orphal, J.: Building the COllaborative Carbon Column Observing Network (COCCON): long-term stability and ensemble performance of the EM27/SUN Fourier transform spectrometer, Atmos. Meas. Tech., 12, 1513–1530, https://doi.org/10.5194/amt-12-1513-2019, 2019. a
Friedl-Vallon, F., Gulde, T., Hase, F., Kleinert, A., Kulessa, T., Maucher, G., Neubert, T., Olschewski, F., Piesch, C., Preusse, P., Rongen, H., Sartorius, C., Schneider, H., Schönfeld, A., Tan, V., Bayer, N., Blank, J., Dapp, R., Ebersoldt, A., Fischer, H., Graf, F., Guggenmoser, T., Höpfner, M., Kaufmann, M., Kretschmer, E., Latzko, T., Nordmeyer, H., Oelhaf, H., Orphal, J., Riese, M., Schardt, G., Schillings, J., Sha, M. K., Suminska-Ebersoldt, O., and Ungermann, J.: Instrument concept of the imaging Fourier transform spectrometer GLORIA, Atmos. Meas. Tech., 7, 3565–3577, https://doi.org/10.5194/amt-7-3565-2014, 2014. a
Gisi, M., Hase, F., Dohe, S., and Blumenstock, T.: Camtracker: a new camera controlled high precision solar tracker system for FTIR-spectrometers, Atmos. Meas. Tech., 4, 47–54, https://doi.org/10.5194/amt-4-47-2011, 2011. a
Harder, H., Camy-Peyret, C., Ferlemann, F., Fitzenberger, R., Hawat, T., Osterkamp, H., Schneider, M., Perner, D., Platt, U., Vradelis, P., and Pfeilsticker, K.: Stratospheric BrO profiles measured at different latitudes and seasons: atmospheric observations, Geophys. Res. Lett., 25, 3843–3846, https://doi.org/10.1029/1998GL900026, 1998. a, b
Harder, H., Bösch, H., Camy-Peyret, C., Chipperfield, M. P., Fitzenberger, R., Payan, S., Perner, D., Platt, U., Sinnhuber, B.-M., and Pfeilsticker, K.: Comparison of measured and modeled stratospheric BrO: Implications for the total amount of stratospheric bromine, Geophys. Res. Lett., 27, 3695–3698, https://doi.org/10.1029/1999GL011215, 2000. a, b, c, d, e
Hersbach, H., Bell, B., Berrisford, P., Hirahara, S., Horányi, A., Muñoz-Sabater, J., Nicolas, J., Peubey, C., Radu, R., Schepers, D., Simmons, A., Soci, C., Abdalla, S., Abellan, X., Balsamo, G., Bechtold, P., Biavati, G., Bidlot, J., Bonavita, M., De Chiara, G., Dahlgren, P., Dee, D., Diamantakis, M., Dragani, R., Flemming, J., Forbes, R., Fuentes, M., Geer, A., Haimberger, L., Healy, S., Hogan, R. J., Hólm, E., Janisková, M., Keeley, S., Laloyaux, P., Lopez, P., Lupu, C., Radnoti, G., de Rosnay, P., Rozum, I., Vamborg, F., Villaume, S., and Thépaut, J.-N.: The ERA5 global reanalysis, Q. J. Roy. Meteor. Soc., 146, 1999–2049, https://doi.org/10.1002/qj.3803, 2020. a
Hersbach, H., Bell, B., Berrisford, P., Biavati, G., Horányi, A., Muñoz Sabater, J., Nicolas, J., Peubey, C., Radu, R., Rozum, I., Schepers, D., Simmons, A., Soci, C., Dee, D., and Thépaut, J.-N.: ERA5 hourly data on pressure levels from 1940 to present, Copernicus Climate Change Service (C3S) Climate Data Store (CDS) [data set], https://doi.org/10.24381/cds.bd0915c6, 2023. a, b
Höpfner, M., Orphal, J., von Clarmann, T., Stiller, G., and Fischer, H.: Stratospheric BrONO2 observed by MIPAS, Atmos. Chem. Phys., 9, 1735–1746, https://doi.org/10.5194/acp-9-1735-2009, 2009. a
Höpfner, M., Kirner, O., Wetzel, G., Sinnhuber, B.-M., Haenel, F., Johansson, S., Orphal, J., Ruhnke, R., Stiller, G., and von Clarmann, T.: The Michelson Interferometer for Passive Atmospheric Sounding global climatology of BrONO2 2002–2012: a test for stratospheric bromine chemistry, Atmos. Chem. Phys., 21, 18433–18464, https://doi.org/10.5194/acp-21-18433-2021, 2021. a, b, c, d
Höpfner, M., Wetzel, G., Friedl-Vallon, F., Gulde, T., Kleinert, A., Kretschmer, E., Laube, J. C., Maucher, G., Neubert, T., Nordmeyer, H., Piesch, C., Preusse, P., and Ungermann, J.: First flight of the mid-infrared limb-imaging interferometer GLORIA on a stratospheric balloon, EGU General Assembly 2022, Vienna, Austria, 23–27 May 2022, EGU22-5557, https://doi.org/10.5194/egusphere-egu22-5557, 2022. a
Klappenbach, F., Bertleff, M., Kostinek, J., Hase, F., Blumenstock, T., Agusti-Panareda, A., Razinger, M., and Butz, A.: Accurate mobile remote sensing of XCO2 and XCH4 latitudinal transects from aboard a research vessel, Atmos. Meas. Tech., 8, 5023–5038, https://doi.org/10.5194/amt-8-5023-2015, 2015. a
Klobas, J. E., Weisenstein, D. K., Salawitch, R. J., and Wilmouth, D. M.: Reformulating the bromine alpha factor and equivalent effective stratospheric chlorine (EESC): evolution of ozone destruction rates of bromine and chlorine in future climate scenarios, Atmos. Chem. Phys., 20, 9459–9471, https://doi.org/10.5194/acp-20-9459-2020, 2020. a
Ko, M. K. W., Poulet, G., (Lead Authors), Blake, D. R., Boucher, O., Burkholder, J. H., Chin, M., Cox, R. A., George, C., Graf, H.-F., Holton, J. R., Jacob, D J. Law, K. S., Lawrence, M. G., Midgley, P. M., Seakins, P. W., Shallcross, D. E., Strahan, S. E., Wuebbles, D. J., and Yokouchi, Y.: Very short-lived halogen and sulfur substances, Chapter 2 in: Scientific Assessment of Ozone Depletion: 2002, GAW Report, WMO, Geneva, No. 47, 2003. a
Koenig, T. K., Baidar, S., Campuzano-Jost, P., Cuevas, C. A., Dix, B., Fernandez, R. P., Guo, H., Hall, S. R., Kinnison, D., Nault, B. A., Ullmann, K., Jimenez, J. L., Saiz-Lopez, A., and Volkamer, R.: Quantitative detection of iodine in the stratosphere, P. Natl. Acad. Sci. USA, 117, 1860–1866, https://doi.org/10.1073/pnas.1916828117, 2020. a
Kreycy, S., Camy-Peyret, C., Chipperfield, M. P., Dorf, M., Feng, W., Hossaini, R., Kritten, L., Werner, B., and Pfeilsticker, K.: Atmospheric test of the ratio: implications for total stratospheric Bry and bromine-mediated ozone loss, Atmos. Chem. Phys., 13, 6263–6274, https://doi.org/10.5194/acp-13-6263-2013, 2013. a, b
Kritten, L., Butz, A., Dorf, M., Deutschmann, T., Kühl, S., Prados-Roman, C., Puķīte, J., Rozanov, A., Schofield, R., and Pfeilsticker, K.: Time dependent profile retrieval of UV/vis absorbing radicals from balloon-borne limb measurements – a case study on NO2 and O3, Atmos. Meas. Tech., 3, 933–946, https://doi.org/10.5194/amt-3-933-2010, 2010. a, b
Lambert, A., Livesey, N., Read, W., and Fuller, R.: MLS/Aura Level 3 Daily Binned Nitrous Oxide (N2O) Mixing Ratio on Assorted Grids V004, Goddard Earth Sciences Data and Information Services Center (GES DISC) [data set], Greenbelt, MD, USA, https://doi.org/10.5067/Aura/MLS/DATA/3116, 2020. a, b
Lan, X., Thoning, K., and Dlugokencky, E.: Trends in globally-averaged CH4, N2O, and SF6 determined from NOAA Global Monitoring Laboratory measurements, Version 2023-10, https://doi.org/10.15138/P8XG-AA10, 2022. a
Langley, S. P.: On a possible variation of the solar radiation and its probable effect on terrestrial temperatures, Astrophys. J., 19, 305, 1904. a
Lary, D. J. and Pyle, J. A.: Diffuse radiation, twilight and photochemistry, J. Atmos. Chem., 13, 373–392, 1991. a
Laube, J. C., Tegtmeier, S., (Lead Authors), Fernandez, R. P., Harrison, J., Hu, L., Krummel, P., Mahieu, E., Park, S., and Western, L.: Update on Ozone-Depleting Substances (ODSs) and Other Gases of Interest to the Montreal Protocol, Chapter 1 in: Scientific Assessment of Ozone Depletion: 2022, GAW Report, WMO, Geneva, No. 278, 509 pp., 2022. a, b, c, d, e
Liao, J., Huey, L. G., Scheuer, E., Dibb, J. E., Stickel, R. E., Tanner, D. J., Neuman, J. A., Nowak, J. B., Choi, S., Wang, Y., Salawitch, R. J., Canty, T., Chance, K., Kurosu, T., Suleiman, R., Weinheimer, A. J., Shetter, R. E., Fried, A., Brune, W., Anderson, B., Zhang, X., Chen, G., Crawford, J., Hecobian, A., and Ingall, E. D.: Characterization of soluble bromide measurements and a case study of BrO observations during ARCTAS, Atmos. Chem. Phys., 12, 1327–1338, https://doi.org/10.5194/acp-12-1327-2012, 2012. a
Meier, R., Anderson, D., and Nicolet, M.: Radiation field in the troposphere and stratosphere from 240 nm– 1000 nm, general analysis, Planet. Space Sci., 30, 923–933, 1982. a
Nicolet, M., Meier, R., and Anderson, D. E.: Radiation field in the troposphere and stratosphere from 240 nm–1000 nm, numerical analysis, Planet. Space Sci., 30, 935–941, 1982. a
Palchetti, L., Barucci, M., Belotti, C., Bianchini, G., Cluzet, B., D'Amato, F., Del Bianco, S., Di Natale, G., Gai, M., Khordakova, D., Montori, A., Oetjen, H., Rettinger, M., Rolf, C., Schuettemeyer, D., Sussmann, R., Viciani, S., Vogelmann, H., and Wienhold, F. G.: Observations of the downwelling far-infrared atmospheric emission at the Zugspitze observatory, Earth Syst. Sci. Data, 13, 4303–4312, https://doi.org/10.5194/essd-13-4303-2021, 2021. a
Platt, U.: Differential optical absorption spectroscopy (DOAS), in: Air Monitoring by Spectroscopic Techniques, edited by: Sigrist, M. W., Wiley, London, 127, 27–84, 1994. a
Platt, U. and Stutz, J.: Differential absorption spectroscopy, Springer, Berlin, Heidelberg, https://doi.org/10.1007/978-3-540-75776-4_6, 2008. a, b, c
Pundt, I., Pommereau, J.-P., Chipperfield, M., Roozendael, M. V., and Goutail, F.: Climatology of the stratospheric BrO vertical distribution by balloon-borne UV-visible spectrometry, J. Geophys. Res., 107, 4806, https://doi.org/10.1029/2002JD002230, 2002. a, b
Riese, M., Oelhaf, H., Preusse, P., Blank, J., Ern, M., Friedl-Vallon, F., Fischer, H., Guggenmoser, T., Höpfner, M., Hoor, P., Kaufmann, M., Orphal, J., Plöger, F., Spang, R., Suminska-Ebersoldt, O., Ungermann, J., Vogel, B., and Woiwode, W.: Gimballed Limb Observer for Radiance Imaging of the Atmosphere (GLORIA) scientific objectives, Atmos. Meas. Tech., 7, 1915–1928, https://doi.org/10.5194/amt-7-1915-2014, 2014. a
Rotermund, M. K., Bense, V., Chipperfield, M. P., Engel, A., Grooß, J.-U., Hoor, P., Hüneke, T., Keber, T., Kluge, F., Schreiner, B., Schuck, T., Vogel, B., Zahn, A., and Pfeilsticker, K.: Organic and inorganic bromine measurements around the extratropical tropopause and lowermost stratosphere: insights into the transport pathways and total bromine, Atmos. Chem. Phys., 21, 15375–15407, https://doi.org/10.5194/acp-21-15375-2021, 2021. a, b, c, d, e, f, g
Rozanov, A., Kühl, S., Doicu, A., McLinden, C., Puķīte, J., Bovensmann, H., Burrows, J. P., Deutschmann, T., Dorf, M., Goutail, F., Grunow, K., Hendrick, F., von Hobe, M., Hrechanyy, S., Lichtenberg, G., Pfeilsticker, K., Pommereau, J. P., Van Roozendael, M., Stroh, F., and Wagner, T.: BrO vertical distributions from SCIAMACHY limb measurements: comparison of algorithms and retrieval results, Atmos. Meas. Tech., 4, 1319–1359, https://doi.org/10.5194/amt-4-1319-2011, 2011. a
Schwartz, M., Froidevaux, L., Livesey, N., and Read, W.: MLS/Aura Level 2 Ozone (O3) Mixing Ratio V005, Goddard Earth Sciences Data and Information Services Center (GES DISC) [data set], Greenbelt, MD, USA, https://doi.org/10.5067/Aura/MLS/DATA2516, 2020. a, b
Sinnhuber, B.-M. and Folkins, I.: Estimating the contribution of bromoform to stratospheric bromine and its relation to dehydration in the tropical tropopause layer, Atmos. Chem. Phys., 6, 4755–4761, https://doi.org/10.5194/acp-6-4755-2006, 2006. a, b
Sinnhuber, B.-M., Rozanov, A., Sheode, N., Afe, O. T., Richter, A., Sinnhuber, M., Wittrock, F., Burrows, J. P., Stiller, G. P., von Clarmann, T., and Linden, A.: Global observations of stratospheric bromine monoxide from SCIAMACHY, Geophys. Res. Lett., 32, L20810, https://doi.org/10.1029/2005GL023839, 2005. a
Sinnhuber, B.-M., Sheode, N., Sinnhuber, M., Chipperfield, M. P., and Feng, W.: The contribution of anthropogenic bromine emissions to past stratospheric ozone trends: a modelling study, Atmos. Chem. Phys., 9, 2863–2871, https://doi.org/10.5194/acp-9-2863-2009, 2009. a
Sioris, C. E., Kovalenko, L. J., McLinden, C. A., Salawitch, R. J., Van Roozendael, M., Goutail, F., Dorf, M., Pfeilsticker, K., Chance, K., von Savigny, C., Liu, X., Kurosu, T. P., Pommereau, J.-P., Bösch, H., and Frerick, J.: Latitudinal and vertical distribution of bromine monoxide in the lower stratosphere from Scanning Imaging Absorption Spectrometer for Atmospheric Chartography limb scattering measurements, J. Geophys. Res.-Atmos., 111, D14301, https://doi.org/10.1029/2005JD006479, 2006. a
Stachnik, R. A., Millán, L., Jarnot, R., Monroe, R., McLinden, C., Kühl, S., Puķīte, J., Shiotani, M., Suzuki, M., Kasai, Y., Goutail, F., Pommereau, J. P., Dorf, M., and Pfeilsticker, K.: Stratospheric BrO abundance measured by a balloon-borne submillimeterwave radiometer, Atmos. Chem. Phys., 13, 3307–3319, https://doi.org/10.5194/acp-13-3307-2013, 2013. a
Thalman, R. and Volkamer, R.: Temperature dependent absorption cross-sections of O2–O2 collision pairs between 340 and 630 nm and at atmospherically relevant pressure, Phys. Chem. Chem. Phys., 15, 15371–15381, https://doi.org/10.1039/C3CP50968K, 2013. a
Theys, N., Van Roozendael, M., Errera, Q., Hendrick, F., Daerden, F., Chabrillat, S., Dorf, M., Pfeilsticker, K., Rozanov, A., Lotz, W., Burrows, J. P., Lambert, J.-C., Goutail, F., Roscoe, H. K., and De Mazière, M.: A global stratospheric bromine monoxide climatology based on the BASCOE chemical transport model, Atmos. Chem. Phys., 9, 831–848, https://doi.org/10.5194/acp-9-831-2009, 2009. a
Toohey, D. W., Anderson, J. G., Brune, W. H., and Chan, K. R.: In situ measurements of BrO in the Arctic stratosphere, Geophys. Res. Lett., 17, 513–516, https://doi.org/10.1029/GL017i004p00513, 1990. a
Voigt, S., Orphal, J., Bogumil, K., and Burrows, J. P.: The temperature dependence (203–293 K) of the absorption cross section of O3 in the 230–850 nm region measured by Fourier-transform spectroscopy, J. Photoch. Photobio. A, 143, 1–9, 2001. a
Voigt, S., Orphal, J., and Burrows, J. P.: The Temperature- and Pressure-Dependence of the Absorption Cross-section of NO2 in the 250–800 nm Region measured by Fourier-Transform Spectroscopy), J. Photoch. Photobio. A, 149, 1–7, 2002. a
Volkamer, R., Baidar, S., Campos, T. L., Coburn, S., DiGangi, J. P., Dix, B., Eloranta, E. W., Koenig, T. K., Morley, B., Ortega, I., Pierce, B. R., Reeves, M., Sinreich, R., Wang, S., Zondlo, M. A., and Romashkin, P. A.: Aircraft measurements of BrO, IO, glyoxal, NO2, H2O, O2–O2 and aerosol extinction profiles in the tropics: comparison with aircraft-/ship-based in situ and lidar measurements, Atmos. Meas. Tech., 8, 2121–2148, https://doi.org/10.5194/amt-8-2121-2015, 2015. a
Voss, K.: Balloon-borne solar occultation DOAS instrument: balloon-borne experiments, atmospheric compounds measurements, flight of 23 August 2022, Version 1.0, AERIS [data set], https://doi.org/10.25326/XYCR-8C53, 2024. a
Wahner, A., Ravishankara, A., Sander, S., and Friedl, R.: Absorption cross section of BrO between 312 and 385 nm at 298 and 223 K, Chem. Phys. Lett., 152, 507–512, 1988. a, b, c, d
Wales, P. A., Salawitch, R. J., Nicely, J. M., Anderson, D. C., Canty, T. P., Baidar, S., Dix, B., Koenig, T. K., Volkamer, R., Chen, D., Huey, L. G., Tanner, D. J., Cuevas, C. A., Fernandez, R. P., Kinnison, D. E., Lamarque, J.-F., Saiz-Lopez, A., Atlas, E. L., Hall, S. R., Navarro, M. A., Pan, L. L., Schauffler, S. M., Stell, M., Tilmes, S., Ullmann, K., Weinheimer, A. J., Akiyoshi, H., Chipperfield, M. P., Deushi, M., Dhomse, S. S., Feng, W., Graf, P., Hossaini, R., Jöckel, P., Mancini, E., Michou, M., Morgenstern, O., Oman, L. D., Pitari, G., Plummer, D. A., Revell, L. E., Rozanov, E., Saint-Martin, D., Schofield, R., Stenke, A., Stone, K. A., Visioni, D., Yamashita, Y., and Zeng, G.: Stratospheric Injection of Brominated Very Short-Lived Substances: Aircraft Observations in the Western Pacific and Representation in Global Models, J. Geophys. Res.-Atmos., 123, 5690–5719, https://doi.org/10.1029/2017JD027978, 2018. a
Waters, J., Froidevaux, L., Harwood, R., Jarnot, R., Pickett, H., Read, W., Siegel, P., Cofield, R., Filipiak, M., Flower, D., Holden, J., Lau, G., Livesey, N., Manney, G., Pumphrey, H., Santee, M., Wu, D., Cuddy, D., Lay, R., Loo, M., Perun, V., Schwartz, M., Stek, P., Thurstans, R., Boyles, M., Chandra, K., Chavez, M., Chen, G.-S., Chudasama, B., Dodge, R., Fuller, R., Girard, M., Jiang, J., Jiang, Y., Knosp, B., LaBelle, R., Lam, J., Lee, K., Miller, D., Oswald, J., Patel, N., Pukala, D., Quintero, O., Scaff, D., Van Snyder, W., Tope, M., Wagner, P., and Walch, M.: The Earth observing system microwave limb sounder (EOS MLS) on the aura Satellite, IEEE T. Geosci. Remote, 44, 1075–1092, https://doi.org/10.1109/TGRS.2006.873771, 2006. a
Weidner, F., Bösch, H., Bovensmann, H., Burrows, J. P., Butz, A., Camy-Peyret, C., Dorf, M., Gerilowski, K., Gurlit, W., Platt, U., von Friedeburg, C., Wagner, T., and Pfeilsticker, K.: Balloon-borne limb profiling of UV/vis skylight radiances, O3, NO2, and BrO: technical set-up and validation of the method, Atmos. Chem. Phys., 5, 1409–1422, https://doi.org/10.5194/acp-5-1409-2005, 2005. a, b, c
Werner, B., Stutz, J., Spolaor, M., Scalone, L., Raecke, R., Festa, J., Colosimo, S. F., Cheung, R., Tsai, C., Hossaini, R., Chipperfield, M. P., Taverna, G. S., Feng, W., Elkins, J. W., Fahey, D. W., Gao, R.-S., Hintsa, E. J., Thornberry, T. D., Moore, F. L., Navarro, M. A., Atlas, E., Daube, B. C., Pittman, J., Wofsy, S., and Pfeilsticker, K.: Probing the subtropical lowermost stratosphere and the tropical upper troposphere and tropopause layer for inorganic bromine, Atmos. Chem. Phys., 17, 1161–1186, https://doi.org/10.5194/acp-17-1161-2017, 2017. a, b, c
Wetzel, G., Oelhaf, H., Höpfner, M., Friedl-Vallon, F., Ebersoldt, A., Gulde, T., Kazarski, S., Kirner, O., Kleinert, A., Maucher, G., Nordmeyer, H., Orphal, J., Ruhnke, R., and Sinnhuber, B.-M.: Diurnal variations of BrONO2 observed by MIPAS-B at midlatitudes and in the Arctic, Atmos. Chem. Phys., 17, 14631–14643, https://doi.org/10.5194/acp-17-14631-2017, 2017. a, b
Wilmouth, D. M., Janisco, T. F., Donahue, N. M., and Anderson, J. G.: Fourier Transform Ultraviolet Spectroscopy of the Transition of BrO, J. Phys. Chem. A, 103, 8935–8945, https://doi.org/10.1021/jp991651o, 1999. a, b
WMO: Scientific Assessment of Ozone Depletion: 2022, Global Ozone Research and Monitoring Project–Report No. 278, (World Meteorological Organisation, Geneve, Switzerland, p. 509, 2022. a
- Abstract
- Introduction
- Deployments
- Instrumentation
- Trace gas analysis
- Stratospheric bromine abundance
- Conclusion
- Appendix A: DOAS retrievals with different sets of pre-processing parameters
- Appendix B: Total BrO and Bry Langley plots for all the sensitivity runs
- Appendix C: Mean age of air
- Data availability
- Author contributions
- Competing interests
- Disclaimer
- Acknowledgements
- Financial support
- Review statement
- References