the Creative Commons Attribution 4.0 License.
the Creative Commons Attribution 4.0 License.
 | 30 Aug 2024
Shortwave Array Spectroradiometer-Hemispheric (SAS-He): design and evaluation
Evgueni Kassianov
Connor J. Flynn
James C. Barnard
Brian D. Ermold
Jennifer M. Comstock
A novel ground-based radiometer, referred to as the Shortwave Array Spectroradiometer-Hemispheric (SAS-He), is introduced. This radiometer uses the shadow-band technique to report total irradiance and its direct and diffuse components frequently (every 30 s) with continuous spectral coverage (350–1700 nm) and moderate spectral (∼ 2.5 nm ultraviolet–visible and ∼ 6 nm shortwave-infrared) resolution. The SAS-He's performance is evaluated using integrated datasets collected over coastal regions during three field campaigns supported by the US Department of Energy's Atmospheric Radiation Measurement (ARM) program, namely the (1) Two-Column Aerosol Project (TCAP; Cape Cod, Massachusetts), (2) Tracking Aerosol Convection Interactions Experiment (TRACER; in and around Houston, Texas), and (3) Eastern Pacific Cloud Aerosol Precipitation Experiment (EPCAPE; La Jolla, California). We compare (i) aerosol optical depth (AOD) and total optical depth (TOD) derived from the direct irradiance, as well as (ii) the diffuse irradiance and direct-to-diffuse ratio (DDR) calculated from two components of the total irradiance. As part of the evaluation, both AOD and TOD derived from the SAS-He direct irradiance are compared to those provided by a collocated Cimel sunphotometer (CSPHOT) at five (380, 440, 500, 675, 870 nm) and two (1020, 1640 nm) wavelengths, respectively. Additionally, the SAS-He diffuse irradiance and DDR are contrasted with their counterparts offered by a collocated multifilter rotating shadowband radiometer (MFRSR) at six (415, 500, 615, 675, 870, 1625 nm) wavelengths. Overall, reasonable agreement is demonstrated between the compared products despite the challenging observational conditions associated with varying aerosol loadings and diverse types of aerosols and clouds. For example, the AOD- and TOD-related values of root mean square error remain within 0.021 at 380, 440, 500, 675, 870, 1020, and 1640 nm wavelengths during the three field campaigns.
- Article
(3839 KB) - Full-text XML
- BibTeX
- EndNote


Clouds and atmospheric aerosols are important drivers of the Earth radiation budget (Voigt et al., 2021; Li et al., 2022). They have unique fingerprints across a wide spectral range, which includes ultraviolet (UV), visible (Vis), near-infrared (NIR), and shortwave-infrared (SWIR) spectral bands. Moreover, cloud droplets and aerosol particles with a wide range of sizes and shapes distinctly modify the angular distribution of the scattered solar radiation (Hansen and Travis, 1974; Kokhanovsky, 2004; Yang et al., 2013). Thus, advanced cloud and aerosol retrievals over different surface types involve both multi-spectral and multi-angular measurements from the surface, air, and space (Chen et al., 2022; Puthukkudy et al., 2020; Matar et al., 2023; Michalsky and Kiedron, 2022). To illustrate, the aircraft-based sensor named the Spectrometer for Sky-Scanning, Sun-Tracking Atmospheric Research (4STAR; wavelength range: 350–1650 nm) with sky-scanning and hyperspectral abilities (Dunagan et al., 2013) has offered valuable information on above-cloud aerosol optical depth (AOD) (LeBlanc et al., 2020), while solar irradiances measured by an aircraft-based solar spectral flux radiometer (SSFR; wavelength range: 350–2100 nm) have been used to provide spectral surface albedo (Coddington et al., 2008) and cloud spectral absorption (Kindel et al., 2011), which is a function of cloud optical thickness and droplet effective radius. The combined 4STAR and SSFR airborne measurements have been utilized to derive heating rate profiles over a climate-important region (Cochrane et al., 2022).
Airborne measurements can infer valuable properties of clouds and aerosols with high temporal resolution. However, these episodic measurements represent a relatively short period (e.g., several weeks) and a given location (LeBlanc et al., 2020; Cochrane et al., 2022). Conversely, satellite observations have been used successfully to extract a wealth of information about clouds and aerosols nearly globally (Platnick et al., 2017; Gumber et al., 2023). Nevertheless, sun-synchronous satellite observations occur infrequently (typically several times a day) and do not capture the diurnal cycle. Combining data from sun-synchronous and geostationary satellites enhances the temporal resolution of aerosol-related products (Gupta et al., 2024). Airborne and satellite measurements can be substantially supplemented by long-term ground-based radiation data collected with high temporal resolution at multiple sites with worldwide locations (Remer et al., 2024). For example, the Aerosol Robotic Network (AERONET) program with worldwide-distributed sites has provided columnar AODs at nine wavelengths (340, 380, 440, 500, 675, 870, 935, 1020, 1640 nm) from the direct-beam irradiance measured by Cimel sunphotometers (CSPHOTs; Holben et al., 1998; Giles et al., 2019). Similar to the AERONET sunphotometers, multifilter rotating shadowband radiometers (MFRSRs) supported by the US Department of Energy's Atmospheric Radiation Measurement (ARM) program (Sisterson et al., 2016; Miller et al., 2016) and the National Oceanic and Atmospheric Administration's surface radiation budget network (SURFRAD; Augustine et al., 2008) have provided AODs at five wavelengths (415, 500, 615, 675, 870 nm) for many locations from the direct irradiances. These irradiances have been obtained from the MFRSR-measured total and diffuse solar irradiances. Additionally, the MFRSR data have been used to derive aerosol, cloud, and surface properties (Riihimaki et al., 2021), as well as to quantify the spectrally resolved radiative impact of clouds (Kassianov et al., 2011). Recently, ARM has added a new channel at 1625 nm wavelength to the ARM-supported MFRSRs.
The limited number of wavelengths coupled with a quite narrow spectral range of the MFRSR prevent improved retrievals of cloud, aerosol, and surface characteristics and thus preclude advanced understanding of complex cloud–aerosol–surface interactions (Barthlott et al., 2022; Calderón et al., 2022). To address the outlined limitation, ARM developed a hyperspectral shortwave radiometer, called the Shortwave Array Spectroradiometer-Hemispheric (SAS-He), that has collected data since 2011. This ground-based radiometer is a next-generation MFRSR with increased spectral coverage (350–1700 nm) and hyperspectral ability. Here we illustrate its performance by taking advantage of an integrated dataset collected by collocated ground-based sensors over coastal regions during three campaigns: (1) Two-Column Aerosol Project (TCAP; Cape Cod, Massachusetts) (Berg et al., 2016), (2) Tracking Aerosol Convection Interactions Experiment (TRACER; in and around Houston, Texas) (Jensen et al., 2022), and (3) Eastern Pacific Cloud Aerosol Precipitation Experiment (EPCAPE; La Jolla, California) (Russell et al., 2021). The following four sections cover the SAS-He design and calibration procedures (Sect. 2); a concise description of ground-based data collected during three campaigns (TCAP, TRACER, and EPCAPE) (Sect. 3); evaluation of the SAS-He AOD, total optical depth (TOD), direct-to-diffuse ratio (DDR), and diffuse irradiance (Sect. 4); and a summary of main results (Sect. 5). It should be emphasized that the spectrally resolved AODs offer a valuable avenue for estimating aerosol columnar size distributions (e.g., King et al., 1978; Sayer et al., 2012; Kassianov et al., 2021; Torres and Fuertes, 2021). Aerosol intensive properties, including the single-scattering albedo and asymmetry parameter in the Vis and NIR spectral bands of the MFRSR, are possible through retrievals combining the corresponding AODs and DDRs (e.g., Kassianov et al., 2007; Ge et al., 2010). The DDRs provided by UV-MFRSR and aerosol properties offered by complementary CSPHOT inversions, such as particle size distribution and real refractive index at 440 nm wavelength, facilitate the successful retrievals of aerosol single-scattering albedo in the UV spectral bands (e.g., Krotkov et al., 2005; Corr et al., 2009; Mok et al., 2016,2018).
Additionally, the favorable comparisons demonstrated in our paper can be considered foundational for future activities including improved understanding of changes in photosynthetically active radiation and refinement of broadband radiation measurements and radiative transfer calculations. Finally, the potential exists to retrieve cloud properties, such as cloud optical thickness (COT) of water clouds and droplet effective radius (e.g., LeBlanc et al., 2015), as well as cirrus COT and ice particle effective diameter (e.g., Segal-Rosenheimer et al., 2013), by examining wavelength-dependent diffuse irradiance under overcast conditions. For optically thin clouds, the COT retrievals require correction of strong forward scattering of solar radiation into the radiometer's field of view (e.g., Min et al., 2004; Norgren et al., 2022).
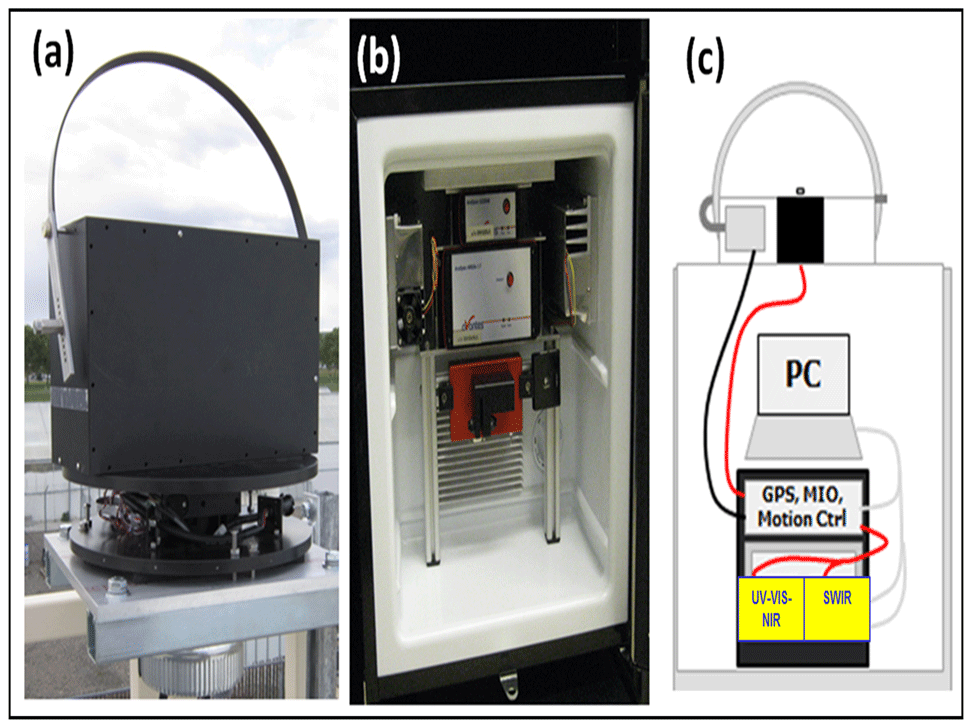
Figure 1The SAS-He design: (a) shadow-band and sky collection optics mounted outside, (b) UV–Vis–NIR and SWIR spectrometers housed inside the chiller, and (c) instrument layout concept.
The SAS-He is the successor to the MFRSR (Hodges and Michalsky, 2016) and the rotating shadowband spectroradiometer (RSS; Michalsky and Kiedron, 2022). The SAS-He employs the shadow-band technique (Wesely, 1982; Harrison et al., 1994), and its design, operation, and calibration are borrowed heavily from the predecessors. Corresponding detailed reviews are presented elsewhere (Hodges and Michalsky, 2016; Flynn, 2016; Michalsky and Kiedron, 2022), and here we provide only a brief description sufficient to acquaint the reader with the enhanced capabilities of the SAS-He.
2.1 Design
Figure 1 shows the major elements of the SAS-He instrument. The overall design is composed of an optical collector (Fig. 1a) located outdoors connected to a pair of chilled spectrometers (Fig. 1b) and data collection system located indoors within a climate-controlled environment (Fig. 1c). Photons incident on the hemispheric diffuser at the fore-optics of the light collector travel through a large single-core optical fiber to a bifurcated Y-fiber that diverts the signal to the UV–Vis–NIR and SWIR spectrometers. Within each spectrometer, the light is spectrally dispersed by a diffraction grating and focused onto a solid-state linear detector array. The array is then read by an electronic interface that passes the data to the computer where it is stored. The data acquisition electronics and spectrometers include an in-line fiber-optic shutter for automatic dark signal correction. Dark signals are obtained periodically by closing the in-line shutter and collecting spectra with the same integration time that was used to measure the sky intensity. The thermostatically controlled (± 1 °F) refrigerator (Fig. 1b) is supplied with dry air and/or desiccant to prevent condensation. The connection of the sky collection optics, rack-mounted data acquisition equipment, and fiber-coupled UV–Vis–NIR and SWIR spectrometers is provided by fiber-optic and electrical cables (Fig. 1c).
The optical collector, based strongly on the designs of the MFRSR and RSS, includes a hemispheric diffuser and a moving shadow band (Fig. 1a) for distinguishing direct solar and diffuse sky irradiance at approximately 30 s temporal resolution. A fiber-optic umbilical with an in-line shutter connects the optical collector to a pair of commercial off-the-shelf Avantes spectrometers (Fig. 1b) with a wide spectral coverage and high spectral resolution (Table 1). Certainly, this important capability is superior to the MFRSR, since it substantially increases the opportunity to extend the existing MFRSR-based retrievals to expected multidisciplinary studies with a focus on climate-important properties (Riihimaki et al., 2021). For example, unique absorption and scattering properties of ice and liquid water cloud particles can be retrieved from cloud-transmitted radiance spectra measured with a wide spectral coverage and high spectral resolution (e.g., LeBlanc et al., 2015). The main consideration in the design of the SAS-He instrument was to obtain high radiometric repeatability and efficiency. To address this challenge, several modifications of the MFRSR-like configuration have been made. The next sections highlight these valuable modifications.
2.2 SAS-He calibrations
Several aspects of the SAS-He require careful characterization and/or calibration. Some of these are commonly applied to legacy solar radiometers, but some are unique to the hyperspectral measurements of the SAS-He. These corrections and calibrations are described briefly below.
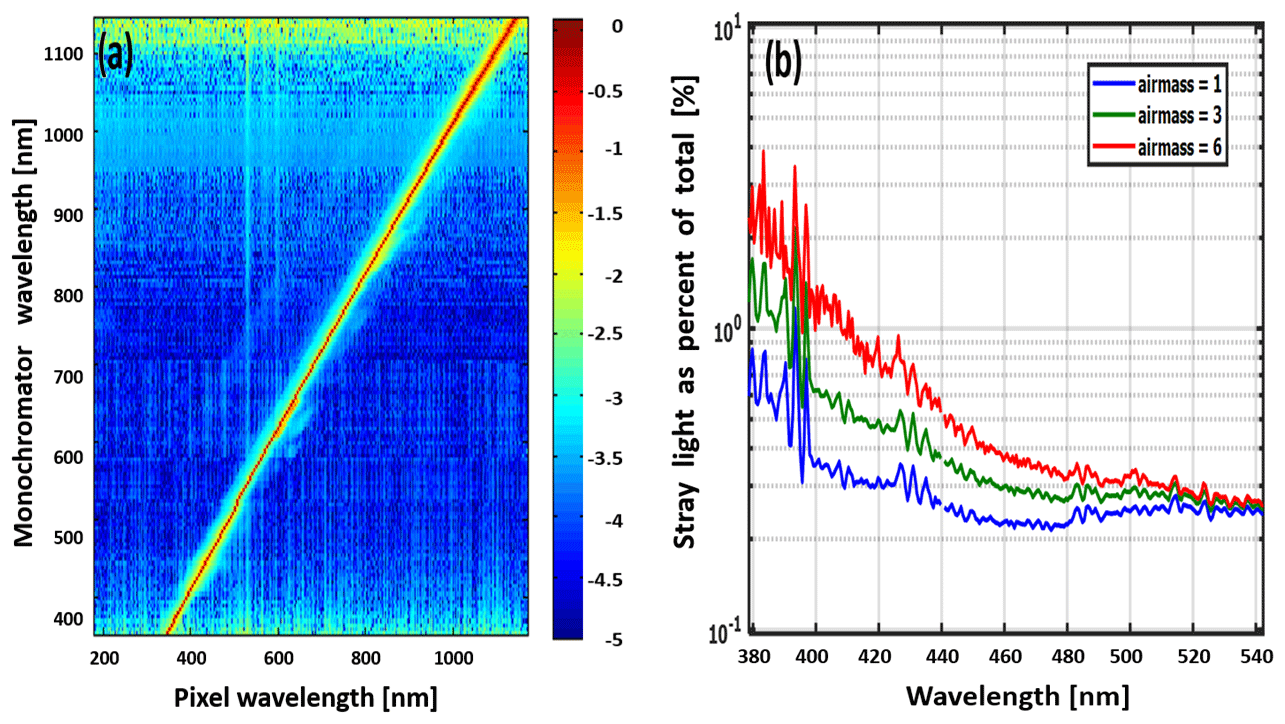
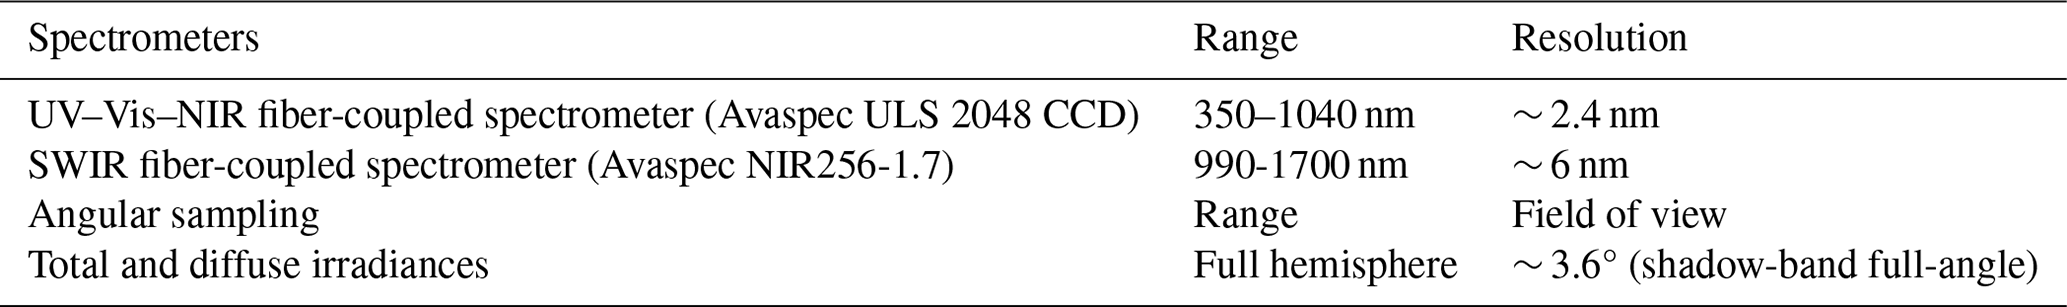
Figure 2Panel (a) shows results of a stray-light measurement for the SAS-He Si CCD obtained by placing a scanning monochromator at the entrance port of the Si CCD grating spectrometer. The horizontal axis is the wavelength reported by the grating spectrometer. The vertical axis is the source wavelength provided by the scanning monochromator. Each horizontal row in the image has been normalized to the maximum value in that row, and a log-base-10 color scale is applied. Thus, a value of −3 (cyan) represents 0.1 % stray light relative to the peak signal intensity along the diagonal in red. Panel (b) shows the empirical stray-light correction of the SAS-He direct horizontal irradiance as a proportion of the raw uncorrected signal for three air mass values over the short wavelength range where this correction is most significant.
2.2.1 Spectral registration
The Avantes grating array spectrometers, calibrated in terms of wavelength prior to delivery, include a multi-order polynomial fit providing wavelength as a function of pixel index number. We confirmed that the wavelength mapping is accurate to within a pixel by confirming the location of known emission lines from a mercury–argon discharge lamp. In addition, reference to sharp Fraunhofer lines (emission and absorption lines in the solar spectrum) in the UV and visible spectra and well-known atmospheric absorption features including water vapor bands and the oxygen A-band permit in-field confirmation of the spectral registration, a practice which is not typically feasible for filter-based measurements.
2.2.2 Spectral resolution
In addition to the pixel-to-wavelength mapping, Avantes also provides the approximate spectral resolution for each spectrometer configuration. For the Si CCD spectrometer, the nominal spectral resolution is about 2.5 nm full width at half-maximum (FWHM). The nominal spectral resolution of the InGaAS array spectrometer is about 6 nm FWHM. Note that the spectral resolution is distinct from the pixel spacing, which is the wavelength difference between adjacent pixels as inferred from the spectral registration above. The pixel spacing for the Si CCD is about 0.55 nm. The pixel spacing for the InGaAs array is about 3.5 nm. This means that the spectra from the Si CCD are being over-sampled by about a factor of 4, while the InGaAs array is being over-sampled by about a factor of 2.
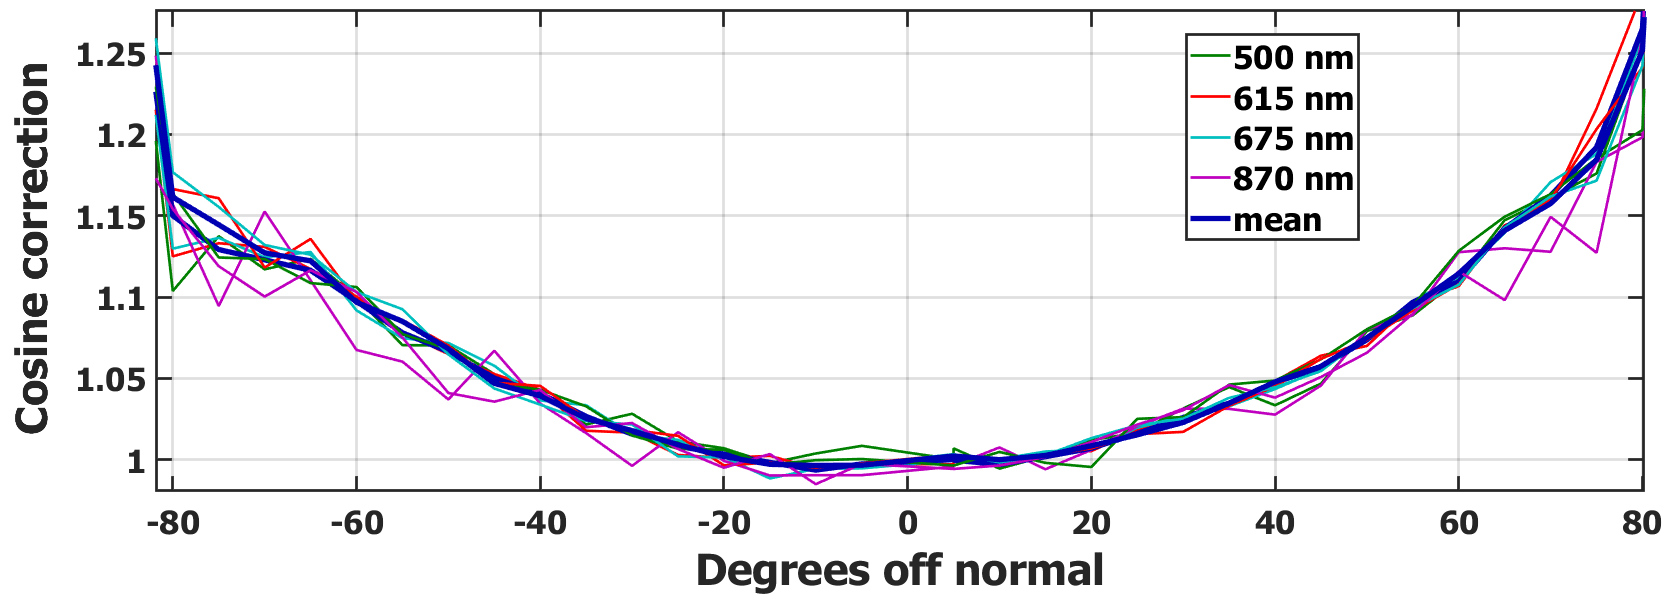
Figure 3Example of cosine correction as a function of angle of incidence and wavelength (green, red, light blue, and magenta lines). To recover perfect cosine dependence, the SAS-He direct beam is multiplied by the cosine correction. No systematic dependence on wavelength was observed, and thus the spectral mean (thick dark blue line) is applied.
2.2.3 Internal stray light within the spectrometer
Stray light in the spectrometer, similar to out-of-band leakage for narrowband filter measurements, represents signal from other wavelengths detected and ascribed to the intended wavelength. We have measured stray light scattered internally within the spectrometer by scanning a double-slit monochromator positioned in front of a broadband light source over the spectral range of the spectrometer. Except for a few isolated “hot pixels”, the stray-light levels are below 0.1 % to 0.01 % over most of the spectral range as shown in Fig. 2a. The horizontal axis is the wavelength reported by the grating spectrometer. The vertical axis is the source wavelength provided by the scanning monochromator. The vivid diagonal line indicates that most light is detected at the spectrometer pixels corresponding to the monochromator selected wavelength. However, some spectrometer artifacts are apparent as whisps about the diagonal line and a ghost-like diagonal feature offset from the diagonal by about 200 nm. Although initially assumed to represent a negligible contribution, the accumulation of even these low scattering levels generated aberrant behavior at the wavelength limits of the UV–Vis spectrometer that required empirical correction. Figure 2b illustrates that the stray-light correction is more significant at shorter wavelengths and depends strongly on air mass. The result of the stray light is that the Langley calibrations for short wavelengths become skewed and artificially shallow, leading to low calibration bias and low retrieved AODs. The empirical correction shown in Fig. 2b yields satisfactory calibration up to 380 nm.
2.2.4 External stray light detected by the spectrometer
There are two potential sources of external light affecting the SAS-He irradiance measurements. The first is direct sunlight leaking through the fiber-optic jacketing of the umbilical. By exposing and shading the optical collector under direct solar exposure we have confirmed that leakage, if it exists at all, is at undetectable levels. In addition, since 2019 the in-line shutter (the red device in Fig. 1b) has been moved out of the chiller and incorporated into the collector head such that fiber leakage would represent common signal and be subtracted as “dark” counts.
The second potential source of stray light is from reflective objects near the collector head producing glint detectable by the SAS-He in the diffuse hemispheric irradiance measurement. This was observed and documented for the Go-Amazon deployment (not part of this study) due to the proximity of the SAS-He to a 10 m high stainless-steel aerosol sampling stack. This unfortunate configuration was avoided for the deployments in this study.
2.2.5 Non-Lambertian response of the optical collector, “cosine correction”
Hemispheric collectors used by the MFRSR and the SAS-He exhibit a dependence on the angle of incidence of incoming light. For an ideal Lambertian diffuser this dependence is exactly the cosine of the incident angle. The angular response of the SAS-He collector is carefully characterized in lab measurements on a “cosine bench” where the collector is mounted on a rotating stage and exposed to a stationary quartz–tungsten lamp light source. The cosine bench is designed such that the rotational axis passes through the diffuser so the distance between the light source and the center of the diffuser is fixed but the angle of incidence is allowed to vary from 0° (normal incidence) to 90° (grazing incidence) along each of four orthogonal arcs that align with the four cardinal directions (N, S, E, W) when the SAS-He is installed for operation. In the ideal case of a perfect collector, the optical signal would vary in direct proportion to the cosine of the incident angle as a consequence of the projected area of the collector surface. In reality, the collector is nonideal so the signal differs from a pure cosine dependence. The ratio between the ideal cosine response and the observed variation with incident angle is computed and termed the “cosine correction” (Fig. 3). The lab-derived cosine correction is applied to the direct beam measurements, and a variant of the cosine correction is also applied to the diffuse field as the average of the modeled response to isotropic, clear-sky, and overcast conditions. For the ARM deployments detailed in this paper, unlike the MFRSR which is installed on a radiometer stand on the ground and therefore potentially subject to settling, the SAS-He was mounted on a rigid steel bench on the roof-top of the ARM Mobile Facility instrument van, which rests on hard-packed fill material and is expected to be quite stable. A precision bubble level was used during installation to achieve a level better than 0.05°. The SAS-He is continually synchronized with ARM network time servers to within a few milliseconds, eliminating errors in solar tracking due to timing errors. For these reasons, it was not deemed necessary to apply corrections for tilt and/or misalignment as described in Alexandrov et al. (2007).
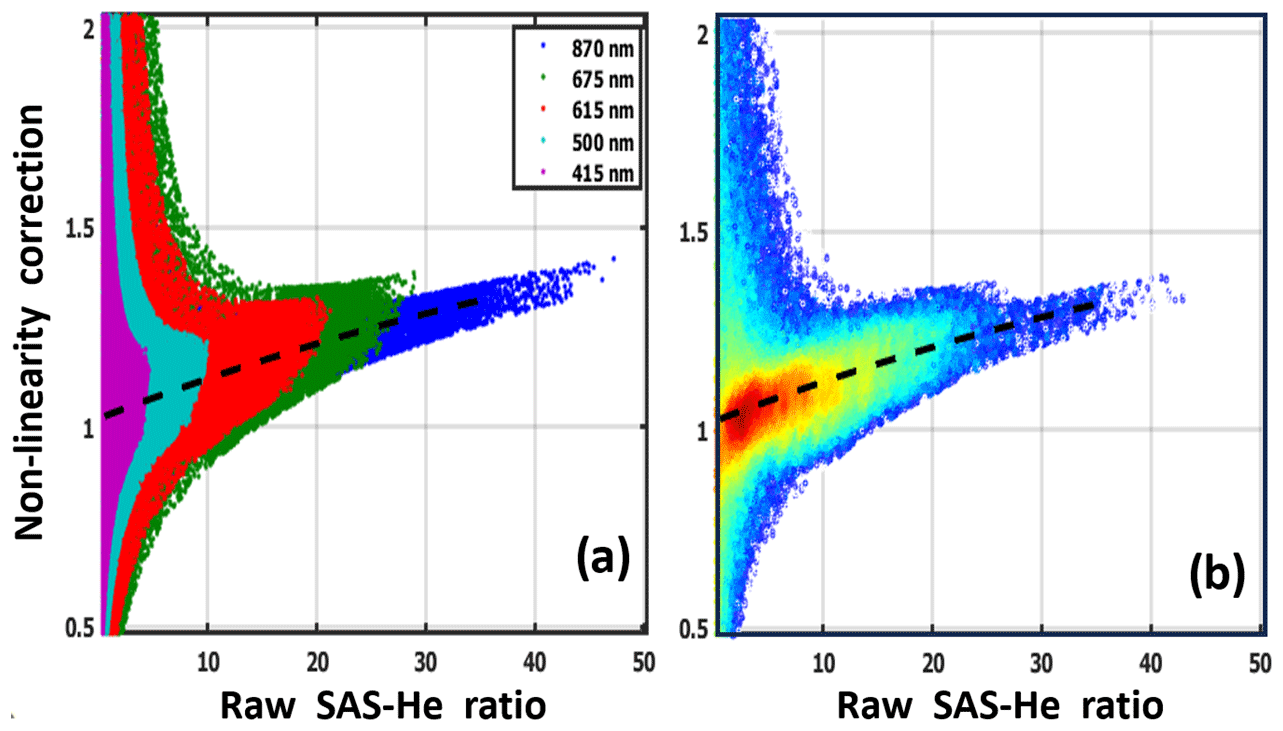
Figure 4Example of nonlinearity correction as a function of the SAS-He direct-to-diffuse ratio obtained during TRACER. (a) The relationship displayed for five MFRSR filter wavelengths (415, 500, 615, 675, 870 nm) shows a progression along a common tendency. (b) A density plot of all corrections irrespective of filter wavelength. Dashed lines indicate the polynomial fits (a, b).
2.2.6 Spectrometer signal nonlinearity
Photodiodes used in the MFRSR and CSPHOT instruments have demonstrated excellent signal linearity spanning several orders of magnitude. In contrast, the SAS-He spectrometers require careful linearity characterization. By varying incident light levels and integration times, we have documented the nonlinearity for each grating spectrometer. The nonlinearity is small, though not negligible. To first order, the nonlinearity of the spectrometer becomes incorporated in the cosine correction for the direct irradiance described above. The optical signal reported by the spectrometer varies in conjunction with incident angle. The cosine correction described in the preceding section incorporates the departure from a perfect cosine dependence into an angular-dependent correction factor, but some fraction of the departure is actually due to the spectrometer nonlinear response and not intrinsically a cosine response. To the extent that the cosine dependence drives the dynamic range of the clear-sky direct irradiance, combining these effects into one correction is acceptable for measurements of the direct beam. However, the diffuse hemispheric component requires further correction. To infer this correction, we apply the following two-step approach. First, we calculate the direct-to-diffuse ratio by dividing the direct-normal irradiance by diffuse hemispheric irradiance at a given wavelength. We use the direct-normal irradiances and diffuse hemispheric irradiances measured by two collocated ground-based instruments, namely the SAS-He and MFRSR. It should be emphasized that the calculated SAS-He and MFRSR direct-to-diffuse ratios are calibration-independent in the sense that this is a unitless ratio. While biases of these ratios associated with coarse-mode aerosol and optically thin cirrus could be substantial (Min et al., 2004), these biases should be the same for both the SAS-He and MFRSR due to identical band and diffuser geometry. Ideally, one should expect the ratios from these two instruments to agree. However, the SAS-He spectrometer is less linear than the MFRSR photodiodes, leading to differences in both the direct and diffuse irradiances. As noted, the cosine correction implicitly includes the effects of nonlinearity on the direct beam. Thus, comparison of the ratios exposes the impact of the SAS-He spectrometer nonlinearity on its diffuse irradiance measurement. Therefore, we obtain an empirical nonlinearity correction to the SAS-He diffuse hemispheric irradiance by dividing the calculated SAS-He ratio by its MFRSR counterpart and then applying the second-order polynomial fit (Fig. 4). We have confirmed that this correction is consistent for a given spectrometer and independent of location. We apply this correction to the SAS-He diffuse hemispheric irradiance. Its corrected values are used for the corresponding assessment of the SAS-He products (Sect. 4).
2.2.7 Spectrometer signal temperature sensitivity
The CCD spectrometers have been confirmed to exhibit a temperature (°F) response of less than 0.1 % per degree. The InGaAs spectrometers show higher temperature-dependent sensitivity, but this is mostly due to changes in thermal background levels that we address through frequent (∼ 30 s interval) dark measurements. We have also identified the fact that the InGaAs spectrometers show a trough in their temperature response, so we operate our chiller centered near this minimum in temperature sensitivity.
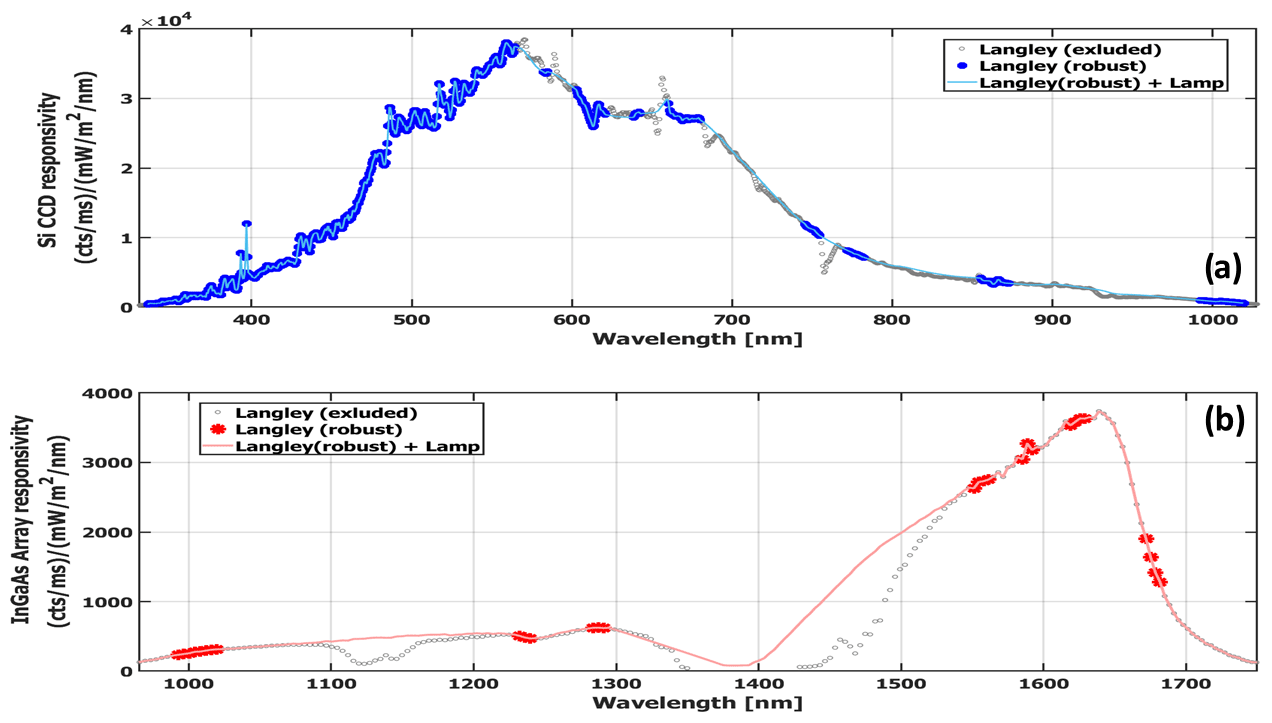
Figure 5The spectral responsivity of the Si CCD (a) and InGaAs (b) array in counts per millisecond per . In both panels, the gray dots show the spectral responsivity obtained by dividing the Langley regression Y intercept by top-of-atmosphere solar irradiance at each wavelength. The colored asterisks represent wavelengths where Langley regressions are anticipated to be dependable under placid atmospheric conditions. The thin blue (Si CCD) and pink (InGaAs array) lines represent the responsivity obtained as a combination of Langley calibration and lamp calibration. These lines are labeled as “Langley + lamp.”
2.2.8 Spectrometer responsivity
A Newport Oriel OPS-Q250 and 200 W QTH lamp with NIST-traceable spectral calibration from 250–2400 nm was used to measure the SAS-He relative spectral response. Based on reproducibility, the absolute uncertainty of the measurement is estimated to be up to several percent, insufficient for independent irradiance calibration. However, comparison of normalized responsivity curves shows relative variation less than 0.1 % over the full spectral range after a 10 min lamp settling time. The relative spectral responsivity is scaled to agree with Langley calibration to top-of-atmosphere solar irradiance (Fig. 5) using the conventional approach (Kindel et al., 2001; Michalsky and Kiedron, 2022).
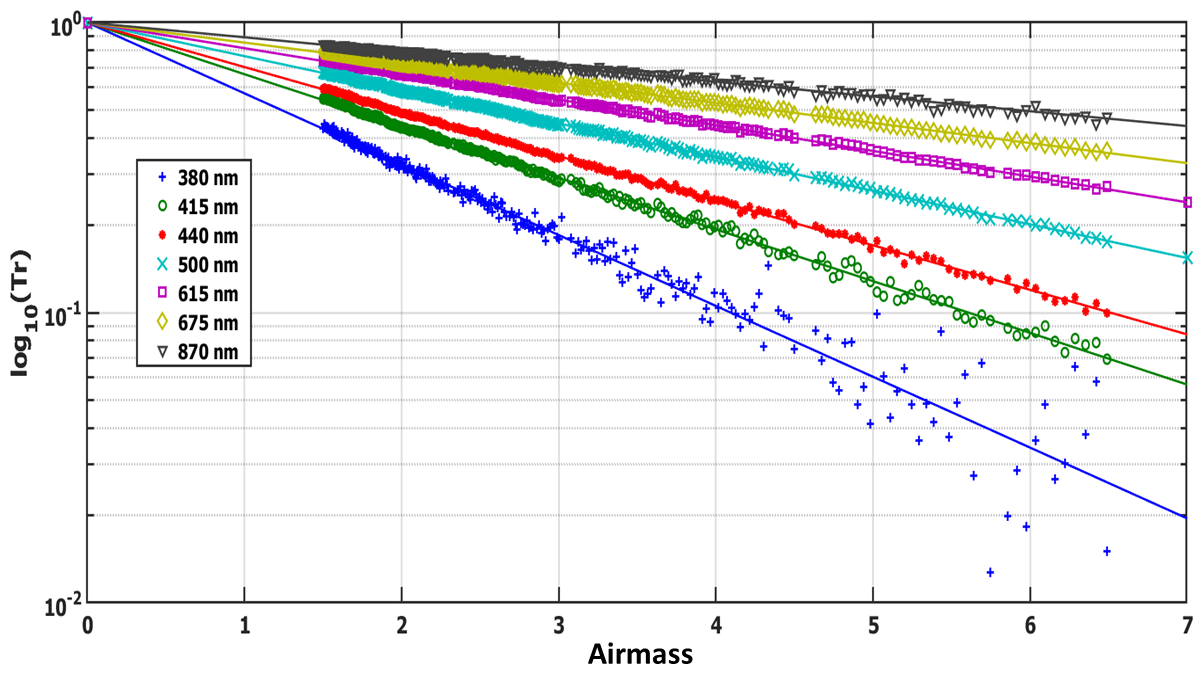
Figure 6Example of an SAS-He Langley plot from 18 July 2021 at several CSPHOT and MFRSR wavelengths during TRACER. To demonstrate the expected monotonic behavior with wavelength (with shorter wavelength having the steepest slopes and largest optical depths) more clearly, the signal for each wavelength is normalized against the Y intercept of the Langley regression line, forcing each to intersect at 0 air mass.
2.2.9 Langley calibration (direct irradiance)
To determine AODs from the SAS-He measurements, in-field calibration with Langley regressions is applied. Recall that the Langley regressions are linear regressions of the log of the measured irradiance versus air mass and they are computed twice daily. The output of these regressions (Fig. 6) is used for field calibration of the SAS-He. Since the daily Langley regressions exhibit significant noise, mostly due to atmospheric variability, several weeks of SAS-He operational measurements are required to accumulate enough acceptable Langley regressions with small (below 1 % per day) statistical variability. Application of a stable daily calibration to the SAS-He radiometric measurements allows one to calculate time series of TOD for each wavelength.
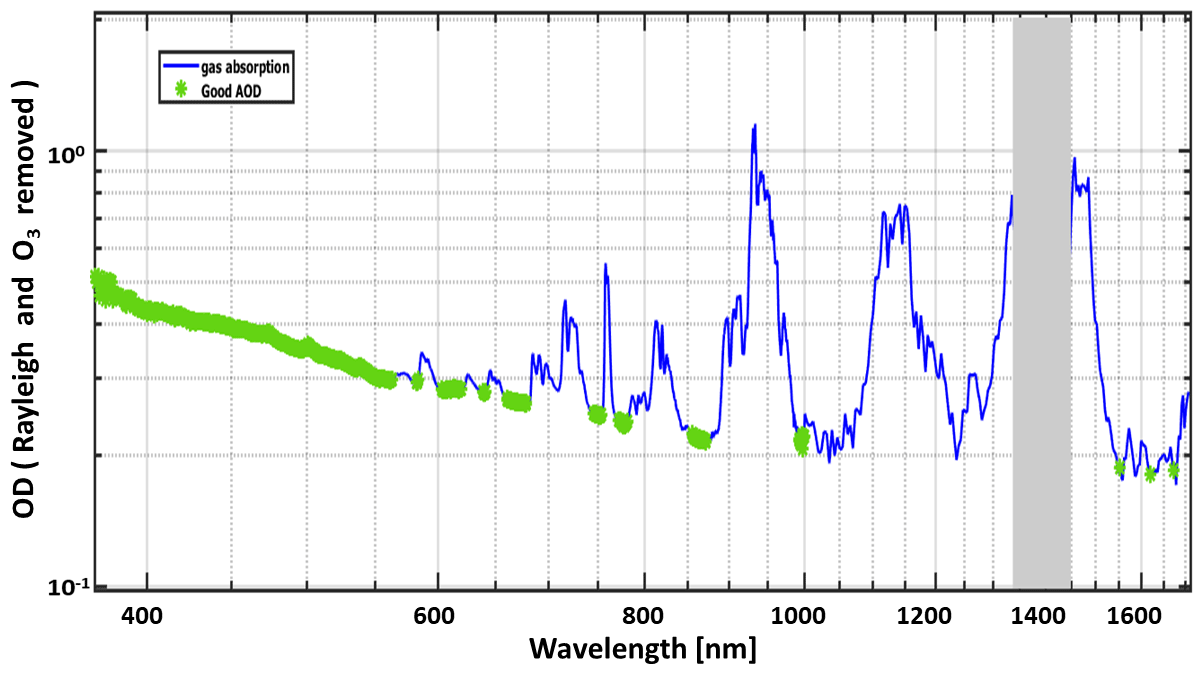
Figure 7Example of an optical depth (OD) spectrum with the Rayleigh component and O3 removed during TRACER. The green symbols show approximate spectral regions where “good” AOD may be effectively retrieved since contributions of trace gases are minimal. AODs may be found across short wavelength segments from about 400 to 675 nm and about 778 and 870 nm. Near-infrared segments suitable for retrieving AOD are centered on 1020 nm and 1623 nm wavelengths, but care must be used to avoid regions of strong gaseous absorption. The SAS-He fiber optics are opaque near 1400 nm, and thus this region has been grayed out.
2.2.10 Total optical depth and gaseous absorption
Figure 7 shows an example of the TOD spectra obtained from the SAS-He “UV–Vis–NIR” spectrometer. The first “UV–Vis” segment (from about 400 to 450 nm) does not include gaseous absorption. The exception is very small NO2 absorption, which can be neglected for many practical applications. Thus, the TOD spectrum in this spectral range represents the actual AOD sufficiently well. Note that the impact of NO2 absorption on aerosol SSA retrievals is most pronounced for low aerosol loading (e.g., Mok et al., 2018). The second segment (from about 450 to 750 nm) includes substantial ozone absorption in the Chappuis band. Finding the ozone optical depth requires an estimate of the columnar amount of ozone. Data from the Total Ozone Mapping Spectrometer (TOMS; https://acd-ext.gsfc.nasa.gov/anonftp/toms/, last access: 24 July 2024; https://disc.gsfc.nasa.gov/datacollection/TOMSN7L3dtoz_008.html, last access: 24 July 2024) or from the Ozone Monitoring Instrument (OMI; Bhartia, 2012) can be used for obtaining the required ozone amount for a given SAS-He location. We continue with spectra obtained from the SAS-He “SWIR” spectrometer (Fig. 7). The gaseous absorption is quite large for the majority of spectral regions, and thus it precludes the straightforward inference of AOD from the measured TOD spectrum. There are, however, several spectral areas with minimal gaseous absorption (e.g., segments around 1020 and 1620 nm wavelengths) where the gaseous absorption can be accounted for.

Figure 8Density plots of SAS-He AOD versus CSPHOT AOD measured at five (380, 440, 500, 675, 870 nm; first five columns) wavelengths during TCAP (a), TRACER (b), and EPCAPE (c). The corresponding scatterplots of TOD adjusted to the Rayleigh scattering at two (1020, 1640 nm) wavelengths are also included (last two columns). The short-dashed black line is the 1:1 correspondence line, and the solid blue line is the linear regression. Points with light color represent outliers. Note that scales for the x and y axes depend on wavelength. Table 2 provides the basic statistics of the comparison.
The evaluation of a new instrument requires two main considerations. The first consideration is a wide range of observational conditions associated with different aerosol and cloud types as well as strong variability of aerosol loading. The second consideration is availability of good-quality data offered by collocated and coincident instruments with different designs and independent operations. The three ARM Mobile Facility (AMF) campaigns selected for this analysis provide ground-based instruments for measuring aerosol, cloud, precipitation, and atmospheric state properties and satisfy these challenging considerations. The interested reader can find detailed descriptions of these campaigns, which are of significant scientific interest, at http://www.arm.gov (last access: 24 July 2024), along with their suites of ground-based instruments with state-of-the-art capabilities and the corresponding data (Berg et al., 2016; Jensen et al., 2022; Russell et al., 2021). Here we summarize these campaigns conducted over climatologically important regions and highlight only data used for our evaluation, specifically the spectrally resolved AOD, TOD, and the diffuse irradiance and DDR.
For each campaign, we compare data provided by MFRSR, CSPHOT, and SAS-He. The quality-assured (level 2) AODs measured at seven (380, 440, 500, 675, 870, 1020, 1640 nm) wavelengths by CSPHOT with a sun-pointing design are used as a “reference” for evaluation of SAS-He AODs (Sect. 4.1). The spectrally resolved DDRs and diffuse irradiances provided by MFRSR are used as a reference for evaluation of their SAS-He counterparts (Sects. 4.2 and 4.3). Recall that MFRSR and SAS-He are sensors with hemispherical receptors that are periodically shaded by rotating bands. The evaluation involves two groups of DDRs and diffuse irradiances offered by the MFRSR measurements. The first group defines the MFRSR products obtained at the five available wavelengths (415, 500, 615, 675, 870 nm) during the TCAP only. The second group defines the MFRSR products obtained at the six available wavelengths (415, 500, 615, 675, 870, 1625 nm) during TRACER and EPCAPE. Similar to previous studies related to hyperspectral measurements (e.g., Shinozuka et al., 2013), a level of agreement between the SAS-He data and those offered by the reference instruments is demonstrated though the basic statistics, such as bias and root mean square error.
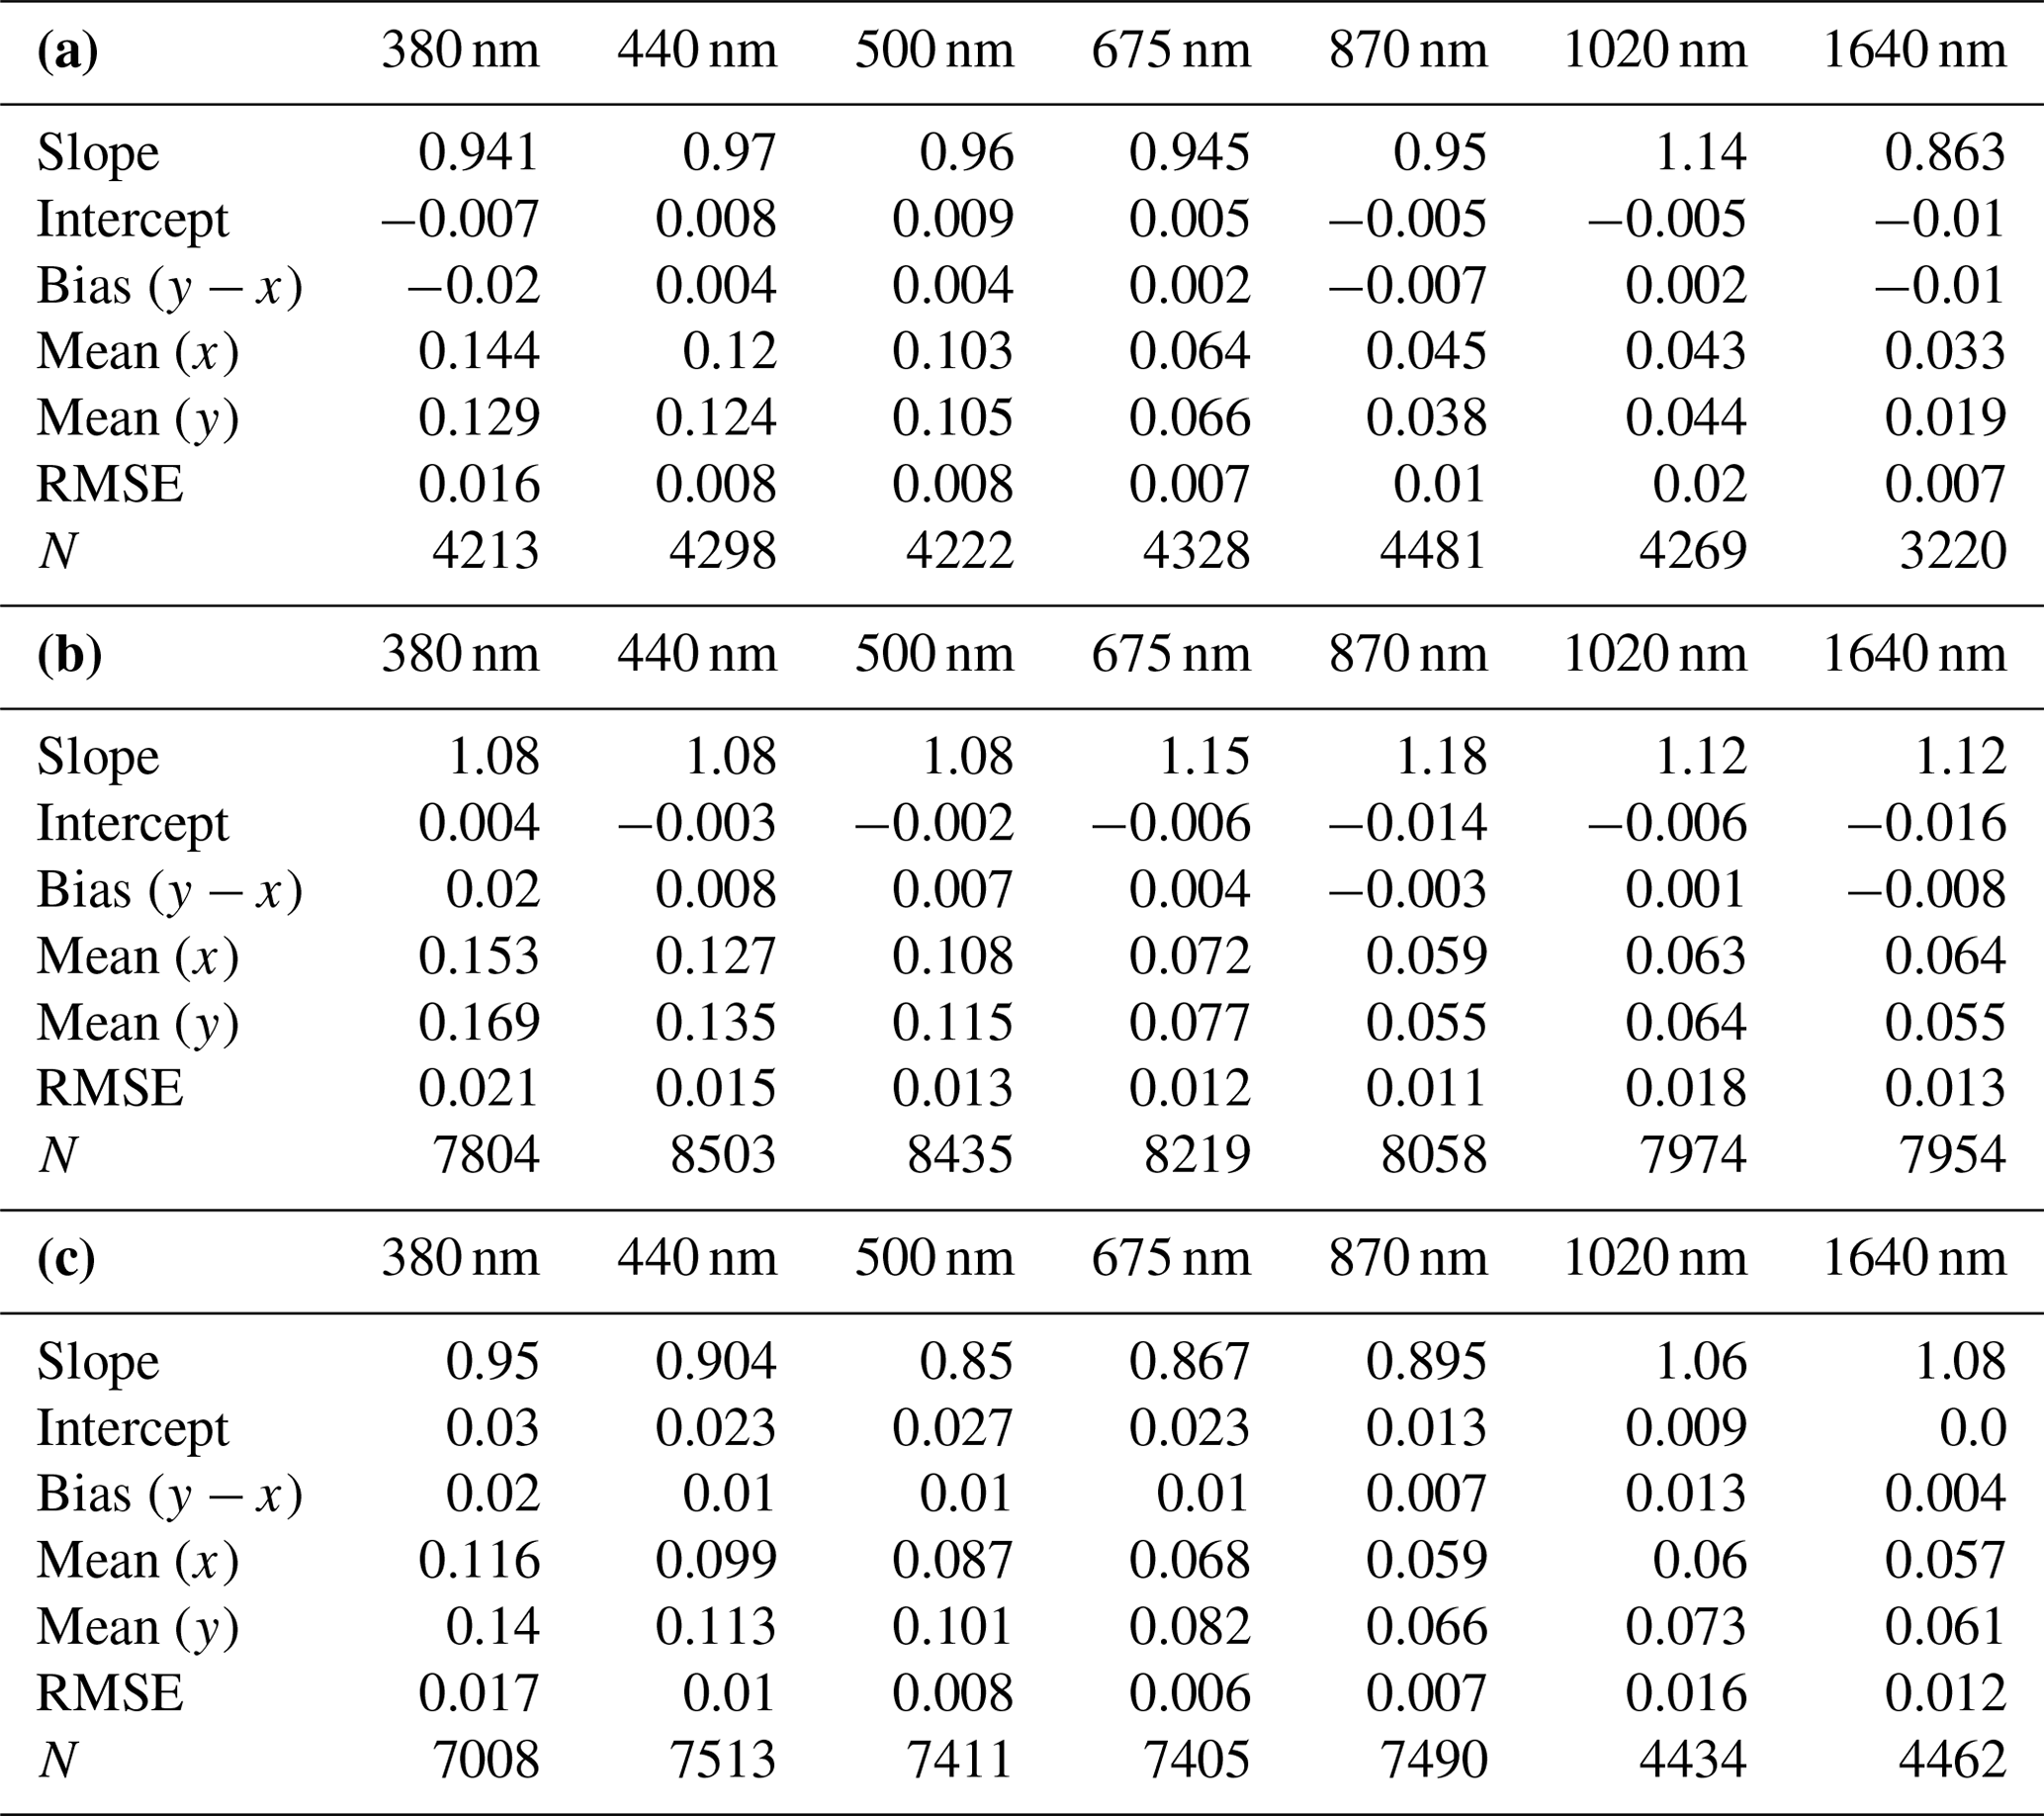
Table 2(a) Parameters of linear regressions (Fig. 8) obtained for CSPHOT and SAS-He AODs measured at seven wavelengths during TCAP. The root mean square error (RMSE) and number of points (N) are also included. (b) The same as Table 2a except for TRACER. (c) The same as Table 2a except for EPCAPE.
3.1 TCAP
The main objective of the TCAP was to examine the evolution of optical and microphysical properties of atmospheric aerosol transported from North America to the Atlantic and their impact on the radiation energy budget (Berg et al., 2016). To achieve this goal, the AMF site (42.03° N, 70.05° W) was deployed on Cape Cod from July 2012 through June 2013. Cape Cod is an arm-shaped peninsula situated on the easternmost portion of Massachusetts, along the US East Coast, and is generally downwind of several metropolitan areas. The AMF site was located nearby offshore of Martha's Vineyard Coastal Observatory (41.33° N, 70.57° W) with CSPHOT (https://aeronet.gsfc.nasa.gov, last access: 24 July 2024).
3.2 TRACER
The main objective of TRACER was to examine aerosol–cloud interactions in deep convection over the Houston metropolitan area of Texas (Jensen et al., 2022). To achieve this goal, the AMF site (29.67° N, 95.06° W) was deployed near the La Porte, Texas, airport from October 2021 through September 2022. This area, with frequent isolated convective systems, is characterized by distinct aerosol types originating, for example, from urban, industrial, and marine sources. The CSPHOT was collocated with the MFRSR and SAS-He as part of the AMF.
3.3 EPCAPE
The main objective of EPCAPE is to characterize the radiative properties, aerosol interactions, precipitation characteristics, and extent of stratocumulus clouds in the eastern Pacific across all four seasons (Russell et al., 2021). To achieve this goal, a 12-month deployment of the AMF site (32.87° N, 117.26° W) on Scripps Pier (La Jolla, California) started in February 2023. This area, with coastal orography and frequently observed transitions from overcast cloud layers to broken clouds, is influenced by distinct aerosol types originating from the Los Angeles–Long Beach urban port megacity. The CSPHOT is collocated with the MFRSR and SAS-He as part of the AMF.
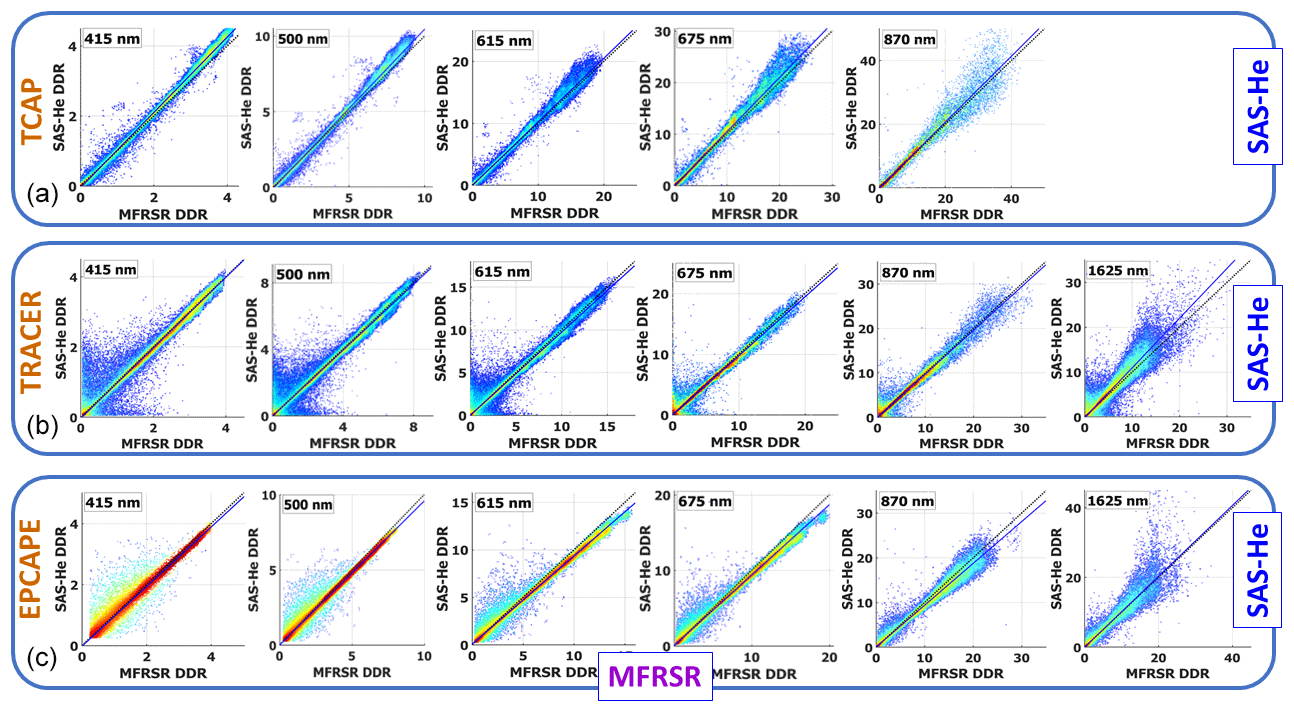
Figure 9Density plots of SAS-He DDR versus MFRSR DDR obtained from the direct and diffuse irradiances measured at five (415, 500, 615, 675, 870 nm) wavelengths during TCAP (a) and at six (415, 500, 615, 675, 870, 1625 nm) wavelengths during TRACER (b) and EPCAPE (c). Note that the DDR is dimensionless.
This section contains comparison of the aerosol-related (both AOD and TOD) and radiative (both diffuse irradiance and DDR) properties provided by the SAS-He with those offered by the collocated ground-based instruments, specifically the MFRSR and CSPHOT, during the three selected campaigns highlighted above (Sect. 3). We start with assessment of AOD and TOD measured at different wavelengths by the SAS-He and CSPHOT (Sect. 4.1). Then, evaluation of spectrally resolved DDR offered by the SAS-He and MFRSR is presented (Sect. 4.2). Finally, the diffuse irradiances measured at different wavelengths by the SAS-He and MFRSR are contrasted (Sect. 4.3).
4.1 AOD: SAS-He versus CSPHOT
When a straight line between the Sun and the ground-based instrument is cloud-free, one can calculate AOD from TOD at a given wavelength (e.g., Giles et al., 2019):
where τRay(λ) is Rayleigh optical depth due to molecular scattering and τgas(λ) is optical depth due to absorption of atmospheric trace gases, such as carbon dioxide, methane, and water vapor. The gaseous absorption is relatively small in comparison to AOD at five wavelengths (380, 440, 500, 675, 870 nm). In contrast, gas absorption is comparable with AOD at two other wavelengths (1020, 1640 nm). Thus, the corresponding corrections of the gas absorption are required for AOD calculations at these wavelengths (1020, 1640 nm). The implementation of the required corrections to the SAS-He AOD is underway. Here, we compare the available total optical depth adjusted to the Rayleigh scattering, namely TOD(λ)−τRay(λ), at these wavelengths (1020, 1640 nm). The same τRay(λ) is used for such adjustment. The collocated SAS-He and CSPHOT measurements provide the needed TOD(λ). Below, both scatterplots (Fig. 8) and the corresponding main statistics (Table 2) illustrate the level of agreement between the SAS-He and CSPHOT products (both AOD and TOD).
Substantial changes in aerosol loading are observed during TCAP (Fig. 8a). For example, AODs measured by both SAS-He and CSPHOT at 500 nm wavelength can vary over a wide range (from roughly 0.05 to 0.5). The proximity of Cape Cod to major urban and industrial sources and its frequently downwind location are mainly responsible for the observed substantial changes in aerosol loading. The majority of points are packed around the 1:1 line (Fig. 8a). The corresponding slopes are close to 1 (about 0.95), absolute values of intercept are small (about 0.01 or less), and root mean square errors (RMSEs) are within the expected measurement uncertainty of AOD (0.01–0.02) (Table 2a). Both scatterplots and main statistics indicate strong agreement between SAS-He and CSPHOT AODs at the wavelengths considered here. The measurements at longer wavelengths (1020, 1640 nm) show increased scatter (Fig. 8a), mostly due to a reduced signal-to-noise ratio at these wavelengths. For example, the mean value of TOD measured by CSPHOT at 1640 nm wavelength (0.033) is about 3 times smaller than the mean value of AOD measured by CSPHOT at 500 nm wavelength (0.103). As a result, agreement for TODs at longer wavelengths (1020, 1640 nm) is slightly weaker than that for AODs at shorter wavelengths (380, 440, 500, 675, 870 nm). To illustrate, a smaller value of the slope (0.863) is obtained for TOD (SAS-He vs. CSPHOT) at 1640 nm wavelength in comparison with that (0.96) acquired for AOD (SAS-He vs. CSPHOT) at 500 nm wavelength (Table 2a).
Similar to the TCAP, the comparisons during TRACER and EPCAPE show substantial changes in aerosol loading (Fig. 8). To take an example, AODs measured by both SAS-He and CSPHOT at 500 nm wavelength during TRACER can vary over a wide range (from roughly 0.05 to 0.4) (Fig. 8b). In contrast to TCAP, TRACER and EPCAPE show slightly different relationships between SAS-He and CSPHOT AODs in terms of slope. The slopes calculated for the SAS-He and CSPHOT AODs at different wavelengths (380–870 nm) are either larger (1.08–1.18) or smaller (0.85–0.95) than 1.0 for TRACER and EPCAPE, respectively (Table 2b and c). In other words, SAS-He AODs tend to be slightly larger than CSPHOT AODs during TRACER (Fig. 8b). The opposite is true for EPCAPE (Fig. 8c). The highlighted overestimation and underestimation are likely associated with slightly different SAS-He calibrations performed during TRACER and EPCAPE. It appears that these trends have only a minor impact on the corresponding RMSEs. The latter are within 0.021 at 380, 440, 500, 675, 870, and 1020 nm wavelengths despite these trends (Table 2b and c). Also, small RMSEs (0.012–0.013) are obtained for TOD at 1640 nm wavelength (Table 2b and c).
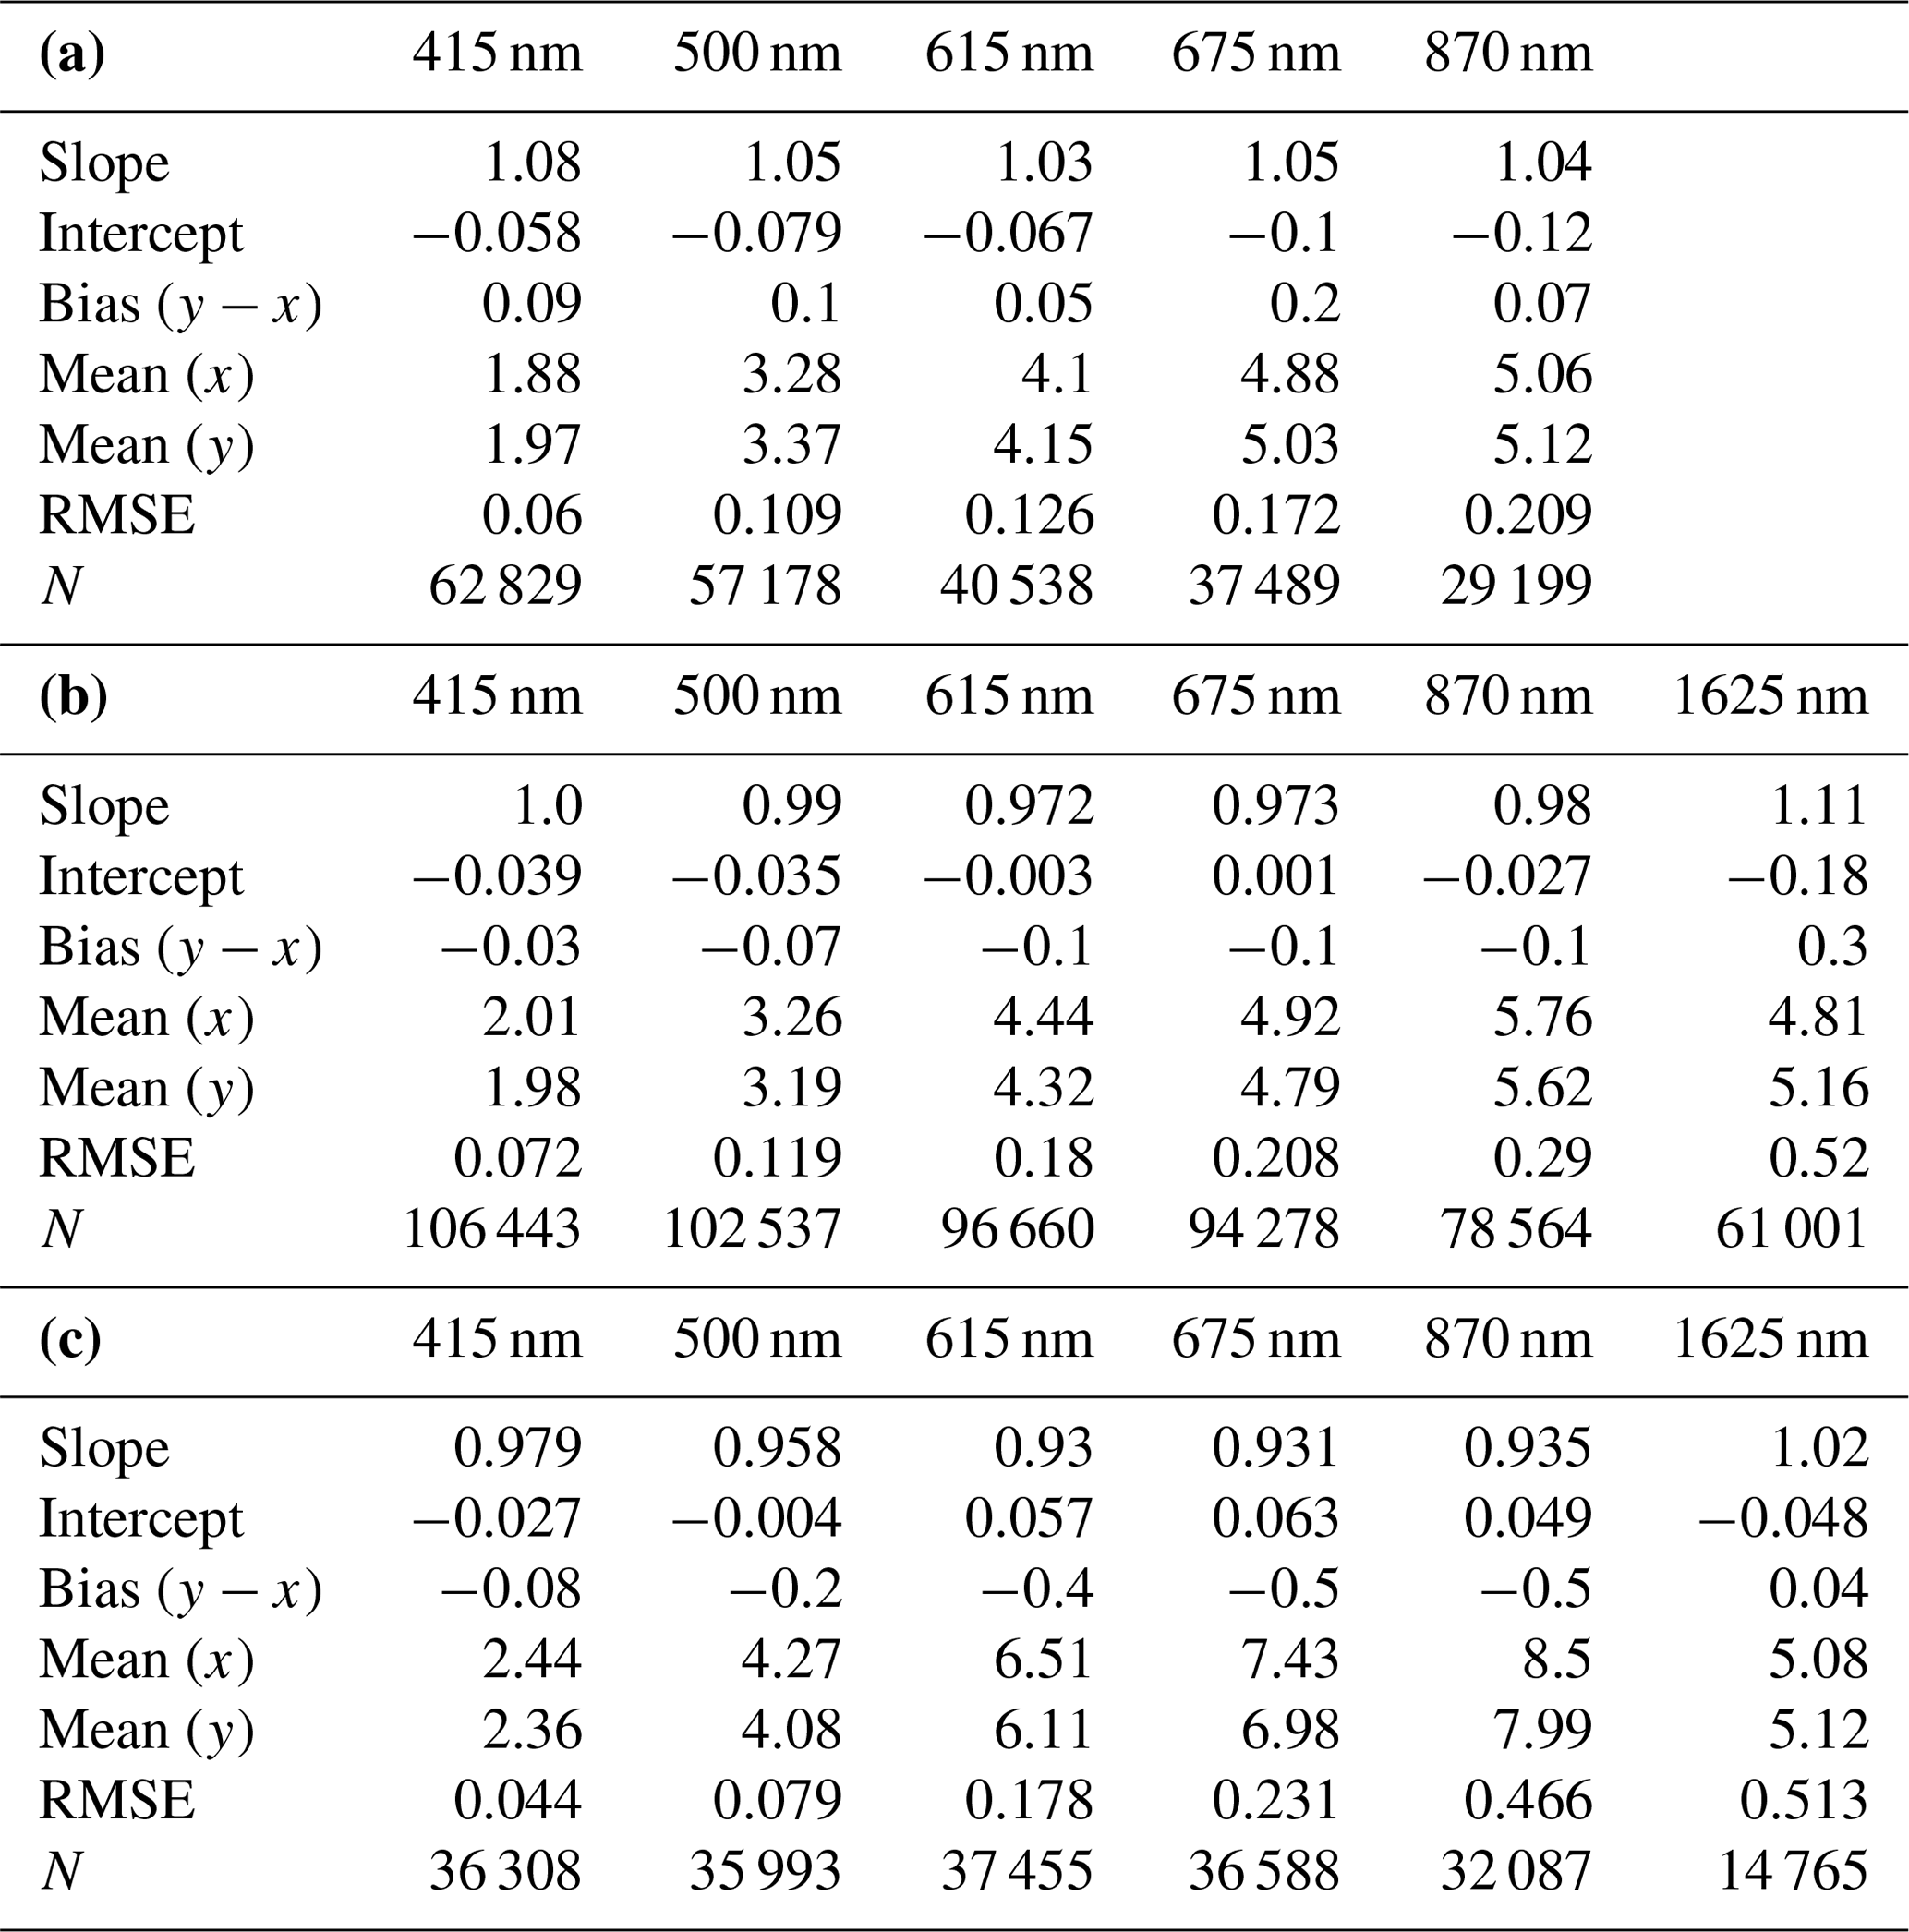
Table 3(a) Parameters of linear regressions (Fig. 9) obtained at five (415, 500, 615, 675, 870 nm) wavelengths for MFRSR and SAS-He DDRs during TCAP. The root mean square error (RMSE) and number of points (N) are also included. (b) Parameters of linear regressions (Fig. 9) obtained at six (415, 500, 615, 675, 870, 1625 nm) wavelengths for MFRSR and SAS-He DDRs during TRACER. The root mean square error (RMSE) and number of points (N) are also included. (c) The same as Table 3b except for EPCAPE.
4.2 DDR: SAS-He versus MFRSR
The DDR exhibits an even wider range of changes (Fig. 9) than the AOD (Fig. 8). These significant changes in DDR (about 2 orders of magnitude) are mainly attributed to two factors. First, the DDR comparison (Fig. 9; Table 3) includes both clear- and cloudy-sky conditions where a straight line between the Sun and the ground-based instruments was either cloud-free or blocked by a cloud. Here, the term “cloudy sky” defines all cloud types observed during the selected campaigns. Typically, different cloud types have distinct and highly variable cloud properties, such as cloud amount and cloud optical thickness, in time and space. Second, the direct and diffuse irradiances vary differently depending on the plume and/or cloud properties. For instance, the DDR is small (close to zero; Fig. 9) during the presence of dense plumes associated with strong air pollution emissions or overcast and optically thick clouds. In this case, the direct irradiance is negligible in comparison with the diffuse irradiance. During clean and clear-sky conditions, the direct irradiance reaches large values, while the diffuse irradiance drops off. These conditions are characterized by large DDRs (Fig. 9).
A moderate scattering of points with well-defined clustering along the 1:1 correspondence line (Fig. 9) indicates that the SAS-He measurements offer the spectrally resolved DDR in a reasonable manner. Visually, the scattering of points has campaign-dependent features (Fig. 9). To illustrate, a noticeable number of points are located along the x and y axis during TRACER (Fig. 9b). Alternatively stated, the DDRs offered by two instruments, namely the SAS-He and MFRSR, can occasionally be quite different when the DDR values are small to moderate (less than 3). The combination of several potential factors, such as cloud-induced variability of both the direct and diffuse irradiances at small scales, a minor temporal mismatch due to different reporting times, and the spatial separation of these neighboring instruments (∼ 120 m), could be responsible for different observational conditions for the two instruments (sunlit vs. shadow cases for two instruments spaced slightly apart) and could thus contribute to the highlighted differences. It appears that the level of agreement between the SAS-He DDR and MFRSR DDR (Table 3) is scarcely affected by the campaign-dependent variability of cloud and aerosol properties: the slope is close to 1 (0.93–1.1), the mean values are comparable, and these values exceed the RMSE substantially (about 10 times or more).
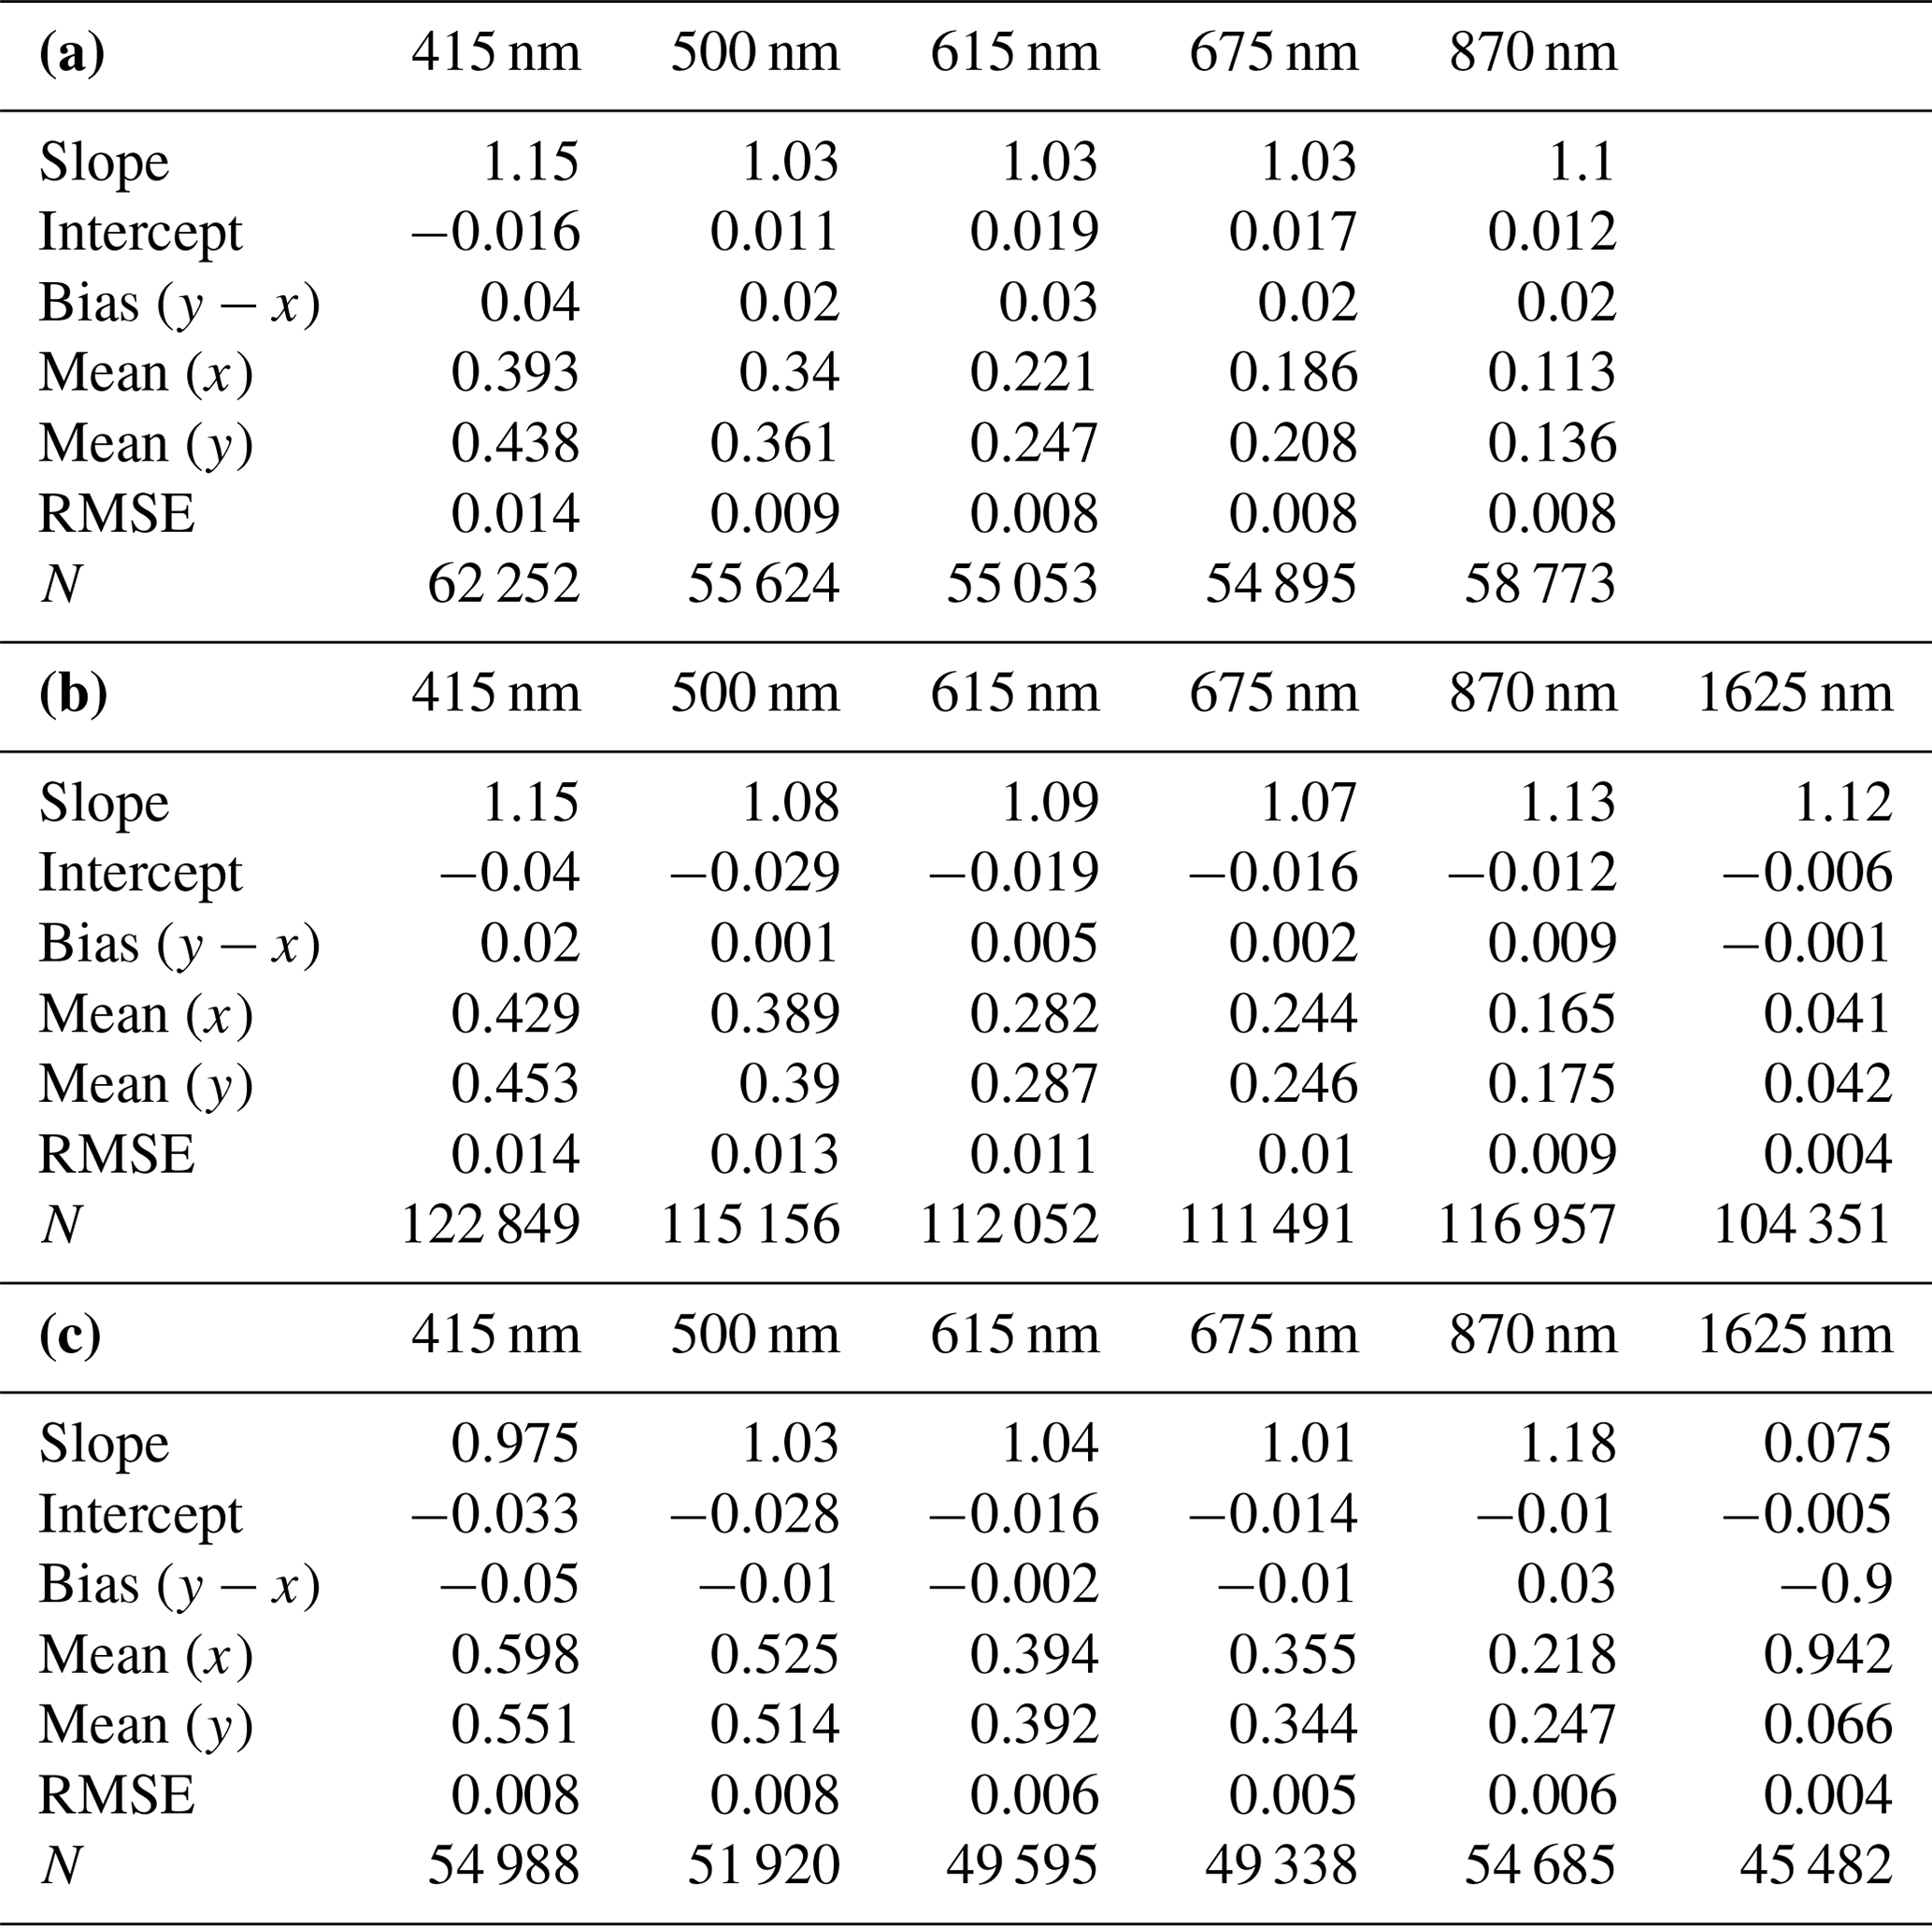
4.3 Diffuse irradiance: SAS-He versus MFRSR
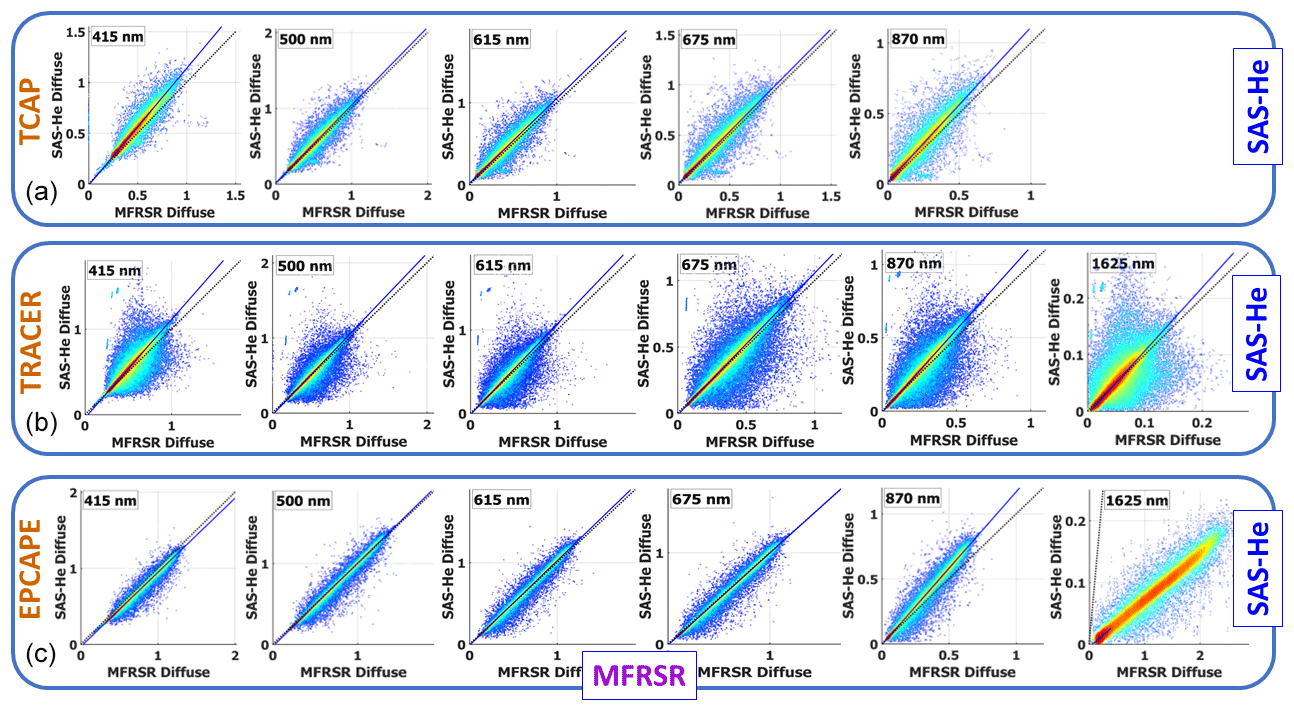
Scatterplots generated for the diffuse irradiances measured by the SAS-He and MFRSR clearly illustrate that these irradiances, on average, are in good agreement (Fig. 10). It should be emphasized that the diffuse irradiances rely on the calibration. Thus, potential calibration-related issues could have a profound impact on the statistical relationship between these irradiances. The MFRSR lamp calibration issue at 1625 nm wavelength is documented for EPCAPE, and this issue is responsible for the significant disagreement between the diffuse irradiances measured by the SAS-He and MFRSR at 1625 nm wavelength (Fig. 10c). The corresponding slope is very small (0.075) and the difference between mean values of the diffuse irradiances is enormous (0.942 vs. 0.066) (Table 4). It is also vital to note that the accompanying DDRs offered by the SAS-He and MFRSR at 1625 nm wavelength are in very good agreement (Fig. 9c) because the DDRs, in contrast to the diffuse irradiances, do not depend on calibration. Similar to the DDR-related scatterplots (Fig. 9), the scatterplots generated for the diffuse irradiances (Fig. 10) display the campaign-dependent features of points scattering around the 1:1 correspondence line. For example, TRACER in comparison with EPCAPE has a wider spread of points (Fig. 10b vs. c). The fraction of points contributing to this spread is small relative to the fraction of points clustering around the 1:1 correspondence line (Fig. 10b vs. c). Thus, the level of agreement between the main statistics (Table 4) depends slightly on these spread-contributed points.
We introduce a ground-based radiometer, the so-called Shortwave Array Spectroradiometer-Hemispheric (SAS-He), with an increased spectral coverage (350–1700 nm) and improved spectral resolution. The latter is about 2.4 and 6 nm in the UV–Vis–NIR (350–1040 nm) and SWIR (990–1700 nm) spectral ranges, respectively. The SAS-He measures the spectrally resolved total irradiance and its direct and diffuse components with high temporal (30 s) resolution. Both aerosol optical depth (AOD) and total optical depth (TOD) are derived from the direct irradiance measured by the SAS-He, while the direct-to-diffuse ratio (DDR) is calculated using two components of the measured total irradiance. We assess the performance of the SAS-He using integrated datasets collected during three field campaigns supported by the US Department of Energy's Atmospheric Radiation Measurement (ARM) program: (1) Two-Column Aerosol Project (TCAP) (Berg et al., 2016), (2) Tracking Aerosol Convection Interactions Experiment (TRACER) (Jensen et al., 2022), and (3) Eastern Pacific Cloud Aerosol Precipitation Experiment (EPCAPE) (Russell et al., 2021). These campaigns represent climatologically important regions with different types of aerosols originating from major marine, urban, and industrial sources.
For our assessment we use data offered by three collocated ground-based instruments, namely the multifilter rotating shadowband radiometer (MFRSR), a Cimel sunphotometer (CSPHOT), and SAS-He, as part of the ARM Mobile Facility (AMF). Our assessment involves (i) AOD measured at five (380, 440, 500, 675, 870 nm) wavelengths and TOD measured at two wavelengths (1020 and 1640 nm) by the SAS-He and CSPHOT, (ii) the diffuse irradiance and DDR provided by the SAS-He and MFRSR at five (415, 500, 615, 675, 870 nm) wavelengths during TCAP, and (iii) the diffuse irradiance and DDR provided by the SAS-He and MFRSR at six (415, 500, 615, 675, 870, 1625 nm) wavelengths during TRACER and EPCAPE. The measurements of the diffuse irradiance and DDR define all-sky observational conditions when a straight line between the Sun and the ground-based instruments was either cloud-free or blocked by a cloud. Data provided by the CSPHOT and MFRSR are considered to be a reference during our assessment.
We compare the spectrally resolved parameters related to aerosol loading (both AOD and TOD) and radiative properties (both diffuse irradiance and DDR) supplied by the SAS-He with those provided by the CSPHOT and MFRSR using scatterplots and the main statistics, such as the slope and intercept of linear regression, as well as the root mean square error (RMSE). Our comparison demonstrates that, on average, the SAS-He properties match their MFRSR and CSPHOT counterparts closely despite the challenging observational conditions associated with large variability of aerosol loading and distinct types of aerosols and clouds. In particular, the AOD- and TOD-related RMSEs are within 0.02 for the majority of cases. Moreover, the slope is mostly close to 1 (0.85–1.18), and absolute values of intercept are mostly near zero (less than 0.07) for both the aerosol and radiative properties considered here. It is expected that SAS-He data collected for a period exceeding 10 years (since 2011) will be used to derive previously unavailable or enhanced data products of aerosol, clouds, and the surface (e.g., Riihimaki et al., 2021) at multiple sites with worldwide locations, and these ground-based products combined with those offered by aircraft and satellite observations (Remer et al., 2024) will be imperative in the context of evaluation and improvements of model predictions.
Data can be downloaded from the ARM data archive (https://www.arm.gov/data/, last access: 24 July 2024) for CSPHOT (csphotaodfiltqav3; https://doi.org/10.5439/1461660; Gregory et al., 1994), MFRSR (mfrsraod1mich; https://doi.org/10.5439/1356805; Koontz et al., 2013), MFRSR7nch (mfrsr7nchaod1mich; https://doi.org/10.5439/1756632; Shippert and Shilling, 2021), SAS-He vis (sashevisaod; https://doi.org/10.5439/1110768; Ermold et al., 2013b), SAS-He NIR (sasheniraod; https://doi.org/10.5439/1110710; Ermold et al., 2013a).
Conceptualization: EK and CJF with input from JCB. Data processing: BDE. Formal analysis: EK and CJF. Writing (original draft): EK. Writing (review and editing): EK and CJF with input from JMC.
The contact author has declared that none of the authors has any competing interests.
Publisher's note: Copernicus Publications remains neutral with regard to jurisdictional claims made in the text, published maps, institutional affiliations, or any other geographical representation in this paper. While Copernicus Publications makes every effort to include appropriate place names, the final responsibility lies with the authors.
This research was supported by the US Department of Energy (DOE), Office of Science Biological and Environmental Research, as part of the Atmospheric Radiation Measurement (ARM) user facility. The Pacific Northwest National Laboratory is operated for the DOE by the Battelle Memorial Institute under contract DE-AC05-76RL01830.
This research has been supported by Battelle (grant no. DE-AC05-76RL01830).
This paper was edited by Omar Torres and reviewed by Samuel LeBlanc and two anonymous referees.
Alexandrov, M. D., Kiedron, P., Michalsky, J. J., Hodges, G., Flynn, C. J., and Lacis, A. A.: Optical depth measurements by shadow-band radiometers and their uncertainties, Appl. Optics, 46, 8027–8038, 2007.
Augustine, J. A., Hodges, G. B., Dutton, E. G., Michalsky, J. J., and Cornwall, C. R.: An aerosol optical depth climatology for NOAA's national surface radiation budget network (SURFRAD), J. Geophys. Res., 113, D11204, https://doi.org/10.1029/2007JD009504, 2008.
Barthlott, C., Zarboo, A., Matsunobu, T., and Keil, C.: Impacts of combined microphysical and land-surface uncertainties on convective clouds and precipitation in different weather regimes, Atmos. Chem. Phys., 22, 10841–10860, https://doi.org/10.5194/acp-22-10841-2022, 2022.
Berg, L. K., Fast, J. D., Barnard, J. C., Burton, S. P., Cairns, B., Chand, D., Comstock, J. M., Dunagan, S., Ferrare, R. A., Flynn, C. J., Hair, J. W., Hostetler, C. A., Hubbe, J., Johnson, R., Kassianov, E. I., Kluzek, C. D., Mei, F., Miller, M. A., Michalsky, J., Ortega, I., Pekour, M., Rogers, R. R., Russell, P. B., Redemann, J., Sedlacek III, A. J., Segal-Rosenheimer, M., Schmid, B., Shilling, J. E., Shinozuka, Y., Springston, S. R., Tomlinson, J., Tyrrell, M., Wilson, J. M., Volkamer, R., Zelenyuk, A., and Berkowitz, C. M.: The Two-Column Aerosol Project: Phase I overview and impact of elevated aerosol layers on aerosol optical depth, J. Geophys. Res., 121, 336–361, https://doi.org/10.1002/2015JD023848, 2016.
Bhartia, P. K.: OMI/Aura TOMS-like ozone and radiative cloud fraction L3 1 day 0.25 degree × 0.25 degree V3, NASA Goddard Space Flight Center, Goddard Earth Sciences Data and Information Services Center (GES DISC), https://doi.org/10.5067/Aura/OMI/DATA3002, 2012.
Calderón, S. M., Tonttila, J., Buchholz, A., Joutsensaari, J., Komppula, M., Leskinen, A., Hao, L., Moisseev, D., Pullinen, I., Tiitta, P., Xu, J., Virtanen, A., Kokkola, H., and Romakkaniemi, S.: Aerosol–stratocumulus interactions: towards a better process understanding using closures between observations and large eddy simulations, Atmos. Chem. Phys., 22, 12417–12441, https://doi.org/10.5194/acp-22-12417-2022, 2022.
Chen, C., Dubovik, O., Schuster, G. L., Chin, M., Henze, D. K., Lapyonok, T., Li , Z., Derimian, Y., and Zhang, Y.: Multi-angular polarimetric remote sensing to pinpoint global aerosol absorption and direct radiative forcing, Nat. Commun., 13, 7459, https://doi.org/10.1038/s41467-022-35147-y, 2022.
Cochrane, S. P., Schmidt, K. S., Chen, H., Pilewskie, P., Kittelman, S., Redemann, J., LeBlanc, S., Pistone, K., Segal Rozenhaimer, M., Kacenelenbogen, M., Shinozuka, Y., Flynn, C., Ferrare, R., Burton, S., Hostetler, C., Mallet, M., and Zuidema, P.: Biomass burning aerosol heating rates from the ORACLES (ObseRvations of Aerosols above CLouds and their intEractionS) 2016 and 2017 experiments, Atmos. Meas. Tech., 15, 61–77, https://doi.org/10.5194/amt-15-61-2022, 2022.
Coddington, O., Schmidt, K. S., Pilewskie, P., Gore, W. J., Bergstrom, R. W., Román, M., Redemann, J., Russell, P. B., Liu, J., and Schaaf, C. C.: Aircraft measurements of spectral surface albedo and its consistency with ground-based and space-borne observations, J. Geophys. Res., 113, D17209, https://doi.org/10.1029/2008JD010089, 2008.
Corr, C. A., Krotkov, N., Madronich, S., Slusser, J. R., Holben, B., Gao, W., Flynn, J., Lefer, B., and Kreidenweis, S. M.: Retrieval of aerosol single scattering albedo at ultraviolet wavelengths at the T1 site during MILAGRO, Atmos. Chem. Phys., 9, 5813–5827, https://doi.org/10.5194/acp-9-5813-2009, 2009.
Dunagan, S. E., Johnson, R., Zavaleta, J., Russell, P. B., Schmid, B., Flynn, C., Redemann, J., Shinozuka, Y., Livingston, J., and Segal-Rosenhaimer, M.: Spectrometer for Sky-Scanning Sun-Tracking Atmospheric Research (4STAR): Instrument technology, Remote Sens.-Basel, 5, 3872–3895. https://doi.org/10.3390/rs5083872, 2013.
Ermold, B., Flynn, C. J., and Barnard, J.: Near-infrared (NIR) Aerosol Optical Depth (AOD) Derived from SAS-He Measurements (SASHENIRAOD), Atmospheric Radiation Measurement (ARM) user facility [data set], https://doi.org/10.5439/1110710, 2013a.
Ermold, B., Flynn, C. J., and Barnard, J.: Visible (Vis) Aerosol Optical Depth (AOD) Derived from SAS-He Measurements (SASHEVISAOD), Atmospheric Radiation Measurement (ARM) user facility [data set], https://doi.org/10.5439/1110768, 2013b.
Flynn, C. J.: Shortwave Array Spectroradiometer–Hemispheric (SASHe) Instrument Handbook, DOE ARM Climate Research Facility, DOE/SC-ARM-TR-172, https://doi.org/10.2172/1251414, 2016.
Ge, J. M., Su, J., Ackerman, T. P., Fu, Q., Huang, J. P., and Shi, J. S.: Dust aerosol optical properties retrieval and radiative forcing over Northwestern China during the 2008 China-US joint field experiment, J. Geophys. Res., 115, D00K12, https://doi.org/10.1029/2009JD013263, 2010.
Giles, D. M., Sinyuk, A., Sorokin, M. G., Schafer, J. S., Smirnov, A., Slutsker, I., Eck, T. F., Holben, B. N., Lewis, J. R., Campbell, J. R., Welton, E. J., Korkin, S. V., and Lyapustin, A. I.: Advancements in the Aerosol Robotic Network (AERONET) Version 3 database – automated near-real-time quality control algorithm with improved cloud screening for Sun photometer aerosol optical depth (AOD) measurements, Atmos. Meas. Tech., 12, 169–209, https://doi.org/10.5194/amt-12-169-2019, 2019.
Gregory, L., Sivaraman, C., Ma, L., and Wagener, R.: Sunphotometer (CSPHOTAODFILTQAV3), Atmospheric Radiation Measurement (ARM) user facility [data set], https://doi.org/10.5439/1461660, 1994.
Gumber, A., Reid, J. S., Holz, R. E., Eck, T. F., Hsu, N. C., Levy, R. C., Zhang, J., and Veglio, P.: Assessment of severe aerosol events from NASA MODIS and VIIRS aerosol products for data assimilation and climate continuity, Atmos. Meas. Tech., 16, 2547–2573, https://doi.org/10.5194/amt-16-2547-2023, 2023.
Gupta, P., Levy, R. C., Mattoo, S., Remer, L., Zhang, Z., Sawyer, V., Wei, J., Zhao, S., Oo, M., Kiliyanpilakkil, V. P., and Pan, X.: Increasing Aerosol Optical Depth Spatial And Temporal Availability By Merging Datasets from Geostationary And Sun-Synchronous Satellites, Atmos. Meas. Tech. Discuss. [preprint], https://doi.org/10.5194/amt-2023-259, in review, 2024.
Hansen, J. E. and Travis, L. D.: Light scattering in planetary atmospheres, Space Sci. Rev., 16, 527–610, 1974.
Harrison, L., Joseph Michalsky, J., and Berndt, J.: Automated multifilter rotating shadow-band radiometer: an instrument for optical depth and radiation measurements, Appl. Optics, 33, 5118–5125, 1994.
Hodges, G. B. and Michalsky, J. J.: Multifilter Rotating Shadowband Radiometer (MFRSR), Multifilter Radiometer (MFR), and Normal Incidence Multifilter Radiometer (NIMFR) Instrument Handbook, DOE ARM Climate Research Facility, DOE/SC-ARM-TR-144, https://doi.org/10.2172/1251387, 2016.
Holben, B. N., Eck, T. F., Slutsker, I., Tanre, D., Buis, J. P., Setzer, A., Vermote, E., Reagan, J. A., Kaufman, Y., Nakajima, T., Lavenue, F., Jankowiak, I., and Smirnov, A.: AERONET – A federated instrument network and data archive for aerosol characterization, Remote Sens. Environ., 66, 1–16, https://doi.org/10.1016/S0034-4257(98)00031-5, 1998.
Jensen, M. P., Flynn, J. H., Judd, L. M., Kollias, P., Kuang, C., Mcfarquhar, G., Nadkarni, R., Powers, H., and Sullivan, J.: A succession of cloud, precipitation, aerosol, and air quality field experiments in the coastal urban environment, B. Am. Meteorol. Soc., 103, 103–105. https://doi.org/10.1175/bams-d-21-0104.1, 2022.
Kassianov, E. I., Flynn, C. J., Ackerman, T. P., and Barnard, J. C.: Aerosol single-scattering albedo and asymmetry parameter from MFRSR observations during the ARM Aerosol IOP 2003, Atmos. Chem. Phys., 7, 3341–3351, https://doi.org/10.5194/acp-7-3341-2007, 2007.
Kassianov, E., Barnard, J., Berg, L. K., Long, C. N., and Flynn, C.: Shortwave spectral radiative forcing of cumulus clouds from surface observations, Geophys. Res. Lett., 38, L07801, https://doi.org/10.1029/2010GL046282, 2011.
Kassianov, E., Pekour, M., Barnard, J., Flynn, C. J., Mei, F., and Berg, L. K.: Estimation of aerosol columnar size distribution from spectral extinction data in coastal and maritime environment, Atmosphere, 12, 1412, https://doi.org/10.3390/atmos12111412, 2021.
Kindel, B. C., Qu Z., and Goetz A. F.: Direct solar spectral irradiance and transmittance measurements from 350 to 2500 nm, Appl. Optics, 40, 3483–3494, https://doi.org/10.1364/ao.40.003483, 2001.
Kindel, B. C., Pilewskie, P., Schmidt, K. S., Coddington, O., and King, M. D.: Solar spectral absorption by marine stratus clouds: Measurements and modeling, J. Geophys. Res., 116, D10203, https://doi.org/10.1029/2010JD015071, 2011.
King, M. D., Byrne, D. M., Herman, B. M., and Reagan, J. A.: Aerosol size distributions obtained by inversions of spectral optical depth measurements, J. Atmos. Sci., 35, 2153–2167, 1978.
Kokhanovsky, A. A.: Optical properties of terrestrial clouds, Earth Sci. Rev., 64, 189–241, 2004.
Koontz, A., Hodges, G., Barnard, J., Flynn, C., and Michalsky, J.: Aerosol Optical Depth (AOD) Derived from MFRSR Measurements (MFRSRAOD1MICH), Atmospheric Radiation Measurement (ARM) user facility [data set], https://doi.org/10.5439/1356805, 2013.
Krotkov, N. A., Bhartia, P. K., Herman, J., Slusser, J., Scott, G., Labow, G., Vasilkov, A. P., Eck, T. F., Dubovik, O., and Holben, B. N.: Aerosol ultraviolet absorption experiment (2002 to 2004), part 2: Absorption optical thickness, refractive index, and single scattering albedo, Opt. Eng., 44, 1–17, 2005.
LeBlanc, S. E., Pilewskie, P., Schmidt, K. S., and Coddington, O.: A spectral method for discriminating thermodynamic phase and retrieving cloud optical thickness and effective radius using transmitted solar radiance spectra, Atmos. Meas. Tech., 8, 1361–1383, https://doi.org/10.5194/amt-8-1361-2015, 2015.
LeBlanc, S. E., Redemann, J., Flynn, C., Pistone, K., Kacenelenbogen, M., Segal-Rosenheimer, M., Shinozuka, Y., Dunagan, S., Dahlgren, R. P., Meyer, K., Podolske, J., Howell, S. G., Freitag, S., Small-Griswold, J., Holben, B., Diamond, M., Wood, R., Formenti, P., Piketh, S., Maggs-Kölling, G., Gerber, M., and Namwoonde, A.: Above-cloud aerosol optical depth from airborne observations in the southeast Atlantic, Atmos. Chem. Phys., 20, 1565–1590, https://doi.org/10.5194/acp-20-1565-2020, 2020.
Li, J., Carlson, B. E., Yung, Y. L., Lv, D., Hansen, J., Penner, J. E., Liao, H., Ramaswamy, V., Kahn, R. A., Zhang, P., Dubovik, O., Ding, A., Lacis, A. A., Zhang, L., and Dong, Y.: Scattering and absorbing aerosols in the climate system, Nat. Rev. Earth Environ., 3, 363–379, https://doi.org/10.1038/s43017-022-00296-7, 2022.
Matar, C., Cornet, C., Parol, F., C.-Labonnote, L., Auriol, F., and Nicolas, M.: Liquid cloud optical property retrieval and associated uncertainties using multi-angular and bispectral measurements of the airborne radiometer OSIRIS, Atmos. Meas. Tech., 16, 3221–3243, https://doi.org/10.5194/amt-16-3221-2023, 2023.
Michalsky, J. J. and Kiedron, P. W.: Moderate spectral resolution solar irradiance measurements, aerosol optical depth, and solar transmission, from 360 to 1070 nm, using the refurbished rotating shadow band spectroradiometer (RSS), Atmos. Meas. Tech., 15, 353–364, https://doi.org/10.5194/amt-15-353-2022, 2022.
Miller, M. A., Nitschke, K., Ackerman, T. P., Ferrell, W., Hickmon, N., and Ivey, M.: The ARM Mobile Facility, Meteor. Mon., 57, 9.1–9.15, https://doi.org/10.1175/AMSMONOGRAPHS-D-15-0051.1, 2016.
Min, Q., Joseph, E., and Duan, M.: Retrievals of thin cloud optical depth from a multifilter rotating shadowband radiometer, J. Geophys. Res., 109, D02201, https://doi.org/10.1029/2003JD003964, 2004.
Mok, J., Krotkov, N., Arola, A., Torres, O., Jethva, H., Andrade, M., Labow, G., Eck, T. F., Li, Z., Dickerson, R. R., Stenchikov, G. L., Osipov, S., Ren, X.: Impacts of brown carbon from biomass burning on surface UV and ozone photochemistry in the Amazon Basin, Sci. Rep.-UK, 6, 36940, https://doi.org/10.1038/srep36940, 2016.
Mok, J., Krotkov, N. A., Torres, O., Jethva, H., Li, Z., Kim, J., Koo, J.-H., Go, S., Irie, H., Labow, G., Eck, T. F., Holben, B. N., Herman, J., Loughman, R. P., Spinei, E., Lee, S. S., Khatri, P., and Campanelli, M.: Comparisons of spectral aerosol single scattering albedo in Seoul, South Korea, Atmos. Meas. Tech., 11, 2295–2311, https://doi.org/10.5194/amt-11-2295-2018, 2018.
Norgren, M. S., Wood, J., Schmidt, K. S., van Diedenhoven, B., Stamnes, S. A., Ziemba, L. D., Crosbie, E. C., Shook, M. A., Kittelman, A. S., LeBlanc, S. E., Broccardo, S., Freitag, S., and Reid, J. S.: Above-aircraft cirrus cloud and aerosol optical depth from hyperspectral irradiances measured by a total-diffuse radiometer, Atmos. Meas. Tech., 15, 1373–1394, https://doi.org/10.5194/amt-15-1373-2022, 2022.
Platnick, S., Meyer, K. G., King, M. D., Wind, G., Amarasinghe, N., Marchant, B., Arnold, G. T., Zhang, Z., Hubanks, P. A., Holz, R. E., Yang, P., Ridgway, W. L., and Riedi, J.: The MODIS cloud optical and microphysical products: Collection 6 updates and examples from Terra and Aqua, IEEE T. Geosci. Remote, 55, 502–525, https://doi.org/10.1109/tgrs.2016.2610522, 2017.
Puthukkudy, A., Martins, J. V., Remer, L. A., Xu, X., Dubovik, O., Litvinov, P., McBride, B., Burton, S., and Barbosa, H. M. J.: Retrieval of aerosol properties from Airborne Hyper-Angular Rainbow Polarimeter (AirHARP) observations during ACEPOL 2017, Atmos. Meas. Tech., 13, 5207–5236, https://doi.org/10.5194/amt-13-5207-2020, 2020.
Remer, L. A., Levy, R. C., and Martins, J. V.: Opinion: Aerosol remote sensing over the next 20 years, Atmos. Chem. Phys., 24, 2113–2127, https://doi.org/10.5194/acp-24-2113-2024, 2024.
Riihimaki, L. D., Flynn, C., McComiskey, A., Lubin, D., Blanchard, Y., Chiu, J. C., Feingold, G., Feldman, D. R., Gristey, J. J., Herrera, C., Hodges, H., Kassianov, E., LeBlanc, S. E., Marshak, A., Michalsky, J. J., Pilewskie, P., Schmidt, S., Scott, R. C., Shea, Y., Thome, K., Wagener, R., and Wielicki, B.: The shortwave spectral radiometer for atmospheric science: Capabilities and applications from the ARM user facility, B. Am. Meteorol. Soc., 102, E539–E554, https://doi.org/10.1175/BAMS-D-19-0227.1, 2021.
Russell, L. M., Lubin, D., Silber, I., Eloranta, E., Muelmenstaedt, J., Aiken, A., Wang, D., Petters, M., Miller, M., Ackerman, A., Fridlind, A., Witte, M., Lebsock, M., Painemal, D., Chang, R., Liggio, J., and Wheeler, M.: Eastern Pacific Cloud Aerosol Precipitation Experiment (EPCAPE) Science Plan, DOE/SC-ARM-21-009, U. S. Department of Energy, Office of Science, Office of Biological and Environmental Research, https://doi.org/10.2172/1804710, 2021.
Sayer, A. M., Smirnov, A., Hsu, N. C., Munchak, L. A., and Holben, B. N.: Estimating marine aerosol particle volume and number from Maritime Aerosol Network data, Atmos. Chem. Phys., 12, 8889–8909, https://doi.org/10.5194/acp-12-8889-2012, 2012.
Segal-Rosenheimer, M., P. B. Russell, J. M. Livingston, S. Ramachandran, J. Redemann, and Baum, B. A.: Retrieval of cirrus properties by Sun photometry: A new perspective on an old issue, J. Geophys. Res.-Atmos., 118, 4503–4520, https://doi.org/10.1002/jgrd.50185, 2013.
Shinozuka, Y., Johnson, R. R., Flynn, C. J., Russell, P. B., Schmid, B., Redemann, J., Dunagan, S. E., Kluzek, C. D., Hubbe, J. M., Segal-Rosenheimer, M., Livingston, J. M., Eck, T. F., Wagener, R., Gregory, L., Chand, D., Berg, L. K., Rogers, R. R., Ferrare, R. A., Hair, J. W., Hostetler, C. A., and Burton, S. P.: Hyperspectral aerosol optical depths from TCAP flights, J. Geophys. Res.-Atmos., 118, 12180–12194, https://doi.org/10.1002/2013jd020596, 2013.
Shippert, T. and Shilling, J.: Aerosol Optical Depth (AOD) Derived from MFRSR Measurements (MFRSR7NCHAOD1MICH), Atmospheric Radiation Measurement (ARM) user facility [data set], https://doi.org/10.5439/1756632, 2021.
Sisterson, D. L., Peppler, R. A., Cress, T. S., Lamb, P. J., and Turner, D. D.: In The Atmospheric Radiation Measurement (ARM) Program: The First 20 Years. The ARM Southern Great Plains (SGP) site, Meteor. Mon., 57, 6.1–6.14, https://doi.org/10.1175/AMSMONOGRAPHS-D-16-0004.1, 2016.
Torres, B. and Fuertes, D.: Characterization of aerosol size properties from measurements of spectral optical depth: a global validation of the GRASP-AOD code using long-term AERONET data, Atmos. Meas. Tech., 14, 4471–4506, https://doi.org/10.5194/amt-14-4471-2021, 2021.
Voigt, A., Albern, N., Ceppi, P., Grise, K., Li, Y., and Medeiros, B.: Clouds, radiation, and atmospheric circulation in the present-day climate and under climate change, WIREs Clim. Change, 12, e694, https://doi.org/10.1002/wcc.694, 2021.
Wesely, M.: Simplified techniques to study components of solar radiation under haze and clouds, J. Appl. Meteorol., 21, 373–383, 1982.
Yang, P., Bi, L., Baum, B. A., Liou, K.-N., Kattawar, G. W., Mishchenko, M. I., and Cole, B.: Spectrally consistent scattering, absorption, and polarization properties of atmospheric ice crystals at wavelengths from 0.2 to 100 µm, J. Atmos. Sci., 70, 330–347, https://doi.org/10.1175/JAS-D-12-039.1, 2013.