the Creative Commons Attribution 4.0 License.
the Creative Commons Attribution 4.0 License.
 | 03 Sep 2024
In situ observations of supercooled liquid water clouds over Dome C, Antarctica, by balloon-borne sondes
Pierre Durand
Paolo Grigioni
Massimo Del Guasta
Giuseppe Camporeale
Axel Roy
Jean-Luc Attié
John Bognar
Clouds in Antarctica are key elements that affect radiative forcing and thus Antarctic climate evolution. Although the vast majority of clouds are composed of ice crystals, a non-negligible fraction constitutes supercooled liquid water (SLW; water held in liquid form below 0 °C). Numerical weather prediction models have great difficulty in forecasting SLW clouds over Antarctica, favouring ice at the expense of liquid water and therefore incorrectly estimating the cloud radiative forcing. Remote-sensing observations of SLW clouds have been carried out for several years at Concordia Station (75° S, 123° E; 3233 m above mean sea level), combining active lidar measurements (SLW cloud detection) and passive HAMSTRAD microwave measurements (liquid water path, LWP). The present project aimed at in situ observations of SLW clouds using sondes developed by the company Anasphere, specifically designed for SLW content (SLWC) measurements. These SLWC sondes were coupled to standard meteorological pressure–temperature–humidity sondes from Vaisala and released under meteorological balloons. During the 2021–2022 summer campaign, 15 launches were made, of which 7 were scientifically exploitable above a height of 400 m above ground level, a threshold height imposed by the time the SLWC sonde takes to stabilize after launch. The three main outcomes from our analyses are as follows: (a) the first in situ observations so far of SLW clouds in Antarctica with SLWC sondes; (b) on average, the consistency of SLW cloud heights as observed by in situ sondes and remote-sensing lidar; and (c) the liquid water path (vertically integrated SLWC) deduced by the sondes being generally equal to or greater than the LWP remotely sensed by HAMSTRAD. In general, the SLW clouds were observed in a layer close to saturation (U > 80 %) or saturated (U ∼ 100 %–105 %) just below or at the lowermost part of the entrainment zone, or capping inversion zone, which exists at the top of the planetary boundary layer and is characterized by an inflection point in the potential temperature vertical profile. Our results are consistent with the theoretical view that SLW clouds form and remain at the top of the planetary boundary layer.
- Article
(8457 KB) - Full-text XML
-
Supplement
(6030 KB) - BibTeX
- EndNote


Clouds in Antarctica are key parameters that affect the Earth radiative balance, thus affecting the climate evolution over Antarctica but also over the Earth through complex teleconnections (Lubin et al., 1998). The nature of the clouds (ice, liquid, or mixed-phase – a mixture of liquid and solid water) and their vertical distributions, together with their interactions with aerosols, add complexity to this topic. Numerical simulations at local or global scales, focused on short timescales or climate evolution, show large differences between clouds located above the Southern Ocean, West Antarctica, and particularly the Antarctic Peninsula, the eastern Antarctic Plateau, and in fine Antarctic coastal areas (see e.g. Fogt and Bromwich, 2008). In general, ice clouds are relatively well estimated by weather models, while supercooled liquid water (SLW; water held in liquid form below 0 °C) clouds tend to be underestimated because the water partition function favours the solid phase instead of the liquid phase for temperatures less than 0 °C (see e.g. Ricaud et al., 2020). This flaw is rather observed in global-scale models but could be reduced in models that include a detailed microphysics scheme (e.g. Engdahl et al., 2020). Therefore, the impact of the clouds on the net surface radiation, the so-called cloud radiative forcing, which strongly depends on the nature of the cloud, is usually underestimated by 5–30 W m−2 in models that favour ice clouds instead of SLW clouds (King et al., 2006, 2015; Bromwich et al., 2013; Lawson and Gettelman, 2014; Listowski and Lachlan-Cope, 2017; Young et al., 2019). From observations and climate models, it appears that, in Antarctica, the liquid water path (LWP), which is the vertically integrated SLW content (SLWC), is on average less than 10 g m−2, with slightly larger values in summer than in winter by 2–5 g m−2 (Lenaerts et al., 2017). On the other hand, in the Arctic, values greater than 50 g m−2 were reported (Lemus et al., 1997; Zhang et al., 2019), and, at middle and tropical latitudes, values ranging 100–150 g m−2 were measured and simulated (Lemus et al., 1997).
In parallel, cloud observations over Antarctica are difficult because of the very small number of ground stations, which are preferably located near the coast – the only three that are open all year long are located far inland. This is the reason why space-borne measurements are paramount to classify clouds over the entire continent as a function of height, nature, and time. It is now clearly accepted that SLW clouds are much more abundant near the coast than on the inner continent (Bromwich et al., 2012; Listowski et al., 2019), with larger ice crystals and water droplets (Lachlan-Cope, 2010; Lachlan-Cope et al., 2016; Grosvenor et al., 2012; O'Shea et al., 2017; Grazioli et al., 2017), and that the cloud radiative forcing is at its maximum over the Antarctic Peninsula, with values reaching 40 W m−2 (Ricaud et al., 2024). In addition to this continent-scale information provided by satellites, it is crucial to obtain information at the local scale from remote and/or in situ observations. Remote observations of SLW and mixed-phase clouds are usually performed by means of backscattered lidars and ceilometers, while in situ observations have been performed over the Southern Ocean (Chubb et al., 2013), West Antarctica (Grosvenor et al., 2012; Lachlan-Cope et al., 2016), and coastal areas (O'Shea et al., 2017) using instruments on board aircraft.
At Concordia Station, several studies from remote-sensed observations have already taken place to evaluate (1) the presence of the SLW and mixed-phase clouds over the station mainly based on a backscattered lidar (Cossich et al., 2021), (2) the amount of LWP within SLW clouds (Ricaud et al., 2020), (3) the impact of SLW clouds on the net surface radiation (Ricaud et al., 2020), (4) the differences between observations and model simulations of SLW clouds (Ricaud et al., 2020), (5) the relationship between in-cloud temperature and LWP (Ricaud et al., 2024), and (6) the relationship between LWP and cloud radiative forcing (Ricaud et al., 2024). In general, SLW clouds are preferably observed in summer with very small LWPs (< 10 g m−2), in-cloud temperatures ranging from −20 to −38 °C, and a cloud radiative forcing up to a maximum value of 40 W m−2 (Ricaud et al., 2024).
We have thus proposed a new project to observe SLW clouds in situ at Concordia, based on the use of a sonde developed by Anasphere and especially designed for the detection of this type of cloud. During the summer campaign 2021–2022, the SLWC sonde was connected to a standard Vaisala pressure–temperature–humidity (PTU) sonde and embarked under an ascending balloon, while, during the summer campaign 2022–2023, the two coupled sondes were installed on board a vertical take-off and landing (VTOL) drone. Numerous SLW clouds were present during the 2021–2022 campaign, while, in 2022–2023, they were very scarce over the station, with a net consequence that only vertical profiles of temperature and relative humidity were measured (Ricaud et al., 2023).
The aim of the present study was to perform, for the first time, in situ observations of SLW clouds above Concordia Station during the summer campaign 2021–2022. For the validation and interpretation of the data, we relied on the observations performed by (1) the backscatter lidar installed at the station for more than 10 years to characterize the nature of the clouds (ice, liquid or mixed-phase) and their height and (2) the LWPs measured by the HAMSTRAD microwave radiometer set up at the station in 2009.
The article is structured as follows. The instruments are presented in Sect. 2. The methodology is explained in Sect. 3. The results of the campaign are presented in Sect. 4 before being synthesized and discussed in Sect. 5. A conclusion finalizes the findings in Sect. 6. Note that all the observations performed during the summer campaign are presented in a companion document as the Supplement.
In addition to the Vaisala PTU and Anasphere SLWC sondes attached to the meteorological balloons, we used observations from two other instruments installed at Concordia Station for several years, namely the backscatter lidar to classify the cloud as an SLW cloud and the HAMSTRAD microwave radiometer to obtain the LWP.
2.1 PTU sondes
The PTU sondes used during the 2021–2022 summer campaign were standard Vaisala RS41 SGP sondes (an upgraded version of Vaisala's RS92 radiosondes), which are now used daily at Concordia to obtain operational temperature and humidity vertical profiles at 12:00 UTC. The sondes were attached to the balloon with a string either unwound before launching (and with a length L = 20 or 40 m) or wound on an unwinder. We systematically used a parachute to obtain vertical profiles in both the ascending and descending phases.
2.2 SLWC sondes
Anasphere's vibrating-wire sonde records a vibrating wire's frequency as ice accumulates along its length (Serke et al., 2014). When the SLW reaches the wire, liquid droplets are instantly converted to ice. These frequency measurements, combined with co-located meteorological measurements, can be used to determine the SLWC of the surrounding air. The SLWC sonde actually measures the frequency of the vibrating wire. Since this frequency f varies according to the change in mass of the wire, its derivative with respect to time df/dt can be used to calculate the SLWC collected by the wire. From Dexheimer et al. (2019), the SLWC (g m−3) is estimated to be
where ε is the droplet collection efficiency (∼ 0.9), D is the wire diameter including the hydrophilic gel (0.762 × 10⁻³ m), b0 is the vibrating-wire mass per unit length including the hydrophilic gel (2.24 g m−1), ω is the velocity of air relative to the wire (∼ 5 m s−1), and f0 is the un-iced wire frequency in Hertz ranging from 21.50 to 22.50 Hz during the campaign. f typically ranges from 20.0 to 22.85 Hz during the campaign. Note that ω is given, irrespective of its direction (upward, downward, etc.). During the ascending phase, given that the balloon has an upward buoyancy, it always rises with respect to the air parcel it is in. The nominal operation of the SLWC sonde requires that it works well with an air flow of about 5 m s−1. This is the reason why the balloon pressure is set up for an average ascending rate (with respect to the ground) of ∼ 5 m s−1. During the descending phase, after the balloon has burst, the sonde falls with a parachute with a downward buoyancy and a downward velocity relative to the air parcel of about 5–6 m s−1. The ascending rate typically ranged 4.0–6.0 m s−1 during our launches performed at Concordia, so we can associate to ω an error (variability) on the order of ±1.0 m s−1. This impacts the SLWC calculation by ±3 %. The droplet collection efficiency ε depends on the median droplet diameter d considered. In Dexheimer et al. (2019), values of 11, 16, and 20 µm, based on Lozowski et al. (1983) and Bain and Gayet (1982), were used to calculate the SLWC. A median droplet diameter of d = 16 µm resulted in a collection efficiency greater than 0.9. This later value was finally given, since it provided the lower estimate of SLWC in all observations performed in the Arctic. We thus also used an efficiency of 0.9 in our study. The sensitivity of ε to the median droplet diameter d was thus investigated. For d varying from 11 to 20 µm, SLWC varies by ±12 %.
The output signal of the sonde is connected to the Vaisala radiosonde, which transmits the data to the ground station via telemetry. The observations of the two sondes are thus synchronized. The integration time is 5 s, thus providing an observation every ∼ 25 m along the vertical. We applied a four-point running average to all our observations. This means that our vertical profiles, even sampled every ∼ 25 m, are not able to describe the variations for scales lower than 100 m. Since it takes about 60–80 s from launch for the SLWC sonde to stabilize, the minimum height for meaningful observations is ∼ 300–400 m above ground level (a.g.l.), below which we are unable to detect any SLW cloud. Note that, in the following, all heights are given in a.g.l.
2.3 Lidar
The tropospheric depolarization backscatter lidar (532 nm) has been operating at Dome C since 2008 (see http://lidarmax.altervista.org/lidar/Antarctic LIDAR.php, last access: 27 August 2024). The lidar provides 5 min tropospheric profiles of aerosols and clouds continuously, from 20 to 7000 m, with a resolution of 7.5 m. Lidar depolarization (Mishchenko et al., 2000) is a robust indicator of non-spherical shape for randomly oriented cloud particles. A depolarization ratio below 10 % is characteristic of SLW clouds, while higher values are produced by ice particles. The potential ambiguity between SLW cloud and oriented ice plates is avoided at Dome C by operating the lidar 4° off-zenith (Hogan and Illingworth, 2003).
2.4 HAMSTRAD
HAMSTRAD is a microwave radiometer that profiles water vapour and tropospheric temperature together with LWP above Dome C. Measuring at both 60 GHz (oxygen molecule line (O2) to derive the temperature) and 183 GHz (H2O line), the radiometer was installed on site for the first time in January 2009 (Ricaud et al., 2010). Measurements from the HAMSTRAD radiometer allow the retrieval of vertical profiles of water vapour and temperature from the ground to 10 km altitude with vertical resolutions of 30 to 50 m in the planetary boundary layer (PBL), 100 m in the lower free troposphere, and 500 m in the upper troposphere–lower stratosphere. The LWP (g m−2) can also be estimated. The time resolution is adjustable and has been fixed at 60 s since 2018. Note that an automated internal calibration is performed every 12 atmospheric observations and takes about 4 min. Consequently, the atmospheric time sampling is 60 s for a sequence of 12 profiles, and a new sequence starts 4 min after the end of the previous one. The temporal resolution of the instrument allows the detection of clouds and diamond dust (Ricaud et al., 2017) together with the SLW clouds (Ricaud et al., 2020). The 2021–2022 and the 2022–2023 summer campaigns were dedicated to in situ observations of SLW clouds using balloons and a drone (Ricaud et al., 2023), respectively. Comparisons with numerical weather prediction (NWP) models showed consistent amounts of LWP at Dome C when the ice–liquid water partition function favours SLW for temperatures below 0 °C (Ricaud et al., 2020).
In order to optimize in situ SLW cloud observations, we developed the following procedure. (1) The remotely sensed and real-time observations of clouds (ice crystals and SLW) from the lidar were checked regularly. (2) When the presence of SLW was verified, we checked the value of LWP from HAMSTRAD. An empirical value of LWP0 = 1.0 g m−2 was estimated as the threshold above which an SLW cloud is regarded as significant. For LWP < LWP0, either the amount of liquid water in the cloud was too low or the SLW cloud was too scattered. (3) If the above two conditions were fulfilled for more than 2 h, we started the connection and calibration process of the two sondes (PTU and SLWC) via the Vaisala DigiCORA station inside Concordia Station. Then, we went outside and inflated the meteorological balloon. Finally, we launched the two sondes attached to the balloon using either an unwinder or an unwound string (Fig. 1). In total, step (3) lasted about 1 h. As we used standard meteorological balloons (Totex TA100), we were able to probe the atmosphere from the surface up to about 12–13 km height (ascent and descent) for a total duration of about 1 h and 40 min. Since the tropopause height ranges 7–8 km and we were only interested in the first 2 km where the SLW clouds are located, only 2 %–5 % of the observations made were scientifically sound for our project. This is the main reason why we used a drone during the next campaign 2022–2023 to detect SLW clouds in the PBL (Ricaud et al., 2023). Note that, since there was only one Vaisala DigiCORA station for both our project and the operational meteorological sounding at 12:00 UTC, we could not use the time window between 09:00 and 14:00 UTC for our studies.
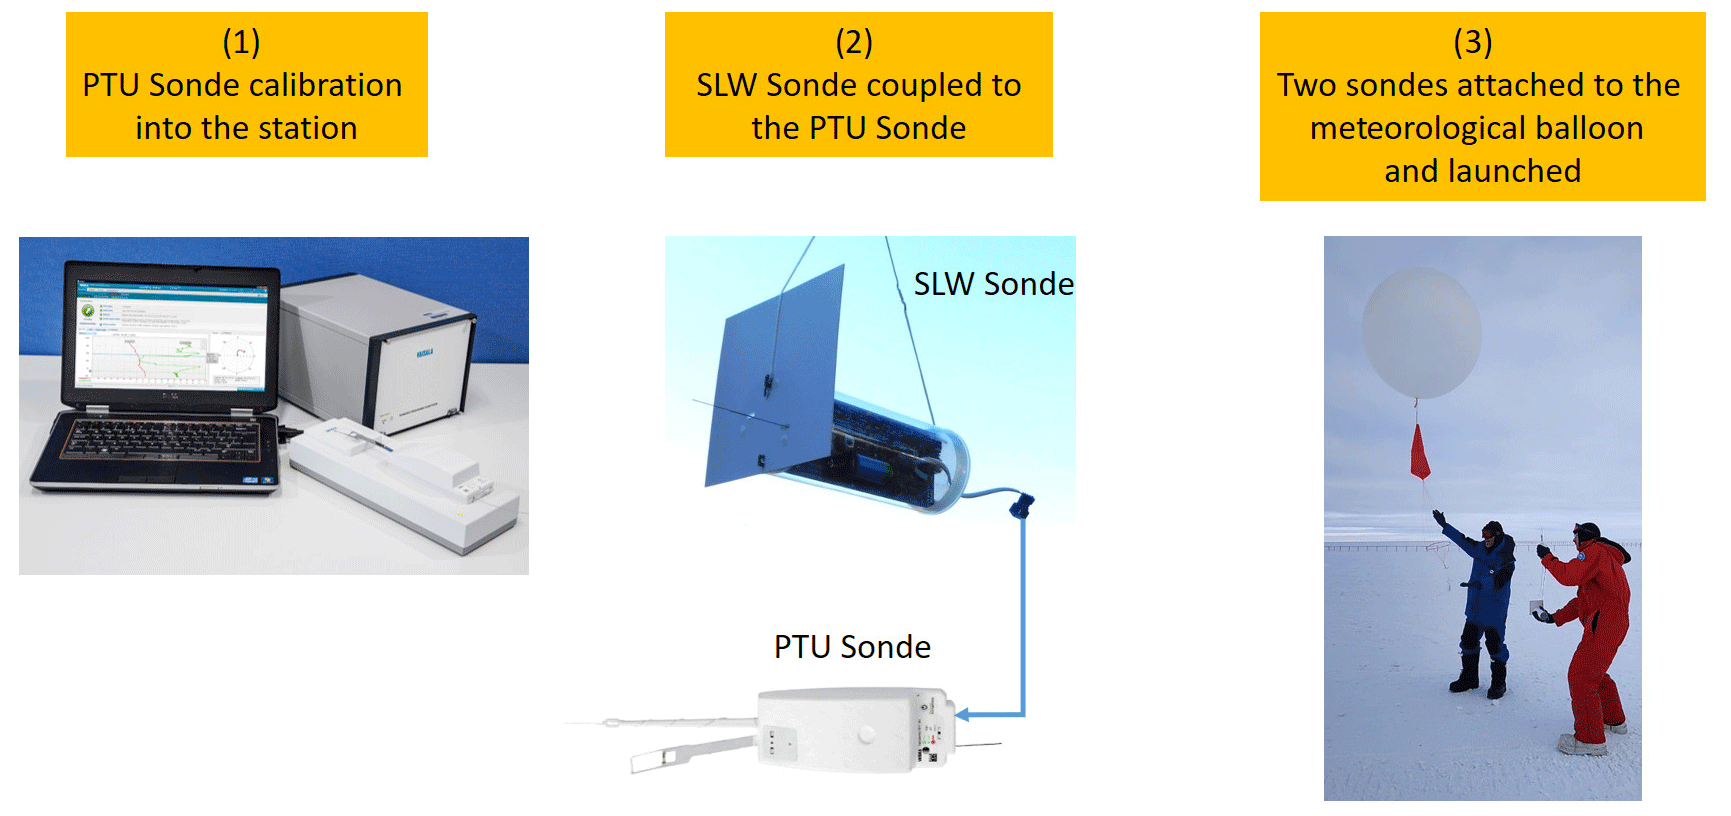
Figure 1The methodology employed to launch the SLWC sonde with meteorological balloons is synthesized as follows. (1) The Vaisala PTU sondes are calibrated in the quiet building of Concordia Station at room temperature using the standard DigiCORA system. (2) The SLWC sonde is connected to the PTU sonde at room temperature and is then transported outdoors to the meteorological shelter. The two sondes are attached to the meteorological balloon after inflation of the balloon. (3) Then, after leaving the shelter, one scientist maintains the SLWC sonde in their hands while another one maintains both the meteorological balloon and the PTU sonde. When the meteorological and technical conditions are optimized, the balloon is launched. The picture on the right represents the launch of a Vaisala PTU sonde (in the left hand of the person in blue) and an Anasphere SLWC sonde (in the right hand of the person in red) attached to the Totex TA100 meteorological balloon, together with the red parachute and the unwinder for the first flight on 22 December 2021.
In general (see e.g. Ricaud et al., 2020), SLW clouds are usually capped by a thin temperature inversion and a decrease from high relative humidity U (> 80 %). As this inversion layer separates two layers where temperature decreases with height, it contains an inflection point in the temperature (or potential temperature) profile, the height H (Tinf) of which can be used as the top of the atmospheric boundary layer with its capping SLW cloud layer. Such a definition based on the height of the inflection point is frequently used for the determination of the boundary-layer thickness (Hennemuth and Lammert, 2006). Consistent with this definition, Ricaud et al. (2020), adapted from Stull (2012), divided the potential temperature profiles separating the diurnal variation of the top of the planetary boundary layer into two phases: (1) the entrainment zone at the top of the mixed layer where the SLW cloud develops and (2) the capping inversion zone under which the SLW cloud still persists at the top of the residual quasi-mixed layer. The vertical limits of these two layers are well defined by the height of the inflection points H(θinf). In the following, we use information from profiles of the potential temperature θ (K) defined as
where T is the temperature (K), P is the pressure (hPa), P0 is the reference pressure (1000 hPa), R is the gas constant of air (J kg−1 K−1), and Cp is the heat capacity at constant pressure (J kg−1 K−1). is taken as 0.286. We characterize inflection-point heights H(θinf) in the potential temperature vertical profiles when the second derivatives in θ with respect to the height z (d2θ/dz2) are greater than an empirical threshold value typically varying from 1.5 × 10⁻⁴ to 4.0 × 10⁻⁴ K m−2.
4.1 Period of study
The balloon-borne observations of SLW clouds were carried out during the 2021–2022 summer campaign at Concordia. A total of 15 launches were performed from 21 December 2021 to 28 January 2022 (labelled from L01 to L15, respectively). With the exception of 17 January 2022 (L11), when observations were made to check the behaviour of the SLWC sondes in cloud-free conditions, all launches were made when an SLW cloud was detected for more than 2 h with the lidar observations using the depolarization method described in Sect. 2.3.
Table 1 lists all the launches that were scientifically exploitable in ascending mode, descending mode, or both modes, while Table 2 lists the two scientifically exploitable launches in cloud-free conditions. In order to avoid listing a catalogue of observations, we chose only to show details and figures relative to the launches performed on 25 December 2021 and on 17 January 2022 (cloud-free period). Nevertheless, the SLWC vertical profiles calculated for all the flights are shown and discussed in the forthcoming sections. The information regarding all the scientifically exploitable flights is presented in the Supplement. This encompasses (1) the LWP values from HAMSTRAD and the height range of the SLW clouds from the lidar over 1 d; (2) the profiles of temperature, potential temperature, and relative humidity measured by the PTU sonde during the flights; and (3) the profile of the SLWC sonde frequency f, the derivative of the frequency with respect to time t (df/dt), and the calculated SLWC during the flights.
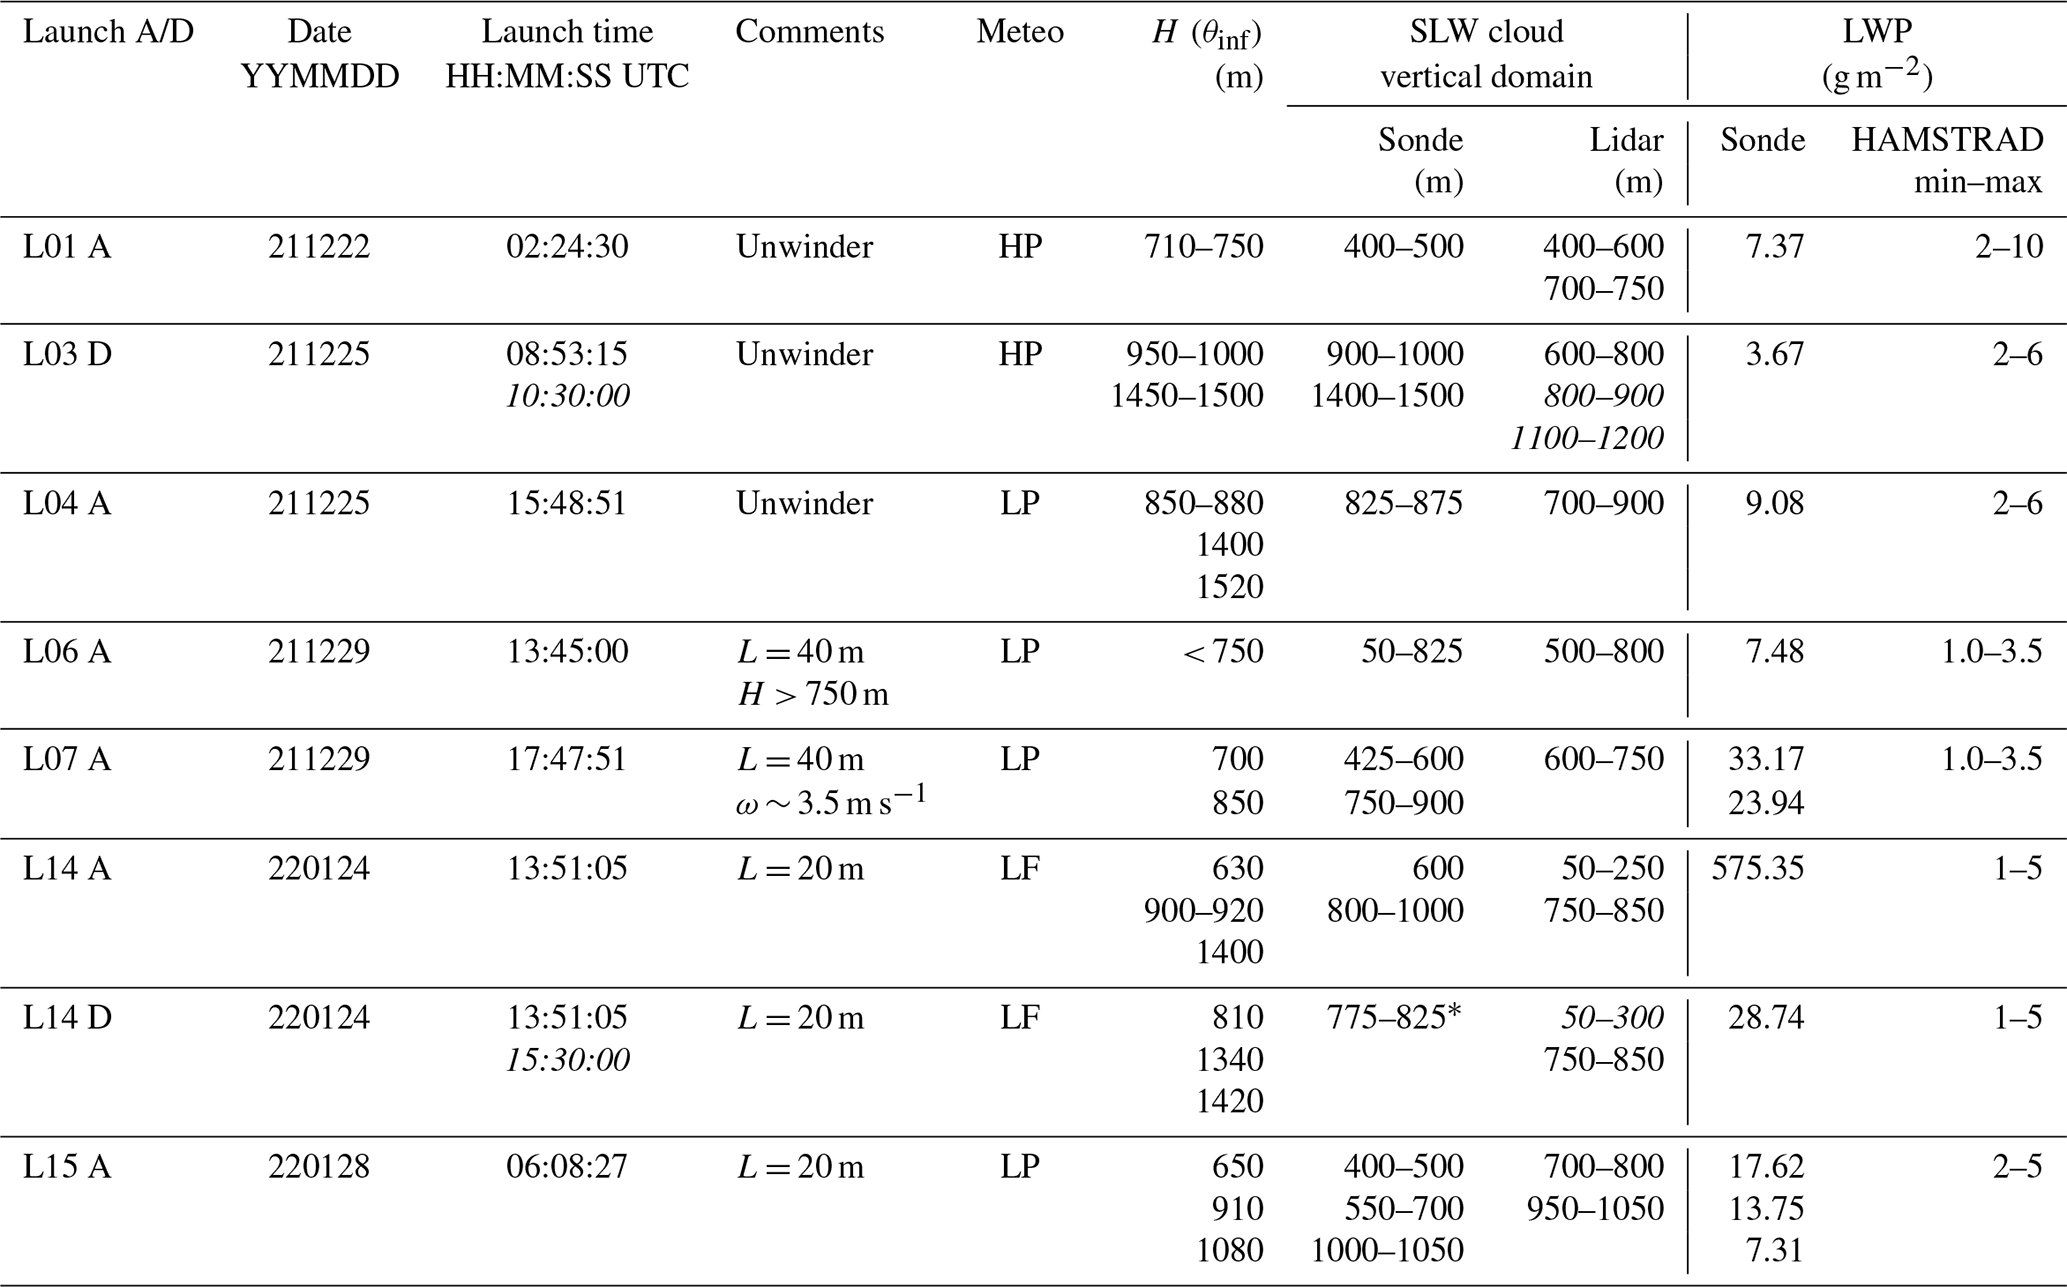
Table 1List of SLW cloud flights performed during the 2021–2022 season over Concordia, together with the date, the launch time (UTC), and the time (UTC) when the balloon hits the ground after the descent (in italics), along with the SLW cloud vertical range (m) and associated LWP (g m−2) in the ascending (A) or descending (D) phase (considering only SLWC sonde observations above 400 m a.g.l.). Also shown is the SLW cloud vertical range (m) observed by the lidar in time coincidence within ±1 h, with the flight in ascending phase and in descending phase (italics). Also presented is the minimum–maximum LWP (g m−2) measured by HAMSTRAD for the same date over 24 h. Also included are the heights (m) of the inflection point in the vertical profile of potential temperature H (θinf) and information on the type of string used (unwinder or unwound string of length L), on the velocity ω when it departs significantly from the nominal value of 5 m s−1, and on surface liquid fog when present. Heights are always given in metres a.g.l. Meteorological conditions (Meteo) are encountered and synthesized as heavy precipitation (HP), light precipitation (LP), and liquid fog (LF).
* Most intense spike.
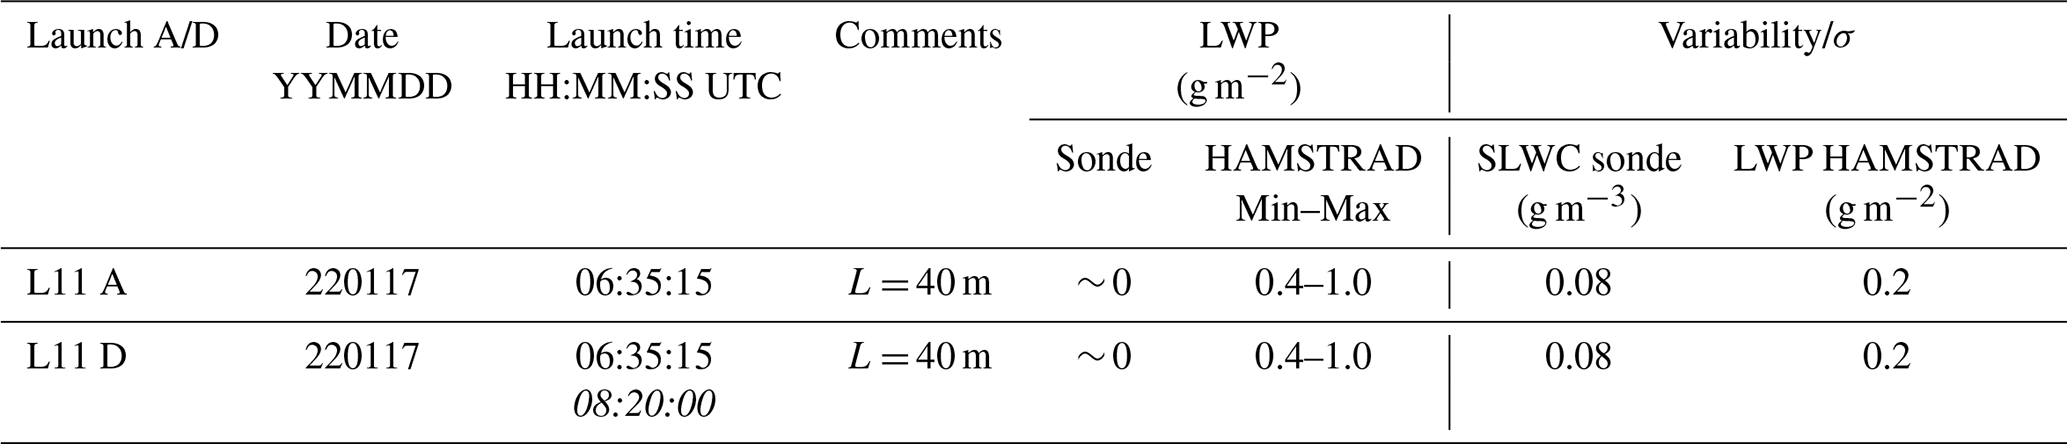
Table 2L11 performed in cloud-free conditions during the 2021–2022 season over Concordia, together with the date, the launch time (UTC), and the time (UTC) when the balloon hits the ground after the descent (in italics), in ascending (A) or descending (D) phase. Also presented are the LWP calculated from SLWC sonde observations, the minimum–maximum LWP (g m−2) measured by HAMSTRAD for the same date over 24 h, the variability σ of the SLWC as calculated from the SLWC sonde observations (g m−3), and the LWP as calculated from the HAMSTRAD observations (g m−2). Information on the type of string used (unwinder or unwound string of length L) is also provided.
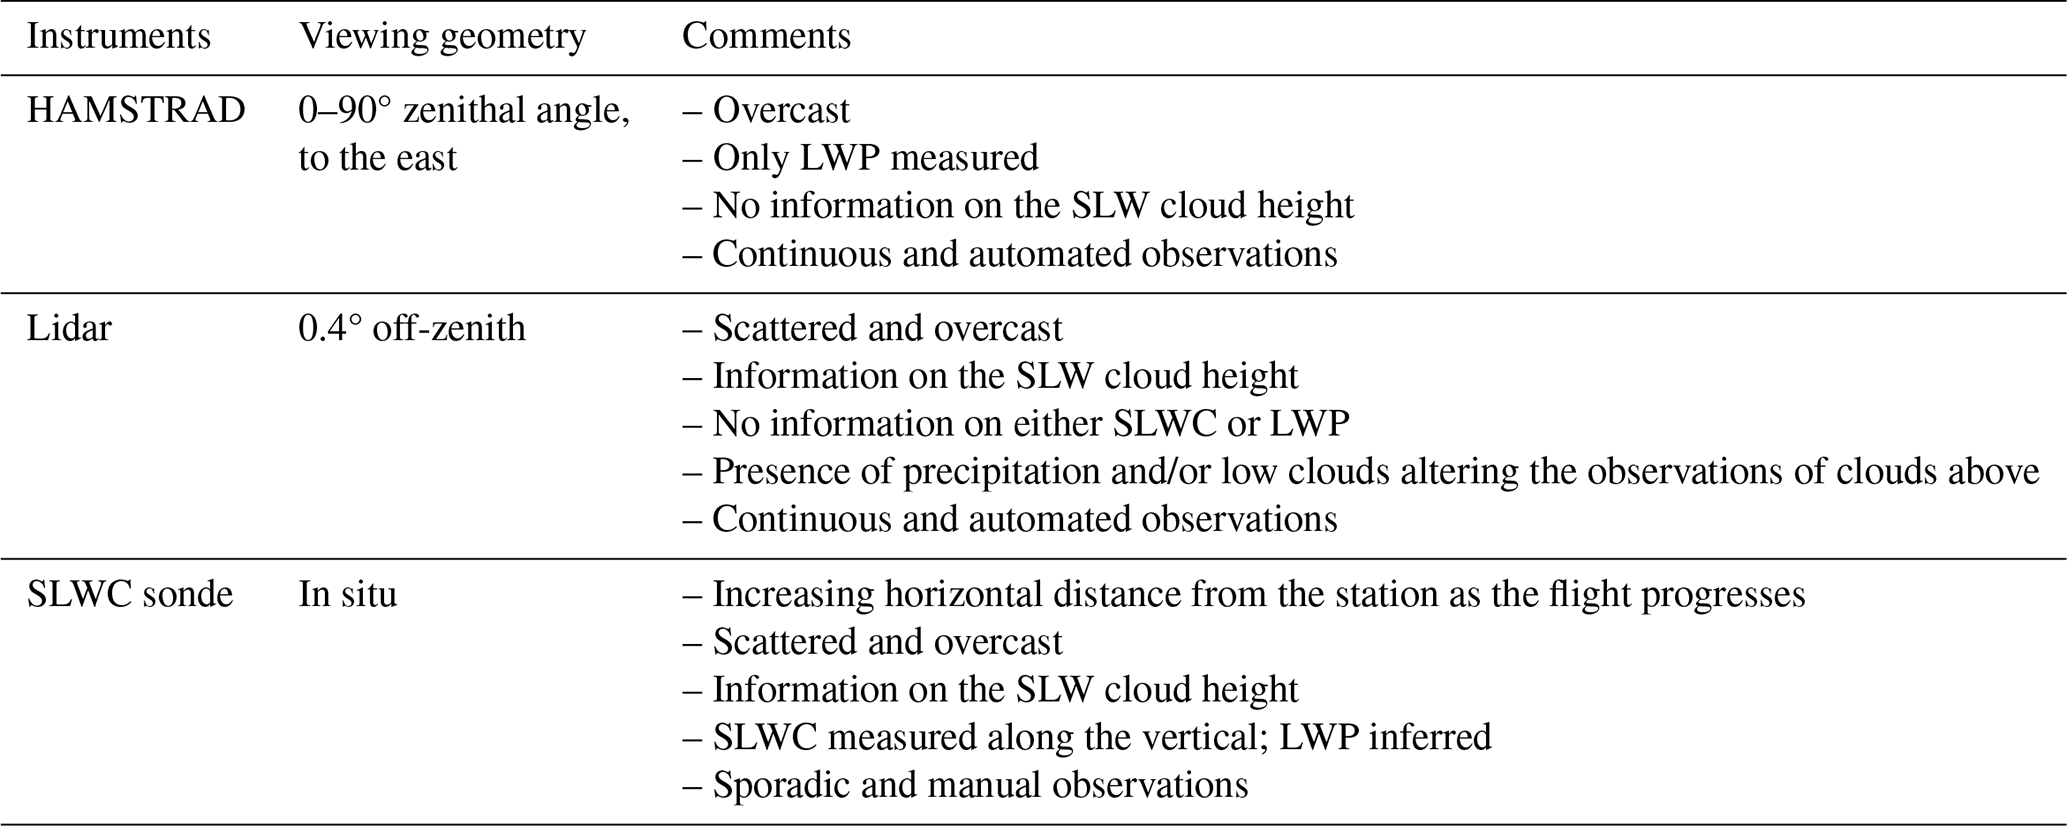
It is interesting to note that, because of their operating modes, the three instruments we used provide different information on the SLW clouds, which we have synthesized in Table 3. Because the microwave radiometer scans the atmosphere from a 0 to 90° zenithal angle to the east, only overcast clouds and associated LWP can be measured, with no information on the SLW cloud height. The lidar with 0.4° off-zenith observations is able to detect scattered and overcast SLW clouds, together with cloud height, with no information on the SLWC or LWP but with some limitations in the presence of precipitation and/or low clouds (e.g. liquid fog) that can alter the observations of cloud above. Finally, the SLWC sonde measures in situ SLW clouds, thus scattered or overcast clouds together with their heights with information on SLWC (thus LWP by vertically integrating SLWC), but there is an increasing horizontal distance from the station as the flight progresses.
Table 3Description of the viewing geometry and comments relative to each instrument used in our analysis: HAMSTRAD, lidar, and SLWC sonde.
4.2 Launches on 25 December 2021
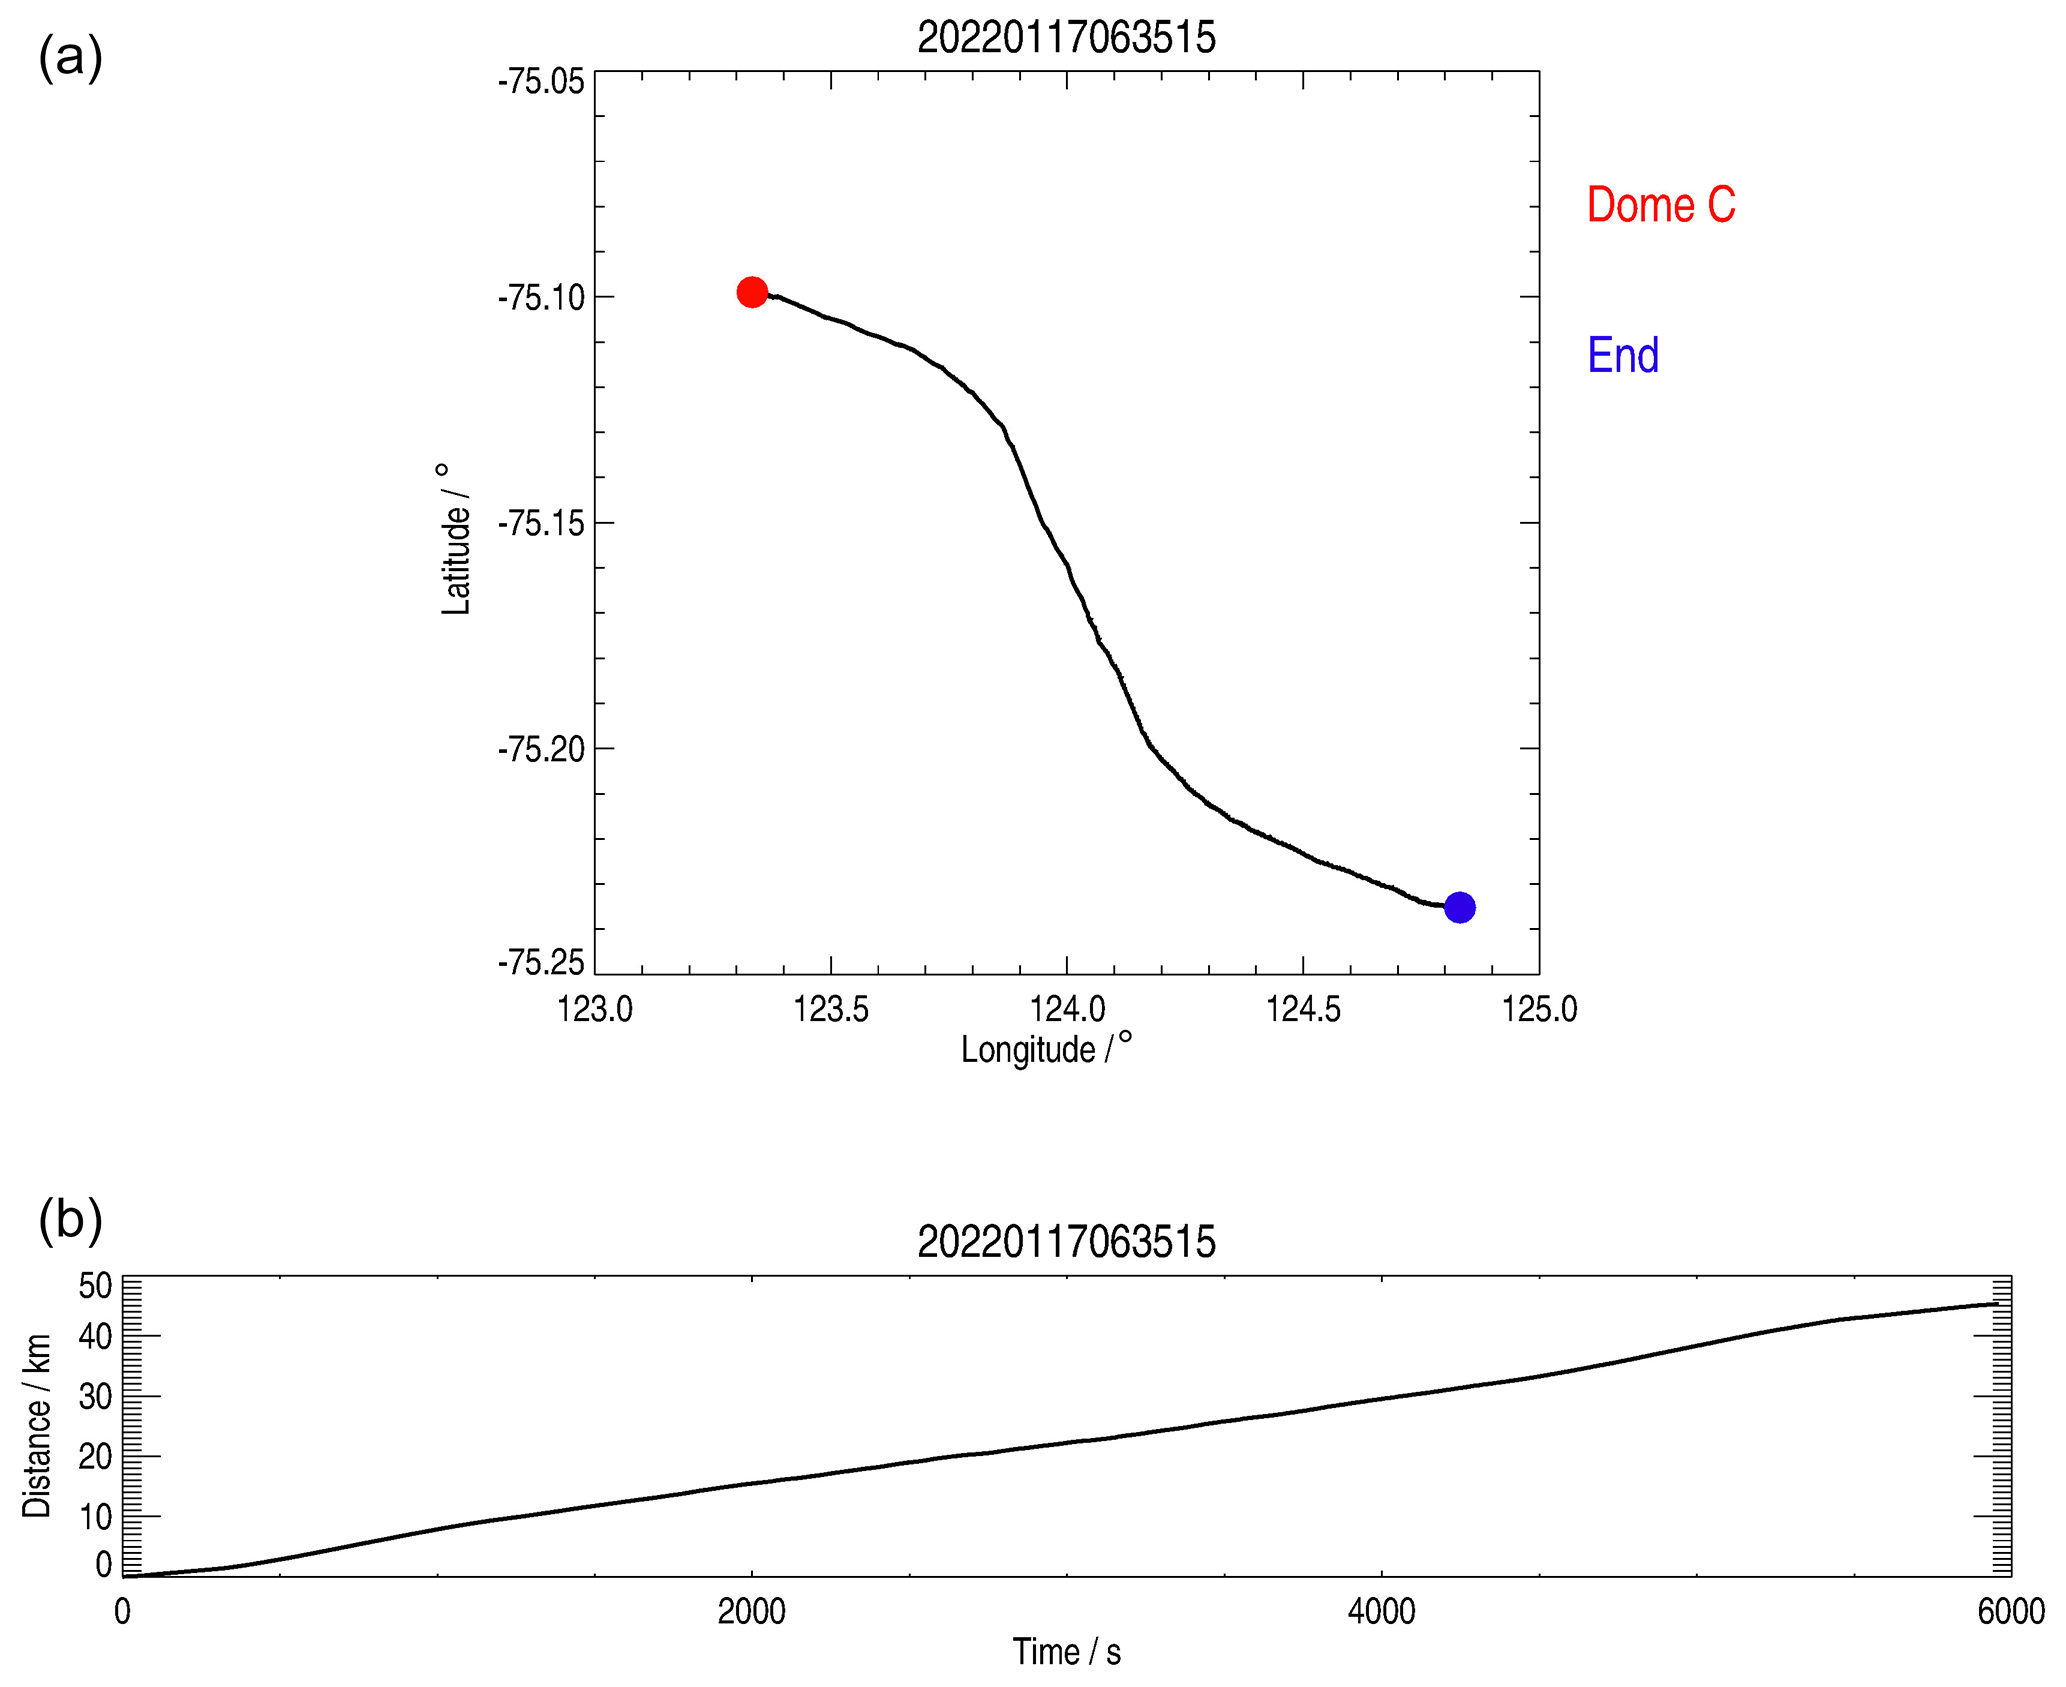
On 25 December 2021, SLW clouds observed by lidar were almost continuously present over Concordia from 00:00 to 19:00 UTC (Fig. 2). Two launches were performed at 08:53:15 (L03) and 15:48:51 UTC (L04), from which we ascertained the descending and ascending phases, respectively. For 2 h before the first launch, SLW clouds were observed by the lidar between 500 and 700 m, and, during the flight, the SLW clouds were located between 600 and 800 m, while approximately 2 h after the flight (when the sondes hit the ground in the descending phase) the SLW clouds were located at 800–900 and 1100–1200 m (see also Table 1). Regarding the second flight, for 2 h before the flight, SLW clouds were observed by the lidar between 700 and 1000 m and around 700–900 m during the flight. The first launch was associated with HAMSTRAD-observed LWP values of 1.5–6.0 g m−2, whereas, for the second flight, they were in the range of 1.5–3.0 g m−2. Note that, when the sondes reached the ground at the end of the first launch, the balloon had travelled a distance of about 70 km from Concordia Station after a flight time of 1 h 40 min (Fig. 3).
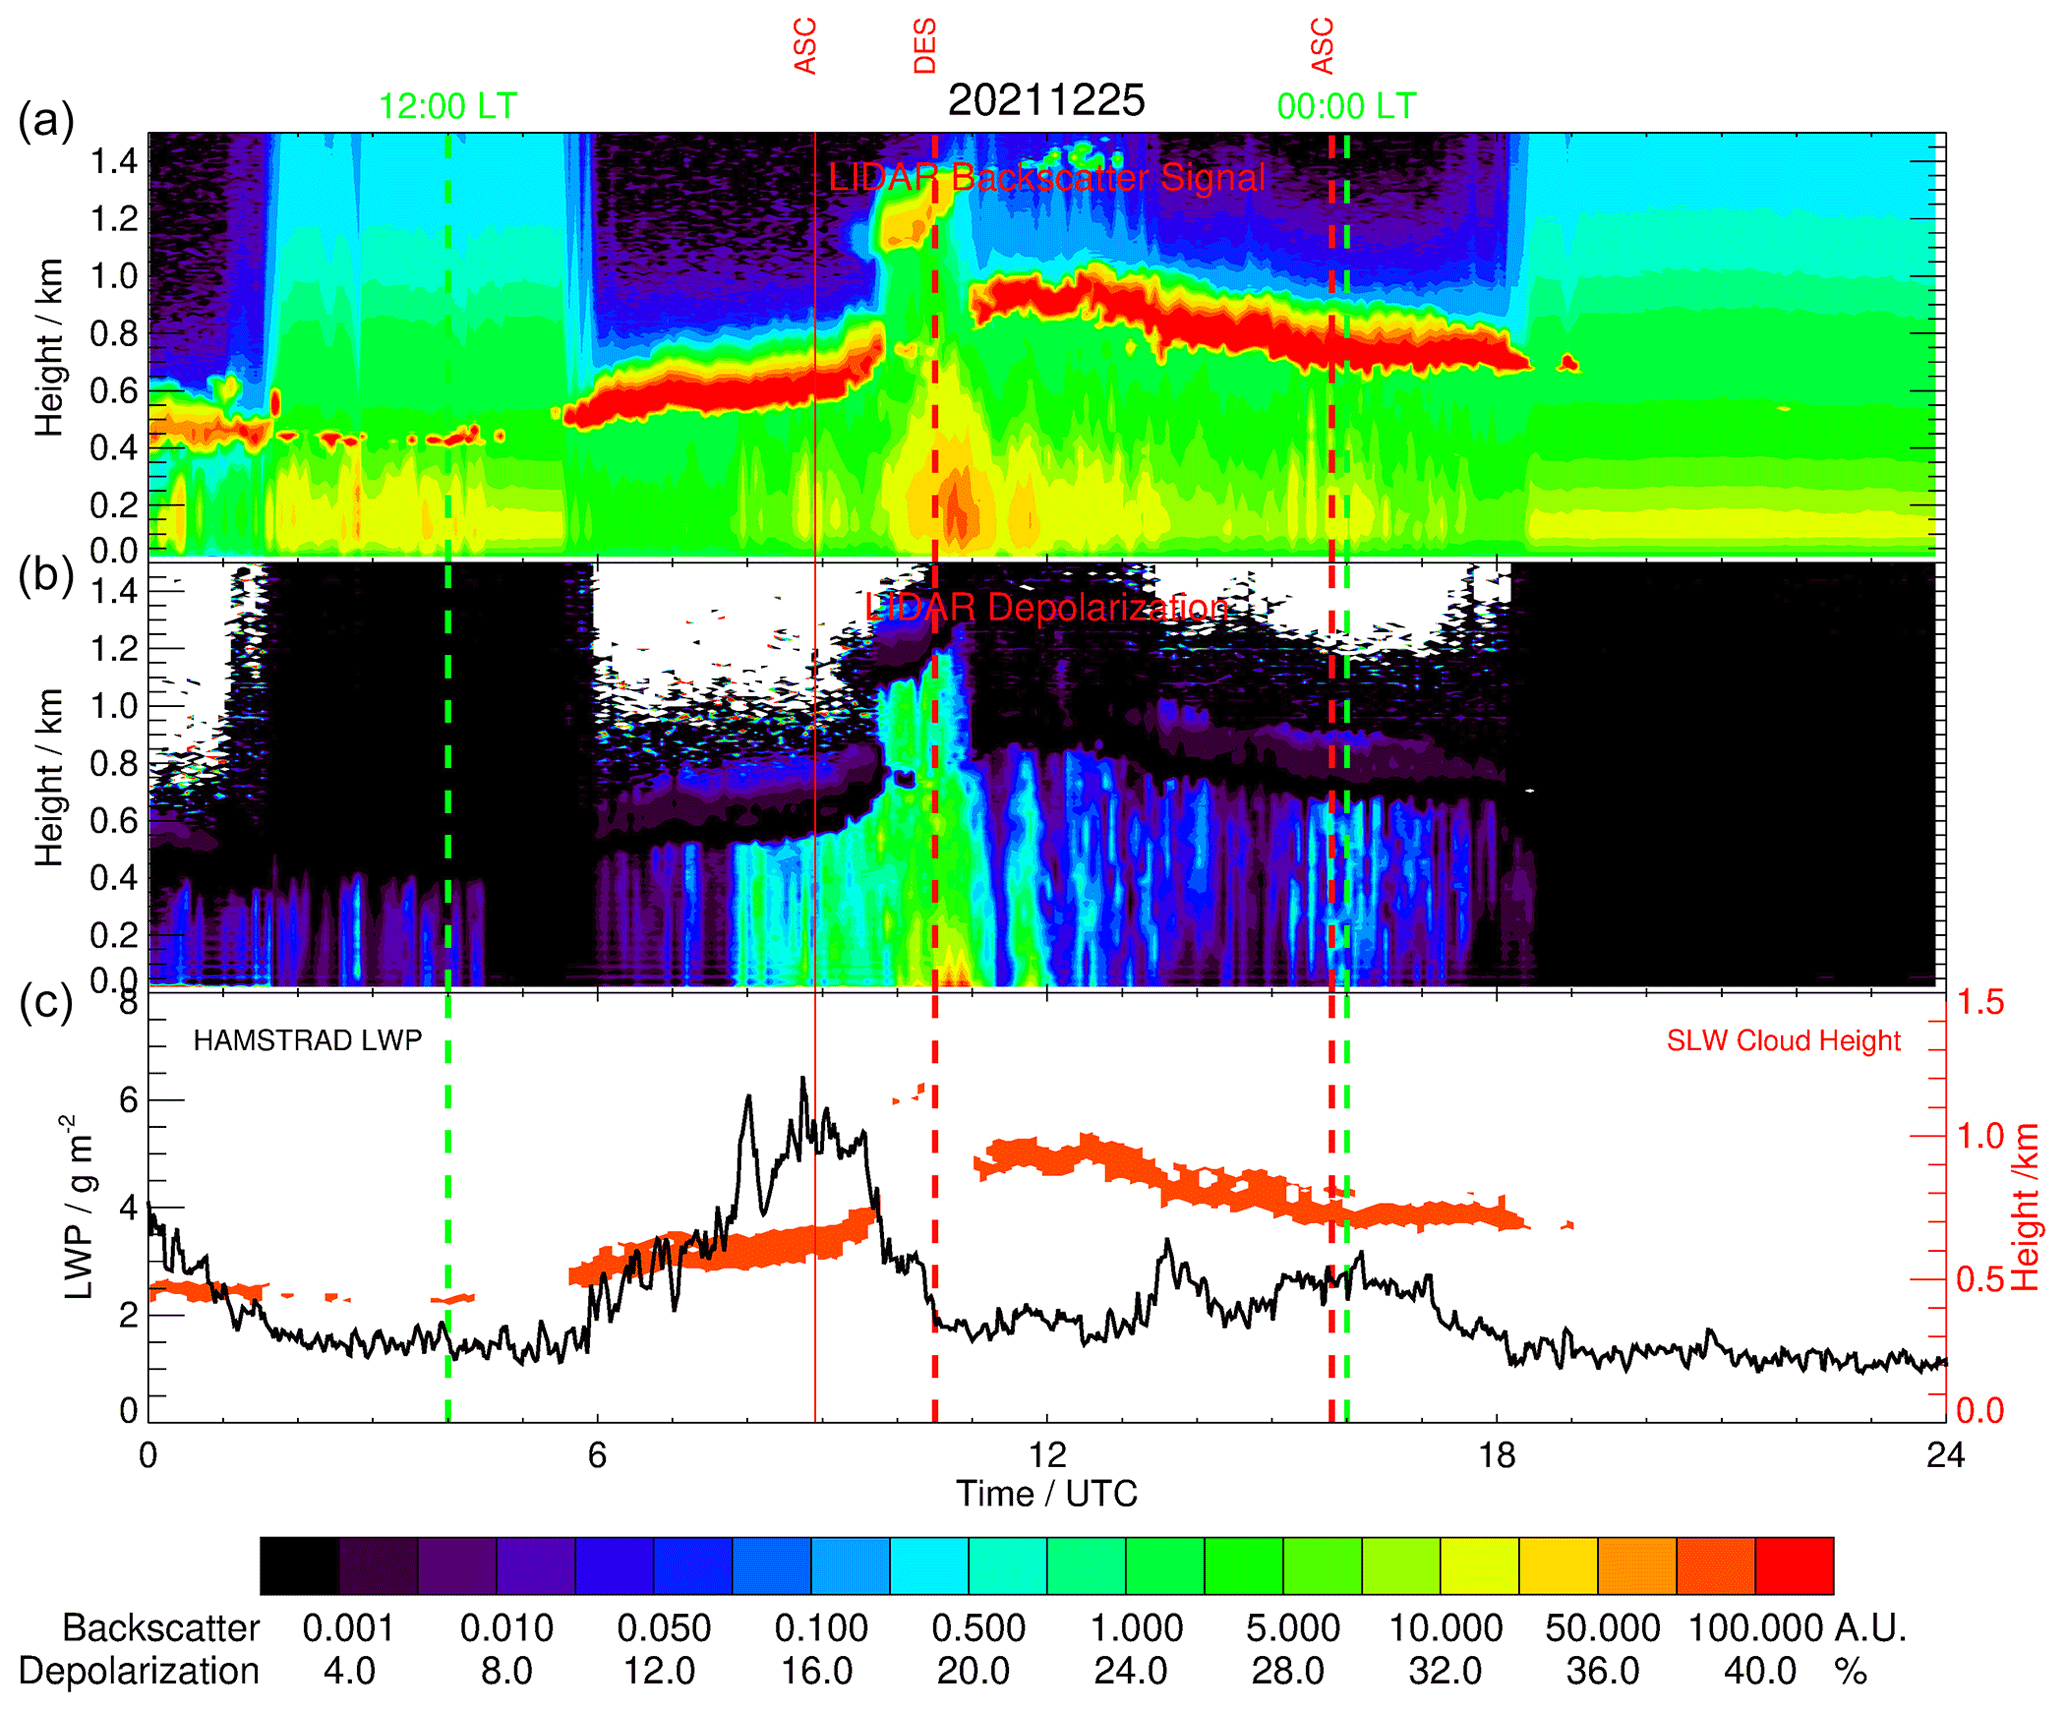
Figure 2Diurnal variation on 25 December 2021 (UTC) along the vertical of (a) the backscatter signal (A.U.: arbitrary unit), (b) the depolarization ratio (%) measured by the lidar, and (c) the liquid water path (LWP) measured by HAMSTRAD (g m−2; solid black line) superimposed with the SLW cloud thickness (red area) derived from the lidar observations (red y axis on the right). Two dashed green vertical lines indicate 12:00 and 00:00 UTC. The thick dashed red vertical lines indicate the time when balloon observations with SLWC sondes were performed in ascending (ASC) or descending (DES) phase, while the thin solid red vertical line (if any) indicates the launch time corresponding to the observations in the descending phase.
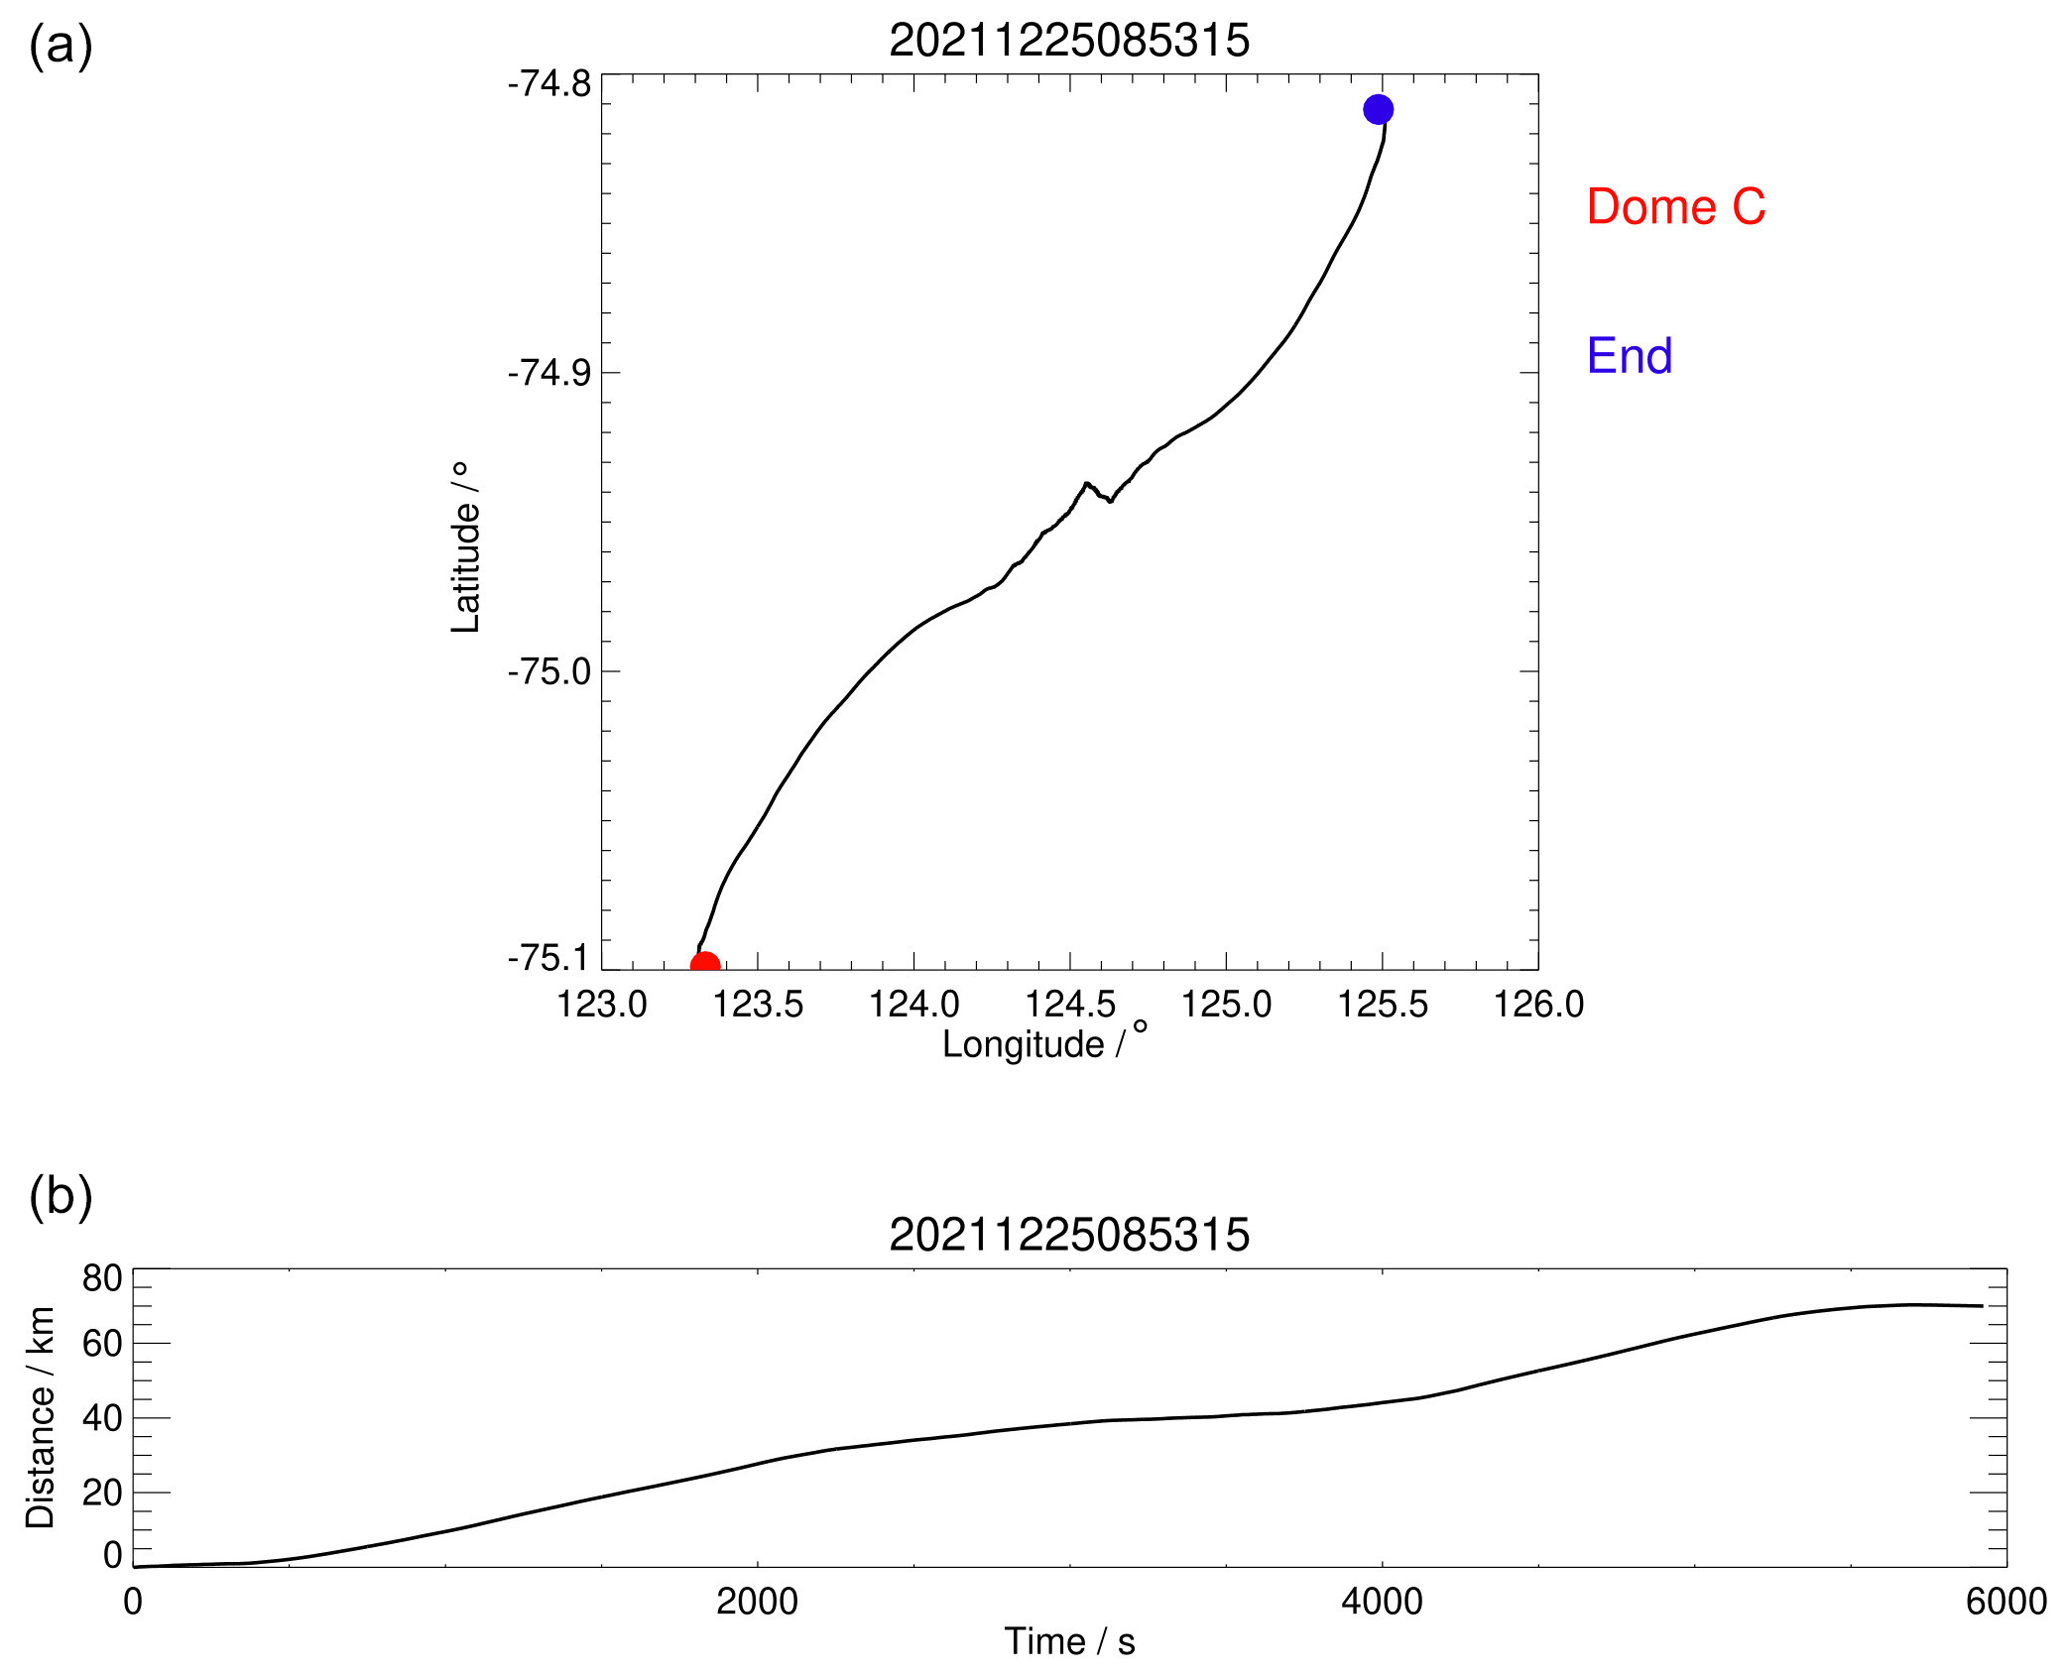
Figure 3(a) Path followed by the meteorological balloon launched on 25 December 2021 at 08:53:15 UTC (L03) (red circle) up to the end of the flight (blue circle). (b) Distance travelled (km) as a function of time since launch.
In general, all flights reached a top height above 10 km (Figs. 4 and S7–S14 in the Supplement), well above the tropopause height (about 7–8 km). This is consistent with previous observations made with meteorological operational Vaisala PTU sondes (Tomasi et al., 2015). The profiles of temperature and relative humidity measured during the whole flight (L03), starting at 08:53:15 UTC, are shown in Fig. 4 together with the calculated potential temperature and observed relative humidity within the 400–1600 m layer. Above 2 km, a good consistency between the ascending and descending phases is found in temperature profiles within ±1 K. The relative humidity profiles are within ±5 % of each other, except between 7 and 8.5 km, where they differ by around 10 %. Below 2 km, the profiles reflect the impact of the PBL. In ascending phase, the heights of inflection points in potential temperature profiles are found at 800–850 and 1300–1350 m. In descending phase, they are located at 950–1000 and 1450–1500 m. Whatever the phase considered, the maximum relative humidity is close to saturation (U ∼ 100 %) and can even reach supersaturation by 2 % to 5 % (U ∼ 102 %–105 %) in descending phase. This clearly indicates the presence of clouds. Three points need to be underlined. (1) The supersaturation highlighted above comes from the actual measurements provided by the Vaisala system with U relative to liquid water. From the Vaisala white paper relative to the RS41 sondes (Vaisala Radiosonde RS41 Measurement Performance, White Paper, Vaisala; available at https://www.vaisala.com/sites/default/files/documents/ WEA-MET-RS41-Performance-White-paper-B211356EN-B-LOW-v3.pdf, last access: 27 August 2024), the accuracy of temperature and relative humidity is 0.3 °C and 4 %, respectively, below 16 km altitude. (2) The heights of the potential temperature inflection points are higher by ∼ 150 m in descending compared with ascending phase. The landing occurred 70 km further out and 1 h 40 min later than the launch (Fig. 3). This is clearly a fingerprint of both time and space evolution of the PBL top height around Concordia Station. (3) The presence of a set of two distinct inflection points, namely two entrainment zones and/or two capping inversion zones where the SLW clouds develop and/or persist, resembles as if two PBL layers were present above Concordia Station. The explanation could be that the lowest layer is related to the PBL above Concordia, although the highest layer is either a remnant of the PBL far from Concordia reaching the station through long-range transport or a fossil layer from the PBL established the day before above the station. These double layers can clearly be identified on 25 December 2021 at 15:48 UTC (Fig. 5), on 24 January 2022 at 13:51 UTC (Fig. S12), and on 28 January 2022 at 06:08 UTC (Fig. S13).
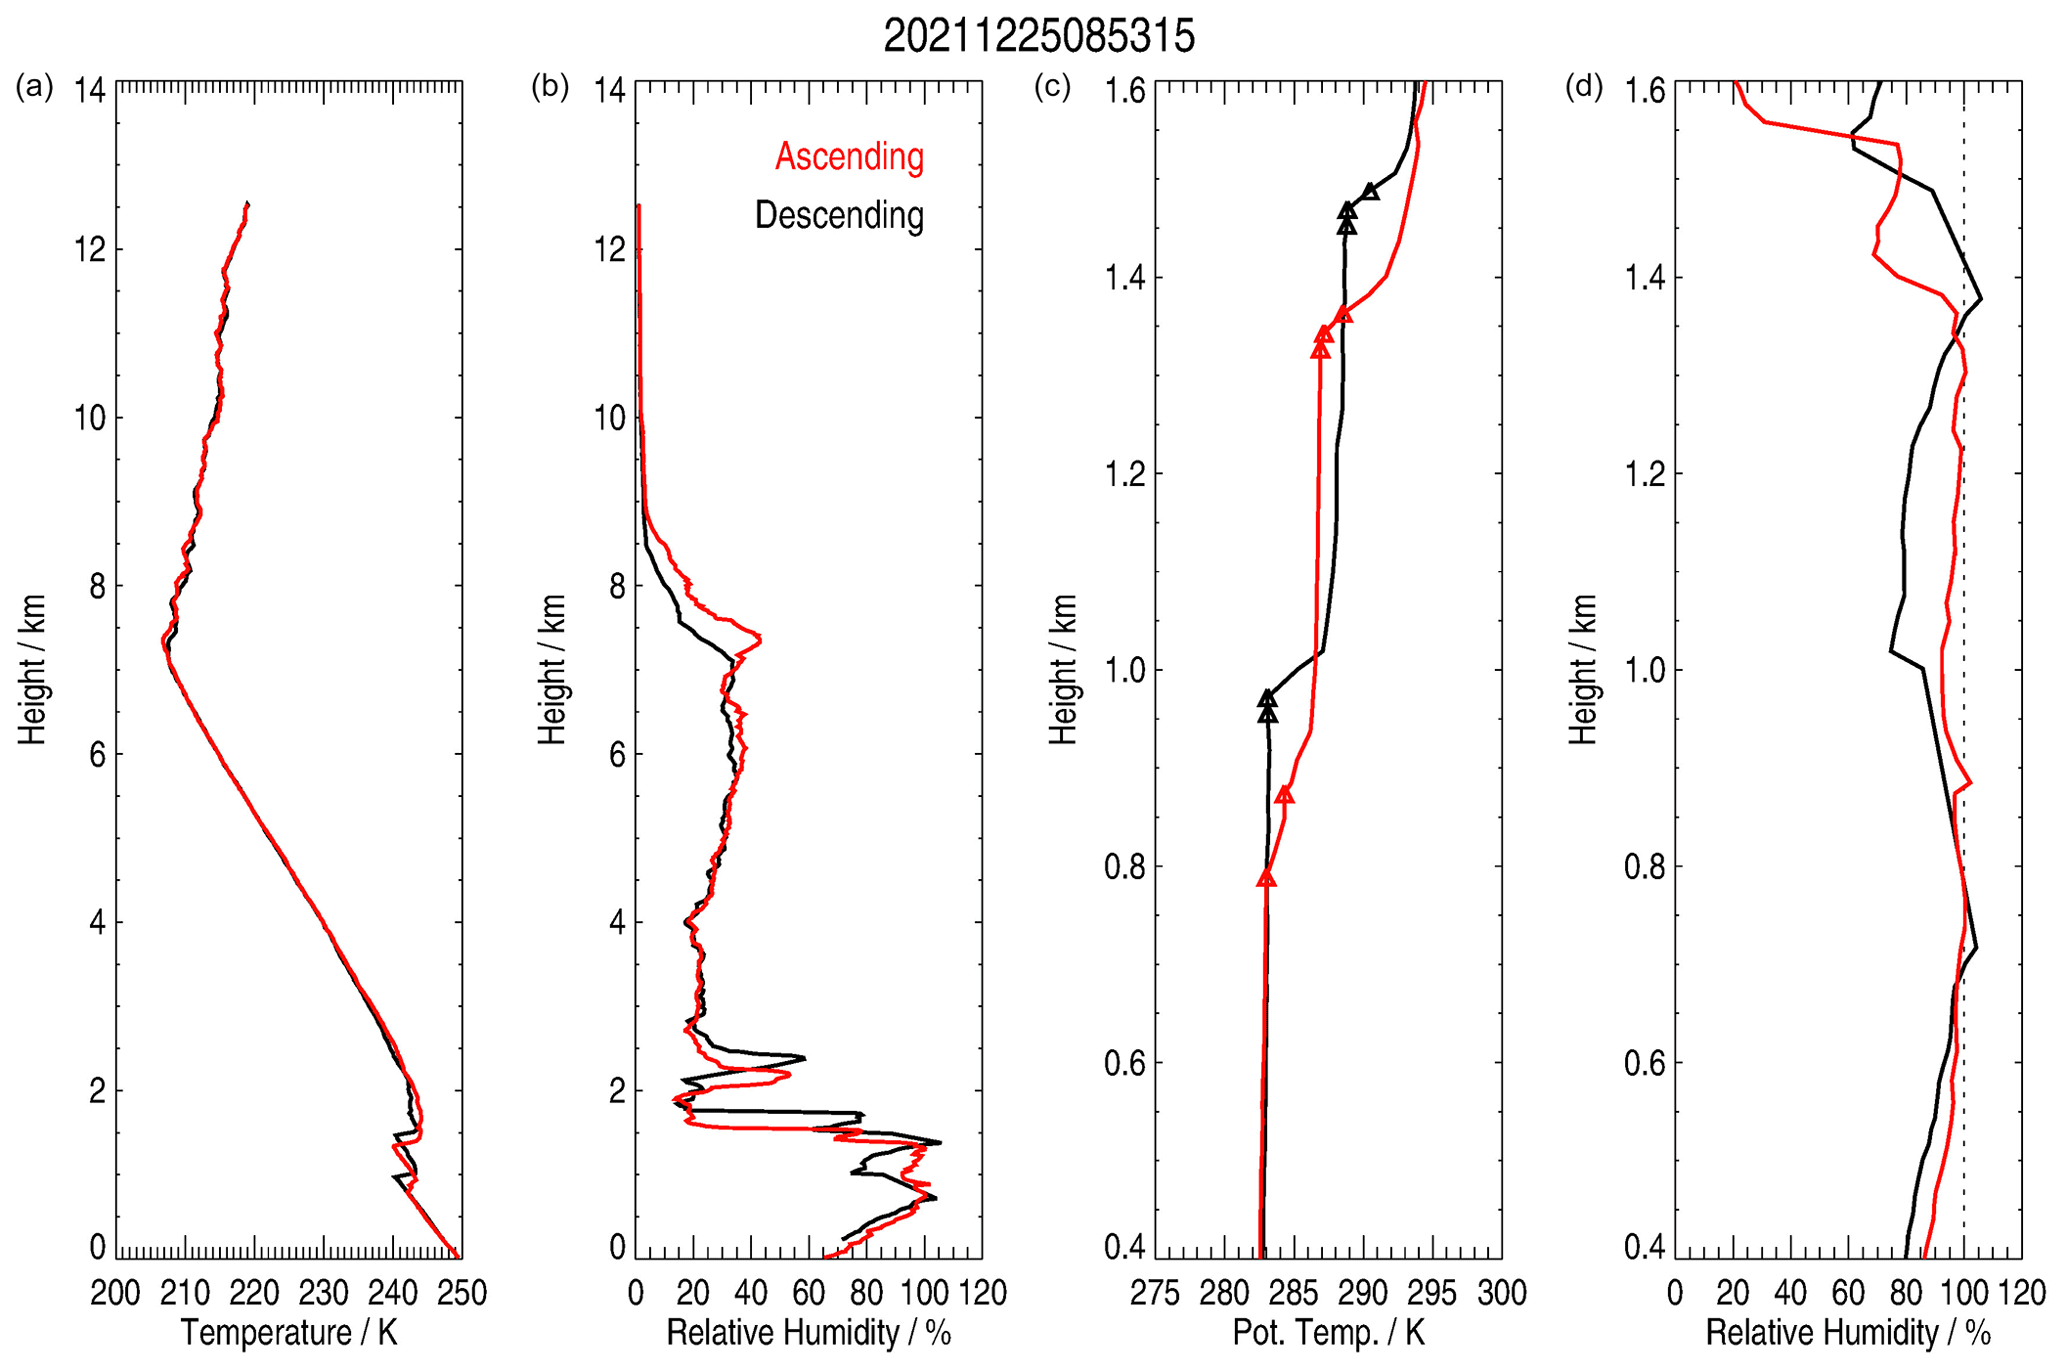
Figure 4From panel (a) to panel (d): vertical profiles of temperature (K), relative humidity (%) observed by the PTU sonde on 25 December 2021 for a launch at 08:53 UTC in ascending (red) and descending (black) phases over the entire vertical range, and potential temperature (K) and relative humidity selected from 400 to 1600 m height. Red and black triangles in the vertical profiles of potential temperature highlight the presence of inflection points in the ascending and descending phases, respectively. The vertical dotted line in the right panel indicates the 100 % relative humidity.
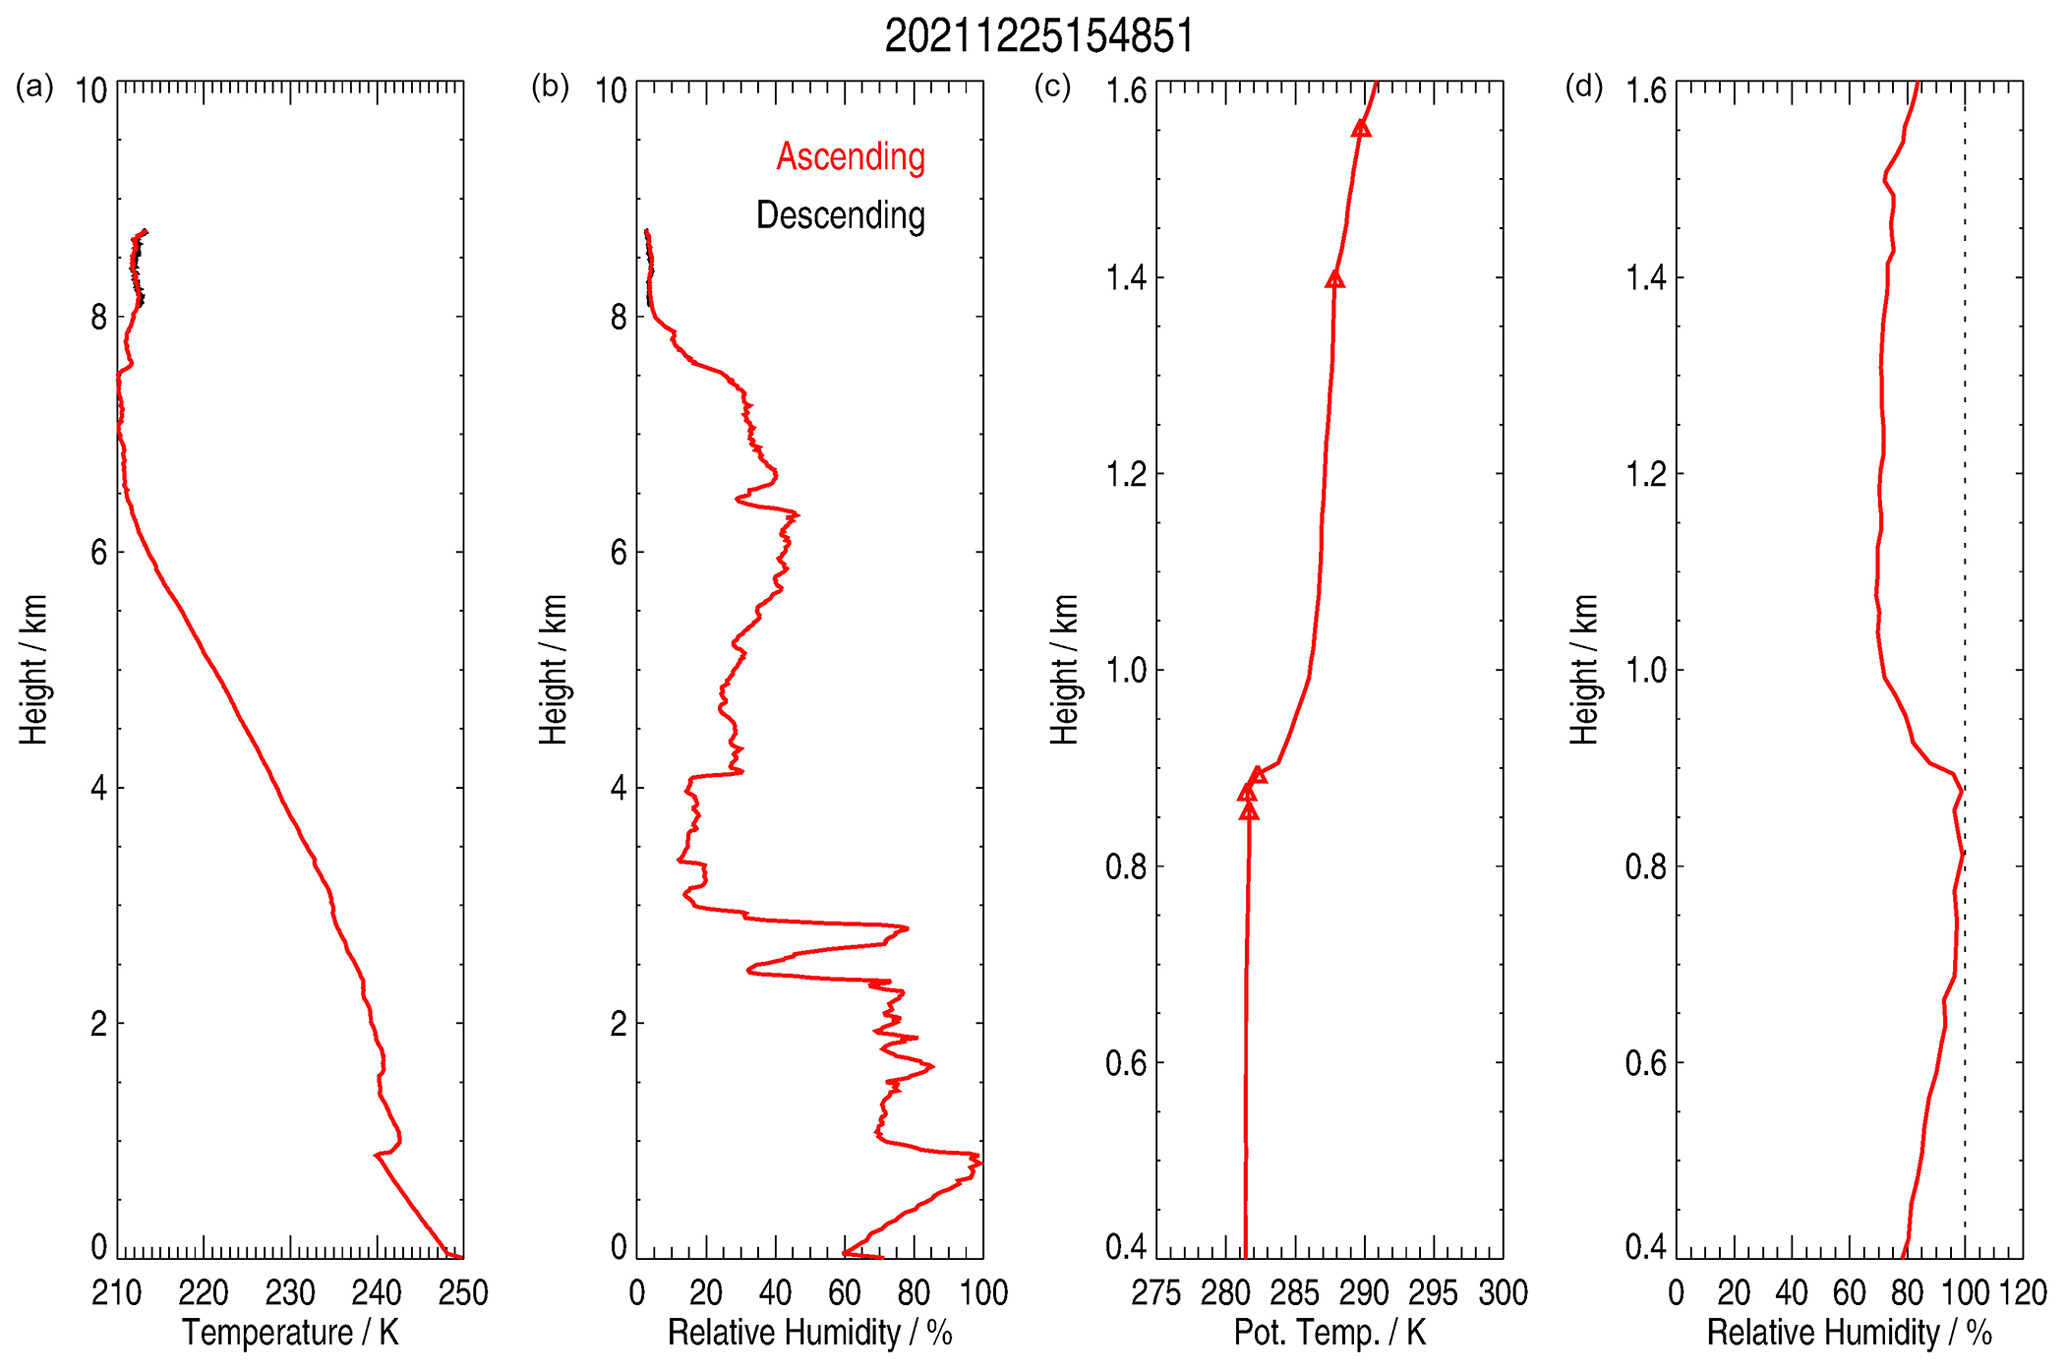
Figure 5From panel (a) to panel (d): same as Fig. 4 but on 25 December 2021 at 15:48 UTC. Note that, in descending phase (black), only a few observations were available after the balloon reached the ceiling height.
The vertical profiles of f, df/dt, and SLWC associated with L03 and L04 are shown in Figs. 6 and 7, respectively. We have also superimposed the vertical extension of the SLW clouds as observed by the lidar within a ±1 h window centred on the launch time (ascending phase) and on the time of the flight end (descending phase) in yellow and orange, respectively. For both flights, f is rather stable (22.2 and 22.4 Hz, respectively) along the vertical, with a slight increase between 400 and 600 m during L04. For L03, the df/dt values are small (±0.001 Hz s−1), except (1) between 850 and 1000 m (about −0.005 Hz s−1), where an SLW cloud is estimated from 900 to 1000 m with an SLWC of 0.55 g m−3 at 950 m, and (2) between 1400 and 1500 m (about −0.001 Hz s−1), where an SLW cloud is estimated from 1400 to 1500 m with an SLWC of 0.25 g m−3 at 1400 m, well above the estimated 1σ random error of 0.08 g m−3 (see Sect. 4.3). For L04, the df/dt values are small (±0.001 Hz s−1), except (1) between 700 and 900 m (±0.005 Hz s−1), where an SLW cloud is estimated from 825 to 875 m with an SLWC of 0.35 g m−3 at 850 m, and (2) around 1500 m (about −0.001 Hz s−1), where an SLW cloud is estimated around 1500 m with an SLWC of 0.09 g m−3, very close to the estimated 1σ random error of 0.08 g m−3. Note that the df/dt values are high below 500 m, reaching +0.01 Hz s−1, but this is not related to the presence of SLW, which would translate as negative values of df/dt (see Eq. 1).
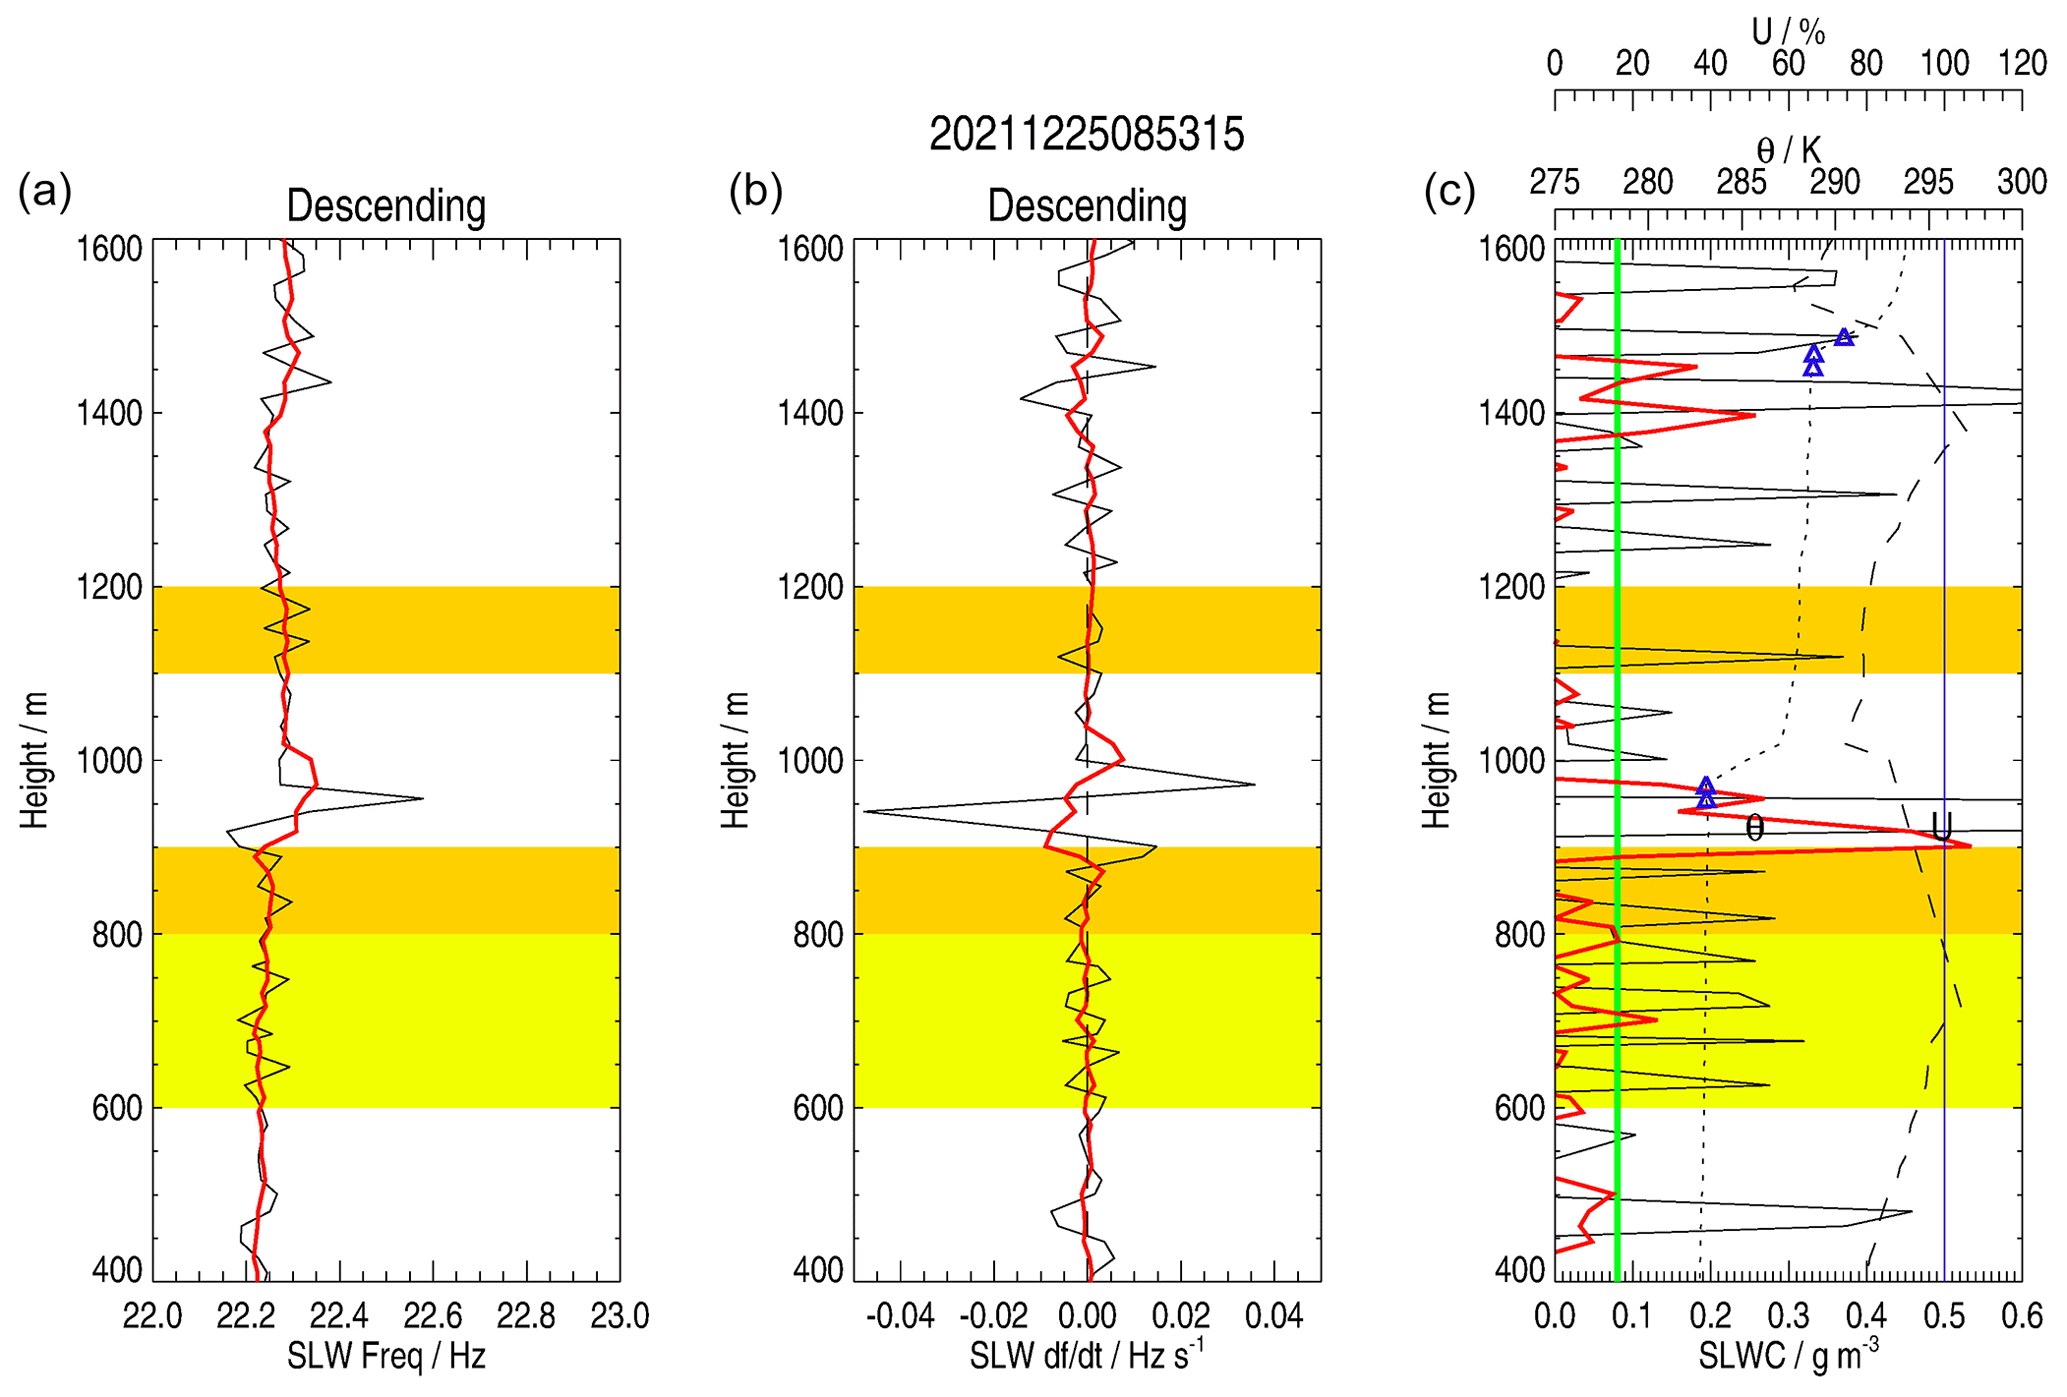
Figure 6Vertical profiles of (a) SLWC sonde frequency f (black; Hz), (b) df/dt (black; Hz s−1), and (c) sonde-calculated SLWC (black; g m−3) on 25 December 2021 at 10:30 UTC (descending phase) for a launch at 08:53:15 UTC. Four-point (20 s) running averages are displayed in red. In panel (c), potential temperature (θ, K) and relative humidity (U, %) are shown as dotted and dashed lines, respectively. Blue triangles represent the heights of the potential temperature inflection points. The green vertical line represents the estimated 1σ error (0.08 g m−3) of the SLWC sonde observations. The blue vertical line indicates the 100 % relative humidity. The vertical extension of the SLW clouds as observed by the lidar within a ±1 h window centred on the launch time (ascending phase) and on the time of the flight end (descending phase) is highlighted in yellow and orange, respectively.
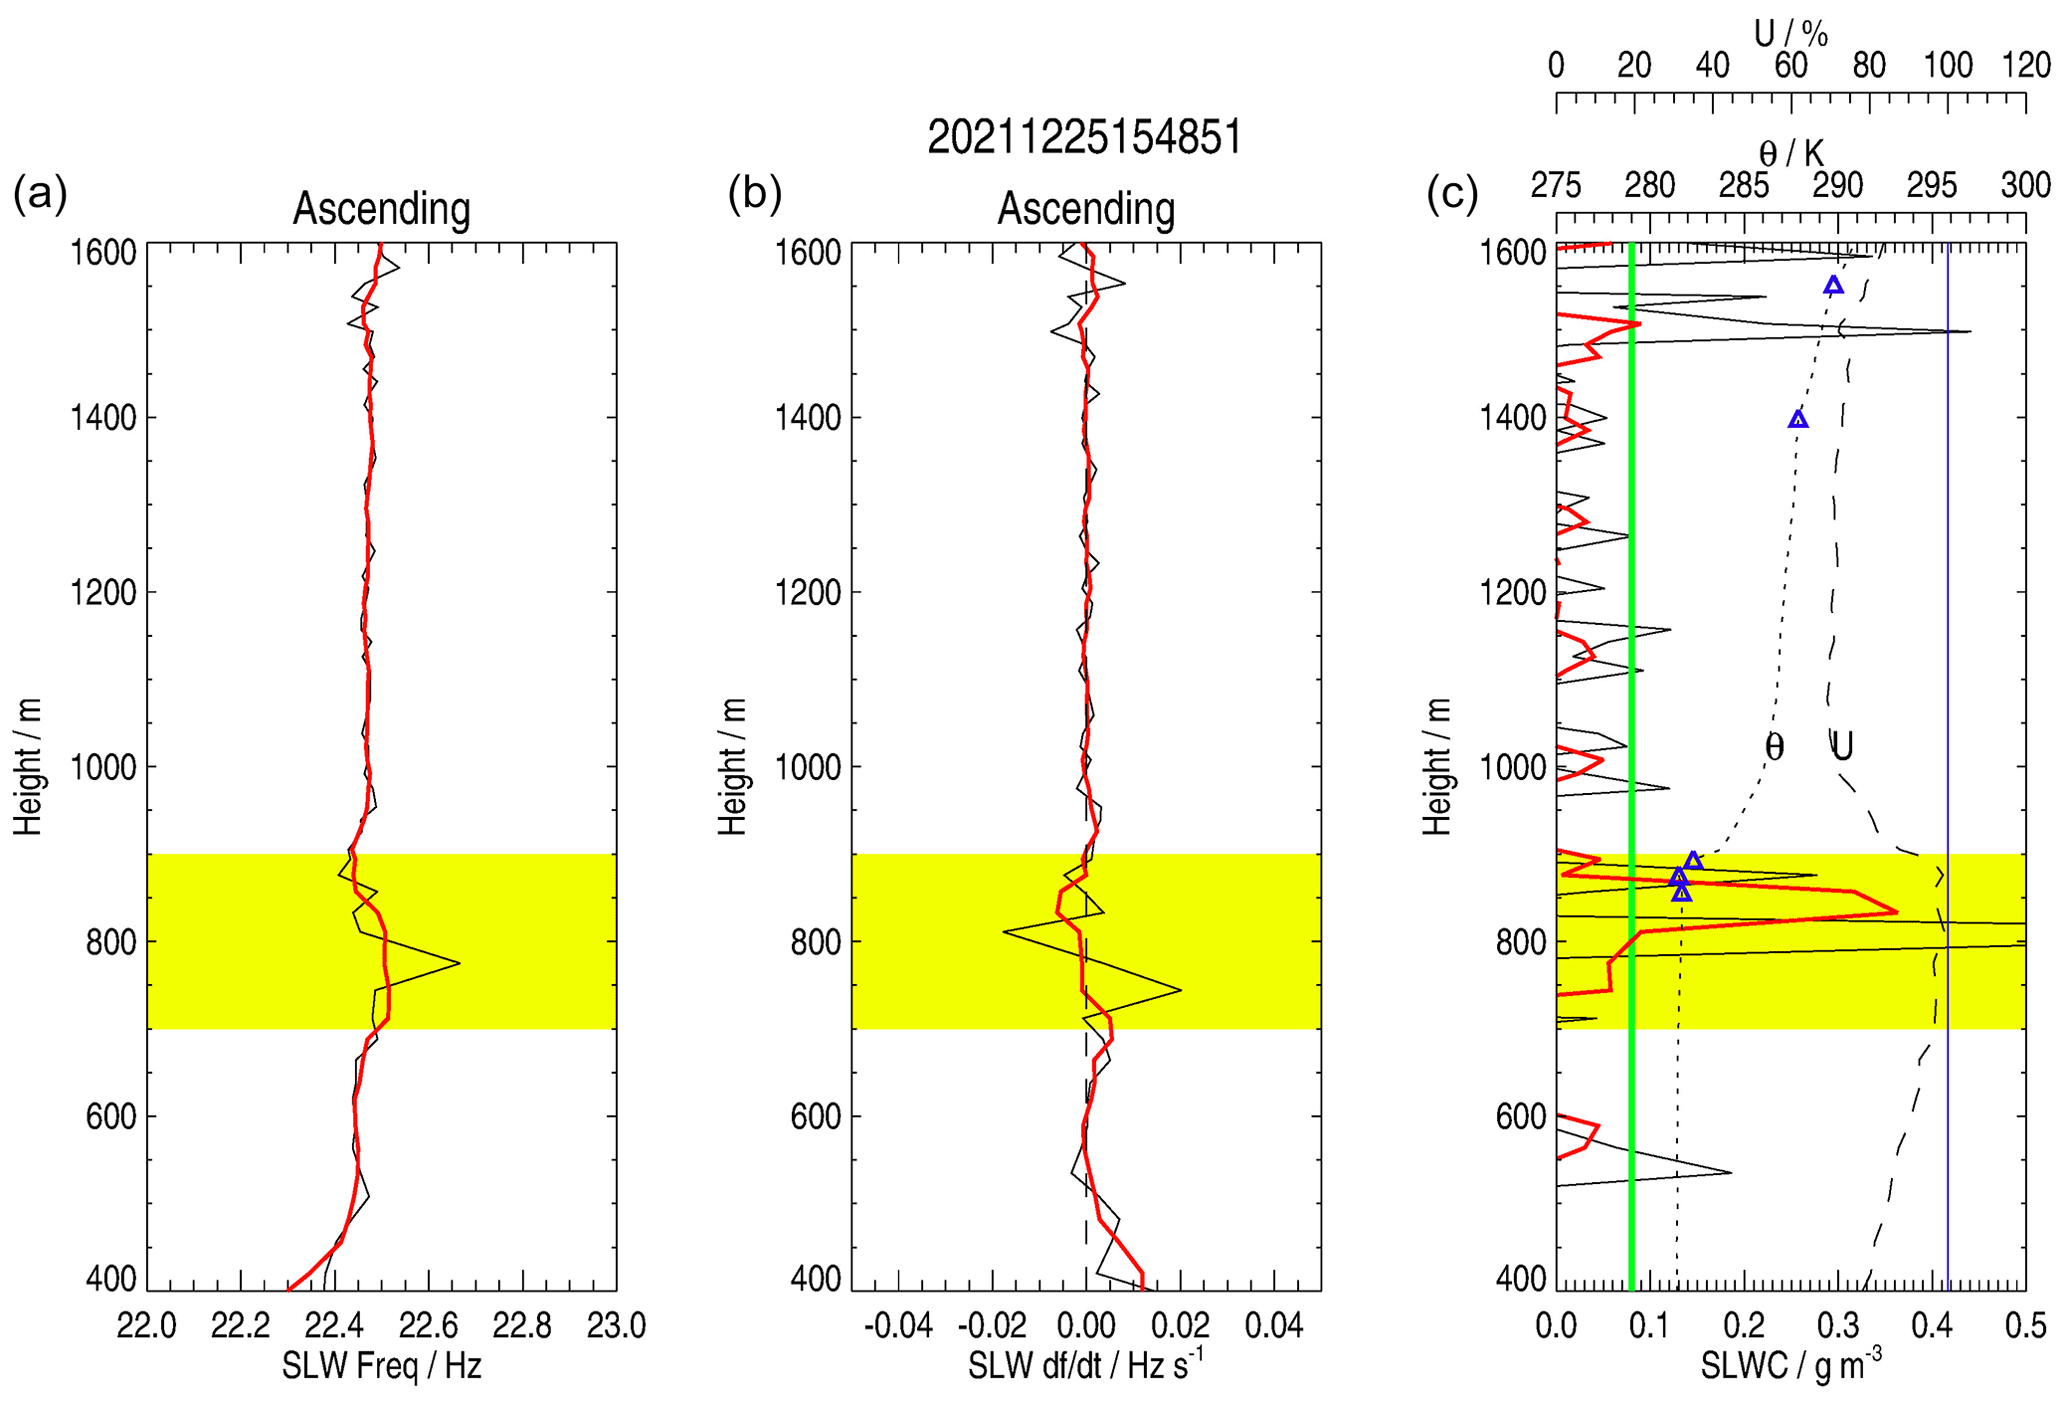
For L03 (Fig. 6), two sets of potential temperature inflection points are measured at H(θinf) = 950–1000 and 1450–1500 m, with no U measurements at these heights. The SLW clouds derived from the SLWC sonde (900–1000 and 1400–1500 m) are located within the lowest part of H(θinf) and a few metres below. For L04 (Fig. 7), two to three potential temperature inflection points are also measured at H(θinf) = 850–880, 1400, and 1520 m, with an almost saturated atmosphere (U ∼ 100 %) at 880 m and with high humidity at 1400 m (U ∼ 75 %) and at 1520 m (U ∼ 80 %). The SLW clouds derived from the SLWC sonde (700–900 and 1500 m) are located within the lowest part of H(θinf) and a few metres below, as for the L03 flight.
The SLW cloud heights derived from the SLWC sonde in L04 (825–875 m) are very consistent with the lidar observations (700–900 m). In L03, the SLW cloud at 900–1000 m from the sonde is slightly below the lidar observations (800–900 m) in descending phase and slightly above the lidar observations (600–800 m) in ascending phase. The SLW cloud at 1400–1500 m (L03) is not detected by the lidar (except at 1100–1200 m in descending phase for L03). This is probably due to the underlying SLW cloud at 900–1000 m that absorbs or reflects most of the lidar laser beam, which cannot propagate higher. For L03, the vertically integrated 900–1000 m layer of the SLWC calculated from the sonde data is about 3.7 g m−2, which falls within the minimum–maximum LWP values observed by HAMSTRAD on that day (2–6 g m−2), whereas, for L04, the SLWC integrated within the 825–875 m layer is 9.0 g m−2, slightly larger than the minimum–maximum values observed by HAMSTRAD (2–6 g m−2; see Table 1).
An interesting point is to check whether the SLW cloud observed at 900–1000 m by the sonde 70 km away from the station in the descending phase (L03) is connected to the one observed 6000 s earlier by the lidar at the station at 600–800 m in the ascending phase, just below the inflection point at 780 m corresponding to the 283 K isentrope. In the ascending phase (Fig. S26), the wind direction (250 ± 20°) and the wind speed (18 ± 4 m s−1) in the middle troposphere are consistent with a balloon travelling 70 km in a northeastern direction in more than 1.5 h. On the other hand, in the lowermost troposphere (Figs. S26 and S27), the wind is orientated to 120 ± 20° and the wind speed is much lower (5 ± 3 m s−1). As a consequence, the probability of the SLW cloud observed by the SLWC sonde in the descending phase being the one observed by the lidar in the ascending phase is very weak. Later on, at 15:48:51 (L05), both the lidar and the SLWC sonde in the ascending phase observed an SLW cloud in the range of 700–900 m, encompassing or being just below the inflection points at 850–880 m corresponding to the isentropes 281.5–282 K (Fig. 7). Therefore, it is very likely that the present SLW cloud is a remnant of (or the same as) the one observed 7 h before over Concordia Station within the 283 K isentrope.
4.3 Launch on 17 January 2022 (cloud-free period)
The launch on 17 January 2022 at 06:15:15 UTC (L11 in ascending and descending phases) was performed in a cloud-free environment throughout the day, as shown by the lidar observations (Fig. 8), with associated HAMSTRAD LWP values of 0.4–1.0 g m−2. This launch was an important test to check the behaviour of the SLWC sonde and to quantify the random error and the bias associated with the estimation of SLWC together with the random error and the bias in LWP from HAMSTRAD observations. Note that, when the sondes reached the ground at the end of the flight, the balloon had travelled a distance of approximately 50 km from Concordia Station after a flight time of 1 h 40 min (Fig. 9).
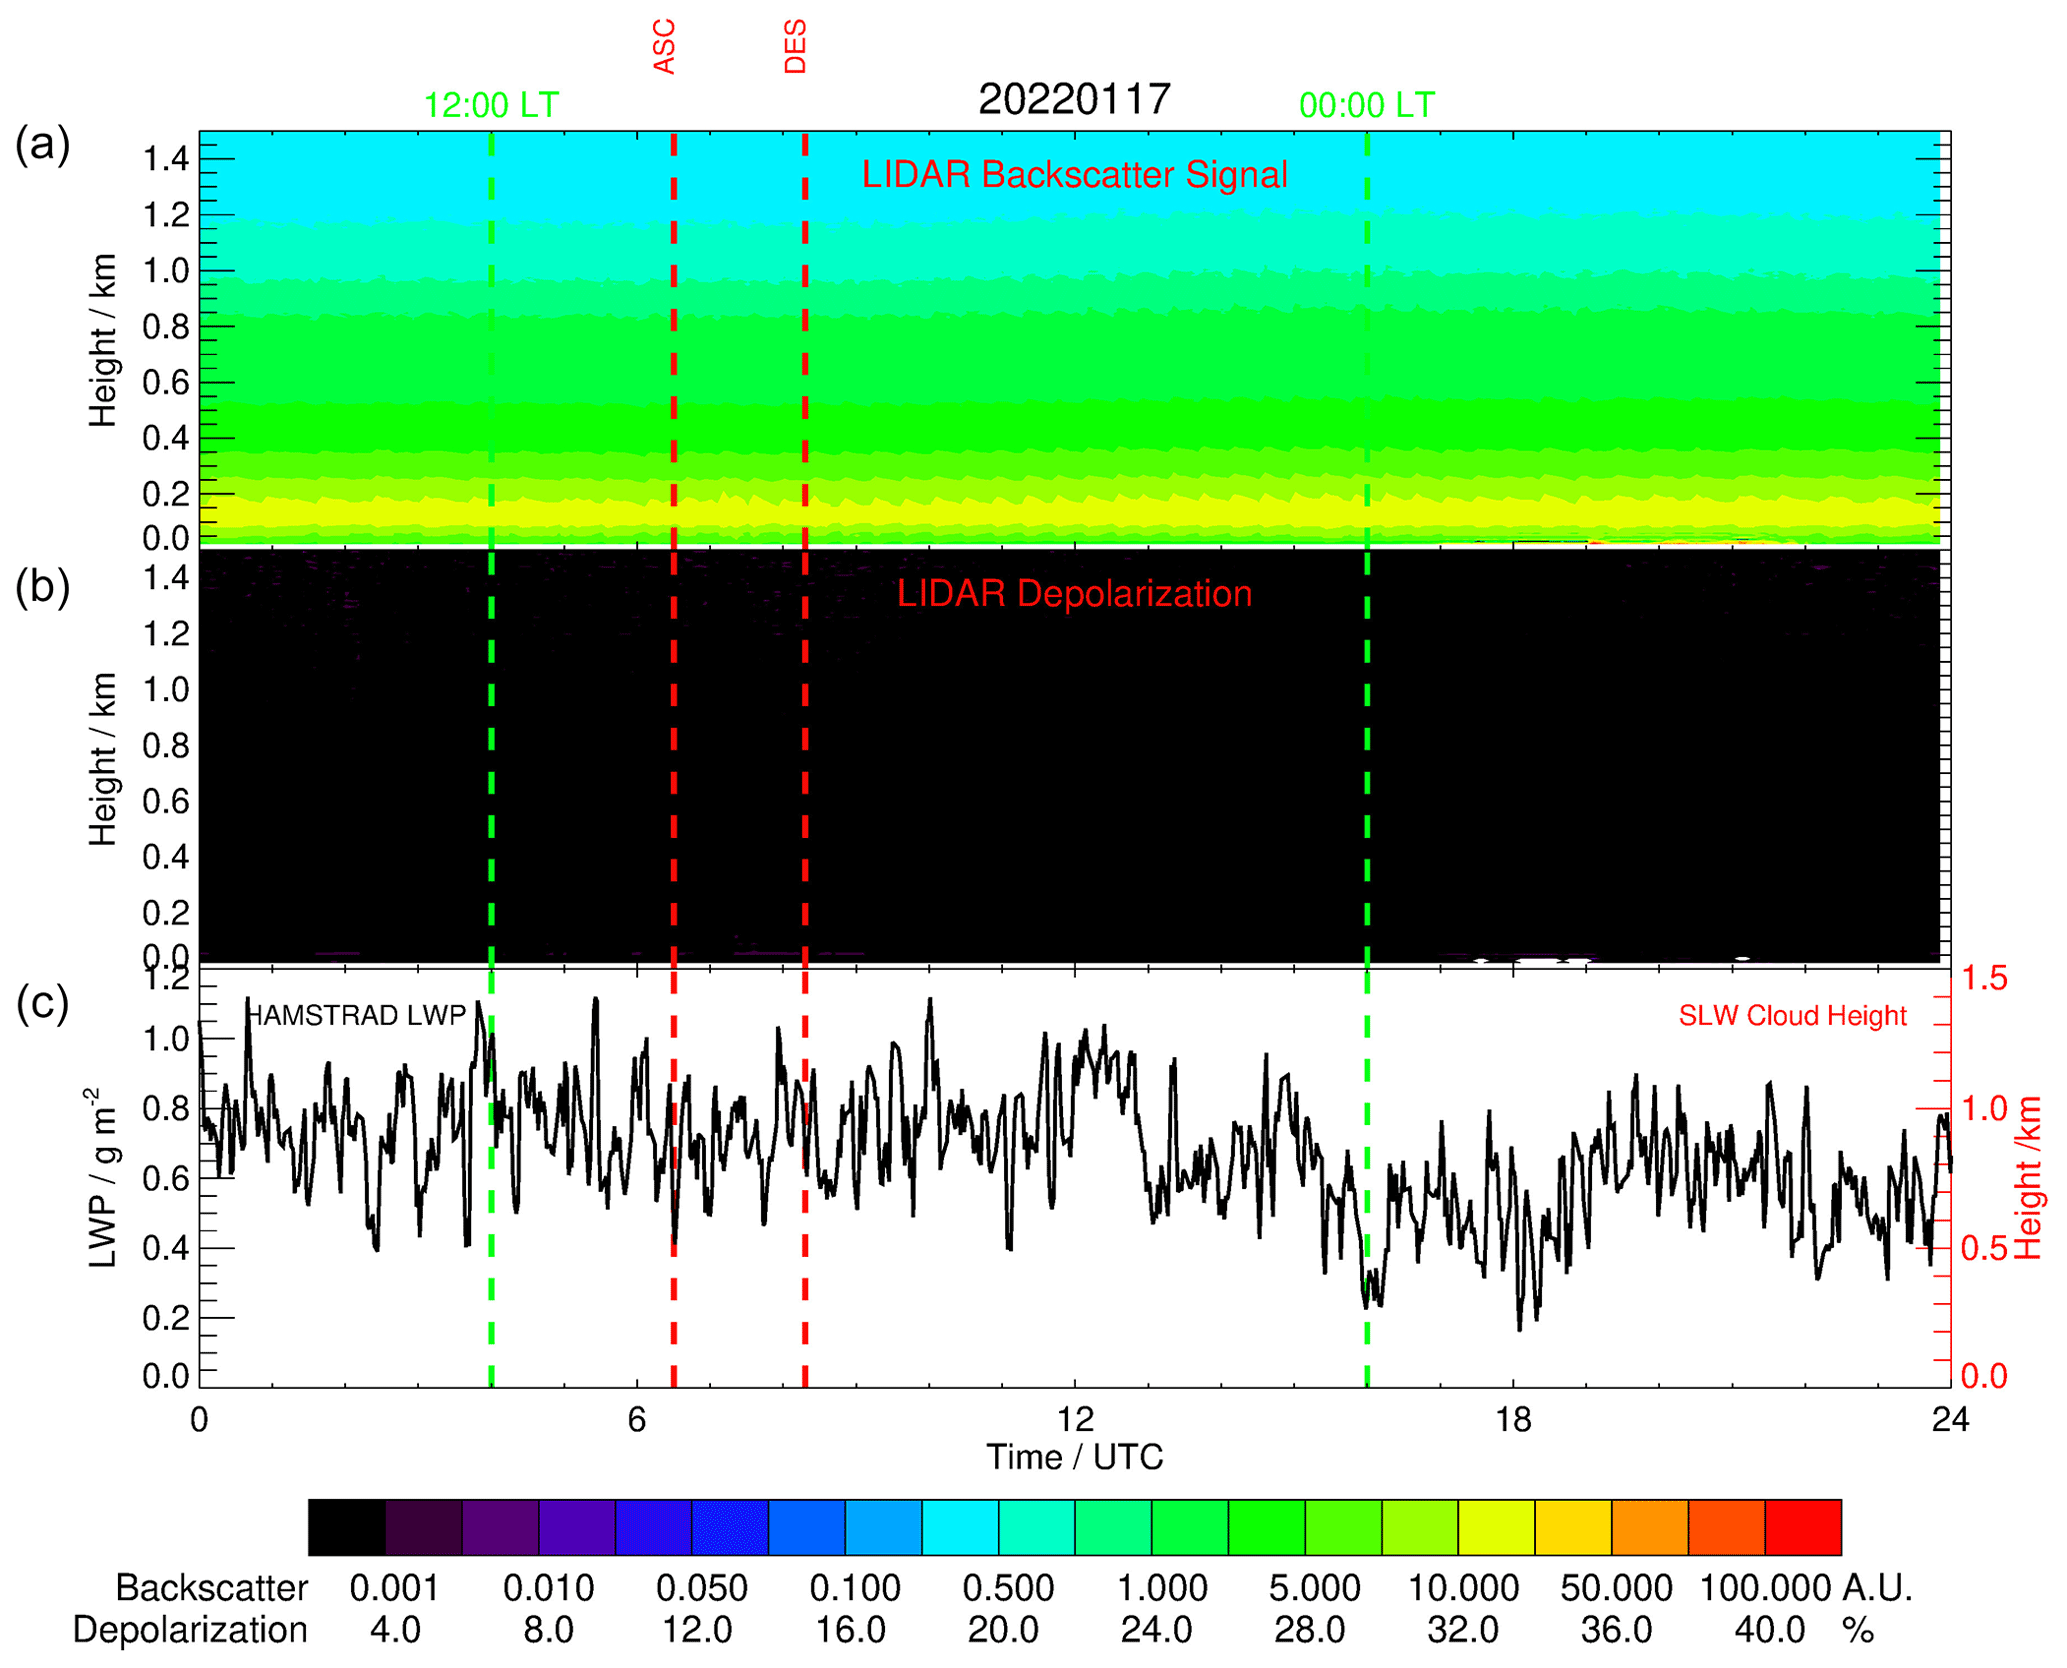
Figure 8Same as Fig. 2 but for 17 January 2022, corresponding to a period of cloud-free conditions.
The profiles of f, df/dt, and SLWC for L11 in its ascending and descending phases are shown in Figs. 10 and 11, respectively. f does not vary much along the vertical in both flight phases, with variations lower than ±0.05 Hz, producing df/dt values on the order of ±0.002 Hz s−1. On average, the SLWC oscillates within ±0.08 g m−3. Therefore, we can estimate the random error in the derived SLWC to be σ = 0.08 g m−3 without any bias and conclude that no SLW clouds were observed with the sonde. This is consistent with the fact that (1) the relative humidity is low (U ranging from 10 %–80 %), (2) the lidar observations do not show any SLW cloud during the day (Fig. 8), and (3) the HAMSTRAD LWP is small (< 1.0 g m−2). From these HAMSTRAD observations in cloud-free conditions, we can estimate that the LWP RMS error σ is about 0.2 g m−2 and that the LWP bias ranges from 0.8–1.0 g m−2.
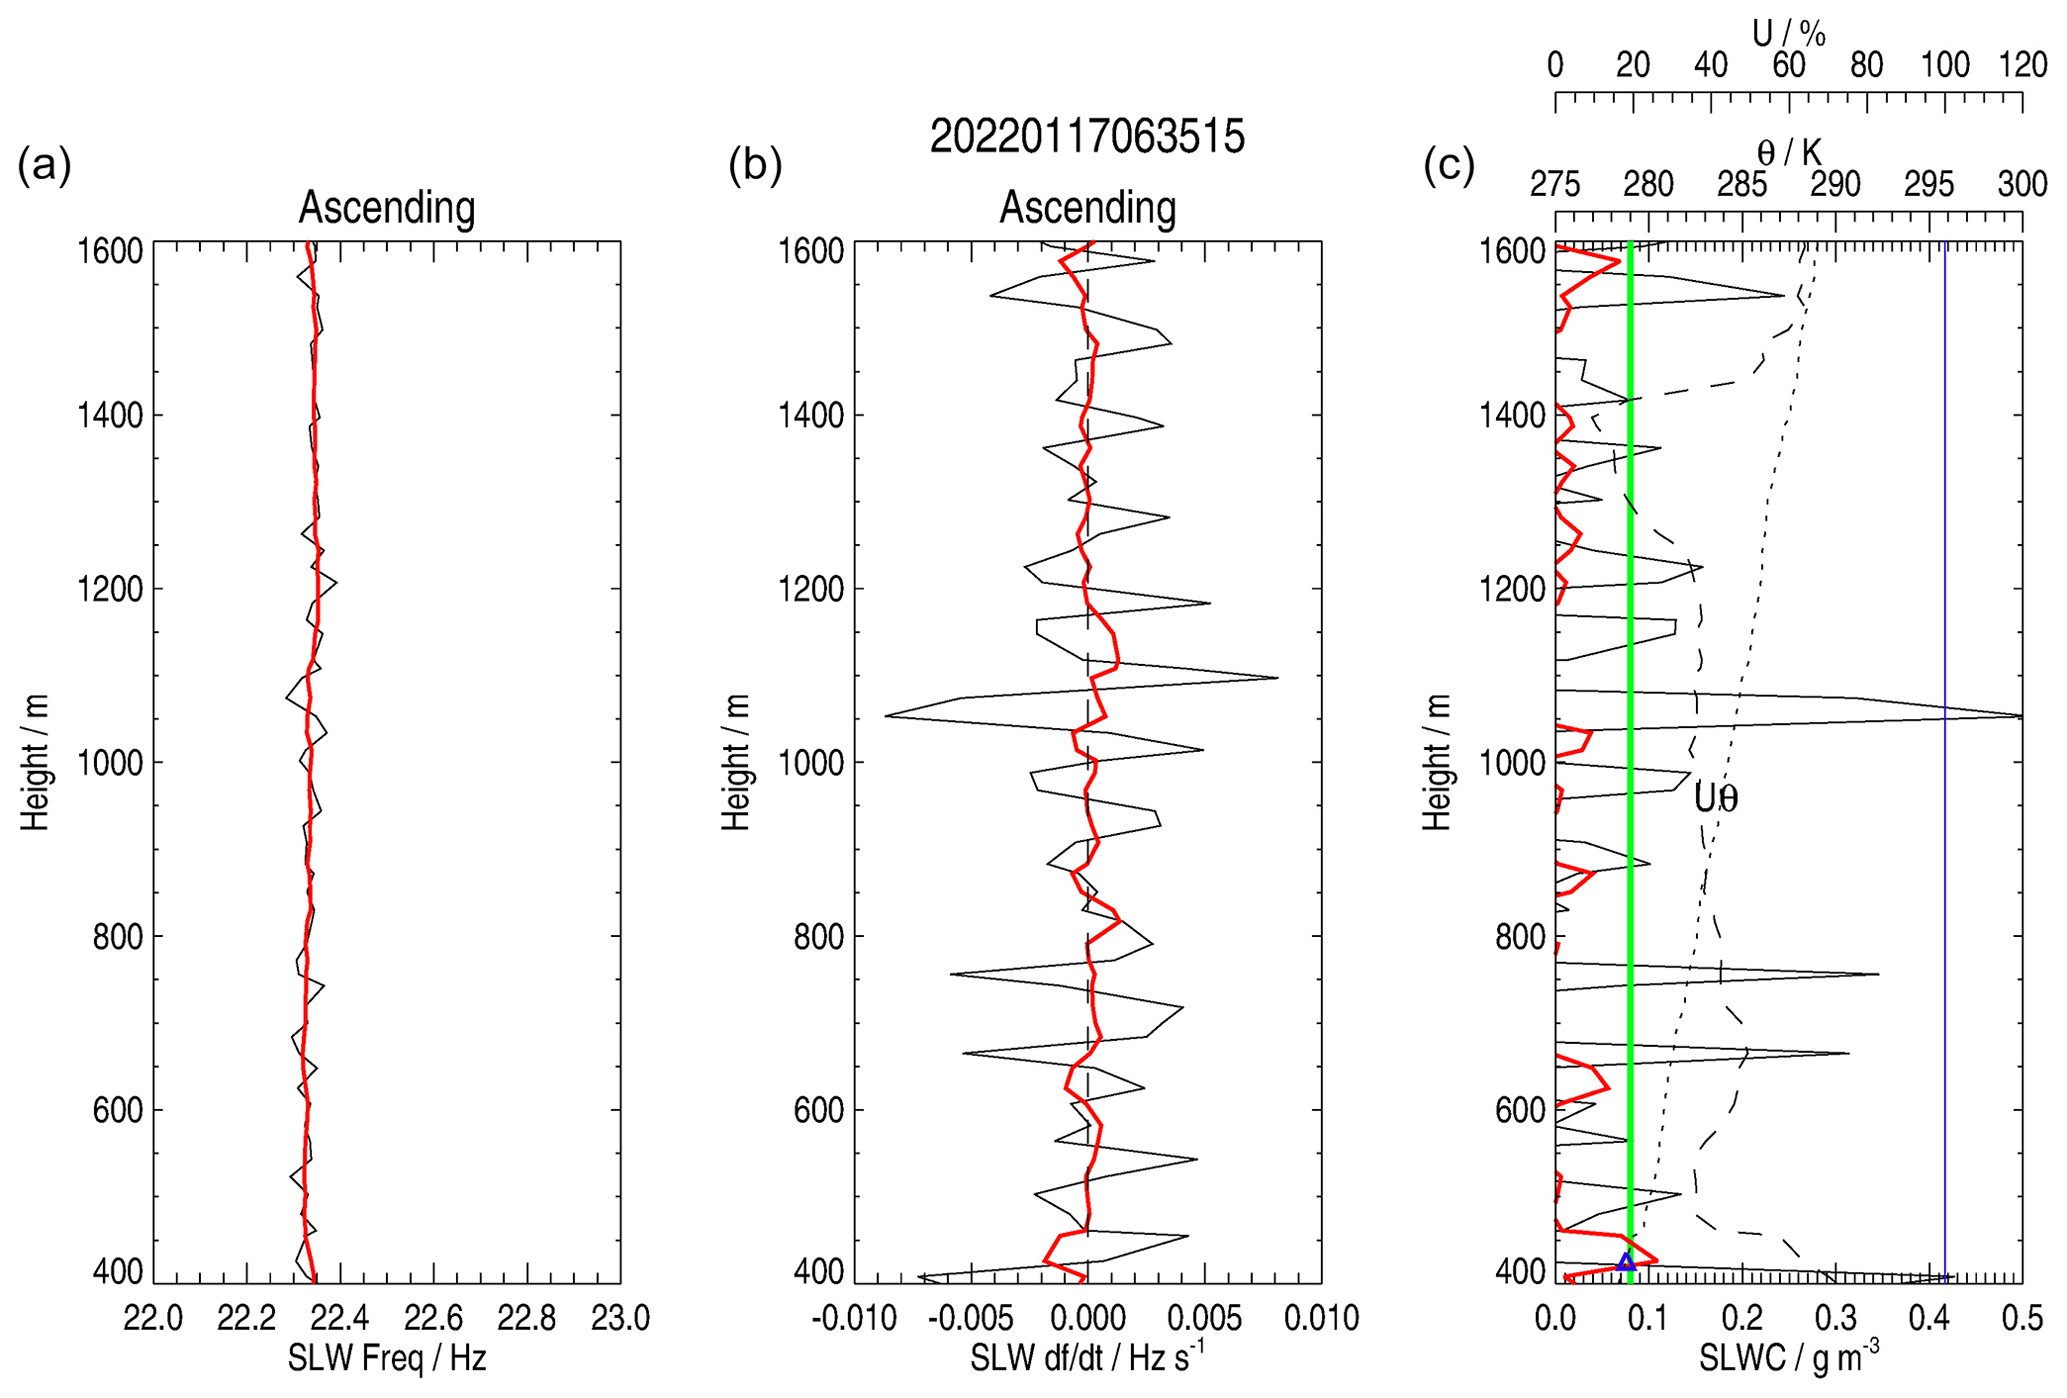
Figure 10Same as Fig. 6 but for 17 January 2022 at 06:35 UTC in ascending phase in cloud-free conditions.
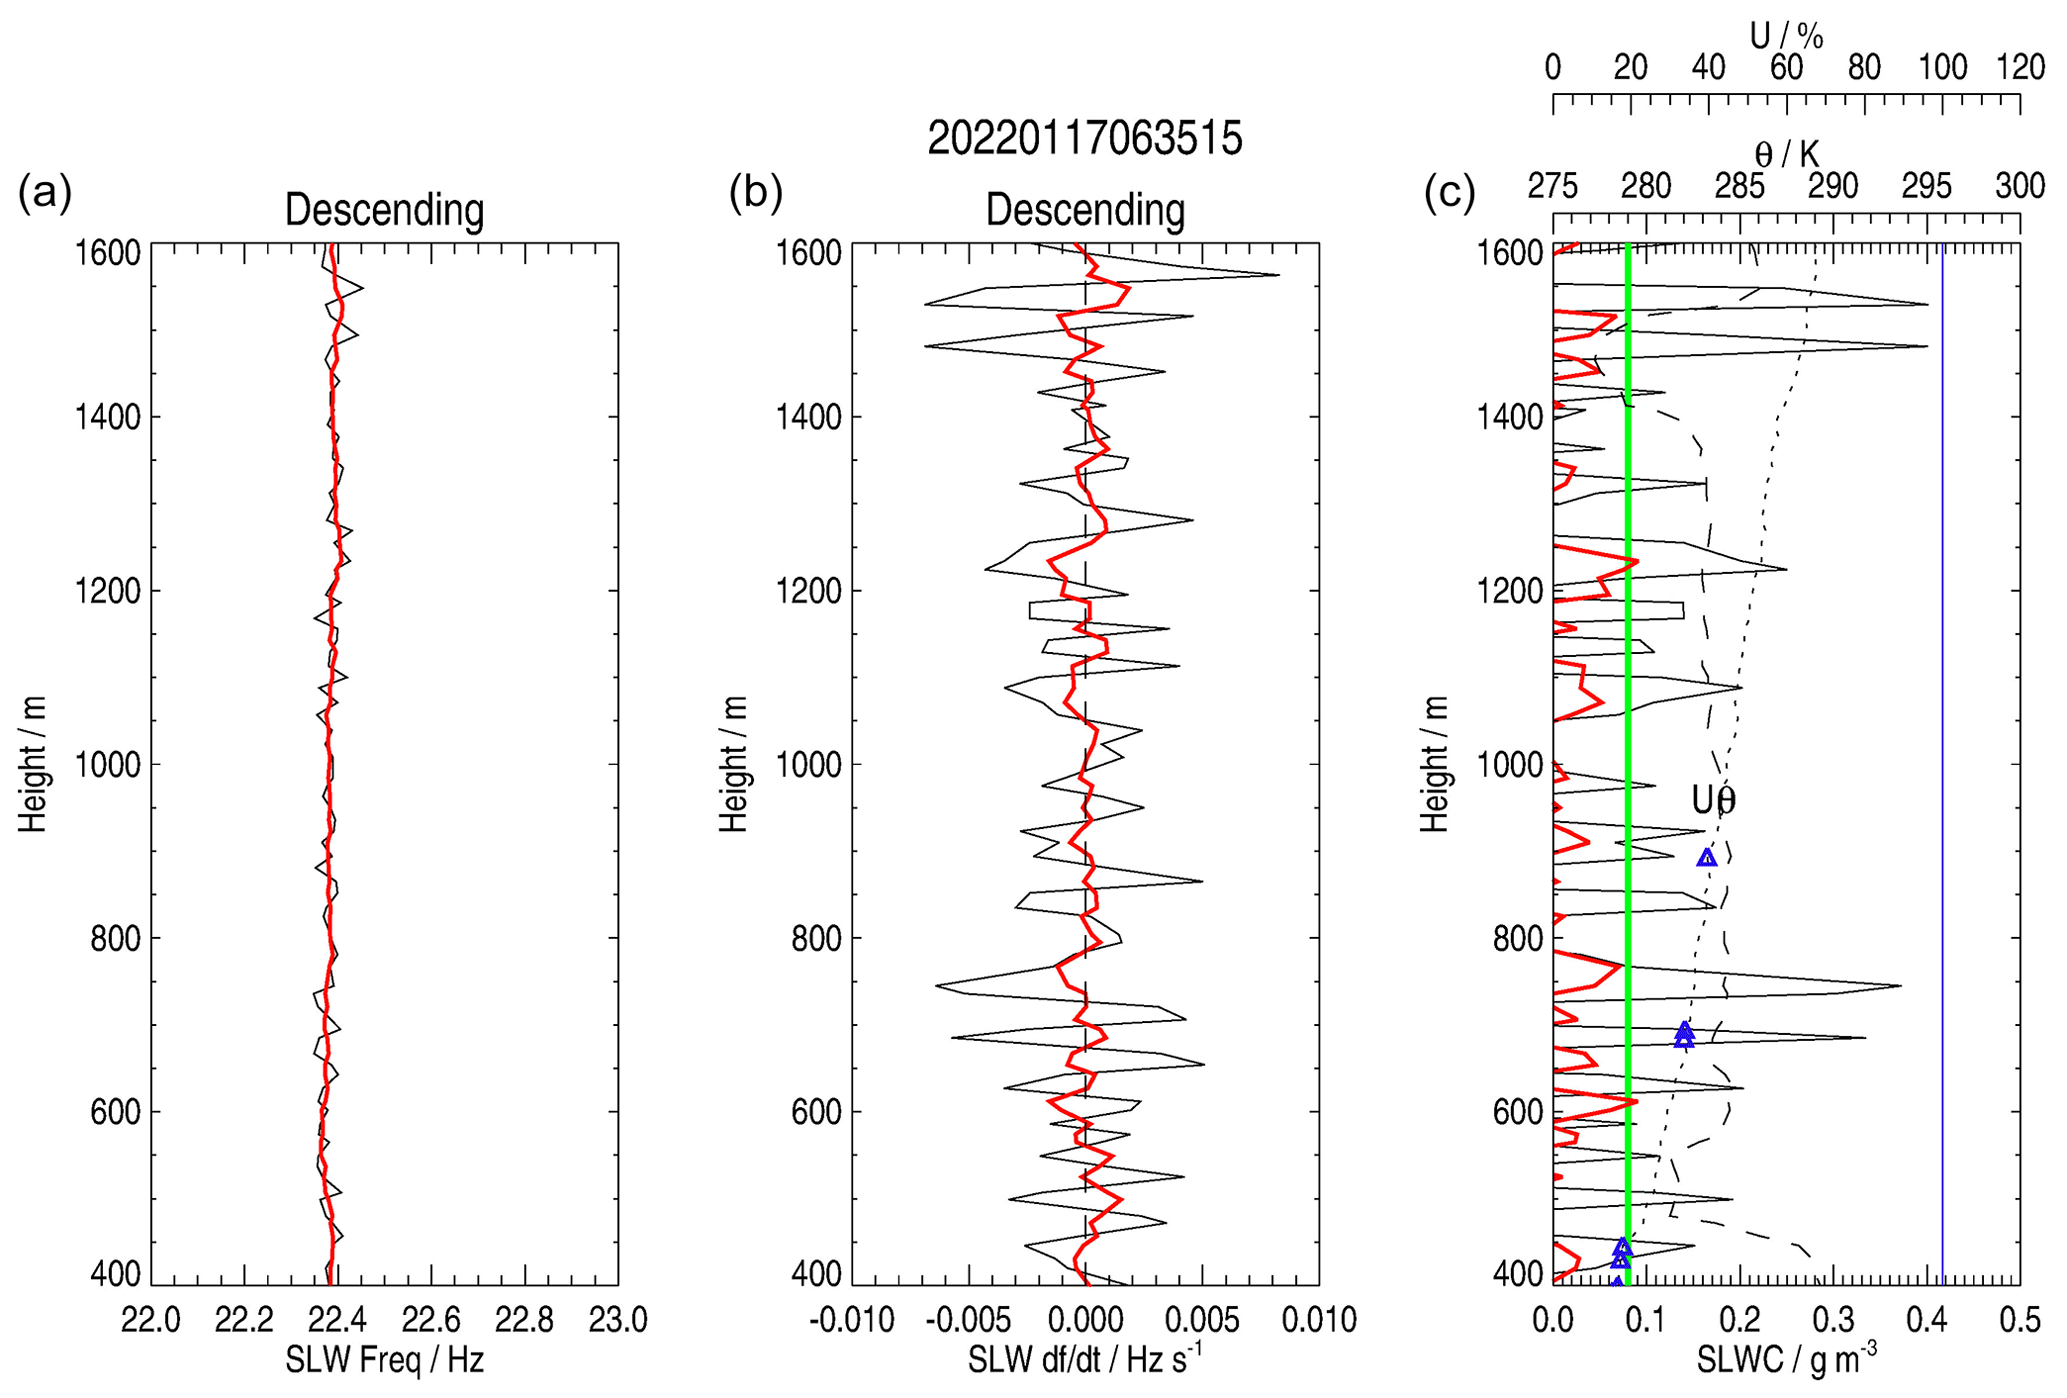
Figure 11Same as Fig. 6 but for 17 January 2022 at 06:35 UTC in descending phase in cloud-free conditions.
4.4 Analysis of all the other flights
The first flight (L01) was carried out on 22 December 2021 at 02:24:30 UTC, using an unwinder, after the lidar detection of an SLW cloud at 400–600 m between 00:00 and 02:00 UTC with an LWP of 8–10.5 g m−2 (Fig. S1). Unfortunately, just before the launch, the HAMSTRAD-observed LWP decreased to 1.5 g m−2, with some remnants of SLW cloud at 500 and 650 m. An SLW cloud is estimated by the lidar from 400 to 500 m (Fig. 12) with an SLWC of 0.35 g m−3 at 450 m, well above the estimated 1σ random error of 0.08 g m−3. From 400 to 750 m, U increases from 80 % to 90 % and H(θinf) ranges from 710–750 m. The lidar observed an SLW cloud at 400–600 m, consistent with the SLWC sonde (400–500 m). The lidar SLW cloud at 700–750 m is not detected by the SLWC sonde. The integral over the 400–500 m layer of the SLWC measured by the sonde is about 7.4 g m−2, which is within the minimum–maximum values observed by HAMSTRAD on that day, namely 2–10 g m−2.
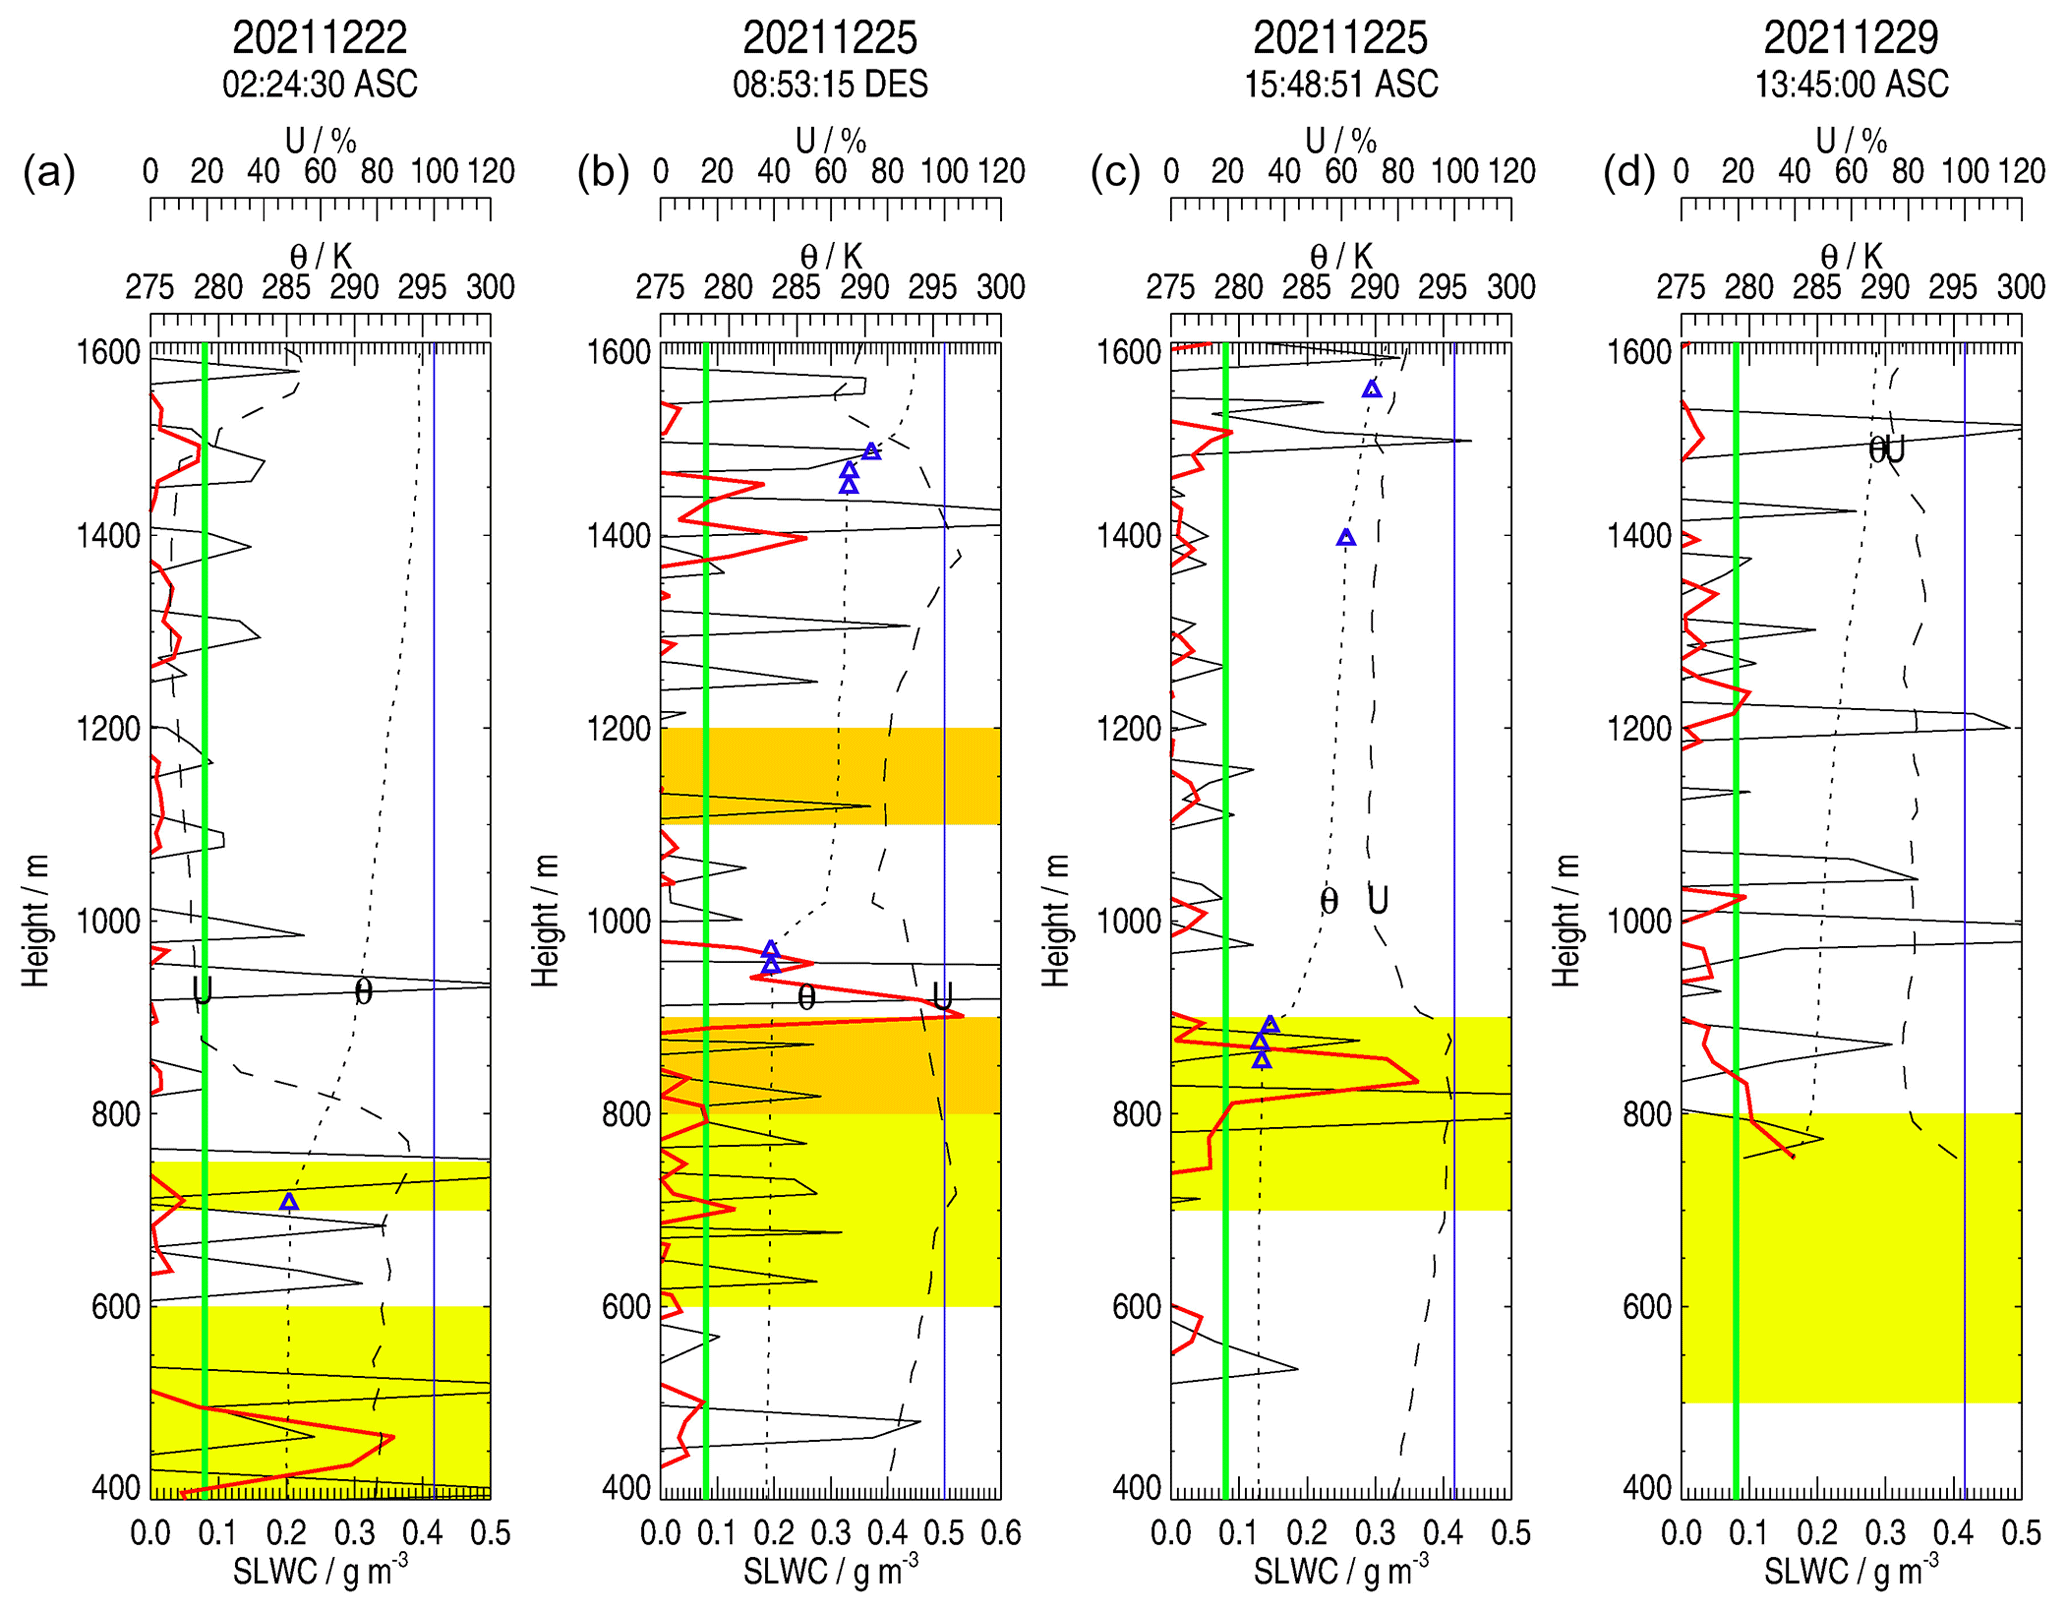
Figure 12From panel (a) to panel (d): profiles of SLWC (black; g m−3) observed on 22 December 2021 at 02:24 UTC (ascending phase), 25 December 2021 at 10:30 UTC (descending phase) after a launch at 08:53 UTC, 25 December 2021 at 15:58 UTC (ascending phase), and 29 December 2021 at 13:45 UTC (ascending phase). Four-point (20 s) running averages are displayed in red. The potential temperature (θ, K) and the relative humidity (U, %) are shown as dotted and dashed lines, respectively. Blue triangles represent the heights of the potential temperature inflection points. The green vertical line represents the estimated 1σ error (0.08 g m−3) of the SLWC calculated from the SLWC sonde observations. The blue vertical line indicates the 100 % relative humidity. The vertical extension of the SLW clouds as observed by the lidar within a ±1 h window centred on the launch time (ascending phase) and on the time of the flight end (descending phase) is highlighted in yellow and orange, respectively.
From 29 December 2021, to reduce the duration of instability of the SLWC sonde just after the launch of the balloon, we no longer used an unwinder but an unwound string of length L = 40 m (L06 and L07 on 29 December 2021 and L11 on 17 January 2022) or L = 20 m (L14 on 24 January 2022 and L15 on 28 January 2022). We still used a parachute to make observations during the descending phase.
On 29 December 2021, two launches occurred at 13:45:00 UTC (L06 in ascending phase) and at 17:47:51 UTC (L07 in ascending phase) after more than 2 h of SLW clouds observed by the lidar (Fig. S3). The launches were associated with HAMSTRAD LWP values of 1.0–3.5 g m−2. Note that, on L06, the PTU and SLWC sondes only started acquiring data above 750 m in the ascending phase.
On L06 (Fig. 12), an SLW cloud is detected by the sonde between 750 and 825 m with a maximum SLWC of 0.16 g m−3, and, on L07 (Fig. 13), two SLW clouds are estimated from 425 to 600 m with an SLWC of 0.32 g m−3 at 500 m and from 750 to 900 m with an SLWC of 0.28 g m−3 at 850 m. On L06, the potential temperature inflection point is certainly below the height of 750 m where the sondes started acquiring near-saturated air at 750 m, and, on L07, two potential temperature inflection points are measured at H(θinf) = 700 and 850 m, with saturated or near-saturated air (U ∼ 100 % and ∼ 90 %, respectively). The SLW clouds derived from the SLWC sonde are in the lowermost part of or slightly below H(θinf). For L06, the lidar observed an SLW cloud at 500–800 m encompassing the sonde at 750–825 m. For L07, the lidar observed an SLW cloud at 600–750 m between the two cloud layers observed by the sonde at 425–600 and 750–900 m. The amounts of SLWC observed by the sonde and integrated over the layers 750–825 (L06), 425–600 (L07), and 750–900 m (L07) are about 7.5, 33.2, and 23.9 g m−2, respectively, slightly larger (L06) and much larger (L07) than the minimum–maximum values of the LWP observed by HAMSTRAD on that day (1.0–3.5 g m−2). Two important points need to be emphasized to explain this excess in SLWC observed by the sonde on L07. (1) f is not stable along the vertical during the first few hundred metres after launch (Fig. S19), contrary to what was observed during the previous flights analysed (Sect. 4.2 and 4.3). (2) The ascending velocity on this day was lower (ω ∼ 3.5 m s−1) than the nominal velocity of the air relative to the vibrating wire (∼ 5 m s−1).
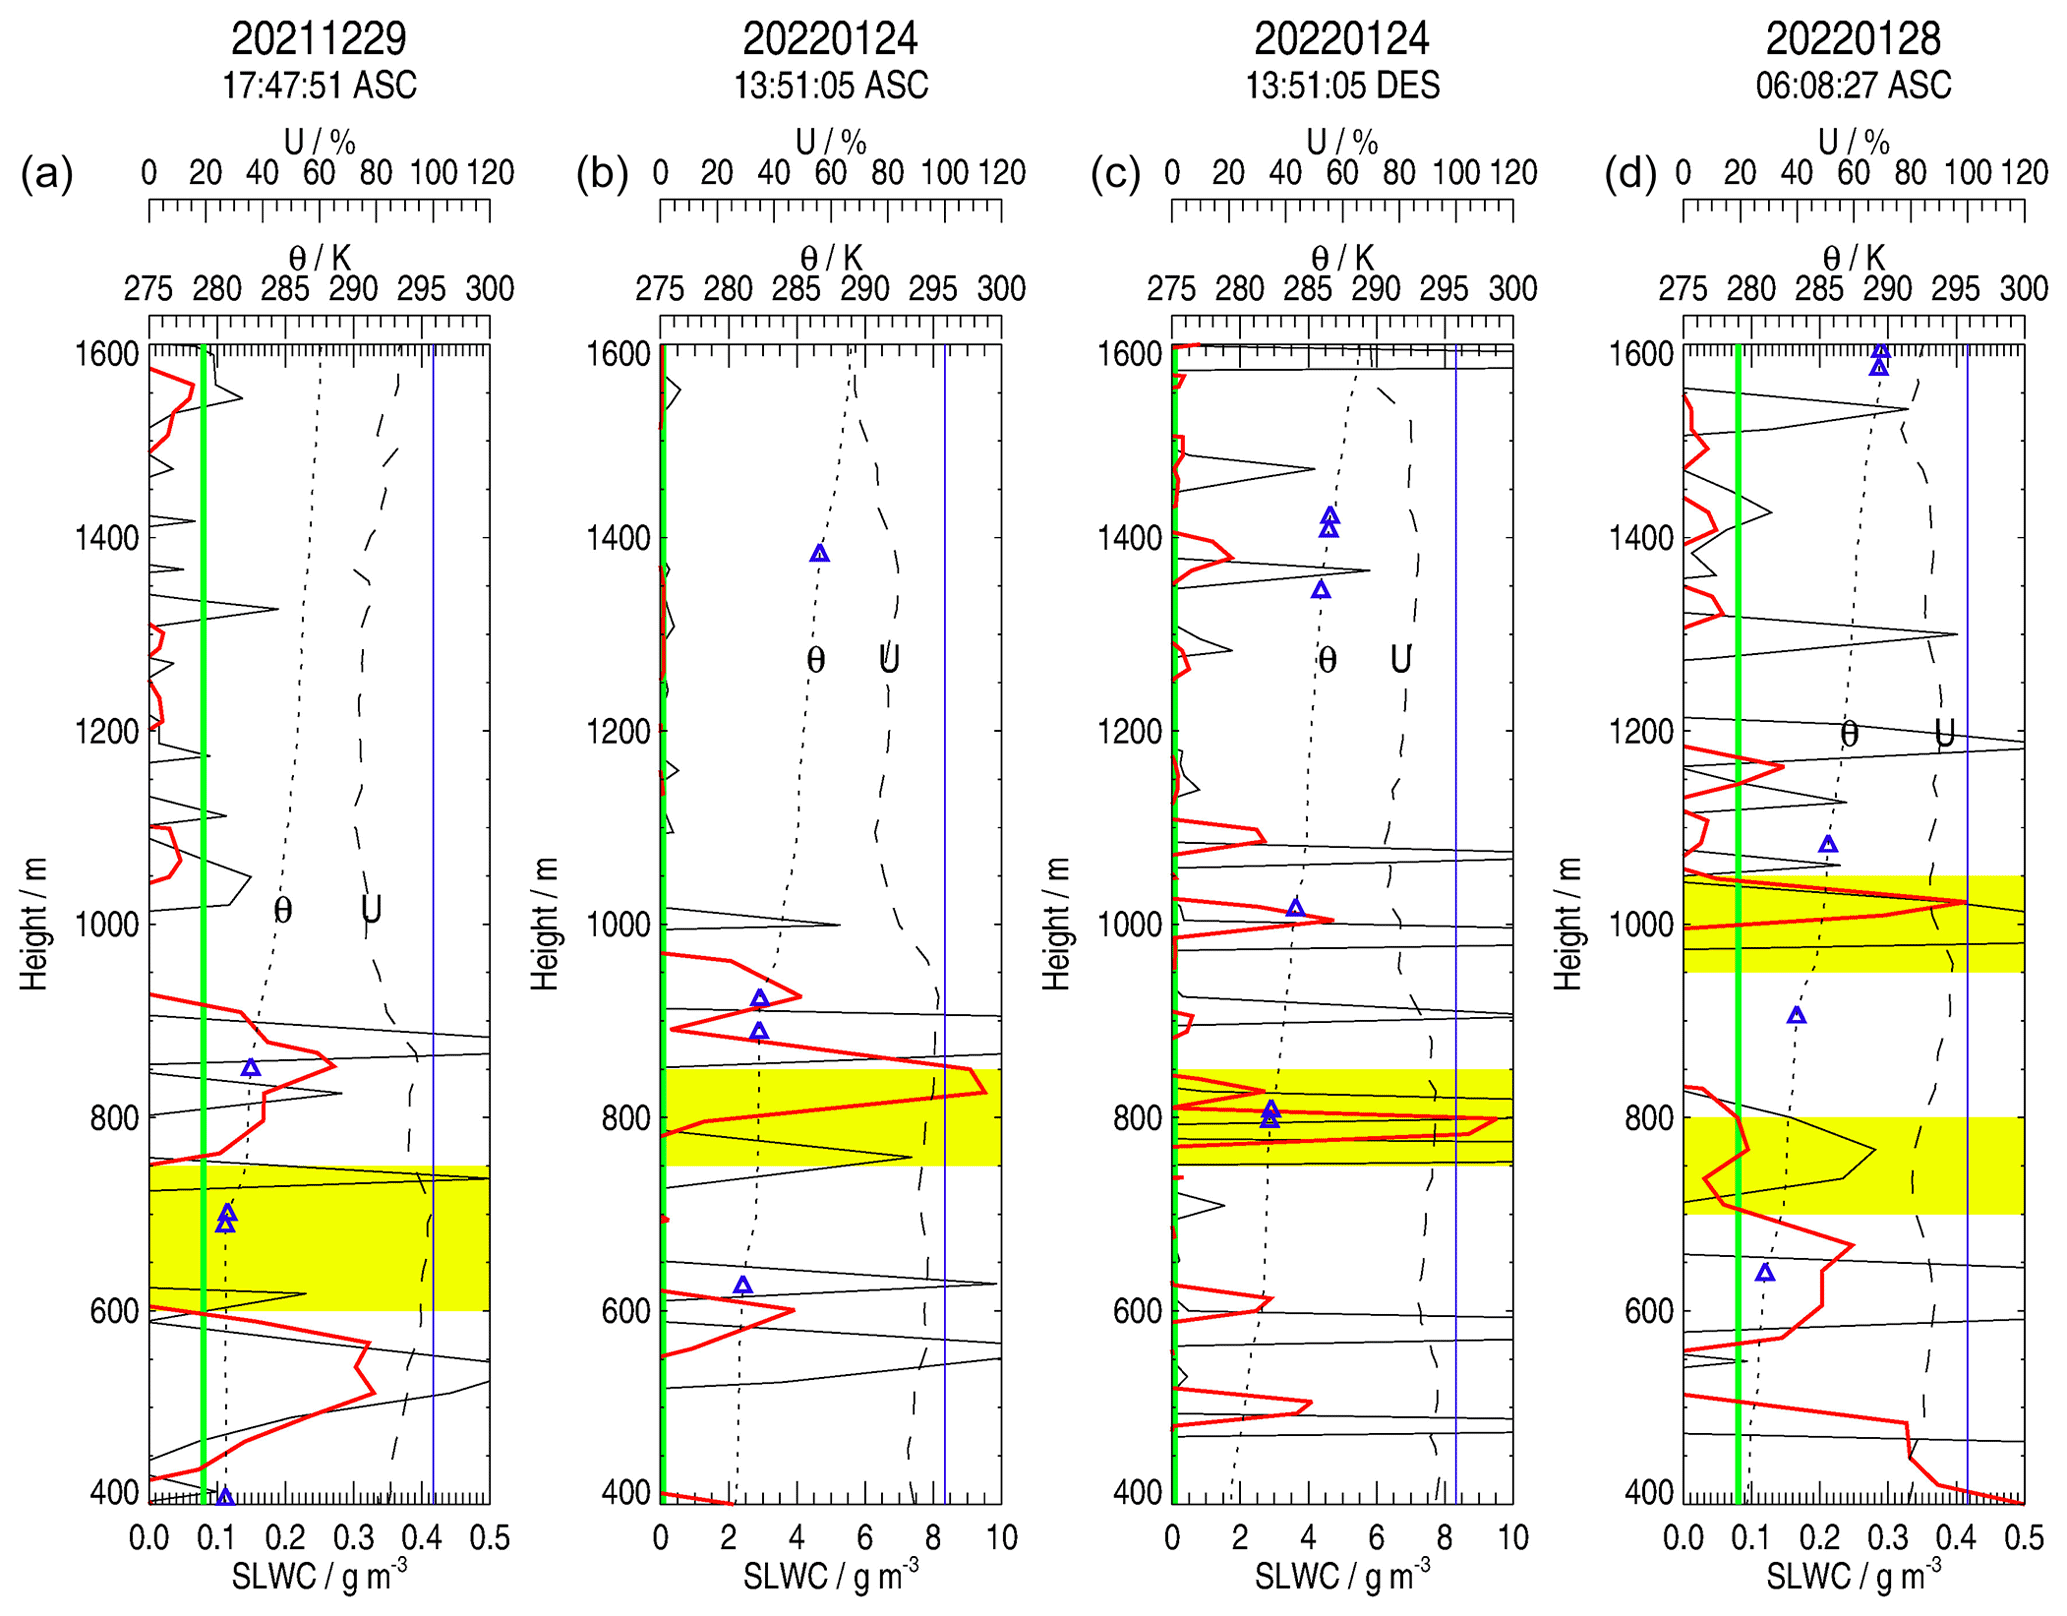
Figure 13From panel (a) to panel (d): same as Fig. 12 but on 29 December 2021 at 17:47 UTC (ascending phase), 24 January 2022 at 13:51 UTC (ascending phase), 24 January 2022 at 15:30 UTC (descending phase) after a launch at 13:51 UTC, and 28 January 2022 at 06:08 UTC (ascending phase).
On 24 January 2022, we used both the ascending and descending phases of the flight initiated at 13:51:05 UTC (L14) after more than 2 h of SLW clouds observed by the lidar (Fig. S4) near the surface between 0 and 200 m. In fact, an episode of intense liquid fog developed just before the launch. The launch was associated with HAMSTRAD LWP values of 1.5–3.0 g m−2. One of the main caveats with liquid fog is that, when it is intense, the lidar signal cannot propagate efficiently, and the presence of any cloud above the liquid fog layer may not be detected. Note that, when the sondes reached the ground at the end of the flight, the balloon had travelled a distance of about 15 km from Concordia Station during 1 h 25 min of flight (Fig. S25). In the ascending phase (L14), two SLW clouds are estimated, around 600 m and from 800 to 1000 m (Fig. 13). Potential temperature inflection points are detected at H(θinf) = 630 and 920 m, with air close to saturation (U ∼ 90 %–95 %), and, to a lesser extent, at 1400 m. In the descending phase (L15), several spikes of SLW clouds were detected below 1200 m, but the most intense one was located at 775–825 m (Fig. 13). The potential temperature inflection points were measured at H(θinf) = 810, 1340, and 1420 m, with relative humidity U ranging 85 %–95 %. In both phases, the SLW clouds derived from the SLWC sonde are located in the lowermost part of the entrainment/capping inversion zone. During the flight, the lidar measured two SLW clouds at 50–250 and 750–850 m, in addition to near-surface liquid fog. This means that the SLW cloud around 800 m was detected by all the instruments, while an underlying SLW cloud was detected around 600 m by the sondes and much lower (at 350 m) by the lidar, slightly below the lowest level where the SLWC sondes start to work well. The SLWCs observed by the sonde and integrated within the layers 800–1000 m (ascending phase) and 775–825 m (descending phase) are about 575.3 and 28.7 g m−2, respectively – much larger than the minimum–maximum values observed by HAMSTRAD on that day (1–5 g m−2). Two important points must be emphasized in order to explain this excess of SLWC and LWP derived from the sonde in situ observations. (1) As far as L14 is concerned, f was not stable along the vertical during the first few hundred metres after launch (Figs. S21 and S22), contrary to what was observed during the previous flights analysed (Sect. 4.2 and 4.3). (2) Above all, the flight was carried out when a liquid fog episode developed over the station. Some SLW droplets could well have adhered to the wire of the SLWC sonde before the launch and perturbed the nominal operation of the sonde system, namely the value of the un-iced wire frequency f0 in Eq. (1) and the post-launch stabilization process.
The last launch of the summer campaign was performed on 28 January 2022 at 06:08:27 UTC (L15 in ascending phase) after more than 2 h of SLW clouds observed by the lidar (Fig. S5) at 600–800 and 900–1000 m. The launch was associated with HAMSTRAD LWP values of 3.0–3.5 g m−2. After the launch, the lidar detected SLW clouds at about 1000 m. Excluding the large signal at 400–500 m, which is probably due to some residual vibrations from the launch (Fig. 13), two SLW clouds are estimated by the SLWC sonde at 550–700 m with an SLWC of 0.25 g m−3 at 650 m and at 1000–1050 m with an SLWC of 0.40 g m−3. Three potential temperature inflection points are estimated at H(θinf) = 650, 910, and 1080 m, with U ranging from 85 %–95 %. The SLW clouds detected by the SLWC sonde at ∼ 650 and ∼ 1000 m are well within the entrainment/capping inversion zone and are at heights slightly less than the lidar observations (700–800 m) and very consistent with the lidar measurements (950–1050 m), respectively. The SLWC observed by the sonde and integrated within the 550–700 m and the 1000–1050 m layers is about 13.7 and 7.3 g m−2, respectively – slightly larger than the minimum–maximum values observed by HAMSTRAD on that day (2–5 g m−2).
5.1 SLW cloud
Our study reveals that, during the 2021–2022 summer campaign at Concordia, the detection of the SLW cloud heights shows high agreement between the remote-sensing observations with the lidar and the in situ observations with the SLWC sondes. The clouds are generally located just below the height H(θinf) of an inflection point in the potential temperature profile, within a layer where the relative humidity U exceeds 80 %, sometimes reaching saturation (100 %), and in the lowermost part of the entrainment/capping inversion zone depending on the local time. These results are in agreement both with the theory of the diurnal evolution of the PBL, for which boundary-layer clouds develop at the top of the PBL (Stull, 2012), and with the first studies carried out at Concordia based only on remote-sensing observations (Ricaud et al., 2020). The presence of the SLW clouds is also observed (1) below the height of the inflection point in potential temperature profile during the high-performance instrumented airborne platform for environmental research (HIAPER) pole-to-pole observations of global transects over the Southern Ocean (Chubb et al., 2013) and (2) around the height of the inflection point in temperature profile above the South Pole station from backscatter lidar signal (Lawson and Gettelman, 2014).
The SLWC maxima measured by the sondes ranged 0.2–0.5 g m−3 in nominal operations. This is consistent with (1) the observations performed in the Arctic with the same sondes and with a surface-based AMF3 microwave radiometer (maximum of 0.3–0.4 g m−3) attached to a tethered balloon (Dexheimer et al., 2019), (2) in situ airborne observations from HIAPER (maximum of 0.47 g m−3) (Chubb et al., 2013), (3) the 580 s observations from the Southern Ocean Clouds, Radiation, Aerosol Transport Experimental Study (SOCRATES) airborne campaign over the Southern Ocean (maximum SLWC of 0.60 g m−3), and (4) results from three climate models (maximum SLWC ranging from 0.36 to 0.40 g m−3) (Yang et al., 2021).
It should also be noted that the variations at scales smaller than 100 m in the vertical profiles of the SLWC observations are smoothed out because of (1) the 5 s integration time of the raw measurements, (2) the method of deriving the SLWC from Eq. (1) which requires the use of the vertical derivative of f, and (3) the four-point running average applied to the observations to minimize the effect of large signal frequency undulations on the retrieved SLWC. Therefore, the actual location of the SLW clouds from the SLWC sondes might be slightly displaced compared with the actual location of the entrainment and capping inversion zones derived from the PTU sondes.
5.2 Vertically integrated SLWCs
The vertically integrated SLWCs calculated from in situ observations were consistent with the minimum–maximum LWPs observed by HAMSTRAD (L01 and L03 with unwinders) or slightly larger than the maximum of LWP (L04 and L15 with an unwinder and a fixed string of L = 20 m, respectively). L07 (fixed string of L = 40 m) gave a vertically integrated SLWC greater than that observed by HAMSTRAD by a factor of 5–10, and we can point out that the ascent vertical velocity was certainly too low for the sonde to operate nominally. Finally, for the flight carried out when a liquid fog episode was present (L14), the vibrating wire of the SLWC sonde was probably affected by this event before launch, producing an unrealistically large amount of SLWC during the flight. Furthermore, our best results were obtained with an SLWC sonde attached to the balloon with an unwinder.
In nominal operations, LWPs from the sondes were consistent with HAMSTRAD observations (1–14 g m−2). Nevertheless, LWPs observed over Concordia far inland on the Antarctic Plateau were much less than those observed in the Arctic (15–40 g m−2 in Dexheimer et al., 2019, and greater than 50 g m−2 in Zhang et al., 2019) and over the coastal Antarctic station of McMurdo (10–50 g m−2 in Zhang et al., 2019, and 40–60 g m−2 in Hines et al., 2021).
5.3 Quality/sensitivity of the SLWC sonde
Flying during a cloud-free period helped to characterize the random RMSE σ associated with the retrieved SLWC. Compared to the other flights carried out during the campaign, the cloud-free flight (L11 with a fixed string of L = 40 m) was nominal, with a low variability in f during the ascent and descent phases for heights above 400 m, from which we estimated that σ was about 0.08 g m−3.
The way the balloon is released is a key issue for the stability of the SLWC sonde and needs to be addressed whenever the SLW clouds of interest are near the surface within the PBL. Irrespective of the method used (unwinder or unwound string), during the 2021–2022 summer season we were unable to find a way to stabilize the sonde in less than 60 s after launch. One of the main difficulties was that some SLW clouds were located around 400 ± 100 m, and, in this case, we were unable to determine whether the variations in the frequency derivatives were due to an instability of the sonde or to a real SLW cloud.
Finally, in our opinion, the optimum way to launch the SLWC sonde was to attach it to the balloon with an unwinder, although we obtained one scientifically exploitable flight using an unwound string of length L = 40 m (L07 on 29 December 2021). However, we have only nine flights, and more flights would be needed to confirm this. We have already highlighted the difficulty of numerical weather prediction models in reproducing the SLW clouds over Concordia, which produces erroneous cloud radiative forcings (Ricaud et al., 2020) along with biased temperature and humidity profiles in the PBL (Ricaud et al., 2023). Therefore, in situ observations, although difficult to deploy, still remain a key tool for improving NWPs in these harsh environments.
The present study intended to observe in situ SLW clouds above Concordia Station by means of sondes sensitive to SLW that were specially developed by Anasphere. These sondes were attached to meteorological balloons and connected to standard Vaisala PTU sondes during the 2021–2022 summer campaign. These launches were coupled with observations from a backscattered lidar providing the nature and height of the clouds and from a microwave radiometer providing the LWP. Over a total of 15 launches, 7 were scientifically exploitable mainly above 400 m a.g.l., a threshold height imposed by the time the SLWC sonde takes to stabilize after launch.
The three main outcomes from our analysis are as follows:
- a.
The in situ observations of SLW clouds with SLWC sondes at Concordia Station in Antarctica are the first observations so far in Antarctica with an SLWC sonde. The location in height of the SLW clouds observed by the SLWC sonde is consistent with the profiles of humidity and temperature (and the deduced inflection points).
- b.
On average, the heights of the SLW clouds as observed by in situ sondes and remote-sensing lidar are consistent.
- c.
The liquid water path (vertically integrated supercooled liquid water content, SLWC) deduced from the sonde observations is generally equal to or greater than the LWP remotely sensed by a ground-based microwave radiometer, in spite of its low values (< 10 g m−2). Unfortunately, on some occasions far from nominal operation (surface liquid fog, low vertical ascent of the balloon), the vertically integrated SLWCs from the sonde were overestimated by a factor of 5–10 compared to the HAMSTRAD LWPs.
Although the vertical sensitivity of the SLWC observations is around 100 m due to the methodology employed (four-point running average of 5 s integration time) and to the vertical ascent of 5 m s−1, the SLW clouds were observed in a layer close to saturation (U > 80 %) or saturated (U ∼ 100 %–105 %) just below or at the lowermost part of the entrainment zone, or capping inversion zone, which exists at the top of the PBL and is characterized by an inflection point in the potential temperature vertical profiles. Consequently, our results are consistent with the theoretical view that SLW clouds form and remain at the top of the PBL.
Because of the positive scientific results obtained during this first balloon campaign, and since the second campaign in 2022–2023 was technologically successful using a VTOL drone, we forecast a new summer campaign to probe the PBL with an SLWC sonde on board a drone. The main advantages of the drone compared with the meteorological balloon are that (1) it can fly every day or even twice a day with the same SLWC sonde on board, minimizing the number of SLWC and PTU sondes used; (2) it does not require helium gas, which is increasingly difficult and costly with time; and (3) it allows us to explore the horizontal variability in the clouds that over-performs the single location of the vertical profiles provided by ground-based instruments.
HAMSTRAD data are available at http://www.cnrm.meteo.fr/spip.php?article961&lang=en (Ricaud, 2024). The tropospheric depolarization lidar data are available at http://lidarmax.altervista.org/lidar/home.php (Del Guasta, 2024). Radiosonde data are available at http://www.climantartide.it/dataaccess/RDS_CONCORDIA/index.php?lang=en (Grigioni, 2024).
The supplement related to this article is available online at: https://doi.org/10.5194/amt-17-5071-2024-supplement.
PR, MDG, GC, AR, PG, and JB provided the observational data. PR developed the methodology with the help of all co-authors. All co-authors participated in the data analysis and interpretation. PR prepared the article with contributions from all co-authors.
The contact author has declared that none of the authors has any competing interests.
Publisher’s note: Copernicus Publications remains neutral with regard to jurisdictional claims made in the text, published maps, institutional affiliations, or any other geographical representation in this paper. While Copernicus Publications makes every effort to include appropriate place names, the final responsibility lies with the authors.
The present research project, Water Budget over Dome C (H2O-DC), has been approved by the Year of Polar Prediction (YOPP) international committee. The permanently staffed Concordia Station is jointly operated by Institut polaire français Paul-Émile Victor (IPEV) and the Italian Programma Nazionale di Ricerche in Antartide (PNRA). The tropospheric lidar has been operated at Dome C since 2008 within the framework of several Italian national (PNRA) projects. We would like to thank all the winter-over personnel who worked at Dome C on the different projects. Finally, we would like to thank the three anonymous reviewers for their beneficial comments.
The HAMSTRAD programme 910 and the SLW-CLOUDS programme 1247 were supported by IPEV, the Institut National des Sciences de l'Univers (INSU)/Centre National de la Recherche Scientifique (CNRS), Météo-France, and the Centre national d'études spatiales (CNES).
This paper was edited by Alexander Kokhanovsky and reviewed by three anonymous referees.
Bain, M. and Gayet, J. F.: Aircraft measurements of icing in supercooled and water droplet/ice crystal clouds, J. Appl. Meteorol., 21, 631–641, https://www.jstor.org/stable/26180452 (last access: 27 August 2024), 1982.
Bromwich, D. H., Nicolas, J. P., Hines, K. M., Kay, J. E., Key, E. L., Lazzara, Lubin, D., McFarquhar, G. M., Gorodetskaya, I. V., Grosvenor, D. P., Lachlan-Cope, T., and van Lipzig, N. P. M.: Tropospheric clouds in Antarctica, Rev. Geophys., 50, RG1004, https://doi.org/10.1029/2011RG000363, 2012.
Bromwich, D. H., Otieno, F. O., Hines, K. M., Manning, K. W., and Shilo, E.: Comprehensive evaluation of polar weather research and forecasting model performance in the Antarctic, J. Geophys. Res.-Atmos., 118, 274–292, 2013.
Chubb, T. H., Jensen, J. B., Siems, S. T., and Manton, M. J.: In situ observations of supercooled liquid clouds over the Southern Ocean during the HIAPER pole-to-pole observation campaigns, Geophys. Res. Lett., 40, 5280–5285, 2013.
Cossich, W., Maestri, T., Magurno, D., Martinazzo, M., Di Natale, G., Palchetti, L., Bianchini, G., and Del Guasta, M.: Ice and mixed-phase cloud statistics on the Antarctic Plateau, Atmos. Chem. Phys., 21, 13811–13833, https://doi.org/10.5194/acp-21-13811-2021, 2021.
Del Guasta, M.: LIDAR – INO CNR in Antartide, INO-CNR [data set], http://lidarmax.altervista.org/lidar/home.php, last access: 17 January 2024.
Dexheimer, D., Airey, M., Roesler, E., Longbottom, C., Nicoll, K., Kneifel, S., Mei, F., Harrison, R. G., Marlton, G., and Williams, P. D.: Evaluation of ARM tethered-balloon system instrumentation for supercooled liquid water and distributed temperature sensing in mixed-phase Arctic clouds, Atmos. Meas. Tech., 12, 6845–6864, https://doi.org/10.5194/amt-12-6845-2019, 2019.
Engdahl, B. J. K., Thompson, G., and Bengtsson, L.: Improving the representation of supercooled liquid water in the HARMONIE-AROME weather forecast model, Tellus A, 72, 1–18, https://doi.org/10.1080/16000870.2019.1697603, 2020.
Fogt, R. L. and Bromwich, D. H.: Atmospheric moisture and cloud cover characteristics forecast by AMPS, Weather Forecast., 23, 914–930, 2008.
Grazioli, J., Genthon, C., Boudevillain, B., Duran-Alarcon, C., Del Guasta, M., Madeleine, J.-B., and Berne, A.: Measurements of precipitation in Dumont d'Urville, Adélie Land, East Antarctica, The Cryosphere, 11, 1797–1811, https://doi.org/10.5194/tc-11-1797-2017, 2017.
Grigioni, P.: Antarctic Meteo-Climatological Observatory, IAMCO [data set], http://www.climantartide.it/dataaccess/RDS_CONCORDIA/index.php?lang=en, last access: 17 January 2024.
Grosvenor, D. P., Choularton, T. W., Lachlan-Cope, T., Gallagher, M. W., Crosier, J., Bower, K. N., Ladkin, R. S., and Dorsey, J. R.: In-situ aircraft observations of ice concentrations within clouds over the Antarctic Peninsula and Larsen Ice Shelf, Atmos. Chem. Phys., 12, 11275–11294, https://doi.org/10.5194/acp-12-11275-2012, 2012.
Hennemuth, B. and Lammert, A.: Determination of the atmospheric boundary layer height from radiosonde and lidar backscatter, Bound.-Lay. Meteorol., 120, 181–200, https://doi.org/10.1007/s10546-005-9035-3, 2006.
Hines, K. M., Bromwich, D. H., Silber, I., Russell, L. M., and Bai, L.: Predicting Frigid Mixed-Phase Clouds for Pristine Coastal Antarctica, J. Geophys. Res.-Atmos., 126, e2021JD035112, https://doi.org/10.1029/2021JD035112, 2021.
Hogan, R. J. and Illingworth, A. J.: The effect of specular reflection on spaceborne lidar measurements of ice clouds, Report for the ESA “Retrieval algorithms for EarthCARE” project, 5 pp., http://www.met.reading.ac.uk/~swrhgnrj/publications/specular.pdf (last access: 27 August 2024), 2003.
King, J. C., Argentini, S. A., and Anderson, P. S.: Contrasts between the summertime surface energy balance and boundary layer structure at Dome C and Halley stations, Antarctica, J. Geophys. Res.-Atmos., 111, D02105, https://doi.org/10.1029/2005JD006130, 2006.
King, J. C., Gadian, A., Kirchgaessner, A., Kuipers Munneke, P., Lachlan-Cope, T. A., Orr, A., Reijmer, C., Broeke, M. R., van Wessem, J. M., and Weeks, M.: Validation of the summertime surface energy budget of Larsen C Ice Shelf (Antarctica) as represented in three high-resolution atmospheric models, J. Geophys. Res.-Atmos., 120, 1335–1347, https://doi.org/10.1002/2014JD022604, 2015.
Lachlan-Cope, T.: Antarctic clouds, Polar Res., 29, 150–158, 2010.
Lachlan-Cope, T., Listowski, C., and O'Shea, S.: The microphysics of clouds over the Antarctic Peninsula – Part 1: Observations, Atmos. Chem. Phys., 16, 15605–15617, https://doi.org/10.5194/acp-16-15605-2016, 2016.
Lawson, R. P. and Gettelman, A.: Impact of Antarctic mixed-phase clouds on climate, P. Natl. Acad. Sci. USA, 111, 18156–18161, 2014.
Lemus, L., Rikus, L., Martin, C., and Platt, R.: Global cloud liquid water path simulations, J. Climate, 10, 52–64, 1997.
Lenaerts, J. T., Van Tricht, K., Lhermitte, S., and L'Ecuyer, T. S.: Polar clouds and radiation in satellite observations, reanalyses, and climate models, Geophys. Res. Lett., 44, 3355–3364, 2017.
Listowski, C. and Lachlan-Cope, T.: The microphysics of clouds over the Antarctic Peninsula – Part 2: modelling aspects within Polar WRF, Atmos. Chem. Phys., 17, 10195–10221, https://doi.org/10.5194/acp-17-10195-2017, 2017.
Listowski, C., Delanoë, J., Kirchgaessner, A., Lachlan-Cope, T., and King, J.: Antarctic clouds, supercooled liquid water and mixed phase, investigated with DARDAR: geographical and seasonal variations, Atmos. Chem. Phys., 19, 6771–6808, https://doi.org/10.5194/acp-19-6771-2019, 2019.
Lozowski, E. P., Stallabrass, J. R., and Hearty, P. F.: The icing of an unheated, nonrotating cylinder. Part I: A simulation model. Journal of Appl. Meteorol. Clim., 22, 2053–2062, https://doi.org/10.1175/1520-0450(1983)022<2053:TIOAUN>2.0.CO;2, 1983.
Lubin, D., Chen, B., Bromwich, D. H., Somerville, R. C., Lee, W. H., and Hines, K. M.: The Impact of Antarctic Cloud Radiative Properties on a GCM Climate Simulation, J. Climate, 11, 447–462, 1998.
Mishchenko, M. I., Hovenier, J. W., and Travis, L. D. (Eds.): Light Scattering by Nonspherical Particles: Theory, Measurements, and Applications, Academic Press, Chap. 14, 393–416, 2000.
O'Shea, S. J., Choularton, T. W., Flynn, M., Bower, K. N., Gallagher, M., Crosier, J., Williams, P., Crawford, I., Fleming, Z. L., Listowski, C., Kirchgaessner, A., Ladkin, R. S., and Lachlan-Cope, T.: In situ measurements of cloud microphysics and aerosol over coastal Antarctica during the MAC campaign, Atmos. Chem. Phys., 17, 13049–13070, https://doi.org/10.5194/acp-17-13049-2017, 2017.
Ricaud, P.: HAMSTRAD, CNRM [data set], http://www.cnrm.meteo.fr/spip.php?article961&lang=en, last access: 17 January 2024.
Ricaud, P., Gabard, B., Derrien, S., Chaboureau, J.-P., Rose, T., Mombauer, A., and Czekala, H.: HAMSTRAD-Tropo, A 183-GHz Radiometer Dedicated to Sound Tropospheric Water Vapor Over Concordia Station, Antarctica, IEEE T. Geosci. Remote, 48, 1365–1380, https://doi.org/10.1109/TGRS.2009.2029345, 2010.
Ricaud, P., Bazile, E., del Guasta, M., Lanconelli, C., Grigioni, P., and Mahjoub, A.: Genesis of diamond dust, ice fog and thick cloud episodes observed and modelled above Dome C, Antarctica, Atmos. Chem. Phys., 17, 5221–5237, https://doi.org/10.5194/acp-17-5221-2017, 2017.
Ricaud, P., Del Guasta, M., Bazile, E., Azouz, N., Lupi, A., Durand, P., Attié, J.-L., Veron, D., Guidard, V., and Grigioni, P.: Supercooled liquid water cloud observed, analysed, and modelled at the top of the planetary boundary layer above Dome C, Antarctica, Atmos. Chem. Phys., 20, 4167–4191, https://doi.org/10.5194/acp-20-4167-2020, 2020.
Ricaud, P., Medina, P., Durand, P., Attié, J. L., Bazile, E., Grigioni, P., Guasta, M. D., and Pauly, B.: In Situ VTOL Drone-Borne Observations of Temperature and Relative Humidity over Dome C, Antarctica, Drones, 7, 532, https://doi.org/10.3390/drones7080532, 2023.
Ricaud, P., Del Guasta, M., Lupi, A., Roehrig, R., Bazile, E., Durand, P., Attié, J.-L., Nicosia, A., and Grigioni, P.: Supercooled liquid water clouds observed over Dome C, Antarctica: temperature sensitivity and cloud radiative forcing, Atmos. Chem. Phys., 24, 613–630, https://doi.org/10.5194/acp-24-613-2024, 2024.
Serke, D., Hall, E., Bognar, J., Jordan, A., Abdo, S., Baker, K., Seitel, T., Nelson, M., Ware, R., McDonough, F., and Politovich, M.: Supercooled liquid water content profiling case studies with a new vibrating wire sonde compared to a ground-based microwave radiometer, Atmos. Res., 149, 77–87, https://doi.org/10.1016/j.atmosres.2014.05.026, 2014.
Stull, R. B.: An introduction to boundary layer meteorology, Vol. 13, Springer Science & Business Media, ISBN 90-277-2769-4, 2012.
Tomasi, C., Petkov, B., Mazzola, M., Ritter, C., di Sarra, A., di Iorio, T., and del Guasta, M.: Seasonal variations of the relative optical air mass function for background aerosol and thin cirrus clouds at Arctic and Antarctic sites, Remote Sens.-Basel, 7, 7157–7180, 2015.
Yang, C. A., Diao, M., Gettelman, A., Zhang, K., Sun, J., McFarquhar, G., and Wu, W.: Ice and supercooled liquid water distributions over the Southern Ocean based on in situ observations and climate model simulations, J. Geophys. Res.-Atmos., 126, e2021JD036045, https://doi.org/10.1029/2021JD036045, 2021.
Young, G., Lachlan-Cope, T., O'Shea, S. J., Dearden, C., Listowski, C., Bower, K. N., Choularton, T. W., and Gallagher, M. W.: Radiative effects of secondary ice enhancement in coastal Antarctic clouds, Geophys. Res. Lett., 46, 2312–2321, https://doi.org/10.1029/2018GL080551, 2019.
Zhang, D., Vogelmann, A., Kollias, P., Luke, E., Yang, F., Lubin, D., and Wang, Z.: Comparison of Antarctic and Arctic single-layer stratiform mixed-phase cloud properties using ground-based remote sensing measurements, J. Geophys. Res.-Atmos., 124, 10186–10204, https://doi.org/10.1029/2019JD030673, 2019.