the Creative Commons Attribution 4.0 License.
the Creative Commons Attribution 4.0 License.
 | 18 Sep 2024
Assessment of the impact of NO2 contribution on aerosol-optical-depth measurements at several sites worldwide
Stelios Kazadzis
Masimo Valeri
Ioannis-Panagiotis Raptis
Gabrielle Brizzi
Kyriakoula Papachristopoulou
Francesca Barnaba
Stefano Casadio
Axel Kreuter
Fabrizio Niro
This work aims at investigating the effect of NO2 absorption on aerosol-optical-depth (AOD) measurements and Ångström exponent (AE) retrievals of sun photometers by the synergistic use of accurate NO2 characterization for optical-depth estimation from co-located ground-based measurements. The analysis was performed for ∼ 7 years (2017–2023) at several sites worldwide for the AOD measurements and AE retrievals by Aerosol Robotic Network (AERONET) sun photometers which use OMI (Ozone Monitoring Instrument) climatology for NO2 representation. The differences in AOD and AE retrievals by NO2 absorption are accounted for using high-frequency columnar NO2 measurements by a co-located Pandora spectroradiometer belonging to the Pandonia Global Network (PGN). NO2 absorption affects the AOD measurements in UV-Vis (visible) range, and we found that the AOD bias is the most affected at 380 nm by NO2 differences, followed by 440, 340, and 500 nm, respectively. AERONET AOD was found to be overestimated in half of the cases, while also underestimated in other cases as an impact of the NO2 difference from “real” (PGN NO2) values. Overestimations or underestimations are relatively low. About one-third of these stations showed a mean difference in NO2 and AOD (at 380 and 440 nm) above 0.5 × 10⁻⁴ mol m−2 and 0.002, respectively, which can be considered a systematic contribution to the uncertainties in the AOD measurements that are reported to be of the order of 0.01. However, under extreme NO2 loading scenarios (i.e. 10 % highest differences) at highly urbanized/industrialized locations, even higher AOD differences were observed that were at the limit of or higher than the reported 0.01 uncertainty in the AOD measurement. PGN NO2-based sensitivity analysis of AOD difference suggested that for PGN NO2 varying between 2 × 10⁻⁴ and 8 × 10⁻⁴ mol m−2, the median AOD differences were found to rise above 0.01 (even above 0.02) with the increase in NO2 threshold (i.e. the lower limit from 2 × 10⁻⁴ to 8 × 10⁻⁴ mol m−2). The AOD-derivative product, AE, was also affected by the NO2 correction (discrepancies between the AERONET OMI climatological representation of NO2 values and the real PGN NO2 measurements) on the spectral AOD. Normalized frequency distribution of AE (at 440–870 and 340–440 nm wavelength pair) was found to be narrower for a broader AOD distribution for some stations, and vice versa for other stations, and a higher relative error at the shorter wavelength (among the wavelength pairs used for AE estimation) led to a shift in the peak of the AE difference distribution towards a higher positive value, while a higher relative error at a lower wavelength shifted the AE difference distribution to a negative value for the AOD overestimation case, and vice versa for the AOD underestimation case. For rural locations, the mean NO2 differences were found to be mostly below 0.50 × 10⁻⁴ mol m−2, with the corresponding AOD differences being below 0.002, and in extreme NO2 loading scenarios, it went above this value and reached above 1.00 × 10⁻⁴ mol m−2 for some stations, leading to higher AOD differences but below 0.005. Finally, AOD and AE trends were calculated based on the original AERONET AOD (based on AERONET OMI climatological NO2), and its comparison with the mean differences in the AERONET and PGN NO2-corrected AOD was indicative of how NO2 correction could potentially affect realistic AOD trends.
- Article
(7080 KB) - Full-text XML
- BibTeX
- EndNote


Earth's radiation budget and climate is impacted by both the direct and indirect effects of atmospheric aerosols (IPCC, 2021). The direct effect of aerosols is associated with the absorption and scattering of solar radiation (Hobbs, 1993), while the indirect effect involves the interaction of aerosols with clouds by acting as cloud condensation nuclei and potentially altering cloud properties, precipitation, surface fluxes, and the energy budget of the atmosphere (Rosenfeld et al., 2014; Herbert and Stier, 2023). Apart from the impact on climate and radiative forcing, aerosols also have adverse effects on human health, leading to respiratory, cardiovascular, and neurological diseases, hypertension, diabetes, and even cancer (Lelieveld et al., 2015; Molina et al., 2020). Aerosol optical depth (AOD) is the most widely used parameter for the estimation of columnar atmospheric aerosol concentrations at different spectral bandwidths.
Sun photometers are passive remote sensing instruments that are used for measuring AOD, which is calculated using the Lambert–Beer law by taking into account the contribution from Rayleigh scattering by atmospheric molecules and absorption by atmospheric constituents other than aerosols like ozone, nitrogen dioxide, and water vapour. The global aerosol networks such as AERONET (Aerosol Robotic Network; https://aeronet.gsfc.nasa.gov, last access: 6 September 2024), SKYNET (https://www.skynet-isdc.org/aboutSKYNET.php, last access: 6 September 2024; Nakajima et al., 2020), and GAW-PFR (Global Atmospheric Watch – Precision Filter Radiometer Network; Kazadzis et al., 2018) use specific methodology to account for the optical-depth contributions from these atmospheric constituents in order to retrieve AOD.
AERONET performs optical-depth corrections for Rayleigh scattering at all wavelengths: ozone for the spectral range 340–675 nm, NO2 for the spectral range 340–500 nm, water vapour for 1020–1640 nm, and carbon dioxide and methane for 1640 nm. The uncertainty in AOD measurements from the AERONET algorithm is estimated to be ∼ 0.01 in the visible range that reaches up to ∼ 0.02 in the UV region (Eck et al., 1999; Giles et al., 2019). Other factors contributing to the AOD uncertainty in different spectral bands include the optical-depth estimation from trace-gas (ozone and NO2) absorption, which is sensitive to the estimation of the gas concentrations. Specifically, NO2 absorption is predominant in lower wavelengths (340–500 nm), and hence, the NO2 correction is of significant importance at these wavelengths. This enhances the need to investigate the impact of NO2-absorption-based optical-depth on AOD measurements and the possibility of improvements in the retrieval algorithm with a more accurate NO2 optical-depth estimation using ground-based NO2 measurements.
Emissions of nitrogen oxides on a global scale from natural sources are more significant than that generated from anthropogenic activities (Seinfeld and Pandis, 2016). The natural sources of NOx emissions include wildfires, lightning, oxidation of biogenic ammonia, and microbial processes in soils. The NO2 levels due to NOx emissions from natural sources are referred to as background and are smaller in magnitude in comparison to the anthropogenic NOx emissions (Koukouli et al., 2022). The NOx budget is dominated by fossil fuel combustion, biomass burning emissions, and anthropogenic activities.
Due to inhomogeneous local emission patterns and photochemical destruction in heavily polluted regions, the NO2 has high spatiotemporal variations and a shorter lifetime, with regional confinement near its source (Richter et al., 2005; Boersma et al., 2008; Tzortziou et al., 2014, 2015; Drosoglou et al., 2017; Fan et al., 2021). The high spatiotemporal variation in the tropospheric NO2 can produce significant bias in the AOD measurements (Arola and Koskela, 2004; Boersma et al., 2004). Therefore, the regions with high tropospheric NO2 emissions will have a higher likelihood for deviation from the climatological mean values (Giles et al., 2019). Furthermore, there can also be significant diurnal variation in NO2 (Boersma et al., 2008). Hence, the climatological mean NO2 values might not be able to represent the actual NO2 loading and spatial distribution in the atmosphere. This in turn tends to produce potential errors in the calculation of AOD in the spectral regions with significant NO2 absorption. However, synergistic assistance from the models, satellite observations, or co-located surface-based measuring instruments capable of providing temporal columnar products of NO2 can help in the reduction in the associated uncertainty, and hence, the accuracy of the total column NO2-optical-depth estimation can increase (Herman et al., 2009; Tzortziou et al., 2012). To this end, the Pandonia Global Network (PGN) (https://www.pandonia-global-network.org, last access: 6 September 2024), which is a global network of Pandora spectroradiometers that are used for trace-gas measurements and provide the NO2 concentration, can be useful. These instruments can be used to provide a good estimation of the NO2 concentration in the atmosphere that can help reduce the uncertainty in AOD measurements.
Here we try to follow up on a previous work by Drosoglou et al. (2023b), who analysed the impact of NO2 absorption using PGN-spectroradiometer-based high-frequency columnar NO2 on AOD, Ångström exponent (AE), and single-scattering albedo (SSA) retrievals from AERONET and SKYNET for the urban area of Rome (Italy) for a time period from 2017–2022. The NO2-based AOD correction showed a systematic overestimation of AOD and AE, with mean AOD bias of ∼ 0.003 and ∼ 0.002 at 380 and 440 nm, respectively, for AERONET, a much higher (∼ 0.007) bias for SKYNET, and an average AE bias of ∼ 0.02 and ∼ 0.05 for AERONET and SKYNET, respectively. However, for high-columnar NO2 concentrations (> 0.7 DU, Dobson unit), the average AOD bias ranged between 0.009 and 0.012 for AERONET and ∼ 0.018 for SKYNET. As this study was limited to only one location, a worldwide analysis is needed to better analyse such an NO2-correction-based bias in AOD measurements.
The work presented in this article deals with updating the work of Drosoglou et al. (2023b) that was based in only one station. This is a first attempt to analyse a worldwide scenario in which AERONET and PGN instruments are co-located. So a more specific investigation is performed on a worldwide scale for evaluating the effect of low- to high-NO2 loads on the AOD measurements by ground-based remote sensing in several sites across the globe in order to understand the wider impact of uncertainties introduced in the aerosol property retrievals by NO2 absorption. In particular, we analyse a long-term dataset (∼ 7 years) collected from 33 sites distributed worldwide and where co-located measurements of both NO2 from Pandora spectroradiometers as part of PGN and AOD from AERONET sun photometers are available. Following the Introduction, Sect. 2 deals with the observational data, methodology for the co-located stations, and the retrieval of the aerosol parameters used for the analysis and trend analysis, followed by Sect. 3, which presents the results and discussions. Finally, Sect. 4 summarizes the findings of this study.
2.1 Data
2.1.1 Columnar aerosol property measurements (AOD and AE)
AERONET provides the datasets of aerosol optical, microphysical, and radiative properties through ground-based passive remote sensing using Cimel sun photometers (https://www.cimel.fr/solutions/ce318-t/, last access: 6 September 2024). It has a centralized data processing and distribution system providing the instrument calibration standardization and data acquisition. AERONET direct-sun algorithm data products obtained from the version 3 processing algorithm (Giles et al., 2019) are employed in this work, including level 1.5 AOD measurements at 340, 380, 440, 500, 675, and 870 nm and AE retrievals at 440–870 and 340–440 nm. Level 1.5 data products are cloud-screened and quality-assured. AERONET data used in this work cover a time period between 2017 and 2023, during which synchronous data from the co-located PGN Pandora instrument are also available. For the trend analysis in Sect. 2.2.3, AERONET AOD data between 2013–2023 are considered. The standard AERONET AOD calculations are based on the NO2-optical-depth estimation from the Ozone Monitoring Instrument (OMI/Aura) level 3 climatological (hereafter referred to as OMIc) total NO2 values at a spatial resolution of 0.25° × 0.25° and for the time period between 2004 and 2013.
2.1.2 Vertical column NO2 measurements
The total NO2 column product used in this study is obtained from Pandora spectroradiometers which are part of PGN. Pandora spectroradiometers perform direct solar irradiance and scattered radiance measurements with a high temporal resolution in the spectral range of 280–530 nm for the retrieval of tropospheric and total column densities, near-surface concentrations, and vertical profiles of atmospheric trace gases (e.g. NO2, O3, and HCHO) (e.g. Herman et al., 2009; Tzortziou et al., 2012, 2015). The total column NO2 densities are retrieved from the direct-sun measurements with ∼ 0.6 nm resolution in the spectral range of 280–530 nm, using Blick software by Cede (2024). Pandora NO2 vertical column density (VCD) used in this analysis is obtained from level 2 datasets that provide column amounts, concentrations, profiles, a direct-sun retrieval code “nvs3”, and Blick processor version 1.8. From this dataset, total column NO2 VCD with high- (0, 10) and medium-quality (1, 11) flags are considered.
2.1.3 Satellite observations
Daily tropospheric NO2 columns are retrieved from OMI/Aura level 3, version 1.1, global data products gridded as 0.25° × 0.25° (https://www.earthdata.nasa.gov, last access: 6 September 2024) for the time period of 2017–2023. The retrieved columnar NO2 is cloud-screened, and the average of the global NO2 during 2017–2023 was obtained to get an overview of the regions with high NO2 based on OMI satellite data global measurements as presented in Sect. 2.2.1. These datasets are referred to as OMId (OMI daily) throughout the paper.
2.2 Methodology
2.2.1 Study locations
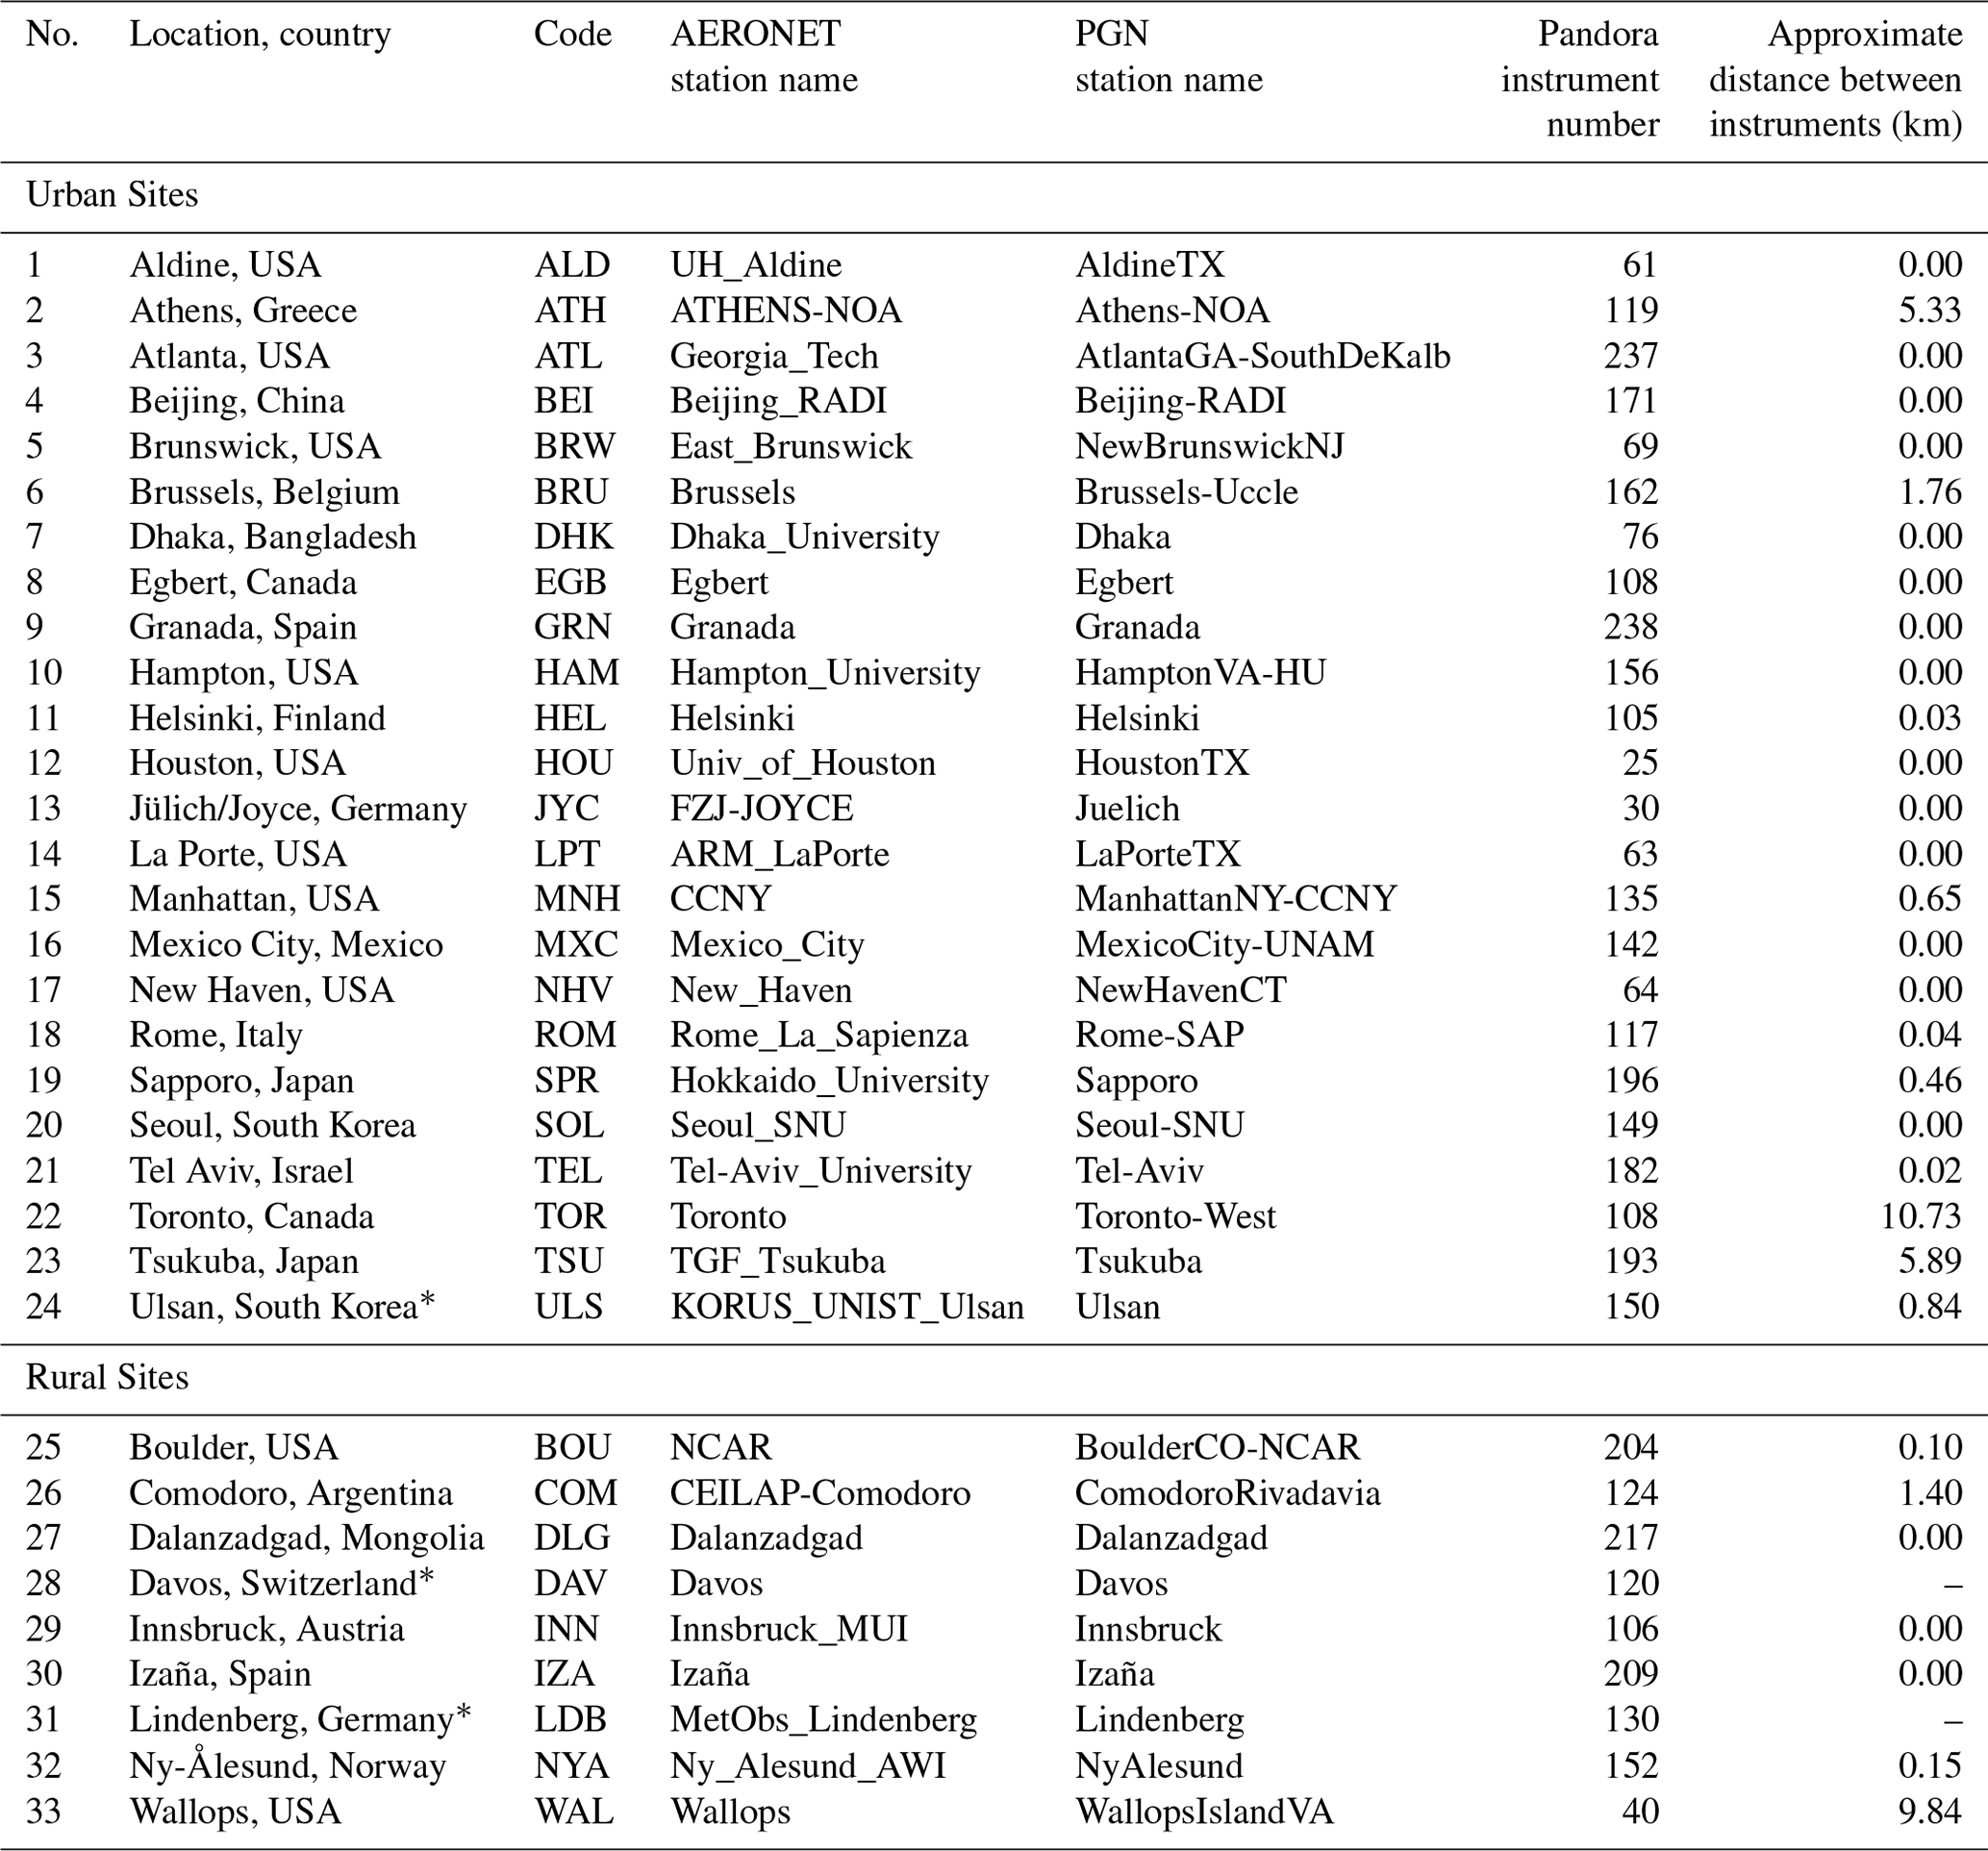
Taking into account the PGN stations around the globe, and having data availability as specified in Sect. 2.1.2 (version and retrieval code), we selected the co-located AERONET stations with matching latitude and longitude. For multiple co-located AERONET stations, the station having the closest match with the PGN station latitude and longitude, a continuous data flow, and/or larger data availability was selected. By applying these criteria, we identified a total of 33 co-located globally distributed stations to be used for the analysis (Table 1; refer to Table A1 for details regarding station names used by AERONET and PGN and instrument number). These include 11 stations in Europe, 14 in North America and South America, 7 in Asia, and 1 in the Middle East (Fig. 1). Out of these, one station is in the Southern Hemisphere (COM), one is a polar station (NYA), and five are high-altitude (> 1000 m above sea level) stations. Figure 1 also reports the OMId-satellite-based (as described in Sect. 2.1.3) long-term mean of daily NO2 values between 2017 and 2023, and this shows that the selected stations cover the NO2 daily mean load representative of conditions ranging from clean (e.g. < 0.2 × 10⁻⁴ mol m−2) to polluted (e.g. > 1 × 10⁻⁴ mol m−2).
Table 1Description of the 33 co-located AERONET and PGN stations. The distance of PGN site from AERONET site is mentioned in brackets with sign.
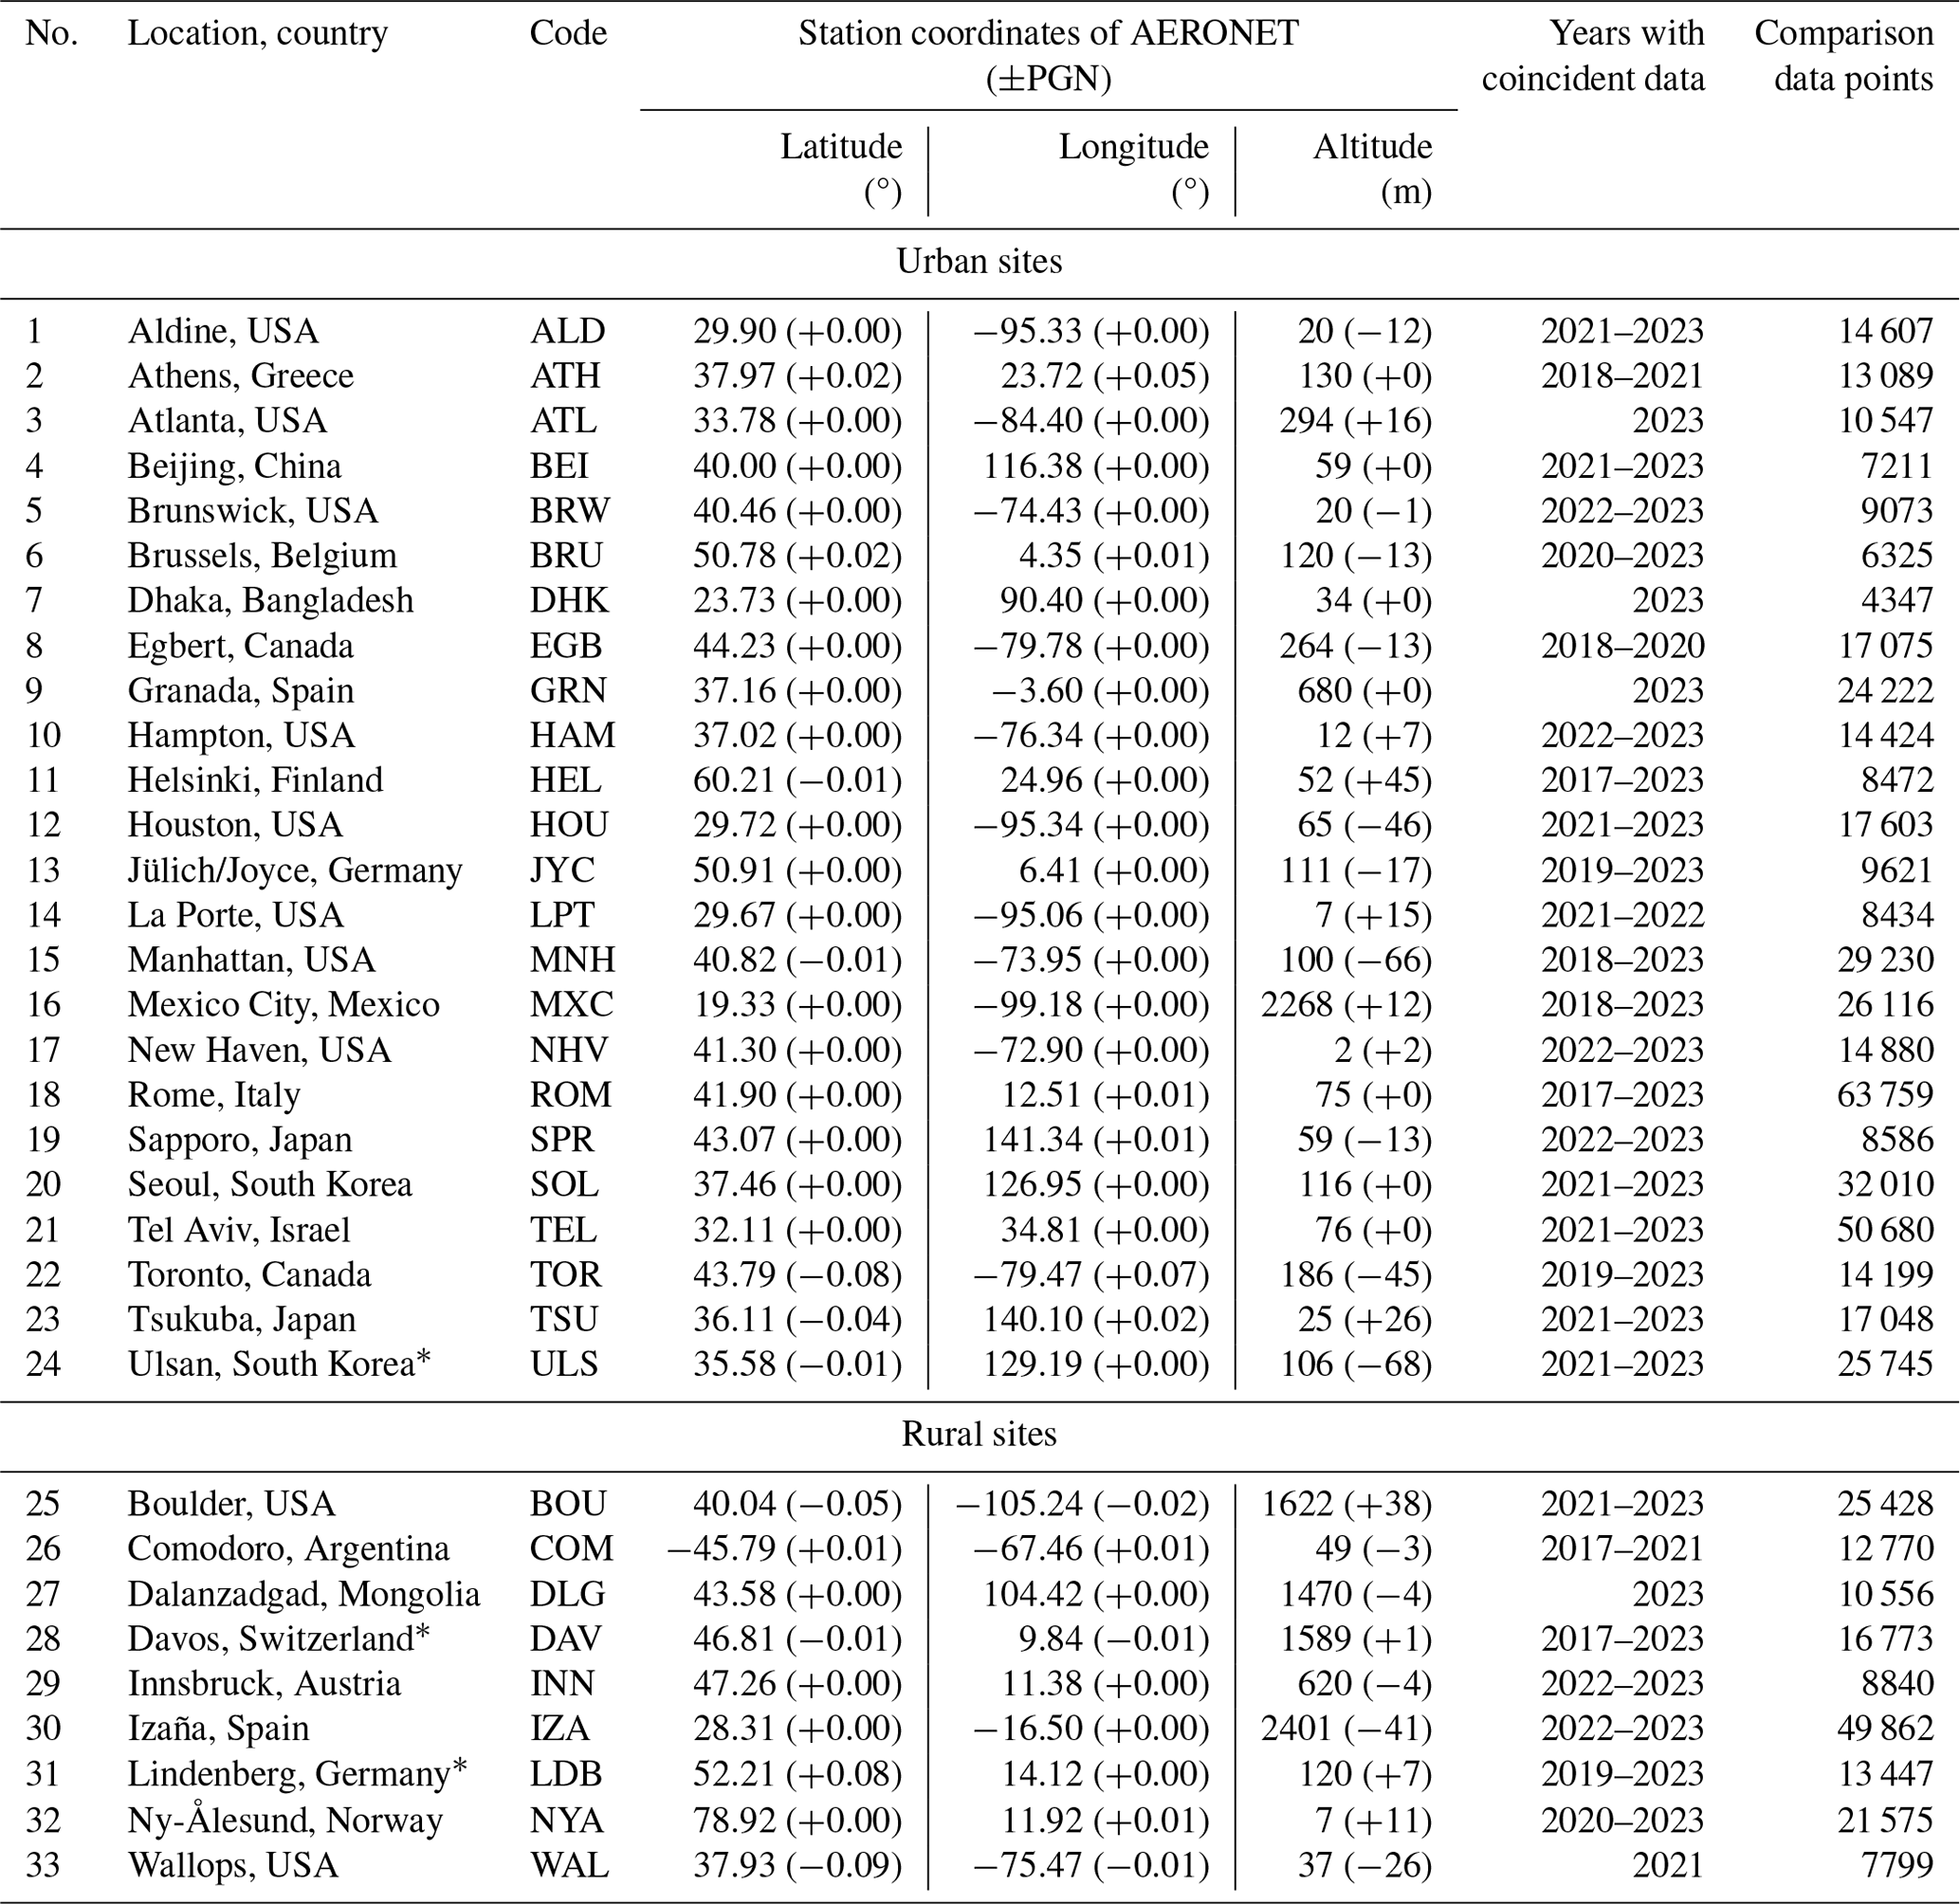
∗ These sites are co-located (i.e. instruments are in the same building), but the coordinates (latitude, longitude, and altitude) provided in AERONET/PGN have some errors. This is verified with the station Principal Investigators.
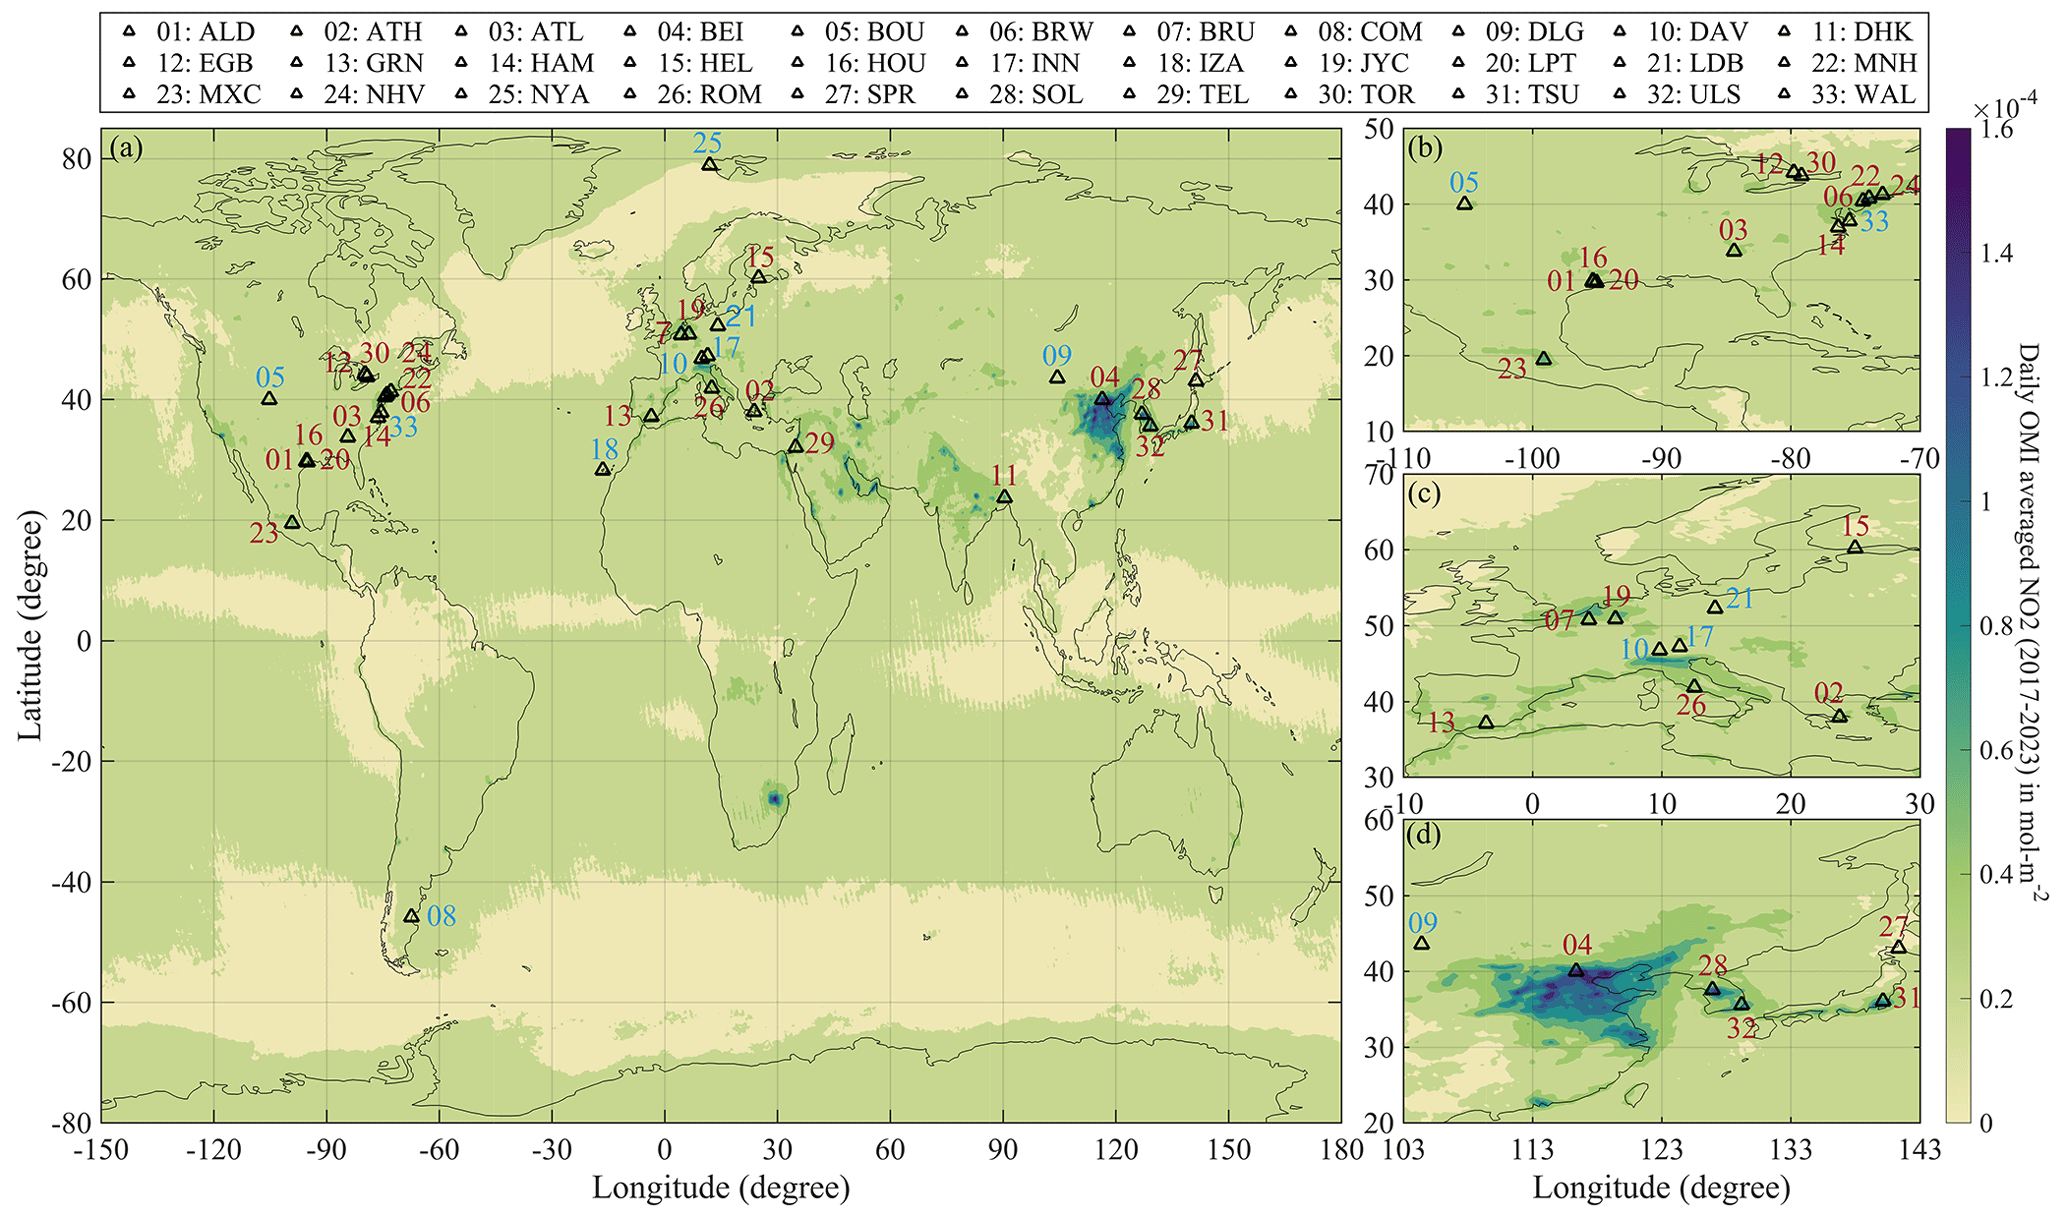
Figure 1(a) Overview of the co-located AERONET and PGN stations and 7-year-averaged (2017–2023) NO2 (mol m−2) from OMId satellite measurements. Panels (b–d) are the focused maps for the clustered locations in North America, Europe, and northeastern Asia, respectively. Sites labelled in red (24 sites) and blue (9 sites) are categorized as urban and rural sites, respectively.
The co-located AERONET and PGN stations have the latitudes of all PGN stations within AERONET latitude ±0.09° and, in most cases, have exactly the same latitudes (Table 1), while the longitudes of the PGN stations are within AERONET's longitude ±0.07° (Table 1). Corresponding to every measurement of AERONET (time of measurement) within a day, the nearest matching PGN measurement (similar time of measurement) was selected and then the PGN data were time-interpolated to the AERONET time stamp for that day. Following this process, we obtained specific comparison data points for each station during the comparison period of 2017–2023, based on the coincident data availability from AERONET and PGN, which are provided in Table 1 (last column). We have categorized all of these stations as either urban or rural sites, based on a simplified assumption that “rural” corresponds to small cities that are in the countryside or adjacent to the ocean, while other sites are “urban”.
2.2.2 NO2 correction for AOD and AE retrievals
The differences in the OMIc NO2 used by AERONET for the calculation of AOD from PGN NO2 VCD (mol m−2) are calculated as
where AERONET OMIc NO2 is converted from DU to SI (International System of Units) for VCD (which is mol m−2) (1 DU = 4.4614 × 10⁻⁴ mol m−2) for comparability. AOD is calculated from direct-sun measurements by sun photometers (Cimel sun photometers in the case of AERONET), using the Lambert–Beer law (Eq. 2) that presents the atmospheric attenuation of radiation as
where I(λ) and I0(λ) represent the radiation intensity at the surface and top of the atmosphere, respectively, at a specific wavelength λ. τ is the total optical depth, and m is the total optical air mass. Total optical depth is the aggregation of the optical-depth contributions from Rayleigh scattering by molecules (τRay), gaseous absorption by ozone (), , carbon dioxide (), methane (), and precipitable water vapour (). mR, , , , , and represent their respective optical air masses, and maer is the aerosol optical air mass. The optical air masses are a function of sun elevation. Aerosol optical depth (τaer) is calculated from total optical depth (τ) by subtracting the optical-depth contributions from Rayleigh scattering by molecules, gaseous absorption, and/or precipitable water vapour, depending on the wavelength. Here, we only discuss the contribution of NO2 absorption to AOD and the NO2 optical-depth estimations (Eq. 3) (Cuevas et al., 2019), calculated as
where is the NO2 absorption coefficient at wavelength (λ) obtained from Gueymard (1995), and the expression for is obtained from Gueymard (1995), while ma is the optical air mass, and NO2 VCD is in Dobson units. The NO2 absorption contribution to the NO2 optical depth is directly proportional to the NO2 VCD at a specific wavelength and sun elevation. The bias ΔAOD (or Δτaer(λ), as shown in Eq. 5) affecting the AERONET AOD (τaer,AERONET) calculation at a specific wavelength is produced by the simplified assumption of OMIc NO2, and the associated optical depth (which is linear to the NO2 concentration for an instrument at a specific wavelength and solar elevation; see Eq. 3) is evaluated after exploiting the “real” value of columnar NO2 from the co-located PGN instrumentation, as shown in Eq. (4) (considering that τaer is obtained by subtracting from the total optical depth; hence, is added to τaer and newly calculated is subtracted to obtain the PGN-corrected τaer in Eqs. 4 and 5) as follows:
where τaer,PGN, τaer,AERONET, and represent the PGN NO2-corrected AOD, original AERONET OMIc NO2-based AOD, and OMIc NO2-based AERONET NO2 optical depth, respectively (the terms used here are summarized in Table 2). Equation (5) represents the difference in the τaer(λ) between AERONET τaer and PGN-corrected τaer, where the expression for τaer,PGN(λ) was obtained from Eq. (4) that led to the second equivalence of Eq. (5), and the third equivalence was obtained using Eq. (1). Therefore, the sign of the AOD bias depends on the sign of ΔNO2, i.e. the ratio between the OMIc and PGN NO2. It is also worth noting here that the post-deployment calibrations in level 2.0 data will not have an impact on this analysis of the NO2-induced differences on AOD differences, as we have considered the relation between the NO2 difference and AOD difference (Eq. 5) (also from Eq. 3; the NO2 optical depth is related to columnar NO2 value, and the other terms will be constant for one instrument at a time stamp or solar elevation and wavelength and are not dependent on the calibration). Therefore, we chose to use level 1.5 data, as described in Sect. 2.1.1, in order to have more comparison points for this analysis. Hence, we define two cases here.
-
Case 1. OMIc NO2 underestimation that is ΔNO2 < 0, or > 1, leading to a positive AOD bias (Δτaer(λ) > 0) or overestimation of AOD by AERONET (OMIc-based AOD) as compared to PGN-corrected AOD.
-
Case 2. OMIc NO2 overestimation that is ΔNO2 > 0, or < 1, leading to a negative AOD bias (Δτaer(λ) < 0) or underestimation of AOD by AERONET (OMIc-based AOD) as compared to PGN-corrected AOD.
Table 2Summary and description of the terms used in the methodology.
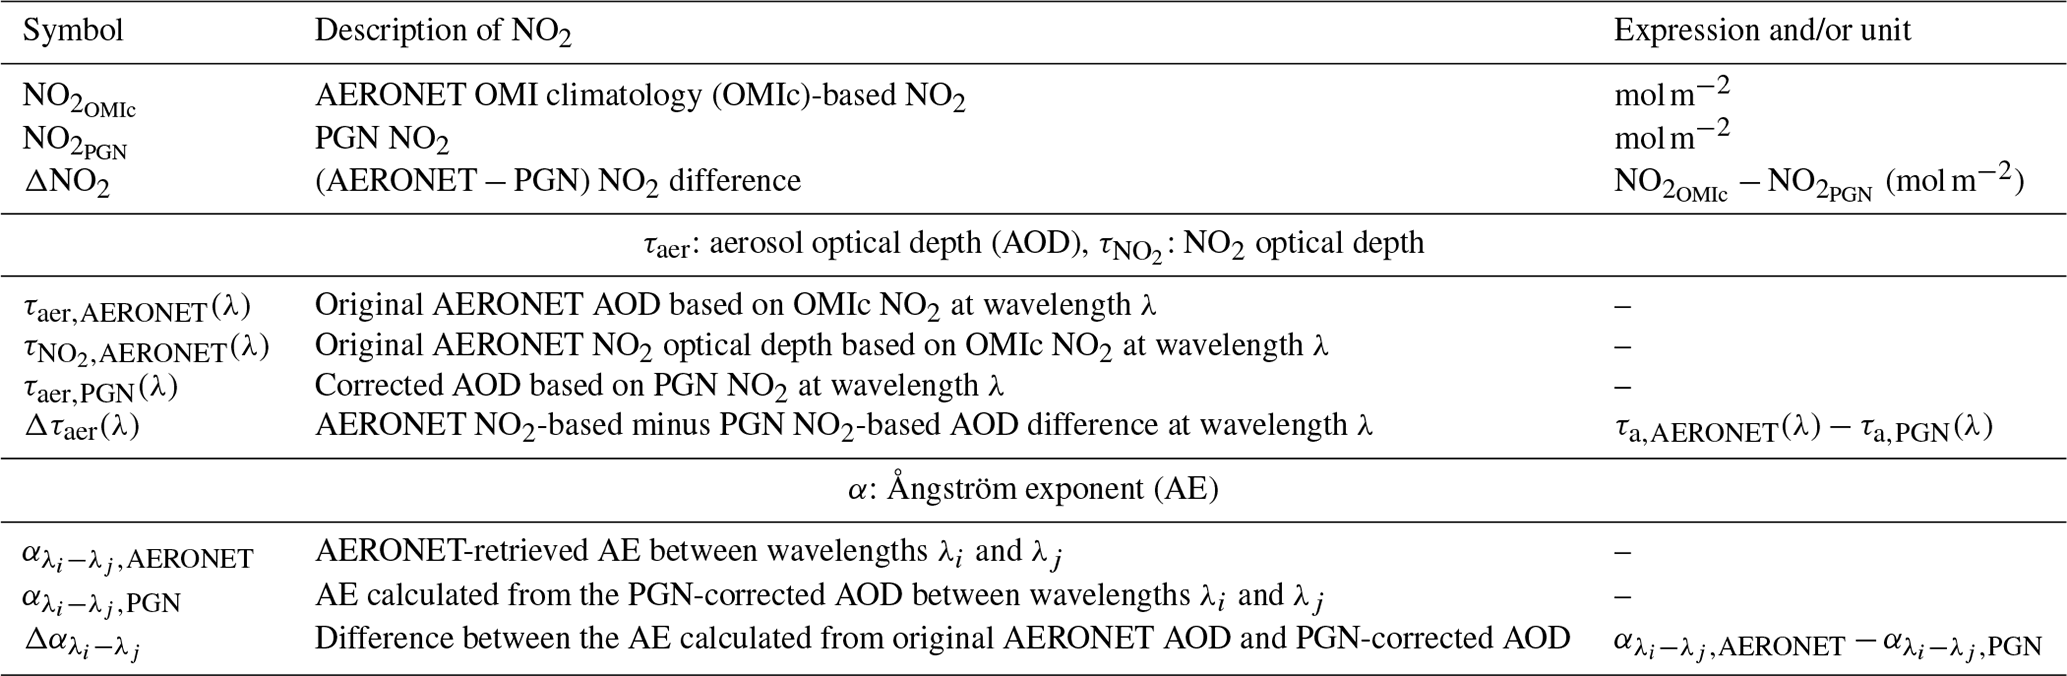
∗ AERONET is for the Aerosol Robotic Network, PGN is for the Pandonia Global Network, and OMI is for the Ozone Monitoring Instrument.
The spectral variability in AOD is represented by the Ångström exponent (AE), which is obtained from the Ångström power law as
where α and β represent the AE and the turbidity coefficient, respectively. The negative slope of the least squares regression fit from Eq. (7) is used by AERONET to retrieve AE (Eck et al., 1999) with AOD at all the wavelengths within the considered spectral ranges (here we use all three and four wavelengths within the 340–440 and 440–870 nm wavelength pairs, respectively, for the AE estimations) as
is obtained from AERONET-retrieved AE for two wavelength ranges, namely 340–440 and 440–870 nm. is calculated from the PGN-corrected AOD, i.e. τaer,PGN(λ) at wavelengths 340, 380, and 440 nm for the spectral range 340–440 nm; from τaer,PGN(λ) at wavelengths 440 and 500 nm; and from τaer,AERONET(λ) at 675 and 870 nm for the spectral range 440–870 nm. The difference in the AE is obtained as
where represents the AE in the wavelength range λi to λj (in our case, these wavelength ranges are 340–440 and 440–870 nm). and are the AE based on the AERONET AOD and PGN-corrected AOD, respectively.
2.2.3 AOD and AE trend estimation
We also evaluate the linear trends in AERONET AOD and AE retrievals for a time span of about a decade between 2013–2023 to compare them with the mean AOD and AE differences calculated, as described in Eqs. (5) and (9). The available PGN dataset is for a duration that is quite short, considering the calculation of statistically meaningful trends; hence, we have not considered the trend analysis using PGN-corrected AOD and AE.
The linear AOD and AE trends are evaluated using the weighted least-squares-fitting technique (Weatherhead et al., 1998; Zhang and Reid, 2010; Yoon et al., 2012; Logothetis et al., 2021) as
where m represents the index of the month (m = ), M is the total number of months, is the total number of years, Ym represents the monthly averaged AOD or AE, Xm represents the decimal number of years since the first month of the time series (), μ represents a constant linear fit offset at the beginning of the time series, ω represents the magnitude of the respective trend per year, and Nm is the residual. The seasonality is taken into account by subtracting Sm, which is the seasonal term calculated as the long-term monthly mean value, from Ym. For the purpose of deriving statistically significant daily mean values of the aerosol properties (AOD and AE), a minimum of 10 observations on a daily basis was ascertained. Additionally, in order to have a qualified monthly mean, the availability of at least 5 d of measurements on a monthly basis was ensured. The datasets that did not meet these criteria were not considered in the calculation of AOD and AE trends.
The statistical significance of the estimated linear trend (ω) is considered following the methodology presented by Weatherhead et al. (1998), which has been commonly applied for trend detection in AOD by numerous previous studies (e.g. Ningombam et al., 2019; Zhang et al., 2018; Alfaro-Contreras et al., 2017; Adesina et al., 2016; Pozzer et al., 2015; Kumar et al., 2015, 2018; Li et al., 2014; Babu et al., 2013; Hsu et al., 2012), by considering Nm, which follows a first-order autoregressive process as
where φ is the autocorrelation coefficient (lag−1), and εm represents the white noise. The standard deviation of the trend is calculated as
where σN represents the standard deviation of Nm, and n is the number of years based on the data availability, taking into account the entire period under consideration (i.e. in our case it is a constant value of 11 years). The trends are considered to be significant when the absolute value of is above 2.
3.1 Differences between AERONET OMI NO2 climatology and PGN NO2 measurements and the impact on AOD measurements
As presented in Sect. 2.2.2, we refer to the OMIc NO2 underestimation (i.e. ΔNO2 < 0; NO2 ratio > 1) and hence AOD overestimation (ΔAOD > 0) as case 1 and the OMIc NO2 overestimation (i.e. ΔNO2 > 0; PGN/OMIc NO2 ratio < 1) leading to AOD underestimation (ΔAOD < 0) as case 2, which we further discuss here.
Overall, we found 16 (∼ 48 % of all stations) stations in the category of case 1, with mean OMIc NO2 underestimated as compared to PGN and hence AOD overestimation (Fig. 2a), where 13 locations (∼ 81 % of case 1 stations) are urban sites, and 3 locations (∼ 19 % of case 1 stations) are rural sites. Out of these, six urban stations (DHK, MXC, ATH, LPT, HOU, and ROM; ∼ 37 %) had mean NO2 underestimation greater than 0.5 × 10⁻⁴ mol m−2. There were at least 1500 instances with mean ΔNO2 < −1 × 10⁻⁴ mol m−2 (Table A2 and A3 in the Appendix) that also showed an AOD overestimation equivalent to or above 0.002. For these cases, the corresponding time series of NO2 values, differences, and the normalized frequency distribution of the differences are presented in Fig. 3a–f. The mean PGN and OMIc values in DHK are 5.59 × 10⁻⁴ and 1.26 × 10⁻⁴ mol m−2, respectively, which has higher real (PGN) NO2 levels, reaching close to 30 × 10−4 mol m−2, while OMIc NO2 remains mostly constant and well within 5 × 10⁻⁴ mol m−2 (Fig. 3a). In ATH, these values are 2.50 × 10⁻⁴ and 1.20 × 10⁻⁴ mol m−2, respectively, and in MXC, 3.84 × 10⁻⁴ and 2.01 × 10⁻⁴ mol m−2, respectively. These stations also have relatively higher real NO2 values reaching close to 20 × 10−4 mol m−2, with OMIc NO2 being mostly constant at ATH and variable at MXC but well within 5 × 10⁻⁴ mol m−2 for both stations (Fig. 3b and c). The corresponding AOD differences at 380 nm are 0.015 (∼ 1.0 %), 0.005 (∼ 1.8 %), and 0.007 (∼ 1.7 %) (Table A2 and Fig. A1) for DHK, ATH, and MXC, respectively. At 440 nm, these AOD differences are 0.013 (∼ 1 %), 0.004 (∼ 1.8 %), and 0.005 (∼ 1.7 %) for DHK, ATH, and MXC, respectively (Fig. 2a; Table A2 and Fig. 4). The stations LPT and HOU (Fig. 1), with the NO2 difference of 0.71 × 10⁻⁴ and 0.58 × 10⁻⁴ mol m−2, respectively, between OMIc and PGN, showed a mean difference in AOD of 0.003 and 0.002 (∼ 1.1 %) at 380 nm and of 0.002 (∼ 1.1 %) at 440 nm. For ROM, ΔNO2 was found to be −0.60 × 10⁻⁴ mol m−2, leading to a mean AOD overestimation of 0.002 at 380 and 440 nm by AERONET OMIc as compared to PGN. LPT, HOU, and ROM has comparatively smaller NO2 values in the time series (reaching close to 10 × 10−4 mol m−2, as per Fig. 3d–f) as compared to stations like DHK and MXC which are located in high-NO2 zones (as per Fig. 1). The effects of NO2 differences on AOD at 340 and 500 nm are smaller compared to 380 and 440 nm for all the stations.
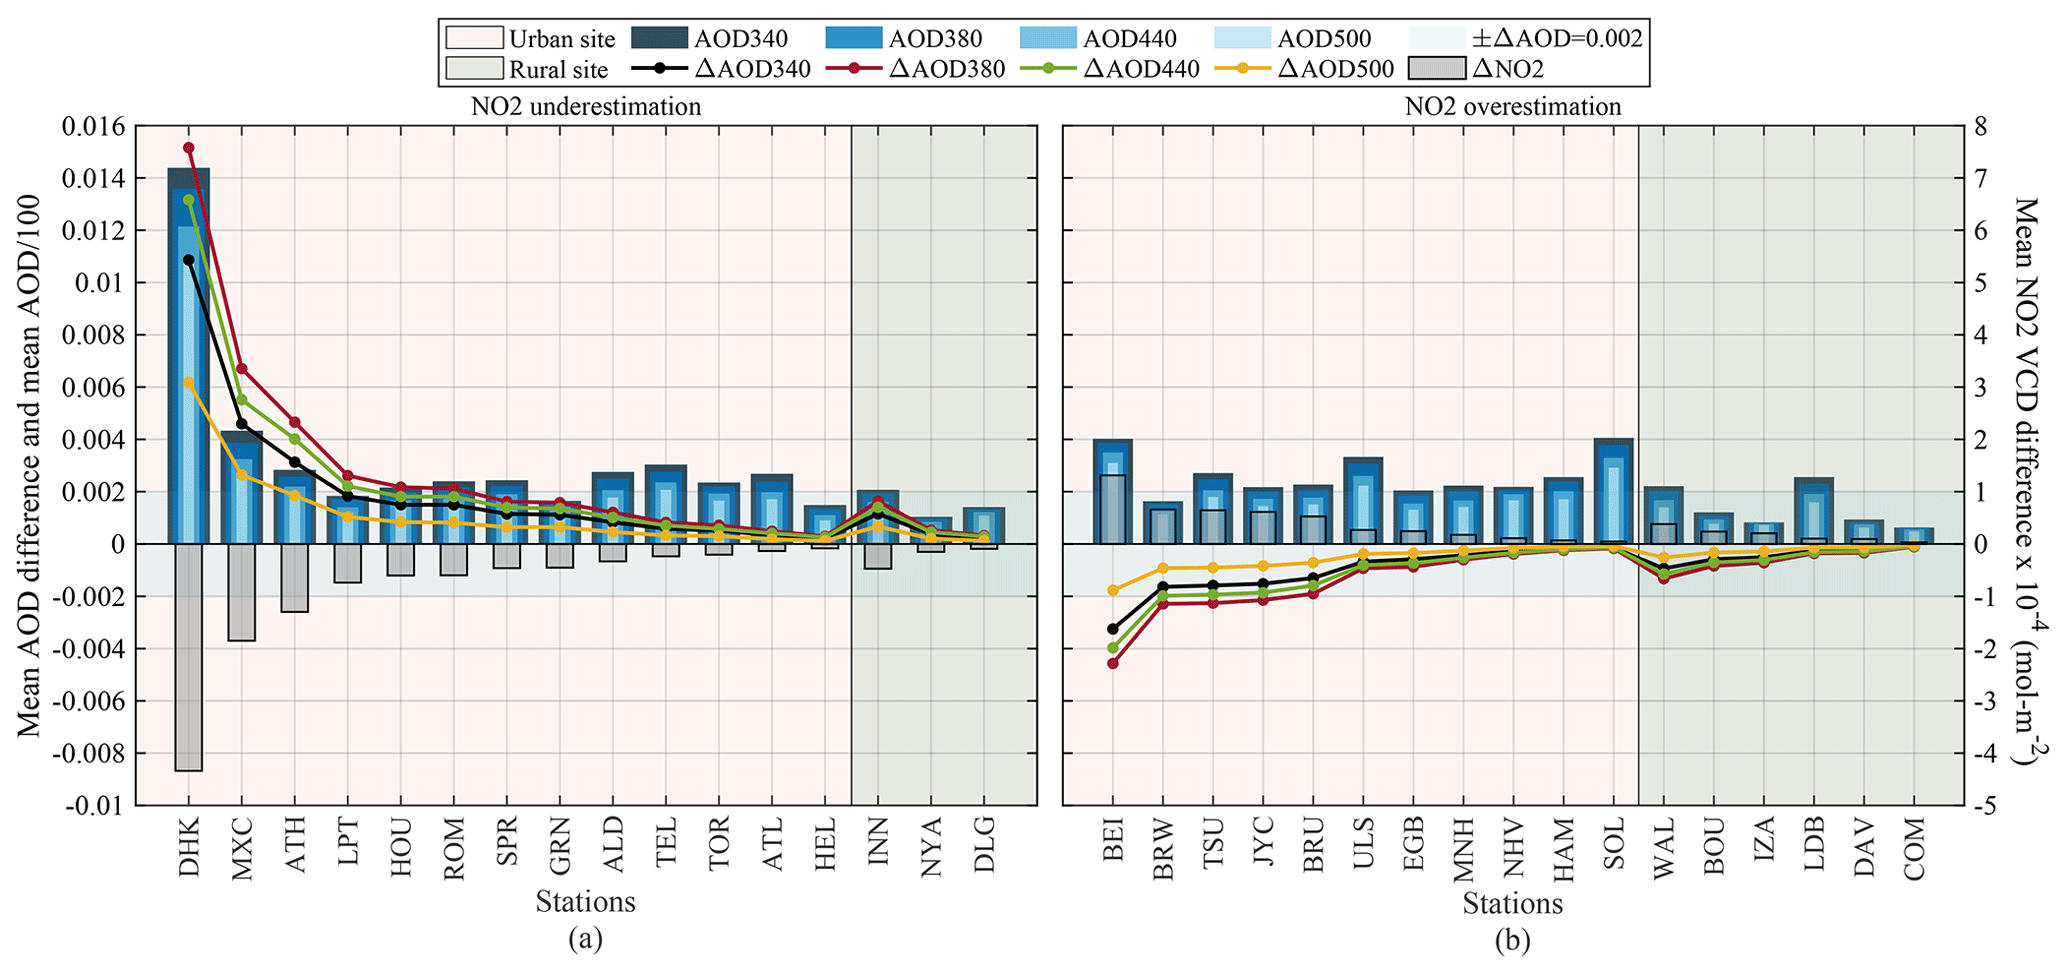
Figure 2NO2 VCD (mol m−2) and AOD differences at 340, 380, 440, and 500 nm for all stations with NO2 (a) underestimation and (b) overestimation. The NO2 differences are calculated as OMIc − PGN, and the corresponding AOD differences are calculated as original AERONET AOD minus PGN-corrected AOD (as described in Sect. 2.2.2). The average AOD at each wavelength is plotted as .
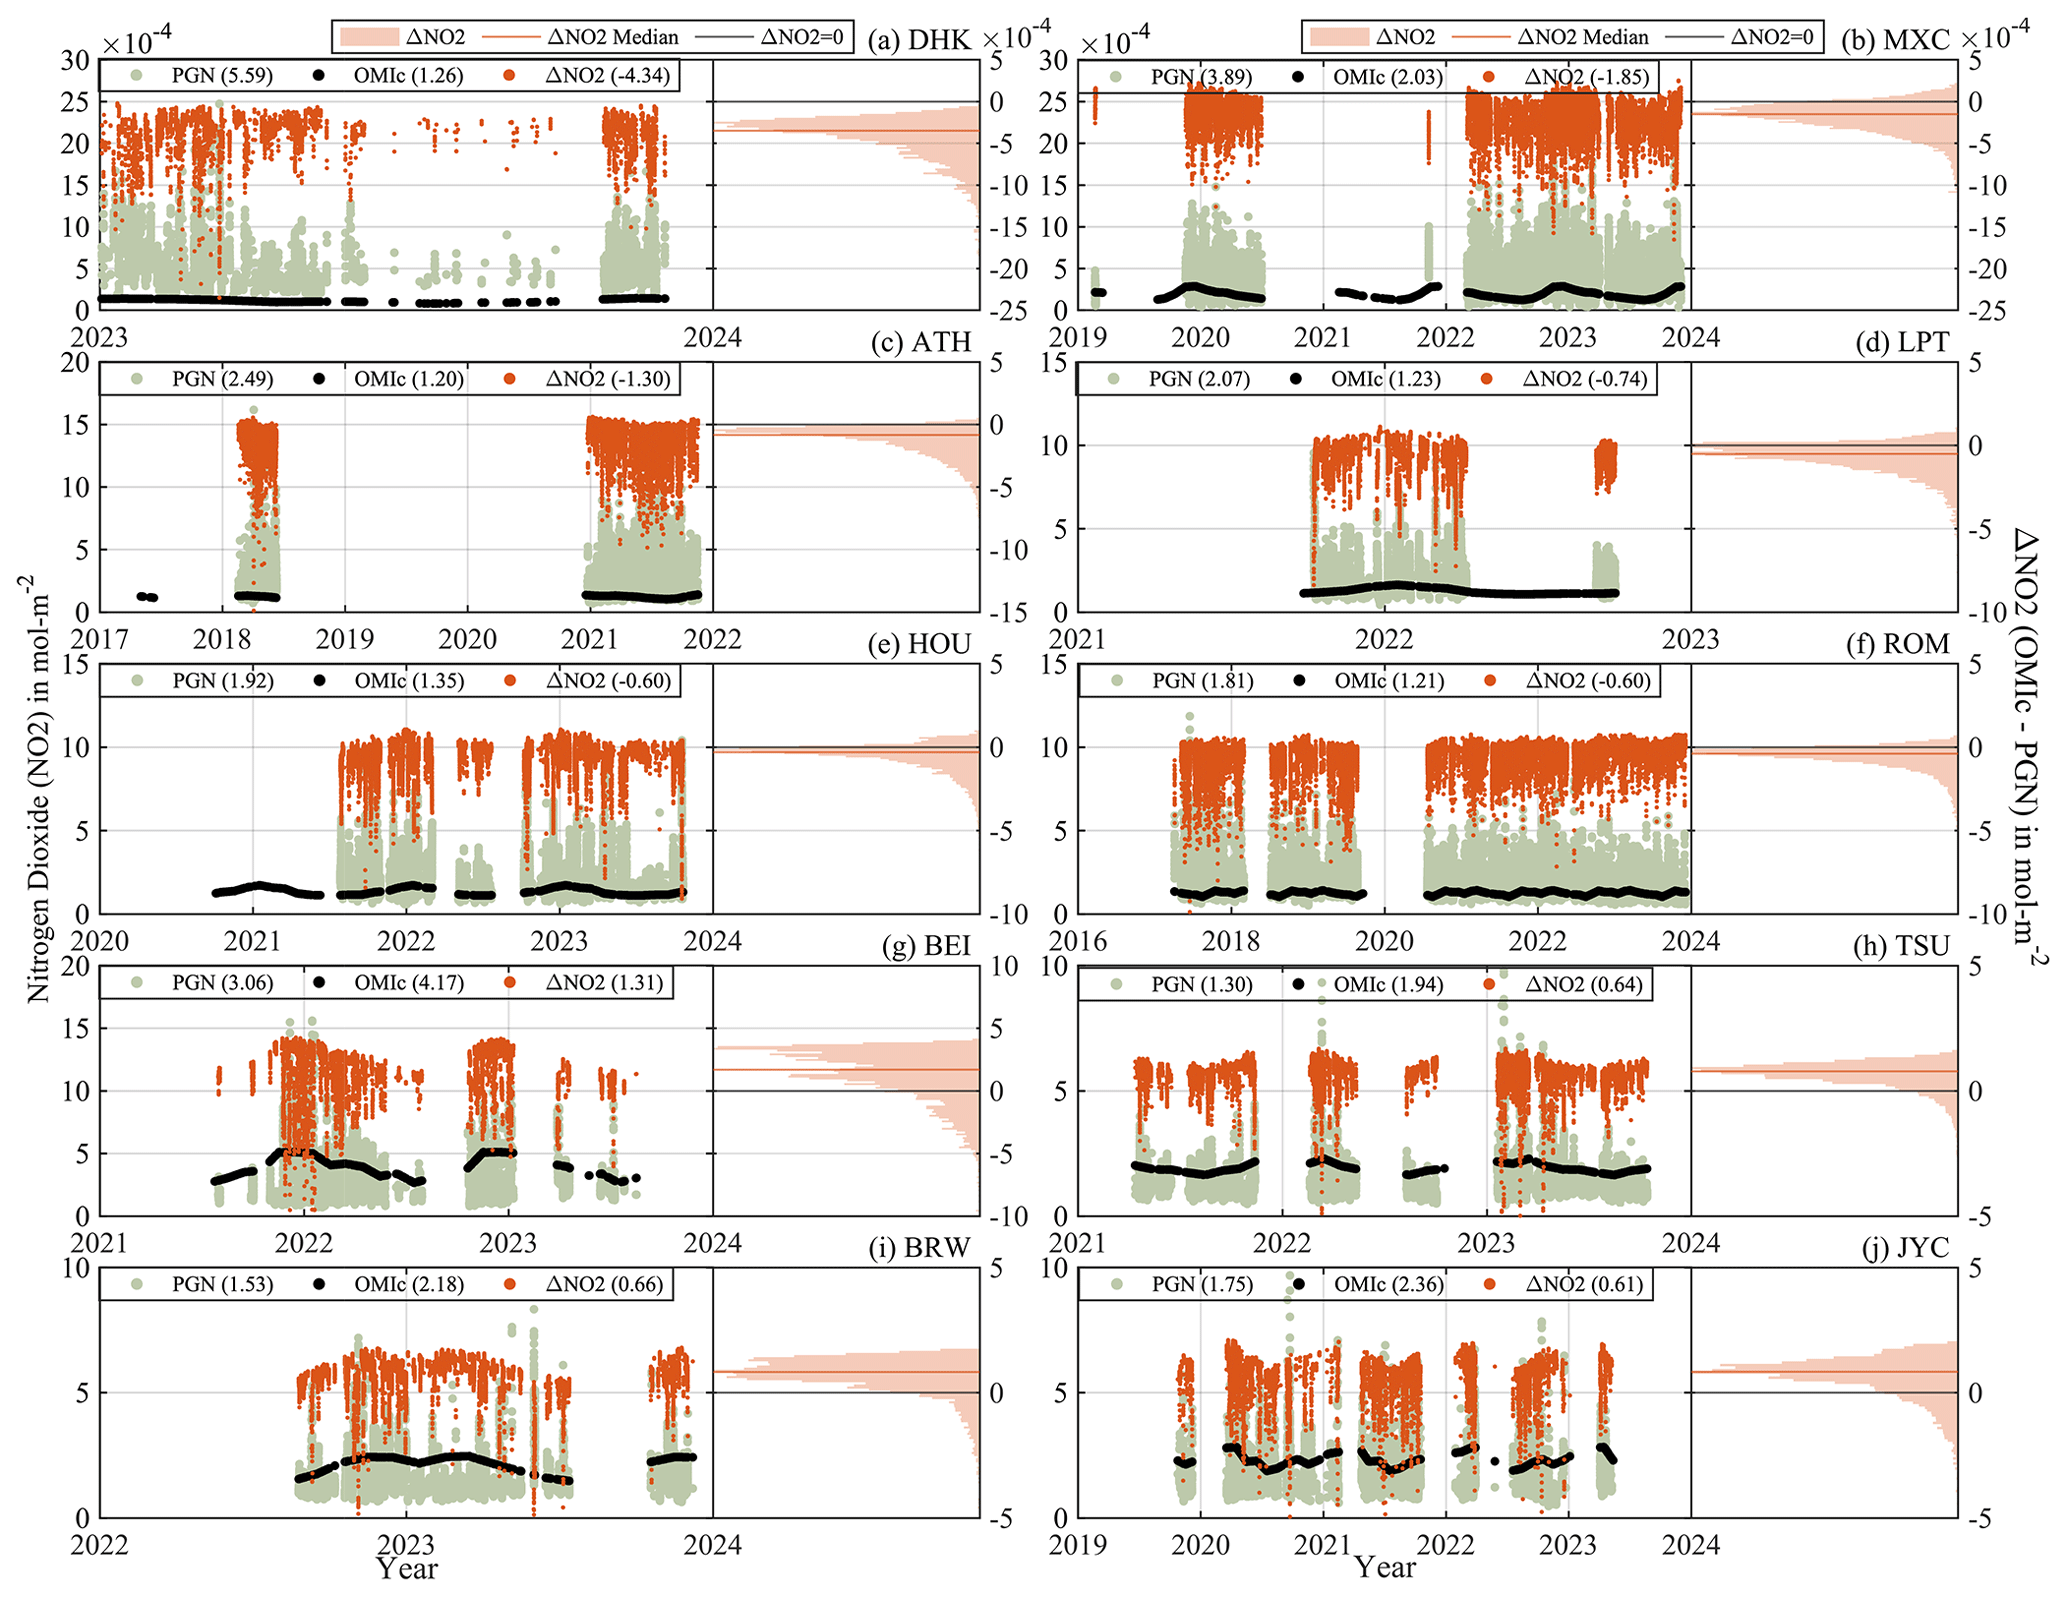
Figure 3(a–j) Time series of NO2 (mol m−2) from OMIc and PGN (black and green dots, respectively), and NO2 differences (OMIc − PGN; orange dots) and normalized frequency distribution of the NO2 differences. The 10 panels refer to stations with mean NO2 differences above 0.5 × 10⁻⁴ mol m−2 and mean AOD differences above 0.002. The numbers in parentheses represent the mean values.
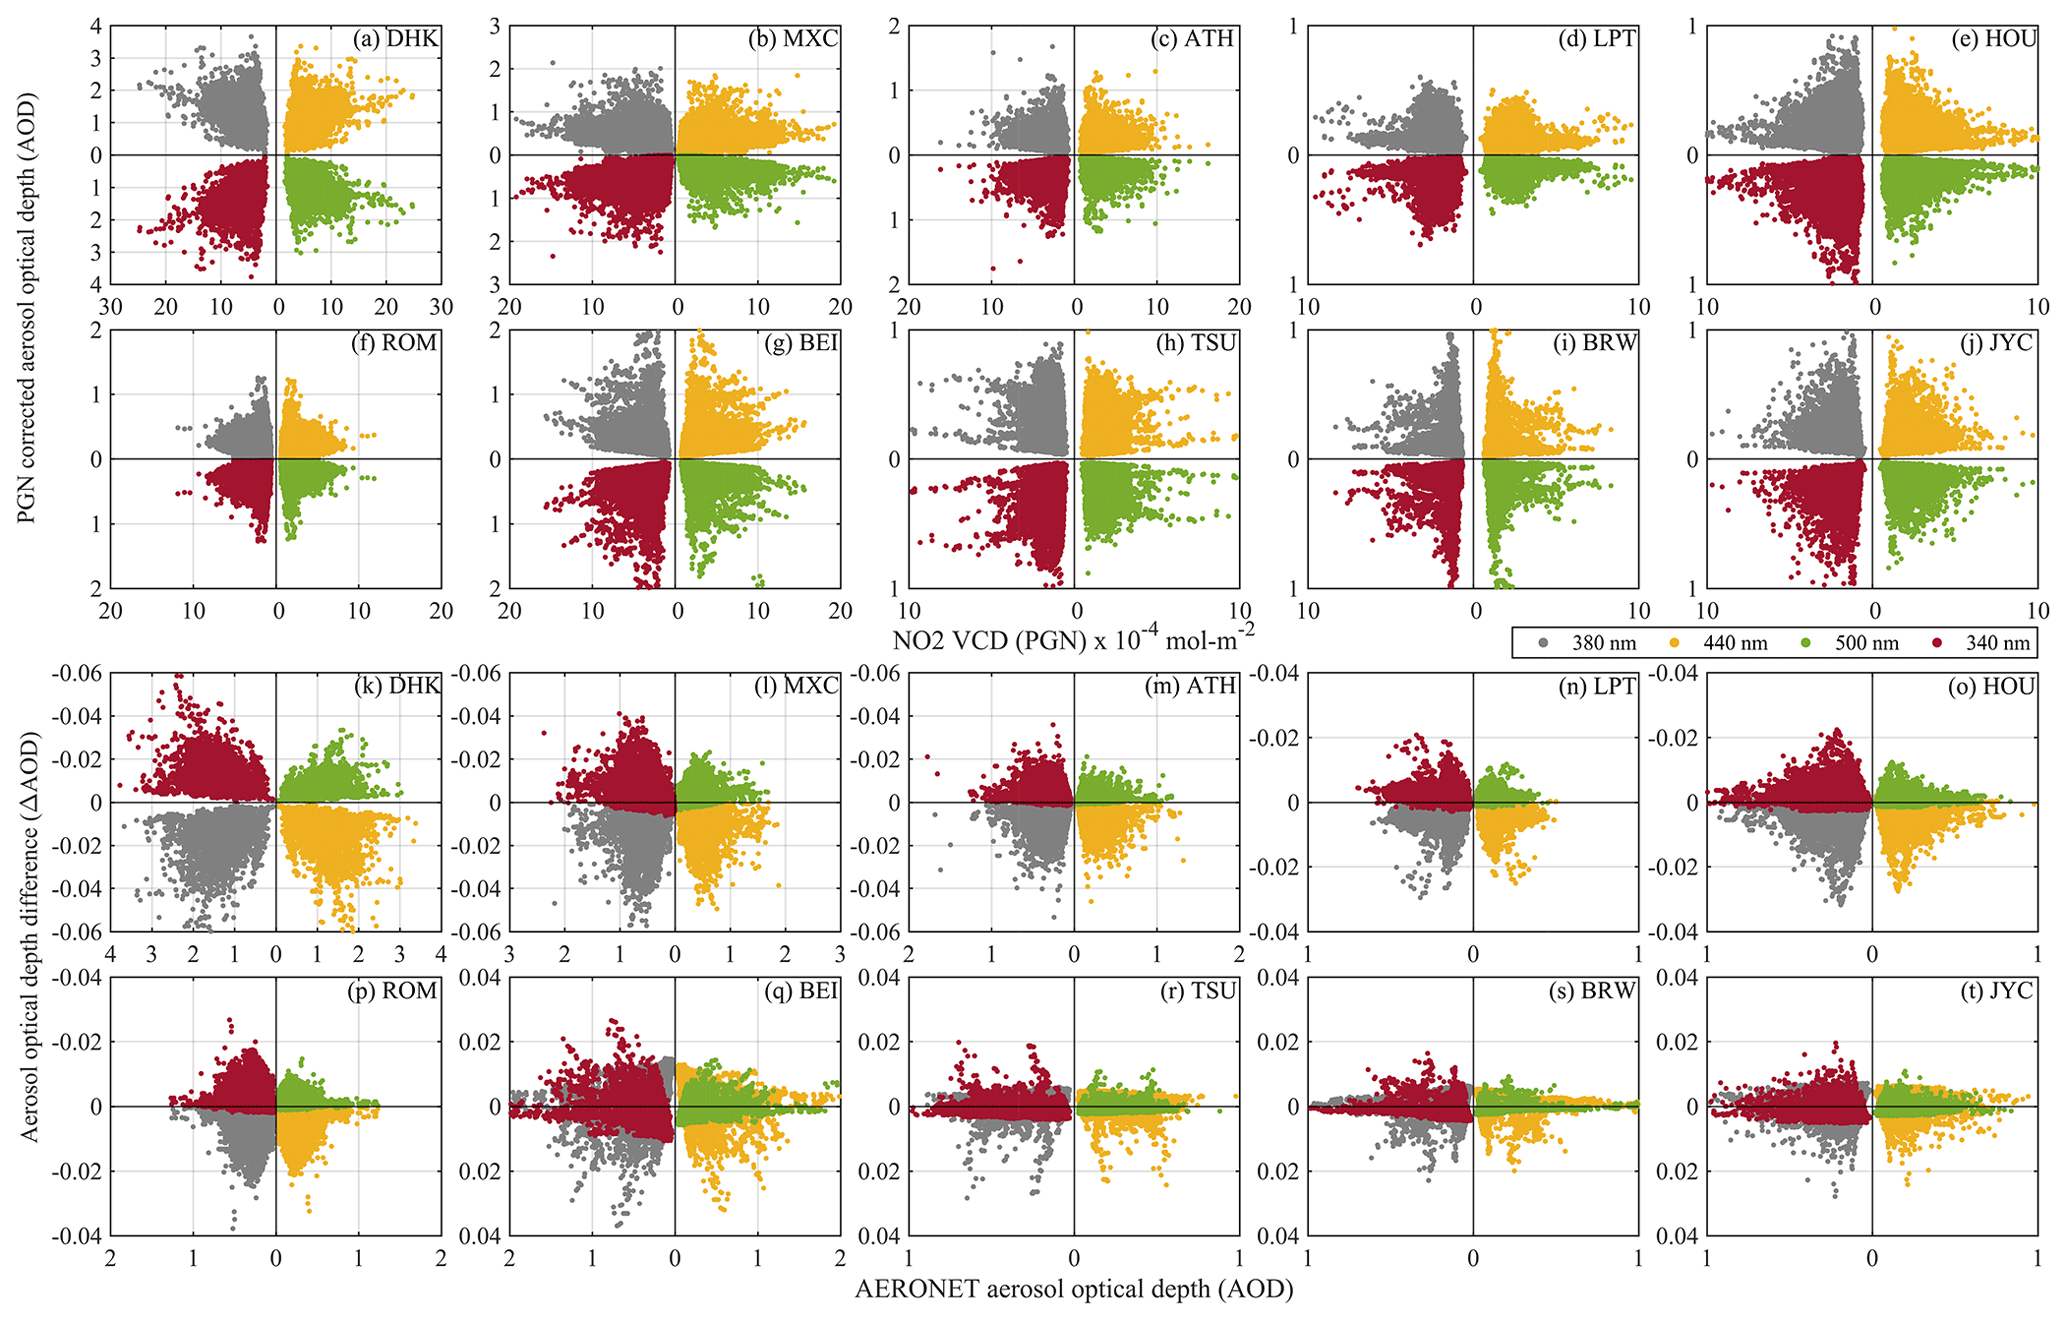
Figure 4(a–j) AOD as a function of NO2 VCD (mol m−2). (k–t) AOD differences as a function of AOD at 340, 380, 440, and 500 nm for stations with a mean NO2 offset of more than 0.5 × 10⁻⁴ mol m−2 and a mean AOD difference offset above 0.002. For NO2 underestimation cases (k–p), ΔAOD below 0 for 340 and 500 nm and ΔAOD above 0 for 380 and 440 nm represent positive AOD differences. For NO2 overestimation cases (q–t), ΔAOD below 0 for 340 and 500 nm and ΔAOD above 0 for 380 and 440 nm represent negative AOD differences.
The underestimation of NO2 by AERONET OMIc compared to PGN values at stations like DHK and MXC is possibly due to higher pollution levels, which the averaged OMIc climatological interpretation of NO2 fails to depict, leading to differences compared to the climatological means (Giles et al., 2019). A study by Pavel et al. (2021) on a yearly trend analysis of NO2 for Dhaka showed a statistically significant positive annual slope of 0.47 ± 0.03 ppb yr−1 for the studied period between 2003 and 2019, which represent an increase in NO2 levels of ∼ 68 % in 2019 from the base year in 2003, and a similar positive trend was observed by Georgoulias et al. (2019) as 0.29 ± 0.02 × 10¹⁵ or 0.05 ± 0.00 × 10⁻⁴ between 1996–2017. The same study by Georgoulias et al. (2019) also revealed a statistically significant positive trend of 0.17 ± 0.09 × 10¹⁵ or 0.03 ± 0.01 × 10⁻⁴ in NO2 values for Mexico City.
On the other hand, case 2 had 17 (∼ 52 % of all the stations) stations with the mean NO2 overestimated by the OMIc when compared to PGN, leading to AOD underestimation (Fig. 2b), with 11 stations (∼ 65 % of the case 2 stations) in the urban area and 6 (∼ 35 % of case 2 stations) in the rural area. Out of these stations, the highest OMIc NO2 overestimation was observed for four (∼ 23 % of the stations in case 2) urban stations, namely BEI, BRW, TSU, and JYC, with mean differences above 0.5 × 10⁻⁴ mol m−2, and at least 1500 instances with the overestimation above 1 × 10⁻⁴ mol m−2 (Table A2 and A3). These four stations also showed the AOD underestimation equal to or above 0.002. The associated NO2 time series of values, differences, and the normalized frequency distribution of the differences can be found in Fig. 3g–j. The average NO2 values for BEI were found to be 3.06 × 10⁻⁴ and 4.17 × 10⁻⁴ mol m−2 from PGN (NO2 values reaching close to 20 × 10−4 mol m−2; Fig. 3g) and OMIc, respectively; 1.31 × 10⁻⁴ and 1.94 × 10⁻⁴ mol m−2, respectively, for TSU; 1.54 × 10⁻⁴ and 2.16 × 10⁻⁴ mol m−2, respectively, for BRW; and 1.75 × 10⁻⁴ and 2.36 × 10⁻⁴ mol m−2, respectively, for JYC. These differences led to a mean overestimation of NO2 from OMIc as 1.30 × 10⁻⁴ mol m−2 for BEI and ∼ 0.62 × 10⁻⁴ mol m−2 for BRW, TSU, and JYC, which led to an AOD underestimation of ∼ 0.005 for BEI and ∼ 0.002 for BRW, TSU, and JYC.
Stations like BEI showed an overestimation of NO2 by AERONET OMIc as compared to PGN, possibly due to the reduction in pollution levels as a result of the implementation of environmental protection policies in eastern China (van der A et al., 2017) that may have led to a significant trend reversal of tropospheric NO2 during the last decade, which OMIc is unable to depict as it considers the average values for time period of 2004–2013. Georgoulias et al. (2019) found a decreasing trend of −1.28 ± 0.78 × 10¹⁵ or 0.21 ± 0.13 × 10⁻⁴ in tropospheric NO2 from 2011–2018 (with 2011 being the year of trend reversal from a positive to a negative trend). Another study by Xu et al. (2023) on NO2 trend analysis in Beijing–Tianjin–Hebei between 2014 and 2020 also revealed a decreasing trend in NO2 with overall reduction by 44.4 % with reference to the year 2014.
Figure 4 presents the scatterplot of AOD as a function of NO2 VCD, as well as AOD differences, arising due to NO2 differences at all considered wavelengths (340, 380, 440, and 500 nm). It is observed that AOD is not correlated with the NO2 VCD magnitude as observed in Fig. 4a–j, and the AOD differences are also not correlated with the AOD values (Fig. 4k–t). The NO2 differences are related to the AOD differences, and vice versa, and are not related to the magnitude of AOD or the magnitude of NO2 VCD as evidenced from Eq. (5).
3.2 Assessment of AOD differences in extreme NO2 load cases
In this section, we present (Table 3) the scenarios with extreme NO2 situations; i.e. 10 % highest of the difference cases (from all of the differences presented in Sect. 3.1) are taken into account as percentiles of NO2 differences with 10 % and 90 % confidence levels for case 1 (NO2 underestimation by OMIc) and case 2 (NO2 overestimation by OMIc), respectively (hereafter referred to as the “Extreme” case). Figure 5 presents a comparison of the NO2 and AOD differences between the Extreme case and whole dataset (hereafter referred to as “All”). It is observed (from Figs. 2 and 5) that the most affected wavelength due to differences in NO2 absorption representation in AOD calculations is 380 nm, followed by 440, 340, and 500 nm, respectively.
Table 3Statistics for Extreme cases with 10 % highest NO2 differences (mol m−2) (percentiles (P) at 10 % and 90 % confidence level for case 1 and case 2, respectively).
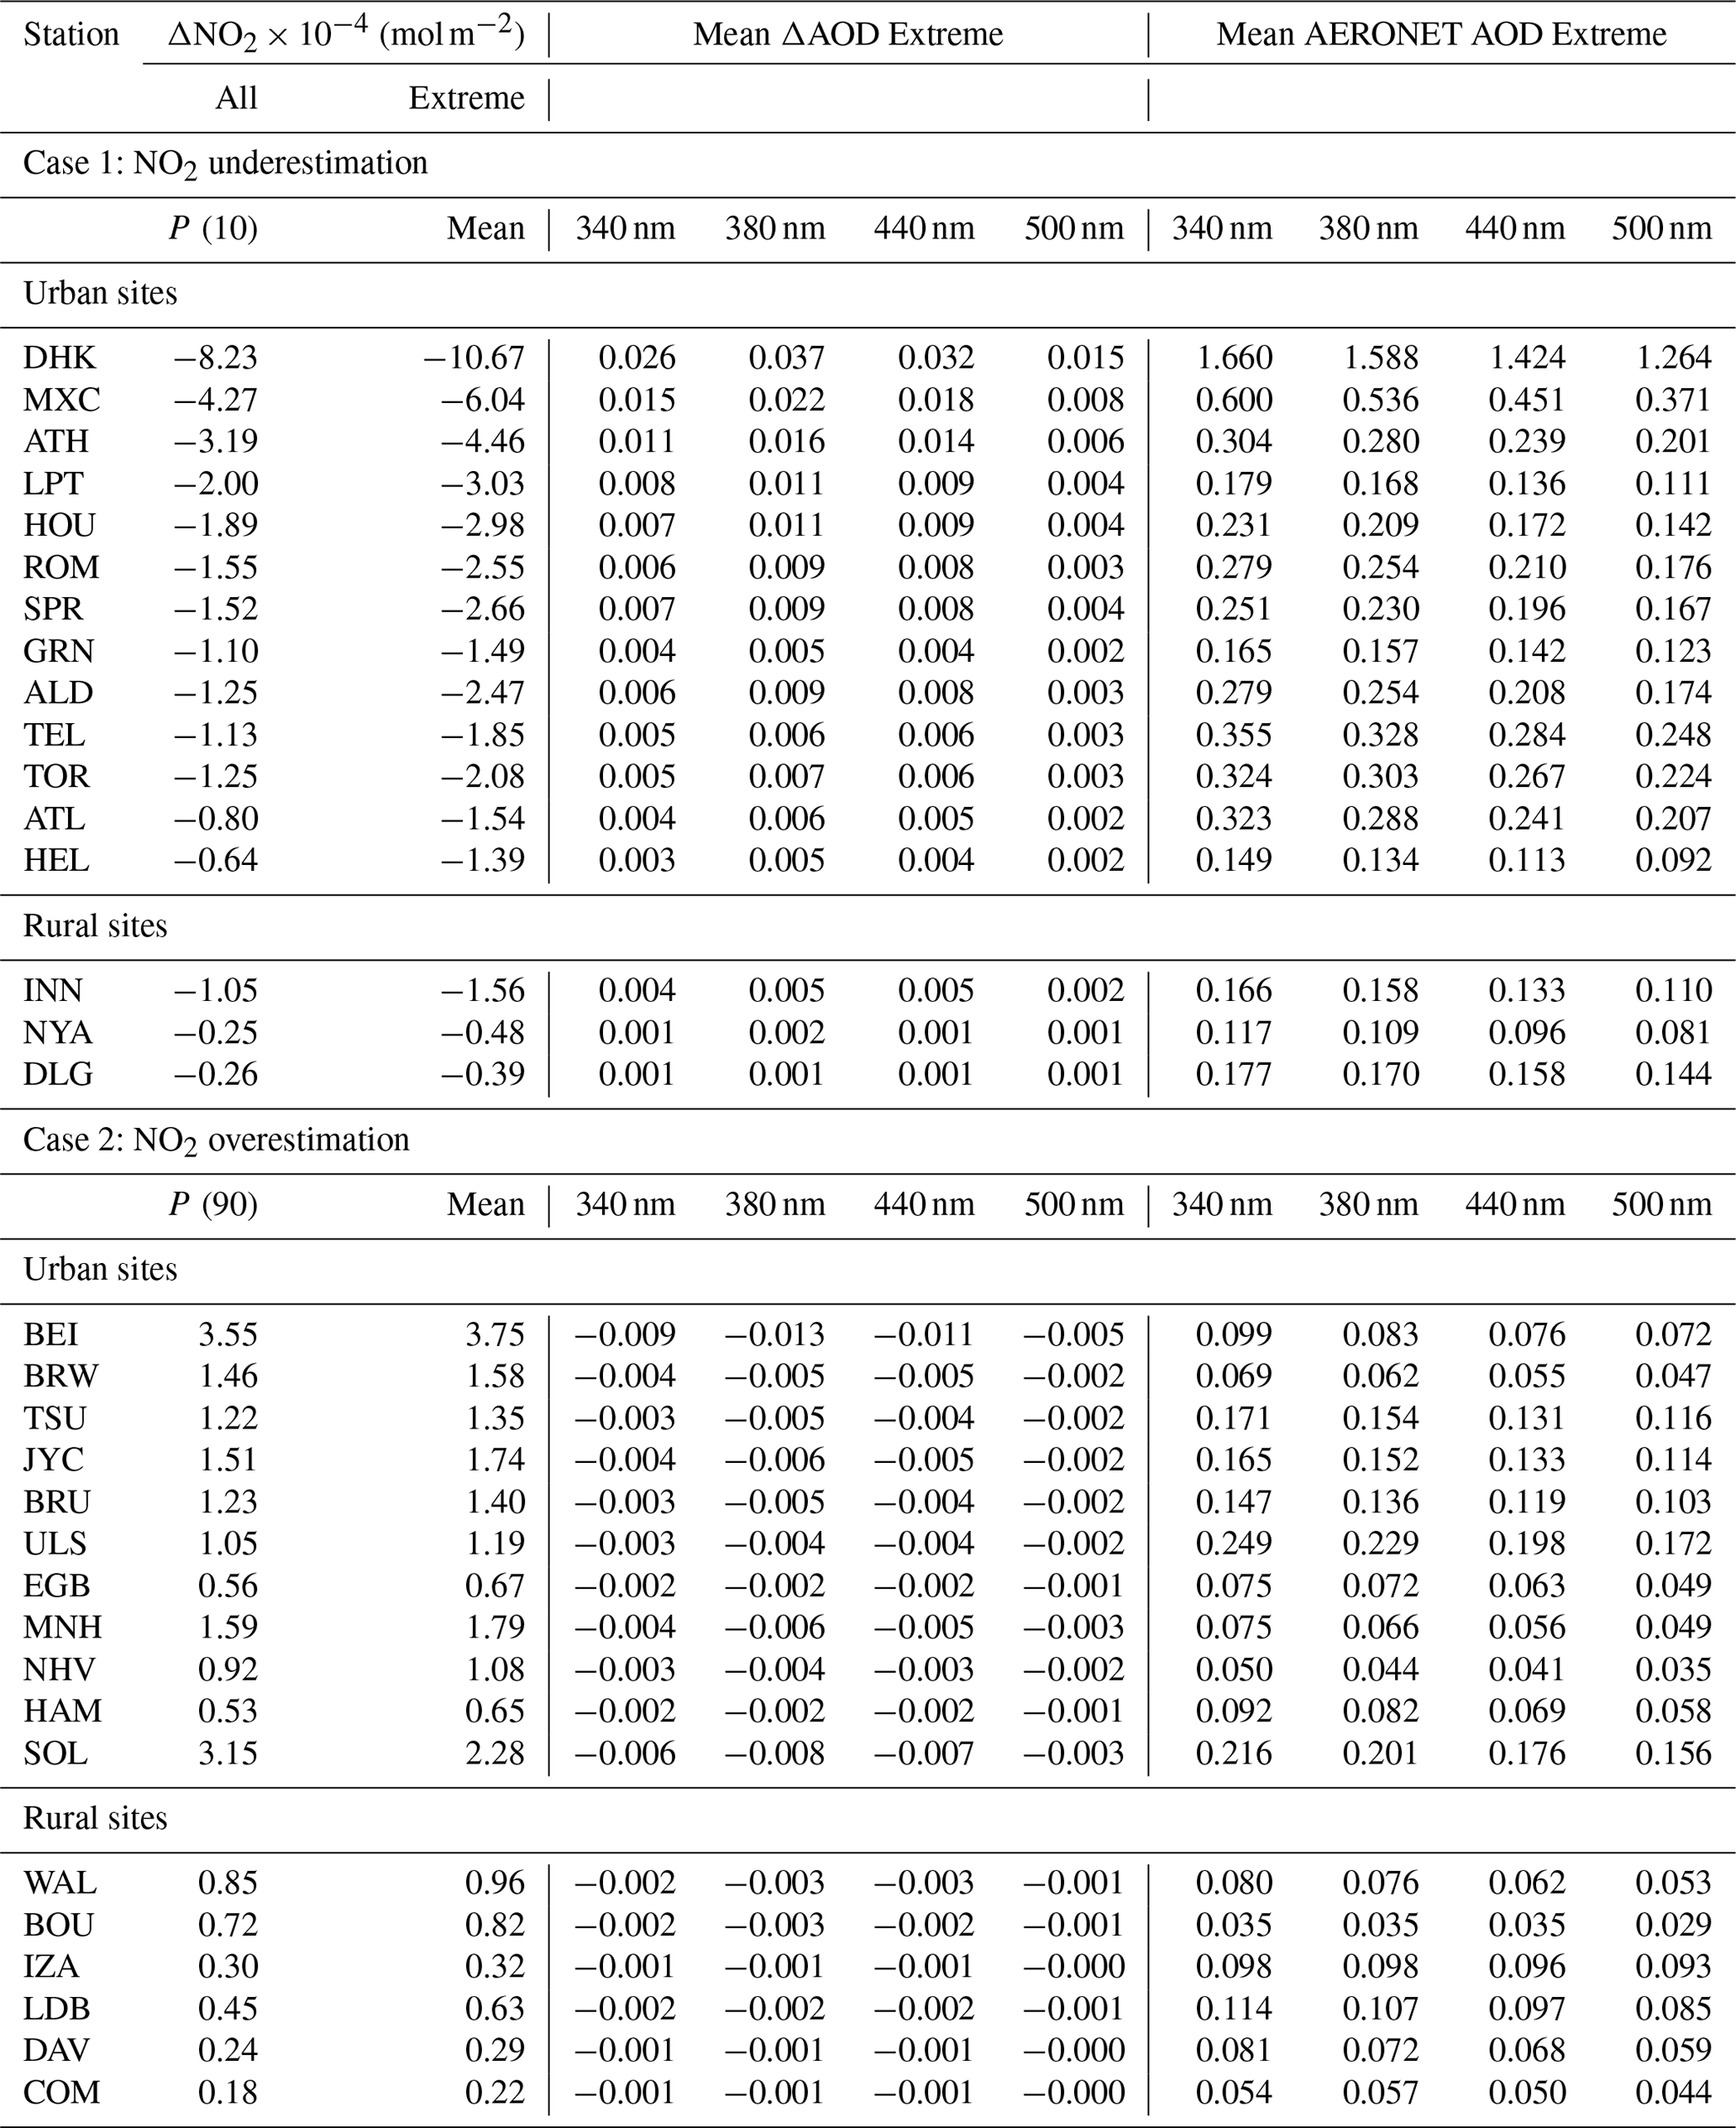
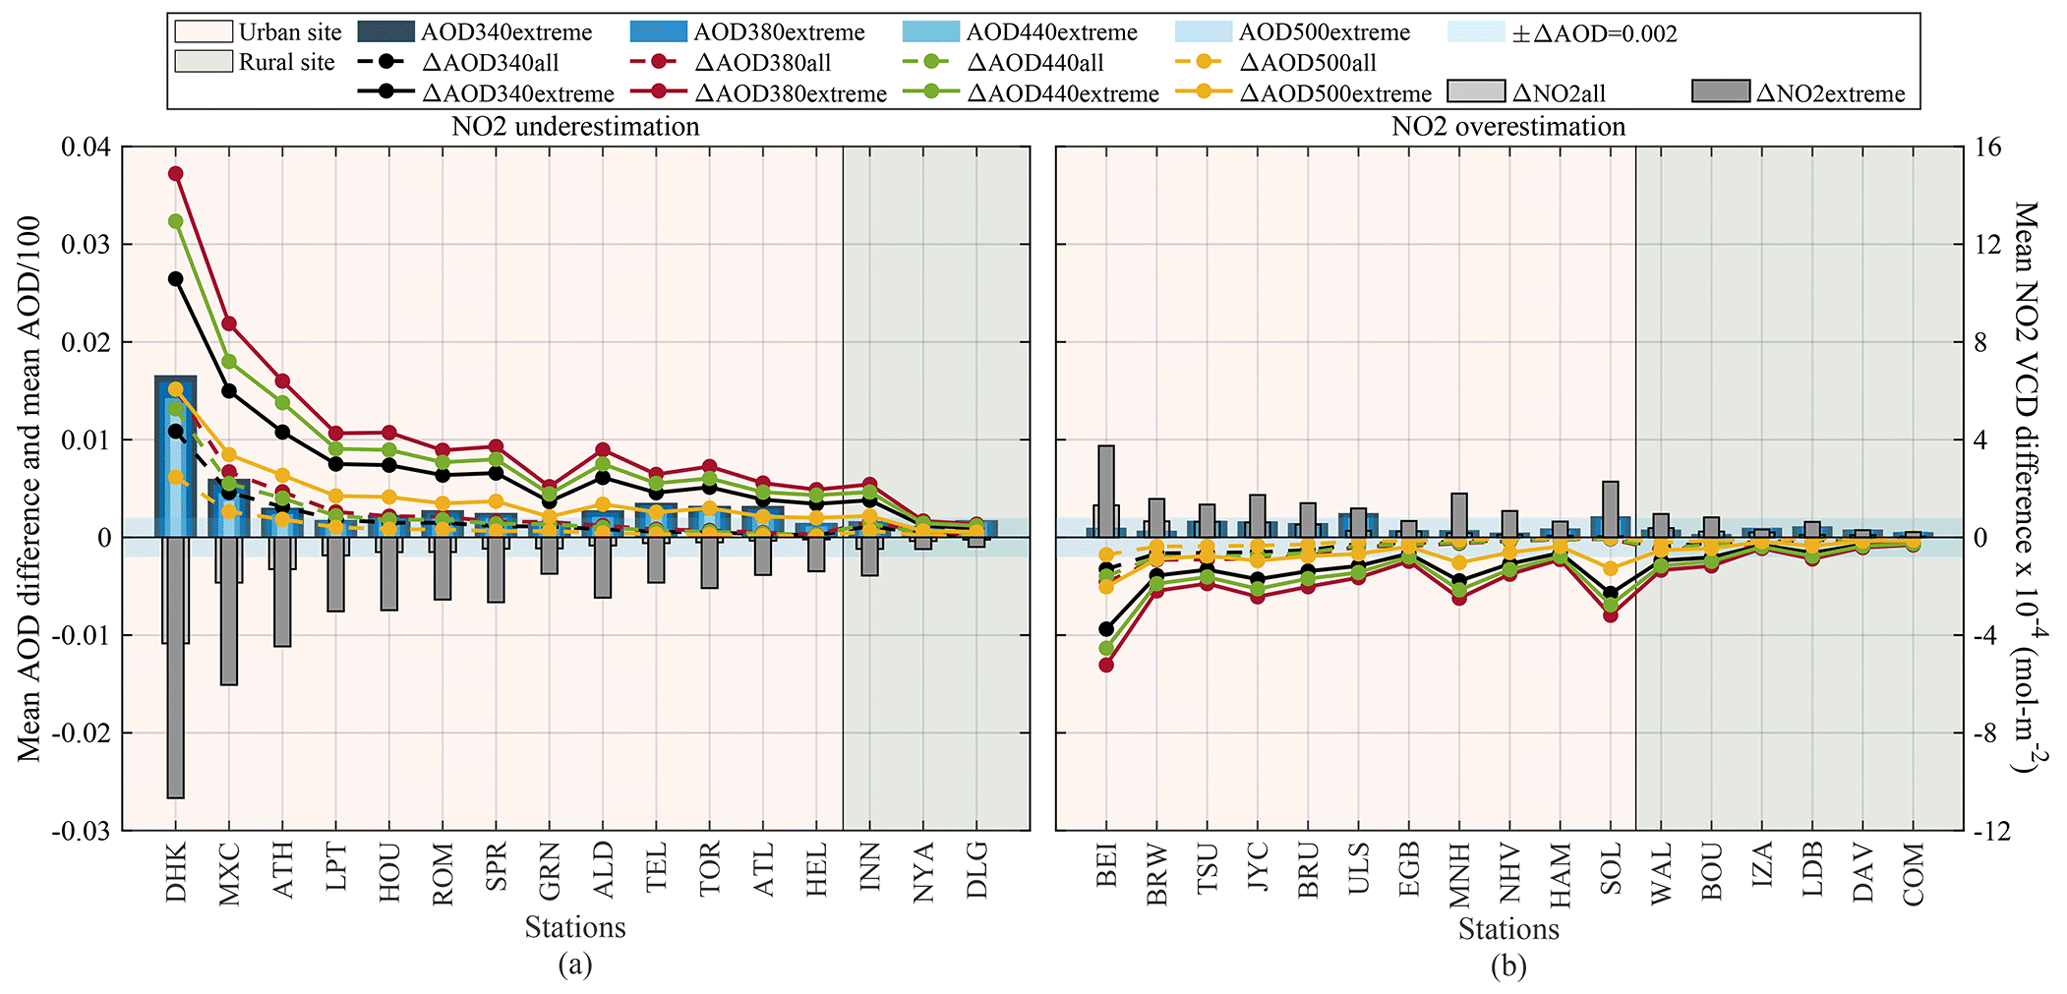
Figure 5Comparison of NO2 VCD (mol m−2) and AOD differences (OMIc − PGN) at 340, 380, 440, and 500 nm in Extreme cases, with 10 % of highest NO2 (a) underestimations and (b) overestimations by OMIc compared to All datasets. The average AOD in the Extreme case at each wavelength is plotted as .
Figure 5a presents the results for case 1, in which the mean differences in an Extreme case were found to be higher than All data case for NO2 by at least 1 × 10⁻⁴ mol m−2 and 0.003 for AOD for all stations except NYA and DLG. For the six selected stations from case 1, as discussed in Sect. 3.1, this difference between the Extreme and All case scenario for NO2 varied from ∼ 2 × 10⁻⁴ mol m−2, reaching up to even 6 × 10⁻⁴ mol m−2 (for DHK). The increase in AOD differences for these six stations was found to be above 0.007, reaching up to 0.023 and 0.015 for DHK and MXC, respectively. Similarly, ALD showed ∼ 7 times and ∼ 8 times increase in the differences in NO2 and AOD, respectively, in the Extreme scenario compared to All datasets.
For case 2, as presented in Fig. 5b, nine stations showed the mean difference between OMIc and PGN NO2 above 1 × 10⁻⁴ mol m−2, and the differences in OMIc and the PGN NO2 difference in the Extreme case from the respective differences in the All dataset were found to reach up to ∼ 2 × 10⁻⁴ mol m−2. These NO2 differences led to an average AOD underestimation equivalent to or above 0.002 at 380 and 440 nm at 14 (out of 17) stations by AERONET. The noticeable stations in this case are BEI, JYC, and MNH (Fig. 5b), with the difference in the OMIc and PGN NO2 difference in the Extreme case from the respective differences in the All dataset being above 1 × 10⁻⁴ mol m−2, leading to higher AOD differences in the Extreme case than the All dataset by a factor of 0.004 and 0.003 at 380 and 440 nm, respectively. It is noteworthy that for BEI, the mean AOD underestimation between OMIc and PGN reached 0.013 and 0.011 at 380 and 440 nm, respectively, for the mean AOD values of 0.083 and 0.076, respectively. This indicates that high-NO2 differences in BEI are observed for low AOD cases (Tables 3 and A4), where OMIc overpredicts NO2 values measured by PGN (Fig. 3g) (Beijing is case 2 of this analysis). Hence, the highest NO2 differences occur for a low-pollution scenario (i.e. PGN measured NO2 is lower than OMIc NO2) and, hence, probably lead to low mean AOD. These cases are about 10 % of what we have considered for Extreme scenario cases for which we have considered the top 10 % of the highest NO2 differences (for case 1, 90th percentile, and case 2, 10th percentile). Another station to note here is SOL, which showed an increase in the average difference in NO2, AOD380, and AOD440 from 0.05 × 10⁻⁴ mol m−2, 0.000 and 0.000 in All datasets (Fig. 5b) to 2.28 × 10⁻⁴ mol m−2, −0.008 and −0.007, respectively, in the Extreme scenario.
Figure 6 presents the stations with high variations (AOD differences in AERONET from a PGN equivalent to or above 0.005), the mean NO2 and AOD differences at these stations, and the normalized frequency distribution of the AOD at 340, 380, 440, and 500 nm. A clear shift in the frequency distribution (Fig. 6f1–k4) is observed for Extreme cases – moving away from the All dataset case at the four wavelengths – with a larger shift noticeable at DHK and MXC and a shift in the opposite direction in the case of BEI, which is consistent with the analysis presented in Fig. 5 and Table 3.
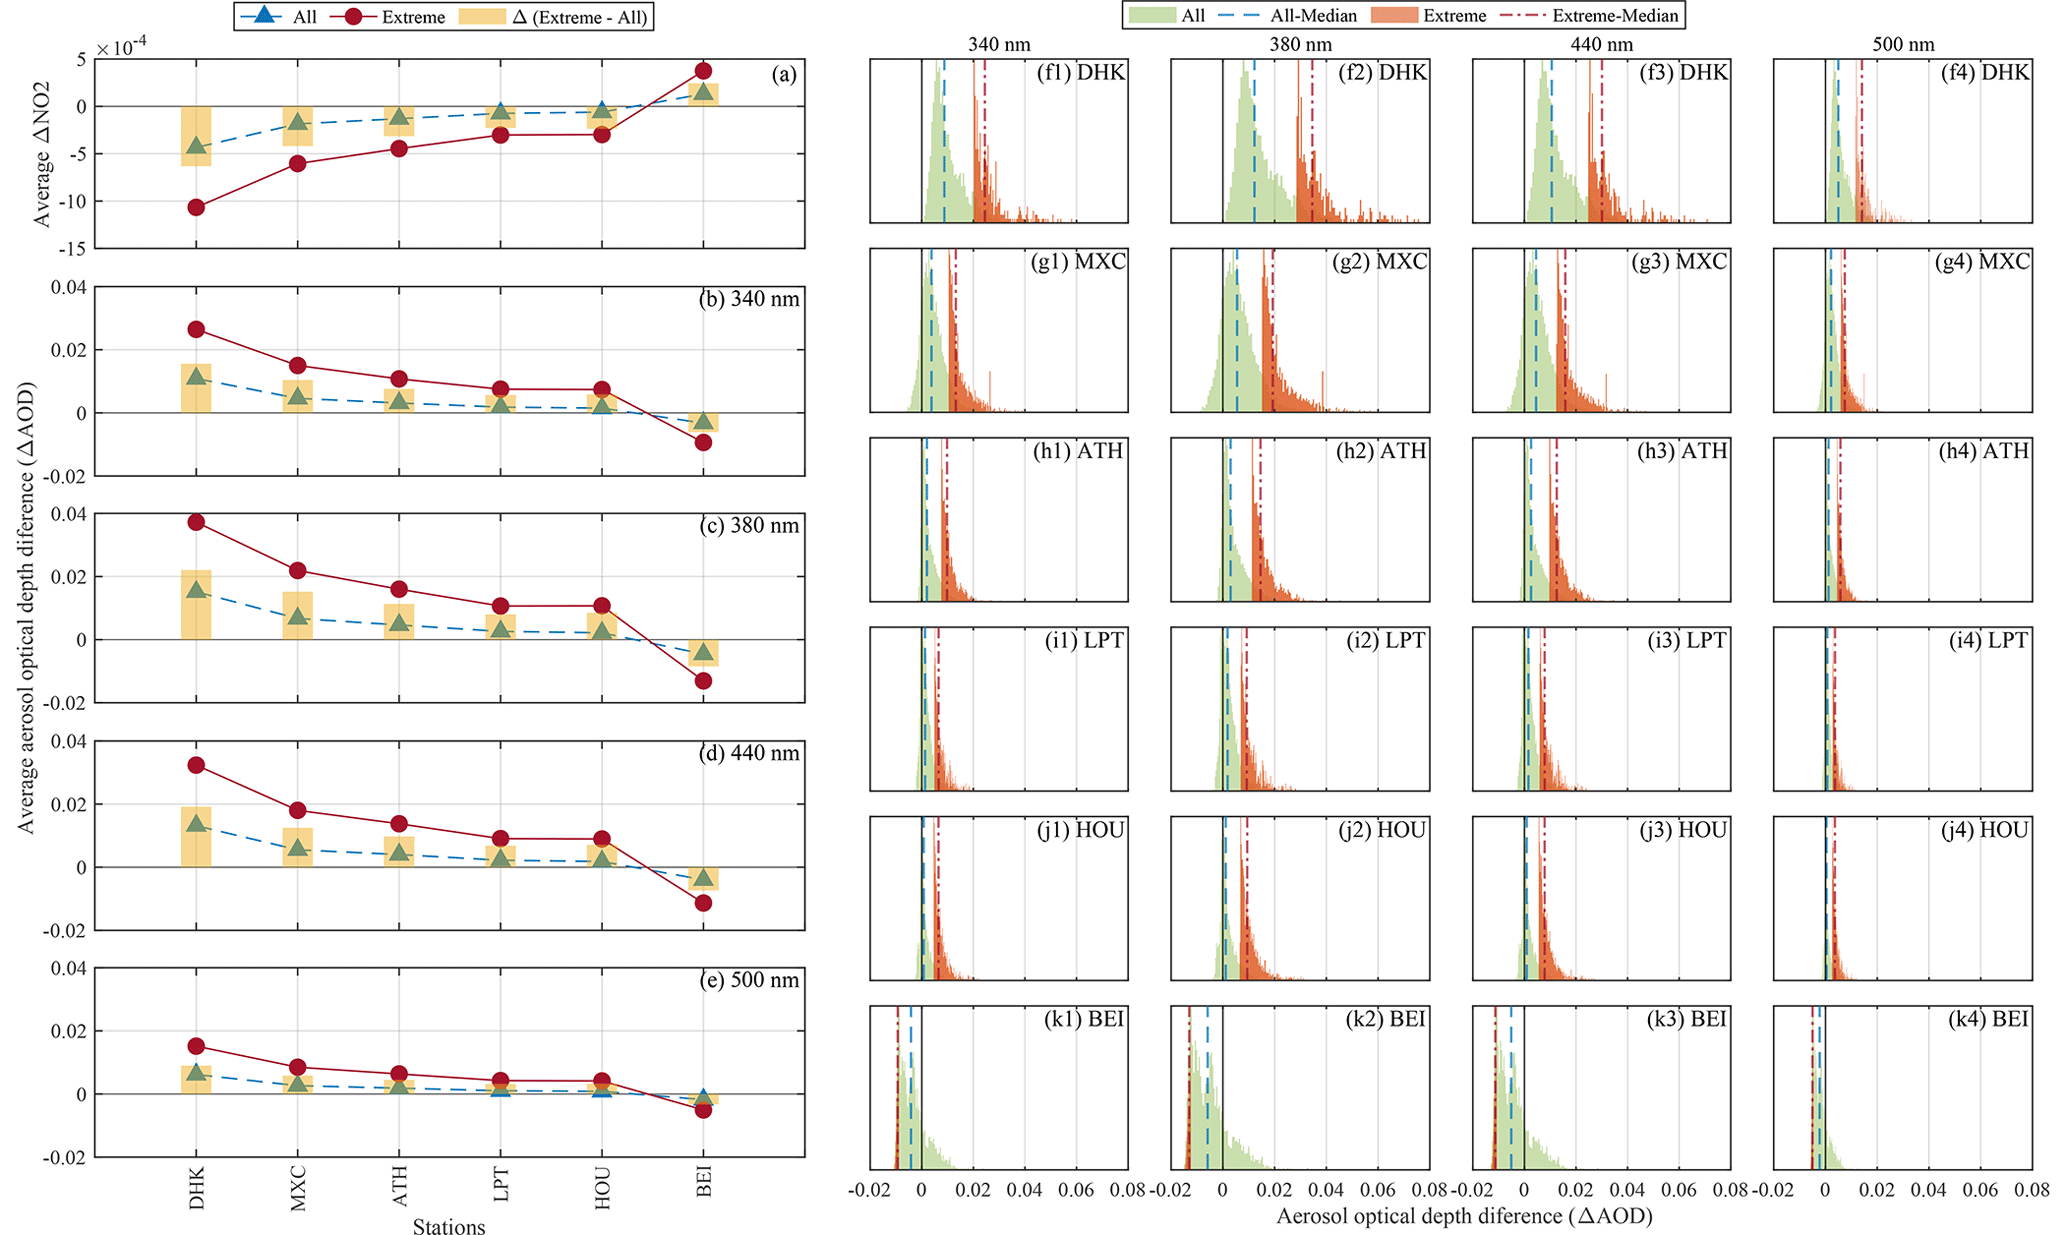
Figure 6ΔNO2 (mol m−2) (a) and ΔAOD at 340, 380, 440, and 500 nm (b–e). The normalized frequency distribution of AOD differences in the Extreme NO2 scenario from the whole dataset (referred to as All) for the stations with high variations at corresponding wavelengths (f1–k4).
Figure 7 presents a sensitivity analysis of AOD differences between AERONET and PGN at 380 and 440 nm for all stations, with PGN NO2 varying between 2 × 10⁻⁴ and 8 × 10⁻⁴ mol m−2. The median AOD differences are found to be within ±0.01 and go above 0.01 – and even above 0.02 – with the increase in the NO2 threshold (lower limit) from 2 × 10⁻⁴ to 8 × 10⁻⁴ mol m−2. Hence, in the case of high-NO2 loadings, the AOD is expected to have higher uncertainties due to inaccurate NO2 optical depth estimations.
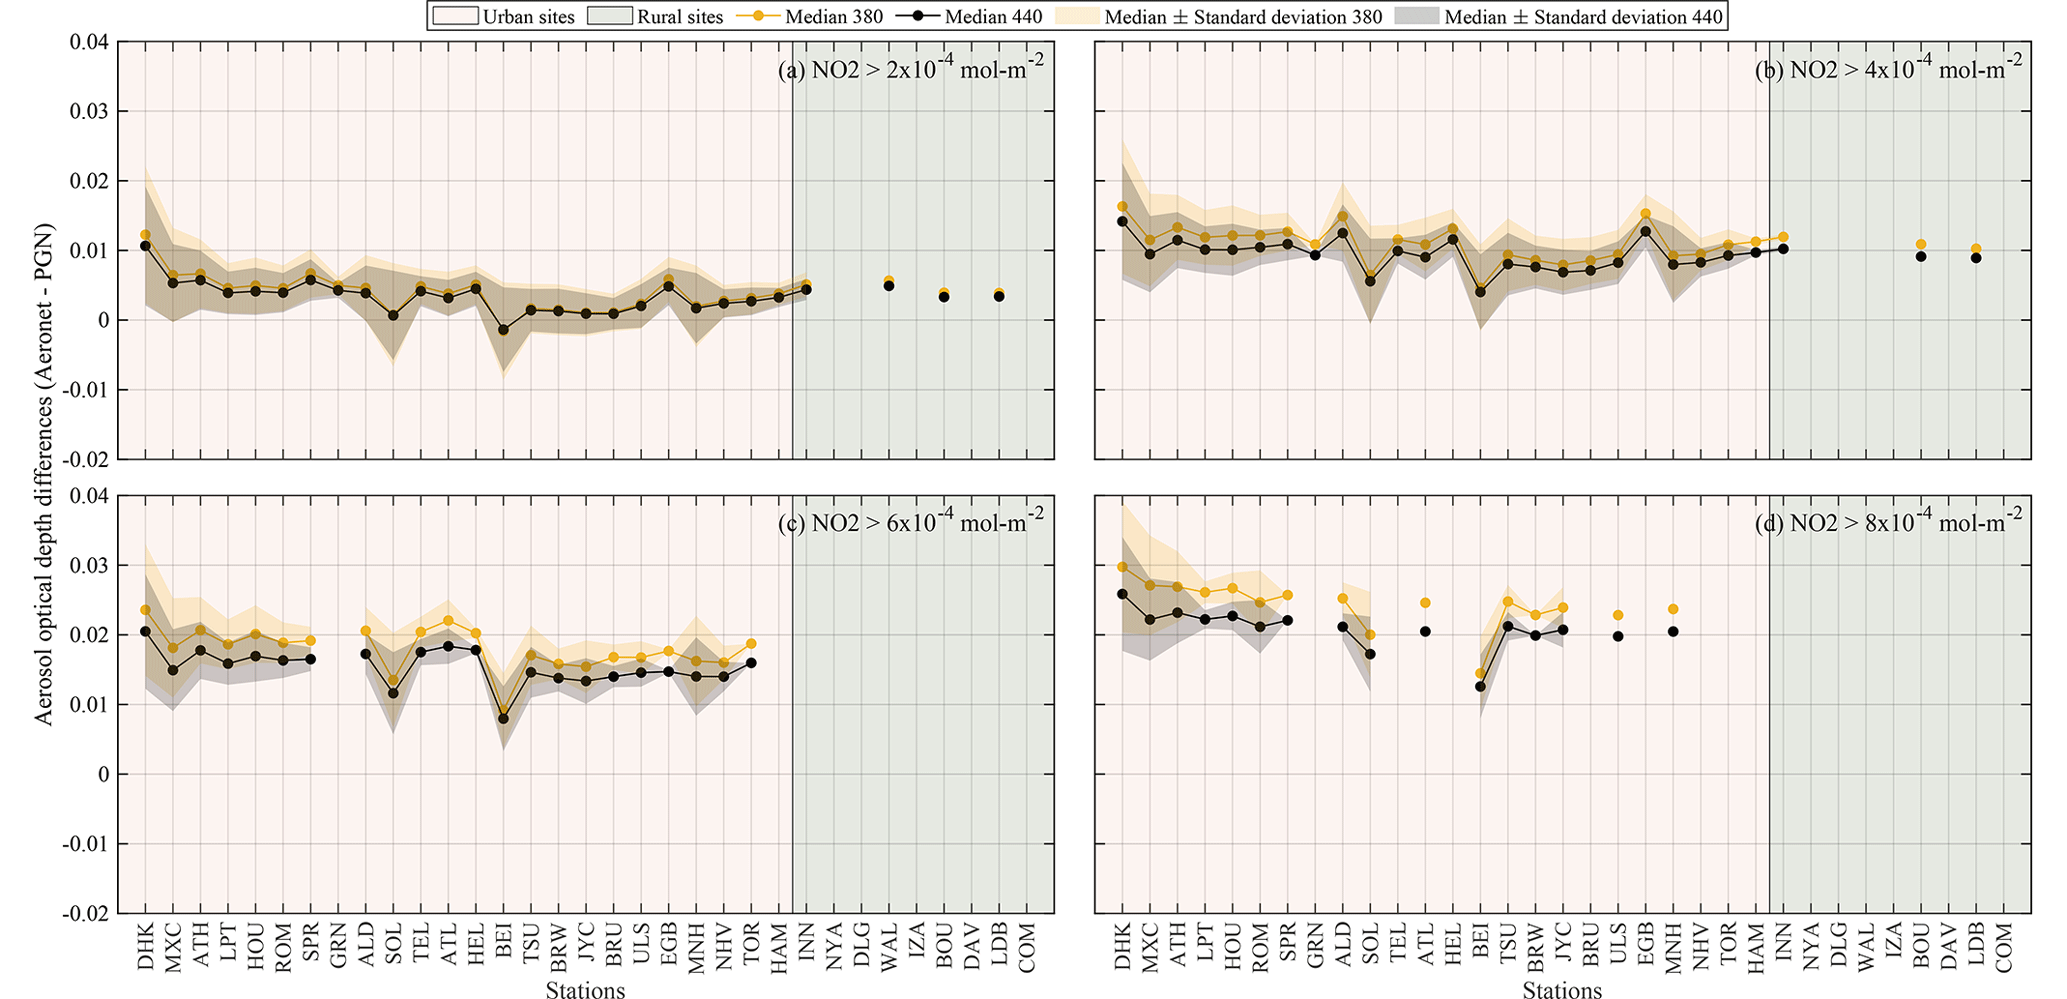
Figure 7Variation in AOD differences (AERONET OMIc-based AOD minus PGN-corrected AOD) at 380 and 440 nm for PGN NO2 varying from (a–d) 2 × 10⁻⁴ to 8 × 10⁻⁴ mol m−2, respectively, for all stations.
3.3 Effect of climatological vs. real NO2 values on the Ångström exponent
Due to a differential impact of the NO2 correction on the spectral AOD, discrepancies between an assumed climatological NO2 value (OMIc by AERONET) and the real one (PGN based) also impact the AERONET AOD-based computation of the AE. In this section, we present a discussion regarding the differences in the AERONET AOD-based AE and the AE computed from the PGN-corrected AOD, as described in Sect. 2.2.2.
Figure 8 presents the normalized frequency distribution of these AE differences at the wavelength ranges of 340–440 and 440–870 nm. The median of the AE 440–870 nm difference is found to be −0.07 and −0.05 for BEI and BRW, respectively, and within ±0.03 for other stations. The median of the AE 340–440 nm difference is 0.07 for BEI, 0.04 for BRW, and within ±0.03 for the remaining stations. The narrower frequency distribution for stations like DHK can be attributed to the broader AOD distribution (Wagner and Silva, 2008), as shown in Fig. 6f1–f4, and a broader AE distribution at stations like ATH, LPT, HOU, and ROM can be attributed to the narrower AOD distributions at these locations (some examples of AOD distributions are presented in Fig. 6).
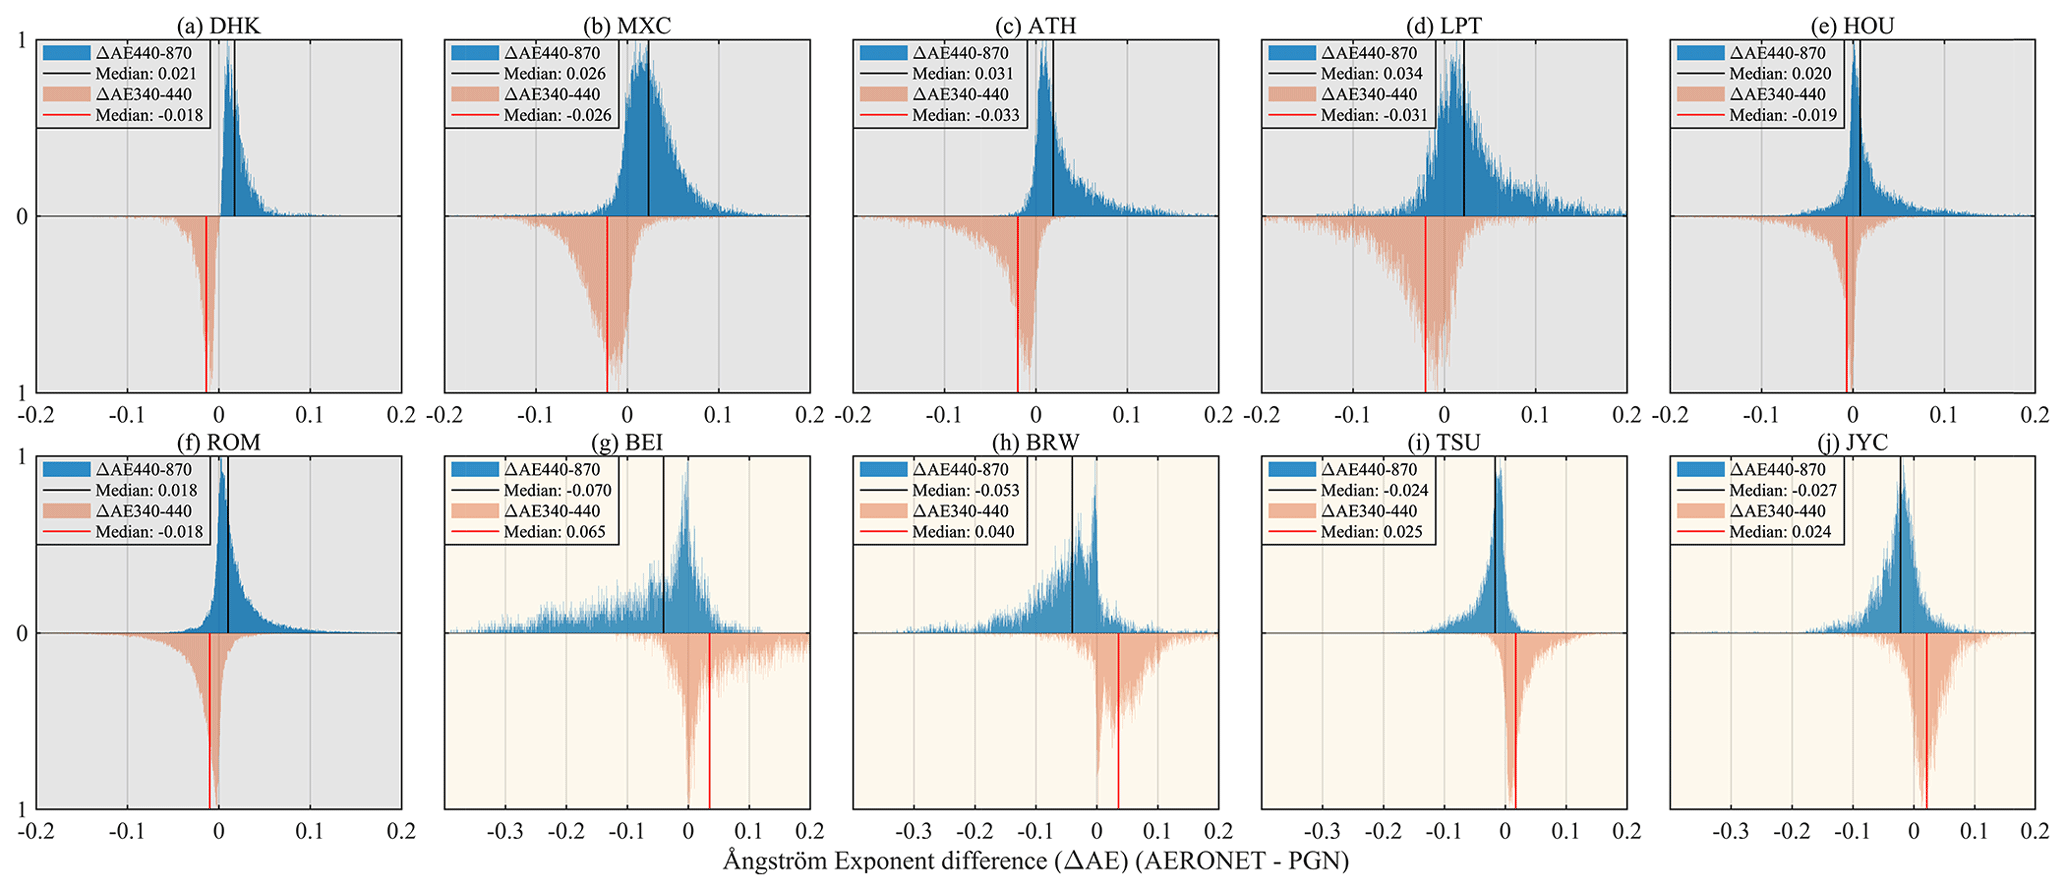
Figure 8Normalized frequency distributions of (a–j) the difference in AE at 440–870 and 340–440 nm retrieved from the AODs based on AERONET OMIc and PGN NO2. The shaded background area represents the NO2 underestimation (grey) (a–f) and overestimation (yellow) (g–j) cases.
In AE retrieval, if the AOD relative errors are equal at both wavelengths, then the AE distribution peak reflects the true value, or else there will be a shift in the peak of the AE distribution (Wagner and Silva, 2008). In our case, there is no error at a higher wavelength (870 and 675 nm, as these wavelengths are not affected by NO2 absorption, and hence PGN NO2 corrections are not made), and the higher relative positive error at a shorter wavelength (440 and 500 nm) leads to a shift in the peak of the AE difference (ΔAE440–870) distribution towards a positive value. The peak of the distribution of ΔAE340–440 is towards the opposite direction to that of ΔAE440–870 as the error in this case is higher at a higher wavelength (440 nm) than at a lower wavelength (340 nm) in case 1, and a similar but opposite behaviour is observed for case 2. It is also noteworthy that the uncertainty in AE is not very simple to interpret as it is a derivative quantity, and its sensitivity is dependent on the AOD value, as well as any spectral correlations in the AOD uncertainty (Wagner and Silva, 2008; Sayer, 2020). Figure 9 shows the variation in AE differences with NO2 VCD and AOD values. For NO2 underestimation cases and with reference to NO2 VCD (Fig. 9a–f), there is a strong positive bias in AE 440–870 nm (i.e. a higher AE estimation from AERONET compared to a PGN-corrected AOD-based AE estimation) and a negative bias in AE 340–440 nm, while for NO2 overestimation cases (Fig. 9g–j), the positive and negative biases are not that strongly present as is in the case of NO2 underestimation. Looking into the AE difference variations with respect to AOD, it was found that high AE differences are associated with low AOD instances.
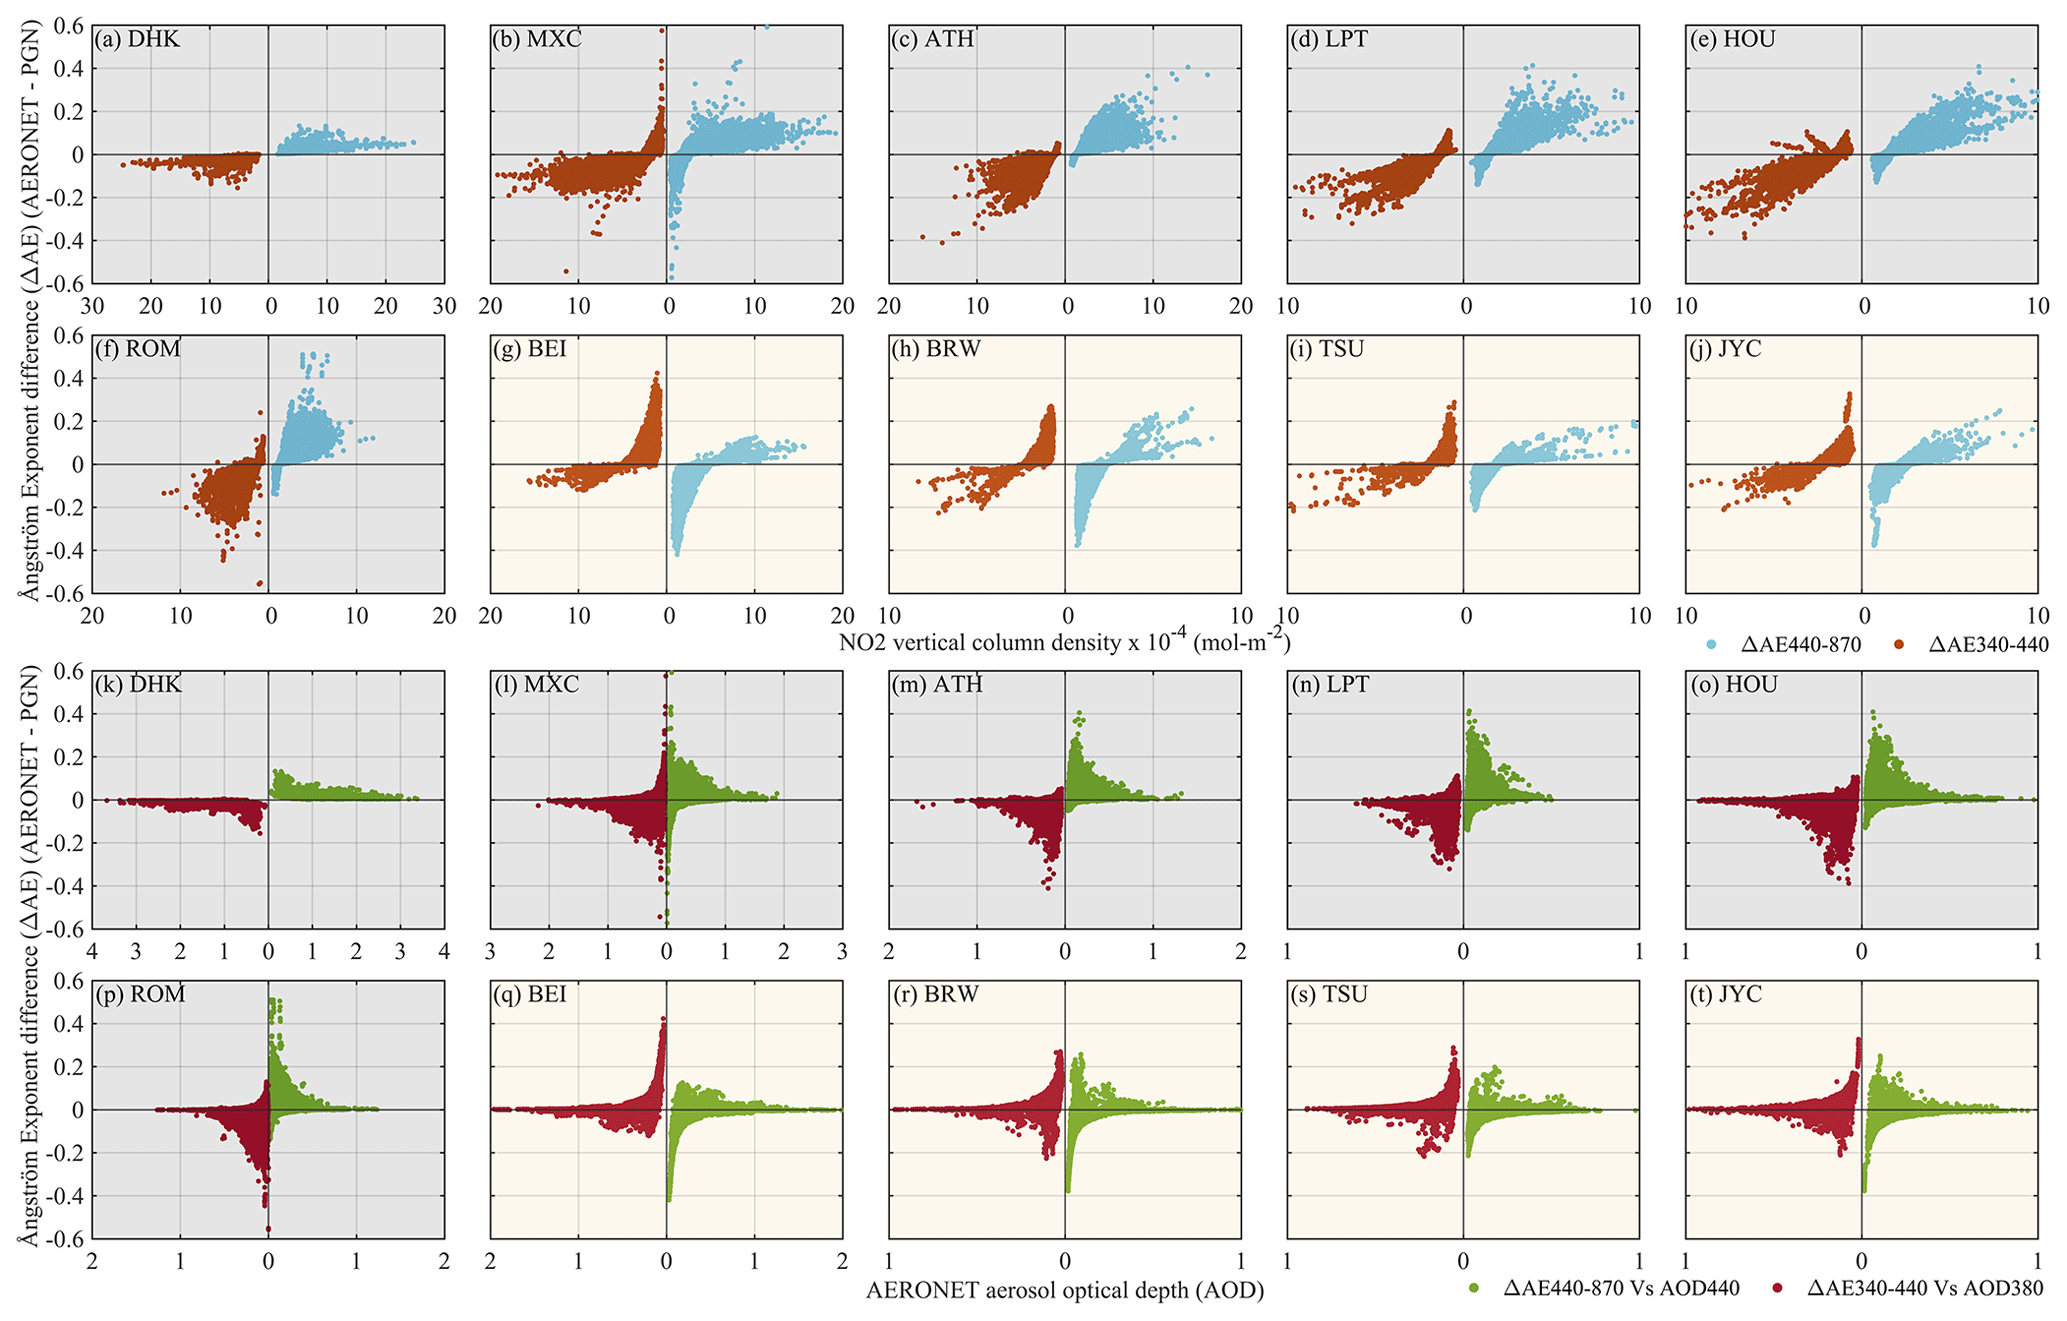
Figure 9Scatterplot of the Ångström exponent (AE) difference at 440–870 and 380–500 nm calculated from the AODs based on AERONET OMIc and PGN NO2-corrected AOD as a function of (a–j) PGN NO2 VCD (mol m−2), and (k–t) AOD at 440 and 380 nm, respectively. The shaded background area represents NO2 underestimation (grey) and overestimation (yellow) cases.
3.4 Assessment of NO2 correction on AOD measurements and AE retrievals in rural sites
For the rural sites considered in this analysis, as presented in Figs. 2 and 5, the mean NO2 underestimation (case 1 as described in Sect. 2.2.2) and overestimation (case 2) between OMIc and PGN was found to be below 0.50 × 10⁻⁴ and 0.40 × 10⁻⁴ mol m−2, respectively, reaching an underestimation of 1.56 × 10⁻⁴ mol m−2 for INN and an overestimation of more than 0.40 × 10⁻⁴ mol m−2 but below 1.00 × 10⁻⁴ mol m−2 for WAL, BOU, and LDB in the Extreme NO2 loading scenario. The corresponding impact on AOD mean in case 1 and case 2 was found to be an overestimation and underestimation below 0.002 and 0.001, respectively, at 380 nm and below 0.001 at other wavelengths. Under Extreme NO2 scenarios, the overestimation reached 0.005 at 380 and 440 nm and 0.004 at 340 nm for INN, while the underestimation was above 0.001 but less than 0.003 for WAL, BOU, and LDB at 380, 440, and 340 nm. The mean AE 440–870 nm difference was found to be positive and within 0.07 for case 1 and negative and within 0.12 for case 2, whereas the mean AE 340–440 nm difference was found to be negative and within 0.06 for case 1 and positive and within 0.07 for case 2.
3.5 Impact of AOD differences on trend analysis
Another aspect of interest relates to the trends in AOD and AE values observed in the last decade, with different magnitudes (and even sign i.e. both overestimation and underestimation cases presented in Sect. 3.1) in different areas of the globe. Hence, in this section, we present the trends based on original AERONET AOD values for a time duration of 2013–2023. In particular, the AOD trends have been calculated based on the AERONET AOD at 380 and 440 nm for stations with larger AOD differences (ΔAOD > 0.002) for the time period between 2013 and 2023 when only considering sites with a data availability of more than 5 years (complete, i.e. all seasons are homogeneously sampled) over this time span.
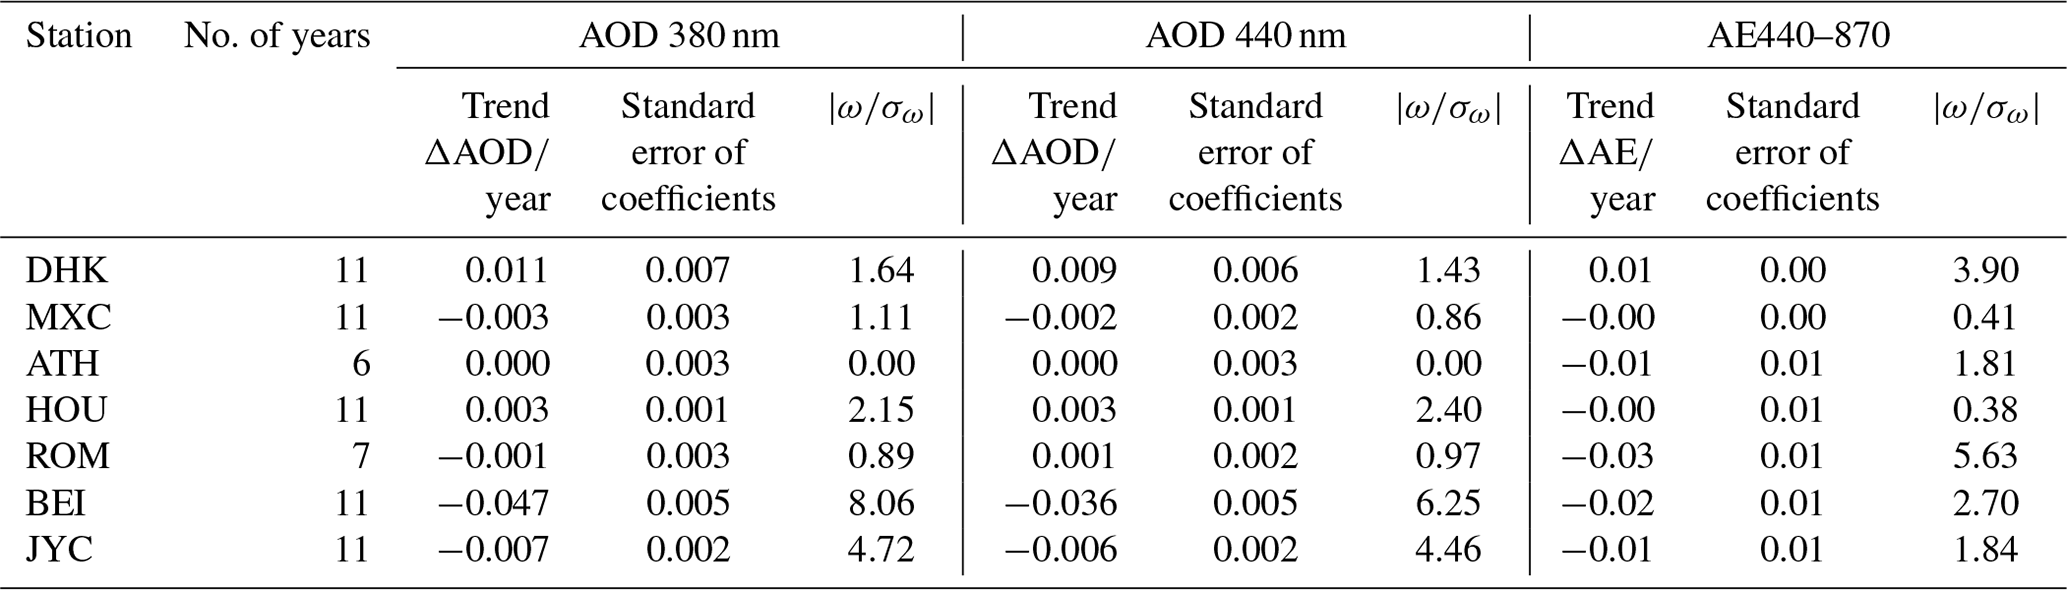
Table 4 presents the trend analysis using the AERONET AOD and AE. The trends are compared with the mean ΔAOD, which was previously presented in Sect. 3.1. We found two stations with statistically significant negative trends (BEI and JYC) and one with a statistically significant positive trend (HOU) in AOD and negative trends in AE 440–870 nm. HOU, having a positive AOD trend of 0.003 (Table 4), had a mean AOD overestimation of 0.002 at 380 and 440 nm (Table A2), which might have impact on the trends when calculated with the corrected AOD values. Furthermore, the other two stations (BEI and JYC), showing a negative trend in AOD, showed a mean underestimation of AOD as per the analysis presented in Sect. 3.1. It is indicative of how the NO2 correction could potentially affect realistic AOD trends. The remaining stations (DHK, MXC, ATH, and ROM) could not present a statistically significant trends and, hence, are not discussed here. This analysis signifies the importance of having correct (real) NO2 values for optical depth calculations that can impact the trend analysis of AOD and AE; however, the true scenario can be unveiled when the trends are calculated with NO2-corrected AOD.
Table 4AERONET AOD trend analysis from 2013–2023 at 380 and 440 nm.
3.6 Pandora NO2 vertical column density spatial representativeness
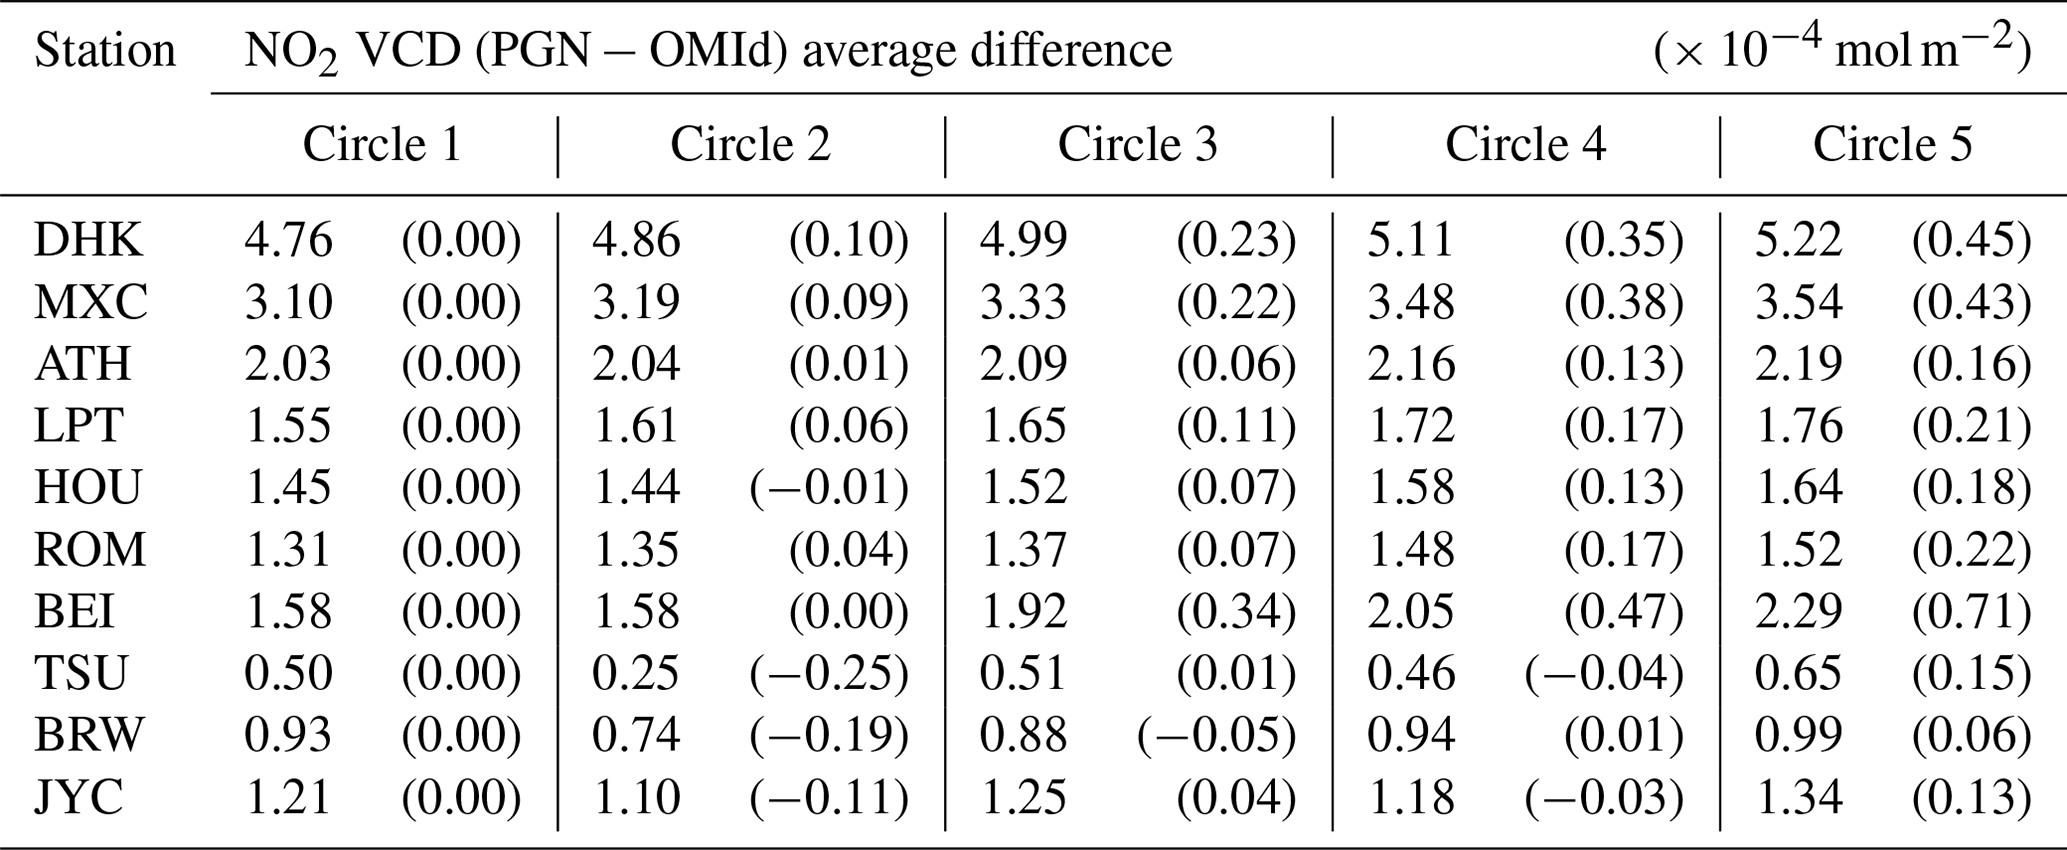
In this section, we try to look into the spatial representativeness of the Pandora instruments for the locations, as discussed in previous sections. Figure 10 shows the 7-year-averaged OMId satellite values based on the spatial distribution of NO2 VCD (also presented in Fig. 1), and the statistics are presented in Table 5. The location of Pandora (marked with red dots) represents the centre of the circular area (red circles), which is considered according to the OMI satellite overpass (yellow dots). The differences are calculated based on the area-averaged NO2 values from OMId satellite and PGN measurement averages. For stations like DHK and MXC that have higher-NO2 values, the area-averaged differences increase with the increase in the area, while other stations like ATH, LPT, HOU, and ROM showed a comparatively smaller variation in the differences. For BEI, the differences were constant until second circular area around the Pandora site and then increased with the increasing radius and showed a maximum difference for the outermost circle.
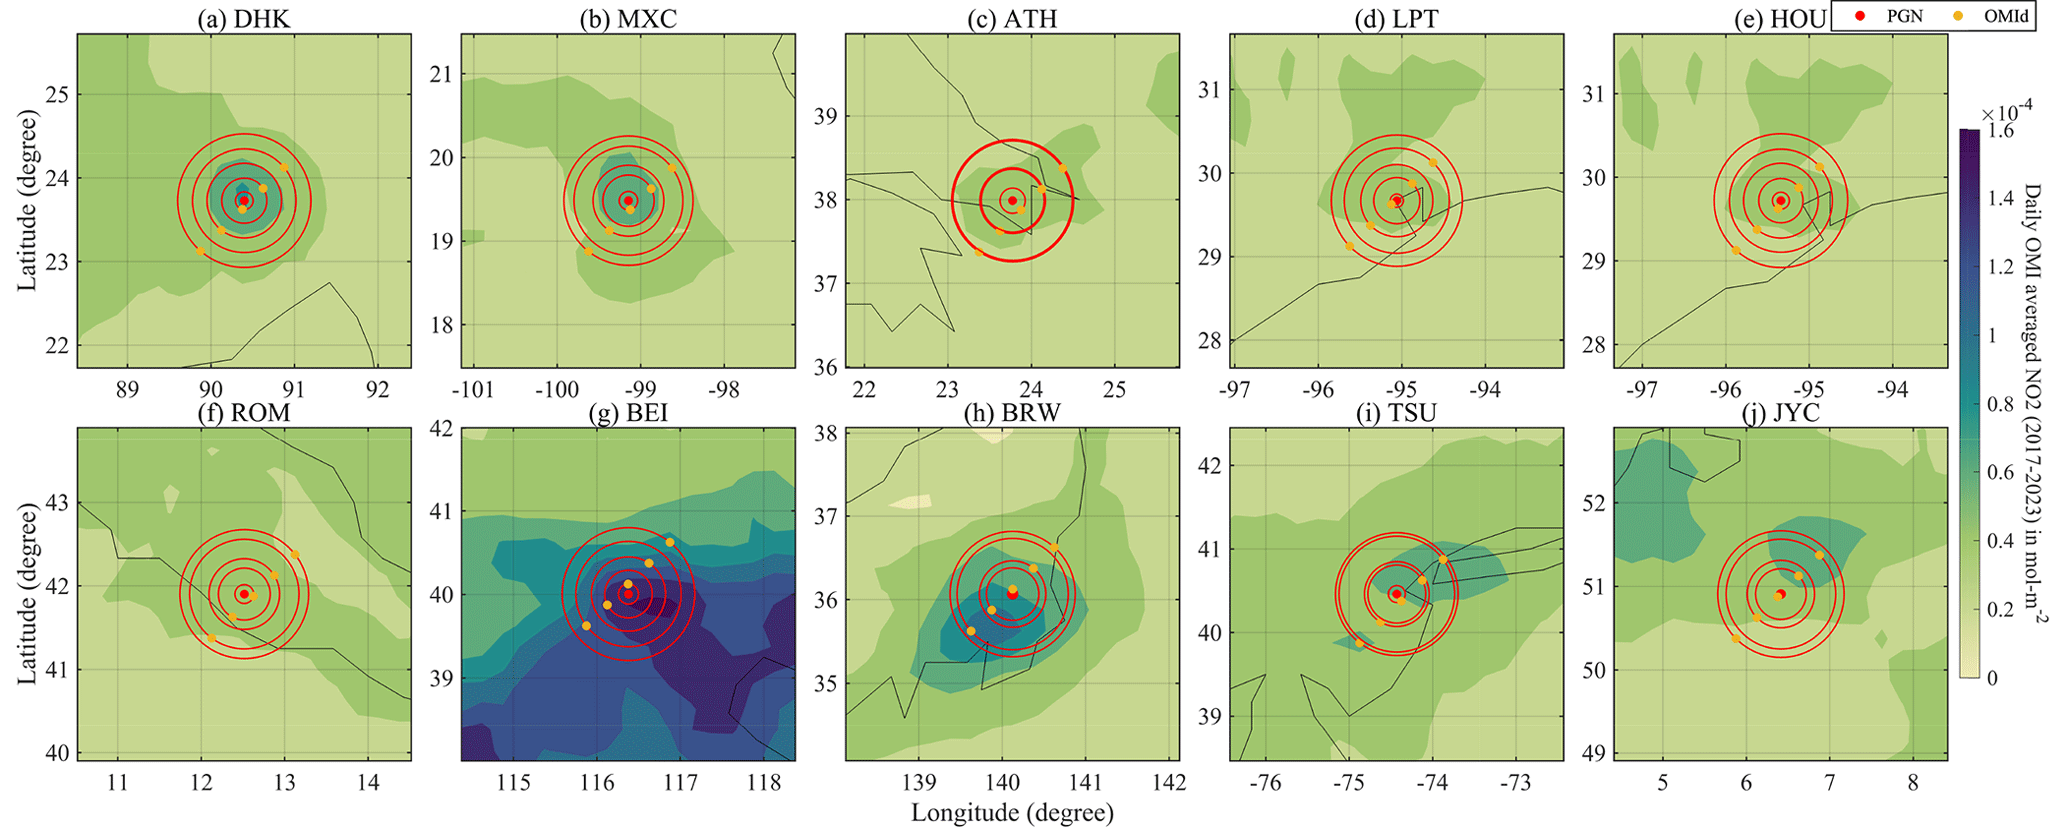
Figure 10Spatial variation in NO2 VCD from OMI (7-year-averaged value, as presented in Fig. 1, i.e. during 2017–2023). The red (at the centre) and yellow dots represent the PGN location and the satellite overpass, respectively. The red circles centred around the PGN location are calculated with a radius representative of the distance between the PGN location and satellite overpass.
Table 5Average NO2 VCD PGN − OMId satellite difference (× 10−4 mol m−2) of circles centred at the PGN site and of the radius increasing as per the difference between PGN site and OMI satellite overpass. The circles represent the area around the centre and are numbered according to the increasing distance from the centre. The values in parentheses represent the difference in the average NO2 values of the respective circle from circle 1.
For sites with homogeneous NO2 distributions, a Pandora instrument can be considered for VCD for a larger surrounding area, while for the regions with less homogeneous NO2 distributions, there can be a limited representation of NO2 in the surrounding area by a Pandora instrument (Liu et al., 2024). Moreover, closely located PGN sites like LPT and HOU can be used to include the regional spatial variation in the NO2. In our analysis, these two closely located stations of LPT and HOU (Fig. 1), with the NO2 difference of 0.71 × 10⁻⁴ and 0.58 × 10⁻⁴ mol m−2, respectively, between OMIc and PGN, showed a mean difference in AOD of 0.003 and 0.002 (∼ 1.1 %) at 380 nm, respectively, and of 0.002 (∼ 1.1 %) at 440 nm. Also, Drosoglou et al. (2023a) analysed the spatiotemporal variability in NO2 for ATH by synergistically using Pandora and satellite (TROPOMI – TROPOspheric Monitoring Instrument) observations. Thus, this could be another approach, such as using a high-resolution satellite VCD for NO2 characterization for real-time NO2 estimations or for the improvement of the climatology used for NO2 optical depth estimation.
This work was based on the Drosoglou et al. (2023b) findings showing the NO2 effects on AOD measurements for Rome, Italy. Here we tried to expand the investigation to all stations with co-located PGN Pandora and AERONET Cimel instruments. We present the analysis of NO2 differences between AERONET OMI climatology and the PGN dataset, focusing on the assessment of the impact on AOD at 340, 380, 440, and 500 nm from 33 worldwide co-located AERONET and PGN stations. About half of these stations (∼ 81 % of which are in the urban area and the remainder in the rural area) showed an underestimation of NO2 values by AERONET OMI climatology compared to the real (PGN) NO2 measurements that could be possibly due to higher pollution levels that averaged AERONET OMI climatological interpretations of NO2 fail to depict. While the other stations (∼ 65 % of which were urban sites and the remainder were rural sites) showed an overestimation of NO2 which could possibly be due to the reduction in pollution levels as an outcome of the implementation of environmental protection policies (in the last decade) that may have led to a significant NO2 trend reversal which AERONET OMI climatology might not be able to depict due to the fact that it considers the average values for time period of 2004–2013.
The correction in AERONET AOD based on PGN NO2 showed differences from the AERONET OMI climatology-based AOD. The analysis was further focused on 10 stations that showed a minimum mean NO2 and AOD (at 380 and 440 nm) differences of 0.5 × 10⁻⁴ mol m−2 and 0.002, respectively. Among these, six stations (DHK, MXC, ATH, LPT, HOU, and ROM) belonged to case 1, having the underestimation of NO2 and overestimation of AOD, while four stations (BEI, TSU, BRW, and JYC) showed the overestimation of NO2 leading to AOD underestimation (case 2). The AOD bias was found to be the most affected at 380 nm due to NO2 differences followed by 440, 340, and 500 nm, respectively.
Further assessment of AOD differences in Extreme NO2 loading scenarios (i.e. 10 % highest difference instances taken into account as percentiles of NO2 differences with 10 % and 90 % confidence levels for case 1 and case 2, respectively) revealed higher AOD differences in all cases, with a much more significant increase in the 10 stations mentioned above, along with 3 more stations (ALD, SOL, and MNH), compared to their respective All dataset mean AOD differences. Furthermore, the sensitivity analysis based on the PGN NO2 variation from 2 × 10⁻⁴ to 8 × 10⁻⁴ mol m−2 revealed that in case of high-NO2 loadings, the AOD is expected to have higher uncertainties due to an inaccurate NO2 optical depth representation by AERONET OMI climatology.
Due to the impact of the NO2 correction (discrepancies between the AERONET OMI climatological representation of NO2 values and the real NO2 measurement values by PGN) on the spectral AOD, the AOD-derivative product, AE, is also impacted. The normalized frequency distribution of AE was found to be narrower for a broader AOD distribution for some stations, and vice versa for other stations. For the wavelength pair used in AE estimation, a higher relative AOD error at the shorter wavelength led to a shift in the peak of the AE distribution towards a positive value, and a higher relative AOD error at a higher wavelength led to the shift in the peak of the AE distribution towards a negative value for the AOD overestimation case, and vice versa for the AOD underestimation case. Also, it is to be noted that the uncertainty in the AE is difficult to interpret due to the AE being a derivative quantity, and its sensitivity depends on the AOD value, as well as any spectral correlations in the AOD uncertainty.
The rural locations considered in this analysis showed mean NO2 differences mostly below 0.50 × 10⁻⁴ mol m−2 for case 1 and case 2. AOD differences were found to be mostly below 0.001 at all wavelengths except 380 nm, which had these differences below 0.002. Slightly higher (compared to the All dataset scenario for rural locations) NO2 and AOD differences were observed in Extreme NO2 loading scenarios to about 1.50 × 10⁻⁴ mol m−2 and 0.005, respectively, for some stations.
An AOD and AE trend assessment was made for about a decade for stations with AOD differences above 0.002 and with more than 5 years of data availability, based on the original (i.e. AERONET OMI climatological NO2) AERONET AOD. Stations having comparable mean AOD overestimations or underestimations with the estimated trends revealed that if the trends can be calculated for these stations with the NO2-corrected AOD, then there can be impacts on the trend values. This analysis is an indication of how the NO2 correction could potentially affect realistic AOD trends. However, the true scenario can be unveiled only with the trends that are calculated with NO2-corrected AOD values. For future analysis, it would be interesting to see how the NO2-based AOD correction would impact the AOD and AE trends; i.e. how much would the trends deviate when using the corrected AODs?
In general, average AOD-related overestimation or underestimation due to differences in the actual and climatological NO2 inputs are low, with the exception of few stations for which a decade-old satellite-based NO2 climatology fails to capture the local NO2 variability and its absolute levels. However, in the case of high-NO2 events (days), such differences are important, as for the top 10 % of high-NO2 cases (these high-NO2 difference cases are not associated with high AOD cases but are related to high levels of pollution and/or changes in the pollution trends in the past decade; Fig. A1 and Table A4); for 10 of the stations, the impact on the AODs is close to the limit or higher than the reported 0.01 uncertainty reported by Giles et al. (2019) and Eck et al. (1999) for AERONET AOD measurements. Taking into account that this uncertainty is a result of various aspects such as calibration (primarily), postprocessing, and instrument/measurement uncertainty, the NO2-related contribution can be considered relatively significant. Higher spatial and temporal resolution and updated NO2-satellite-based climatology or the use of co-located Cimel–Pandora retrievals could limit the reported NO2-related AOD uncertainties, especially in urban areas where NO2 can be highly variable.
Moreover, some AOD measuring networks (e.g. SKYNET, Nakajima et al., 2020; GAW-PFR, Kazadzis et al., 2018) do not officially take into account the NO2 optical depth in AOD measurements, and in this case the NO2 correction will be considered a systematic overestimation of AOD. For the GAW-PFR network, the NO2-absorption-based error in AOD measurements can be assumed to be negligible as the GAW remote stations have low-NO2 concentrations (the annual mean values of NO2 optical depth are < 0.001 in general; Kazadzis et al., 2018). However, it might be of some significance for stations located in polluted areas, especially in Asia, or during extreme events such as wildfires, which are becoming more frequent as a consequence of climate change. As a future endeavour, it would also be interesting to look into the impact of NO2-based corrections on AOD and other aerosol property retrievals, especially in ground-based aerosol remote sensing stations located in high-pollution zones such as those of SKYNET, which has established regional sub-network groups in China, Europe, India, Japan, South Korea, Mongolia, and Southeast Asia. Finally, technological improvements and the wide range of instrumentations such as real-time NO2 monitoring from the Pandonia global network, high-spatial-resolution real-time satellite-based observations (such as TROPOMI), and the foreseen high-temporal-resolution NO2 products (such as from Sentinel 4 and TEMPO satellites) could be directly used for contributing towards the improvement of aerosol property retrievals, specifically in the spectral range (∼ 340–500 nm), which is significantly affected by NO2 absorption.
This analysis highlights the importance of accurate NO2 optical depth representation with the best possible scenario (i.e. high-frequency and accurate available NO2 measurements from Pandora instruments); however, concerning the implementation into the global AOD networks (such as AERONET, GAW-PFR, or SKYNET), the utilization of satellite data is required to account for all the stations in the network.
List of acronyms
| τ | Optical depth |
| α | Ångström exponent |
| λ | Wavelength |
| Δ | Difference |
| AE | Ångström exponent |
| AERONET | Aerosol Robotic Network |
| AOD | Aerosol optical depth |
| DU | Dobson unit |
| GAW-PFR | Global Atmospheric Watch – Precision Filter Radiometer Network |
| OMI | Ozone Monitoring Instrument |
| OMIc | OMI climatology |
| OMId | OMI daily |
| PGN | Pandonia Global Network |
| TEMPO | Tropospheric Emissions: Monitoring of Pollution |
| TROPOMI | TROPOspheric Monitoring Instrument |
| VCD | Vertical column density |
Table A1AERONET and PGN co-located station information.
∗ These sites are co-located (i.e. instruments are in the same building) but the coordinates (latitude, longitude, and altitude) provided in AERONET/PGN have some errors at the time of submission. This is verified with the stations' principal investigators.
Table A2NO2 (mol m−2), AOD (380 and 440 nm), and AE (440–870 nm) differences. All differences are as OMIc − PGN.

Table A3NO2 (mol m−2), AOD (340 and 500 nm), and AE (340–440) differences. All differences are as OMIc − PGN.
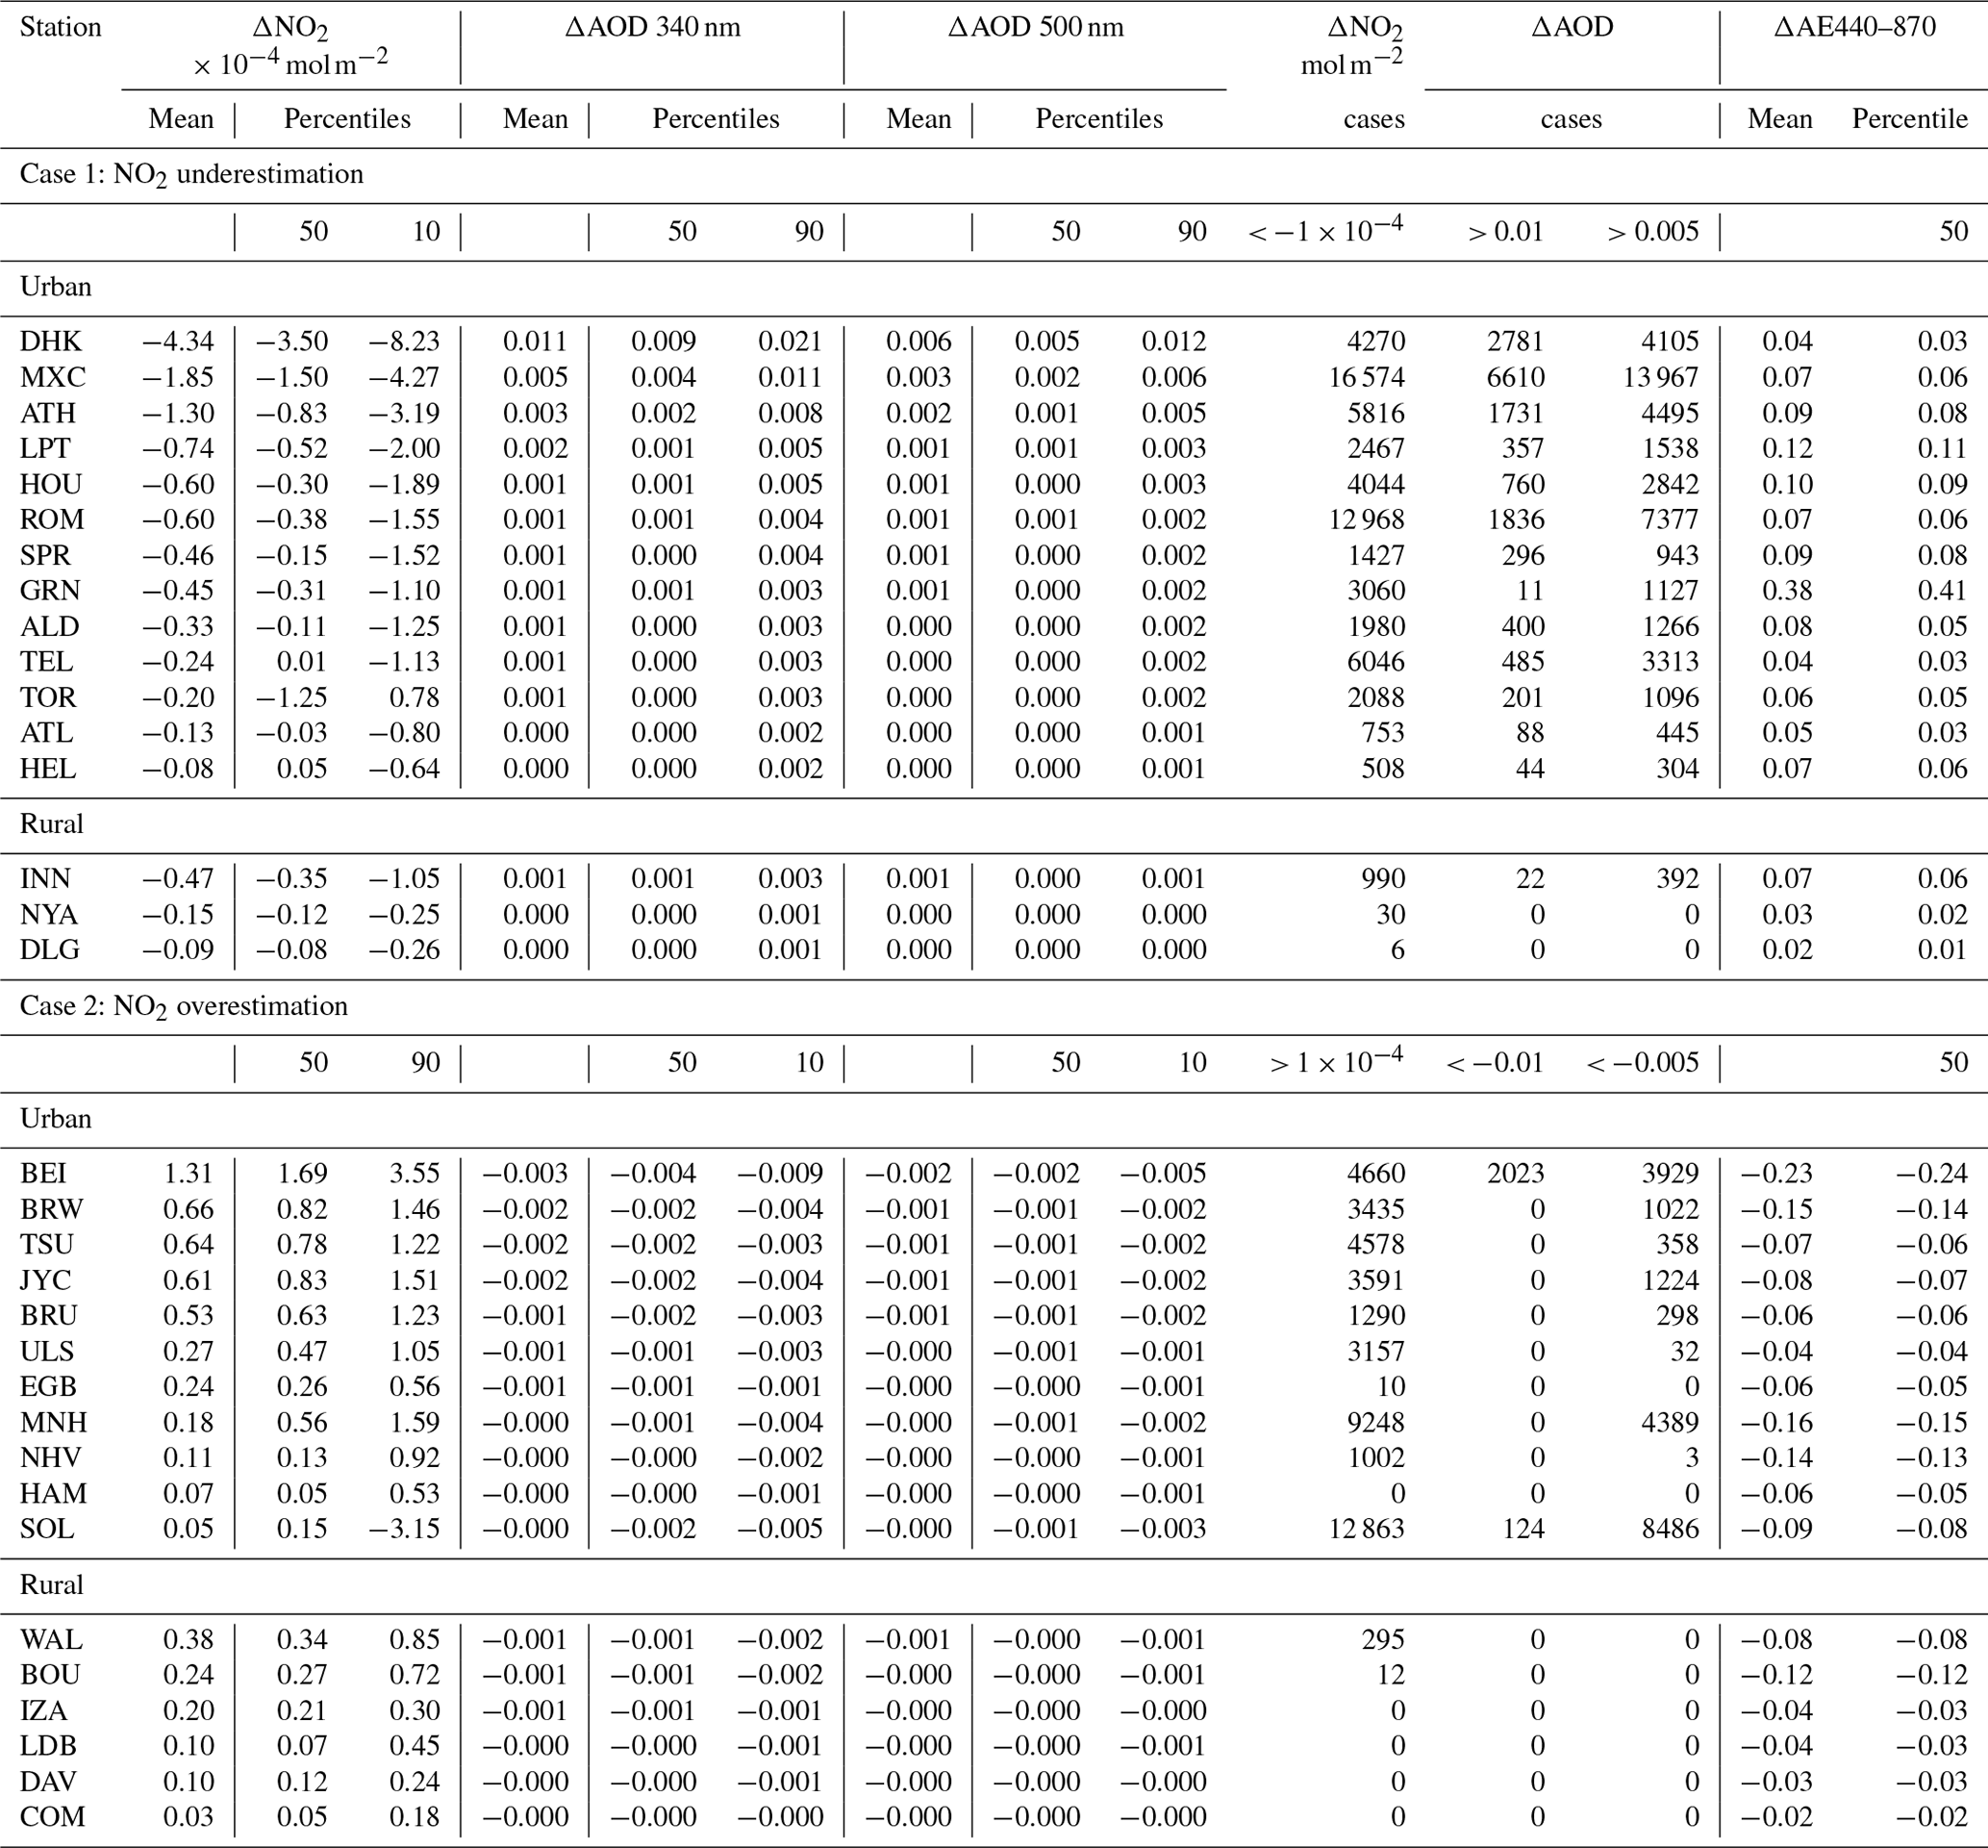
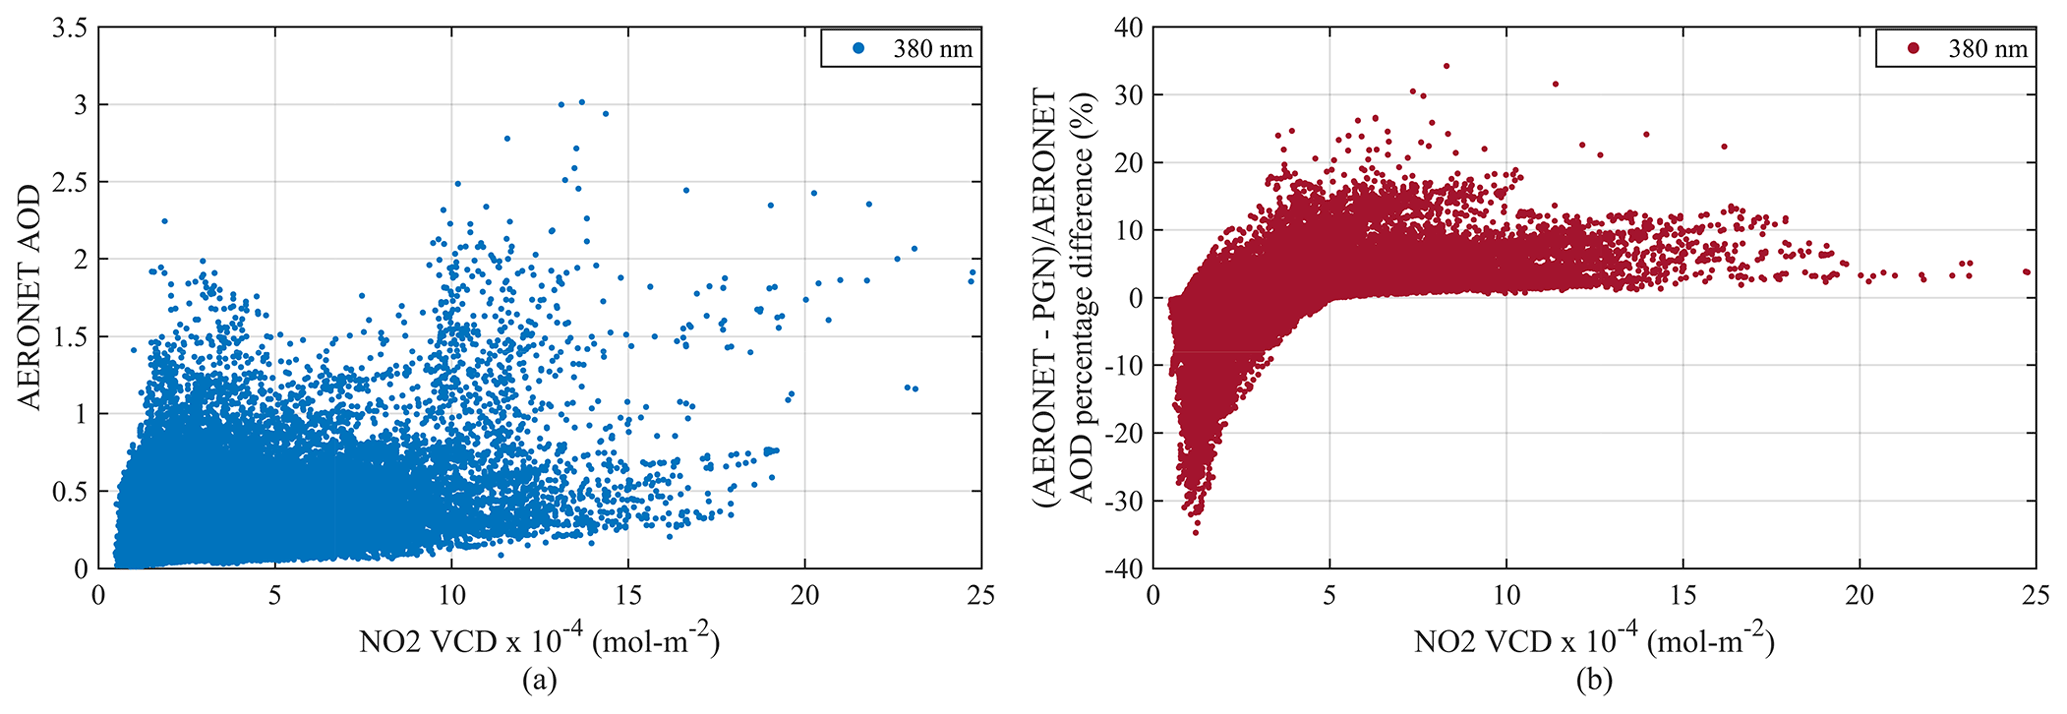
Figure A1AERONET (a) AOD and (b) AOD percentage difference as a function of NO2 VCD for 10 % highest NO2 cases for 10 stations (DHK, MXC, ATH, LPT, HOU, ROM, BEI, TSU, BRW, and JYC).
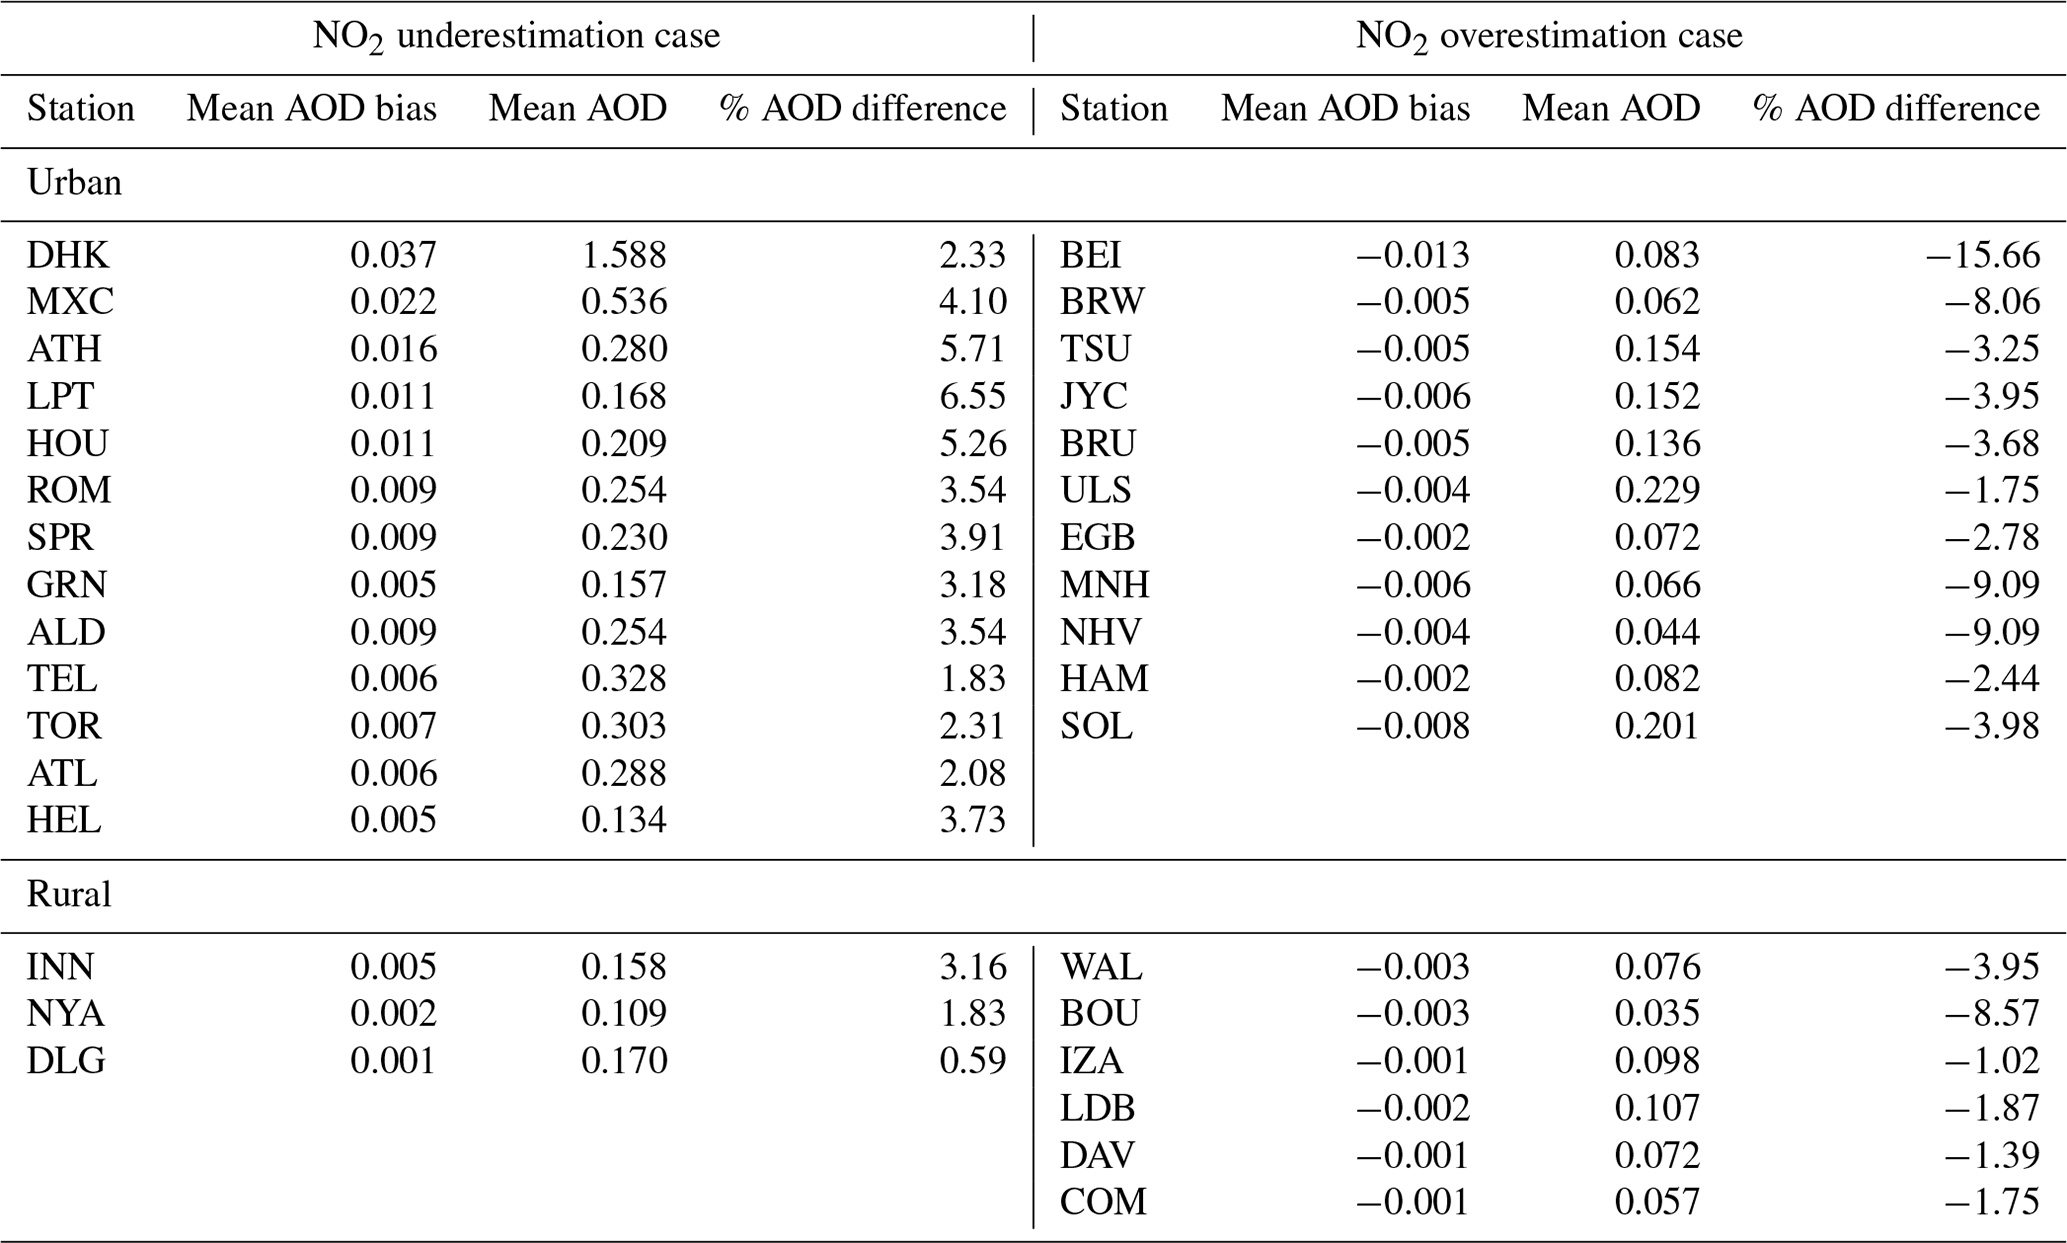
Table A4Comparison between NO2 optical-depth-based bias and relative percentage differences in AOD at 380 nm in Extreme NO2 cases.
The data used in this work are freely available through the AERONET portal at https://aeronet.gsfc.nasa.gov/cgi-bin/webtool_aod_v3 (NASA Goddard Space Flight Center, 2024), the Pandonia global network website at https://www.pandonia-global-network.org (Pandonia Global Network, 2024), and NASA Earth Science Data Systems at https://doi.org/10.5067/MEASURES/MINDS/DATA304 (Lamsal et al., 2022).
AM and SK developed the idea, performed the analysis, and prepared the figures. All authors contributed to the discussion of the findings and participated in writing the original manuscript.
The contact author has declared that none of the authors has any competing interests.
Publisher's note: Copernicus Publications remains neutral with regard to jurisdictional claims made in the text, published maps, institutional affiliations, or any other geographical representation in this paper. While Copernicus Publications makes every effort to include appropriate place names, the final responsibility lies with the authors.
The authors acknowledge the Quality Assurance for Earth Observation (QA4EO) project supported by the European Space Agency (ESA). Stelios Kazadzis would like to acknowledge the Aerosols, Clouds, and Trace gases Research Infrastructure (ACTRIS) Switzerland project supported by the Swiss State Secretariat for Education Research and Innovation. The authors would like to acknowledge the AERONET and PGN networks and local instrument operators. AERONET is a project of National Aeronautics and Space Administration (NASA), and PGN is a bilateral project supported by NASA and ESA. Akriti Masoom, Stelios Kazadzis, and Ioannis-Panagiotis Raptis would like to acknowledge HARMONIA (International network for harmonization of atmospheric aerosol retrievals from ground-based photometers; grant no. CA21119), supported by COST (European Cooperation in Science and Technology).
This research has mainly been supported by the European Space Agency in the frame of the Instrument Data quality Evaluation and Analysis Service – Quality Assurance for Earth Observation (IDEAS-QA4EO) project (contract no. QA4EO/SER/SUB/09; TPZ PO grant no. 600006842-PMOD/WRC).
This paper was edited by Omar Torres and reviewed by two anonymous referees.
Adesina, A. J., Kumar, K. R., Sivakumar, V., and Piketh, S. J.: Intercomparison and assessment of long-term (2004–2013) multiple satellite aerosol products over two contrasting sites in South Africa, J. Atmos. Sol.-Terr. Phy., 148, 82–95, https://doi.org/10.1016/j.jastp.2016.09.001, 2016.
Alfaro-Contreras, R., Zhang, J., Reid, J. S., and Christopher, S.: A study of 15-year aerosol optical thickness and direct shortwave aerosol radiative effect trends using MODIS, MISR, CALIOP and CERES, Atmos. Chem. Phys., 17, 13849–13868, https://doi.org/10.5194/acp-17-13849-2017, 2017.
Arola, A. and Koskela, T.: On the sources of bias in aerosol optical depth retrieval in the UV range, J. Geophys. Res., 109, D08209, https://doi.org/10.1029/2003JD004375, 2004.
Babu, S. S., Manoj, M. R., Moorthy, K. K., Gogoi, M. M., Nair, V. S., Kompalli, S. K., Satheesh, S. K., Niranjan, K., Ramagopal, K., Bhuyan, P. K., and Singh, D.: Trends in aerosol optical depth over Indian region: Potential causes and impact indicators, J. Geophys. Res.-Atmos., 118, 11, 794–11, 806, https://doi.org/10.1002/2013JD020507, 2013.
Boersma, K. F., Eskes, H. J., and Brinksma, E. J.: Error analysis for tropospheric NO2 retrieval from space, J. Geophys. Res., 109, D04311, https://doi.org/10.1029/2003JD003962, 2004.
Boersma, K. F., Jacob, D. J., Eskes, H. J., Pinder, R. W., Wang, J., and van der A, R. J.: Inter-comparison of SCIAMACHY and OMI tropospheric NO2 columns: Observing the diurnal evolution of chemistry and emissions from space, J. Geophys. Res., 113, D16S26, https://doi.org/10.1029/2007JD008816, 2008.
Cede, A.: Manual for Blick Software Suite 1.8, Issue 1.8-5, https://www.pandonia-global-network.org/wp-content/uploads/2024/08/BlickSoftwareSuite_Manual_v1-8-5.pdf (last access: 6 September 2024), 14 August 2024.
Cuevas, E., Romero-Campos, P. M., Kouremeti, N., Kazadzis, S., Räisänen, P., García, R. D., Barreto, A., Guirado-Fuentes, C., Ramos, R., Toledano, C., Almansa, F., and Gröbner, J.: Aerosol optical depth comparison between GAW-PFR and AERONET-Cimel radiometers from long-term (2005–2015) 1 min synchronous measurements, Atmos. Meas. Tech., 12, 4309–4337, https://doi.org/10.5194/amt-12-4309-2019, 2019.
Drosoglou, T., Bais, A. F., Zyrichidou, I., Kouremeti, N., Poupkou, A., Liora, N., Giannaros, C., Koukouli, M. E., Balis, D., and Melas, D.: Comparisons of ground-based tropospheric NO2 MAX-DOAS measurements to satellite observations with the aid of an air quality model over the Thessaloniki area, Greece, Atmos. Chem. Phys., 17, 5829–5849, https://doi.org/10.5194/acp-17-5829-2017, 2017.
Drosoglou, T., Koukouli, M.-E., Raptis, I.-P., Kazadzis, S., Pseftogkas, A., Eleftheratos, K., Zerefos, C.: Nitrogen dioxide spatiotemporal variations in the complex urban environment of Athens, Greece, Atmos. Environ., 314, 120115, https://doi.org/10.1016/j.atmosenv.2023.120115, 2023a.
Drosoglou, T., Raptis, I.-P., Valeri, M., Casadio, S., Barnaba, F., Herreras-Giralda, M., Lopatin, A., Dubovik, O., Brizzi, G., Niro, F., Campanelli, M., and Kazadzis, S.: Evaluating the effects of columnar NO2 on the accuracy of aerosol optical properties retrievals, Atmos. Meas. Tech., 16, 2989–3014, https://doi.org/10.5194/amt-16-2989-2023, 2023b.
Eck, T. F., Holben, B. N., Reid, J. S., Dubovik, O., Smirnov, A., O'Neill, N. T., Slutsker, I., and Kinne, S.: Wavelength dependence of the optical depth of biomass burning, urban, and desert dust aerosols, J. Geophys. Res., 104, 31333–31349, https://doi.org/10.1029/1999JD900923, 1999.
Fan, C., Li, Z., Li, Y., Dong, J., van der A, R., and de Leeuw, G.: Variability of NO2 concentrations over China and effect on air quality derived from satellite and ground-based observations, Atmos. Chem. Phys., 21, 7723–7748, https://doi.org/10.5194/acp- 21-7723-2021, 2021.
Georgoulias, A. K., van der A, R. J., Stammes, P., Boersma, K. F., and Eskes, H. J.: Trends and trend reversal detection in 2 decades of tropospheric NO2 satellite observations, Atmos. Chem. Phys., 19, 6269–6294, https://doi.org/10.5194/acp-19-6269-2019, 2019.
Giles, D. M., Sinyuk, A., Sorokin, M. G., Schafer, J. S., Smirnov, A., Slutsker, I., Eck, T. F., Holben, B. N., Lewis, J. R., Campbell, J. R., Welton, E. J., Korkin, S. V., and Lyapustin, A. I.: Advancements in the Aerosol Robotic Network (AERONET) Version 3 database – automated near-real-time quality control algorithm with improved cloud screening for Sun photometer aerosol optical depth (AOD) measurements, Atmos. Meas. Tech., 12, 169–209, https://doi.org/10.5194/amt-12-169-2019, 2019.
Gueymard, C.: SMARTS2: a simple model of the atmospheric radiative transfer of sunshine: algorithms and performance assessment, Florida Solar Energy Center Cocoa, University of Florida, http://www.fsec.ucf.edu/en/publications/pdf/fsec-pf-270-95.pdf (last access: 16 May 2024), 1995.
Herbert, R. and Stier, P.: Satellite observations of smoke–cloud–radiation interactions over the Amazon rainforest, Atmos. Chem. Phys., 23, 4595–4616, https://doi.org/10.5194/acp-23-4595-2023, 2023.
Herman, J., Cede, A., Spinei, E., Mount, G., Tzortziou, M., and Abuhassan, N.: NO2 column amounts from ground-based Pandora and MFDOAS spectrometers using the direct-sun DOAS technique: Intercomparisons and application to OMI validation, J. Geophys. Res., 114, D13307, https://doi.org/10.1029/2009JD011848, 2009.
Hobbs, P. V.: Chapter 2 Aerosol-Cloud Interactions, International Geophysics, 54, 33–73, https://doi.org/10.1016/S0074-6142(08)60211-9, 1993.
Hsu, N. C., Gautam, R., Sayer, A. M., Bettenhausen, C., Li, C., Jeong, M. J., Tsay, S.-C., and Holben, B. N.: Global and regional trends of aerosol optical depth over land and ocean using SeaWiFS measurements from 1997 to 2010, Atmos. Chem. Phys., 12, 8037–8053, https://doi.org/10.5194/acp-12-8037-2012, 2012.
IPCC: Climate Change 2021: The Physical Science Basis. Contribution of Working Group I to the Sixth Assessment Report of the Intergovernmental Panel on Climate Change, edited by: Masson-Delmotte, V., Zhai, P., Pirani, A., Connors, S. L., Péan, C., Berger, S., Caud, N., Chen, Y., Gold- farb, L., Gomis, M. I., Huang, M., Leitzell, K., Lonnoy, E., Matthews, J. B. R., Maycock, T. K., Waterfield, T., Yelekçi, O., Yu, R., and Zhou, B., Cambridge University Press, Cambridge, United Kingdom and New York, NY, USA, in press, https://doi.org/10.1017/9781009157896, 2021.
Kazadzis, S., Kouremeti, N., Nyeki, S., Gröbner, J., and Wehrli, C.: The World Optical Depth Research and Calibration Center (WORCC) quality assurance and quality control of GAW-PFR AOD measurements, Geosci. Instrum. Method. Data Syst., 7, 39–53, https://doi.org/10.5194/gi-7-39-2018, 2018.
Koukouli, M.-E., Pseftogkas, A., Karagkiozidis, D., Skoulidou, I., Drosoglou, T., Balis, D., Bais, A., Melas, D., and Hatzianastassiou, N.: Air Quality in Two Northern Greek Cities Revealed by Their Tropospheric NO2 Levels, Atmosphere, 13, 840, https://doi.org/10.3390/atmos13050840, 2022.
Kumar, K. R., Yin, Y., Sivakumar, V., Kang, N., Yu, X., Diao, Y., Adesina, A. J., and Reddy, R. R.: Aerosol climatology and discrimination of aerosol types retrieved from MODIS, MISR and OMI over Durban (29.88°S, 31.02°E), South Africa, Atmos. Environ., 117, 9–18, https://doi.org/10.1016/j.atmosenv.2015.06.058, 2015.
Kumar, K. R., Boiyo, R., Madina, A., and Kang, N.: A 13-year climatological study on the variations of aerosol and cloud properties over Kazakhstan from remotely sensed satellite observations, J. Atmos. Sol.-Terr. Phy., 179, 55–68, https://doi.org/10.1016/j.jastp.2018.06.014, 2018.
Lamsal, L. N., Krotkov, N. A., Marchenko, S. V., Joiner, J., Oman, L., Vasilkov, A., Fisher, B., Qin, W., Yang, E.-S., Fasnacht, Z., Choi, S., Leonard, P., and Haffner D.: OMI/Aura NO2 Tropospheric, Stratospheric & Total Columns MINDS Daily L3 Global Gridded 0.25 degree x 0.25 degree, NASA Goddard Space Flight Center, Goddard Earth Sciences Data and Information Services Center (GES DISC) [data set], https://doi.org/10.5067/MEASURES/MINDS/DATA304, 2022.
Lelieveld, J., Evans, J. S., Fnais, M., Giannadaki, D., and Pozzer, A.: The contribution of outdoor air pollution sources to pre-mature mortality on a global scale, Nature, 525, 367–371, https://doi.org/10.1038/nature15371, 2015.
Li, J., Carlson, B. E., Dubovik, O., and Lacis, A. A.: Recent trends in aerosol optical properties derived from AERONET measurements, Atmos. Chem. Phys., 14, 12271–12289, https://doi.org/10.5194/acp-14-12271-2014, 2014.
Liu, O., Li, Z., Lin, Y., Fan, C., Zhang, Y., Li, K., Zhang, P., Wei, Y., Chen, T., Dong, J., and de Leeuw, G.: Evaluation of the first year of Pandora NO2 measurements over Beijing and application to satellite validation, Atmos. Meas. Tech., 17, 377–395, https://doi.org/10.5194/amt-17-377-2024, 2024.
Logothetis, S.-A., Salamalikis, V., Gkikas, A., Kazadzis, S., Amiridis, V., and Kazantzidis, A.: 15-year variability of desert dust optical depth on global and regional scales, Atmos. Chem. Phys., 21, 16499–16529, https://doi.org/10.5194/acp-21-16499-2021, 2021.
Molina, C., Toro, A. R., Manzano, C. A., Canepari, S., Massimi, L., and Leiva-Guzmán, M. A.: Airborne Aerosols and Human Health: Leapfrogging from Mass Concentration to Oxidative Potential, Atmosphere, 11, 917, https://doi.org/10.3390/atmos11090917, 2020.
Nakajima, T., Campanelli, M., Che, H., Estellés, V., Irie, H., Kim, S.-W., Kim, J., Liu, D., Nishizawa, T., Pandithurai, G., Soni, V. K., Thana, B., Tugjsurn, N.-U., Aoki, K., Go, S., Hashimoto, M., Higurashi, A., Kazadzis, S., Khatri, P., Kouremeti, N., Kudo, R., Marenco, F., Momoi, M., Ningombam, S. S., Ryder, C. L., Uchiyama, A., and Yamazaki, A.: An overview of and issues with sky radiometer technology and SKYNET, Atmos. Meas. Tech., 13, 4195–4218, https://doi.org/10.5194/amt-13-4195-2020, 2020.
NASA Goddard Space Flight Center: AErosol RObotic NETwork, Aerosol Optical Depth – Direct Sun Measurements, Version 3 Direct Sun Algorithm, Data Download Tool, National Aeronautics and Space Administration, https://aeronet.gsfc.nasa.gov/cgi-bin/webtool_aod_v3, last access: 6 September 2024.
Ningombam, S. S., Larson, E. J. L., Dumka, U. C., Estelleìs, V., Campanelli, M., and Steve, C.: Long-term (1995–2018) aerosol optical depth derived using ground based AERONET and SKYNET measurements from aerosol aged-background sites, Atmos. Pollut. Res., 10, 608–620, https://doi.org/10.1016/j.apr.2018.10.008, 2019.
Pandonia Global Network: Reference Measurements of Atmospheric Composition, National Aeronautics and Space Administration and European Space Agency, https://data.pandonia-global-network.org, last access: 6 September 2024.
Pavel, M. R. S., Zaman, S. U., Jeba, F., Islam, M. S., and Salam, A.: Long-Term (2003–2019) Air Quality, Climate Variables, and Human Health Consequences in Dhaka, Bangladesh, Front. Sustain. Cities, 3, 681759, https://doi.org/10.3389/frsc.2021.681759, 2021.
Pozzer, A., de Meij, A., Yoon, J., Tost, H., Georgoulias, A. K., and Astitha, M.: AOD trends during 2001–2010 from observations and model simulations, Atmos. Chem. Phys., 15, 5521–5535, https://doi.org/10.5194/acp-15-5521-2015, 2015.
Richter, A., Burrows, J. P., Nüß, H., Granier, C., and Niemeier, U.: Increase in tropospheric nitrogen dioxide over China observed from space, Nature, 437, 129–132, https://doi.org/10.1038/nature04092, 2005.
Rosenfeld, D., Andreae, M. O., Asmi, A., Chin, M., de Leeuw, G., Donovan D. P., Kahn, R., Kinne, S., Kivekäs, N., Kulmala, M., Lau, W., Schmidt, K. S., Suni, T., Wagner, T., Wild, M., and Quaas, J.: Global observations of aerosol-cloud precipitation–climate interactions, Rev. Geophys., 52, 750–808, https://doi.org/10.1002/2013RG000441, 2014.
Sayer, A. M.: How long is too long? Variogram analysis of AERONET data to aid aerosol validation and intercomparison studies, Earth Space Sci., 7, e2020EA001290, https://doi.org/10.1029/2020EA001290, 2020.
Seinfeld, J. H. and Pandis, S. N. (Eds.): Atmospheric Chemistry and Physics: From Air Pollution to Climate Change, 3rd edn., John Wiley & Sons, Inc., Hoboken, NJ, USA, ISBN 978-1-118-94740-1, 2016.
Tzortziou, M., Herman, J. R., Cede, A., and Abuhassan, N.: High precision, absolute total column ozone measurements from the Pandora spectrometer system: Comparisons with data from a Brewer double monochromator and Aura OMI, J. Geophys. Res., 117, D16303, https://doi.org/10.1029/2012JD017814, 2012.
Tzortziou, M., Herman, J. R., Ahmad, Z., Loughner, C. P., Abuhassan, N., and Cede, A.: Atmospheric NO2 dynamics and impact on ocean color retrievals in urban nearshore regions, J. Geophys. Res.-Oceans, 119, 3834–3854, https://doi.org/10.1002/2014JC009803, 2014.
Tzortziou, M., Herman, J. R., Cede, A., Loughner, C. P., Abuhassan, N., and Naik, S.: Spatial and temporal variability of ozone and nitrogen dioxide over a major urban estuarine ecosystem, J. Atmos. Chem., 72, 287–309, https://doi.org/10.1007/s10874-013-9255-8, 2015.
van der A, R. J., Mijling, B., Ding, J., Koukouli, M. E., Liu, F., Li, Q., Mao, H., and Theys, N.: Cleaning up the air: effectiveness of air quality policy for SO2 and NOx emissions in China, Atmos. Chem. Phys., 17, 1775–1789, https://doi.org/10.5194/acp-17-1775-2017, 2017.
Wagner, F. and Silva, A. M.: Some considerations about Ångström exponent distributions, Atmos. Chem. Phys., 8, 481–489, https://doi.org/10.5194/acp-8-481-2008, 2008.
Weatherhead, E. C., Reinsel, G. C., Tiao, G. C., Meng, X.-L., Choi, D., Cheang, W.-K., Keller, T., DeLuisi, J., Wuebbles, D. J., Kerr, J. B., Miller, A. J., Oltmans, S. J., and Frederick, J. E.: Factors affecting the detection of trends: Statistical considerations and applications to environmental data, J. Geophys. Res., 103, 17149–17161, https://doi.org/10.1029/98JD00995, 1998.
Xu, J., Zhang, Z., Zhao, X., and Cheng, S.: Downward trend of NO2 in the urban areas of Beijing–Tianjin–Hebei region from 2014 to 2020: Comparison of satellite retrievals, ground observations, and emission inventories, Atmos. Environ., 295, 119531, https://doi.org/10.1016/j.atmosenv.2022.119531, 2023.
Yoon, J., von Hoyningen-Huene, W., Kokhanovsky, A. A., Vountas, M., and Burrows, J. P.: Trend analysis of aerosol optical thickness and Ångström exponent derived from the global AERONET spectral observations, Atmos. Meas. Tech., 5, 1271–1299, https://doi.org/10.5194/amt-5-1271-2012, 2012.
Zhang, J. and Reid, J. S.: A decadal regional and global trend analysis of the aerosol optical depth using a data-assimilation grade over-water MODIS and Level 2 MISR aerosol products, Atmos. Chem. Phys., 10, 10949–10963, https://doi.org/10.5194/acp-10-10949-2010, 2010.
Zhang, M., Wang, Y., Ma, Y., Wang, L., Gong, W., and Liu, B.: Spatial distribution and temporal variation of aerosol optical depth and radiative effect in South China and its adjacent area, Atmos. Environ., 188, 120–128, https://doi.org/10.1016/j.atmosenv.2018.06.028, 2018.